

Submitted:
12 August 2026
Posted:
13 August 2026
You are already at the latest version
Abstract
The common bean (Phaseolus vulgaris L.) is a key crop for food security in Mexico, yet its genetic resources remain poorly characterized in rural areas with high agrobiodiversity. Using genotyping-by-sequencing, we assessed genetic diversity, population structure, and gene flow among wild populations (W), traditional landraces (L), and commercial varieties exchanged through local markets (M), contrasting these populations with a sample of improved varieties (I). We analyzed a total of 78 individuals and 18,951 neutral SNPs. Population analyses (sNMF, PCoA, Neighbor-Joining, AMOVA) revealed strong differentiation between wild populations and cultivated forms (landraces and markets) (FstL-W = 0.704 and FstM-W = 0.601), whereas landraces and market varieties were weakly differentiated (FstL-M = 0.059). Wild populations exhibited the highest genetic diversity, with the greatest proportion of polymorphic loci (%PW = 56.6), expected heterozygosity (HeW = 0.49), and nucleotide diversity (πW = 0.55). Cultivated forms showed lower diversity across all parameters, although levels exceeded those previously reported for Guerrero and other Mexican regions. Gene flow was limited between wild and cultivated forms but high between landraces and market varieties (NmL-M = 7.877), highlighting the role of seed exchange networks in maintaining connectivity and diversity. These findings underscore the importance of conserving wild populations, landraces, and traditional seed systems to strengthen crop resilience and food security under climate change.
Keywords:
common bean
; food security
; GBS
; genetic diversity
; Guerrero
; wild relatives
1. Introduction
Climate change represents one of the primary threats to agriculture and biodiversity, directly affecting the productivity and stability of agricultural systems by increasing droughts, extreme temperatures, and variability in precipitation regimes. These shifts have direct consequences on global food security [1,2]. Basic crops, such as the common bean (Phaseolus vulgaris), are particularly sensitive to thermal and water stress, which compromises their yield and adaptive capacity under current and future climate scenarios [3]. Genetic diversity constitutes a key component of species’ adaptive capacity when facing adverse environmental conditions, as it provides the standing genetic variation upon which natural selection acts [4,5,6].
Within cultivated species, landraces represent reservoirs of genetic diversity. They harbor unique allelic combinations and differentiation patterns associated with local adaptation processes, which result from traditional selection and management maintained by farmers over generations [7,8]. Consequently, the germplasm of these varieties is not only essential for identifying climate-resilient crops and variants that are resistant to biotic and abiotic stress; it also represents a pillar of food security for peasant communities that depend on landraces for subsistence [9,10].
Wild populations belonging to the same cultivated taxon (the primary crop gene pool; [11] are also important reservoirs of genetic diversity. Frequently, wild populations display higher levels of genetic variation than cultivated populations. However, this pattern can be influenced by historical processes of gene flow [12,13], the genetic consequences of domestication (e.g. genetic bottlenecks, artificial selection, inbreeding), and sociocultural and management practices within rural communities [14,15].
Two especially significant sociocultural practices that influence the structure and composition of crop genetic diversity are the exchange of seeds between farmers and seed circulation through local markets. Local markets play an important role as interaction hubs where seeds of diverse geographical and genetic origins converge, thereby facilitating indirect gene flow across varieties and regions [16]. In several rural regions, local markets have been reported to perform a fundamental role in in situ conservation by commercializing regionally produced landraces and facilitating the exchange of seeds and other agricultural products among farmers [16,17].
Previous studies on the population structure and genetic diversity of the common bean (Phaseolus vulgaris) show that variation is driven by the species' predominantly autogamous reproductive system, the type of molecular marker used, diverse evolutionary and demographic processes, and hybridization or introgression events at each region, among other factors [18]. Two major gene pools of common bean have been distinguished: the Andean and the Mesoamerican. The Mesoamerican pool is more structured and genetically diverse [19,20,21,22], comprising distinct genetic groups from Brazil [23], Honduras, Guatemala, Costa Rica, Colombia [24], and Mexico. Within Mexico, distinct varieties have been identified from Oaxaca [20] and the Lerma-Santiago Basin [25], both of which exhibit high genetic diversity and are considered domestication sites in Mesoamerica, as well as varieties from Jalisco-Durango-Colima, Chiapas, and Morelos. Rodriguez et al. [24] identified a decrease in genetic diversity toward central Mexico, particularly in Guerrero, Puebla, Morelos, and the State of Mexico.
On the coast of Guerrero, common bean (P. vulgaris) cultivation is a key activity for food security and the local economy [26]. Moreover, in this region landraces coexist with wild populations which may represent an important source of genetic diversity. Within wild Mesoamerican P. vulgaris, populations from this region have been identified as a unique lineage clearly differentiated from other wild populations [27]. Generally, higher genetic diversity has been documented in wild populations of beans compared to cultivated forms, though exceptions exist [28]. Furthermore, gene flow in beans has been found to primarily run from cultivated populations toward wild ones [29,30,31,32]. However, genetic diversity studies in the region remain scarce and are mostly limited to morphological and agronomic characterizations [33,34,35]. These uncertainties make molecular studies of beans in this region essential, as this crop lies at the base of the subsistence diet of the rural population, and molecular data are currently lacking to establish protection and/or conservation strategies when necessary.
In this study, we therefore aimed to evaluate genetic diversity and structure, as well as the magnitude and direction of gene flow, between wild and cultivated populations of P. vulgaris on the coast of Guerrero, Mexico. We also analyze the importance of local markets in maintaining and conserving this genetic diversity.
2. Results
2.1. Identification of Neutral SNPs
Out of the 106,717 polymorphic SNPs identified in the samples analyzed, Tajima’s D detected 20,580 unique SNPs, while the FST filtering identified 98,630 unique SNPs. The intersection between the two methods yielded 18,951 common SNPs, which were retained as neutral loci and utilized for all subsequent analyses.
2.2. Neutral Genetic Structure of Common Bean
The cross-entropy value obtained via the sNMF method suggested the presence of four genetic groups of common bean (K = 4; Figure 1a–b). Individuals from the wild bean group (W) were clearly differentiated from the other three groups, displaying a high mixture of lineages among individuals but low intra-individual admixture (Figure 1a). The remaining three cultivated groups (landraces (L), local markets (M), and improved varieties (I)) formed separate pools. However, they displayed a similar composition dominated by a single genetic group (green), maintaining low intra-individual admixture, particularly within the local market group (Figure 1a and Figure 1d).
When considering K = 3, the wild group (W) remained genetically diverse among individuals but homogeneous within them (Figure 1c). The other three groups (L, M, and I) became almost completely homogenized, indicating low differentiation among and within the cultivated samples and suggesting nearly pure lines within each one (Figure 1c). Group-level ancestry proportions (Figure 1d) confirmed a greater admixture of lineages in wild populations compared to cultivated groups.
The Neighbor-Joining (NJ) tree revealed a clear separation between wild and cultivated beans, although a few cultivated accessions clustered closer to the wild group (Figure 2). Six well-supported clades were identified (bootstrap >80 %). The first clade comprised the yellow-seeded cultivars Peruano and Mantequilla, which formed distinct subgroups. A second clade included the brown-colored landraces Ojito Escaldado, Confeti, and Pinto. A third clade grouped the improved black cultivar Negro 37 together with the red-seeded landrace Colorado, while the wild accession Wild_16 was positioned as a closely related but distinct lineage. This pattern may reflect a feralized crop escape or shared ancestry between cultivated and wild gene pools. Two additional clades were composed exclusively of wild accessions. The largest clade comprised predominantly black-seeded varieties, including Guapinol, Negro, Jamapa, Chaparro, Michigan, and Mahapan, together with the brown-seeded varieties Bayo and Flor de Mayo. Notably, accessions from local markets and landraces were intermingled throughout this clade rather than forming separate groups by variety or origin, indicating limited genetic differentiation among black-seeded beans. This pattern suggests extensive seed exchange and recurrent farmer-mediated selection, which may contribute to genetic connectivity among cultivated populations (Figure 2).
The Principal Coordinate Analysis (PCoA) revealed that the wild samples were genetically differentiated from the three cultivated samples. The first two axes together explained 81.2% of the total variation. The first axis accounted for the vast majority of the variance explained (77.02 % of the total variance) and separated the wild samples from the remaining three bean groups. The PCoA2 axis explained a substantially smaller proportion of the variance (4.18%) and contributed slight additional separation of wild samples from the other three groups, without generating a clear separation among the cultivated samples (Landraces, Local Markets, and Improved; Figure 3).
The Analysis of Molecular Variance (AMOVA) showed that half of the genetic variation (51.89 %) was distributed among genetic groups, reflecting a high differentiation index (FST = 0.51; P < 0.001; Table 1). Conversely, similar proportions of genetic variation were observed among individuals within groups (24.34 %) and within individuals (23.77 %; Table 1). The total inbreeding coefficient (Fit = 0.76) and the local inbreeding coefficient (FIS = 0.50) across the four populations were both high.
2.3. Genetic Differentiation (FST), Gene Flow (Nm), and Migration Between Groups
The strongest genetic differentiation was between the wild samples and landraces (FST = 0.704), corresponding to a highly restricted gene flow rate (Nm = 0.209). A similar, though slightly weaker, pattern was observed between the wild samples and varieties from local markets (FST = 0.601; Nm = 0.331; Table 2), indicating that these groups are practically isolated from one another. In contrast, the comparison between landraces and local market varieties revealed very low genetic distance (FST = 0.059), demonstrating nearly non-existent differentiation. This result leads to a high gene flow value between these two groups (Nm = 7.877). Finally, the improved bean samples showed greater genetic similarity to the local market group (FST = 0.143; Nm = 2.981) than to the landrace group (FST = 0.266; Nm = 1.376), while maintaining a considerable distance from wild samples (FST = 0.412; Nm = 0.711; Table 2).
Contemporary migration rate estimations (BA3-SNPS) revealed limited and asymmetrical gene flow among the groups. Across all four groups, most individuals were categorized as non-recent migrants (0.768–0.971). Wild beans had recent migration rates ranging from 2% to 14% from the other three groups, whereas the migration rate in the opposite direction was lower (0.7% to 4%; Figure 4). The highest migration rate was from landraces to local markets (18%), whereas the migration rate in the opposite direction was only 1%. Finally, there were low migration rates to the improved bean group from landraces (6%) and markets (4%) as well as in the opposite direction (0.7% and 4%, respectively; Figure 4).
2.4. Neutral Genetic Diversity of Common Bean
Estimators of neutral genetic diversity revealed a marked contrast among the wild, landrace, market, and improved groups (Table 3). Despite a small sample size (N = 10), wild samples had the highest number of polymorphic loci (10,723), the highest polymorphism percentage (56.6%), the highest nucleotide diversity (π = 0.458), and the highest expected heterozygosity (HE = 0.49 ± 0.08), as well as a high inbreeding coefficient (FIS = 0.69).
In contrast, landraces and local market samples had a lower number of polymorphic loci (2,479 and 3,001, respectively), as well as relatively low polymorphism percentages (13.47% and 16.7%, respectively), nucleotide diversity (π = 0.032 and 0.041, respectively), expected heterozygosity (0.243 and 0.232, respectively) and lower inbreeding coefficients (0.037 and 0.288, respectively).
Finally, the improved bean group showed an intermediate pattern. Improved beans were similar to wild samples in having high expected heterozygosity (HE = 0.441 ± 0.13) and a high inbreeding coefficient (FIS = 0.511). However, they had the lowest number of polymorphic loci (1,856), a polymorphism rate of only 10.3%, and low nucleotide diversity (π = 0.044), close to the values of market and landrace samples (Table 3).
3. Discussion
This study represents the first genomic characterization of Phaseolus vulgaris in the Costa Grande and Costa Chica regions of Guerrero. Although Guerrero is one of the more biodiverse states in Mexico and harbors a high number of indigenous communities [36], the lack of molecular information limits the development of conservation and improvement strategies. Our results reveal that despite heavy anthropogenic pressure on wild habitats and strong domestication pressure on landraces, factors such as traditional agricultural management systems, ecosystem resilience, and human practices associated with marketing and germplasm exchange through local markets allow for the maintenance of moderate-to-high levels of common bean genetic diversity in these regions. These practices also drive the low genetic structure between landraces grown in farmer’s fields and market varieties. We also found higher genetic diversity in these regions than was previously reported for accessions from northern Guerrero (HE < 0.15) [24], underscoring the importance of expanding evaluations into understudied regions. Conversely, the limited gene flow between wild and cultivated populations demonstrates that these two gene pools must be managed as distinct entities. This highlights the importance of conserving the natural ranges of wild populations, which harbor the highest levels of genetic diversity. It also emphasizes the need to protect and maintain local markets in the region, as they constitute an integral part of the social structure, sustaining the diversity of this crop at a regional scale.
3.1. The Cost of Domestication and Loss of Genetic Variability
The genetic structure and diversity patterns of common bean samples showed a sharp contrast between wild populations and cultivated forms (landraces and local market varieties), reflecting the evolutionary consequences of the domestication process. The reduction in the number of polymorphic loci in cultivated varieties, along with decreases in nucleotide diversity and expected heterozygosity, supports the "domestication cost" hypothesis. Under this scenario, artificial selection, genetic bottlenecks, and reduced effective population sizes lead to a substantial loss of ancestral genetic variability [14,15,37].
Various studies of common bean have documented similar patterns of genetic erosion during domestication. Bitocchi et al. [19], using genomic markers, reported a significant reduction in diversity in domesticated forms relative to wild Mesoamerican and Andean populations. Similarly, Schmutz et al. [38], using the common bean reference genome, noted that domestication considerably reduced nucleotide diversity and favored the fixation of genomic regions linked to agronomic traits. Together, these findings corroborate our results, in which wild populations from Guerrero preserved substantially higher genetic richness than landraces and commercial varieties. Although the loss of diversity observed in domesticated varieties does not necessarily imply an immediate drop in productivity, it can limit the crop’s adaptive potential under climate change scenarios. Nevertheless, as mentioned previously, the genetic diversity values reported in this study were significantly higher than those from prior studies of beans from northern Guerrero [24]. This indicates that varieties cultivated on the coast of Guerrero still maintain moderate levels of genetic diversity, which merit protection by regional farmers through cultural practices like seed exchange networks and commercialization in local markets.
3.2. Effects of Reproductive Isolation and Gene Flow
Genetic differentiation between wild populations and cultivated forms (landraces and markets) was high, accompanied by negative gene flow values (Nm < 1). These results suggest reproductive isolation between the genetic groups. This isolation could be explained by several non-mutually exclusive mechanisms. On one hand, phenological shifts in flowering time and reproductive synchrony could limit mating opportunities between wild and cultivated forms, as has been previously documented in common bean [32,34,39]. On the other hand, traditional selection and seed-saving practices by farmers may favor the conservation of specific genotypes, intentionally restricting the introduction of wild variants into cultivated germplasm [26].
Despite this isolation, the detection of exclusive lineages in wild populations suggests that these reservoirs harbor ancestral variants that are absent from domesticated or improved varieties. This finding is one of the most significant contributions of this study, indicating that wild populations in Guerrero are an important source of genetic variation that has not yet been incorporated into formal breeding programs. Global concerns regarding the development of more resilient and productive crops have motivated basic and applied research programs focused on the sustainable use of wild crop relatives as valuable sources of genes associated with drought tolerance, pathogen resistance, and climate adaptation [40,41]. In this context, the in situ conservation of wild populations is of paramount importance for generating strategies that help cultivated species to adapt to changing environmental conditions.
3.3. Local Markets as Bridges for Genetic Exchange
Population structure analysis via sNMF indicated that the analyzed groups represent distinct ancestral lineages. However, we found low genetic differentiation between landraces and varieties commercialized in local markets, which was consistent with high gene flow. The discrepancy between the genetic structure inferred by sNMF and the low differentiation values (FST) between markets and landraces can be explained by moderate levels of recent gene flow, likely driven by human seed exchange and the circulation of diverse varieties sold in local markets. That is, even within a shared "domesticated" gene pool containing distinct lineages, recent gene flow between landraces and market varieties prevents their complete separation. It is also worth noting that varieties commercialized in markets are not identical to those grown in local farmers’ fields, so their ancestral lineages are expected to differ.
This result suggests that local commercial networks, such as markets, function as vital bridges for genetic exchange between agricultural communities. In this sense, markets represent more than just economic spaces; they act as dynamic mechanisms for the dispersal and redistribution of regional agricultural genetic diversity [16,42]. Llamas-Guzmán et al. [17] noted that informal seed exchange among farmers and local markets in the municipalities of Ixtenco and Huamantla, in the state of Tlaxcala, Mexico, contributes significantly to maintaining and conserving agrobiodiversity. Similarly, Severiano-Galeana et al. [26] reported that 21% of farmers interviewed on the coast of Guerrero acquire their seeds for planting or consumption from local shops and markets, while 79% engage in seed exchanges with relatives and neighbors from surrounding communities. Consequently, seeds commercialized in local markets tend to act as genetic mosaics derived from multiple sources, reducing genetic differentiation across cultivated populations. Thus, local markets function as in situ conservation hubs by promoting the exchange of local seeds among regional farmers and selling varieties produced directly in the field.
In contrast, we detected only very faint signals of recent migration from market varieties toward wild populations. This could be due to occasional crop-to-wild introgression events in areas where cultivated fields are close to wild populations, likely favored by anthropogenic disturbances or crop escapes. Several studies have documented bidirectional gene flow events within wild-weedy-domesticated complexes, particularly in regions where both reservoirs coexist in intricate agroecological mosaics [43]. This gene flow can threaten the survival of crops’ wild relatives through the introgression of maladaptive genes that could lead to local extinction or turn wild populations into aggressive weeds [44,45]. However, in this study, we detected minimal gene flow, indicating clear genetic independence between the two reservoirs.
3.4. Effect of Self-Pollination in Wild Common Bean Populations
A high inbreeding coefficient (FIS=0.696) was observed in wild populations, despite this group having the highest overall genetic diversity (π=0.548, P=56.6%). Although this pattern may appear paradoxical, several evolutionary and demographic processes can explain the coexistence of high population-level genetic diversity alongside high individual-level homozygosity. One primary explanation is the reproductive biology of the species. Wild Phaseolus vulgaris has a high self-fertilization rate, which increases inbreeding [46]. In natural environments, wild bean vines grow isolated among trees and shrubs, promoting high rates of self-pollination or mating between closely related individuals, growing close to their maternal plant [47], which increases homozygosity and drives high inbreeding values despite high regional genetic diversity.
Another possible explanation relates to the small size and partial isolation of the wild populations analyzed. In small populations, genetic drift can rapidly increase homozygosity and favor mating among related individuals, particularly when external gene flow is limited [48,49]. Likewise, a small effective population size can accelerate the random loss of alleles and increase the fixation of deleterious variants, intensifying inbreeding levels [50].
Taken together, our results demonstrate that the coastal region of Guerrero constitutes an important reservoir of ancestral genetic diversity for the common bean, preserved in both wild populations and landraces. This underscores the need to implement comprehensive in situ conservation strategies and sustainable utilization plans for this germplasm that balance the protection of wild populations with the dynamic maintenance of landraces managed by farmers. Furthermore, this study highlights the fundamental role of farmers and local markets as key actors in the conservation, circulation, and maintenance of regional genetic diversity. Through seed exchange, selection, and commercialization, these sociocultural systems actively contribute to preserving unique genetic lineages and generating continuous variation. In this context, local markets function not only as commercial venues but also as central hubs for regional germplasm conservation and genetic connectivity. The genetic diversity and ancestral lineages identified here represent a valuable source of adaptive variation and constitute the essential raw material needed to strengthen the resilience and agronomic adaptation of Phaseolus vulgaris when facing the challenges imposed by global climate change.
4. Materials and Methods
4.1. Study Area and Sample Collection
Seeds of P. vulgaris were obtained from four municipalities in the coastal region of Guerrero, Mexico: Atoyac de Álvarez, Coyuca de Benítez, Tecpan de Galeana, and Tecoanapa (Figure 5). This region is the primary producer of common bean in the state [51]. The study area has a warm, subhumid climate, with an average annual temperature of 28.5 °C and annual precipitation ranging from 800 to 2,000 mm [52]. Samples were categorized into four groups according to their origin: a) landraces grown in farmers’ agricultural plots (designated as L, N = 21); b) varieties from local markets distributed across the four municipalities (M, N = 8); c) improved varieties purchased from supermarkets (I, N = 2), and (d) wild populations, collected from the field (W, N = 4). In total, we collected 35 batches of common bean seeds. Vernacular names of all cultivated samples (landraces, markets and improved varieties) were recorded, producing a list of 17 names of cultivated varieties as recognized by local farmers and shop owners.
4.2. Greenhouse Plant Germination
Fifteen seeds from each batch were germinated under greenhouse conditions at the Escuela Nacional de Estudios Superiores (ENES), Unidad Morelia of the National Autonomous University of Mexico (UNAM). Once the seedlings emerged and grew at least three true leaves, they were cut and transported immediately to the laboratory to extract DNA. The number of plants per batch ranged between two and three. Our final sample size considering all batches was 86 individual plants.
4.3. DNA Extraction
DNA was extracted at the Genomics Laboratory of the ENES, Unidad Morelia, UNAM. For individual DNA extractions, 30 mg of fresh leaf tissue was ground using liquid N2 and processed with the DNeasy Mini Plant Kit (Qiagen), following the manufacturer’s instructions. DNA integrity was verified via 1% agarose gel electrophoresis using a high-molecular-weight lambda ladder as a reference. Additionally, DNA quality was determined by measuring spectrophotometric absorbance ratios on a BioSpectrometer basic (® Eppendorf) to ensure appropriate 260/280 nm and 260/230 nm ratios to rule out contamination by proteins and carbohydrates, respectively. DNA concentration was measured using a Qubit™ dsDNA fluorometer and homogenized to a concentration of 50 ng/μL.
4.4. Genome Sequencing
We sequenced a total of 86 individuals: 13 from wild populations, 53 from agricultural plot landraces, 18 from local markets, and two from improved varieties. Whole-genome sequencing was performed via paired-end genotyping-by-sequencing (GBS) with a target fragment selection size of 150 bp and an average read depth of 10X. Library preparation and genome sequencing were carried out by SNPSaurus LLC (Eugene, OR, USA; https://www.snpsaurus.com/).
4.5. Variant Calling (SNPs)
Sequence quality was analyzed using FastQC v0.12.1 to identify adapters, low-quality reads, or regions with inconsistent quality. Reads were mapped and aligned to the common bean reference genome (PhaVulg1_0: GCA_000499845.1; [38] using the Burrows-Wheeler Aligner (BWA, [53] algorithm. The resulting alignment files in SAM (Sequence Alignment Map) format were converted to binary format (BAM) and sorted using SAMtools v1.13 [54]. Finally, duplicate reads resulting from library preparation were removed using GATK4 v4.6.1.0 [55].
Variant calling (SNPs) was performed using the HaplotypeCaller module, and individual samples were joint-called into a single VCF file via CombineGVCFs, both of which are tools within the Genome Analysis Toolkit software (Gatk v.4.6.1.0; [55]. The final genotyped VCF file was generated using GenotypeGVCFs v4.6.1.0. A total of 23,699,568 SNPs were initially obtained and subsequently filtered using the following criteria: a minimum average Phred-scaled quality score of 30, a minor allele frequency (MAF) ≤ 0.05, retention of biallelic sites only, and a maximum of 30% missing data per genotype. The final data matrix consisted of 18,951 single nucleotide variants (SNPs) and 78 individuals that passed the filters (10 Wild, 42 Landrace, 22 Local Market and 4 Improved). All bioinformatic analyses were executed on the high-performance computing cluster at the Laboratorio Nacional de Análisis y Síntesis Ecológica (LANASE), ENES Unidad Morelia, UNAM.
4.6. Identification of Neutral Loci
Neutral SNP´s were identified by applying two statistical methods: Tajima’s D and FST across the four genetic groups. Tajima’s D method was calculated using a sliding window approach with a window size of 10,000 bp. This method contrasts two independent estimators of genetic diversity: average nucleotide diversity (π) and Watterson’s estimator (θ), which is based on the number of segregating sites [56]. SNPs with D values within the interval of -0.5 to 0.5 were retained.
The second statistical method evaluated genetic differentiation among the four genetic groups using the fixation index (FST), which measures allele frequency variance among groups by comparing individual allele frequencies against the total group variance frequencies [57,58]. SNPs with FST < 0.05 were considered neutral loci. Both analyses were performed using VCFtools and BCFtools. The final VCF file for neutral SNPs was generated from the intersection of common SNPs retained by both tests (Tajima’s D and FST).
4.7. Data Analysis
4.7.1. Population Structure
To determine the genetic structure among the four provenance groups, individual ancestry coefficients were calculated using Sparse Non-negative Matrix Factorization (sNMF), which utilizes sparse least-squares optimization algorithms to infer population structures [59]. The analysis evaluated a range of clusters from K = 1 to K = 4, with 10 independent replicates per K value. The optimal number of clusters was determined using the cross-entropy criterion to select the most probable number of genetic groups, facilitated by the LEA v3.20 package in RStudio [60,61]. Unlike other Bayesian clustering models such as STRUCTURE, sNMF relaxes the assumption of Hardy-Weinberg equilibrium, making it highly suitable for large SNP datasets [60].
Additionally, a Neighbor-Joining (NJ) phylogenetic tree was constructed with 1,000 bootstrap replicates using MEGA 12.1 software [62]. A Principal Coordinate Analysis (PCoA) was also performed to explore patterns of similarity or dissimilarity among batches based on a Nei’s genetic distance matrix, using RStudio v4.5.2 [63]. To determine the relative contribution of each ancestral lineage within the provenance groups, mean ancestry coefficients were calculated at the group level from the Q-matrix using RStudio v4.5.2 [63].
The degree of genetic differentiation between groups was evaluated using Wright’s F-statistics (1951). In addition, an Analysis of Molecular Variance (AMOVA) was conducted to estimate the proportion of genetic variation partitioned among and within groups using ARLEQUIN software [64].
4.7.2. Neutral Genetic Diversity
Genetic diversity analyses were conducted across the four provenance groups. The following diversity parameters were estimated: expected heterozygosity (HE), observed heterozygosity (HO), number of polymorphic loci (P), percentage of polymorphic loci (%P), local inbreeding coefficient (FIS), and nucleotide diversity (π), using ARLEQUIN software [64].
4.7.3. Gene Flow and Migration Rates
To explore the extent to which wild relatives act as a source of genetic diversity for domesticated populations and vice versa, historical gene flow (Nm) was estimated between groups [65]. Because Nm depends on estimated historical FST values, we also calculated the contemporary migration rate (m) corresponding to the last two generations using BA3-SNPS v3.0.4 [66]. This analysis was executed 10 times with a Markov Chain Monte Carlo (MCMC) length of 106 iterations, a burn-in of 105, and a sampling interval of 2,000 iterations.
Acknowledgments
We thank bean farmers for allowing us access to their fields and to collect seed samples. We are grateful to M.Sc. Diego Isla López and the Laboratorio Nacional de Análisis y Síntesis Ecológica (LANASE) campus Morelia for providing access to and maintaining the computing cluster; F.S.G. acknowledges the scholarship provided by the Secretaría de Ciencia, Humanidades, Tecnología e Innovación (Secihti) in support of his doctoral studies (CVU: 930050). V.J.L. acknowledges financial support from Secihti through project FORDECYT-PRONACES/514851/2020.
References
- Heino, M.; Kinnunen, P.; Anderson, W.; Ray, D.K.; Puma, M.J.; Varis, O.; Siebert, S.; Kummu, M. Increased probability of hot and dry weather extremes during the growing season threatens global crop yields. Sci. Rep. 2023, 13, 3583. [Google Scholar] [CrossRef] [PubMed]
- Raza, A.; Razzaq, A.; Mehmood, S.S.; Zou, X.; Zhang, X.; Lv, Y.; Xu, J. Impact of climate change on crops adaptation and strategies to tackle its outcome: A review. Plants 2019, 8, 34. [Google Scholar] [CrossRef] [PubMed]
- Medina-García, G.; Ruiz-Corral, J.A.; Rodríguez-Moreno, V.M.; Soria-Ruiz, J.; Díaz- Padilla, G.; Zarazúa Villaseñor, P. Efecto del cambio climático en el potencial productivo del frijol en México. Remexca 2017, 2465–2474. [Google Scholar] [CrossRef]
- Chung, M.Y.; Merilä, J.; Li, J.; Mao, K.; López-Pujol, J.; Tsumura, Y.; Chung, M.G. Neutral and Adaptive Genetic Diversity in plants: An overview. Front. Ecol. Evol. 2023, 11, 1116814. [Google Scholar] [CrossRef]
- Hoffmann, A.A.; Weeks, A.R.; Sgrò, C.M. Opportunities and challenges in assessing climate change vulnerability through genomics. Cell 2021, 184, 1420–1425. [Google Scholar] [CrossRef] [PubMed]
- Saccheri, I.; Kuussaari, M.; Kankare, M.; Vikman, P.; Fortelius, W.; Hanski, I. Inbreeding and extinction in a butterfly metapopulation. Nature 1998, 392, 491–494. [Google Scholar] [CrossRef]
- Corrado, G.; Rao, R. Towards the genomic basis of local adaptation in landraces. Diversity 2017, 9, 51. [Google Scholar] [CrossRef]
- Jarvis, D.I.; Brown, A.H.D.; Cuong, P.H.; Collado-Panduro, L.; Latournerie-Moreno, L.; Gyawali, S.; Tanto, T.; Sawadogo, M.; Mar, I.; Sadiki, M.; et al. A global perspective of the richness and evenness of traditional crop-variety diversity maintained by farming communities. Proc. Natl. Acad. Sci. USA 2008, 105, 5326–5331. [Google Scholar] [CrossRef] [PubMed]
- Lopes, M.S.; El-Basyoni, I.; Baenziger, P.S.; Singh, S.; Royo, C.; Ozbek, K.; Aktas, H.; Ozer, E.; Ozdemir, F.; Manickavelu, A.; et al. Exploiting genetic diversity from landraces in wheat breeding for adaptation to climate change. J. Exp. Bot. 2015, 66, 3477–3486. [Google Scholar] [CrossRef] [PubMed]
- Marone, D.; Russo, M.A.; Mores, A.; Ficco, D.B.M.; Laidò, G.; Mastrangelo, A.M.; Borrelli, G.M. Importance of landraces in cereal breeding for stress tolerance. Plants 2021, 10, 1267. [Google Scholar] [CrossRef] [PubMed]
- Maxted, N.; Ford-Lloyd, B.V.; Jury, S.; Kell, S.; Scholten, M. Towards a Definition of a crop wild relative. Biodivers. Conserv 2006, 15, 2673–2685. [Google Scholar] [CrossRef]
- Bohra, A.; Kilian, B.; Sivasankar, S.; Caccamo, M.; Mba, C.; McCouch, S.R.; Varshney, R.K. Reap the crop wild relatives for breeding future crops. Trends Biotechnol. 2022, 40, 412–431. [Google Scholar] [CrossRef] [PubMed]
- Zhang, H.; Mittal, N.; Leamy, L.J.; Barazani, O.; Song, B. Back into the wild—apply untapped genetic diversity of wild relatives for crop improvement. Evol. Appl. 2017, 10, 5–24. [Google Scholar] [CrossRef] [PubMed]
- Glémin, S.; Bataillon, T. A Comparative view of the evolution of grasses under domestication. New Phytol. 2009, 183, 273–290. [Google Scholar] [CrossRef] [PubMed]
- Meyer, R.S.; Purugganan, M.D. Evolution of crop species: genetics of domestication and diversification. Nat. Rev. Genet 2013, 14, 840–852. [Google Scholar] [CrossRef] [PubMed]
- Heindorf, C.; Reyes-Agüero, J.A.; Van’T Hooft, A. Local markets: agrobiodiversity reservoirs and access points for farmers’ plant propagation materials. Front Sustain. Food Syst. 2021, 5, 597822. [Google Scholar] [CrossRef]
- Llamas-Guzmán, L.P.; Lazos Chavero, E.; Perales Rivera, H.R.; Casas, A. Seed exchange networks of native maize, beans, and squash in San Juan Ixtenco and San Luis Huamantla, Tlaxcala, Mexico. Sustainability 2022, 14, 3779. [Google Scholar] [CrossRef]
- Angioi, S.A.; Rau, D.; Rodriguez, M.; Logozzo, G.; Desiderio, F.; Papa, R.; Attene, G. Nuclear and chloroplast microsatellite diversity in Phaseolus vulgaris L. from Sardinia (Italy). Mol. Breed. 2009, 23, 413–429. [Google Scholar] [CrossRef]
- Bitocchi, E.; Nanni, L.; Bellucci, E.; Rossi, M.; Giardini, A.; Zeuli, P.S.; Logozzo, G.; Stougaard, J.; McClean, P.; Attene, G.; et al. Mesoamerican origin of the common bean (Phaseolus vulgaris l.) is revealed by sequence data. Proc. Natl. Acad. Sci. U.S.A. 2012, 109. [Google Scholar] [CrossRef] [PubMed]
- Bitocchi, E.; Bellucci, E.; Giardini, A.; Rau, D.; Rodriguez, M.; Biagetti, E.; Santilocchi, R.; Spagnoletti Zeuli, P.; Gioia, T.; Logozzo, G.; et al. Molecular analysis of the parallel domestication of the common bean (Phaseolus vulgaris) in Mesoamerica and the Andes. New Phytol. 2013, 197, 300–313. [Google Scholar] [CrossRef] [PubMed]
- Cortés, A.J.; Chavarro, M.C.; Blair, M.W. SNP marker diversity in common bean (Phaseolus vulgaris L.). Theor. Appl. Genet 2011, 123, 827–845. [Google Scholar] [CrossRef] [PubMed]
- Kwak, M.; Gepts, P. Structure of genetic diversity in the two major gene pools of common bean (Phaseolus vulgaris L., Fabaceae). Theor. Appl. Genet 2009, 118, 979–992. [Google Scholar] [CrossRef] [PubMed]
- Almeida, C.P.D.; Paulino, J.F.D.C.; Morais Carbonell, S.A.; Chiorato, A.F.; Song, Q.; Di Vittori, V.; Rodriguez, M.; Papa, R.; Benchimol-Reis, L.L. Genetic diversity, population structure, and Andean introgression in Brazilian common bean cultivars after half a century of genetic breeding. Genes 2020, 11, 1298. [Google Scholar] [CrossRef] [PubMed]
- Rodriguez, M.; Rau, D.; Bitocchi, E.; Bellucci, E.; Biagetti, E.; Carboni, A.; Gepts, P.; Nanni, L.; Papa, R.; Attene, G. Landscape genetics, adaptive diversity and population structure in Phaseolus vulgaris. New Phytol. 2016, 209, 1781–1794. [Google Scholar] [CrossRef] [PubMed]
- Kwak, M.; Kami, J.A.; Gepts, P. The putative Mesoamerican domestication center of Phaseolus vulgaris is located in the Lerma–Santiago Basin of Mexico. Crop Sci. 2009, 49, 554–563. [Google Scholar] [CrossRef]
- Severiano-Galeana, F.; Gutiérrez-Flores, C.; Aguirre-Dugua, X.; Delgado-Salinas, A.; Jiménez-Lobato, V. Desafíos y saberes locales: prácticas tradicionales y amenazas al cultivo del frijol en la costa de Guerrero. Tlamati 2025, 22, 47–58. [Google Scholar]
- Ariani, A.; Berny; Mier, Y.; Teran, J.C.; Gepts, P. Spatial and temporal scales of range expansion in wild Phaseolus vulgaris. Mol. Biol. Evol. 2018, 35, 119–131. [Google Scholar] [CrossRef] [PubMed]
- Zizumbo-Villarreal, D.; Colunga-GarcíaMarín, P.; De La Cruz, E.P.; Delgado-Valerio, P.; Gepts, P. Population structure and evolutionary dynamics of wild–weedy–domesticated complexes of common bean in a Mesoamerican region. Crop Sci. 2005, 45, 1073–1083. [Google Scholar] [CrossRef]
- Heredia-Pech, M.; Chávez-Pesqueira, M.; Ortiz-García, M.M.; Andueza-Noh, R.H.; Chacón-Sánchez, M.I.; Martínez-Castillo, J. Consequences of introgression and gene flow on the genetic structure and diversity of lima bean (Phaseolus Lunatus L.) in its Mesoamerican diversity area. PeerJ 2022, 10, e13690. [Google Scholar] [CrossRef] [PubMed]
- Martínez-Castillo, J.; Zizumbo-Villarreal, D.; Gepts, P.; Colunga-GarcíaMarín, P. Gene flow and genetic structure in the wild–weedy–domesticated complex of Phaseolus lunatus L. in its Mesoamerican Center of domestication and diversity. Crop Sci. 2007, 47, 58–66. [Google Scholar] [CrossRef]
- Martínez-Castillo, J.; Zizumbo-Villarreal, D.; Gepts, P.; Delgado-Valerio, P.; Colunga-GarcíaMarín, P. Structure and genetic diversity of wild populations of lima bean (Phaseolus lunatus L.) from the Yucatan Peninsula, Mexico. Crop Sci. 2006, 46, 1071–1080. [Google Scholar] [CrossRef]
- Papa, R.; Gepts, P. Asymmetry of gene flow and differential geographical structure of molecular diversity in wild and domesticated common bean (Phaseolus vulgaris L.) from Mesoamerica. Theor. Appl. Genet 2003, 106, 239–250. [Google Scholar] [CrossRef] [PubMed]
- Chávez-Servia, J.L.; Heredia-García, E.; Mayek-Pérez, N.; Aquino-Bolaños, E.N.; Hernández-Delgado, S.; Carrillo-Rodríguez, J.C.; Gill-Langarica, H.R.; Vera-Guzmán, A.M. Diversity of common bean (Phaseolus vulgaris L.) landraces and the nutritional value of their grains. In Grain Legumes; Goyal, A.K., Ed.; InTech, 2016; ISBN 978-953-51-2720-8. [Google Scholar]
- Severiano Galeana, F.; Gutiérrez Flores, C.; Aguirre Dugua, X.; Delgado Salinas, A.; Jiménez Lobato, V. Local reservoirs and cultural practices of common bean (Phaseolus vulgaris) in the Coast of Guerrero, Mexico. In Biodiversity Management and Domestication in the Neotropics; Casas, A., Peroni, N., Parra-Rondinel, F., Lema, V., Aguirre-Dugua, X., Arévalo-Marín, E., Alvarado-Sizzo, H., Blancas, J., Eds.; Springer Nature Switzerland: Cham, 2025; pp. 1–23. ISBN 978-3-031-64203-6. [Google Scholar]
- Solano Cervantes, F.; Díaz Ruiz, R.; Jacinto Hernández, C.; Aguirre Álvarez, L.; Huerta De La Peña, A. Prácticas agrícolas, descripción morfológica, proteínica y culinaria del grano de cultivares de frijol sembrados en la región de Tlatzala, Guerrero. Ra Ximhai 2009, 187–200. [Google Scholar] [CrossRef]
- Boege, E. El Patrimonio biocultural de los pueblos indígenas de México. Hacia la conservación in situ de la biodiversidad y agrodiversidad en los territorios indígenas., Primera edición.; Instituto Nacional de Antropología e Historia: México, 2008; ISBN 978-968-03-0385-4. [Google Scholar]
- Doebley, J.F.; Gaut, B.S.; Smith, B.D. The molecular genetics of crop domestication. Cell 2006, 127, 1309–1321. [Google Scholar] [CrossRef] [PubMed]
- Schmutz, J.; McClean, P.E.; Mamidi, S.; Wu, G.A.; Cannon, S.B.; Grimwood, J.; Jenkins, J.; Shu, S.; Song, Q.; Chavarro, C.; et al. A reference genome for common bean and genome-wide analysis of dual domestications. Nat. Genet 2014, 46, 707–713. [Google Scholar] [CrossRef] [PubMed]
- Blair, M.W.; Iriarte, G.; Beebe, S. QTL analysis of yield traits in an advanced backcross population derived from a cultivated Andean × wild common bean (Phaseolus vulgaris L.) Cross. Theor. Appl. Genet 2006, 112, 1149–1163. [Google Scholar] [CrossRef] [PubMed]
- Castañeda-Álvarez, N.P.; Khoury, C.K.; Achicanoy, H.A.; Bernau, V.; Dempewolf, H.; Eastwood, R.J.; Guarino, L.; Harker, R.H.; Jarvis, A.; Maxted, N.; et al. Global conservation priorities for crop wild relatives. Nat. Plants 2016, 2, 16022. [Google Scholar] [CrossRef] [PubMed]
- Kapazoglou, A.; Gerakari, M.; Lazaridi, E.; Kleftogianni, K.; Sarri, E.; Tani, E.; Bebeli, P.J. Crop wild relatives: a valuable source of tolerance to various abiotic stresses. Plants 2023, 12, 328. [Google Scholar] [CrossRef] [PubMed]
- Colin-Bahena, H.; Monrroy, R.; Velázquez-Carreño, H.; García-Flore, A.; Monroy-Ortiz, C. El tianguis de Coatetelco, Morelos: articulador de la conservación biocultural en el territorio. Rev. Etnobiol 2018, 16, 87–97. [Google Scholar]
- Rendón-Anaya, M.; Montero-Vargas, J.M.; Saburido-Álvarez, S.; Vlasova, A.; Capella-Gutierrez, S.; Ordaz-Ortiz, J.J.; Aguilar, O.M.; Vianello-Brondani, R.P.; Santalla, M.; Delaye, L.; et al. Genomic history of the origin and domestication of common bean unveils its closest sister species. Genome Biol. 2017, 18, 60. [Google Scholar] [CrossRef] [PubMed]
- Ellstrand, N.C.; Rieseberg, L.H. When gene flow really matters: gene flow in applied evolutionary biology. Evol. Appl. 2016, 9, 833–836. [Google Scholar] [CrossRef] [PubMed]
- Feurtey, A.; Cornille, A.; Shykoff, J.A.; Snirc, A.; Giraud, T. Crop-to-wild gene flow and its fitness consequences for a wild fruit tree: Towards a comprehensive conservation strategy of the wild apple in europe. Evol. Appl. 2017, 10, 180–188. [Google Scholar] [CrossRef] [PubMed]
- Bliss, F.A. Common bean. In hybridization of crop plants; John Wiley & Sons, Ltd, 1980; pp. 273–284. ISBN 978-0-89118-566-6. [Google Scholar]
- Debouck, D.G. Diversity in Phaseolus species in relation to the common bean. in common bean improvement in the twenty-first century. In Developments in Plant Breeding; Singh, S.P., Ed.; Springer Netherlands: Dordrecht, 1999; Vol. 7, pp. 25–52. ISBN 978-90-481-5293-3. [Google Scholar]
- Keller, L. Inbreeding effects in wild populations. Trends Ecol. Evol. 2002, 17, 230–241. [Google Scholar] [CrossRef]
- Willi, Y.; Griffin, P.; Van Buskirk, J. Drift load in populations of small size and low density. Heredity 2013, 110, 296–302. [Google Scholar] [CrossRef] [PubMed]
- Spigler, R.B.; Theodorou, K.; Chang, S. Inbreeding depression and drift load in small populations at demographic disequilibrium. Evolution 2017, 71, 81–94. [Google Scholar] [CrossRef] [PubMed]
- SIAP. (Servicio de Información Agroalimentaria y Pesquera) Anuario estadístico de la producción agrícola; Informe de la producción de frijol común en Guerrero. Available online: https://nube.siap.gob.mx/cierreagricola/.
- INEGI. (Instituto Nacional de Estadística y Geografía) Aspectos geográficos de Guerrero. 2022; p. 43. [Google Scholar]
- Li, H. Aligning sequence reads, clone sequences and assembly contigs with BWA-MEM. arXiv 2013, arXiv:1303.3997. [Google Scholar]
- Li, H.; Handsaker, B.; Wysoker, A.; Fennell, T.; Ruan, J.; Homer, N.; Marth, G.; Abecasis, G.; Durbin, R. 1000 genome project data processing subgroup the sequence alignment/map format and SAMtools. Bioinformatics 2009, 25, 2078–2079. [Google Scholar] [CrossRef] [PubMed]
- McKenna, A.; Hanna, M.; Banks, E.; Sivachenko, A.; Cibulskis, K.; Kernytsky, A.; Garimella, K.; Altshuler, D.; Gabriel, S.; Daly, M.; et al. The genome analysis toolkit: a mapreduce framework for analyzing next-generation DNA sequencing data. Genome Res. 2010, 20, 1297–1303. [Google Scholar] [CrossRef] [PubMed]
- Tajima, F. Statistical method for testing the neutral mutation hypothesis by DNA polymorphism. Genetics 1989, 123, 585–595. [Google Scholar] [CrossRef] [PubMed]
- Weir, B.S.; Cockerham, C.C. Estimating F-statistics for the analysis of population structure. Evolution 1984, 38, 1358. [Google Scholar] [CrossRef]
- Wright, S. The genetical structure of populations. Ann. Eugen. 1949, 15, 323–354. [Google Scholar] [CrossRef] [PubMed]
- Frichot, E.; Mathieu, F.; Trouillon, T.; Bouchard, G.; François, O. Fast and efficient estimation of individual ancestry coefficients. Genetics 2014, 196, 973–983. [Google Scholar] [CrossRef] [PubMed]
- Frichot, E.; François, O. LEA: An R package for landscape and ecological association studies. Methods Ecol. Evol. 2015, 6, 925–929. [Google Scholar] [CrossRef]
- Gain, C.; François, O. LEA 3: Factor models in population genetics and ecological genomics with R. Mol. Ecol. Resour. 2021, 21, 2738–2748. [Google Scholar] [CrossRef] [PubMed]
- Kumar, S.; Stecher, G.; Suleski, M.; Sanderford, M.; Sharma, S.; Tamura, K. MEGA12: Molecular evolutionary genetic analysis version 12 for adaptive and green computing. Mol. Biol. Evo 2024, 41, 1–9. [Google Scholar] [CrossRef] [PubMed]
- R Core Team R: The R Project for Statistical Computing. Available online: https://www.r-project.org/ (accessed on 13 June 2025).
- Excoffier, L.; Lischer, H.E.L. Arlequin suite Ver 3.5: a new series of programs to perform population genetics analyses under Linux and Windows. Mol. Ecol. Resour. 2010, 10, 564–567. [Google Scholar] [CrossRef] [PubMed]
- Slatkin, M. Gene flow in natural populations. Ann. Rev. Ecol. Syst. 1985, 16, 393–430. [Google Scholar] [CrossRef]
- Mussmann, S.M.; Douglas, M.R.; Chafin, T.K.; Douglas, M.E. BA3-SNPs: Contemporary migration reconfigured in BayesAss for next-generation sequence data. Methods Ecol. Evol. 2019, 10, 1808–1813. [Google Scholar] [CrossRef]
Figure 1.
Population genetic structure of Phaseolus vulgaris inferred with Sparse Non-negative Matrix Factorization, sNMF. a) Ancestry coefficients for K = 4; b) Cross-entropy values obtained using sNMF method for different numbers of genetic clusters (K); c) Ancestry coefficients for K = 3; d) Ancestry proportions by origin group. W: wild populations; L: local landraces; M: Local market varieties; I: Improved varieties.
Figure 1.
Population genetic structure of Phaseolus vulgaris inferred with Sparse Non-negative Matrix Factorization, sNMF. a) Ancestry coefficients for K = 4; b) Cross-entropy values obtained using sNMF method for different numbers of genetic clusters (K); c) Ancestry coefficients for K = 3; d) Ancestry proportions by origin group. W: wild populations; L: local landraces; M: Local market varieties; I: Improved varieties.
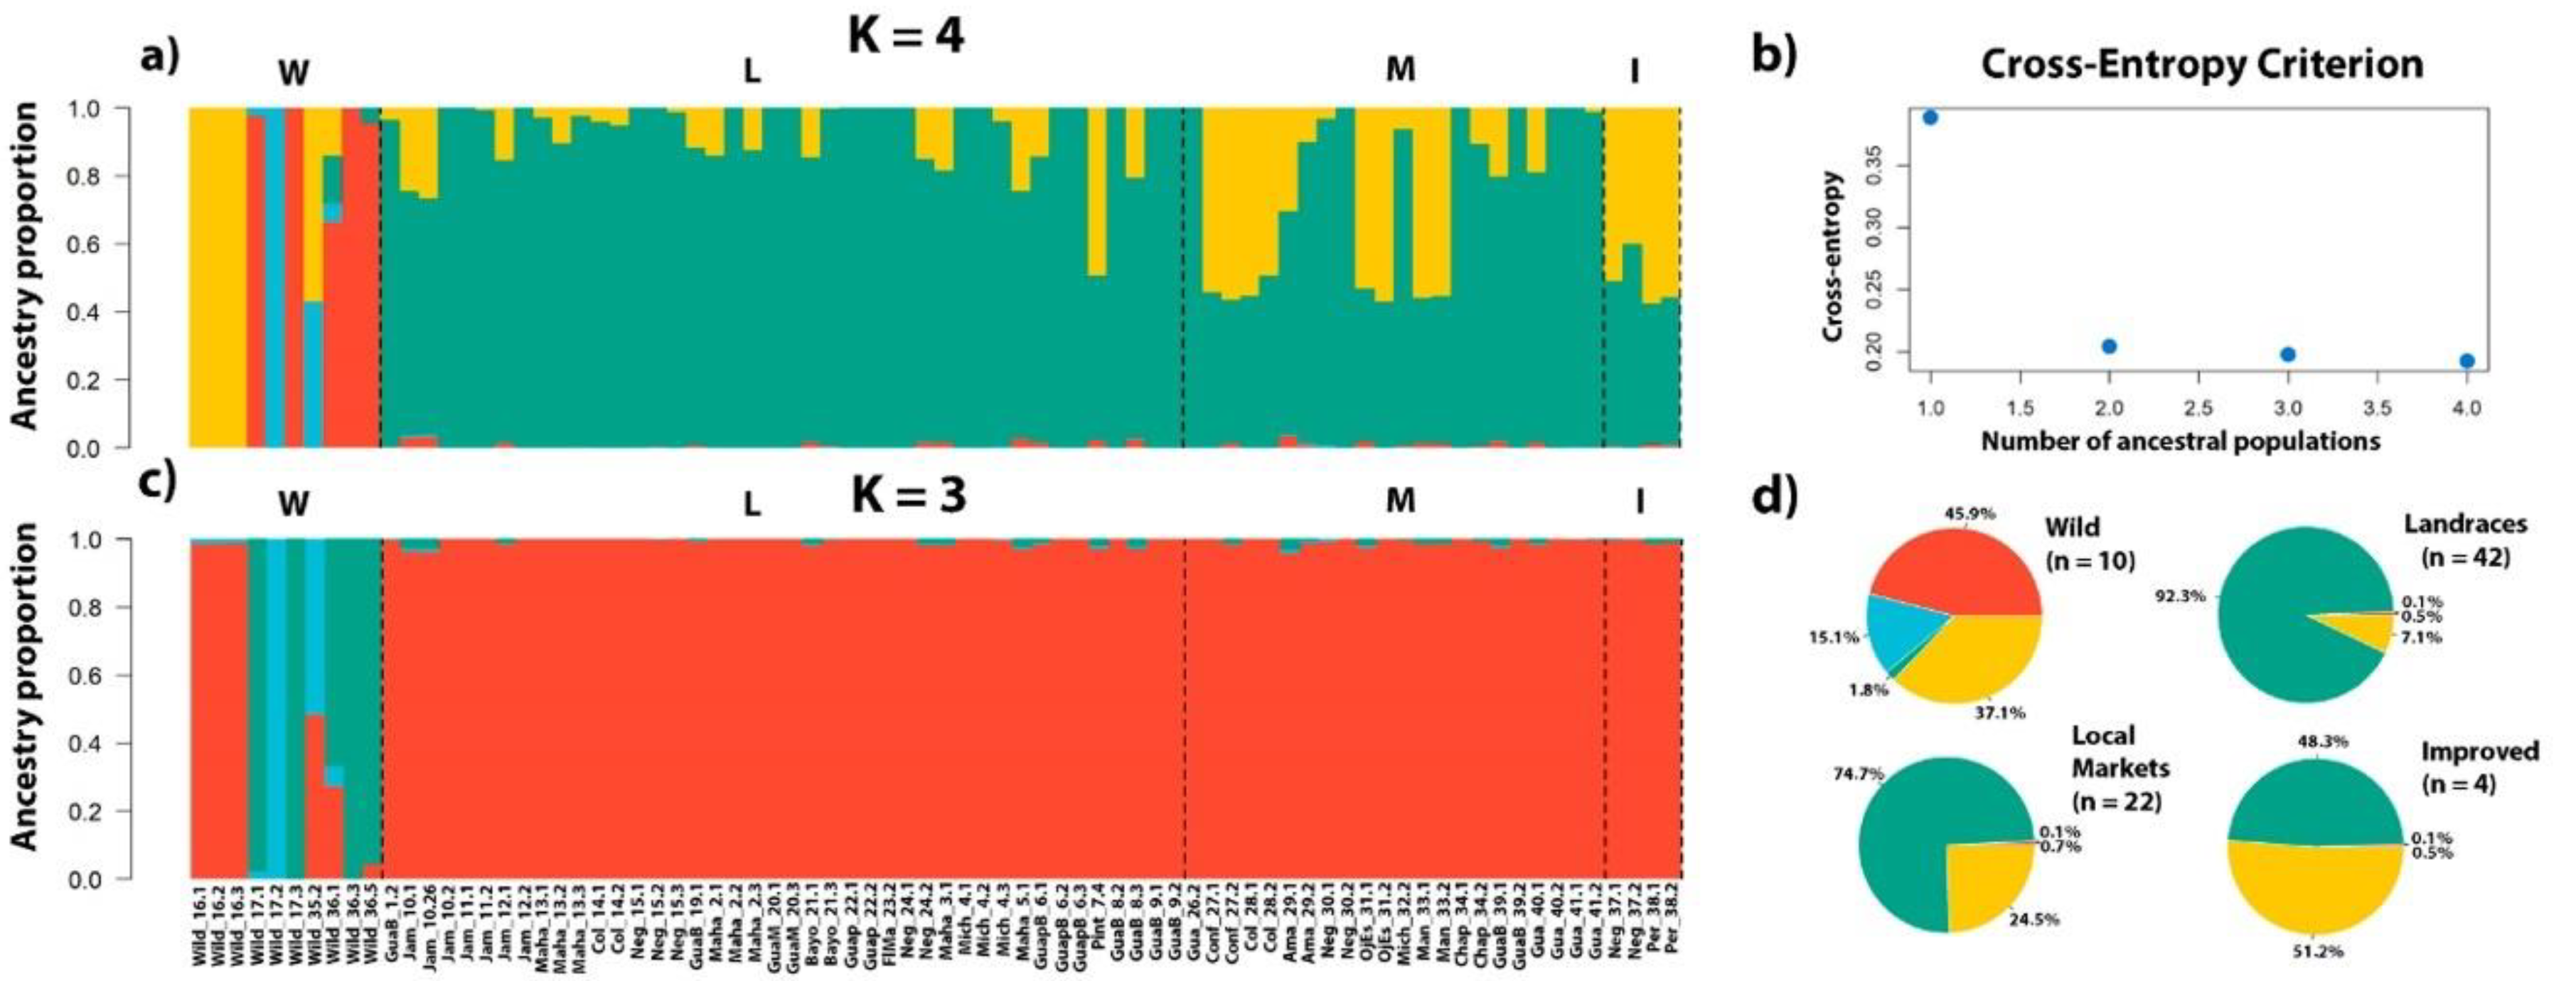
Figure 2.
Neighbor-Joining (NJ) phylogenetic tree based on neutral SNPs of Phaseolus vulgaris. Numerical values at nodes indicate bootstrap support obtained from 1,000 replicates. Colored circles at the tips represent the different origin groups analyzed. Name of varieties: Ama: Amapa; Bayo: Bayo; Chap: Chaparro; Col: Colorado; Conf: Confeti; FlMa: Flor de Mayo; Guap: Guapinol; GuapB: White Guapinol; GuapM: Purple Guapinol; Jam: Jamapa; Maha: Mahapan; Man: Mantequilla; Mich: Michigan; Neg: Black; OjEs: Ojito Escaldado; Per: Peruano; Pint: Pinto.
Figure 2.
Neighbor-Joining (NJ) phylogenetic tree based on neutral SNPs of Phaseolus vulgaris. Numerical values at nodes indicate bootstrap support obtained from 1,000 replicates. Colored circles at the tips represent the different origin groups analyzed. Name of varieties: Ama: Amapa; Bayo: Bayo; Chap: Chaparro; Col: Colorado; Conf: Confeti; FlMa: Flor de Mayo; Guap: Guapinol; GuapB: White Guapinol; GuapM: Purple Guapinol; Jam: Jamapa; Maha: Mahapan; Man: Mantequilla; Mich: Michigan; Neg: Black; OjEs: Ojito Escaldado; Per: Peruano; Pint: Pinto.
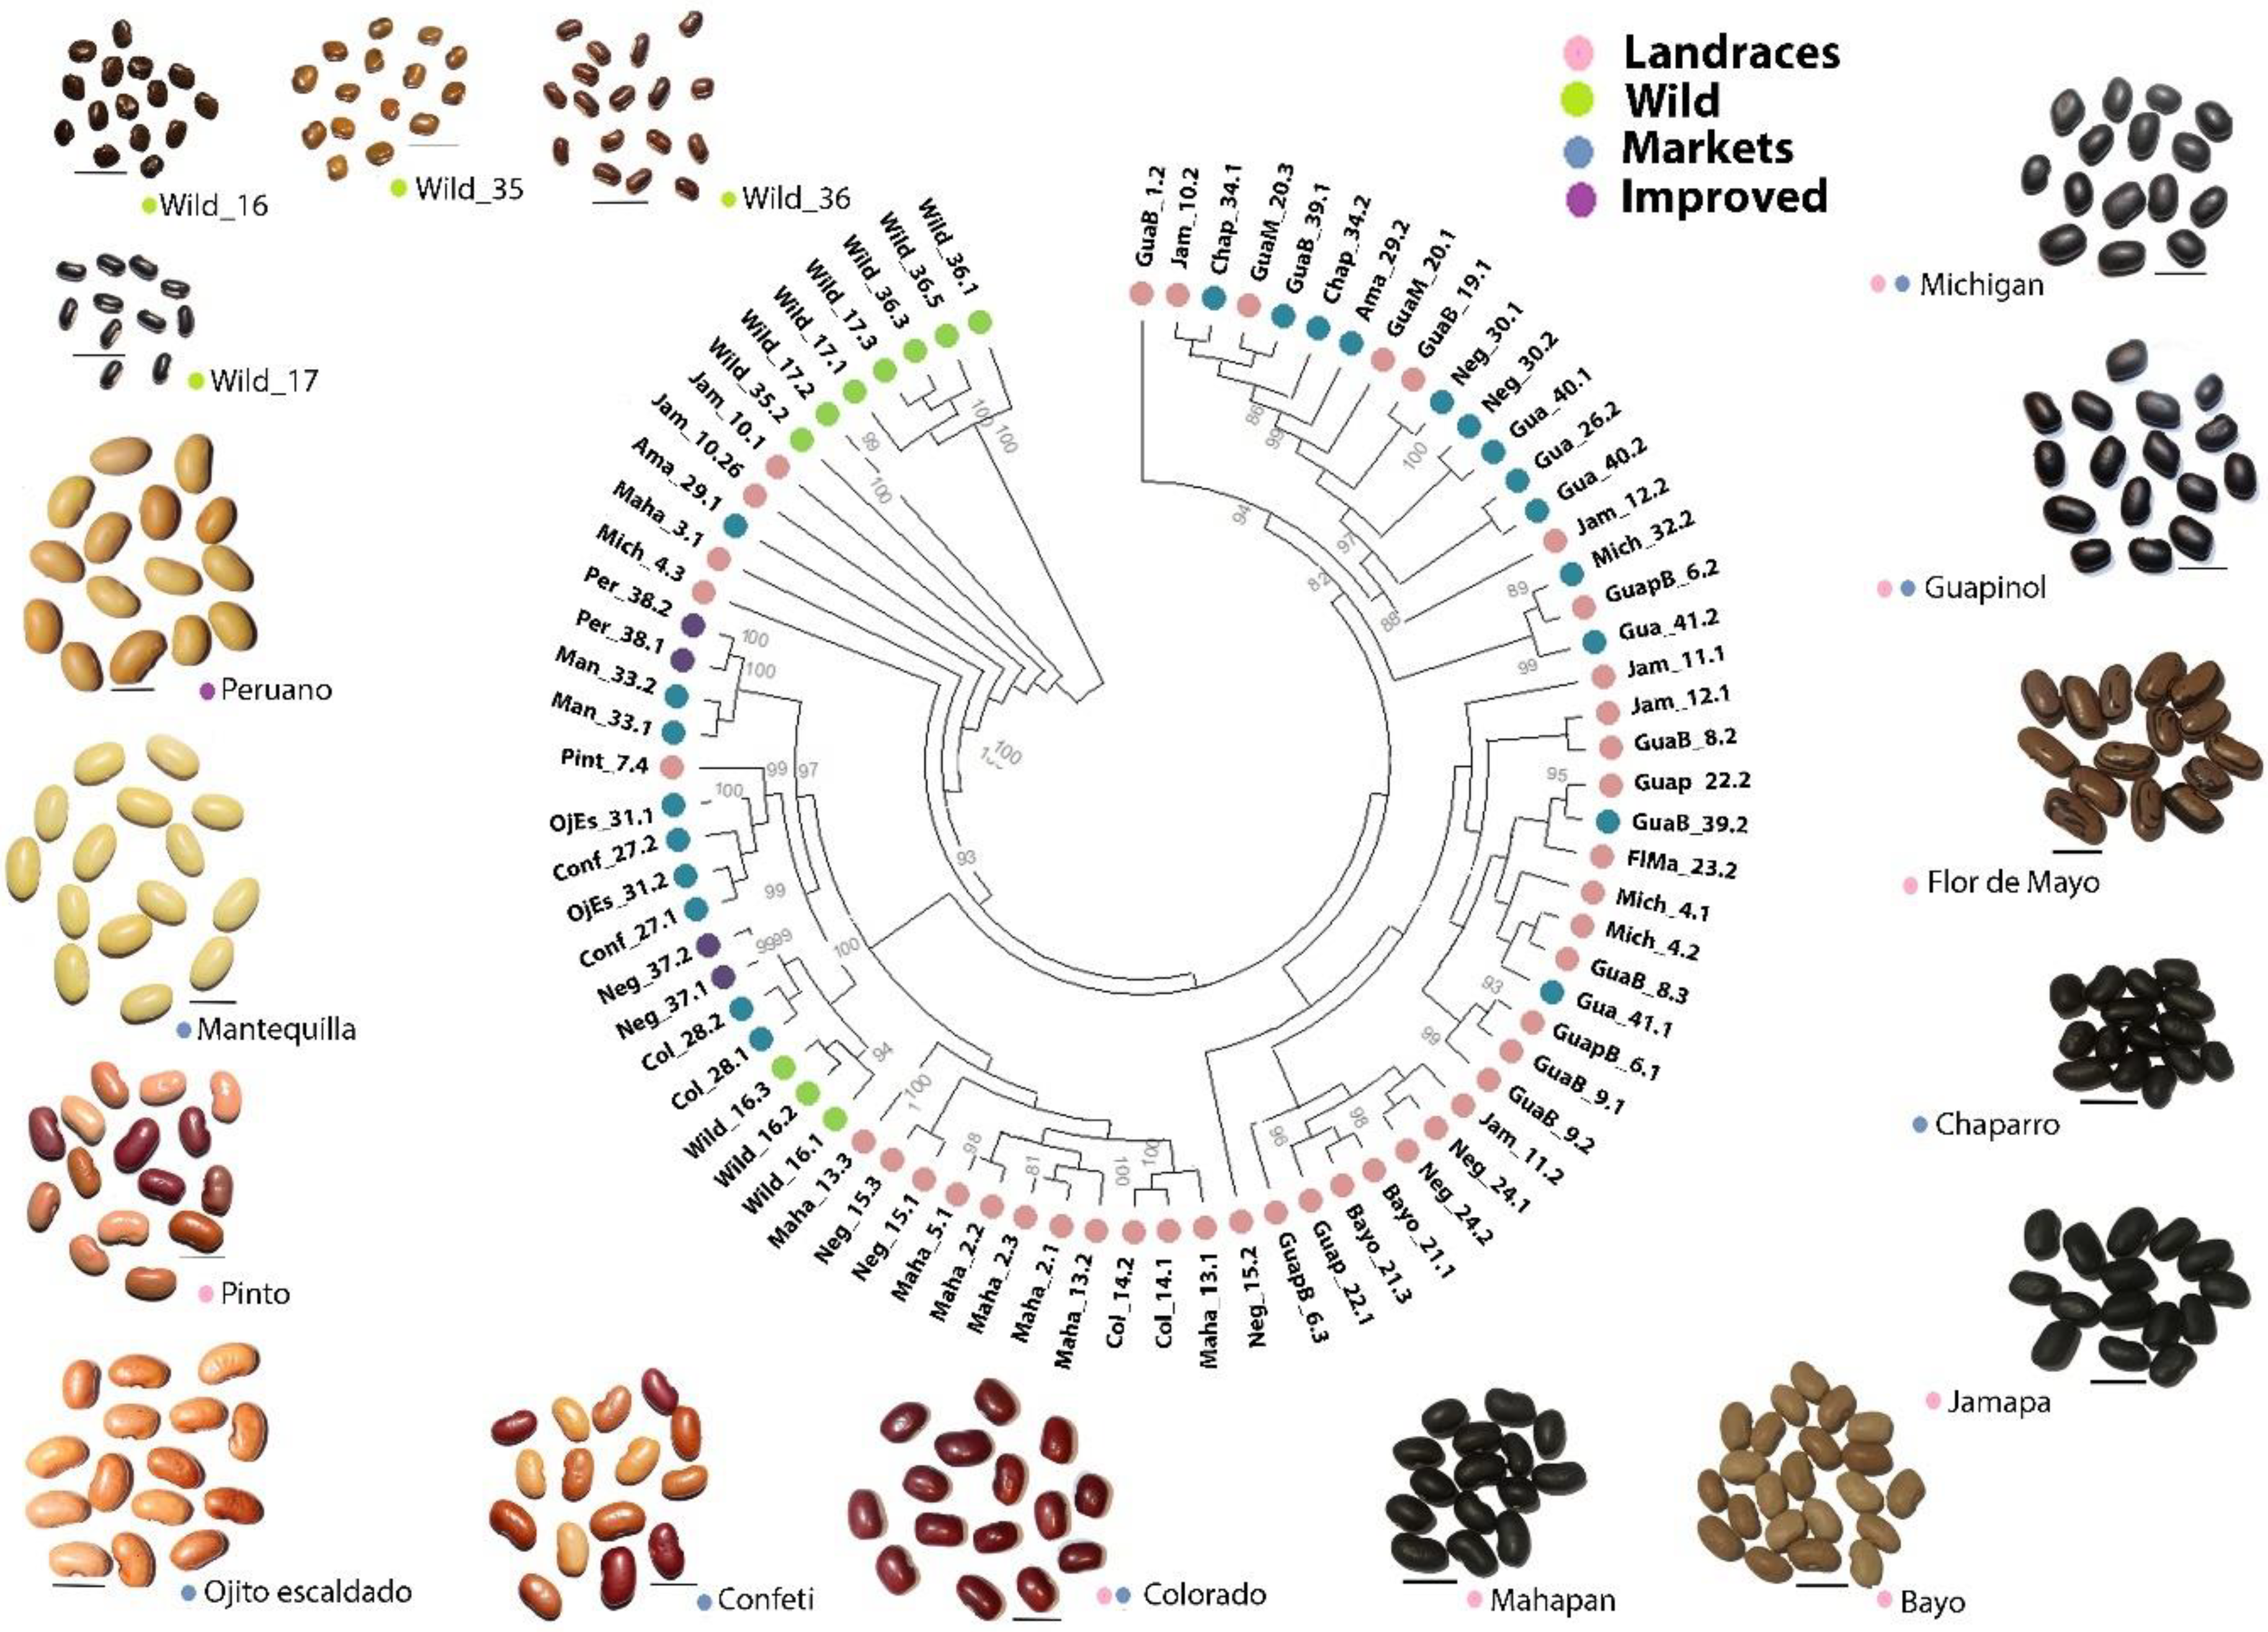
Figure 3.
Principal Coordinates Analysis (PCoA) of 78 Phaseolus vulgaris accessions based on neutral SNPs. Each point represents an individual, and colors indicate the groups analyzed: local landraces (pink), wild populations (green), local market varieties (blue), and improved varieties (purple).
Figure 3.
Principal Coordinates Analysis (PCoA) of 78 Phaseolus vulgaris accessions based on neutral SNPs. Each point represents an individual, and colors indicate the groups analyzed: local landraces (pink), wild populations (green), local market varieties (blue), and improved varieties (purple).
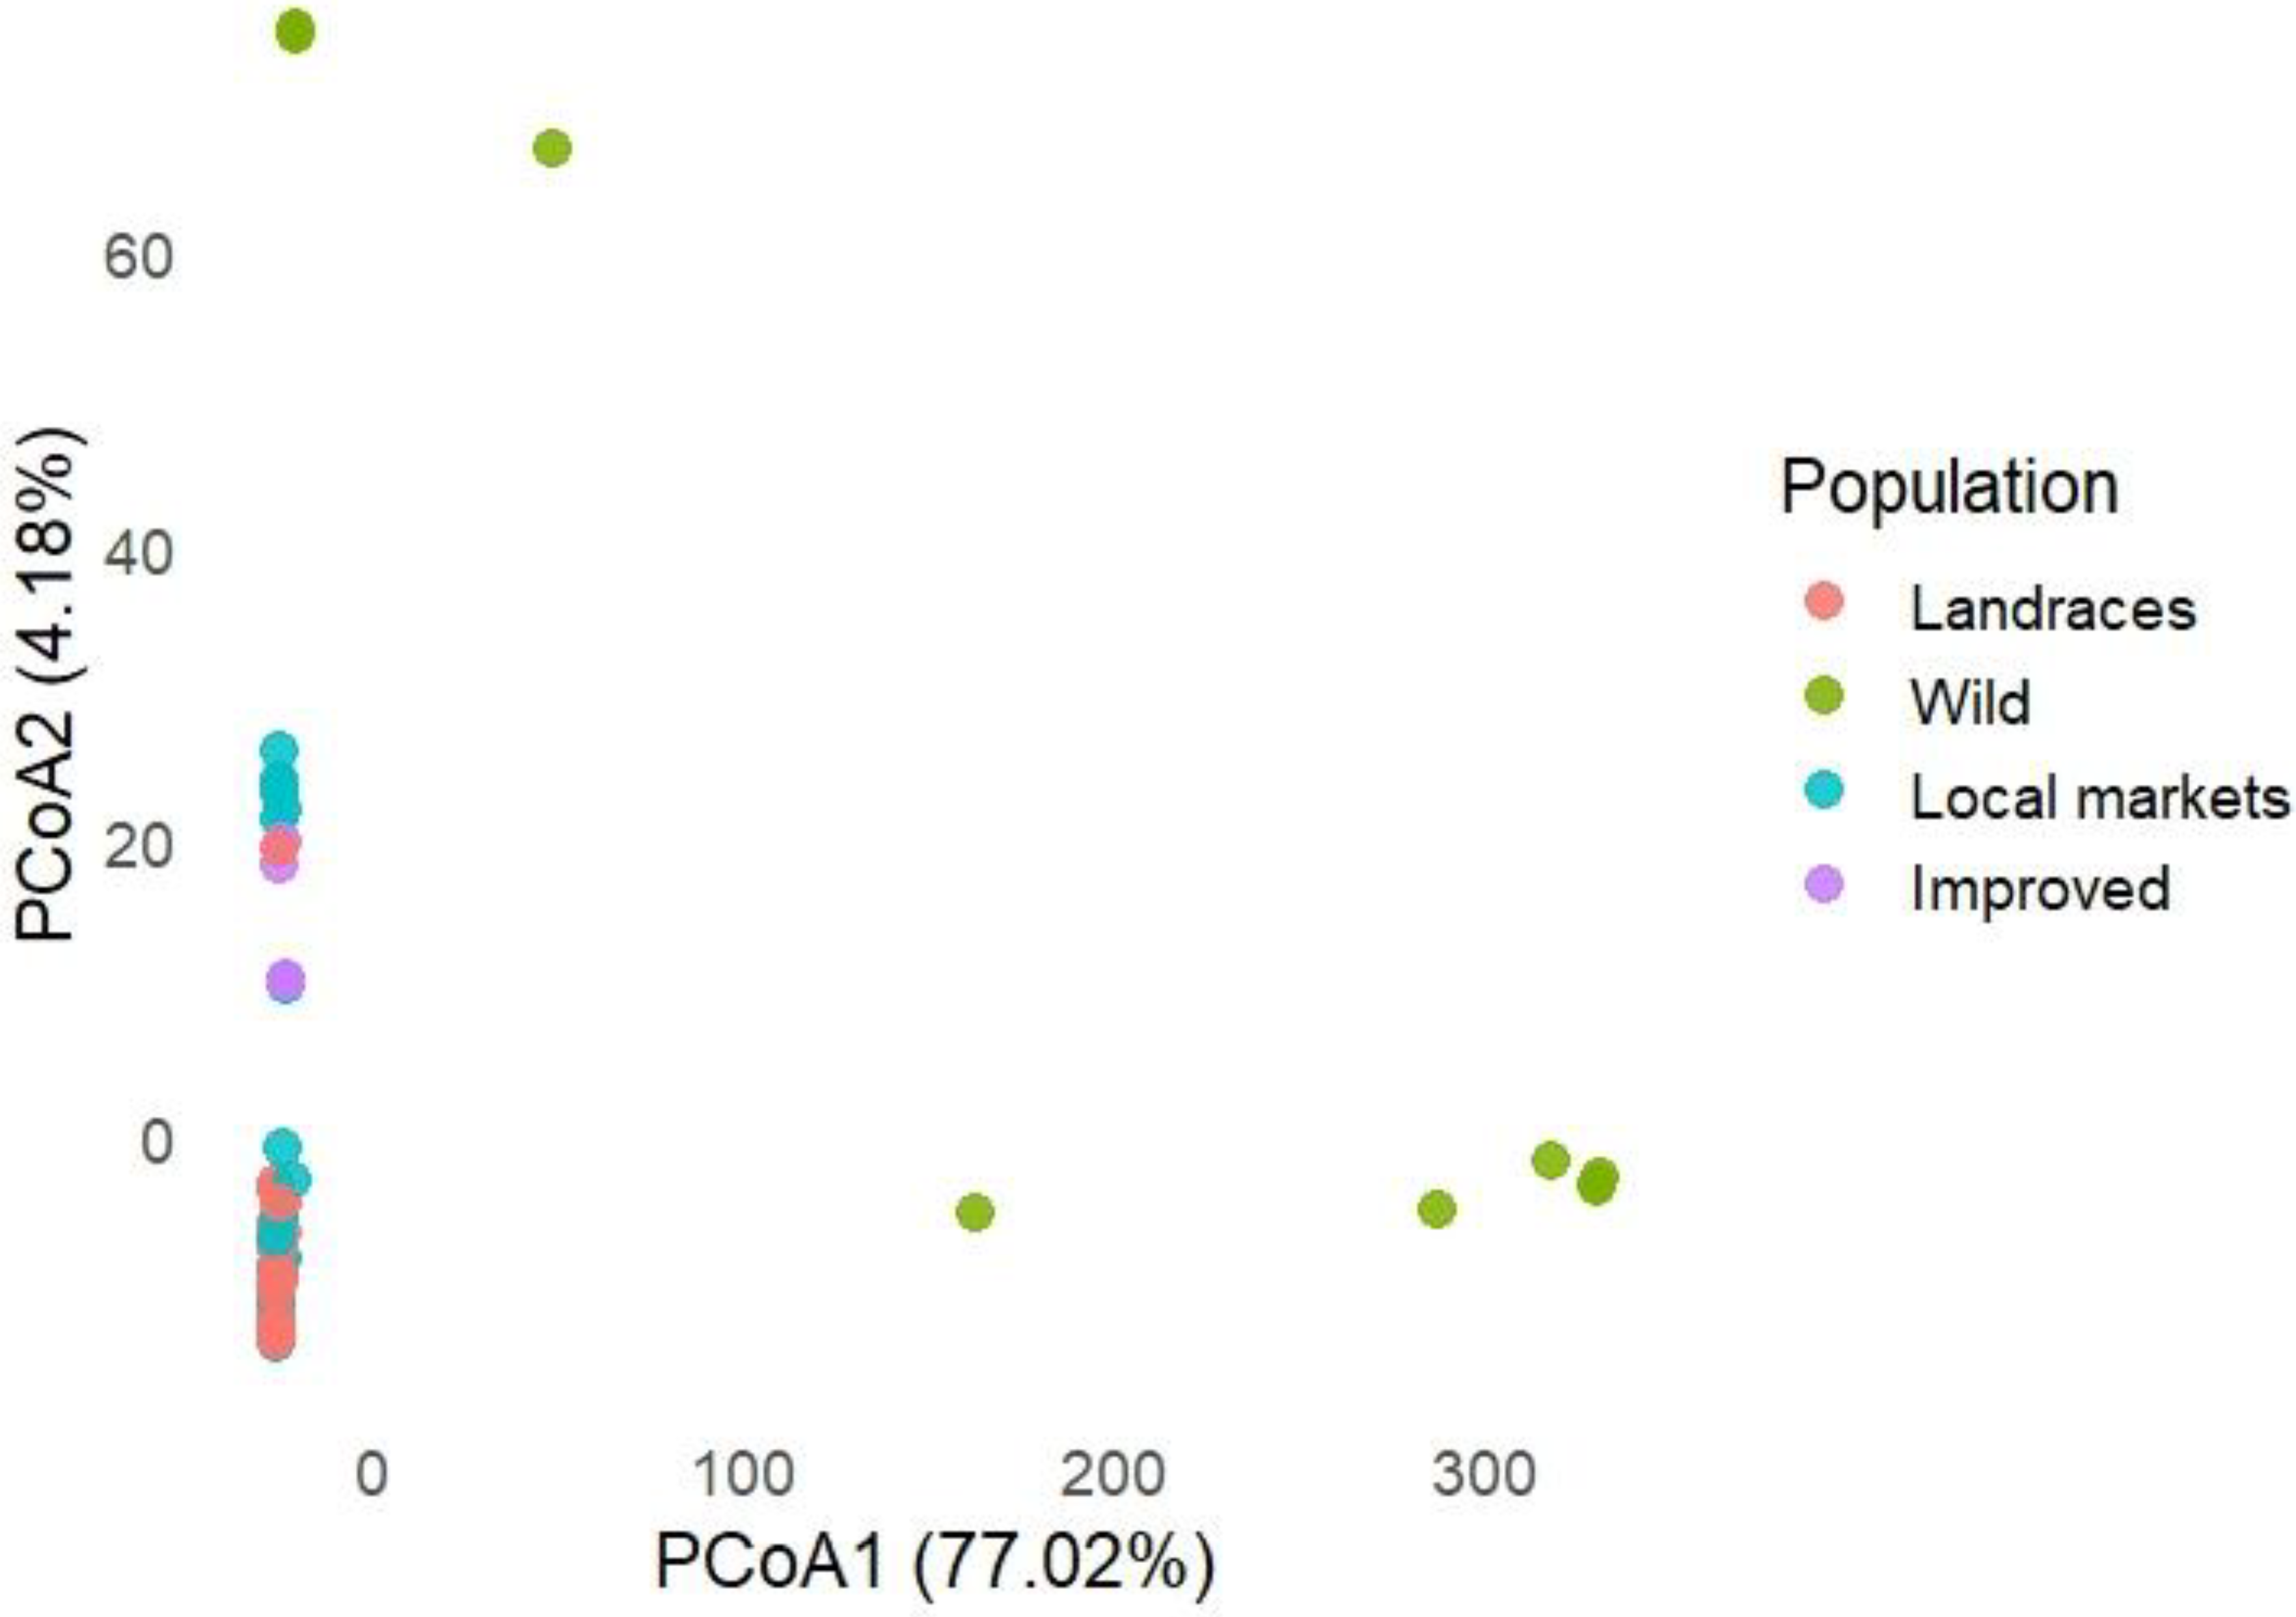
Figure 4.
Recent migration rates in the last two generations (error standard) among common bean (Phaseolus vulgaris) groups in the coast of Guerrero, Mexico. The arrows represent the direction of the estimated migrants between pairs of populations.
Figure 4.
Recent migration rates in the last two generations (error standard) among common bean (Phaseolus vulgaris) groups in the coast of Guerrero, Mexico. The arrows represent the direction of the estimated migrants between pairs of populations.
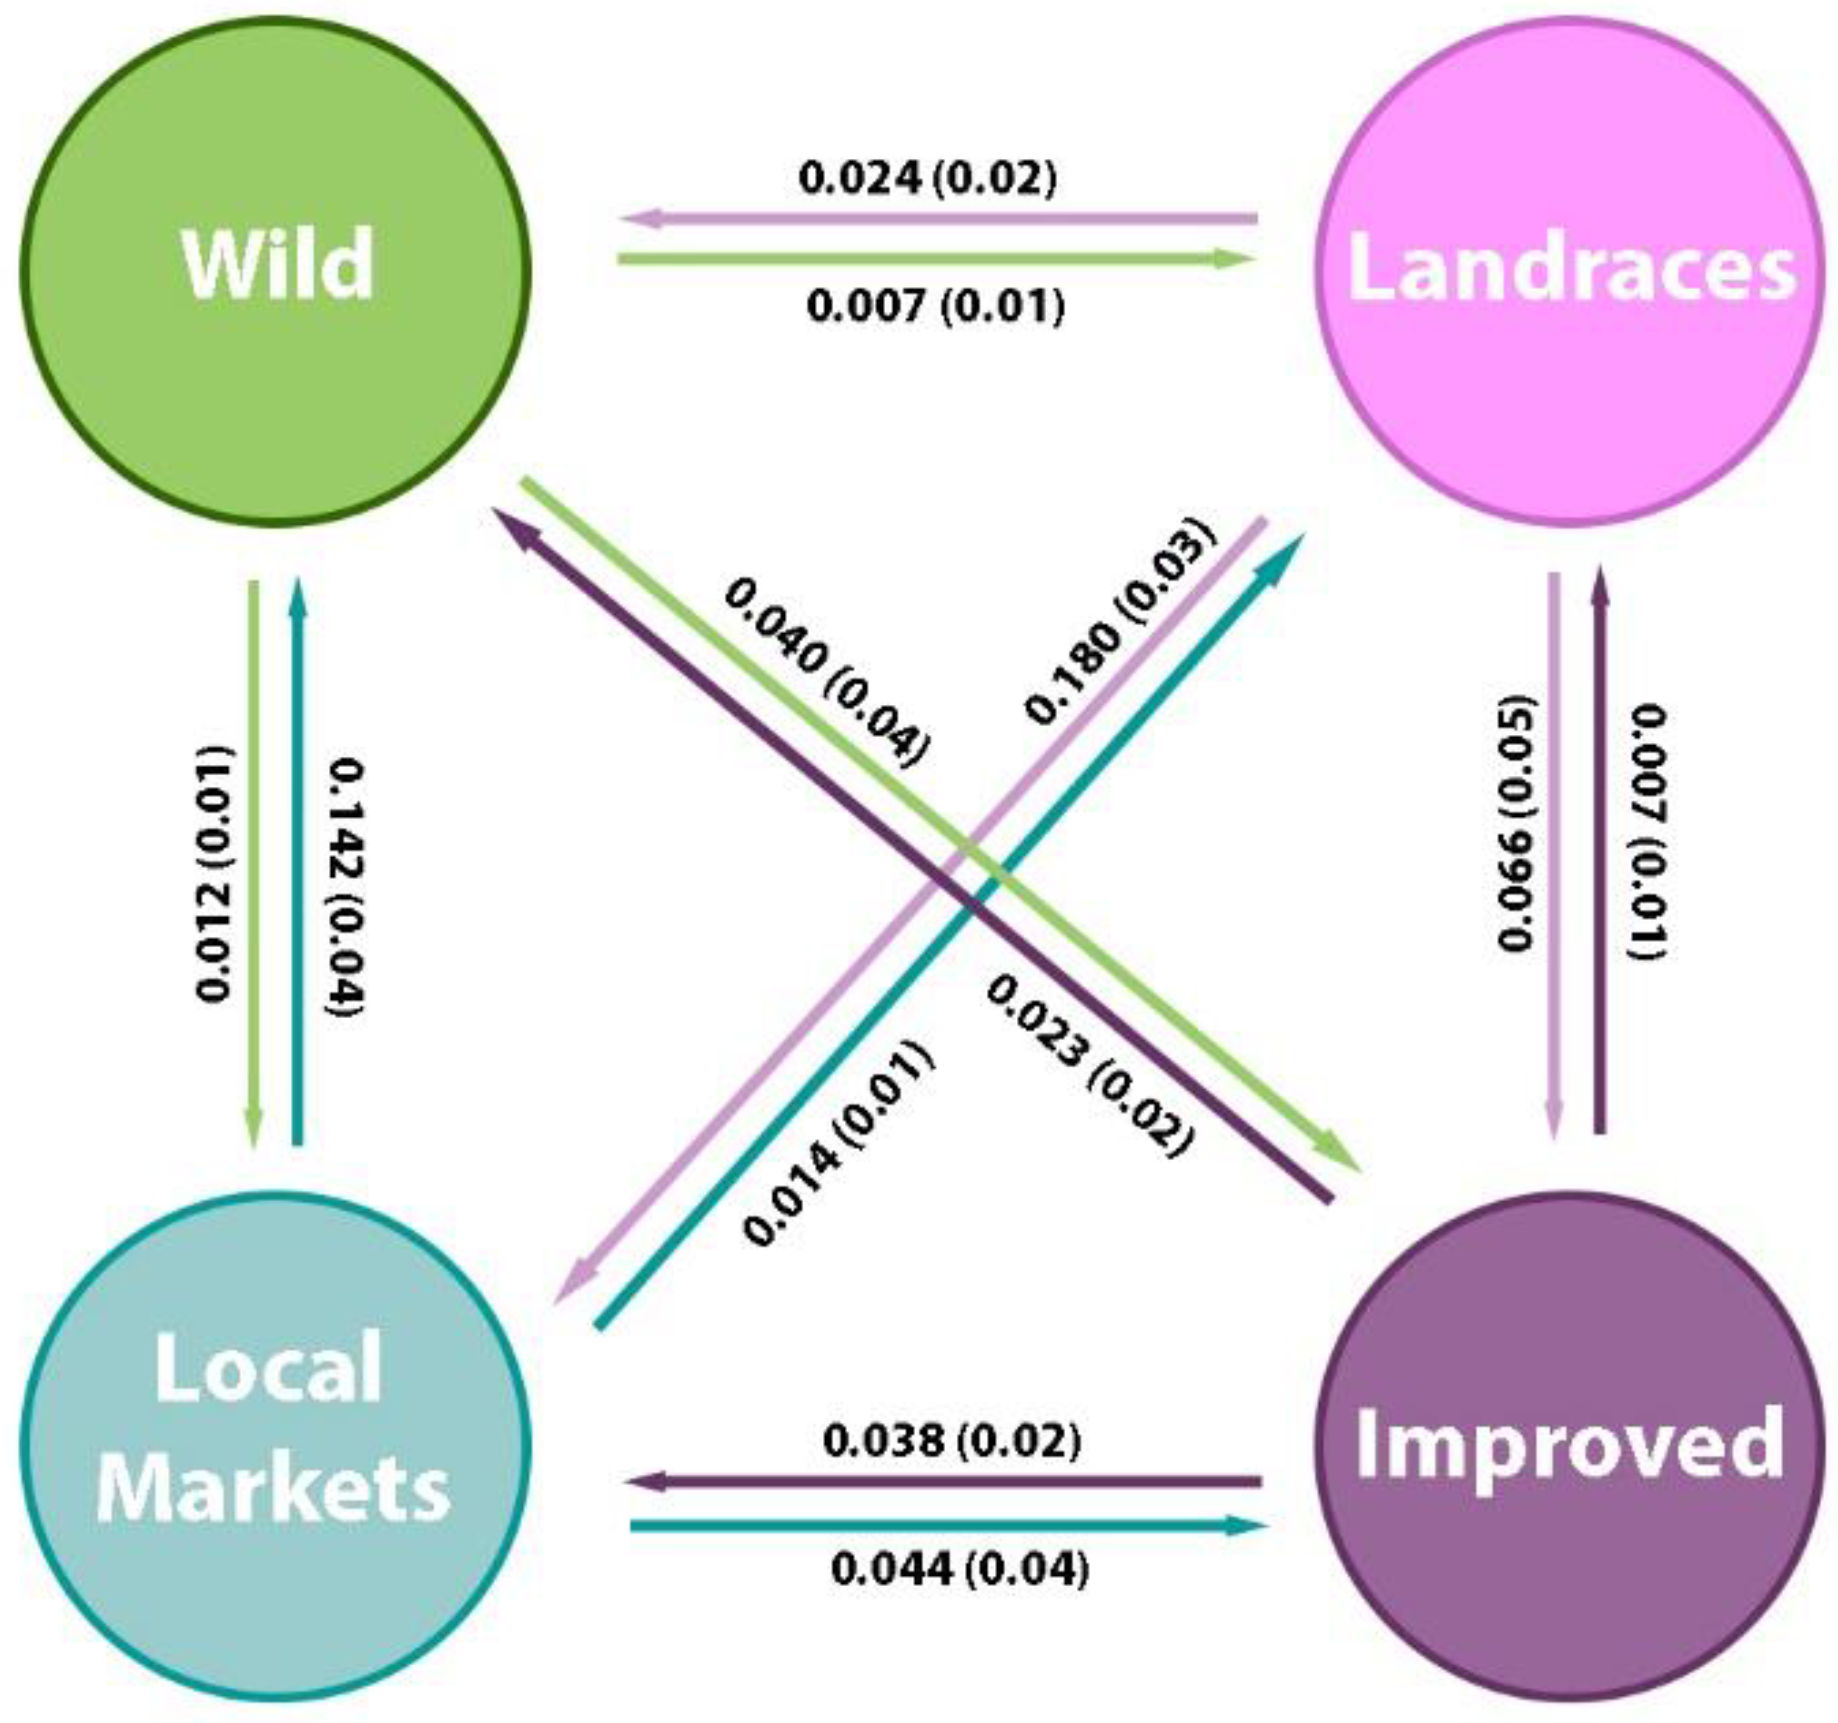
Figure 5.
Study area and sampling sites of common bean (Phaseolus vulgaris) seeds collected along the coast of Guerrero, Mexico.
Figure 5.
Study area and sampling sites of common bean (Phaseolus vulgaris) seeds collected along the coast of Guerrero, Mexico.
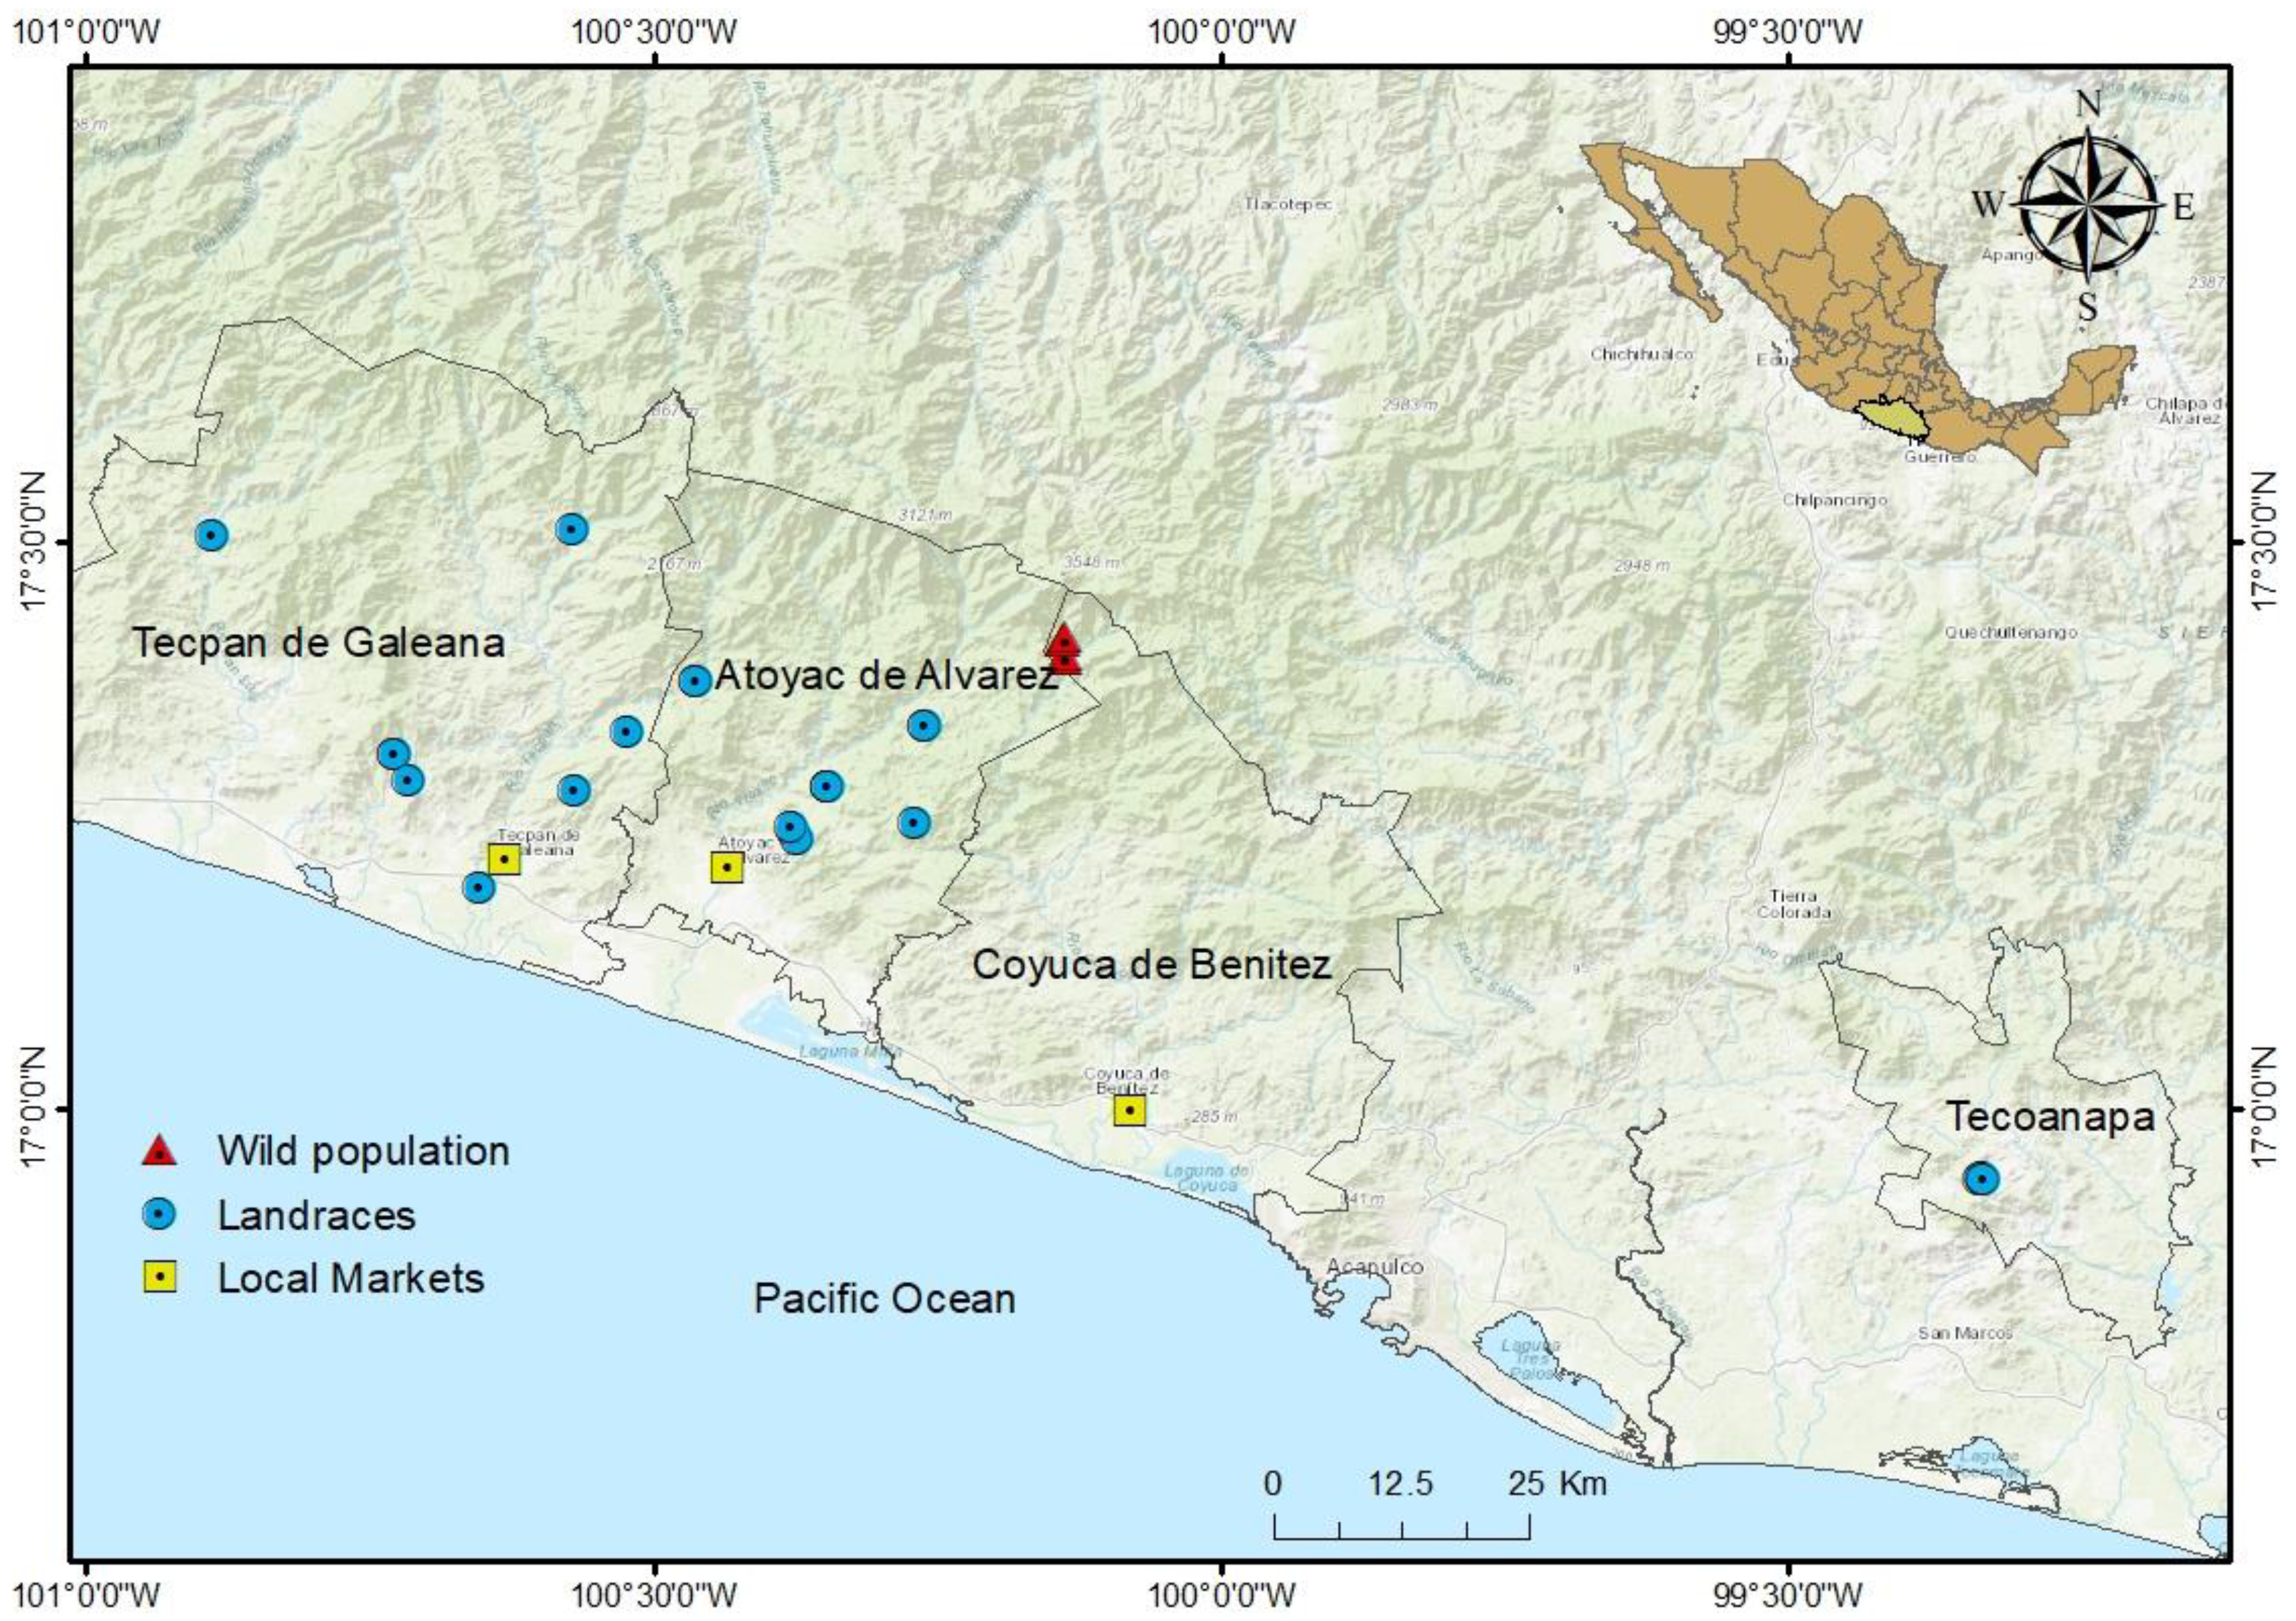

Table 1.
Analysis of Molecular Variance (AMOVA) for four common bean (Phaseolus vulgaris) groups from different origins in the coast of Guerrero, Mexico.
Table 1.
Analysis of Molecular Variance (AMOVA) for four common bean (Phaseolus vulgaris) groups from different origins in the coast of Guerrero, Mexico.
| Source of variation | g.l. | Sum of squares | Variance components | Percentage of variation |
| Among groups | 3 | 73260 | 735.74 | 51.89 |
| Among individuals within groups | 74 | 76003.4 | 345.03 | 24.34 |
| Within individuals | 78 | 26287 | 337.01 | 23.77 |
| Total | 155 | 175550 | 1417.78 | 100 |
Table 2.
Pairwise genetic differentiation (FST) (lower diagonal) and gene flow (Nm) (upper diagonal) based on SNP markers among four common bean (Phaseolus vulgaris) groups in the coast of Guerrero, Mexico.
Table 2.
Pairwise genetic differentiation (FST) (lower diagonal) and gene flow (Nm) (upper diagonal) based on SNP markers among four common bean (Phaseolus vulgaris) groups in the coast of Guerrero, Mexico.
| FST / Nm | Wild | Landraces | Local markets | Improved |
| Wild | --- | 0.209 | 0.331 | 0.711 |
| Landraces | 0.704 | --- | 7.877 | 1.376 |
| Local markets | 0.601 | 0.059 | --- | 2.981 |
| Improved | 0.412 | 0.266 | 0.143 | --- |
Table 3.
Neutral genetic diversity estimates in four common bean (Phaseolus vulgaris) groups in the coast of Guerrero, Mexico. Standard deviations are shown in parentheses.
Table 3.
Neutral genetic diversity estimates in four common bean (Phaseolus vulgaris) groups in the coast of Guerrero, Mexico. Standard deviations are shown in parentheses.
| Groups | N | P | %P | HO (s.d) | HE (s.d) | FIS | Π |
| Wild | 10 | 10,723 | 56.6 | 0.154 (0.11) | 0.494 (0.07) | 0.696 | 0.548 |
| Landraces | 42 | 2,479 | 13.4 | 0.233 (0.25) | 0.243 (0.14) | 0.037 | 0.032 |
| Local markets | 22 | 3,001 | 16.7 | 0.174 (0.21) | 0.232 (0.14) | 0.288 | 0.041 |
| Improved | 4 | 1,856 | 10.3 | 0.245 (0.26) | 0.441 (0.13) | 0.511 | 0.044 |
| Total | 78 | 17999 | 100% |
N:Number of samples per group; P: Number of polymorphic loci; %P: Percentage of polymorphic loci; HO: Observed heterozygosity; HE: Expected heterozygosity; FIS: Inbreeding coefficient; π: Nucleotide diversity.
Disclaimer/Publisher’s Note: The statements, opinions and data contained in all publications are solely those of the individual author(s) and contributor(s) and not of MDPI and/or the editor(s). MDPI and/or the editor(s) disclaim responsibility for any injury to people or property resulting from any ideas, methods, instructions or products referred to in the content. |
© 2026 by the authors. Licensee MDPI, Basel, Switzerland. This article is an open access article distributed under the terms and conditions of the Creative Commons Attribution (CC BY) license (http://creativecommons.org/licenses/by/4.0/).
Copyright: This open access article is published under a Creative Commons CC BY 4.0 license, which permit the free download, distribution, and reuse, provided that the author and preprint are cited in any reuse.