

Submitted:
11 August 2026
Posted:
12 August 2026
You are already at the latest version
Abstract
T-2 toxin and deoxynivalenol (DON) are major trichothecene mycotoxins that frequently contaminate agricultural products and pose substantial risks to human and animal health. Here, a highly sensitive and specific surface-enhanced Raman scattering lateral flow immunochromatographic assay (SERS-LFIA) was developed for simultaneous determination of T-2 toxin and DON on a single test line. Silver-coated petal-like gap-enhanced Raman tags encoded with 4-aminothiophenol or 4-nitrobenzenethiol were conjugated with antibodies against T-2 toxin or DON, respectively. A mixture of T-2 toxin-ovalbumin and DON-ovalbumin coating antigens was immobilized on the test line. After a 15 min assay, Raman signals at 1136 cm−1 and 1333 cm−1 were measured for quantitative detection. The assay produced IC50 values of 0.35 ng mL−1 for T-2 toxin and 0.29 ng mL−1 for DON, with limits of detection of 0.0033 and 0.0067 pg mL−1, respectively. No mutual interference or significant cross-reactivity with aflatoxin B1, ochratoxin A, zearalenone, patulin, or fumonisin B1 was observed. Recoveries from spiked corn and wheat samples ranged from 89.7% to 114.6%, with relative standard deviations below 9.09%. This rapid platform therefore enables sensitive and specific multiplex mycotoxin analysis on a single test line.
Keywords:
T-2 toxin
; deoxynivalenol (DON)
; surface-enhanced Raman scattering (SERS)
; lateral flow immunochromatographic assay (LFIA)
; SERS-LFIA
; Raman tags
1. Introduction
Mycotoxins are the secondary metabolites produced by various fungal species, including Aspergillus, Penicillium, Fusarium, and Alternaria. They are commonly found in moldy agricultural products such as grains, nuts, fruits, etc. [1,2]. Also, mycotoxins are often present in animal products such as meat, eggs and milk, where the mycotoxins were transferred and accumulated when the animals ingested contaminated feed [3]. Most mycotoxins remain structurally stable under conventional cooking temperatures, and are non-volatile and resistant to degradation [4]. The accumulation of mycotoxins in the food chain will induce serious toxic effects on animals and human being such as carcinogenicity, mutagenicity, teratogenicity, neurotoxicity, and immunotoxicity [5]. In addition, large-scale contamination of agricultural products by mycotoxins will cause tremendous economic loss [6]. The most well-known mycotoxins include aflatoxin B1 (AFB1), ochratoxin A (OTA), zearalenone (ZEN), etc. Recently, trichothecenes, especially T-2 toxin and deoxynivalenol (DON), are getting great attention [7]. It was reported that T-2 toxin exhibits the highest toxicity in trichothecenes family, while DON is the most frequently detected mycotoxin [8]. T-2 toxin and DON predominantly contaminate in plant derived foods, and bring potential food safety risks. Weight loss, vomiting, bleeding, cell apoptosis, cardiotoxicity and teratogenicity, and even death have been observed as a result of exposure to T-2 toxin and DON. What’s worse, T-2 toxin and DON usually contaminated in food simultaneously [9]. Therefore, establishing sensitive and specific analytical methods for simultaneous detection of T-2 toxin and DON in food samples is of great importance.
Many analytical methods have been reported for the detection of T-2 toxin and DON in food samples [10,11]. Immunoassays, especially enzyme-linked immunosorbent assays (ELISAs), were proved to be suitable for fast screening and semiquantitative methods for target trichothecenes [12,13]. However, the results from ELISAs were not reliable for precision quantify, and positive results should be further confirmed by the chromatographic methods such as high performance liquid chromatography tandem mass spectrum (LC-MS/MS) or gas chromatography-mass spectrometry (GC–MS) [14,15]. Although chromatographic methods are reliable for precise quantitative analysis, they require expensive equipment, professionally trained operators, and complex sample preparation processes, making them impractical for point-of-care (POC) testing.
Lateral flow immunochromatographic assay (LFIA) is one of the most popular POC testings widely used in clinical, biological, environmental and food for rapid diagnosis due to its simplicity, short times to obtain test results, a user-friendly format, low cost, and long-term stability [16,17]. However, the commonly used LFIA based on colloidal gold nanoparticles (NPs) can only be used for qualitative or semi-quantitative detection. In the last decades, many quantitative LFIAs based on various nanomaterials (magnetic particles, carbon nano-particles, fluorescent microspheres, quantum dots, up-conversion fluorescence, lanthanide nanoparticles, etc.) using different readout signals (fluorescence, chemiluminescence, magnet, electrochemical, etc.) have been developed [18,19]. For the detection of analytes with very low concentration in the samples, the existing LFIAs described above are still troubled in some way by poor sensitivity and low accuracy. On the other hand, for multiplex detection, the normal LFIAs are unable to detect two to three analytes on a single test line simultaneously. The detection of two to three analytes on a single T line will greatly reduce the signal acquisition time, reagent consumption and cost, preparation time of LFIA as well as manual operation.
Surface-enhanced Raman scattering (SERS) is considered to be one of the most sensitive analytical techniques in the world, as it was reported that SERS was able to detect a single molecule [20,21]. SERS refers to the phenomenon that when Raman active molecules (e.g., Raman reporters) are adsorbed on the surface of rough noble-metal (gold, silver, etc.) substrates, the Raman intensities of the molecules are greatly amplified [22,23]. The SERS enhancement effect of the substrates are mainly relied on the “hot spots”, which are relative to the composition, structure, shape and morphology of noble metals. Many gold and silver nanomaterials in form of flowers, star, prisms, hollows, cones, rods, etc. have been synthesized and used in SERS-based analytical methods [24,25]. Compared to the NPs described above, the NPs with nano-gaps often showed a higher SERS enhancement because of the anisotropic distribution of electromagnetic field near the surface of non-spherical particles. The generation of ultra-narrow gaps in nanostructures can cause a significant increase in near-field spectral. It was reported that the enhancement factor (EF) generated in ultra-narrow gaps was about proportional to the fourth power of near-field spectral [26,27]. Recently, a novel type of gap-based nanomaterial, e.g., encoded silver-coated petals-like gap-enhanced Raman tags (P-GERT@Ag) with the highest “hot spots” densities have been synthesized and applied to high-speed Raman imaging [28]. The strategy is simultaneous growth and functionalization of an Au shell around Au nanospheres coated with Raman reporter. The amount of added Raman reporter is key factor to control the structure of the resulting Raman tags, which consists a Au petal core, the embedded Raman reporters, and a silver shell [28].
In the last ten years, a novel quantitative SERS-based lateral flow immunochromatographic assay (SERS-LFIA) has been developed with great progress due to its advantages such as ultra-sensitivity, simplicity, rapidity, capability for detecting two to three analytes in a single test line, integrating sample enrichment and detection when Fe3O4@nobel metal NPs were empolyed as the substrates, etc. [29,30,31,32]. SERS-LFIA has been widely used for the detection various target analytes in clinical, biological, environmental and food areas [33,34,35,36,37,38,39].
In this study, a highly sensitive and specific SERS-LFIA was developed for simultaneous detection of T-2 toxin and DON in food samples on a single test line using ATP and NBT encoded silver-coated petals-like gap-enhanced Raman tags (P-GERTATP@Ag, P-GERTNBT@Ag). These Raman tages were prepared, characterized, and applied to SERS-LFIA for simultaneous detection of T-2 toxin and DON for the first time. By immobilizing the antibodies against T-2 toxin and DON on the surface of Raman tags, two immunoprobes (e.g., P-GERTATP@Ag-AbT-2, P-GERTNBT@Ag-AbDON) were obtained. As illustrated in Figure 1A, the mixture of coating antigens, e.g., T-2-ovalbumin (OVA) and DON-OVA conjugates, were coated on a single T line, and the immunoprobes were subjected to LFIA procedures. After 15 min, the specific SERS intensities of ATP at 1136 cm−1 and NBT at 1333 cm−1 on the T line were measured for the quantitative detection of T-2 toxin and DON simultaneously.
2. Results and Discussion
2.1. Synthesis and Characterization of Raman Tags
In the presence of Au seeds, Au NPs were synthesized. As shown in Figure S1A,B, the diameter of the Au NPs was about 20 nm with the absorbance peak at 540 nm. Using Au NPs as the spherical core, the encoded silver-coated petals-like gap-enhanced Raman tags (e.g., P-GERTATP@Ag, P-GERTNTP@Ag) were synthesized by layer-by-layer method (Figure 1B). In the synthesis, the Au nanopetals were formed (Figure S2) due to Raman reporters induced multi-point nucleation on Au NPs, creating continuous nanogaps at Au sphere-petal interfaces (yellow arrow indicated) and discontinuous nanogaps between rough petals-like structures (blue arrow indicated). During the shell growth, the amount of Raman reporter added is considered the key factor in morphological control of petals-like structure [28,40]. As shown in the TEM images in Figure 2A–E, when the amount of Raman reporter (ATP or NBT, 0.01 mol L−1) added to 2 mL Au NPs solution was increased from 2 μL, 10 μL, 50 μL, 100 μL to 200 μL, the morphology of the product gradually changed from gap-enhanced Raman tags (GERTs) with smooth shell (S-GERT) [Figure 2A, GERT 1] to multi petals-like GERTs (P-GERT) [Figure 2B–E, GERT 2~5].
The SERS intensities of the five synthesized NBT-encoded GERTs with different morphologies measured at 785 nm laser excitation were shown in Figure 2F. It can be seen that the SERS intensity (at 1333 cm−1) of S-GERT (GERT 1) synthesized at 2 μL of NBT addition is very low due to fewer amount of nanogaps formed, while the SERS intensity of P-GERTs (GERT 2~4) synthesized at 10 μL, 50 μL and 100 μL of NBT addition are gradually increased. However, the SERS intensity of P-GERT (GERT 5) synthesized at 200 μL of NBT addition is rapidly declined, which may be due to the accumulation of the P-GERT when excess NBT was added. The same findings are also observed in ATP-encoded GERTs. As the P-GERTs (GERT 4) at 100 μL of NBT (or ATP) addition displayed the strongest SERS intensity, they were selected for further experiment.
To protect the possible loss of Raman reporter from P-GERT, and to enhance SERS intensity further (Ag displaying higher SERS enhancement than that of Au), Ag coating shell was fabricated on the outside of P-GERT to form bimetallic sandwich-like structure, which consists of Au petal core, the embedded Raman reporter, and a silver shell. The TEM image of the synthesized P-GERT@Ag is shown in Figure 3A. It can be seen that the encoded P-GERT@Ag is spherical-like with the diameter about 120 nm. The HAADF-STEM image of the P-GERT@Ag is shown in Figure 3B, from which the the core (P-GERT) can be observed. EDS analysis was also performed, and the corresponding element mapping images of Ag, S (from Raman reporter) and Au in P-GERT@Ag were shown in Figure 3C–E. Apparently, the distribution of Ag, S and Au is gradually from shell to core, verifying the core-shell structure of P-GERT@Ag. In addition, UV-vis spectra of P-GERT@Ag and P-GERT were shown in Figure 3F. It can be seen from Figure 3F that P-GERT exhibits one plasmonic peak at 590 nm. Compared to the plasmonic peak of Au NPs at 540 nm [Figure S1B], there is 50 nm red-shift for P-GERT. While for P-GERT@Ag, there are two plasmonic peaks at 450 nm and 620 nm, which are relative to the existence of Ag shell and Au petal core. All above results clearly indicate the success of the encoded P-GERT@Ag synthesis. Moreover, the SERS spectra of P-GERTs (P-GERTATP, P-GERTNBT) and Raman tags (P-GERTATP@Ag, P-GERTNTP@Ag) were displayed in in Figure 4A,B, respectively. Apparently, the SERS intensities of P-GERTATP@Ag (or P-GERTNBT@Ag) are much higher than those of P-GERTATP (or P-GERTNBT), indicating the great SERS enhancement of Ag shell.
To investigate whether the selected Raman reporters (ATP, NBT) can be employed in SERS-LFIA for the detection of two analytes in a single T line or not, the SERS spectra of P-GERTATP@Ag, P-GERTNBT@Ag and the mixture of the two Raman tags (P-GERTATP@Ag + P-GERTNBT@Ag) were examined and shown in in Figure S3. It can be seen that for SERS spectra of P-GERTATP@Ag, the highest peak of ATP at 1078 cm−1 is overlapped with the peak of NBT at 1077 cm−1 in spectra of P-GERTNBT@Ag. However, for the second-high peak of ATP at 1136 cm−1, the interference from the spectra of P-GERTATP@Ag is avoided. Therefore, for P-GERTATP@Ag, the SERS intensity at 1136 cm−1 was selected for quantification. For SERS spectra of P-GERTNBT@Ag, as there is almost no interference from the spectra P-GERTATP@Ag on the highest peak (1333 cm−1), the SERS intensity at 1333 cm−1 was used for quantification. It is confirmed from Figure S3 that based on ATP and NBT as the Raman reporters, the SERS-LFIA has the capability to detect two analytes in on single T line.
2.2. Characterization of Immunoprobes
Two types of immunoprobes (P-GERTATP@Ag-AbT-2, P-GERTNBT@Ag-AbDON) were prepared simply by immobilizing the mAbs against T-2 toxin and DON on the surface of P-GERTATP@Ag and P-GERTNBT@Ag, respectively. The specific recognition of the immunoprobes with the corresponding antigens coated on the T line was examined by following experiments. As shown in Figure S4A, the specific recognition of P-GERTATP@Ag-AbT-2 with T-2 toxin-OVA coated on T line was firstly tested. The SERS-LFIA procedures were performed at zero concentration of T-2 toxin standard under following five situations: (I) P-GERTATP@Ag-AbT-2 as the immunoprobe, T-2 toxin-OVA coated on T line; (II) P-GERTATP@Ag-AbT-2 as the immunoprobe, DON-OVA coated on T line; (III) P-GERTATP@Ag-BSA as the immunoprobe, T-2 toxin-OVA coated on T line; (IV) P-GERTATP@Ag-AbT-2 as the immunoprobe, OVA coated on T line; (V) P-GERTATP@Ag-AbT-2 as the immunoprobe, Na2CO3-NaHCO3 applied on T line. From the spectrum (I) in Figure S4A, it can be seen that the specific Raman peak of ATP at 1136 cm−1 with the signal values of 13,000 (a.u.), which clearly demonstrates that the immunoprobe can be specifically captured by T-2 toxin-OVA at the T line. While from the Raman spectra (II–V) in Figure S4A, the SERS signals appeared at 1136 cm−1 were very low (<2000 a.u.) due to lack the specific reaction between mAb with corresponding antigen. In the situations of II, IV, V, P-GERTATP@Ag-AbT-2 was used, but these was no T-2 toxin-OVA on the T line; while in the situation of III, although T-2 toxin-OVA was coated on T line, no mAb against T-2 toxin was appeared in the immunoprobe.
The specific recognition of P-GERTNBT@Ag-AbDON with DON-OVA coated on T line was examined in the similar manner, and the corresponding Raman spectra (I–V) were presented in Figure S4B. The specific Raman peak of NBT at 1333 cm−1 from spectrum (I) was found to be 13,500 (a.u.), while SERS signals from spectra (II–V) in were less than 1500 a.u., demonstrating that P-GERTNBT@Ag-AbDON can only be specifically captured with DON-OVA on the T line.
2.3. Optimization of SERS-LFIA Experimental Conditions
To improve the sensitivity of the SERS-LFIA for simultaneous detection of T-2 toxin and DON in a single T line, a series of experimental conditions including the concentration of coating antigen applied to T line, the amount of antibodies added in the preparation of immunoprobes, and the amount of immunoprobes applied in SERS-LFIA procedures, etc. should be optimized carefully. Herein, the inhibition ratio B0/B0.1 was used to evaluate the optimization, where B0 and B0.1 refer to the SERS intensities of ATP at 1136 cm−1 (or SERS intensities of NBT at 1333 cm−1) when the concentrations of T-2 toxin (or DON) in standard solution were 0 ng mL−1 and 0.1 ng mL−1, respectively. Higher B0/B0.1 value implys higher sensitivity of the SERS-LFIA for target analyte.
The dosage of coating antigen on T line significantly influence the sensitivity of the analysis. As shown in Figure S5A,D, the amount of T-2 toxin-OVA (or DON-OVA) on B0/B0.1 value were optimized. It was found from Figure S5A that when 5 μL of T-2 toxin-OVA at concentrations from 1.0 mg mL−1 to 3.0 mg mL−1 was applied to T line, the highest value of the B0/B0.1 was achieved at 2.0 mg mL−1. While from Figure S5D, when 5 μL of DON-OVA at concentrations from 0.5 mg mL−1 to 2.5 mg mL−1 was applied to test strips, the highest value of the B0/B0.1 was achieved at 1.0 mg mL−1.
The amount of mAbs used for the preparation of immunoprobes were optimized. As shown in Figure S5B, when the volume of 0.5 mg mL−1 T-2 toxin-Ab varied from 1.0 μL to 5.0 μL, the highest inhibition ratio achieved at 3.0 μL. As shown in Figure S5E, when the volume of 1.0 mg mL−1 DON-Ab was in range of 0.5–2.5 μL, the highest inhibition ratio achieved at 1.0 μL.
The amount of immunoprobes used in SERS-LFIA was also optimized. As shown in Figure S5C, when the volume of T-2 toxin immunoprobe varied from 1.0 μL to 5.0 μL, the highest inhibition ratio achieved at 3.0 μL. As shown in Figure S5F, when the volume of DON immunoprobe varied from 4.0 μL to 12 μL, the highest inhibition ratio achieved at 6.0 μL. In summary, the optimal detection conditions for T-2 toxin and DON were: the mixture containing 5 μL of T-2 toxin-OVA (2.0 mg mL−1) and 5 μL of DON-OVA (1.0 mg mL−1) disperse on T line; the mixture containing of 3 μL of P-GERTATP@Ag-AbT-2 and 6 μL of P-GERTNBT@Ag-AbDON applied in SERS-LFIA procedure.
2.4. Simultaneous Detection of T-2 Toxin and DON on a Single Test Line
To assess the quantitative detection of T-2 toxin and DON oin a single T line, standard solutions containing both T-2 toxin and DON at the concentrations of 0, 10−4, 10−3, 10−2, 0.1, 1, 10 and 100 ng mL−1 were subjected to SERS-LFIA procedures under optimal conditions. After 15 min, as shown in Figure 5B, the color intensity on the T lines gradually becomes lighter with the increasing of T-2 toxin and DON concentrations. This was further confirmed by SEM images taken from T lines at 0 ng mL−1 and 100 ng mL−1. Many immunoprobes NPs appeared in Figure 5A at 0 ng mL−1, while fewer immunoprobes NPs were observed in Figure 5C at 100 ng mL−1, demonstrating that with the concentrations of T-2 toxin and DON increase, the amount of immunoprobes bound to the T lines decreases. Meanwhile, with the standard solutions varied in range of 0 ~ 100 ng mL−1, the corresponding SERS spectra were recorded and illustrated in Figure 5D. It can be observed that with the concentrations of T-2 toxin and DON increase, the SERS intensities measured at 1136 cm−1 from ATP and at 1333 cm−1 from NBT in the immunoprobes captured on the T lines were gradually decreased. The standard curve of the SERS-LFIA for target analyte was plotted in form of B/B0 × 100% versus log C, where B and B0 were the SERS intensity of ATP (or NBT) at the standard point and zero concentration, respectively. The standard curves of the SERS-LFIA for T-2 toxin and DON were presented in Figure 5E and Figure 5F, respectively. Usually, in competitive immunoassay, the sensitivity can be expressed by IC50 value, e.g., the concentration of analyte producing 50% signal inhibition. The lower of the IC50 value, the higher of the assay. From Figure 5E,F, the IC50 values of the SERS-LFIA for T-2 toxin and DON were found to be 0.35 ng mL−1 and 0.29 ng mL−1, with the limit of detection (LOD) at three times of standard deviation (SD) were estimated to be 0.0033 pg mL−1 and 0.0067 pg mL−1, respectively, demonstrating high sensitivity of our SERS-LFIA for the detection of T-2 toxin and DON. As shown in Table S1, compared to other SERS-based analytical methods for the detection of T-2 toxin or DON [41,42,43,44,45,46,47], the lowest LOD values were achieved by the proposed SERS-LFIA, demonstrating the ultra-sensitivity of our assay.
2.5. Specificity of the Method
The specificity of method was evaluated by the cross-reactivity (CR) of SERS-LFIA with T-2 toxin, DON and other five well-known mycotoxins (AFB1, OTA, ZEN, PAT, FB1). The standard solutions of T-2 toxin and DON were prepared in concentration of 0, 10−4, 10−3, 10−2, 0.1, 1, 10 and 100 ng mL−1, while the standard solutions of other five tested compounds were at 0, 0.1, 1, 10, 100, 1000 and 10,000 ng mL−1. All above standard solutions were subjected to SERS-LFIA procedures. After SERS-LFIA procedures, the values of IC50 can be obtained from the corresponding standard curves. The CR (%) was calculated using the following equation: CR (%) = (IC50 of target/IC50 of the tested compound) × 100%. The molecular structures of the tested compounds and the CR values of the assay with these compounds are presented in Table 1. It can be seen from Table 1 that the molecular structures among the tested compounds are quite different, thus when the CR of the SERS-LFIA with T-2 toxin is considered to be 100%, there is no cross-reactivity (CR < 0.01%) of the SERS-LFIA with DON and other five mycotoxins; Also, when the CR of the SERS-LFIA with DON is considered to be 100%, there is no cross-reactivity (CR < 0.01%) of the SERS-LFIA with T-2 toxin and other five mycotoxins. Clearly, there is no any interference each other between the detections of T-2 toxin and DON, and the existence of other five mycotoxins (AFB1, OTA, ZEN, PAT, FB1) in food samples will not interfere with the detection of T-2 toxin and DON measured by SERS-LFIA. The results above suggest the high specificity of the proposed SERS-LFIA for simultaneous detection of T-2 toxin and DON on a single T line.
2.6. Stability and Repeatability of the SERS-LFIA
The stability and repeatability of SERS-LFIA for T-2 toxin and DON detection were investigated. The prepared immunoprobes, the assembled test strips, and the standard solutions were stored at 4 °C. After SERS-LFIA procedure (T-2 toxin and DON were at 0.1 ng mL−1), the SERS intensities on the T lines (1136 cm−1, 1333 cm−1) were recorded daily. The results from Figure 6A,B demonstrated the high store stability of the sensing platform. The reproducibility of the SERS-LFIA was tested by comparing the SERS signals at 1136 cm−1 (or 1333 cm−1) measured from five different spots in the center sections of the T line when T-2 toxin (or DON) standard solutions were at 0, 0.1 and 1.0 ng mL−1, respectively. The SERS spectra and SERS intensities at 1136 cm−1 and 1333 cm−1 were illustrated in Figure 6C,D, respectively. It was seen that the SERS spectra at each standard point are relative consistency [Figure 6C], and the relative standard deviation (RSD) value is in range of 1.58–3.27% [Figure 6D], suggesting high reproducibility of the SERS measurement.
2.7. Detection of T-2 Toxin and DON in Spiked Food Samples
To further validate the practicality and reliability of the proposed method, we selected corn and wheat for spiked recovery experiments. The results (Table 2) demonstrated that the recoveries of T-2 toxin and DON varied from 89.7% to 114.6% and the relative standard deviation (RSD) values were less than 9.09%. These data indicate that the SERS-LFIA detection platform has satisfactory accuracy.
3. Materials and Methods
3.1. Chemicals, Materials, and Apparatus
Cetyltrimethylammonium chloride (CTAC), ascorbic acid (AA), T-2 toxin, DON and other compounds used to test for cross-reactivity (CR) including aflatoxin B1 (AFB1), ochratoxin A (OTA), zearalenone (ZEN), patulin (PAT), and Fumonisin B1 (FB1) were purchased from Shanghai Aladdin Biochemical Technology Co., Ltd. (Shanghai, China). Sodium borohydride (NaBH4), sodium tetraborate decahydrate (NaB4O7), silver nitrate (AgNO3) and Tween-20 were purchased from Sinopharm Chemical Reagent Co., Ltd. (Shanghai, China). Bovine serum albumin (BSA), and ovalbumin (OVA) were purchased from Sigma-Aldrich Co., Ltd. (St Louis, MO, USA). Chloroauric acid (HAuCl4) was purchased from Anhui Senrise Technology Co., Ltd. (Anhui, China). Sodium azide (NaN3) was purchased from Beijing Biotopped Technology Co., Ltd. (Beijing, China). 4-aminothiophenol (ATP) was purchased from Shanghai yuanye Bio-Technology Co., Ltd. (Shanghai, China). 4-nitrobenzenethiol (NBT) was purchased from Shanghai Haohong Bio-pharmaceutical Technology Co., Ltd. (Shanghai, China). Monoclonal antibodies (mAbs) against T-2 toxin, and the coating antigens (T-2 toxin-OVA, DON-OVA) were prepared by our group. All other chemicals were of analytical grade.
Nitrocellulose (NC) membranes were purchased from Whatman (Shanghai, China). The PVC sheets, adhesive tape, and filter paper were purchased from Jieyi Biotechnology Co., Ltd. (Shanghai, China). The deionized-RO water supply system (Dura 12FV) was purchased from THE LAB Com. (Dover, DE, USA). The UV-2300 spectrophotometer was bought from Techcom (Shanghai, China). The digital photographs were taken with Redmi K60 (Beijing, China). Transmission electron microscopy (TEM) and scanning electron microscope (SEM) images were respectively taken by Transmission Electron Microscope HT7700 and Scanning Electron Microscope S-4700 (Hitachi Company, Japan). High-angle annular dark-field scanning transmission electron microscopy (HAADF-STEM) image and conducting energy dispersive X-Ray spectroscopy (EDS) elemental mapping images were taken by field emission transmission electron microscope talos F200X G2 (Thermo Scientific, Czech Republic). The portable Raman Analyzer RamTracer-200-HS was obtained from Opto Trace Technologies, Inc. (Suzhou, China).
3.2. Preparation of Raman Tags (P-GERTATP@Ag and P-GERTNBT@Ag)
All of the glassware used in this study were cleaned with freshly prepared aqua regia (HNO3/HCl, 1:3, v/v), then thoroughly rinsed ten times with tap water and ultrapure water.
The Raman tags were synthesized according to the published papers with some modification [28,40]. As shown in Figure 1B, the first step is to synthesize Au NPs. Briefly, 225 μL of NaBH4 (20 mmol L−1) was rapidly added to a solution containing 2.5 mL of CTAC (200 mmol L−1), 258 μL of HAuCl4 (4.86 mmol L−1) and 2.25 mL H2O with vigorous stirring for 2 min. The solution was kept in dark for 1 h without disturbing, where the Au seeds were gradually formed. Then, 100 μL of the Au seed (diluted ten times with water) was added to another solution containing 40 mL CTAC (100 mmol L−1), 1 mL of HAuCl4 (4.86 mmol L−1) and 150 μL of AA (40 mmol L−1). The solution was stirred gently for a few seconds, and kept undisturbed in dark for several days, in which Au NPs were gradually formed. The second step is to synthesize encoded petals-like gap-enhanced Raman tags. 4 mL of Au NPs solution were mix with 200 μL of ATP (or NBT, 10 mmol L−1 in ethanol solution) under sonication for 30 min. ATP (or NBT) modified Au NPs was obtained after centrifugal washing. Then the Raman reporter modified Au NPs were added to the solution containing 10 mL of CTAC (50 mmol L−1), 960 μL of HAuCl4 (4.86 mmol L−1) and 480 μL of AA (40 mmol L−1). The solution was under sonication for 10 min. After centrifugal washing, the ATP (or NBT) encoded P-GERT was obtained. The third step is to coat the encoded P-GERT with silver shell. 2 mL of the encode P-GERT was mixed with 800 μL of AgNO3 (14.58 mmol L−1), 3.75 mL of AA (0.04 mmol L−1) and 5 mL of CTAC (0.025 mM). The mixtures was incubated 70 °C for 3 h under ultrasonication. The P-GERTATP@Ag (or P-GERTNBT@Ag) was formed, which was then centrifugated and washed three times with water. The product was redispersed in 4.0 mL of ultrapure water and stored at 4 °C for further use.
3.3. Preparation of Immunoprobes
The immunoprobes (P-GERTATP@Ag-AbT-2, P-GERTNBT@Ag-AbDON) were prepared by immobilizing mAbs against T-2 toxin and DON on the surface of P-GERTATP@Ag and P-GERTNBT@Ag, respectively. Briefly, the pH value of P-GERTATP@Ag (or P-GERTNBT@Ag) solution was adjusted to 8.0 with K2CO3 solution (0.1 mol L−1), then 400 μL of the Raman tages (pH 8.0) was mixed with mAb of T-2 toxin (or DON) at the concentration of 1 mg mL−1. The mixture was incubated overnight at 4 °C. Then 10 μL of BSA (5%) was added and incubated for another 1 h to block the non-specfic binding sites on the Raman tages. The solution was centrifuged for 8 min at 2500 rpm and the supernatant was removed. The obtained precipitates containing P-GERTATP@Ag-AbT-2 (or P-GERTNBT@Ag-AbDON) were resuspended in 100 μL PBS solution (0.01 mol L−1) and stored at 4 °C.
3.4. Preparation of LFIA Strips
As shown in Figure 1A, the LFIA strips was fabricated with a PVC backing plate, a sample pad, a nitrocellulose (NC) membrane, and an absorbent pad. The sample pad was treated with sodium borate buffer (20 mmolL−1 Na2B4O7.10H2O, 1.0% BSA, 0.25% Tween-20, 0.1% NaN3) and dried at 50 °C before use. The NC membrane was prepared by separately spotting the mixture of two coating antigens (T-2 toxin-OVA, DON-OVA) on T line and the second antibody, e.g., goat anti mouse immunoglobulin G (IgG), on control line (C line). The interval between T line and C line was 7 mm. The sample pad, NC membrane, and absorbent pad were assembled, overlapping by 1~2 mm on the PVC backing plate. The LFIA strips were stored in seal at 4 °C and cut into 4 mm before use.
3.5. SERS-LFIA Procedure for Simultaneous Detection of T-2 Toxin and DON
The procedure and principle of SERS-LFIA for simultaneous detection of T-2 toxin and DON is illustrated in Figure 1A. Briefly, 9 μL of the mixture containing two immunoprobes (P-GERTATP@Ag-AbT-2, P-GERTNBT@Ag-AbDON) was added onto the sample pad near the NC membrane, and then 200 μL of T-2 toxin and DON standard (or sample) solution was pipetted onto the sample pad. The T-2 toxin and DON standard (or sample) solutions together with the two immunoprobes were flowing toward the absorbent pad by capillary action. Due to the specific reaction between antigen and antibody, the immunoprobes can be captured by coating antigens on the T line. Moreover, because of the competition between the T-2 toxin (or DON) in the solution and the T-2 toxin (or DON) in the coating antigens for limited antibodies in the immunoprobers, the amount of immunoprobes captured on the T line is reverse proportional to the concentration of analytes. The excess immunoprobes or immunoprobe-analyte complex will get to C line and be captured by the second antibody. After 15 min, the specific SERS intensities of ATP at 1136 cm−1 and NBT at 1333 cm−1 on the T line were measured by portable Raman analyzer coupled with a microscope (Eplan, 40 × 0.6) for quantitative detection of T-2 toxin and DON simultaneously. The 20× objective lens with the numerical aperture (NA) of 0.4 were used. The incident wavelength is 785 nm, the laser power is 200 mW, and the integration time is 5 s. Average SERS intensity from 10 different spots along the T line was collected for quantification.
3.6. Spiking Experiment
To verify the practicability of the proposed method, spiking experiment was performed as follows. The wheat and corn samples bought from local supermarket were homogenized before use. Aliquots (0.5 g) of the processed samples (wheat or corn) were allocated into four centrifuge tubes, followed by sequential addition of 0, 12, 120, and 1200 μL standard mixture solution (0.5 ng mL−1 T-2 toxin and 0.5 ng mL−1 DON in acetonitrile), then supplemented with 1200, 1188, 1080, and 0 μL of acetonitrile to make the the spiked concentrations to be 0, 0.012, 0.12, 1.2 μg kg−1. After vigorous agitation, 2 mL of the extraction solvent (Vmethanol:Vwater = 4:1) was introduced to each centrifuge tube. The tubes were vortex-mixed for 10 min, followed by centrifugation (10,000 rpm) for 10 min. The supernatant was transferred to other four fresh centrifuge tubes and evaporated under nitrogen atmosphere in a 60 °C water bath to remove the solvent. The residues in each tube were resuspended in 600 μL of PBST (0.01 molL−1). At last, 200 µL of this solution was subjected to SERS-LFIA procedure. For each sample with different spiked concentration, triplicate spike-recovery assays were performed, and the unspiked samples were extracted similarly and used as blanks.
4. Conclusions
In this study, a quantitatively ultrasensitive and specific SERS-LFIA for simultaneous detection of T-2 toxin and DON in food samples on a single T line was described. The ATP and NBT encoded silver-coated petals-like gap-enhanced Raman tags with high SERS intensities and stability were synthesized, characterized, and applied in SERS-LFIA for the first time. The immunoprobes were prepared by respectively immobilizing Abs against analytes on the surface of Raman tags. The SERS-LFIA procedure was completed within 15 min. The specific SERS intensities of ATP at 1136 cm−1 and NBT at 1333 cm−1 on the T lines were measured for quantitative detection. Under optimal conditions, the IC50 values of the SERS-LFIA for T-2 toxin and DON were 0.35 ng mL−1 and 0.29 ng mL−1, while the LODs were 0.0033 pg mL−1 and 0.0067 pg mL−1, respectively, indicating high-sensitivity of the assay. No mutual interference was observed between the detection of T-2 toxin and DON, and there is no CR of the SERS-LFIA with AFB1, OTA, ZEN, PAT, FB1, demonstrating the high specificity of the assay. The recoveries of the T-2 toxin and DON in spiked food samples were 89.7–114.6% with the RSD less than 9.09%. It was proven that the proposed SERS-LFIA was able to sensitively, specifically, simply and rapidly detect T-2 toxin and DON in food samples on a single T line. The method can be also an alternative platform for multi-component detection of other target analytes on a single test line based on the corresponding Abs.
Supplementary Materials
The electronic Supplementary Information (ESI) is available at: Preprints.org.
Author Contributions
Conceptualization, Yuanzhe Zhu; methodology, Yuanzhe Zhu, Yanmin Wu, Lili Lun, Kang Wu, and Yuxi Zhang; validation, Yuanzhe Zhu, Jing Shi, and Yuxi Zhang; formal analysis, Yuanzhe Zhu; investigation, Yuanzhe Zhu, Yanmin Wu, Jing Shi, Lili Lun, and Kang Wu; data curation, Yuanzhe Zhu; writing—original draft preparation, Yuanzhe Zhu and Yanmin Wu; writing—review and editing, Anping Deng; supervision, Jianguo Li and Anping Deng; funding acquisition, Jianguo Li and Anping Deng. All authors have read and agreed to the published version of the manuscript.
Funding
This research was funded by the National Natural Science Foundation of China (No. 31772053); the Key Research and Development Project of the Ministry of Science and Technology (No. 5010900122); the Funds for Key-Core Technologies Research Project of Suzhou (No. 2023ss21); the Applied Fundamental Research Science and Technology Innovation Project of Suzhou (No. SYW2025156); the Universities Natural Science Research Project of Jiangsu Province (No. 23KJD430011); the High-Quality Innovation Platform of Science and Education Innovation Zone in Suzhou Industrial Park—Key Platform Project (No. YZCXPT2023104); and the Priority Academic Program Development of Jiangsu Higher Education Institutions (No. YX10900212).
Institutional Review Board Statement
Not applicable.
Informed Consent Statement
Not applicable.
Data Availability Statement
The datasets generated and analyzed during the current study are available from the corresponding author upon reasonable request.
Conflicts of Interest
The authors declare no conflicts of interest.
References
- Guo, H.; Ji, J.; Wang, J.; Sun, X. Co-contamination and interaction of fungal toxins and other environmental toxins. Trends Food Sci. Technol. 2020, 103, 162–178. [Google Scholar] [CrossRef]
- Franco, L.T.; Ismail, A.; Amjad, A.; de Oliveira, C.A.F. Occurrence of toxigenic fungi and mycotoxins in workplaces and human biomonitoring of mycotoxins in exposed workers: A systematic review. Toxin Rev. 2021, 40, 576–591. [Google Scholar] [CrossRef]
- Kępińska-Pacelik, J.; Biel, W. Mycotoxins—Prevention, detection, impact on animal health. Processes 2021, 9, 2035. [Google Scholar] [CrossRef]
- Sugita-Konishi, Y.; Park, B.J.; Kobayashi-Hattori, K.; Tanaka, T.; Chonan, T.; Yoshikawa, K.; Kumagai, S. Effect of cooking process on the deoxynivalenol content and its subsequent cytotoxicity in wheat products. Biosci. Biotechnol. Biochem. 2006, 70, 1764–1768. [Google Scholar] [CrossRef] [PubMed]
- Ülger, T.G.; Uçar, A.; Çakıroğlu, F.P.; Yilmaz, S. Genotoxic effects of mycotoxins. Toxicon 2020, 185, 104–113. [Google Scholar] [CrossRef] [PubMed]
- Eskola, M.; Kos, G.; Elliott, C.T.; Hajšlová, J.; Mayar, S.; Krska, R. Worldwide contamination of food-crops with mycotoxins: Validity of the widely cited ‘FAO estimate’ of 25%. Crit. Rev. Food Sci. Nutr. 2020, 60, 2773–2789. [Google Scholar] [CrossRef] [PubMed]
- Zhang, J.; You, L.; Wu, W.; Wang, X.; Chrienova, Z.; Nepovimova, E.; Wu, Q.; Kuca, K. The neurotoxicity of trichothecenes T-2 toxin and deoxynivalenol (DON): Current status and future perspectives. Food Chem. Toxicol. 2020, 145, 111676. [Google Scholar] [CrossRef] [PubMed]
- Yang, S.; Wang, Y.; Beier, R.C.; Zhang, H.; Ruyck, K.D.; Sun, F.; Cao, X.; Shen, J.; Zhang, S.; Wang, Z. Simultaneous determination of type A and B trichothecenes and their main metabolites in food animal tissues by ultraperformance liquid chromatography coupled with triple-quadrupole mass spectrometry. J. Agric. Food Chem. 2015, 63, 8592–8600. [Google Scholar] [CrossRef] [PubMed]
- Mokubedi, S.M.; Phoku, J.Z.; Changwa, R.N.; Gbashi, S.; Njobeh, P.B. Analysis of mycotoxins contamination in poultry feeds manufactured in selected provinces of South Africa using UHPLC-MS/MS. Toxins 2019, 11, 452. [Google Scholar] [CrossRef] [PubMed]
- Polak-Śliwińska, M.; Paszczyk, B. Trichothecenes in food and feed, relevance to human and animal health and methods of detection: A systematic review. Molecules 2021, 26, 454. [Google Scholar] [CrossRef] [PubMed]
- Chen, P.; Xiang, B.; Shi, H.; Yu, P.; Song, Y.; Li, S. Recent advances on type a trichothecenes in food and feed: Analysis, prevalence, toxicity, and decontamination techniques. Food Control 2020, 118, 107371. [Google Scholar] [CrossRef]
- Li, Y.; Luo, X.; Yang, S.; Cao, X.; Wang, Z.; Shi, W.; Zhang, S. High specific monoclonal antibody production and development of an ELISA method for monitoring T-2 toxin in rice. J. Agric. Food Chem. 2014, 62, 1492–1497. [Google Scholar] [CrossRef] [PubMed]
- Li, Y.; Shi, W.; Shen, J.; Zhang, S.; Cheng, L.; Wang, Z. Development of a rapid competitive indirect ELISA procedure for the determination of deoxnivalenol in cereals. Food Agric. Immunol. 2012, 23, 41–49. [Google Scholar] [CrossRef]
- Liu, S.; Wu, Y.; Liu, T.; Ye, J.; Li, L.; Guan, X.; Wang, S. Development of an integrated multifunctional column for rapid pretreatment and determination of trichothecenes in cereals and feeds with HPLC-MS/MS. Foods 2025, 14, 1466. [Google Scholar] [CrossRef] [PubMed]
- Ibáñez-Vea, M.; Lizarraga, E.; González-Peñas, E. Simultaneous determination of type-A and type-B trichothecenes in barley samples by GC--MS. Food Control 2011, 22, 1428–1434. [Google Scholar] [CrossRef]
- Wang, P.; Li, J.; Guo, L.; Li, J.; He, F.; Zhang, H.; Chi, H. The developments on lateral flow immunochromatographic assay for food safety in recent 10 years: A review. Chemosensors 2024, 12, 88. [Google Scholar] [CrossRef]
- Bahadır, E.B.; Sezgintürk, M.K. Lateral flow assays: Principles, designs and labels. TrAC Trends Anal. Chem. 2016, 82, 286–306. [Google Scholar] [CrossRef]
- Kim, K.; Kashefi-Kheyrabadi, L.; Joung, Y.; Kim, K.; Dang, H.; Chavan, S.G.; Lee, M.H.; Choo, J. Recent advances in sensitive surface-enhanced Raman scattering-based lateral flow assay platforms for point-of-care diagnostics of infectious diseases. Sens. Actuators B Chem. 2021, 329, 129214. [Google Scholar] [CrossRef] [PubMed]
- Shao, Y.; Xiong, S.; Huang, M.; Liu, B.; Huang, Z.; Xu, D.; Chen, X.; Xiong, Y. Recent advances in multifunctional nanomaterials enhanced immunochromatographic assays. TrAC Trends Anal. Chem. 2024, 181, 118013. [Google Scholar] [CrossRef]
- Kim, J.; Sim, K.; Cha, S.; Oh, J.W.; Nam, J.M. Single-particle analysis on plasmonic nanogap systems for quantitative SERS. J. Raman Spectrosc. 2021, 52, 375–385. [Google Scholar] [CrossRef]
- Nie, S.; Emory, S.R. Probing aingle molecules and single nanoparticles by surface-enhanced Raman scattering. Science 1997, 275, 1102–1106. [Google Scholar] [CrossRef] [PubMed]
- Schlücker, S. Surface-enhanced Raman spectroscopy: Concepts and chemical applications. Angew. Chem. Int. Ed. 2014, 53, 4756–4795. [Google Scholar] [CrossRef] [PubMed]
- Sharma, B.; Frontiera, R.R.; Henry, A.I.; Ringe, E.; Van Duyne, R.P. SERS: Materials, applications, and the future. Mater. Today 2012, 15, 16–25. [Google Scholar] [CrossRef]
- Fan, M.; Andrade, G.F.S.; Brolo, A.G. A review on recent advances in the applications of surface-enhanced Raman scattering in analytical chemistry. Anal. Chim. Acta 2020, 1097, 1–29. [Google Scholar] [CrossRef] [PubMed]
- Xu, Y.; Aljuhani, W.; Zhang, Y.; Ye, Z.; Li, C.; Bell, S.E.J. A practical approach to quantitative analytical surface-enhanced Raman spectroscopy. Chem. Soc. Rev. 2025, 54, 62–84. [Google Scholar] [CrossRef] [PubMed]
- Arbuz, A.; Sultangaziyev, A.; Rapikov, A.; Kunushpayeva, Z.; Bukasov, R. How gap distance between gold nanoparticles in dimers and trimers on metallic and non-metallic SERS substrates can impact signal enhancement. Nanoscale Adv. 2021, 4, 268–280. [Google Scholar] [CrossRef] [PubMed]
- Futamata, M.; Ishikura, M.; Iida, C.; Handa, S. The critical importance of gap modes in surface enhanced Raman scattering. Faraday Discuss. 2015, 178, 203–220. [Google Scholar] [CrossRef] [PubMed]
- Zhang, Y.; Gu, Y.; He, J.; Thackray, B.D.; Ye, J. Ultrabright gap-enhanced Raman tags for high-speed bioimaging. Nat. Commun. 2019, 10, 3905. [Google Scholar] [CrossRef] [PubMed]
- Li, M.; Yang, H.; Li, S.; Zhao, K.; Li, J.; Jiang, D.; Sun, L.; Deng, A. Ultrasensitive and quantitative detection of a new β-agonist phenylethanolamine A by a novel immunochromatographic assay based on surface-enhanced Raman scattering (SERS). J. Agric. Food Chem. 2014, 62, 10896–10902. [Google Scholar] [CrossRef] [PubMed]
- Yu, Q.; Wu, T.; Tian, B.; Li, J.; Liu, Y.; Wu, Z.; Jin, X.; Wang, C.; Wang, C.; Gu, B. Recent advances in SERS-based immunochromatographic assay for pathogenic microorganism diagnosis: A review. Anal. Chim. Acta 2024, 1286, 341931. [Google Scholar] [CrossRef] [PubMed]
- Kim, K.; Kashefi-Kheyrabadi, L.; Joung, Y.; Kim, K.; Dang, H.; Chavan, S.G.; Lee, M.H.; Choo, J. Recent advances in sensitive surface-enhanced Raman scattering-based lateral flow assay platforms for point-of-care diagnostics of infectious diseases. Sens. Actuators B Chem. 2021, 329, 129214. [Google Scholar] [CrossRef] [PubMed]
- Liu, X.; Yang, X.; Li, K.; Liu, H.; Xiao, R.; Wang, W.; Wang, C.; Wang, S. Fe3O4@Au SERS tags-based lateral flow assay for simultaneous detection of serum amyloid A and C-reactive protein in unprocessed blood sample. Sens. Actuators B Chem. 2020, 320, 128350. [Google Scholar] [CrossRef]
- Sloan-Dennison, S.; Scullion, K.M.; Clark, B.; Fineran, P.; Mair, J.; Laing, S.; Shand, N.C.; Rathmell, C.; Creasey, D.; Bingemann, D.; et al. A point-of-care diagnostic for drug-induced liver injury using surface-enhanced Raman scattering lateral flow immunoassay. Nat. Commun. 2025, 16, 6223. [Google Scholar] [CrossRef] [PubMed]
- Atta, S.; Zhao, Y.; Li, J.Q.; Vo-Dinh, T. Dual-modal colorimetric and surface-enhanced Raman scattering (SERS)-based lateral flow immunoassay for ultrasensitive detection of SARS-CoV-2 using a plasmonic gold nanocrown. Anal. Chem. 2024, 96, 4783–4790. [Google Scholar] [CrossRef] [PubMed]
- Chen, R.; Wang, H.; Sun, C.; Zhao, Y.; He, Y.; Nisar, M.S.; Wei, W.; Kang, H.; Xie, X.; Du, C.; et al. Au@SiO2 SERS nanotags based lateral flow immunoassay for simultaneous detection of aflatoxin B1 and ochratoxin A. Talanta 2023, 258, 124401. [Google Scholar] [CrossRef] [PubMed]
- Sun, J.J.; Sun, R.; Li, L.; Liu, J.; Fu, W.W.; Yin, H.C. Dual-competitive turn-on SERS-lateral flow immunoassay for ultrasensitive cortisol detection in saliva. Anal. Chem. 2026, 98, 15620–15630. [Google Scholar] [CrossRef] [PubMed]
- Xiong, R.J.; Su, J.H.; Wang, S.Z.; Tong, Z.J.; Zhu, R.L.; Liu, Y.F.; Xiao, R. Electronic structure engineered Fe-ZnO@au-DTNB nanotags for ultrasensitive SERS-based lateral ffow immunoassay. Chem. Eng. J. 2026, 534, 175105. [Google Scholar] [CrossRef]
- Ye, Q.D.; Nan, W.Y.; Zheng, L.; Luo, Y.S.; Dong, Q.M.; Wang, Y.F.; Liang, P. Ultra-sensitive SERS-ICA for carbofuran detection in complex food matrices: A smart signal averaging strategy overcoming matrix interference. Food Chem. 2026, 505, 148079. [Google Scholar] [CrossRef] [PubMed]
- Yang, S.; Qu, J.L.; Qin, Y.; An, S.B.; Huang, K.Q.; Wei, Y.J.; Xi, J. Enhanced ultra-sensitive detection of peanut allergen Ara h 3 on immunochromatographic paper based on surface-enhanced Raman spectroscopy and AuNBs@PDA dual signal ampliffcation strategy. Food Chem. 2026, 507, 148209. [Google Scholar] [CrossRef] [PubMed]
- Bi, X.; Fang, Z.; Deng, B.; Zhou, L.; Ye, J. Ultrahigh Raman-fluorescence dual-enhancement in nanogaps of silver-coated gold nanopetals. Adv. Opt. Mater. 2023, 11, 2300188. [Google Scholar] [CrossRef]
- Chen, M.; Su, B.; Wu, H.; Dai, Y.; Chen, T.; Fu, F.; Lin, Z.; Dong, Y. Hydrogel SERS chip with strong localized surface plasmon resonance for sensitive and rapid detection of T-2 toxin. Talanta 2024, 268, 125329. [Google Scholar] [CrossRef] [PubMed]
- Khan, I.M.; Niazi, S.; Pasha, I.; Khan, M.K.I.; Yue, L.; Ye, H.; Mohsin, A.; Shoaib, M.; Zhang, Y.; Wang, Z. Novel metal enhanced dual-mode fluorometric and SERS aptasensor incorporating a heterostructure nanoassembly for ultrasensitive T-2 toxin detection. J. Mater. Chem. B 2023, 11, 441–451. [Google Scholar] [CrossRef] [PubMed]
- Han, X.; Qin, M.; Lu, X.; Wang, Q.; Zhang, Y.; Wang, Z. A highly sensitive SERS aptasensor using a novel truncated aptamer for the detection of deoxnivalenol. Sens. Actuators B Chem. 2025, 424, 136908. [Google Scholar] [CrossRef]
- Sun, B.; Wu, H.; Fang, T.; Wang, Z.; Xu, K.; Yan, H.; Cao, J.; Wang, Y.; Wang, L. Dual-mode colorimetric/SERS lateral flow immunoassay with machine learning-driven optimization for ultrasensitive mycotoxin detection. Anal. Chem. 2025, 97, 4824–4831. [Google Scholar] [CrossRef] [PubMed]
- Chen, R.; Wu, J.; Wang, H.; Nisar, M.S.; Li, Y.; Chen, Y.; Mao, Y.; Nan, X.; Zhang, F.; Yang, L.; et al. Fe3O4@Au magnetic SERS nanotags-based vertical flow immunoassay for simultaneous detection of fumonisin B1, aflatoxin B1 and deoxnivalenol. Anal. Chim. Acta 2025, 1348, 343837. [Google Scholar] [CrossRef] [PubMed]
- Ge, K.; Hu, Y.; Li, G. Surface initiated encapsulation of MOF-74 (Ni) on magnetic prickly-like nickel rods combined with silver nanoparticle decoration for simultaneous and selective surface-enhanced Raman spectroscopy analysis of T-2 and deoxnivalenol. Sens. Actuators B Chem. 2023, 374, 132842. [Google Scholar] [CrossRef]
- Alieva, R.; Sokolova, S.; Zhemchuzhina, N.; Pankin, D.; Povolotckaia, A.; Novikov, V.; Kuznetsov, S.; Gulyaev, A.; Moskovskiy, M.; Zavyalova, E. A surface-enhanced Raman spectroscopy-based aptasensor for the detection of deoxnivalenol and T-2 mycotoxins. Int. J. Mol. Sci. 2024, 25, 9534. [Google Scholar] [CrossRef] [PubMed]
Figure 1.
(A) Schematic illustration of the assembly of LFIA strip and the principle of competitive SERS-LFIA for simultaneous detection of T-2 toxin and DON on a single test line; (B) Preparation of two Raman tages (P-GERTATP@Ag, P-GERTNBT@Ag).
Figure 1.
(A) Schematic illustration of the assembly of LFIA strip and the principle of competitive SERS-LFIA for simultaneous detection of T-2 toxin and DON on a single test line; (B) Preparation of two Raman tages (P-GERTATP@Ag, P-GERTNBT@Ag).
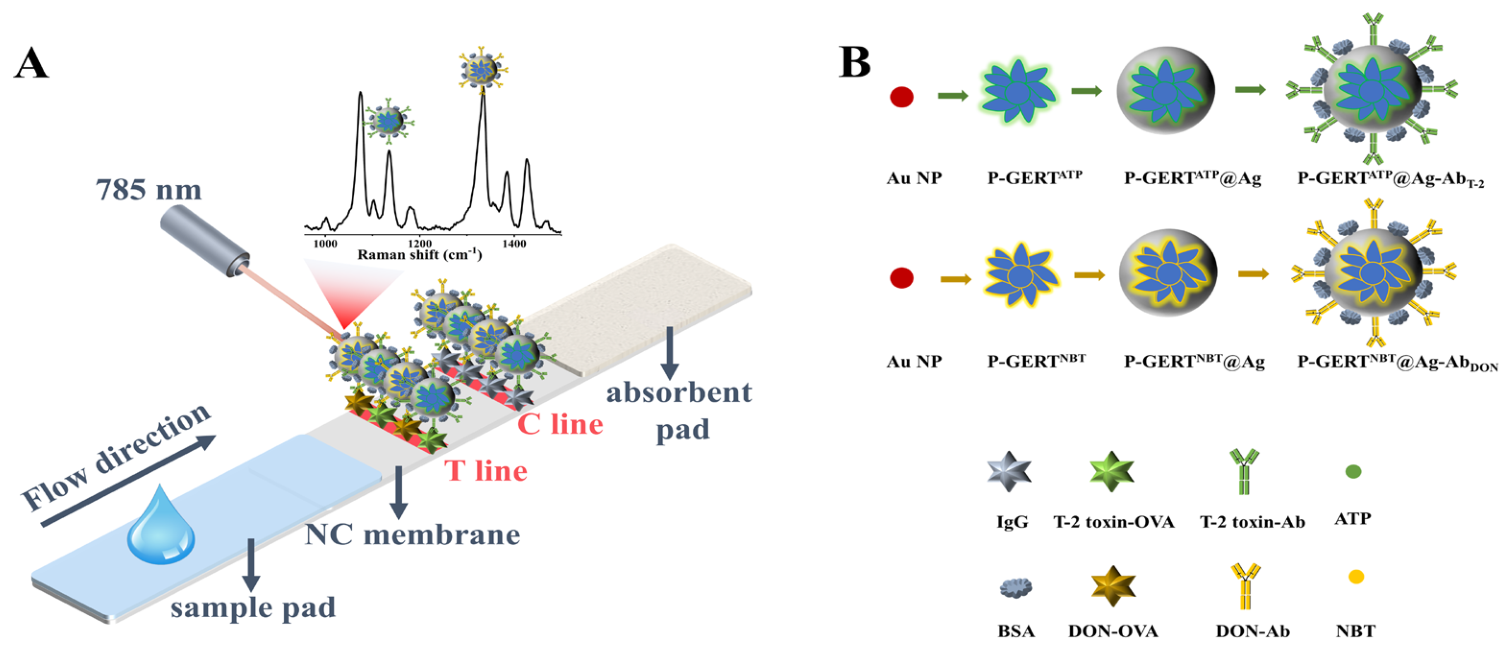
Figure 2.
(A–E) TEM images of synthesized GERTs when the addition amount of Raman molecule (0.01 mol L−1) was 2 μL, 10 μL, 50 μL, 100 μL and 200 μL, respectively; (F) Raman spectra of the GERTs (1~5) when the addition amount of Raman molecule (0.01 mol L−1) was 2 μL, 10 μL, 50 μL, 100 μL and 200 μL, respectively.
Figure 2.
(A–E) TEM images of synthesized GERTs when the addition amount of Raman molecule (0.01 mol L−1) was 2 μL, 10 μL, 50 μL, 100 μL and 200 μL, respectively; (F) Raman spectra of the GERTs (1~5) when the addition amount of Raman molecule (0.01 mol L−1) was 2 μL, 10 μL, 50 μL, 100 μL and 200 μL, respectively.
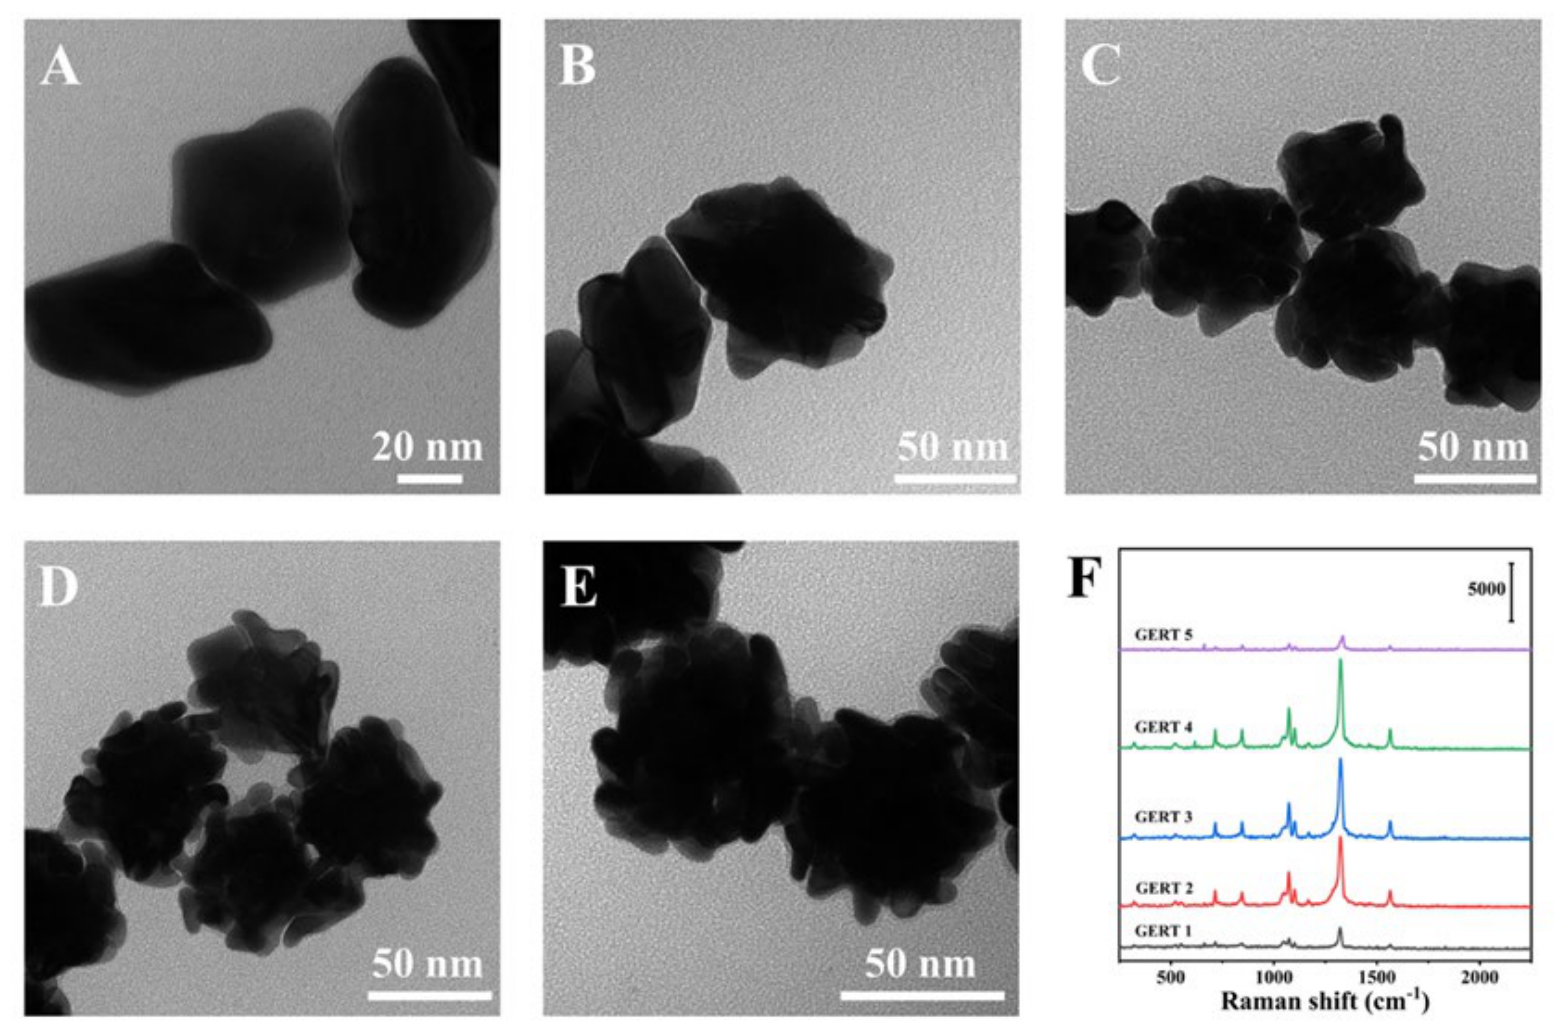
Figure 3.
(A) TEM image of P-GERT@Ag; (B) HAADF-STEM image of P-GERT@Ag; EDS element mapping images of Ag (C), S (D) and Au (E) in P-GERT@Ag; (F) UV-vis spectra of P-GERT and P-GERT@Ag.
Figure 3.
(A) TEM image of P-GERT@Ag; (B) HAADF-STEM image of P-GERT@Ag; EDS element mapping images of Ag (C), S (D) and Au (E) in P-GERT@Ag; (F) UV-vis spectra of P-GERT and P-GERT@Ag.
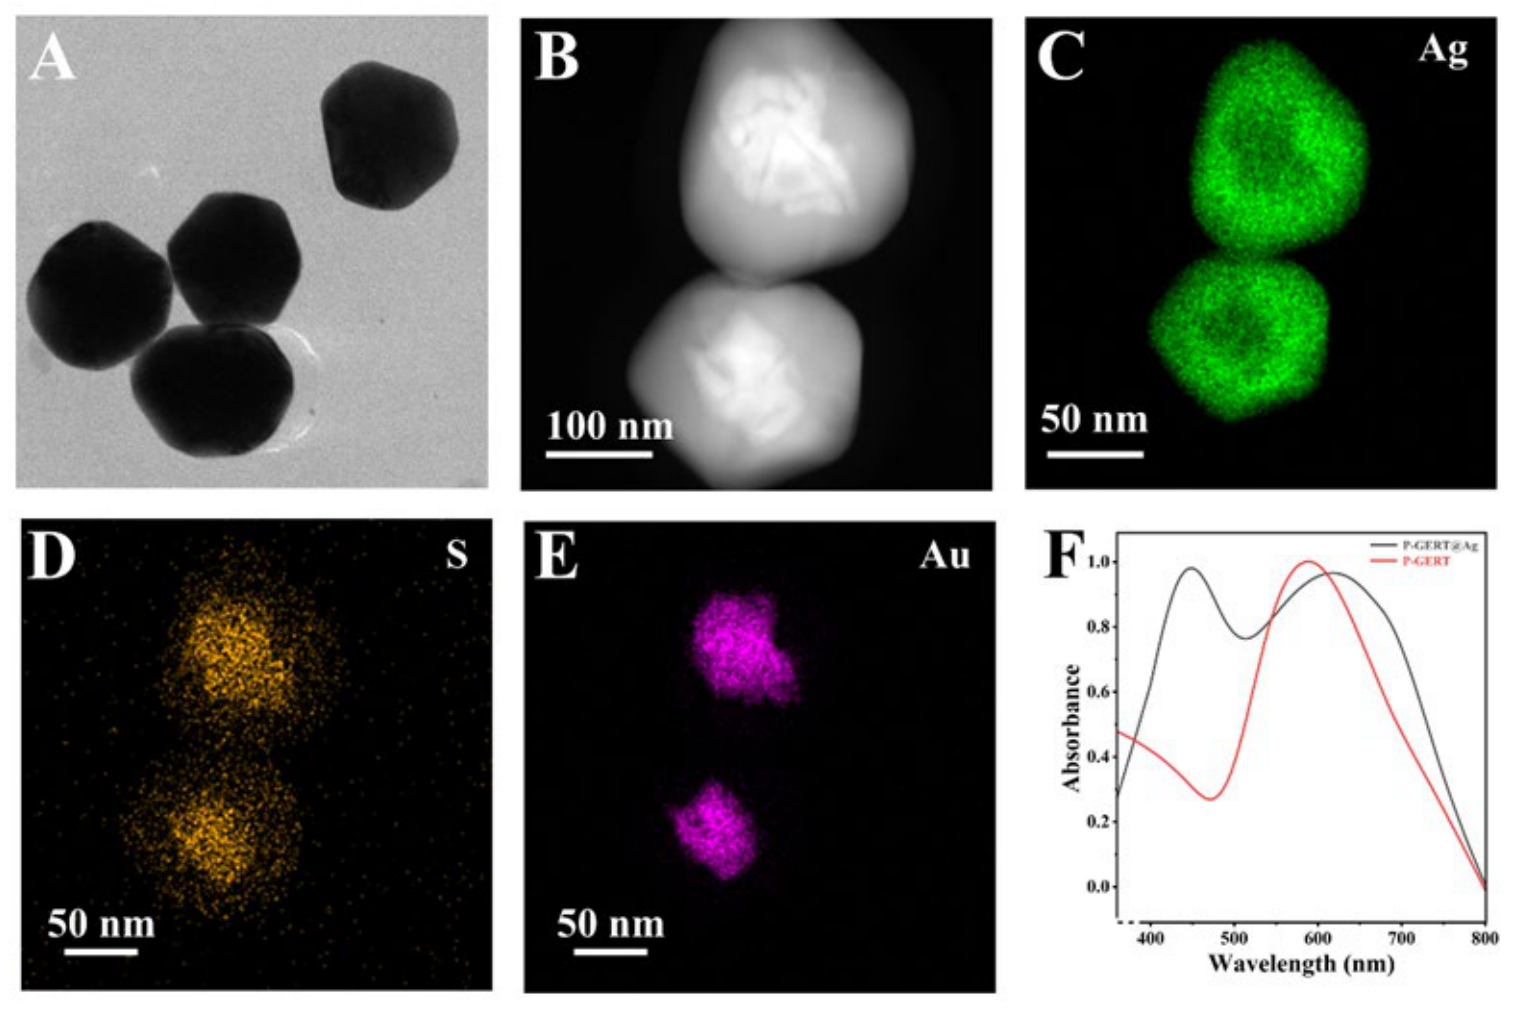
Figure 4.
(A) SERS spectra of P-GERTATP and P-GERTATP@Ag; (B) SERS spectra of P-GERTNBT and P-GERTNBT@Ag.
Figure 4.
(A) SERS spectra of P-GERTATP and P-GERTATP@Ag; (B) SERS spectra of P-GERTNBT and P-GERTNBT@Ag.
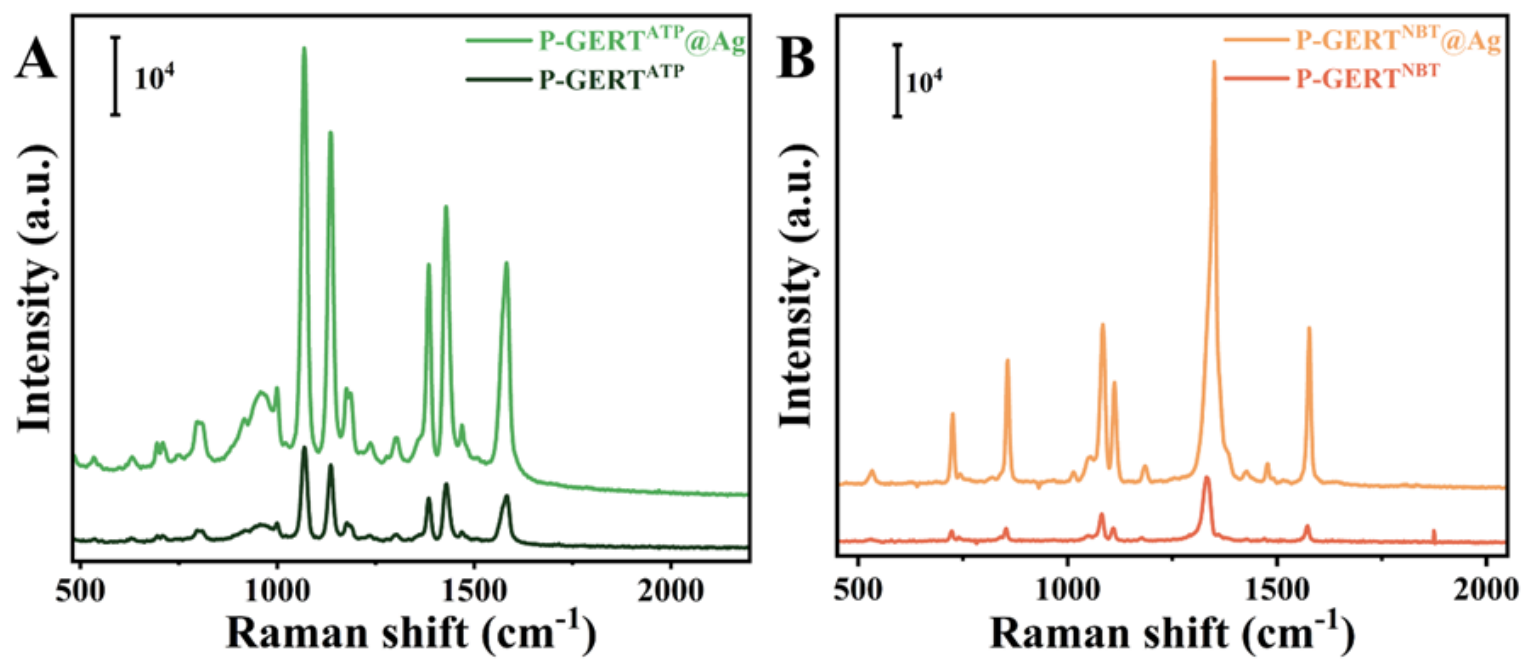
Figure 5.
(A) SEM images from T lines at zero concentration; (B) Digital photograph of SERS-LFIA strips after the assay procedures. The numbers above the T lines are the standard concentrations of analyte (ng mL−1); (C) SEM images from T lines at concentration of 100 ng mL−1; (D) SERS spectra arising from Raman reporters on T lines after assay procedures at the standard concentrations; (E) Calibration curve of the SERS-LFIA for T-2 toxin, where B and B0 were the SERS intensities of ATP (1136 cm−1) at standard concentration and zero ng mL− 1, respectively; (F) Calibration curve of the SERS-LFIA for DON, where B and B0 were the SERS intensities of NBT (1333 cm−1) at standard concentration and zero ng mL− 1, respectively.
Figure 5.
(A) SEM images from T lines at zero concentration; (B) Digital photograph of SERS-LFIA strips after the assay procedures. The numbers above the T lines are the standard concentrations of analyte (ng mL−1); (C) SEM images from T lines at concentration of 100 ng mL−1; (D) SERS spectra arising from Raman reporters on T lines after assay procedures at the standard concentrations; (E) Calibration curve of the SERS-LFIA for T-2 toxin, where B and B0 were the SERS intensities of ATP (1136 cm−1) at standard concentration and zero ng mL− 1, respectively; (F) Calibration curve of the SERS-LFIA for DON, where B and B0 were the SERS intensities of NBT (1333 cm−1) at standard concentration and zero ng mL− 1, respectively.
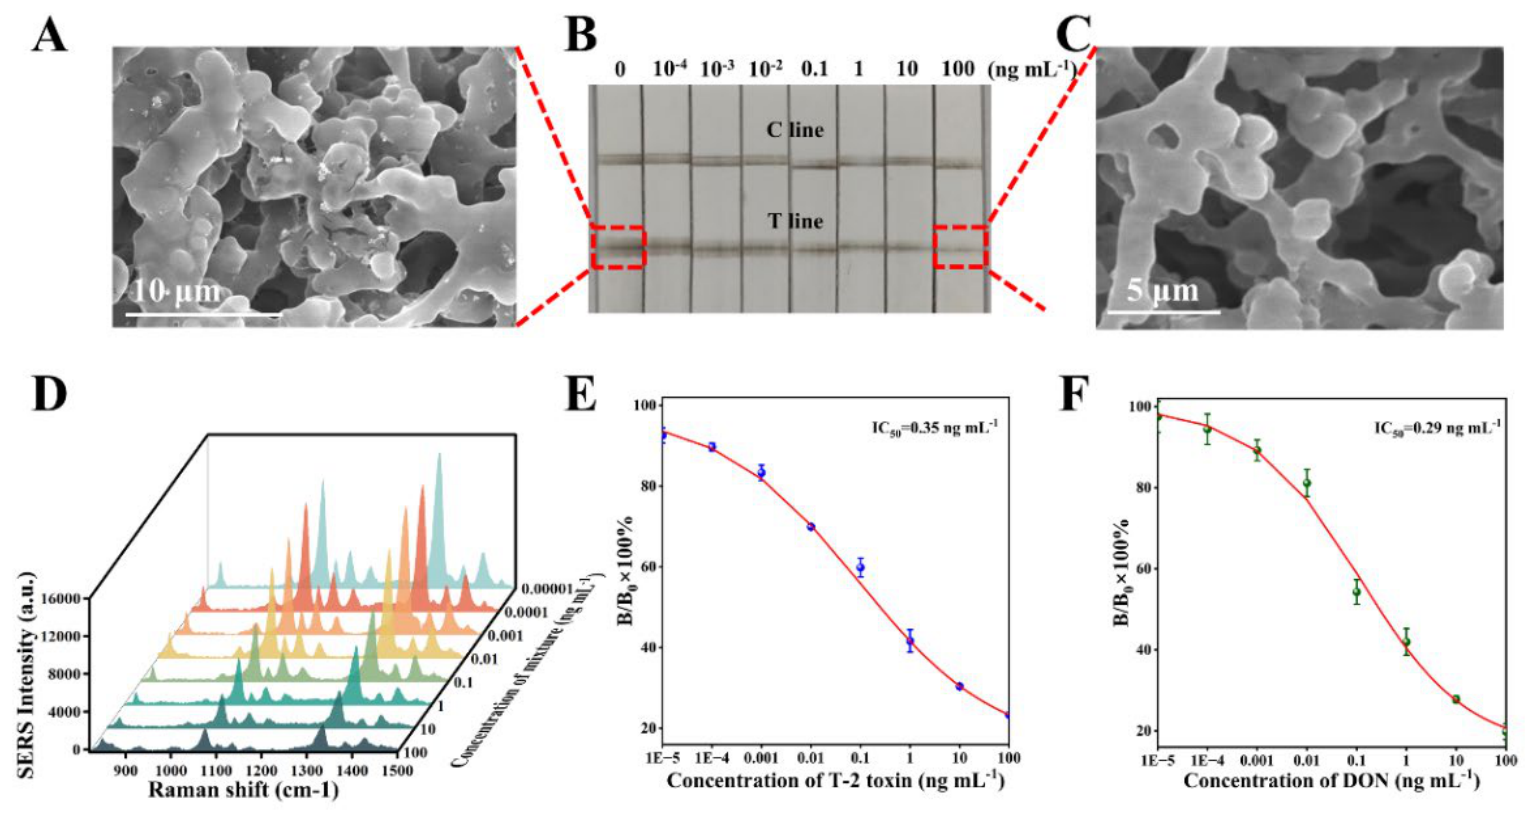
Figure 6.
The stability and repeatability of the proposed SERS-LFIA. (A) SERS spectra obtained during one week SERS-LFIA performance at same experimental condition; (B) SERS intensit ies measured during one week SERS-LFIA performance at same experimental condition; (C) SERS spectra obtained from five different spots in the center sections of the T line at concentrations of 0, 0.1, 1.0 ng mL−1, respectively; (D) SERS intensities obtained from five different spots in the center sections of the T line at concentrations of 0, 0.1, 1.0 ng mL, respectively.
Figure 6.
The stability and repeatability of the proposed SERS-LFIA. (A) SERS spectra obtained during one week SERS-LFIA performance at same experimental condition; (B) SERS intensit ies measured during one week SERS-LFIA performance at same experimental condition; (C) SERS spectra obtained from five different spots in the center sections of the T line at concentrations of 0, 0.1, 1.0 ng mL−1, respectively; (D) SERS intensities obtained from five different spots in the center sections of the T line at concentrations of 0, 0.1, 1.0 ng mL, respectively.
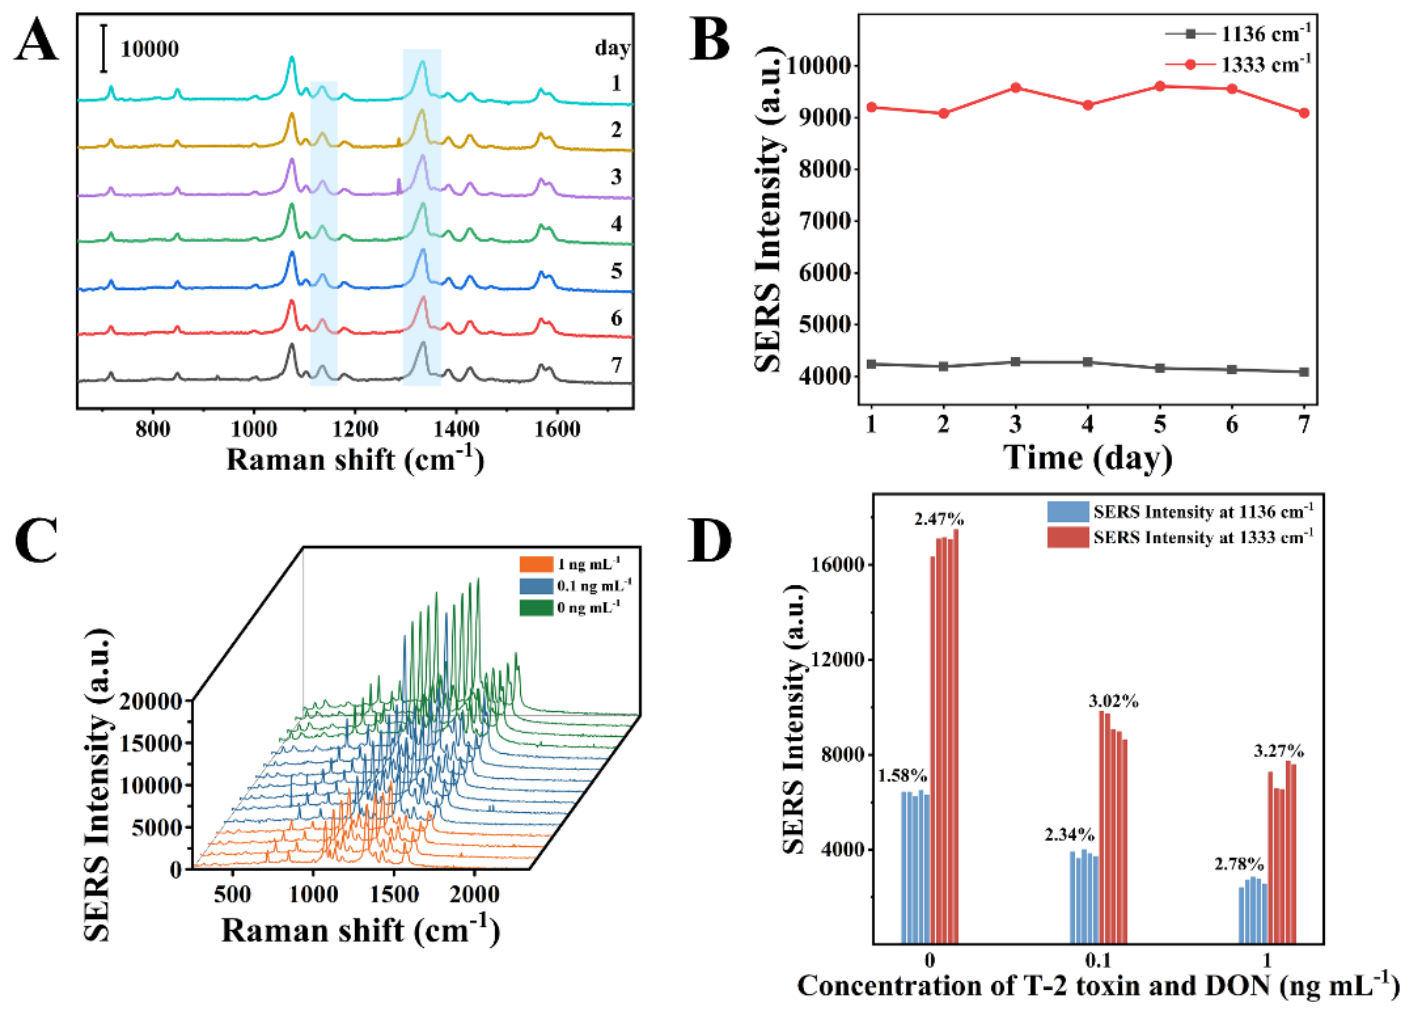

Table 1.
The cross-reactivity (CR) values of the SERS-LFIA with the tested compounds.
| Compound | Molecular Structure of the Tested Compounds |
CR (%) (for T-2 Toxin) |
CR (%) (for DON) |
|---|---|---|---|
| T-2 toxin | 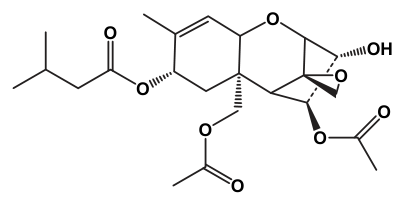 |
100 | <0.01 |
| DON | 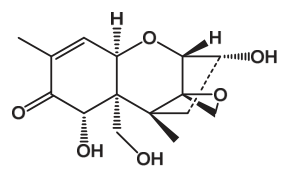 |
<0.01 | 100 |
| AFB1 | 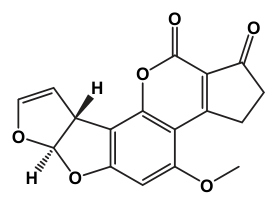 |
<0.01 | <0.01 |
| OTA | 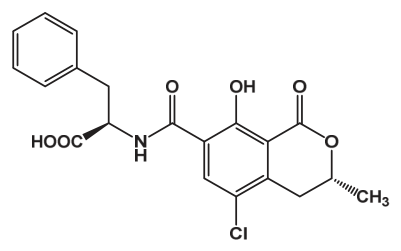 |
<0.01 | <0.01 |
| ZEN | 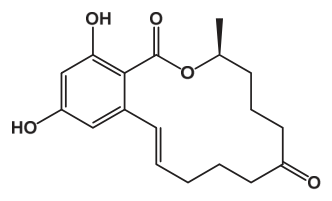 |
<0.01 | <0.01 |
| PAT | 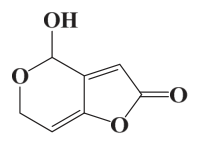 |
<0.01 | <0.01 |
| FB1 | 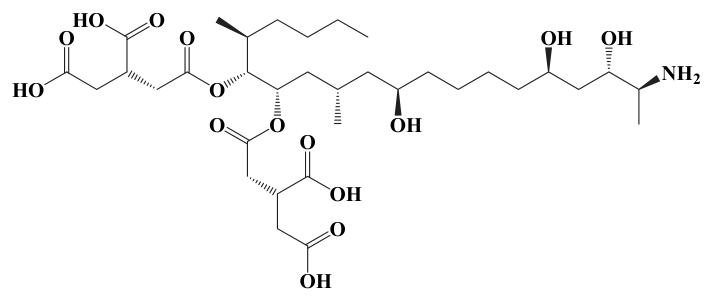 |
<0.01 | <0.01 |
Table 2.
The recoveries of T-2 toxin and DON from spiked samples measured by SERS-LFIA.
| Analyte | Samples |
Conc.Spiked (ng mL−1) |
Conc.Measured (ng mL−1) (mean ± SD, n = 3) |
RSD (%) |
Recovery (%) |
|---|---|---|---|---|---|
| T-2 toxin | Corn | 0.01 | (1.04 ± 0.06) × 10−2 | 6.00 | 104.2 |
| 0.1 | (10.06 ± 0.51) × 10−2 | 5.04 | 100.6 | ||
| 1 | 1.09 ± 0.07 | 6.07 | 109.2 | ||
| Wheat | 0.01 | (0.98 ± 0.03) × 10−2 | 3.47 | 98.3 | |
| 0.1 | (8.97 ± 0.22) × 10−2 | 2.48 | 89.7 | ||
| 1 | 1.06 ± 0.06 | 5.42 | 105.6 | ||
| DON | Corn | 0.01 | (0.98 ± 0.09) × 10−2 | 9.09 | 97.9 |
| 0.1 | (10.78 ± 0.25) × 10−2 | 2.32 | 107.8 | ||
| 1 | 1.03 ± 0.06 | 5.78 | 103.4 | ||
| Wheat | 0.01 | (1.08 ± 0.04) × 10−2 | 3.34 | 108.3 | |
| 0.1 | (11.4 ± 0.46) × 10−2 | 4.06 | 114.0 | ||
| 1 | 1.15 ± 0.05 | 4.52 | 114.6 |
Disclaimer/Publisher’s Note: The statements, opinions and data contained in all publications are solely those of the individual author(s) and contributor(s) and not of MDPI and/or the editor(s). MDPI and/or the editor(s) disclaim responsibility for any injury to people or property resulting from any ideas, methods, instructions or products referred to in the content. |
© 2026 by the authors. Licensee MDPI, Basel, Switzerland. This article is an open access article distributed under the terms and conditions of the Creative Commons Attribution (CC BY) license (http://creativecommons.org/licenses/by/4.0/).
Copyright: This open access article is published under a Creative Commons CC BY 4.0 license, which permit the free download, distribution, and reuse, provided that the author and preprint are cited in any reuse.