

Submitted:
11 August 2026
Posted:
12 August 2026
You are already at the latest version
Abstract
The evolving hydrogen transmission network is a key component of Europe’s energy transition. This study assesses whether the planned European hydrogen transmission grid can accommodate projected regional supply and demand in 2030, 2040, and 2050. Scenario data from the TransHyDE System Analysis project are combined with GIS-based network models and European-scale hydraulic simulations. The modeled topology integrates the European Hydrogen Backbone and the German hydrogen core network. The results indicate that, in 2030, the still-fragmented network can satisfy peak regional demand. By 2040, the grid develops into a largely meshed system, although elevated pressure levels occur in Spain and Italy because of regional supply–demand imbalances and high hydrogen imports from North Africa. The southern European pipelines and the interconnections between the Iberian Peninsula and Central Europe therefore appear insufficiently dimensioned under the investigated scenario. These effects become more pronounced in 2050 as hydrogen demand and imports increase. The findings indicate that additional transport capacity and strengthened cross-border interconnections may be required to ensure the reliable operation of the future European hydrogen network.
Keywords:
hydrogen transmission networks
; hydrogen infrastructure
; european hydrogen backbone
; hydraulic network simulation
; energy system scenarios
; hydrogen storage
; pipeline repurposing
; network bottlenecks
1. Introduction
Climate neutrality is a core policy goal in Europe because it reduces climate-related risks, while maintaining a secure energy supply [1]. Renewable electricity will play a significant role in future energy systems. Nevertheless, molecules such as hydrogen will remain indispensable cross-sectoral and are expected to support a complete transition away from fossil fuels [2].
From a system analysis perspective, a focused hydraulic assessment of the future hydrogen backbone is necessary to reveal potential bottlenecks and supply risks. The importance of this perspective has increased in recent years, as continental geopolitical shocks such as the Russian invasion of Ukraine have exposed structural vulnerabilities in the European energy system [3]. This fact raises the question of whether planned hydrogen transport infrastructure can reliably connect future supply and demand under physical network constraints. In response to these challenges, hydrogen infrastructure projects have been incorporated into Europe’s Ten-Year Network Development Plan [4]. In addition, the recent establishment of the European Network of Network Operators for Hydrogen (ENNOH) further underlines the growing institutional and regulatory importance of developing dedicated hydrogen infrastructure and coordinating cross-border hydrogen network planning across Europe. These developments are supported by broader EU strategies, such as REPowerEU [5], the Energy System Integration Strategy [6], and the EU Hydrogen Strategy [7]. Infrastructure-oriented roadmaps complement these strategies.
Hydrogen can serve as a storage medium for large amounts of renewable surplus electricity, as an industrial feedstock and as energy carrier for transport applications. Hydrogen demand and hydrogen production will be linked by infrastructure, most prominently by the future European hydrogen backbone.
Final energy consumption from hydrogen is projected to reach 289 TWh in 2030, 934 TWh in 2040, and 1,841 TWh in 2050. The largest share of this demand is attributable to the industrial sector [8]. For comparison, ENTSOG’s Summer Supply Outlook 2026 with Winter 2026/27 Overview indicates a reference methane demand of 2,965 TWh for winter 2026/27 across the countries considered [9].
The European Hydrogen Backbone proposes a comprehensive cross-border pipeline network connecting member states. It is expected to reach approximately 28,000 km by 2030 and 53,000 km by 2040, with around 60% of the 2040 network consisting of repurposed natural gas pipelines and 40% of new pipelines, requiring estimated investments of about €80–143 billion [10,11,12].
At the same time, the number of hydrogen-related projects continues to grow, as documented in successive updates of the hydrogen project information platform Hydrogen Infrastructure Map [13,14]. National planning efforts are aligned with these objectives, with Germany’s hydrogen core network plan providing a prominent example [15,16].
Hydraulic network simulations enable a scenario-dependent assessment of the technical capabilities of transmission networks. They also allow evaluation of whether hydrogen production and consumption can be reliably connected under physical constraints. This aspect is particularly relevant because renewable generation and hydrogen demand are often located in different regions. The resulting spatial mismatch requires sufficient transport capacity to ensure system reliability.
Scenario-based analyses of generation, consumption, and technological development at national and European scales support these policies and planning processes. However, realistic assessments of potential supply bottlenecks require explicit consideration of physical transport constraints. From a methodological perspective, two main approaches are commonly applied in network assessment. Capacity-based scenario models provide simplified system-level representations of infrastructure [17], while hydraulic simulations explicitly calculate pressures, flows, and operational constraints at the level of pipelines and network nodes [18]. This study adopts the latter approach. Hydraulic analysis can provide important insights that are not captured by capacity-based energy system models, particularly with respect to pressure constraints, flow distribution, and the operational feasibility of large-scale hydrogen transport networks.
Publicly available datasets enable the reconstruction and analysis of gas transmission networks at sufficient spatial resolution for research applications [19]. Large-scale simulation of natural gas transmission networks is already established practice although such analyses often face limited data availability due to the complexity and age of existing networks [19,20]. In Europe, a substantial share of this existing natural gas infrastructure is planned to be repurposed for hydrogen transport, offering cost and time advantages compared with new construction. Repurposing is therefore considered a key element of the transition pathway. It is consistently emphasized in the scientific literature [18,21,22].
Several recent studies address aspects of this transition. Müller-Kirchenbauer et al. [23] focus on Germany and develop a comprehensive toolchain for transforming the natural gas transmission network into a hydrogen transport network. Their work provides an open database of the existing gas transmission system and methods to design and to assess future hydrogen topologies. Simulation results demonstrate feasible development pathways for green hydrogen transport while maintaining security of supply during the transition phase.
At European level, Mielich et al. [18] conduct an analysis within the same research project as the present study. The authors apply a spatial resolution at the NUTS 3 level combined with hourly temporal resolution and derive an optimized network topology using a Steiner tree approach. Fluid-dynamic simulations are performed for 2030, 2040, and 2050 using the SIMONE hydraulic network simulation software. However, their underlying energy system scenario [24] differs from the scenario which is employed here in this study [17,25], and their assumed network extent in 2030 is substantially smaller than that of the planned European Hydrogen Backbone on which this study is based. Their results indicate that by 2040 an almost fully retrofitted network is optimal, deviating from original EHB planning assumptions [10,11,12].
Complementary insights are provided by Kountouris et al. [26], who apply a fully sector-coupled energy system model rather than hydraulic simulation. Despite methodological differences, their findings point to similar requirements, including rapid scaling of electrolysis capacity, expansion of pipeline and storage infrastructure, and parallel deployment of renewable electricity generation. This perspective aligns with conclusions that accelerated renewable expansion reduces the cost of green energy and limits reliance on fossil alternatives [17]. Environmental and thermodynamic assessments further indicate that while hydrogen pipelines can support cleaner energy transport, both retrofitting and new construction entail non-negligible impacts that should be considered in pipeline design and compressor station planning [27].
These studies provide important system-level and environmental insights. However, only a limited number of studies analyze a large-size (European-scale) hydrogen transmission grid itself in sufficient hydraulic detail [18,28,29,30].
The paper aims to support a robust energy system design and policy decisions by adding a detailed hydraulic infrastructure perspective to scenario-based energy system analysis. To this end, European and German planning documents are combined into a coherent network topology and simulated for three target years: 2030, 2040 and 2050, using stakeholder-driven hydrogen demand and supply data from the BMFTR-funded TransHyDE System Analysis project [25]. The objective is to identify bottlenecks, operational constraints, and systematic mismatches between the spatially resolved scenario assumptions and the available or planned pipeline infrastructure. The analysis further indicates where targeted upgrades, repurposing, or additional pipelines may be required to support a reliable and efficient European hydrogen transport system.
Against this background, this study makes three main contributions:
A European-scale hydraulic representation of the planned hydrogen transmission grid, combining the European Hydrogen Backbone and the German hydrogen core network.
The integration of spatially and temporally resolved TransHyDE System Analysis scenario data for hydrogen injection and withdrawal into a hydraulic pipeline model, allowing the interaction between scenario-based hydrogen supply and demand and the physical constraints of the transmission infrastructure to be assessed.
A hydraulic stress test of the planned infrastructure for the target years 2030, 2040 and 2050 using STANET® simulations, including both steady-state and transient analyses.
2. Materials and Methods
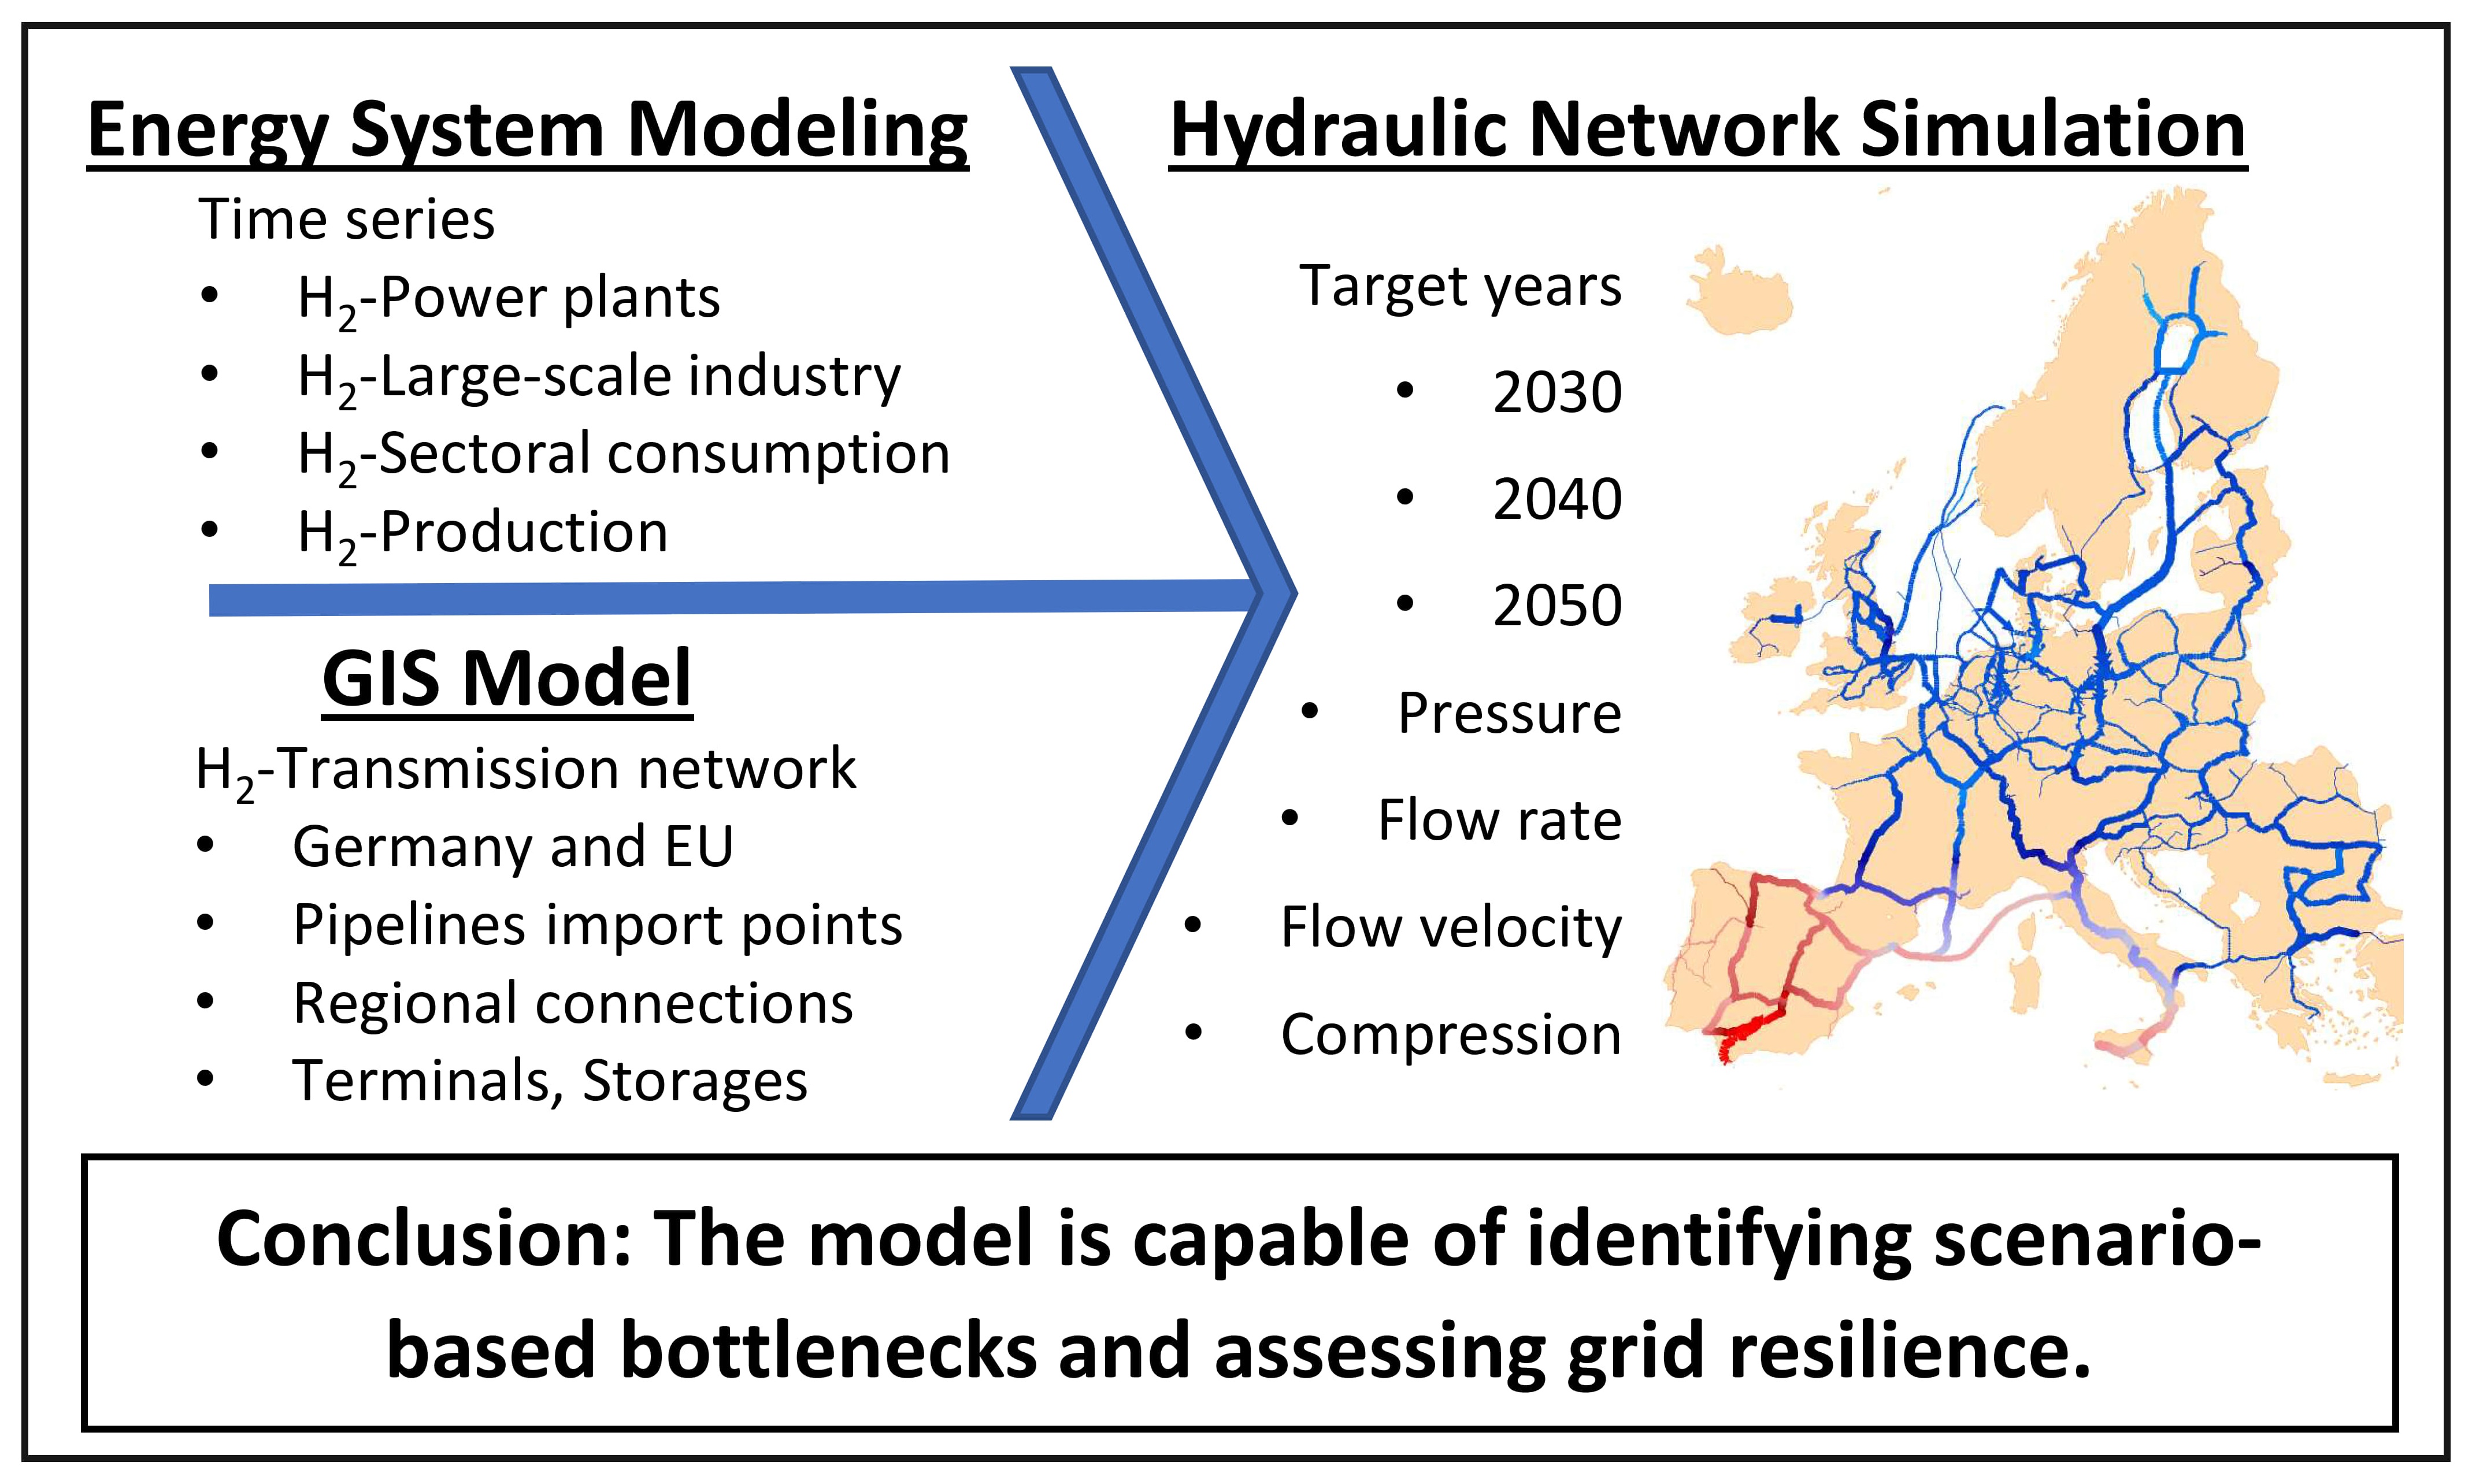
The methodology covers three main components, which build on one another and thus ultimately provide a comprehensive and coherent picture: (i) energy system modeling (Section 2.1.), (ii) preparation of the GIS-based network model (Section 2.2.) and (iii) hydraulic network simulation (Section 2.3.). Energy system modeling provides spatially resolved hydrogen withdrawal and injection time series, while the GIS model contains the topology of the hydrogen transport network as well as associated infrastructure such as storage facilities, terminals and possible locations for compressor stations. Scenario and GIS data preparation are carried out iteratively, because compatibility between both datasets is required to perform meaningful hydraulic simulations. The quality of the input data strongly influences the quality of the simulation results.
2.1. Energy System Modeling - Scenario Time Series Preparation
An energy system scenario is a coherent and internally consistent set of assumptions about future drivers such as technology costs, policy frameworks, demand levels and resource availability. It is used to explore how the energy system may evolve under specific pathways or interventions. The scenario used in this study is described by Kigle et al. [17] and was developed within the TransHyDE System Analysis project (so-called market expectation). It reflects stakeholder-based transition pathways for industry. Renewable capacity expansion is varied from 2025 onward in order to assess system uncertainty.
For a given scenario, energy generation data is compared with consumption data from the industry, electricity generation, heating and transport sectors. This method has made it possible to develop a comprehensive understanding of hydrogen integration. In a subsequent step, this data was then allocated to regions, storage facilities, terminals and import points, as described in the following sections.
2.1.1. End-Use Sectors and Regional Hydrogen Supply
For use in the network simulations, end-use sector scenario data from [17] are spatially aggregated to the NUTS 3 level using NUTS 3 centroid coordinates and the corresponding NUTS 3 codes. This aggregation is applied consistently across all end-use sectors, including
- industry,
- power generation,
- buildings,
- commercial and public services,
- and transport.
In addition, NUTS 3 time series are provided for hydrogen production facilities, such as power-to-gas injections into the transmission grid. The resulting spatially aggregated hydrogen demand and production data used in the network model are shown in Figure 1.
The results of the hydraulic simulations are strongly dependent on the underlying scenario assumptions. Site-specific modeling of industry, power plants, or other large consumers is not performed. In early target years, connections of regions located far from the transmission network may therefore appear unrealistic. However, no regions are excluded based on their distance from the transmission network or on minimum consumption or production thresholds. Some islands would likely not be supplied via direct pipelines for economic reasons, and transport alternatives such as ships are more plausible.
2.1.2. H2 Underground Storages
From the perspective of a hydrogen transmission grid, storage facilities are important flexibility elements because they can buffer temporal imbalances between hydrogen injection, transport capacity, and regional demand [31].
The analysis focuses simplified on large underground storages, which typically have capacities above 100 GWh. Due to high uncertainty of long-term planning, differences between storage locations planned for 2040 and 2050 are not distinguished.
Storage time series data are provided at national level (NUTS 0), meaning that one time series is available per country. Storage locations are identified using the Hydrogen Infrastructure Map [14] (status Q4 2024), a joint initiative mandated by the European Commission and developed by ENTSOG, EUROGAS, GIE, GEODE, GD4S and CEDEC. Their aim is to visualize publicly reported hydrogen infrastructure projects across Europe, based on publicly available project information.
This means that in contrast to regional supply and demand data, underground gas storages are modeled with explicit geographic locations. When more than one storage location is planned within a country, the national-level time series is distributed proportionally according to the planned storage capacities. If no storage locations are available in the Hydrogen Infrastructure Map [14], locations are selected using information from the European Hydrogen Backbone Initiative [10,32] or placed in proximity to the transmission grid while assuming a single national storage site (in Romania and Norway).
Splitting time series proportional to capacity alone is more realistic than assigning the entire time series to a single location. Alternative scaling approaches, such as proportional distribution based on injection and extraction power, could lead to different results. However, these parameters are currently not all publicly available.
2.1.3. Pipeline Imports and Terminals
Both terminals and pipeline import points are represented as unidirectional supply elements that can only inject hydrogen into the transmission system. Pipeline imports from the Middle East and North Africa (MENA) region are assigned to the southernmost import points in Spain and Italy, which are known entry locations in the network representation as shown in Figure 2 and Figure 3.
H2 import terminal data are also provided as national-level (NUTS 0) time series. Their preparation follows a procedure similar to that used for storage data. However, the national-level terminal time series are distributed evenly across all terminal locations within each country. Thus, the disaggregation is not proportional to projected terminal capacities or other technical capabilities, but follows an equal allocation due to limited terminal-specific information. This assumption reflects the lack of publicly available information on terminal specific capacities and operational characteristics, which are less detailed than for underground gas storages. Furthermore, all terminal types capable of injecting hydrogen into the transmission network are considered, including dedicated H2 terminals and ammonia-cracking terminals. The locations that can be identified are taken from the Hydrogen Infrastructure Map [14].
Table 2 summarizes the number of elements by infrastructure type, target year, and country. Some countries’ terminal projects cannot yet be pinpointed precisely (based on [14]), which makes it necessary to select representative locations in the following countries: Finland, Estonia, Latvia, Norway and Sweden.
The scenario does not include terminal time series for the year 2040. This modeling outcome is linked to projected hydrogen prices, particularly the relative competitiveness of different supply options. In energy system modeling, ship-based hydrogen imports are generally associated with higher costs compared to both pipeline imports and domestic hydrogen production within Europe, thereby influencing the overall level and spatial distribution of European hydrogen supply, as discussed in detail by Kigle et al. [17].
2.2. GIS Model - Network Topology Preparation
The network topologies are created using georeferenced data in the open-source GIS software QGIS [33]. Key grid junctions and cross border connection points are mapped in all directions to achieve a sufficient level of spatial accuracy. The GIS data used for modeling hydrogen transport networks are based on publicly available planning documents at both the European and national levels. At the European level, the primary source is the European Hydrogen Backbone Initiative [10,11,12], from which the most recent documentation of the European Hydrogen Backbone dates from November 2023 [10,32]. At the German level, the main reference is the documentation published by the Association of Transmission System Operators (TSO) and approved by the Federal Network Agency in October 2024 [15]. The modeled grid topologies for each target year and their corresponding data sources are summarized in Table 1. These target years are consistent with those defined in the underlying scenario data [17].
Combining the formally approved German hydrogen core network with publicly available information on planned hydrogen infrastructure projects at the European level enables a more detailed and realistic representation of a potential future European hydrogen transmission network than relying solely on announced hydrogen infrastructure projects or conceptual European Hydrogen Backbone visions [10,11,12]. Pipeline construction timelines are considered by assigning the published commissioning dates of individual projects to the corresponding pipelines and activating them in the model only from their respective target year onward. This approach allows the network topology to evolve consistently across the analyzed target years (2030, 2040, and 2050) in accordance with the available planning information.
More recent European infrastructure datasets are available, for example the Hydrogen Infrastructure Map [14], which is regularly updated and therefore reflects a more recent planning status of hydrogen pipeline projects and network topologies across Europe. However, many of the projects listed in such databases are still in early development stages and often have not yet reached a Final Investment Decision (FID). As a result, the European hydrogen infrastructure project landscape remains highly dynamic and subject to frequent revisions. According to the current version of the Hydrogen Infrastructure Map largely similar key onshore pipelines are shown, but there are notable differences in offshore transmission pipelines compared with the topology used in this study.
The German network topology includes some pipeline projects that have not yet received final regulatory approval but are incorporated in the model based on the currently available planning information. Transmission pipelines listed as officially withdrawn or rejected in the documentation are excluded from the model.
2.2.1. Integration of Scenario Nodes into the Transmission Grid Model
Several elements derived from the scenario are represented in the model as sources or sinks of hydrogen flow. This section describes the methodological approach used to determine the connection points between scenario nodes and transmission network and to integrate these elements into the GIS model. The elements considered include regional demand and supply nodes, pipeline import points, hydrogen import terminals, and storage facilities.
In the GIS model, each NUTS 3 region is represented by a single node located at the geometric centroid of the region, to which the aggregated NUTS 3 hydrogen demand and production time series are assigned. The connection points to the transmission grid are determined using an automated spatial matching procedure that identifies the nearest transmission pipeline to each centroid node based on the shortest geometric distance. The resulting connections are generated automatically and subsequently reviewed, as the purely distance-based assignment does not account for topological or infrastructural constraints. Manual corrections are therefore applied to prevent simplified connections from crossing national borders. In addition, they ensure that no grid junctions are located in marine areas.
The connection between the NUTS 3 centroid nodes and the selected transmission pipelines represents a simplified interface to the downstream distribution infrastructure. Detailed hydrogen distribution networks are not modeled, as publicly available information on their topology and capacity is currently very limited. As every region is represented by a single connection point to the transmission grid, which may not reflect real network configurations. In reality, some regions may be supplied by neighboring regions, via hub structures, or through multiple transmission connections.
Consequently, potential bottlenecks within regional distribution systems are outside the scope of the present transmission-level analysis. The connecting pipeline can therefore be interpreted as an aggregated representation of downstream transport structures, which may in reality consist of distribution grids, industrial branch lines, or potential hub-based supply concepts for more remote demand regions. The connection diameter is set to 500 mm, which is sufficiently large to avoid influencing results at the transmission grid level.
Pipeline import points are positioned directly at the southern termini of the Italian and Spanish transmission pipelines. The locations of Spanish import points differ between 2030 and the later target years of 2040 and 2050. This difference results from changes in the European Hydrogen Backbone pipeline topology across target years and is illustrated in Figure 2 and Figure 3.
For storage facilities and terminals, grid connection points are also determined using the shortest geometric distance to the transmission network, analogous to the NUTS 3 region connection approach, as the precise routing of future storage connection pipelines is not yet known.
As shown in Table 2, the European hydrogen transmission network model is summarized in a table-based overview, including pipelines, storage facilities, terminals, import points, and aggregated regional demand and supply nodes at the NUTS 3 level for all analyzed target years. The country codes indicate the location of the respective network elements.
2.3. Hydraulic Network Simulation
This section discusses the governing equations and theoretical fundamentals of the steady-state simulation. See Section 2.3.1. Building on this basis, the integration of compressor stations into the network model is described in Section 2.3.2. Their inclusion is relevant because simulations can also be performed without compressor stations. However, considering compressor stations improves the representation of flow patterns and pressure conditions in the network. Finally, the boundary conditions and the initialization of the simulation are presented in Section 2.3.3.
2.3.1. Theoretical Fundamentals of Simulation
The relevant gas properties, including density, viscosity and compressibility, are specified through the STANET® gas-property settings. STANET® is a commercial hydraulic network simulation software widely used in gas infrastructure analysis [34,35,36].
The thermodynamical standard equation for real gases is as follows in (1:
An isothermal flow assumption is applied within each simulation case. Elevation differences are neglected. The simulation approach follows an established hydraulic pipeline engineering practice and is based on energy-balance equations describing compressible gas flow [37]. Accordingly, gas density is not treated as constant, but depends on pressure, temperature, gas composition, and the real-gas compressibility factor. For gas networks, the frictional resistance (R) is therefore a function of both the flow rate (Q) and the pressure (p).
The compressibility factor describes the relationship between density and pressure [38]. Since this relationship is gas-specific, it is represented by the pressure factor [39]. In STANET®, a linear pressure dependency of the compressibility factor is used as the standard setting, as shown in (2):
The pipeline volumetric flow is defined in a cylindrical pipe with diameter (D) and () being the mean flow velocity. See in Equation (3):
For turbulent flow conditions, expected in transmission pipelines, the Prandtl-Colebrook friction law (Equation(4) is applied to determine the pipe friction factor . The formulation is widely used in gas network analysis and consistent with the German technical rules provided by the German Technical and Scientific Association for Gas and Water [40]. The friction factor () characterizes frictional pressure losses along the pipe wall and is required to quantify hydraulic resistance in the pipeline equations. It depends on the Reynolds number () and the relative pipe roughness ():
The Reynolds number is calculated as (5). Where () is the mean flow velocity and () the kinematic viscosity:
The pressure loss in a pipeline segment is a function of the hydraulic resistance and the flow rate, as described in (6), This equation is also called the hydraulic resistance law. It can be expanded into the form shown in (7) [34,40,41]:
The simulation does not account for elevation differences and assumes a flat network topology. Because of this the second term in (8 disappears which results in then in . When dividing with (), the hydraulic resistance factor can be derived. See (9:
The pressure and flow state of the meshed pipeline network is described by a system of nonlinear equations based on Kirchhoff’s laws (node condition (10, loop condition (11 [40]):
Since the pressure-loss relation is nonlinear with respect to the flow rate, it is treated iteratively within the hydraulic network calculation. For the linearized equation system, the pressure difference between two adjacent nodes (i) and (k) can be written using an effective hydraulic resistance () of the pipe section between these nodes. See (12.
Here, () represents the effective, iteration-dependent hydraulic resistance used in the linearized form of the pipe equation. It therefore contains the influence of pipe properties and the current hydraulic state of the pipe section. The resulting equation system consists of pipe equations linking pressures, flows and hydraulic resistance, node equations enforcing mass balance, and loop or path equations enforcing pressure consistency. In steady-state simulations, the Newton-Raphson method is applied iteratively until convergence is reached and a hydraulic equilibrium of the network is obtained. The linearized system is solved using (13 and (14, where (i) denotes the node index, (k) the adjacent node index, () and () the pressures at nodes (i) and (k), () the external injection or withdrawal at node (i), and () the conductance of pipe (i,k) [39]:
Convergence is controlled by user-defined precision thresholds and a maximum iteration limit. In this study, a maximum of 50 iterations is allowed and the target accuracy for pressure differences is set to 0.1 bar. During each iteration, the equations are linearized and solved using Gaussian elimination with optimized ordering according to Tinney, which improves computational efficiency for large sparse matrix systems [42].
In steady-state simulations, the system is solved for a single equilibrium state without explicit time dependence [34]. Kirchhoff’s laws are enforced algebraically. The resulting solution represents the stationary operating condition of the network. Here flows and pressures are balanced and no further temporal changes occur.
2.3.2. Compressor Stations
Steady-state simulations are performed with compressor stations. The steady-state formulation allows the hydraulic impact of compressor stations on pressure levels and flow patterns to be analyzed without implementing a detailed operational dispatch strategy. The stations are modeled simplified using a compressor element in STANET®. The produced compression is one-directional between 2 and 9.8 bar and is able to handle very large flow rates. See Figure 4. In practice such large quantities are not handled by one machine but a chain of compressors [43].
Candidate compressor locations are primarily identified using SciGrid and Sci2grid datasets [44,45], which document compressor stations in existing natural gas transmission networks. Compressor stations located along pipelines assumed to be repurposed for hydrogen transport are therefore considered as plausible locations and are highlighted in dark blue in Figure 5. Since the SciGrid dataset does not include compressor stations along newly constructed hydrogen pipelines, additional candidate locations are identified. These locations indicate areas where additional pressure support may be required to maintain stable operating conditions within the hydraulic model.
The final selection focuses on compressor stations which are located in peripheral regions of the hydrogen transmission grid, including northern regions, Spain and Italy. This reflects on the large import volumes from North Africa as well as the Norwegian coast. In addition, a compressor station is considered at the offshore pipeline connection point in the North Sea, in the vicinity of the Sleipner and Draupner floating platforms (There is also precedent for sub-sea compressor station there [46]). These platforms are described in the European Hydrogen Backbone documentation [10,11,12] and are identified as candidates for future repurposing for H2 transport.
In Germany, three compressor stations are included at Forchheim, Moorburg, and Achim, as documented in the German hydrogen core network plans [15].
The final set of active compressor stations is defined based on simulations of maximum aggregated NUTS 3-level demand in each target year. A more comprehensive analysis would require a dispatch strategy with controls, which is beyond the scope of the present study. Capital expenditures (CAPEX) and operational expenditures (OPEX) of compressor stations are not considered.
2.3.3. Boundary Conditions and Initialization
Multiple groups of simulation iterations are performed in order to identify errors from earlier processing steps, improve numerical robustness, and reduce deviations from the boundary conditions defined by the scenario data [17].
The grid topology from QGIS and the scenario data are imported into STANET®. To ensure numerical stability the pipelines are subdivided into segments of approximately 10 km, while a minimum pipeline length of 100 m is enforced. This avoids numerical instabilities caused by large disparities in pipeline lengths within the equation system.
Steady-state simulations require initial boundary conditions in the form of pressure nodes to resolve the equation system. A pressure node represents a user-defined degree of freedom that provides a reference pressure level for the iterative solution of the equation system. If the network is not fully connected, each disconnected subnetwork requires at least one pressure node. Pressure levels assigned to these nodes must respect the maximum operating pressure of the pipelines. Due to limited information on future operating conditions, representative pressure levels are uncertain.
It is assumed that average pressure levels in 2040 and later are higher than in 2030, reflecting the ramp-up phase of the hydrogen transmission network. As shown in Figure 6 and Table 3, pressure nodes are set to 30 bar for the target year 2030, reflecting this ramp up phase of the H2 transmission grid. For the target years 2040 and 2050, pressure nodes are increased to 60 bar, as these years represent a more mature and interconnected network with higher gas transport volumes.
Hydraulic simulations are sensitive to extreme values in the scenario time series and are therefore well suited for identifying structural bottlenecks in the transmission grid. This is why the maximum aggregated regional (NUTS 3-level) consumption is selected as the evaluated point in time (see Table 3).
In the simulation, pressure nodes are preferentially assigned to real hydrogen projects if found, particularly to underground gas storage facilities (see Figure 6). Storage facilities are favored because they can operate both as sources and sinks, enabling them to compensate for imbalances during long-term transient simulations or momentarily in case of steady-state simulations. This allocation also allows for an approximate quantification of the required compensation (i.e.: net injection or withdrawal) at project-related locations.
The outer European border-crossing points are set to inactive. Accordingly, no gas transport across these borders is modeled, except for the two pipeline import points and ship-based transport flows (terminals) considered in the scenario data.
In addition, pressure-level and flow-velocity limitations are only considered indirectly in the simulation. A simulation breakdown would occur only at pressure or velocity values far outside the physically expected range. Therefore, pressures and flow velocities are evaluated after a successful simulation run, and extreme values are analyzed in the post-processing step.
4. Results and Discussion
For the target year 2030, the network topology is fragmented and not fully meshed. The transmission grid is not fully interconnected (see Bulgaria, GB, Ireland, Portugal as examples). Flow velocities are generally within acceptable ranges. Some elevated velocities can be observed next to the pressure nodes. Only two pipeline segments exceed 40 m/s, in the NUTS 3-connecting pipelines. These outliers are located at the German-French border and result from several high-demand NUTS 3 regions being connected to a single transport corridor. NUTS 3-connections are not visible in Figure 7.
In the target year 2040, the gas grid is fully interconnected (Figure 8). Terminal time series are not included at the 2040-stage, in line with the assumptions of the underlying energy system scenario. Only a single pressure node (=single degree of freedom) is required, minimizing distortion relative to the scenario boundary conditions. This pressure node is linked to Sergnano underground gas storage site in Northern Italy. Under peak-load conditions, no critical flow velocities are observed. However, elevated pressure levels occur in southern regions due to the accumulation of large H2 import volumes from MENA.
For the target year 2050 terminal injections are reintroduced in accordance with the underlying energy system scenario. The network topology remains identical to that of 2040, however more pressure nodes are required due to increased regional imbalances. Under these conditions, unrealistically high pressures above 200 bar occur near the MENA pipeline import points, particularly in Spain. Pressure nodes linked to storage sites and other H2 related projects are insufficient to compensate for these peaks. Notably, flow velocities exhibit fewer critical outliers than pressure values. Sudden changes in flow velocity can occur due to pressure differences resulting from strong regional imbalances between neighboring feed-in and withdrawal levels. See the results especially in target year 2050 in Figure 9.
Simulation results are evaluated during postprocessing using visual indicators for critical pressure levels and flow velocities. Flow velocities above 25 m/s are highlighted in bright red, although values up to approximately 40 m/s are considered acceptable according to external sources, with an upper conservative technical limit around 50 m/s [47]. Pipeline pressures above 80 bar are marked using light red coloring, while pressures exceeding 100 to 120 bar are classified as critical and likewise highlighted in bright red. These thresholds are used as indicative guidance rather than strict operational limits. The classification represents a generalization, as offshore pipelines typically tolerate higher operating pressures than onshore pipelines, some of which have published maximum operating pressures as low as 40 bar.
In the target year 2030, no high-pressure values are observed, although some regions experience pressures below 20 bar, partly due to insufficient H2 production during the early ramp-up phase (See: Figure 10).
In 2040, only 0.3 % of simulation nodes exhibit critical pressures above 100 bar, while 1.7 % exceed 80 bar. In contrast, the 2050 simulations indicate that approximately 10 % of nodes reach pressures above 100 bar (see Figure 11). The primary drivers of the extreme pressure levels observed in southern regions in 2040 and 2050 are the large gas import volumes from the MENA region and insufficient transport capacity toward Central Europe, both of which lead to excessive gas accumulation. In Spain, substantial domestic H2 production further amplifies this effect. The pipeline section between Spain between Gibraltar and Córdoba seems undersized. This corridor exhibits the most critical pressure levels in 2050 and already shows elevated pressures in 2040. It is important to note that the planned H2 pipelines connecting the North-Africa to Europe are largely based on retrofitted or repurposed infrastructure. As a result, pipeline diameter is not a freely adjustable parameter. The compressor stations push the excess gas towards Central Europe, but do not solve the pressure problem.
Overall, the 2030 network is capable of meeting peak demand, although grid fragmentation complicates reliable supply (Figure 7). However, the results indicate that the network configuration for 2040 and 2050 are not fully compatible with the underlying energy system scenario (Figure 8 and Figure 9). The grid is unable to meet supply requirements while maintaining subcritical pressure levels, particularly, though not exclusively, in regions connected to MENA. The Tunisian-Italian connection appears to be moderately undersized, while the Spanish MENA connection is clearly undersized under the given scenario assumptions. The transport capacity between Spain and France is insufficient, since both the number and the size of the interconnection pipelines are inadequate to transport the accumulated gas volumes through the French-Spanish border toward Central Europe.
A broader implication of these findings is that, if the MENA region (North Africa) remains a major contributor to Europe’s hydrogen supply strategy, the robustness of the connecting infrastructure requires closer consideration. Retrofitted pipelines alone may not be sufficient to accommodate sustained high import volumes. In the underlying scenario, either additional infrastructure or a diversification of network utilization across multiple import corridors would need to be considered, rather than concentrating flows in a limited number of high-capacity routes. Any additional capacity would likely require at least partial construction of new pipelines. At the same time, extensive repurposing must not compromise CH4 transport capability in scenarios where methane demand persists.
5. Conclusion and Outlook
This paper presents a large-scale simulation that assesses the hydraulic capabilities of the planned European H2-grid for the target years 2030, 2040, and 2050. The work aims at the research gap in understanding the large-scale H2-grid expansion in the coming decades.
The three pillars of the study are energy-system modeling as input from the TransHyDE-System Analysis project, a GIS model and hydraulic simulation using STANET®. The topology reflects a combination of the European Hydrogen Backbone (07.2023) and the German core network (10.2024). An enhanced emphasis is placed on the maximum aggregated regional (NUTS 3-level) consumption because it is the largest offtake in the system. The pressure nodes (degrees of freedom) are assigned to real-life H2-related projects, if possible. Selected large compressor stations are included.
Several conclusions can be drawn from the H2-transport grid simulation. For target year 2030, a fragmented, not fully interconnected network can cover the maximum regional demand. For the target year 2040 and 2050, a fully meshed network enables stable simulation. Both in 2040 and 2050, elevated pressures occur in southern regions (Spain, Italy) due to regional supply–demand imbalances and high pipeline import volumes from the North-Africa. The southernmost pipelines in Italy and especially in Spain seem undersized for these import quantities. Assuming these scenario-given import volumes, investments into new parallel pipelines or into the repurposing of additional CH4-pipelines may be necessary. The compressor stations do not resolve the southern pressure peaks.
The gas network model is continually updated to reflect real-world changes and therefore requires ongoing adjustments. However, this does not invalidate the conclusions drawn from the previous results. Our overall assessment is that, despite some coarse modeling resolution, the network models can highlight potential weaknesses and bottlenecks in the future hydrogen infrastructure, as a virtual stress-test. If the pipeline imports from North Africa remain important, this region’s political and economic stability should be further analyzed.
Several extensions of the present model are possible in future work. First, the plausibility of H2-related infrastructure projects, such as storage facilities and import terminals, could be examined in greater detail. This would allow a more precise assessment of whether the assumed injection and withdrawal capacities are technically realistic and consistent with the surrounding network infrastructure. Second, smaller-scale case studies could be developed with a higher modeling resolution, especially to analyze the interaction between transmission and distribution grids. Such studies could provide insights into regional bottlenecks, local pressure behavior, and the technical requirements for connecting decentralized demand and supply structures to the transport grid.
In addition, the operational strategy of network coupling points could be analyzed in more detail. Instead of using fixed or simplified boundary conditions, future models could include dispatch strategies that reflect import availability, regional demand, network constraints, and cross-border coordination.
Another important extension would be the development of price-sensitive operating strategies for H2 storage facilities. Storage injection and withdrawal could then be linked not only to hydraulic feasibility, but also to market signals, seasonal price variations, and security-of-supply considerations. Finally, the model could be combined with resilience analyses to investigate where gas-fired power plants should be built or deployed in the future. This would make it possible to identify locations where flexible generation capacity could strengthen the robustness of the hydrogen transport system. It would also indicate where such plants could most effectively support the integration of renewable energy.
Author Contributions
Conceptualization, M.K. and L.W.; methodology, M.K., M.H. and L.W.; validation, W.K.; formal analysis, M.K.; investigation, M.K.; data curation, O.M.A.A.-W.; writing—original draft preparation, M.K.; writing—review and editing, M.K., M.H., W.K. and F.G.; visualization, M.K.; supervision, W.K., F.G. and F.S.; project administration, M.H.; funding acquisition, W.K., F.G. and F.S. All authors have read and agreed to the published version of the manuscript.
Funding
This research was funded by the Federal Ministry of Research, Technology and Space (BMFTR) under grant number 03HY201S as part of the German hydrogen flagship project TransHyDE. Additional support was provided by the Helmholtz Association through the Energy System Design (ESD) program within the framework of the RESUR project.
Data Availability Statement
The network topology developed in this study was constructed exclusively from publicly available data sources, all of which are cited in the manuscript. The energy-system scenario data used as model inputs were provided by the Forschungsstelle für Energiewirtschaft e.V. (FfE) within the TransHyDE-Sys project. Restrictions apply to the availability of these third-party data, which cannot be made available by the authors and may be obtained from FfE subject to its permission. The processed network-model data and hydraulic simulation results generated in this study are available from the corresponding authors upon reasonable request, subject to any restrictions arising from the underlying third-party data.
Declaration of generative AI and AI-assisted technologies in the writing process
The authors used OpenAI’s ChatGPT and the software Congree to assist with language refinement and readability. All content was subsequently reviewed and edited by the authors, who accept full responsibility for the final publication.
Acknowledgments
The authors gratefully acknowledge the Forschungsstelle für Energiewirtschaft (FfE) for providing the scenario data used in this study. The authors further thank Fischer-Uhrig Engineering GmbH for providing the STANET® software license, which enabled the hydraulic simulations.
Conflicts of Interest
The authors have no competing financial interests or personal relationships that could have influenced the work reported here.
Abbreviations
The following abbreviations are used in this manuscript:
| CAPEX | Capital expenditures |
| CH4 | Methane |
| EHB | European Hydrogen Backbone |
| FID | Final Investment Decision |
| GIS | Geographic Information System |
| H2 | Hydrogen |
| MENA | Middle East and North Africa |
| OPEX | Operational expenditures |
| QGIS | Quantum Geographic Information System |
| STANET® | Hydraulic network simulation software |
| TSO | Transmission System Operator |
Symbols
The following symbols are used in this manuscript:
| A, B | End nodes of a representative pipe segment |
| D | Pipe diameter |
| f(Q) | Pressure-loss function depending on flow rate |
| g | Gravitational acceleration |
| G(i,k) | Conductance of pipe segment between nodes i and k |
| h(A), h(B) | Geodetic elevation of nodes A and B |
| i, k | Generic running indices for network nodes |
| K | Compressibility factor |
| Kpₐᵣ | Gas-specific pressure factor of the compressibility factor |
| k | Pipe roughness |
| k/D | Relative pipe roughness |
| L | Pipe length |
| p | Pressure |
| p(A), p(B) | Pressure at nodes A and B |
| p(i), p(k) | Pressure at nodes i and k |
| pn | Reference pressure under normal conditions |
| Q | Volumetric flow rate |
| Q(i,k) | Volumetric flow rate between nodes i and k |
| Qe(i) | External injection or withdrawal at node i |
| R | Hydraulic resistance |
| R(A,B) | Hydraulic resistance of pipe segment between nodes A and B |
| R(i,k) | Hydraulic resistance of pipe segment between nodes i and k |
| Rs | Specific gas constant |
| Re | Reynolds number |
| T | Absolute temperature |
| Tn | Normal temperature |
| v | Mean flow velocity |
| Δp | Pressure difference / pressure loss |
| Δpi | Pressure difference of pipe segment i |
| ζ | Local loss coefficient |
| λ | Pipe friction factor |
| ν | Kinematic viscosity |
| π | Pi, mathematical constant |
| ρ | Gas density |
| ρ(A), ρ(B) | Gas density at nodes A and B |
| ρn | Gas density under normal conditions |
References
- EU Climate Law: MEPs confirm deal on climate neutrality by 2050 | News | European Parliament. Available online: https://www.europarl.europa.eu/news/en/press-room/20210621IPR06627/eu-climate-law-meps-confirm-deal-on-climate-neutrality-by-2050 (accessed on Dec. 11 2025).
- International Energy Agency (IEA). Global Hydrogen Review 2024. Oct. 2024. [Google Scholar]
- Graf, F.; et al. Hintergrundpapier zu Gasinfrastrukturen im Lichte des russischen Angriffskriegs auf die Ukraine. 2021. [Google Scholar]
- ENTSOG. Ten-Year Network Development Plan 2024: TYNDP 2024 Annex A - Projects. Available online: https://www.entsog.eu/tyndp#entsog-ten-year-network-development-plan-2024 (accessed on 15 May 2024).
- European Commission. "REPowerEU: Affordable, Secure And Sustainable Energy for Europe. Available online: https://commission.europa.eu/topics/energy/repowereu_en (accessed on Aug. 27 2025).
- European Commission, Communication from the Commission to the European Parliament, the Council, the European Economic and Social Committee and the Committee of the Regions: Powering a climate-neutral Economy: An EU Strategy for Energy System Integration. (Communication from the Commission to the European Parliament). Available online: https://ec.europa.eu/energy/ (accessed on 2020).
- European Commission, Communication from the Commission to the European Parliament, the Council, the European Economic and Social Committee and the Committee of the Regions: A Hydrogen Strategy for a Climate-Neutral Europe. Available online: https://ec.europa.eu/energy/sites/ener/files/hydrogen (accessed on 2020).
- DECHEMA, FfE; Fraunhofer, I.K.T.S. "Wasserstoffinfrastruktur-Roadmap: Ergebnisse aus dem TransHyDE-Projekt Systemanalyse." ISBN: 978-3-89746-256-4. Available online: https://www.wasserstoff-leitprojekte.de/lw_resource/datapool/systemfiles/elements/files/23d87cb2-d9a4-11f0-ad78-fa163ebab5e5/live/document/Wasserstoffinfrastruktur-Roadmap_final.pdf (accessed on Jun. 19 2026).
- ENTSOG AISBL. ENTSOG Summer Supply Outlook 2026: With Winter 2026/27 Overview. Available online: https://www.entsog.eu/sites/default/files/2026-04/SO0069-26_Summer%20Supply%20Outlook%202026.pdf (accessed on Jun. 19 2026).
- EHB. European Hydrogen Backbone Interaktive Karte. Available online: https://www.ehb.eu/maps/202307/index.html#4/51.37/19.73 (accessed on Aug. 6 2025).
- van Rossum, Rik; Jens, Jaro; La Guardia, Gemma. European Hydrogen Backbone: A European Hydrogen Infrastructure Vision Covering 28 Countries, 2022. Available online: https://ehb.eu/files/downloads/ehb-report-220428-17h00-interactive-1.pdf (accessed on Nov. 26 2025).
- Sagdur, Yasin; Slowinski, Robert; van Rossum, Rik; Kozub, Alex; Kühnen, Luis; Overgaag, Martijn; Michelet, Alizé; Kandathiparambil, Stephanie; London, Poppy. European Hydrogen Backbone: Implementation Roadmap - Cross Border Projects and Costs Update, 2023. Available online: https://ehb.eu/files/downloads/EHB-2023-Implementation-Roadmap-Part-1.pdf.
- ENTSOG, G.I.E.; EUROGAS; CEDEC, G.D.4S.; GEODE. H2 Infrastructure Map Europe Q4/2023: Showcasing concrete European hydrogen infrastructure projects and possibilities for transport routes and corridors. Available online: https://www.h2inframap.eu/ (accessed on Nov. 15 2024).
- ENTSOG, G.I.E.; EUROGAS; CEDEC, G.D.4S.; GEODE. Hydrogen Infrastructure Map Q4/2024: Showcasing concrete European hydrogen infrastructure projects and possibilities for transport routes and corridors. Available online: https://www.h2inframap.eu/#map (accessed on Aug. 10 2025).
- Bundesnetzagentur, Genehmigung eines Wasserstoff-Kernnetzes. 2024. Available online: https://fnb-gas.de/wasserstoffnetz-wasserstoff-kernnetz/.
- Bundesministerium für Wirtschaft und Klimaschutz (BMWK). Entwurf eines Klimaschutzprogramms 2023 der Bundesregierung: BMWK, 2023. Available online: https://www.bundeswirtschaftsministerium.de/Redaktion/DE/Downloads/klimaschutz/entwurf-eines-klimaschutzprogramms-2023-der-bundesregierung.pdf?__blob=publicationFile&v=6 (accessed on Aug. 19 2025).
- Kigle, S.; Helmer, N.; Schmidt-Achert, T. Fast enough? The consequences of delayed renewable energy expansion on european hydrogen import needs. Appl. Energy 2025, 400. [Google Scholar] [CrossRef]
- Mielich, T.; Dobler, R.; Hollnagel, J.; Akca, O.; Müller-Kirchenbauer, J. Europe's way from natural gas to green hydrogen: Modeling and simulation of the transforming European gas transport infrastructure. Int. J. Hydrogen Energy 2025, 135, 156–171. [Google Scholar] [CrossRef]
- Rövekamp, J. Transportnetzberechnung zur Feststellung der Erdgasversorgungssicherheit in Deutschland unter regulatorischem Einfluss; Universitätsbibliothek der TU Clausthal, 2015. [Google Scholar]
- Lohmeier, D.; Cronbach, D.; Drauz, S.R.; Braun, M.; Kneiske, T.M. Pandapipes: An Open-Source Piping Grid Calculation Package for Multi-Energy Grid Simulations. Sustainability 2020, 12, 9899. [Google Scholar] [CrossRef]
- Dejonghe, M.; Van de Graaf, T.; Belmans, R. From natural gas to hydrogen: Navigating import risks and dependencies in Northwest Europe. Energy Res. Soc. Sci. 2023, 106. [Google Scholar] [CrossRef]
- Hanto, J.; Herpich, P.; Löffler, K.; Hainsch, K.; Moskalenko, N.; Schmidt, S. Assessing the implications of hydrogen blending on the European energy system towards 2050. Adv. Appl. Energy 2023, 13. [Google Scholar] [CrossRef]
- Müller-Kirchenbauer, J.; Evers, M.; Hollnagel, J.; Kuzyaka, B.; Jiang, D.; Akça, O.; Mielich, T.; Kalz, M.; Verwiebe, P.A. Germany's Way from Russian Natural Gas to Green Hydrogen: Network Data, Procedures, and Topologies for Feasible Transition Paths to a Green Hydrogen Transport Infrastructure in Germany, GreenHyDE [gri:n'haɪ̯də] –. Energy Technol. 2024, 13. [Google Scholar] [CrossRef]
- Fleiter, T.; Fragoso, J.; Lux, B.; Alibaş, Ş.; Al-Dabbas, K.; Manz, P.; Neuner, F.; Weißenburger, B.; Rehfeldt, M.; Sensfuß, F. Hydrogen Infrastructure in the Future CO2-Neutral European Energy System—How Does the Demand for Hydrogen Affect the Need for Infrastructure? Energy Technol. 2024, 13. [Google Scholar] [CrossRef]
- Kigle, S.; Mohr, S.; Kneiske, T.; Clees, T.; Ebner, M.; Harper, R.; Jahn, M.; Klaassen, B.; Köppel, W.; Ausfelder, F.; et al. TransHyDE-Sys: An Integrated Systemic Approach for Analyzing and Supporting the Transformation of Energy Systems and Hydrogen Infrastructure Development. Energy Technol. 2024, 13. [Google Scholar] [CrossRef]
- Kountouris, I.; Bramstoft, R.; Madsen, T.; Gea-Bermúdez, J.; Münster, M.; Keles, D. A unified European hydrogen infrastructure planning to support the rapid scale-up of hydrogen production. Nat. Commun. 2024, 15, 1–13. [Google Scholar] [CrossRef] [PubMed]
- Tsiklios, C.; Hermesmann, M.; Müller, T. Hydrogen transport in large-scale transmission pipeline networks: Thermodynamic and environmental assessment of repurposed and new pipeline configurations. Appl. Energy 2022, 327. [Google Scholar] [CrossRef]
- Triesch, T.; Klütz, T.; Linßen, J.; Stolten, D. Evaluation of possible network states in the future German hydrogen network 2025 and 2030. Sustain. Energy Grids Netw. 2024, 39. [Google Scholar] [CrossRef]
- Azimipoor, A.; Zhang, T.; Qadrdan, M.; Jenkins, N. Operational implications of transporting hydrogen via a high-pressure gas network. Energy Convers. Manag. X 2025, 26. [Google Scholar] [CrossRef]
- Clees, T. Contingency analysis for gas transport networks with hydrogen injection. Math. Methods Oper. Res. 2022, 95, 533–563. [Google Scholar] [CrossRef]
- Yang, M.; Hunger, R.; Berrettoni, S.; Sprecher, B.; Wang, B. A review of hydrogen storage and transport technologies. Clean. Energy 2023, 7, 190–216. [Google Scholar] [CrossRef]
- Guidehouse, Ed. EHB Implementation Roadmap: Public support as catalyst for hydrogen infrastructure: European Hydrogen Backbone. Apr 2024. Available online: https://www.ehb.eu/files/downloads/EHB-2024-Implementation-Roadmap-Part-2.pdf.
- Documentation for QGIS 3.40: Index. Available online: https://docs.qgis.org/3.40/en/docs/index.html (accessed on Oct. 28 2025).
- Ingenieurbüro Fischer-Uhrig, STANET Network Analysis. 2020. Available online: https://www.stafu.de/de/home.html.
- Kisse, J.M.; Braun, M.; Letzgus, S.; Kneiske, T.M. A GIS-Based Planning Approach for Urban Power and Natural Gas Distribution Grids with Different Heat Pump Scenarios. Energies 2020, 13, 4052. [Google Scholar] [CrossRef]
- Jakob, J.; Uhlemeyer, B.; Koralewicz, M.; Garzon-Real, J.; Zdrallek, M.; Ruf, J.; Köppel, W.; Bauhaus, B. Simulation of an integrated planning of power and gas distribution grids considering power-to-gas and gas-to-power units. Cired-Open Access Proc. J. 2020, 2020, 70–73. [Google Scholar] [CrossRef]
- Horlacher, H.-B.; Helbig, U. (Eds.) Rohrleitungen 2: Einsatz, Verlegung, Berechnung, Rehabilitation, 3rd ed.; Springer Berlin Heidelberg: Berlin, Heidelberg; Imprint Springer Vieweg, 2023. [Google Scholar]
- Gugat, M.; Schultz, R.; Wintergerst, D. Networks of pipelines for gas with nonconstant compressibility factor: stationary states. Comput. Appl. Math. 2016, 37, 1066–1097. [Google Scholar] [CrossRef]
- Ingenieurbüro Fischer-Uhrig, Internes Schulungsmatrial 2015: Rechenverfahren
- DVGW GW 303-1 (A); Berechnung von Gas- und Wasserrohrnetzen - Teil 1: Hydraulische Grundlagen, Netzmodellierung und Berechnung. DVGW Deutscher Verein des Gas- und Wasserfaches e. V.: Bonn, Oct 2006.
- Eberhard, R.; Huening, R. Handbuch der Gasversorgungstechnik: Gastransport u. Gasverteilung, 2nd ed.; Oldenbourg: München, 1990. [Google Scholar]
- Tinney, W.; Walker, J. Direct solutions of sparse network equations by optimally ordered triangular factorization. Proc. IEEE 1967, 55, 1801–1809. [Google Scholar] [CrossRef]
- Fleer, A.-C.; Sciancalepore, M.; Spreckelsen, E.-M.; Verbücheln, R. W. Verdichtung und Wasserstofftransport: Eine technische und wirtschaftliche Analyse. May. 2025. [Google Scholar]
- BMWK. "Europäische Gasnetze mit Open-Source genauer abbilden: Projekt SciGRID_gas. Available online: https://www.energieforschung.de/de/aktuelles/projekteinblicke/2022/scigrid-gas (accessed on Oct. 27 2025).
- Institute of Networked Energy Systems. Sci2grid – Open reference models of European energy networks: Modelling Tool. Available online: https://www.dlr.de/en/ve/research-and-transfer/research-infrastructure/modelling-tools/sci2grid (accessed on Oct. 27 2025).
- Yeaw, S.; Storstenvik, A.; Vesterkjaer, R. Learning and development from the world’s first operating subsea compression system. APPEA J. 2017, 57, 683–686. [Google Scholar] [CrossRef]
- Raj, A.; Larsson, I.S.; Ljung, A.-L.; Forslund, T.; Andersson, R.; Sundström, J.; Lundström, T. Evaluating hydrogen gas transport in pipelines: Current state of numerical and experimental methodologies. Int. J. Hydrogen Energy 2024, 67, 136–149. [Google Scholar] [CrossRef]
Figure 1.
Hydrogen production and demand density all target years.
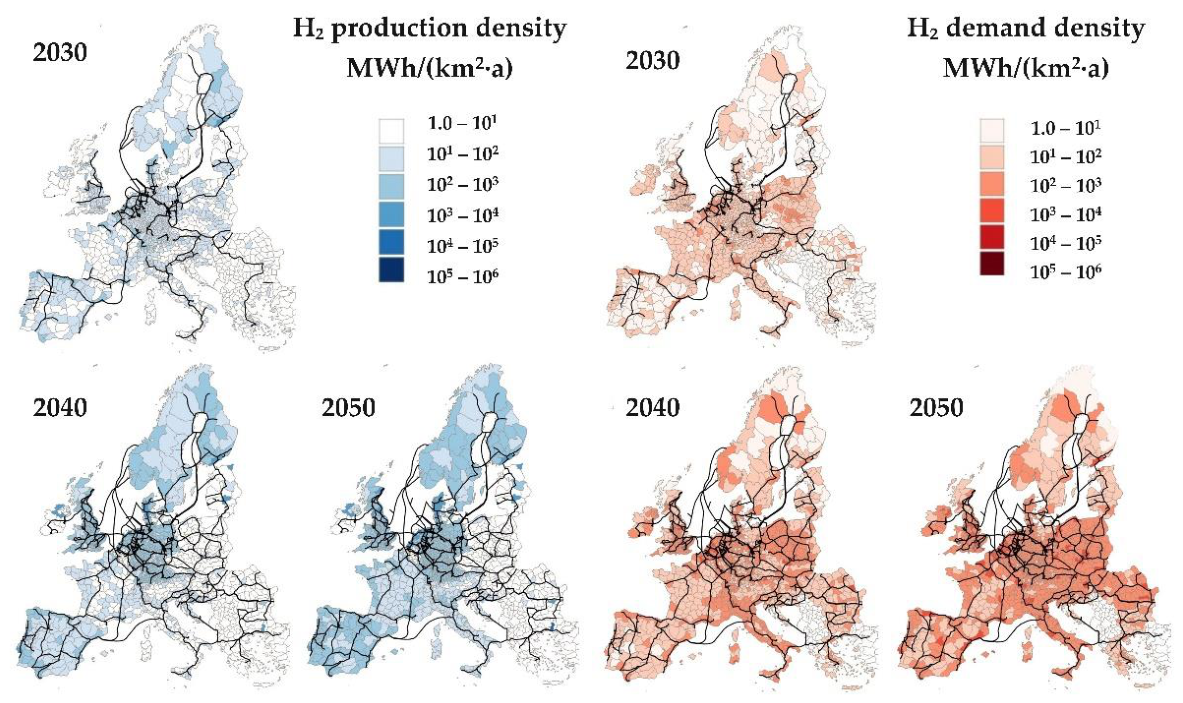
Figure 2.
GIS model target year 2030.
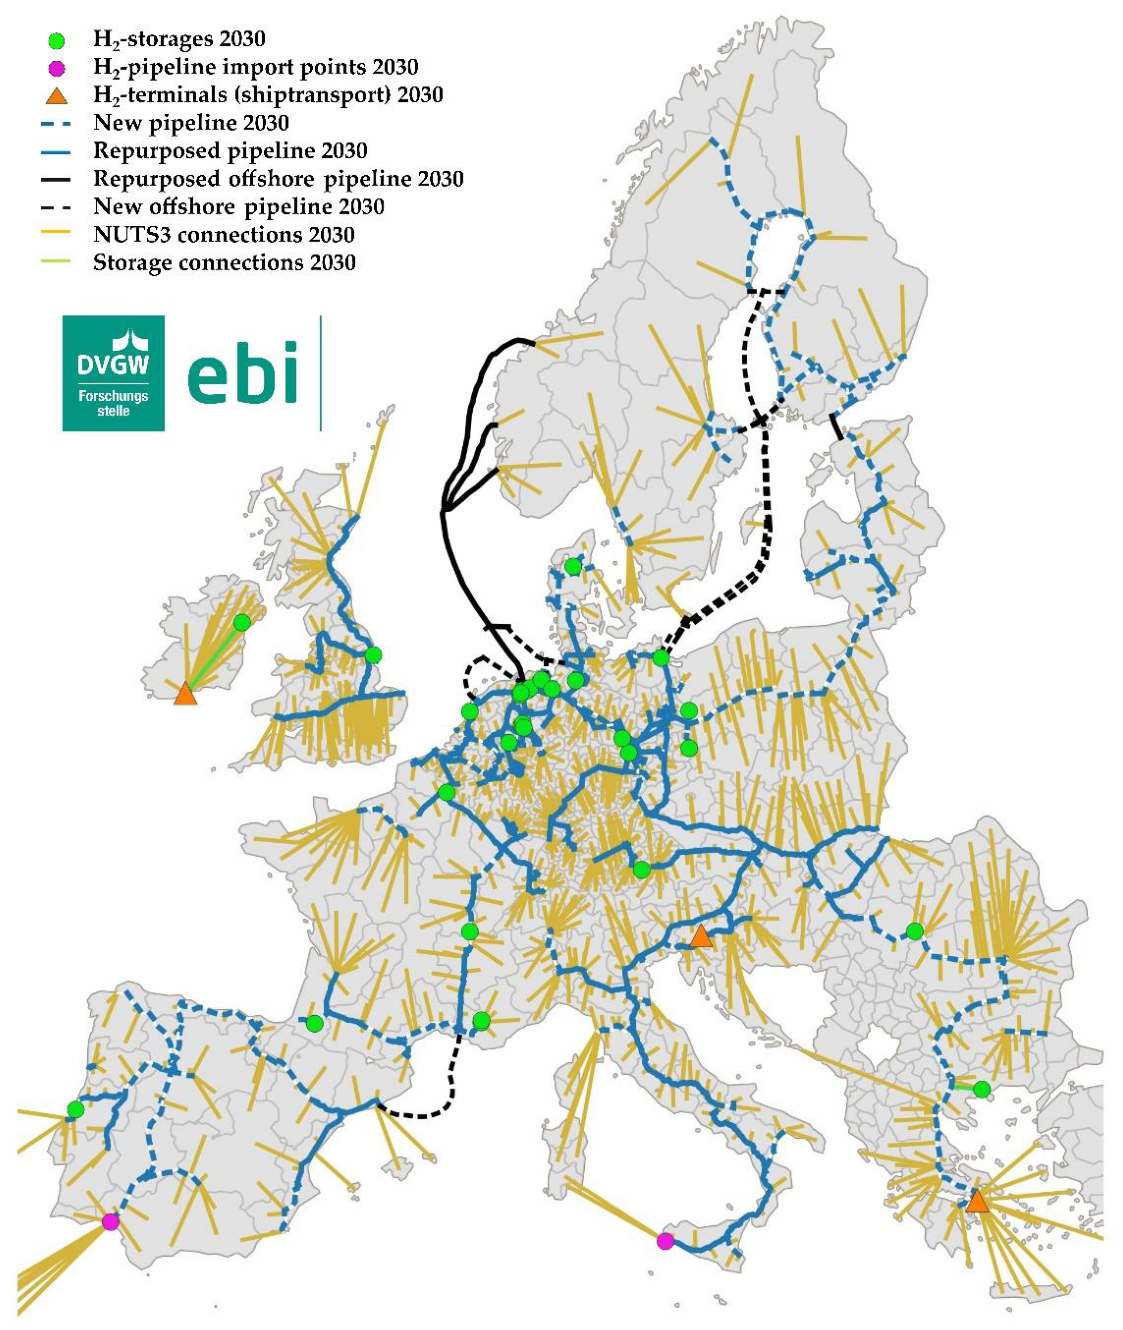
Figure 3.
GIS model target years 2040-2050.
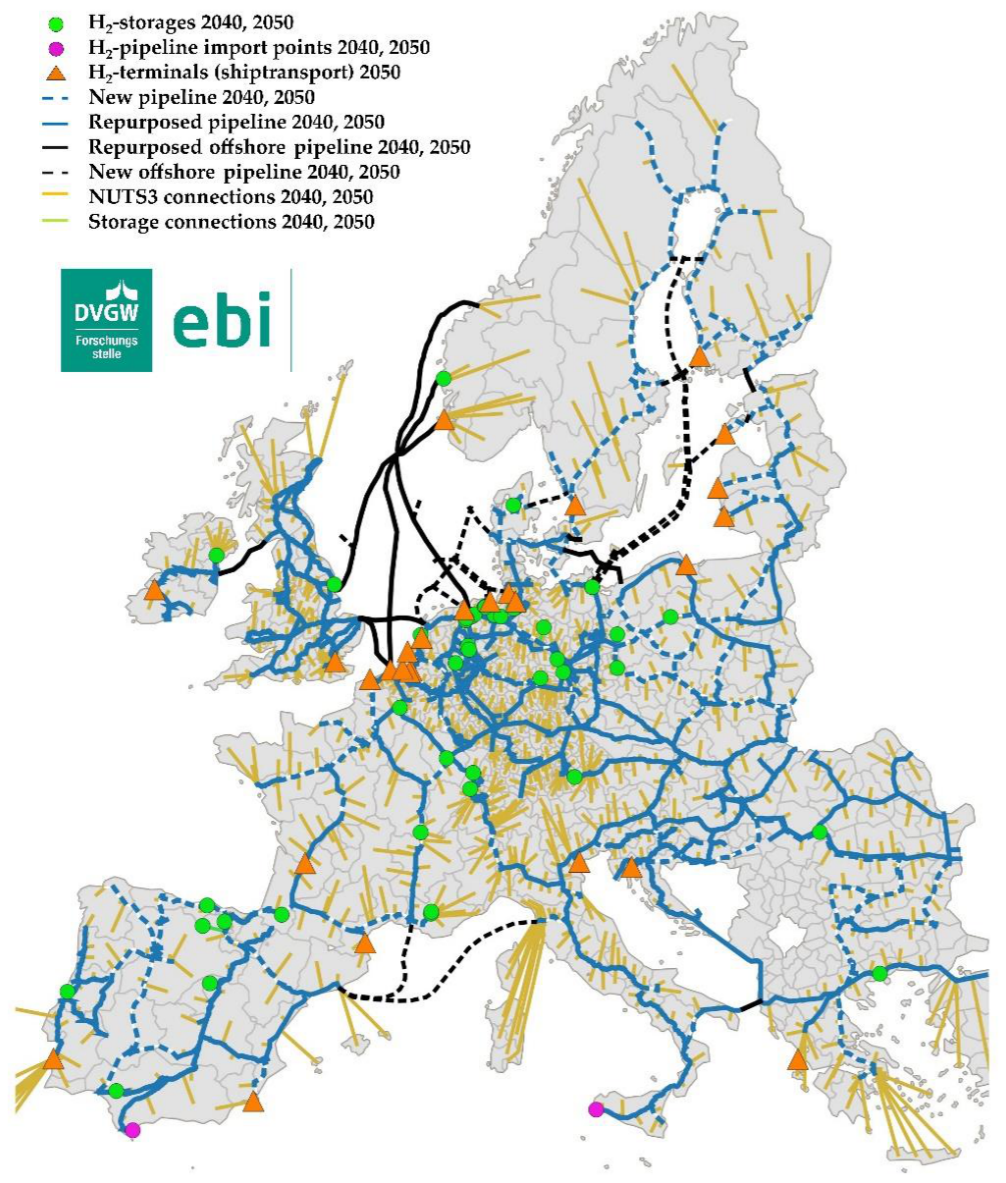
Figure 4.
Simplified compressor characteristic curve: showing pressure and flow rate.
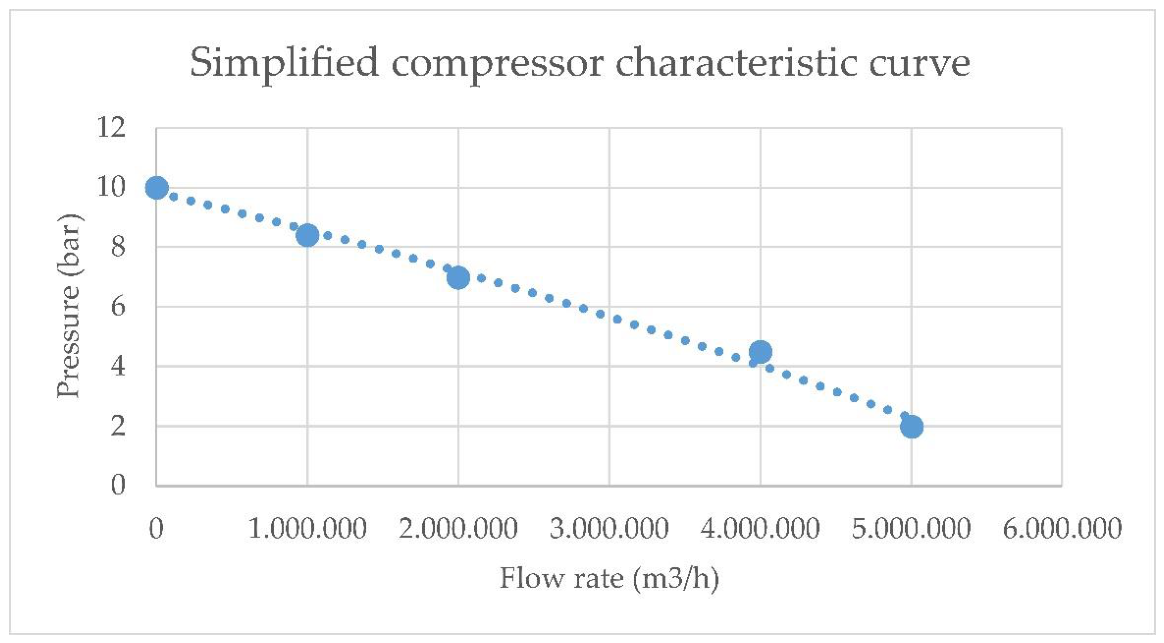
Figure 5.
Potential compressor station locations derived from the SciGrid and Sci2grid datasets (left) and the set of stations activated in the hydraulic model at the time of maximum aggregated NUTS 3-level demand for each target year (right). The compressor station configuration for 2040 and 2050 is identical. *Source: SciGrid dataset [44,45].
Figure 5.
Potential compressor station locations derived from the SciGrid and Sci2grid datasets (left) and the set of stations activated in the hydraulic model at the time of maximum aggregated NUTS 3-level demand for each target year (right). The compressor station configuration for 2040 and 2050 is identical. *Source: SciGrid dataset [44,45].
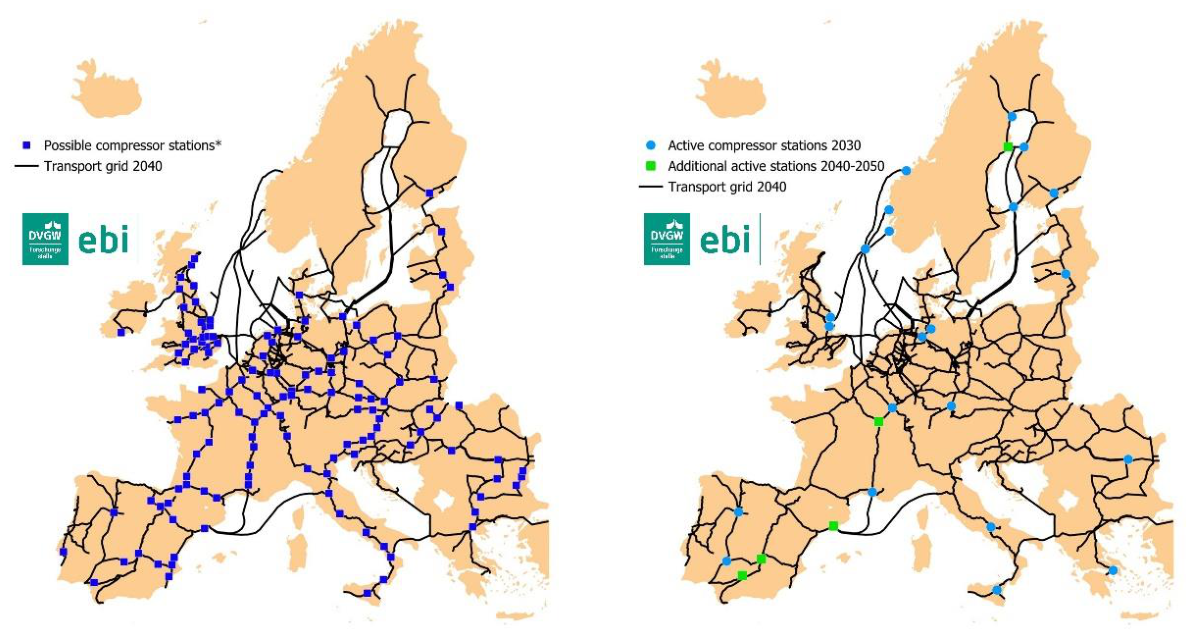
Figure 6.
Pressure node-project pairings and the corresponding transport grids, all target years.
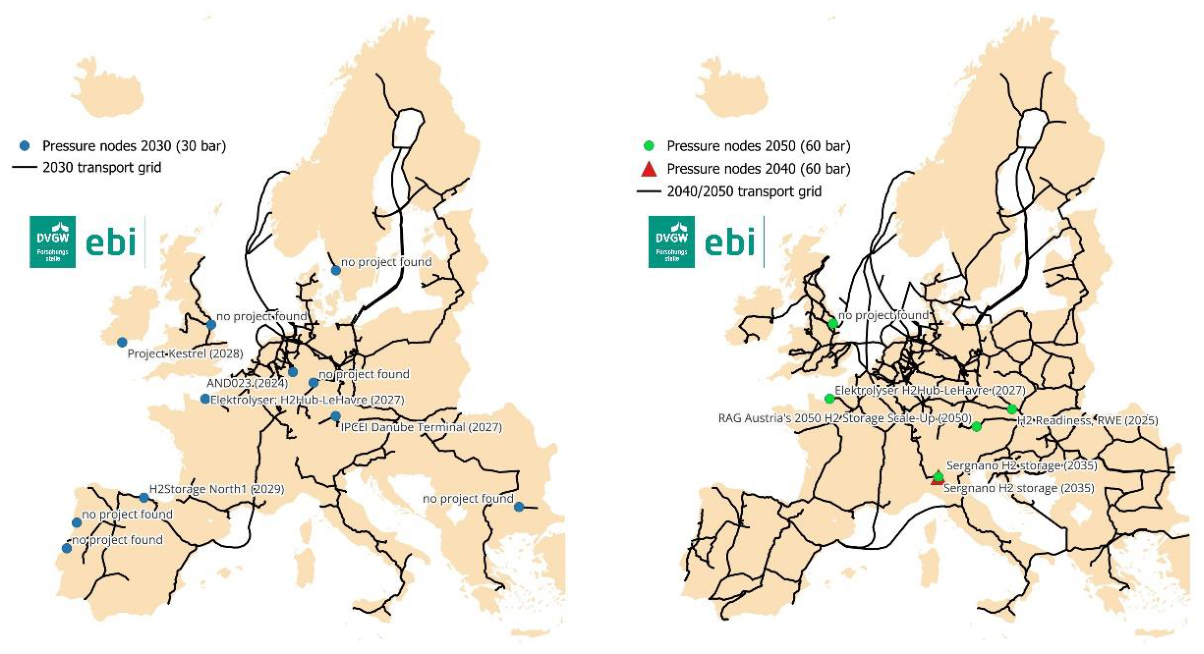
Figure 7.
Simulation results at maximum aggregated regional (NUTS 3-level) consumption, target year 2030.
Figure 7.
Simulation results at maximum aggregated regional (NUTS 3-level) consumption, target year 2030.
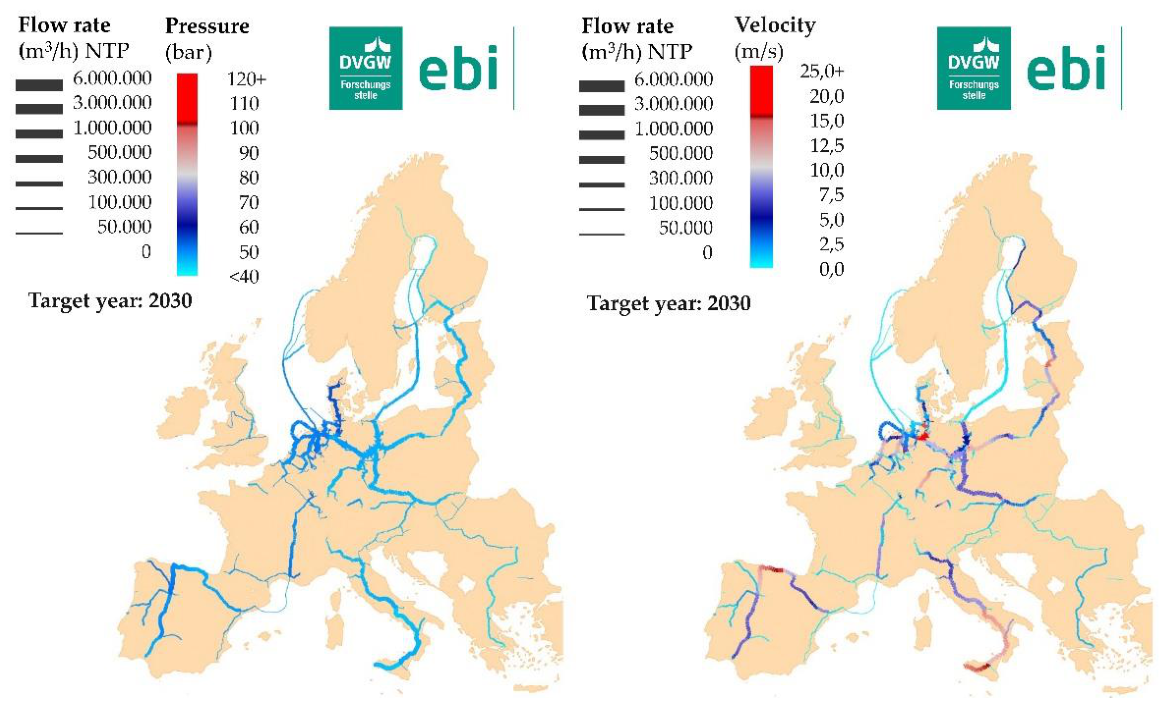
Figure 8.
Simulation results at maximum aggregated regional (NUTS 3-level) consumption, target year 2040.
Figure 8.
Simulation results at maximum aggregated regional (NUTS 3-level) consumption, target year 2040.
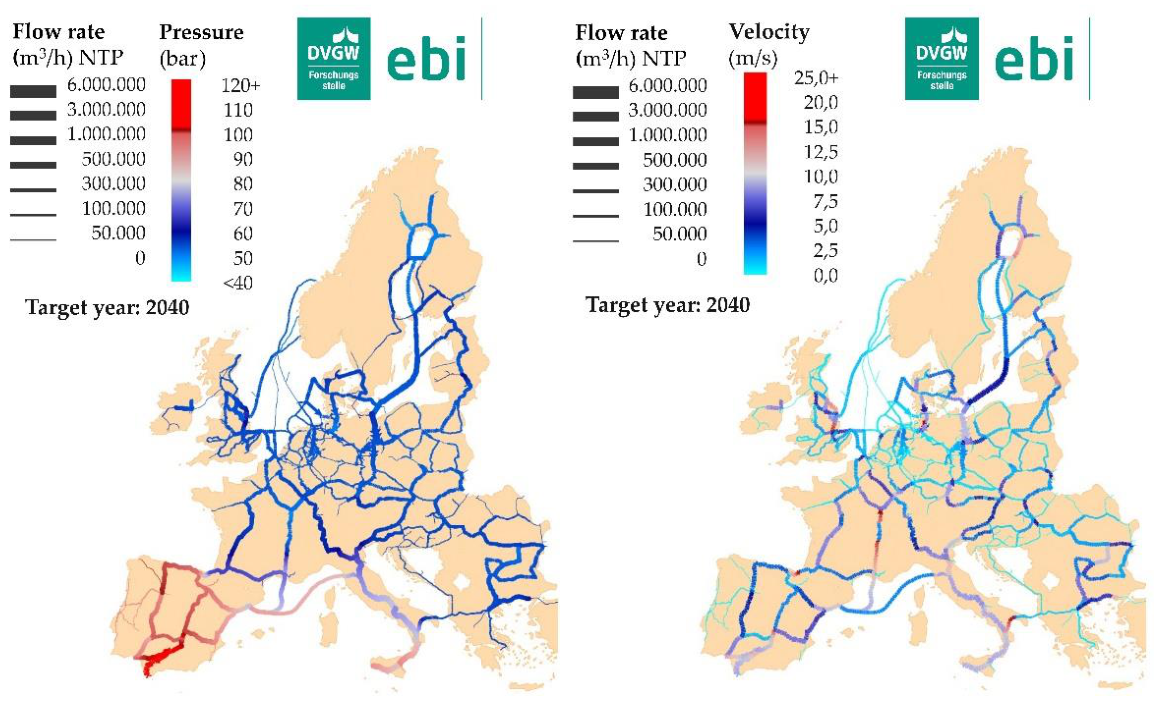
Figure 9.
Simulation results at maximum aggregated regional (NUTS 3-level) consumption, target year 2050.
Figure 9.
Simulation results at maximum aggregated regional (NUTS 3-level) consumption, target year 2050.
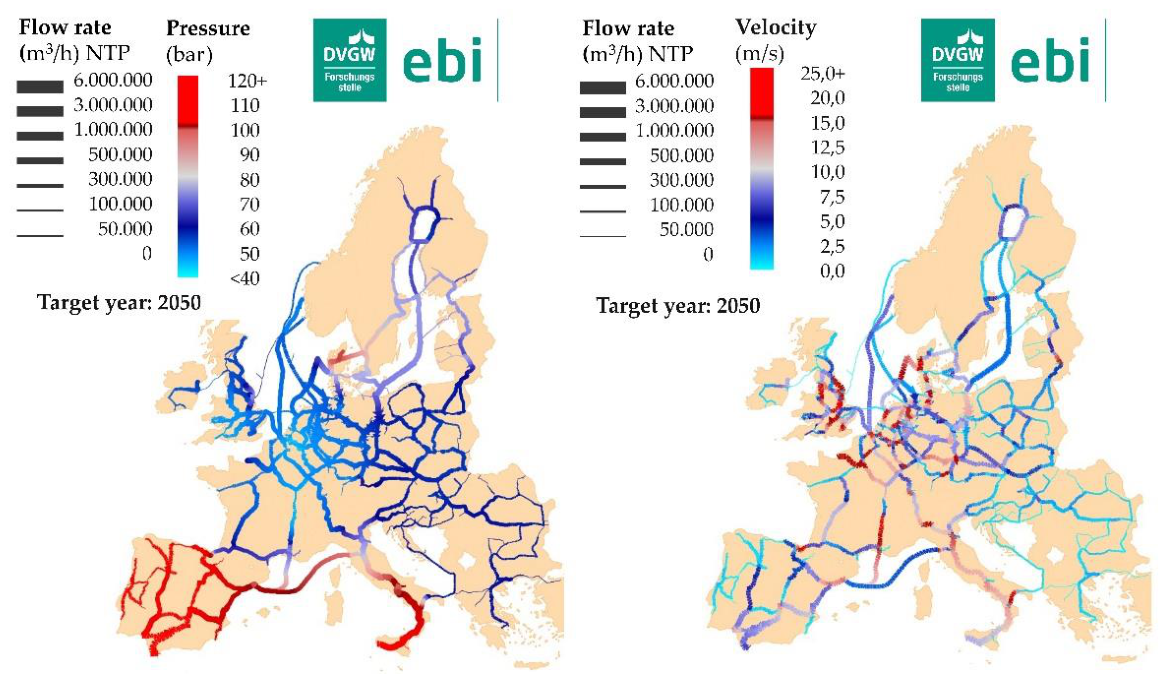
Figure 10.
Target year 2030 pressure distribution among grid nodes. Number of grid nodes: 7117.
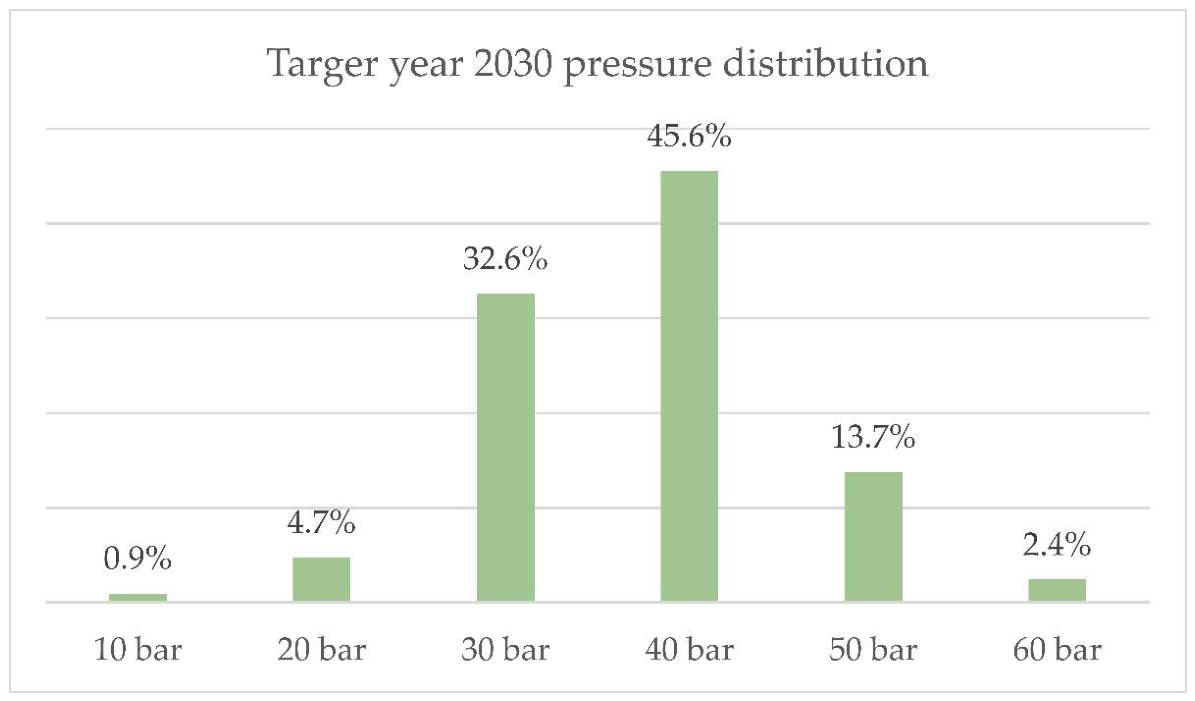
Figure 11.
Target year 2040 and 2050 pressures among grid nodes. Number of grid nodes for both 2040 and 2050: 11298.
Figure 11.
Target year 2040 and 2050 pressures among grid nodes. Number of grid nodes for both 2040 and 2050: 11298.
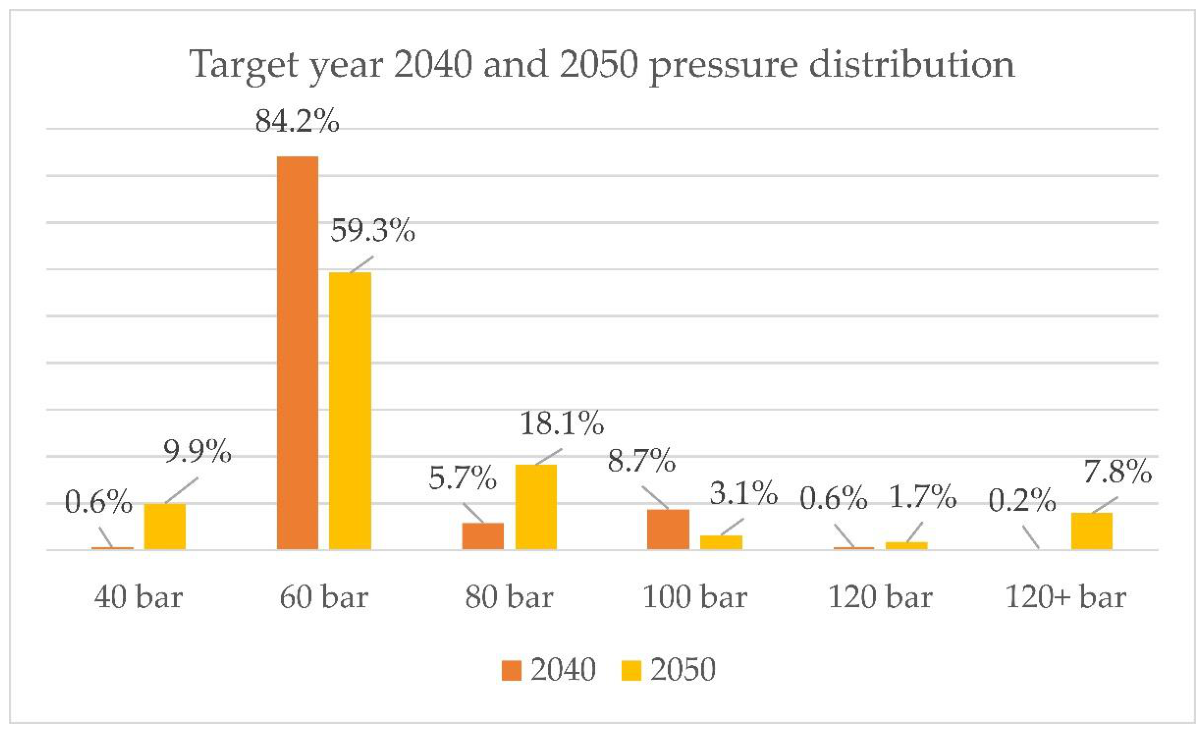

Table 1.
Modeled hydrogen transmission network topology for each target year and corresponding data sources.
Table 1.
Modeled hydrogen transmission network topology for each target year and corresponding data sources.
| Target year | German grid topology | European grid topology |
|---|---|---|
| 2030 | German transmission pipelines planned for commissioning up to and including 2030 according to the German H2 Core Network approval document (10.2024) [15]. | European transmission pipelines planned for commissioning up to and including 2030 according to the EHB (07.2023) [10,11,12], excluding Germany. |
| 2040 | All German transmission pipelines planned for commissioning according to the German H2 Core Network approval document (10.2024) [15]. | All European transmission pipelines planned for commissioning up to and including 2040 according to EHB (07.2023) [10,11,12], excluding Germany. |
| 2050 | Due to the substantial uncertainties associated with long-term infrastructure planning, the network topology beyond 2040 remains difficult to assess. Therefore, the 2050 topology is assumed to be identical to the 2040 topology. | |
Table 2.
Table-based overview of the European hydrogen transmission network model all target years.
| Year 2030 | Year 2040 | Year 2050 | |
|---|---|---|---|
|
NUTS 3 nodes (demand & production) |
EU-27 +3 (CH, GB, NO) |
||
|
Pipeline import points (Number of locations) |
2 total – IT (1), SP (1) |
||
|
Underground gas storages (Number of locations) |
30 total – DE (13), DK (1), FR (5), GB-ENG (1), GB-NIR (1), GR (1), NL (4), PL (1), PT (1), RO (1) |
45 total – DE (19), DK (1), ES (5), FR (7), GB-ENG (1), GB-NIR (1), GR (1), NL (4), NO (1), PL (2), PT (1), RO (1) |
45 total – DE (19), DK (1), ES (5), FR (7), GB-ENG (1), GB-NIR (1), GR (1), NL (4), NO (1), PL (2), PT (1), RO (1) |
|
Hydrogen import terminals (Number of locations) |
3 total – GR (1), CRO (1), IR (1) |
26 total, but 0 modeled* – BE (2), DE (3), EE (1), ES (1), FI (1), FR (3), GB (1), GR (1), HR (1), IE (1), IT (1), LT (1), LV (1), NL (5), NO (1), PL (1), PT (1), SE (1) | 26 total – BE (2), DE (3), EE (1), ES (1), FI (1), FR (3), GB (1), GR (1), HR (1), IE (1), IT (1), LT (1), LV (1), NL (5), NO (1), PL (1), PT (1), SE (1) |
* Terminals are excluded from the hydraulic simulations because the underlying energy system scenario assumes no hydrogen imports via terminals in 2040.
Table 3.
Key characteristics of the simulation used in this study.
| Modeling goal | Stable, steady-state simulations including compressor stations |
|---|---|
| Set pressure at pressure nodes | 2030: 30 bar (ramp-up) 2040: 60 bar 2050: 60 bar |
| Placement of pressure nodes | Pressure nodes are assigned to real hydrogen projects if found, preferably underground gas storages |
| Steady-state simulations | Yes – evaluated at the time of maximum aggregated regional (NUTS 3-level) consumption |
Disclaimer/Publisher’s Note: The statements, opinions and data contained in all publications are solely those of the individual author(s) and contributor(s) and not of MDPI and/or the editor(s). MDPI and/or the editor(s) disclaim responsibility for any injury to people or property resulting from any ideas, methods, instructions or products referred to in the content. |
© 2026 by the authors. Licensee MDPI, Basel, Switzerland. This article is an open access article distributed under the terms and conditions of the Creative Commons Attribution (CC BY) license (http://creativecommons.org/licenses/by/4.0/).
Copyright: This open access article is published under a Creative Commons CC BY 4.0 license, which permit the free download, distribution, and reuse, provided that the author and preprint are cited in any reuse.