

Submitted:
10 August 2026
Posted:
11 August 2026
You are already at the latest version
Abstract
This article presents the design, construction, and calibration of a portable instrument capable of measuring the solar spectrum in the visible region (430–650 nm), as well a UVA, UVB, and UVC radiation, while also determining the ultraviolet radiation index. The hardware was constructed by integrating a Raspberry Pi 4B, a Raspberry Pi HQ camera coupled to a spectroscope for solar spectrum analysis, and an AS7331 sensor for UV radiation measurement. The control software was developed in Python and includes a graphical user interface that displays the solar spectrum and UVA, UVB, and UVC radiation levels, in addition to calculating the ultraviolet index from UVB-band measurements. The instrument was calibrated using a mercury (Hg) spectral lamp, a reference spectrometer, and commercial UVA and UVB radiation meters. The prototype spectrometer was calibrated and adjusted in the city of Arequipa. During this stage, the equations required to convert the digital signals from the sensors into radiometric units were determined, and the measurement uncertainty of the instrument was obtained. Finally, the instrument was evaluated under field conditions at three locations situated at different altitudes: Camaná (0 m a.s.l.), Arequipa (2330 m a.s.l.), and Sumbay (4100 m a.s.l.). The spectrometer recorded irradiance values of 111.2 W/m2, 670.7 W/m2, and 643.1 W/m2 in Camaná, Arequipa, and Sumbay, respectively, and exhibited a maximum deviation of 15.8 W/m2 from the measurements obtained with the reference instrument. Likewise, maximum differences of 0.27 mW/cm2, 0.02 mW/cm2, and 0.01 mW/cm2 were observed for UVA, UVB, and UVC radiation measurements, respectively. These differences were not significant relative to the order of magnitude of the measurements obtained. In addition, the ultraviolet radiation index was found to reach values of up to 21 in Sumbay, posing a risk to the population of the region. The results showed that the solar spectrum and UV radiation measurements obtained with the constructed instrument were proportional to those recorded by the reference spectrometer and commercial UV meters, demonstrating its reliability and feasibility as a measurement instrument.
Keywords:
solar spectrum
; UV radiation
; calibration
; solar energy
; spectrometer
; UV meter
1. Introduction
Solar radiation is a natural resource with a broad impact on our daily lives: on the one hand, it enables electricity generation through photovoltaic technologies, and on the other, it represents a significant risk to human health due to its ultraviolet (UV) component. In 2025, the Ministry of Energy and Mines (MINEM) reported that Peru has an installed capacity of 748 megawatts (MW), which are generated by 17 Solar Power Plants that inject a total of 1.671 gigawatts (GW) into the National Interconnected Power System (SEIN). Furthermore, MINEM also reported that Peru only uses 0.08% of its solar capacity, which is 937 GW, and that it is a country possessing high photovoltaic potential, highlighting the Arequipa region as one of the regions with the greatest usable solar power. However, the performance evaluation of photovoltaic technologies is usually based on the theoretical AM 1.5 standard, which has proven to be insufficient for predicting operational efficiency under real conditions [1,2]. Studies conducted in Saudi Arabia, Brazil, the United States, Spain, China, Romania, and Germany show that surface solar spectrum variations significantly alter the performance of photovoltaic technologies, particularly multi-junction technologies, with silicon photovoltaic technologies presenting the greatest stability [6,7,8]. This spectral mismatch can generate efficiency losses of up to 60% to 65% in photovoltaic technologies; these losses were primarily associated with two causes: the thermalization of high-energy photons (which dissipate excess energy as heat) and the passive transmission of sub-bandgap photons [26]. In Peru, studies carried out in the city of Lima corroborate that the local solar spectrum differs from the spectrum predicted by AM 1.5; the average photon energy parameter was used to evaluate the difference between the local spectrum and the AM 1.5 standard, finding that Lima’s average photon energy is 1.923 eV, whereas the average photon energy predicted by the AM 1.5 standard is 1.880 eV. This difference directly impacts the performance of photovoltaic technologies [3,4]. Consequently, the in situ measurement of the solar spectrum has become an indispensable requirement for improving the design efficiency of photovoltaic technologies [5].
From a health perspective, high solar irradiance entails extreme levels of UV radiation, which generates skin and eye diseases such as tumorigenesis, skin cancer, sunburns, photoaging, pterygium, cataracts, macular degeneration, photokeratitis, climatic droplet keratopathy, squamous cell carcinoma, photoretinitis, and ocular melanoma [27,28,29]. In Peru, the National Meteorology and Hydrology Service of Peru (SENAMHI) reported that, in the city of Arequipa, Ultraviolet Radiation Indexes (UVI) greater than 11 are recurrently recorded, reaching values up to 14 or 15 during the summer, which represents a critical risk for the development of photocarcinogenesis and ocular pathologies [9]. Despite this geographic vulnerability, research conducted in the city of Arequipa warns of a severe shortage of continuous monitoring networks and emphasizes the need to expand radiometric instrumentation for epidemiological surveillance.
To mitigate this lack of spectral and radiometric data, the development of low-cost instruments based on embedded systems, such as Raspberry Pi or Arduino, has gained technical relevance [11,14]. Nevertheless, the literature highlights that the viability of these radiometers and spectrometers is strongly limited by their precision and uncertainty [12,15]. Low-cost commercial sensors require rigorous individual calibrations due to inherent problems such as angular response, thermal dependence, and spectral mismatch with the light source [13]. If calibration or performance verification of the instruments is not performed, they can present significant systematic errors that would affect the reliability of the measurements made by these instruments [16,17].
In this context, the present article outlines the design, construction, and calibration of a dual radiometric measurement and spectrometry system that is portable and low-cost. This embedded instrument integrates an optical spectrometer designed to measure the solar spectrum in the visible region (430 nm to 650 nm) and a multichannel radiometer (AS7331) dedicated to quantifying UVA, UVB, and UVC radiation. To validate the performance of the constructed spectrometer, it was subjected to field tests at different topographical altitudes in the southern region of Peru: Camaná (0 masl), Arequipa (2330 masl), and Sumbay (4100 masl). In this way, the work proposes an accessible, open-architecture, and rigorously validated technological solution, oriented toward the comprehensive monitoring of the solar resource for both energy efficiency applications and epidemiological surveillance.
2. Methodology
The present study proposes the development of a low-cost modular measurement instrument designed for the simultaneous analysis of direct solar radiation in the visible region (430–650 nm) and in the ultraviolet bands (UVA, UVB, and UVC). The methodology is divided into four fundamental phases: hardware design, software design, calibration and adjustment of the developed spectrometer, and field verification of the spectrometer’s performance.
2.1. Hardware Design
The spectrometer was constructed by integrating five modules: an optical collector, a dispersion unit, a signal-detection unit, a UV-radiation sensor, and a data-processing unit.
The optical collector consists of a 3 m long plastic optical fiber with an aperture diameter of 1 mm.
The selected dispersion unit was a transmission spectroscope (TE313 model) equipped with a high-precision diffraction grating of 600 lines per millimeter, which disperses the incident light entering through the waveguide.
The signal-detection unit consists of a Raspberry Pi HQ camera module based on a stacked, back-illuminated CMOS image sensor (12.3-megapixel Sony IMX477R). This sensor has a pixel size of 1.55 m × 1.55 m, ensuring high resolution of the received signal and low noise levels. The camera was fitted with a 16 mm telephoto lens with a manually adjustable aperture from f/1.4 to f/16, mounted using a C-to-CS adapter to sharply focus the diffraction pattern directly onto the CMOS sensor array.
The selected UV-radiation sensor was the AS7331. This sensor consists of three independent photodiodes coupled with interference filters that selectively isolate UVA (315–410 nm), UVB (280–315 nm), and UVC (240–280 nm) radiation. The internal photoelectric conversion is processed through delta-sigma analog-to-digital converters (ADCs) with a resolution of up to 24 bits, and the digital counts are transmitted to the main processing unit through the I2C serial communication protocol.
The data-processing unit was centralized in a Raspberry Pi 4 Model B single-board computer (SBC), equipped with a Broadcom BCM2711 system-on-chip and an ARM Cortex-A72 processor. This unit receives and processes the signals from the two installed sensors and displays the results through the graphical user interface.
To ensure optical alignment, immobilize the components during field measurements, and reduce the entry of stray light, a unified support structure was designed and manufactured by three-dimensional printing using black polylactic acid (PLA). To ensure adequate mechanical fixation, the support cavities were dimensioned with a nominal interference of 0.2 mm relative to the dimensions of the spectrometer components, allowing them to be press-fitted into place. This geometric configuration maintains stable alignment between the output of the dispersive system and the optical axis of the telephoto lens, thereby reducing spectral displacement across the focal plane caused by vibrations or mechanical movements during operation.
2.2. Software Design
The software for system control, data acquisition, and data analysis was developed entirely in Python using the object-oriented programming paradigm. Its implementation was based on the GitHub repositories iorodeo_as7331 and PySpectrometer. The former provides a library for configuring the AS7331 sensor and managing its communication through the I2C bus, whereas the latter contains an application for acquiring and processing spectral images using a 5 MP Raspberry Pi camera. Both source codes were adapted and expanded according to the characteristics of the components, the system architecture, and the functions required by the developed spectrometer.
Because the system must simultaneously process a high-resolution video stream and acquire measurements from the UV sensor through the I2C bus, a concurrent architecture based on execution threads was implemented. Access to shared resources and data was controlled through mutual-exclusion mechanisms to prevent race conditions, inconsistencies in the records, and interference between acquisition processes. This architecture allows the UV data logger to operate at a constant sampling frequency of 1 Hz, while the graphical interface associated with the visible spectrometer is updated every 15 ms.
2.2.1. Visible-Spectrum Processing
To obtain reproducible measurements and maintain a consistent relationship between the recorded signal and the incident radiation, the Picamera2 library was used to control the camera acquisition parameters. Through this library, the automatic exposure and gain algorithms of the image signal processor (ISP) were disabled, allowing fixed values to be established for the exposure time and the analog gain of the CMOS sensor. This prevented the camera’s automatic adjustments from modifying the recorded intensity between acquisitions performed under different illumination conditions.
The images, captured at a resolution of 1920 × 1080 pixels, were processed using vectorized operations. First, the image-intensity component was extracted, and the chrominance information was discarded, producing a two-dimensional matrix representative of the spatial intensity distribution within the region of interest. To reduce the contributions of thermal noise, dark current, and the sensor background level, a reference profile was calculated from a non-illuminated region of the image and dynamically subtracted from the recorded spectral profile.
The corrected intensity profile was then smoothed using a Savitzky–Golay filter. Unlike a moving-average filter, this method performs local polynomial fitting by least squares, thereby attenuating high-frequency fluctuations without significantly altering the shape, amplitude, or position of the spectral maxima. Finally, the PeakUtils library analyzed the filtered profile using minimum-amplitude and spatial-separation criteria, allowing the pixel coordinates corresponding to the maximum spectral intensities to be automatically identified.
2.2.2. UV-Radiation Processing
Ultraviolet-radiation measurements were acquired using the AS7331 sensor, whose communication through the I2C bus was managed in an independent execution thread to prevent interruptions in visible-spectrum processing. Access to the sensor was controlled through a mutual-exclusion mechanism, ensuring that only one process read the device at any given time.
The digital counts corresponding to the UVA, UVB, and UVC channels were converted into irradiance values, expressed in mW/cm2, using the calibration equations implemented in the software. The system includes a data-saving function that stores the calibrated irradiance values and the sensor-derived UV index at a sampling frequency of 1 Hz over 30 s intervals. Each measurement is associated with a timestamp and stored in a CSV file without interrupting the acquisition or processing of the visible-spectrometer images.
2.2.3. Ultraviolet Index Calculation
The ultraviolet radiation index was calculated from the UVB-radiation measurements by applying the erythemal action spectrum weighting established by the International Commission on Illumination (CIE), using the mathematical derivation proposed by McKenzie [24]. Considering that UVB radiation has the greatest erythemal effectiveness, the UVI was calculated from the measured irradiance using the standardized relationship:
where the constant 40 represents the conversion to global index units, and 7.55 represents the erythemal-spectrum weighting factor for solar zenith angles below 70∘.
2.3. Calibration
The calibration procedure was based on the direct-comparison method. The readings obtained with the developed spectrometer were compared with those of a reference spectrometer at the same instant while both instruments measured the same light source.
The reference instrument was a Black Comet C-SR-50 spectrometer equipped with an F600-UVvis-SR fiber-optic cable. This instrument has an accuracy of ±5% and has a certificate of irradiance calibration with number #22013122-UVVIS-CR2, the instrument was calibrated by StellarNet Inc. During the measurements, the reference spectrometer was configured with an integration time of 15 ms and an averaging rate of 10 measurements per reported reading.
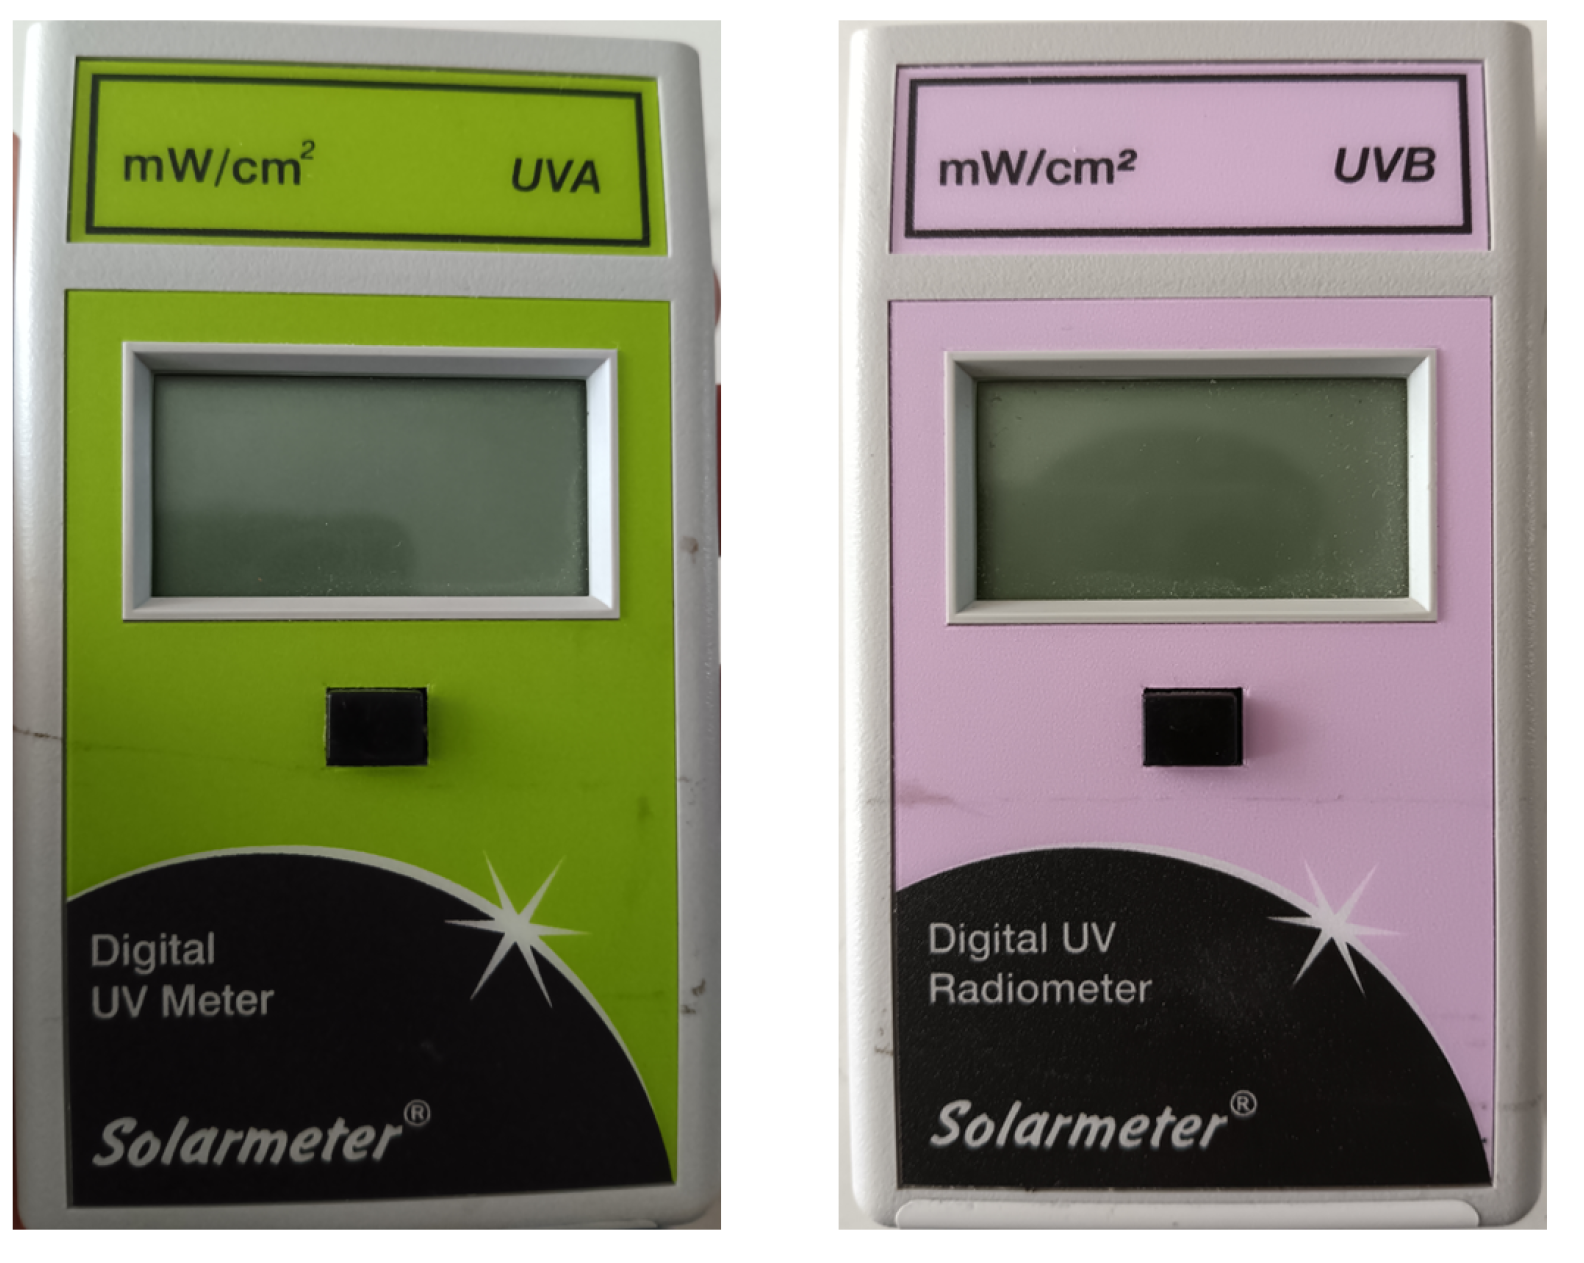
Two commercial UV-radiation meters were also used: one for measuring UVA radiation and the other for measuring UVB radiation. Both instruments have an accuracy of ±10%.
Figure 1.
Spectrometer Black Comet C-SR-50t (Computational Physics and Solar Energy Lab).
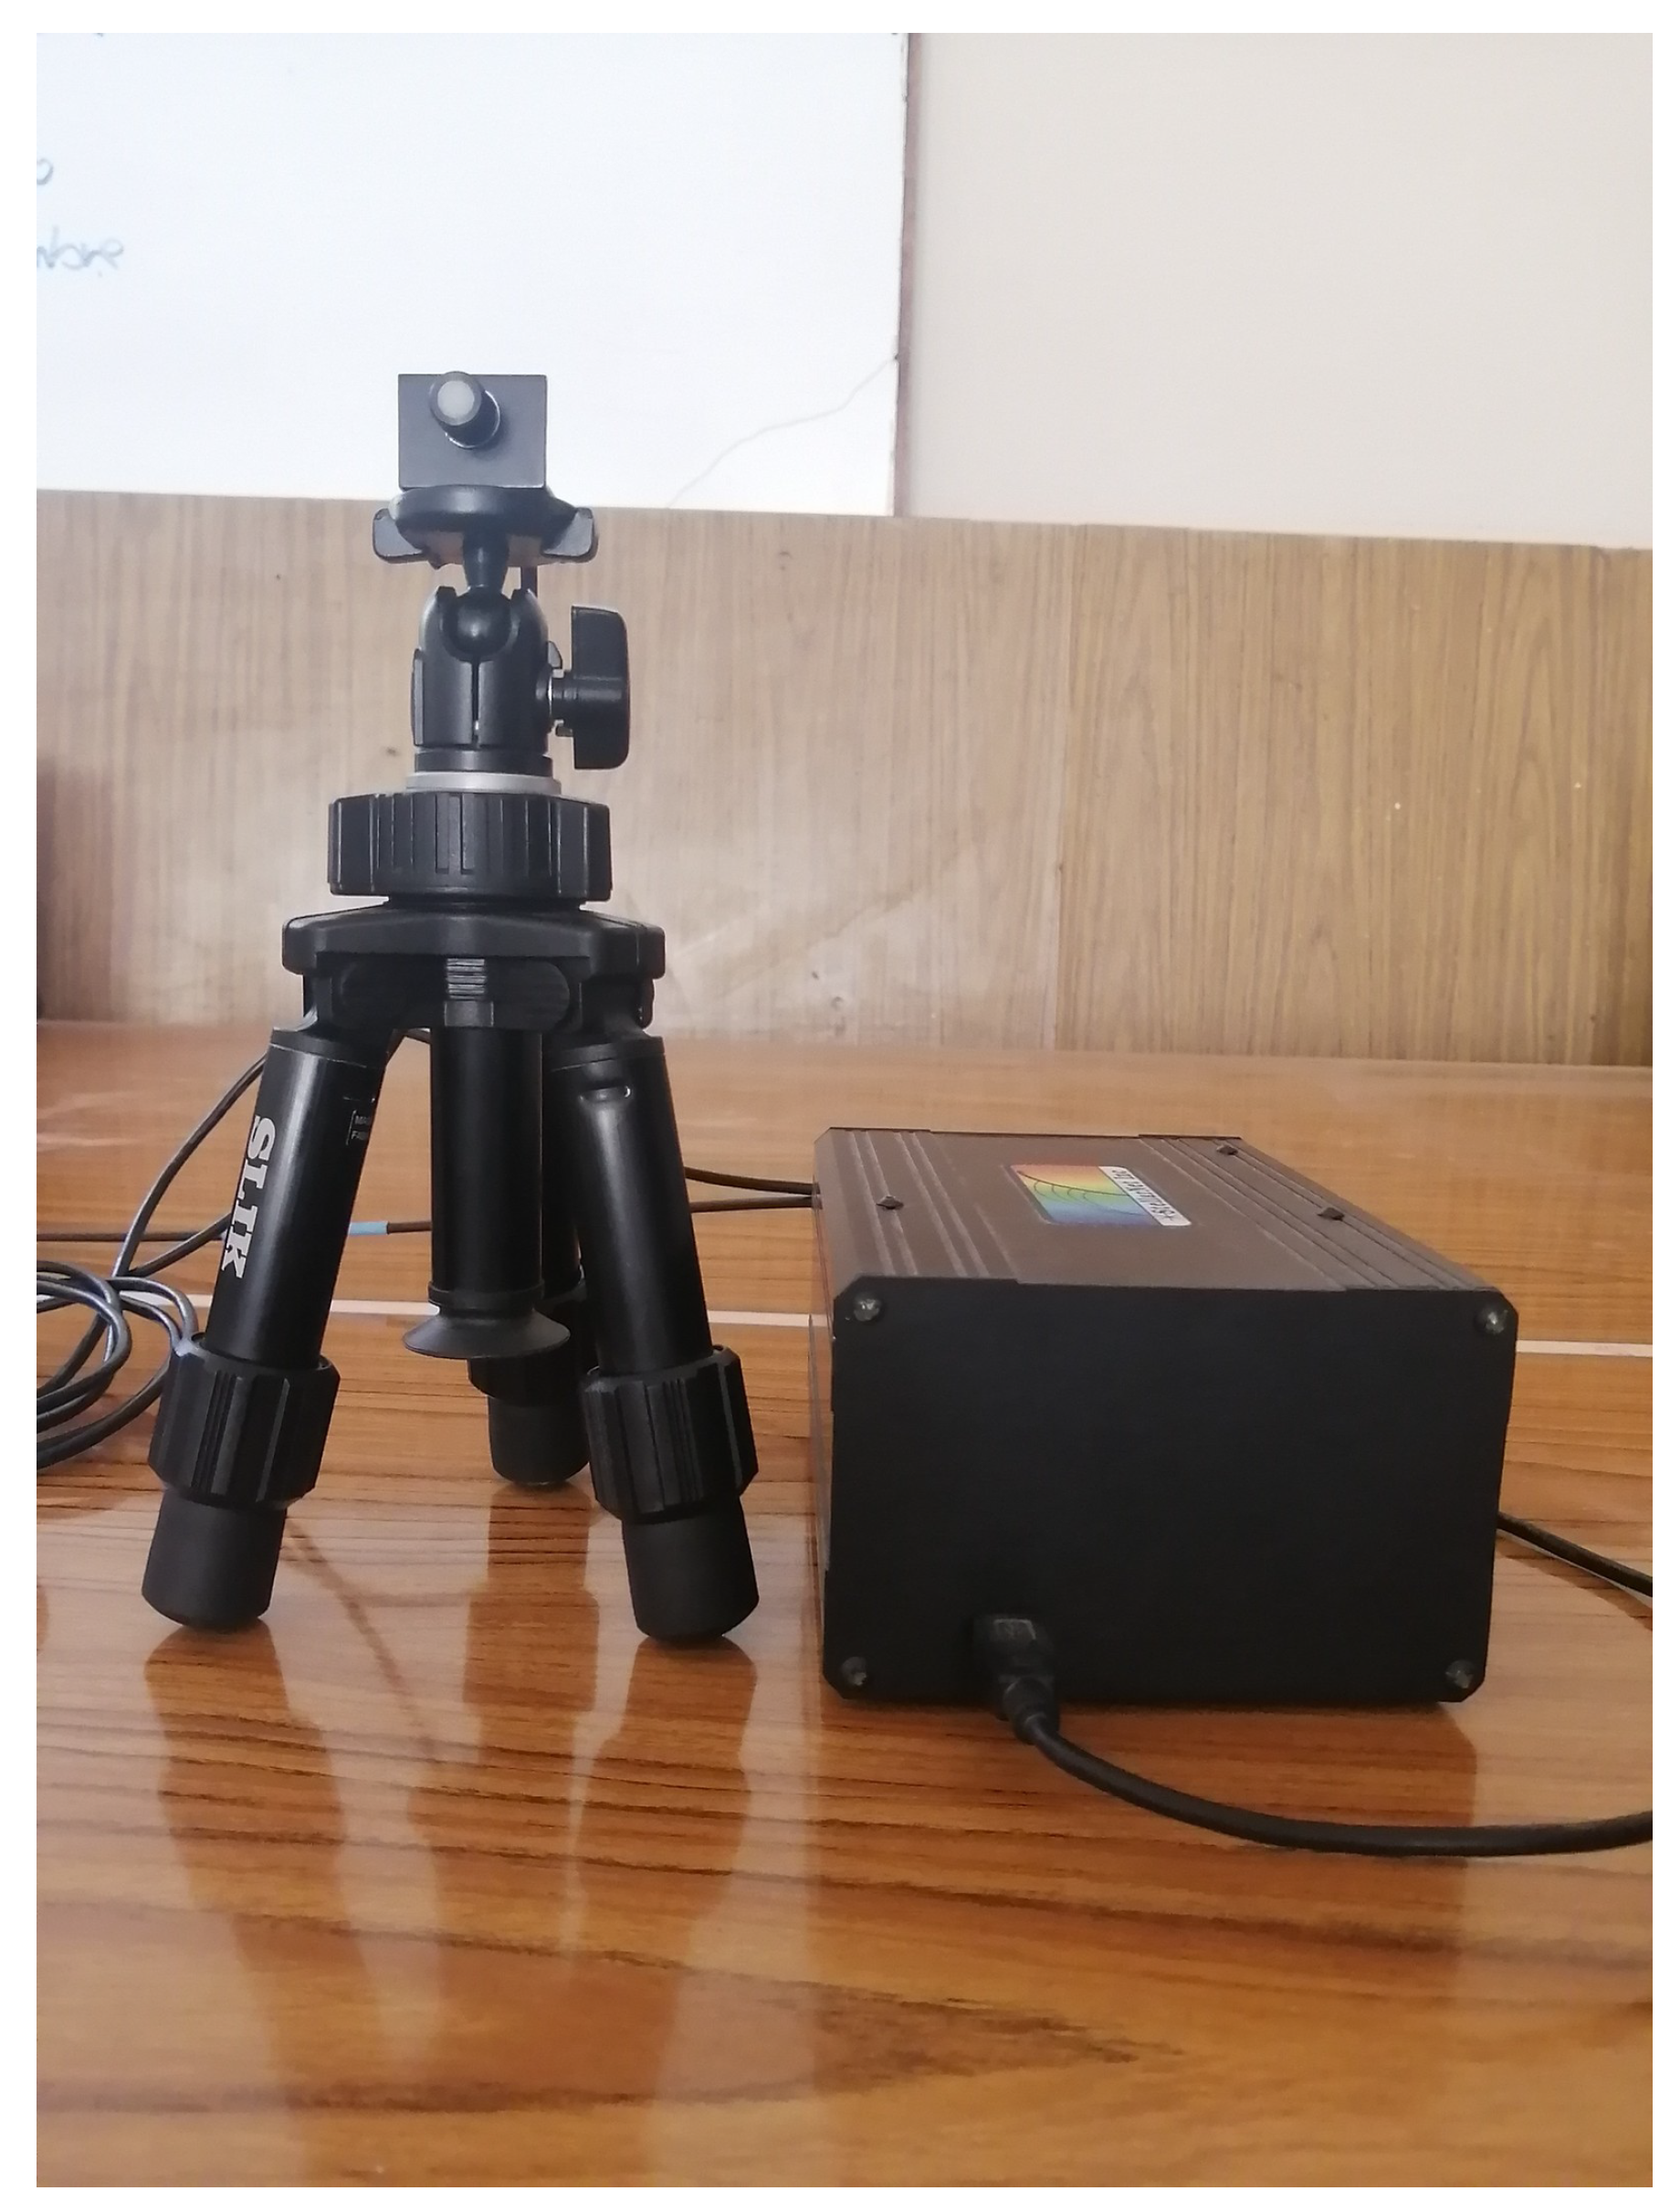
Figure 2.
UVA meter model 4.0 and UVB meter model 6.0 (Computational Physics and Solar Energy Lab).
The uncertainty calculation was performed following the guidelines of the Guide to the Expression of Uncertainty in Measurement (GUM).
2.3.1. Wavelength Calibration
The equipment’s software correlates the intensity positions of the received signals with a specific pixel. This pixel, in turn, is associated with a wavelength by the software through interpolation using two fixed points. To achieve this, the software allows two known pixels to be associated with two wavelengths.
To perform the wavelength adjustment with the camera image pixels, a mercury spectral lamp was used. This lamp has 4 characteristic peaks in the visible spectrum, which occur at defined wavelengths and do not change over time. These characteristic peaks were measured simultaneously with the reference spectrometer and the constructed spectrometer, and the readings were associated by matching two wavelength-pixel pairs that were entered into the software.
During the adjustment procedure, the focus of the Raspberry Pi camera was permanently fixed, as any modification to this parameter can alter the position and shape of the recorded spectral peaks. Consequently, all subsequent measurements and evaluations were performed while maintaining the same optical configuration established during the initial adjustment.
Once the relationship between pixels and wavelengths was defined, the repeatability and intermediate precision of the instrument in determining the wavelengths corresponding to the characteristic lines of the mercury lamp were evaluated. Repeatability was evaluated through ten consecutive measurements, taken at three-minute intervals and under the same operating conditions.
Reproducibility was evaluated through measurements taken on five different days. Prior to each set of measurements, the instrument was transported and subsequently reinstalled, in order to reproduce the mechanical and alignment conditions associated with its field use.
The mathematical model for the peak position correction is:
Where C represents the correction to the peak position measured by the pilot spectrometer with respect to the measurement taken by the reference spectrometer, represents the contribution of the pilot spectrometer’s repeatability, represents the contribution of the pilot spectrometer’s reproducibility, and represents the changes in position that may occur in the spectrometer due to influence quantities, in this case, the transportation of the instrument.
To evaluate the uncertainty in the geometric correction of the peaks (), the Guide to the Expression of Uncertainty in Measurement (GUM) was applied, modeling the error sources according to the equation:
where Type A components were considered, derived from repeatability tests (10 measurement iterations at 3-minute intervals) and reproducibility (measurements over 5 days), as well as Type B components associated with the resolution of the instruments, source stability, and alignment tolerances after simulating transportation perturbations (influence quantities).
2.3.2. Radiometric Calibration of Visible Irradiance
To transform the digital counts of the constructed spectrometer into spectral irradiance units (), measurements of the solar spectrum in the city of Arequipa were taken from 12:00 pm to 2:00 pm over three days. Direct solar radiation was measured under clear skies at the same instant in time with the reference spectrometer and the pilot spectrometer.
Since both instruments have different optical resolutions, the spectral distribution of the reference equipment was analytically described using a sixth-degree polynomial fit. This smoothed reference model allowed for a one-to-one interpolation with the data matrix of the pilot instrument, deriving the radiometric transformation coefficients (transfer function) necessary to equalize the intensity measurements taken by both instruments.
2.3.3. Ultraviolet Radiometric Calibration
The digital counts from the AS7331 sensor were corrected by comparing these readings with measurements taken by a reference spectrometer, a UVA radiation meter, and a UVB radiation meter at the same instant in time. These measurements were taken over 5 days, during which several pairs of digital counts and irradiance measurements were obtained. A linear regression graph was created to determine the coefficients that allow the transformation of the AS7331 sensor measurements into effective irradiance units ().
The uncertainty of the UV radiation measurement was calculated as follows:
Where is the contribution to the uncertainty due to the resolution of the reference instrument, is the contribution to the uncertainty due to the accuracy of the reference instrument, and is the contribution to the uncertainty due to the residual standard deviation of the linear regression.
2.4. Field Verification of the Spectrometer
Once the adjustment and calibration of the equipment were completed, we proceeded to validate the performance of the pilot instrument in real operating environments. Three locations were selected: the coastal city of Camaná (0 masl), the city of Arequipa (2330 masl), and the Sumbay station (4100 masl). At these locations, the solar spectrum, UVA radiation, UVB radiation, UVC radiation, and the ultraviolet radiation index were measured.
3. Results
3.1. Wavelength Calibration and Adjustment
Figure 3 shows the peak positions of the mercury spectral lamp measured by the pilot spectrometer after the adjustment; the graph demonstrates that the instrument repeats its readings when measuring the same source.
Table 1 shows the correction of the mercury lamp peaks measured by the pilot spectrometer. The evaluated uncertainty includes the contributions due to the instrument’s repeatability, reproducibility, and transportation, and is expressed at a 95% confidence level.
3.2. Intensity Calibration and Adjustment
Figure 4 shows the solar spectrum measured by the reference spectrometer over 3 days from 12:00 pm to 2:00 pm. The city’s spectrum is repeatable and stable, which allows it to be used as a source to perform the intensity corrections for the pilot spectrometer.
Figure 5 shows the solar spectrum measured by the pilot spectrometer. The measurements were taken with an integration time of 100 ms, and the measured spectrum is repeatable, just like the measurements taken by the reference spectrometer.
Figure 6 shows the interpolation curve used to define the behavior of the solar spectrum in the city of Arequipa. Its behavior is described by Equation 5, a sixth-degree polynomial equation.
where is expressed in W m−2 m−1 and in m.
Figure 7 shows the correction of the spectrum measured by the pilot spectrometer compared to the spectrum measured by the reference spectrometer. The total irradiance under the curve of the corrected spectrometer is and the total irradiance under the curve of the reference spectrometer is , which shows that the pilot spectrometer presents a deviation of after applying the adjustment.
3.3. UV Radiation Calibration and Adjustment
Digital count transformation curves
UVA Meter
This equation has a linear regression coefficient
Figure 8.
UVA radiation adjustment curve – reference commercial UVA meter.
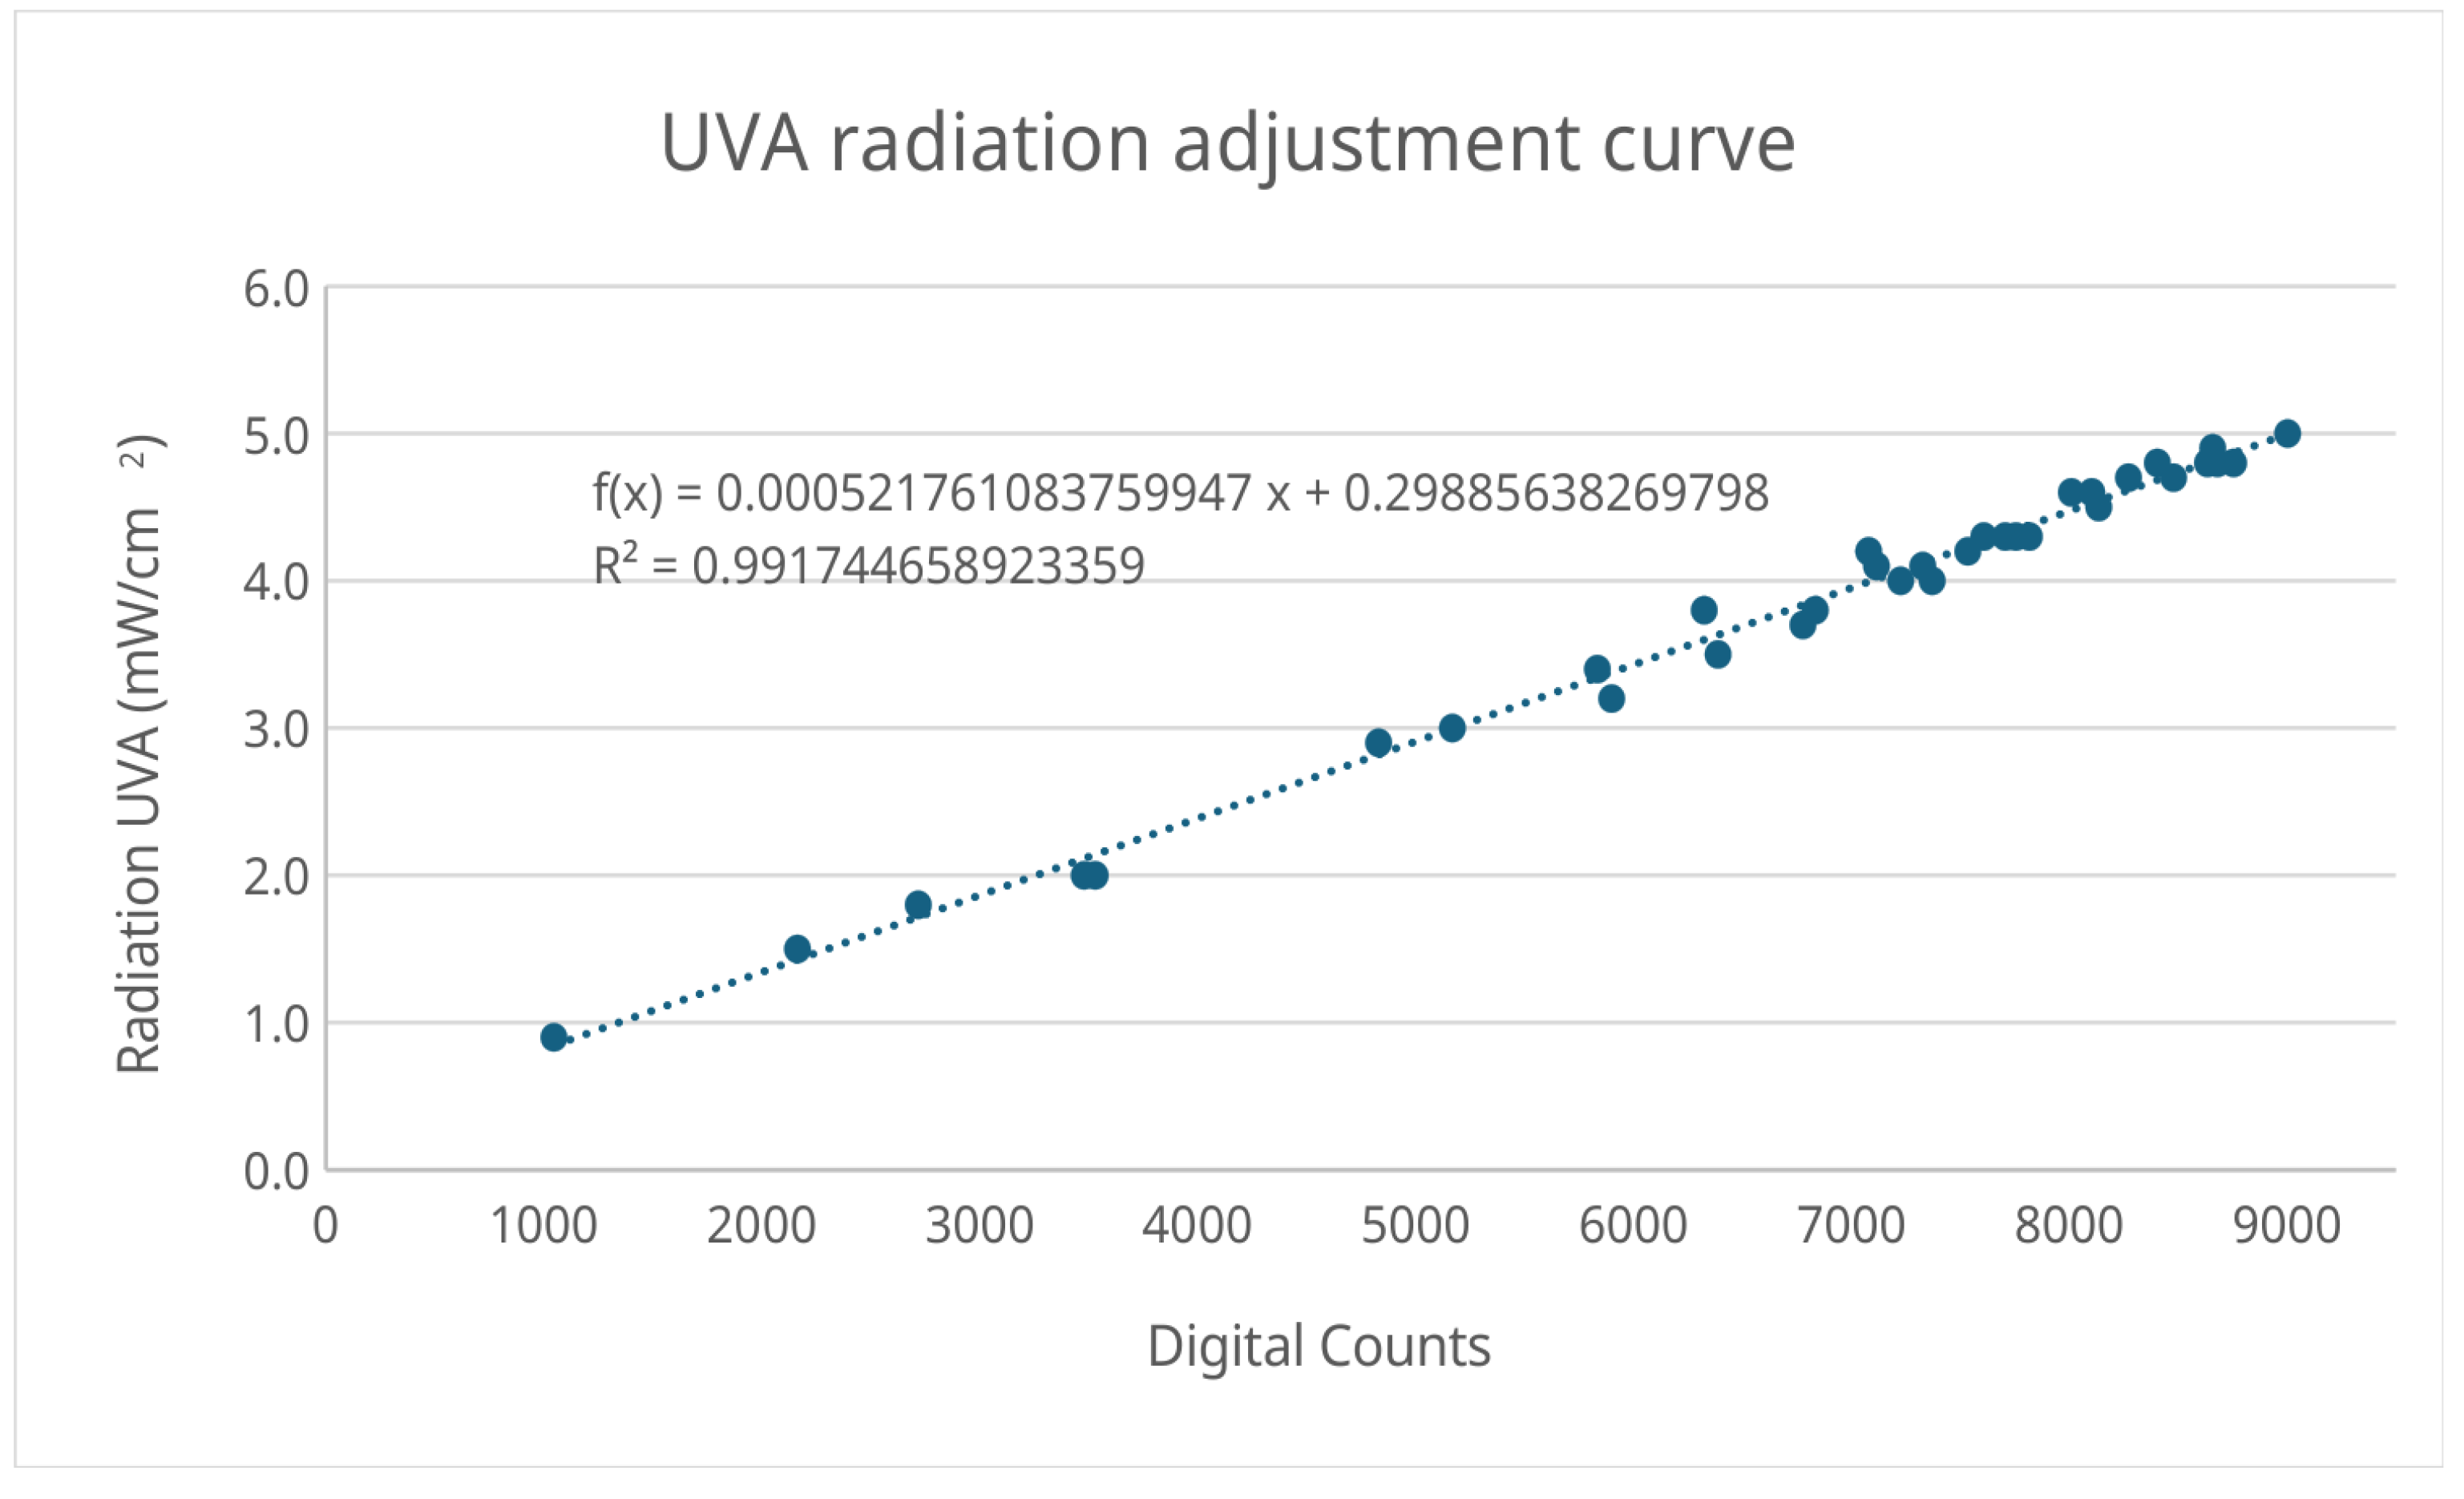
Figure 9.
UVB radiation adjustment curve – reference commercial UVB meter.
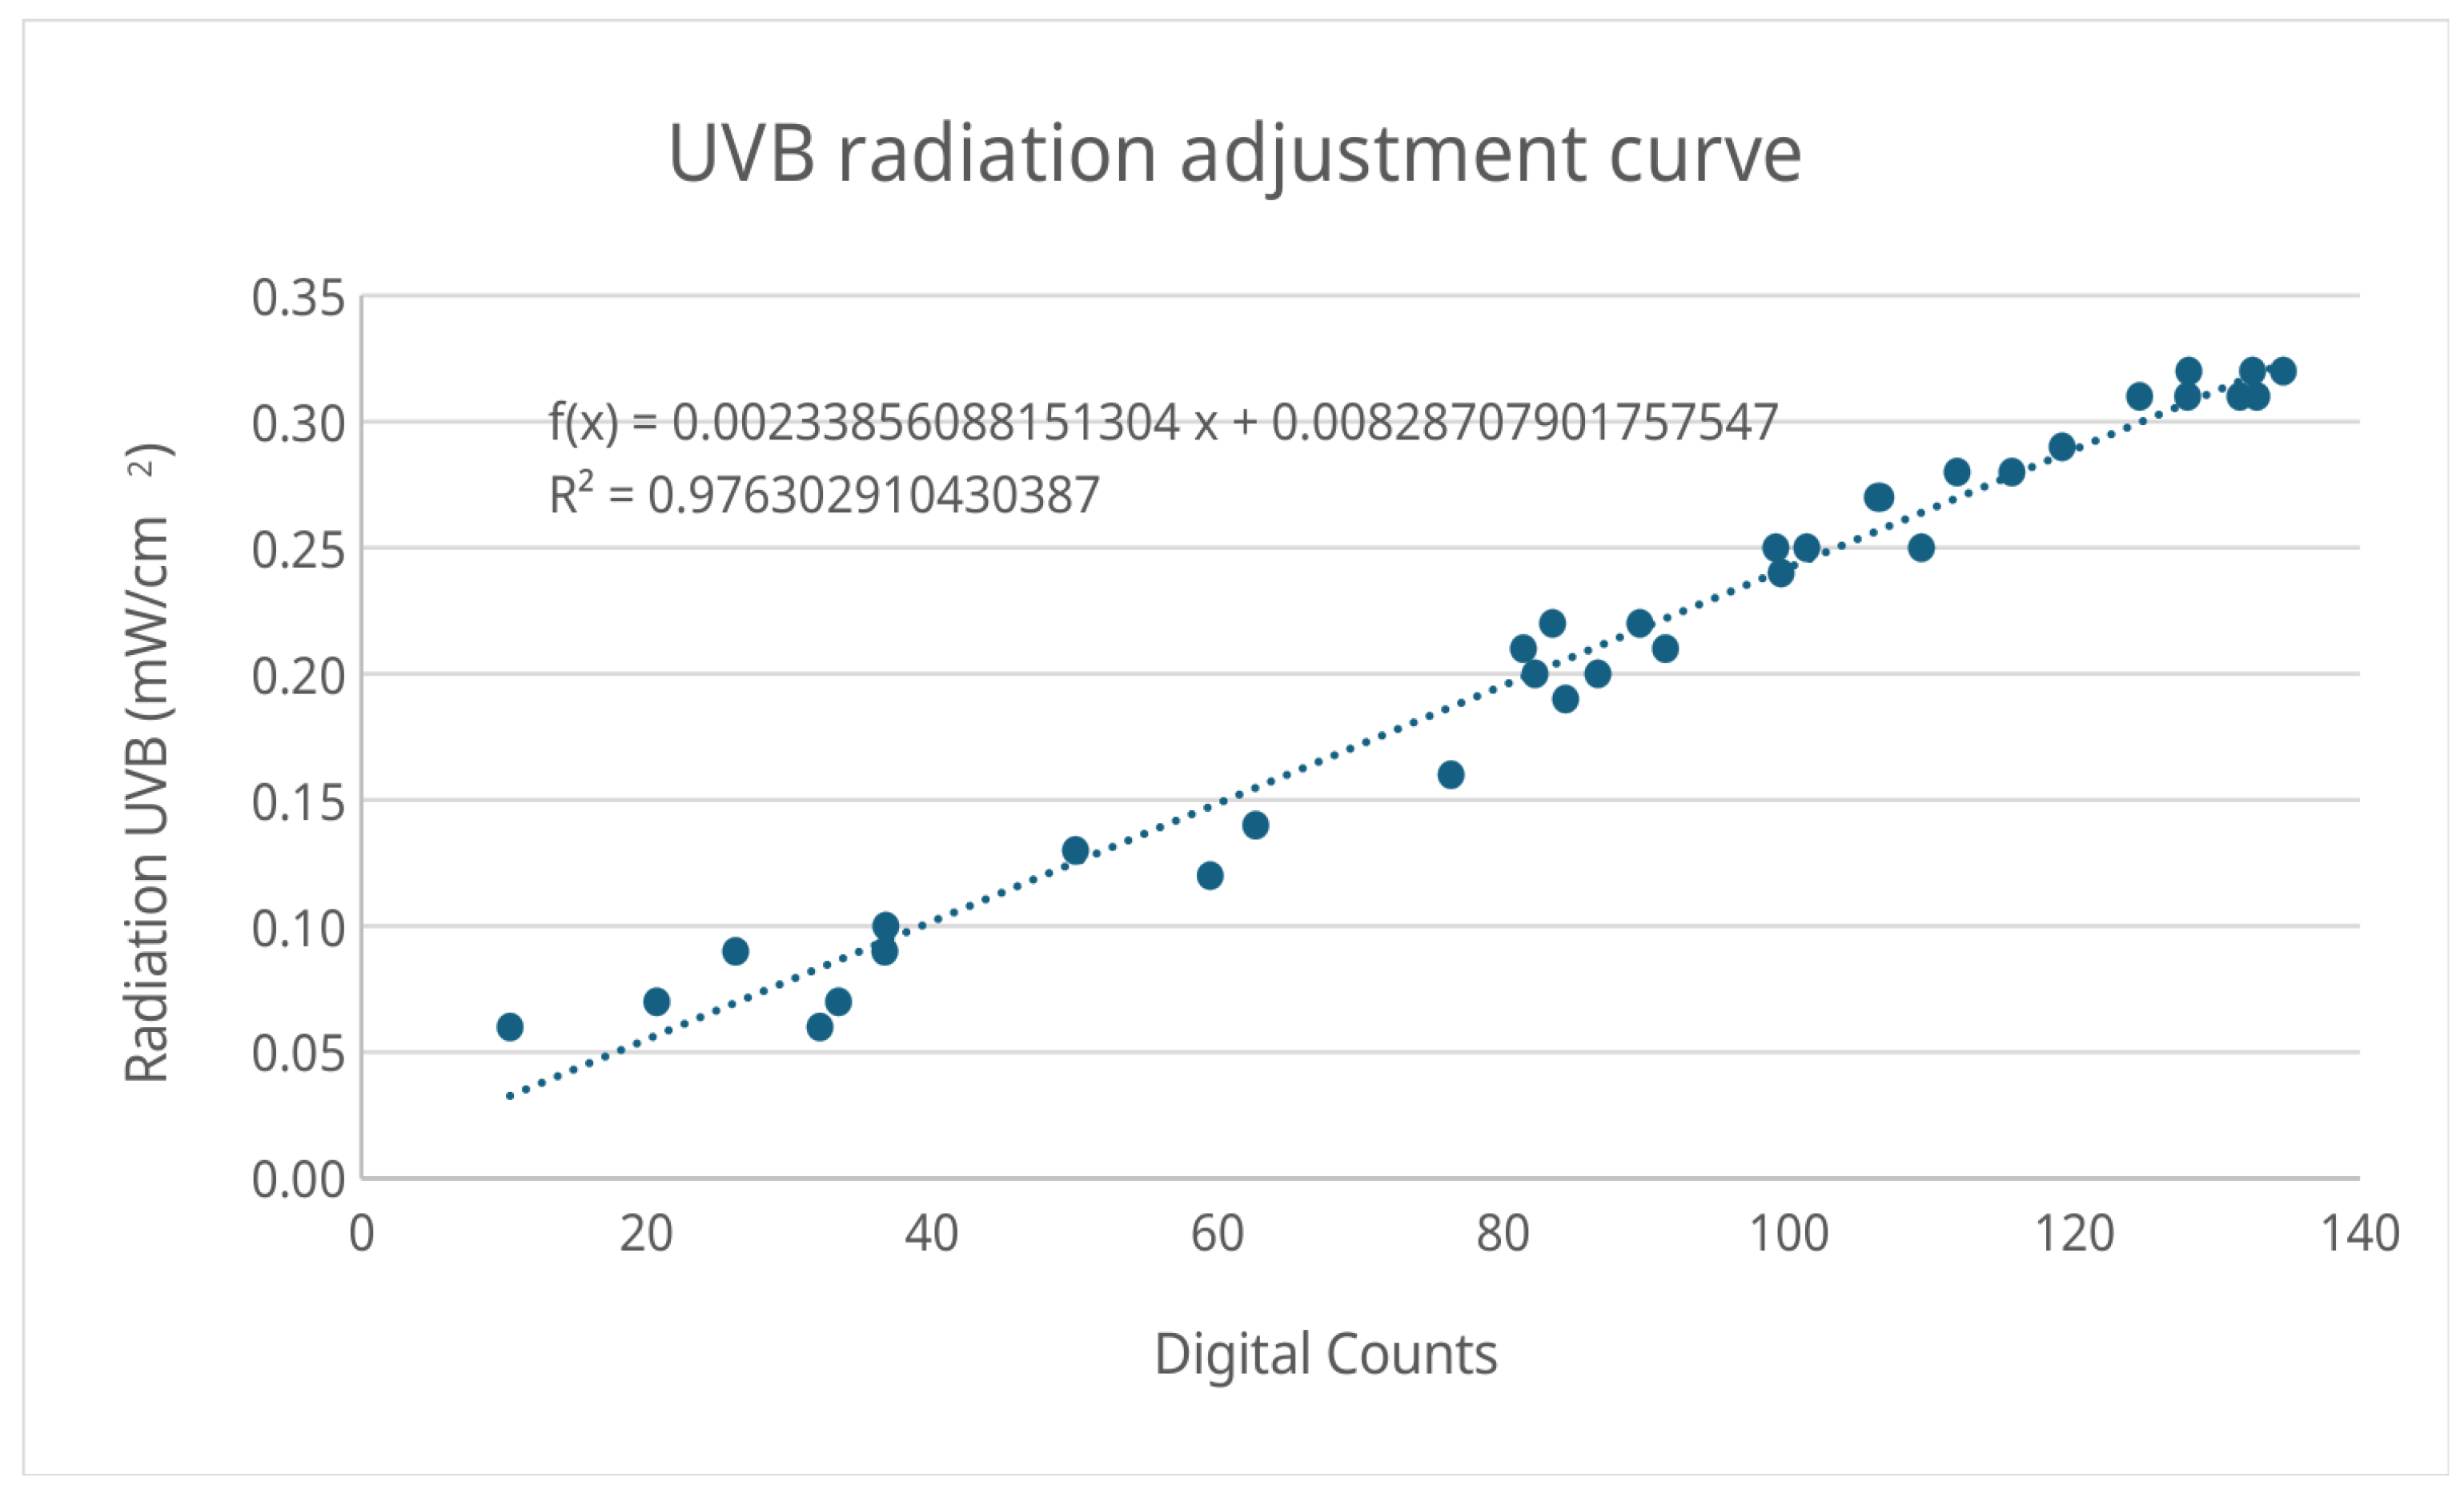
Figure 10.
UVA radiation adjustment curve – reference Black Comet spectrometer.
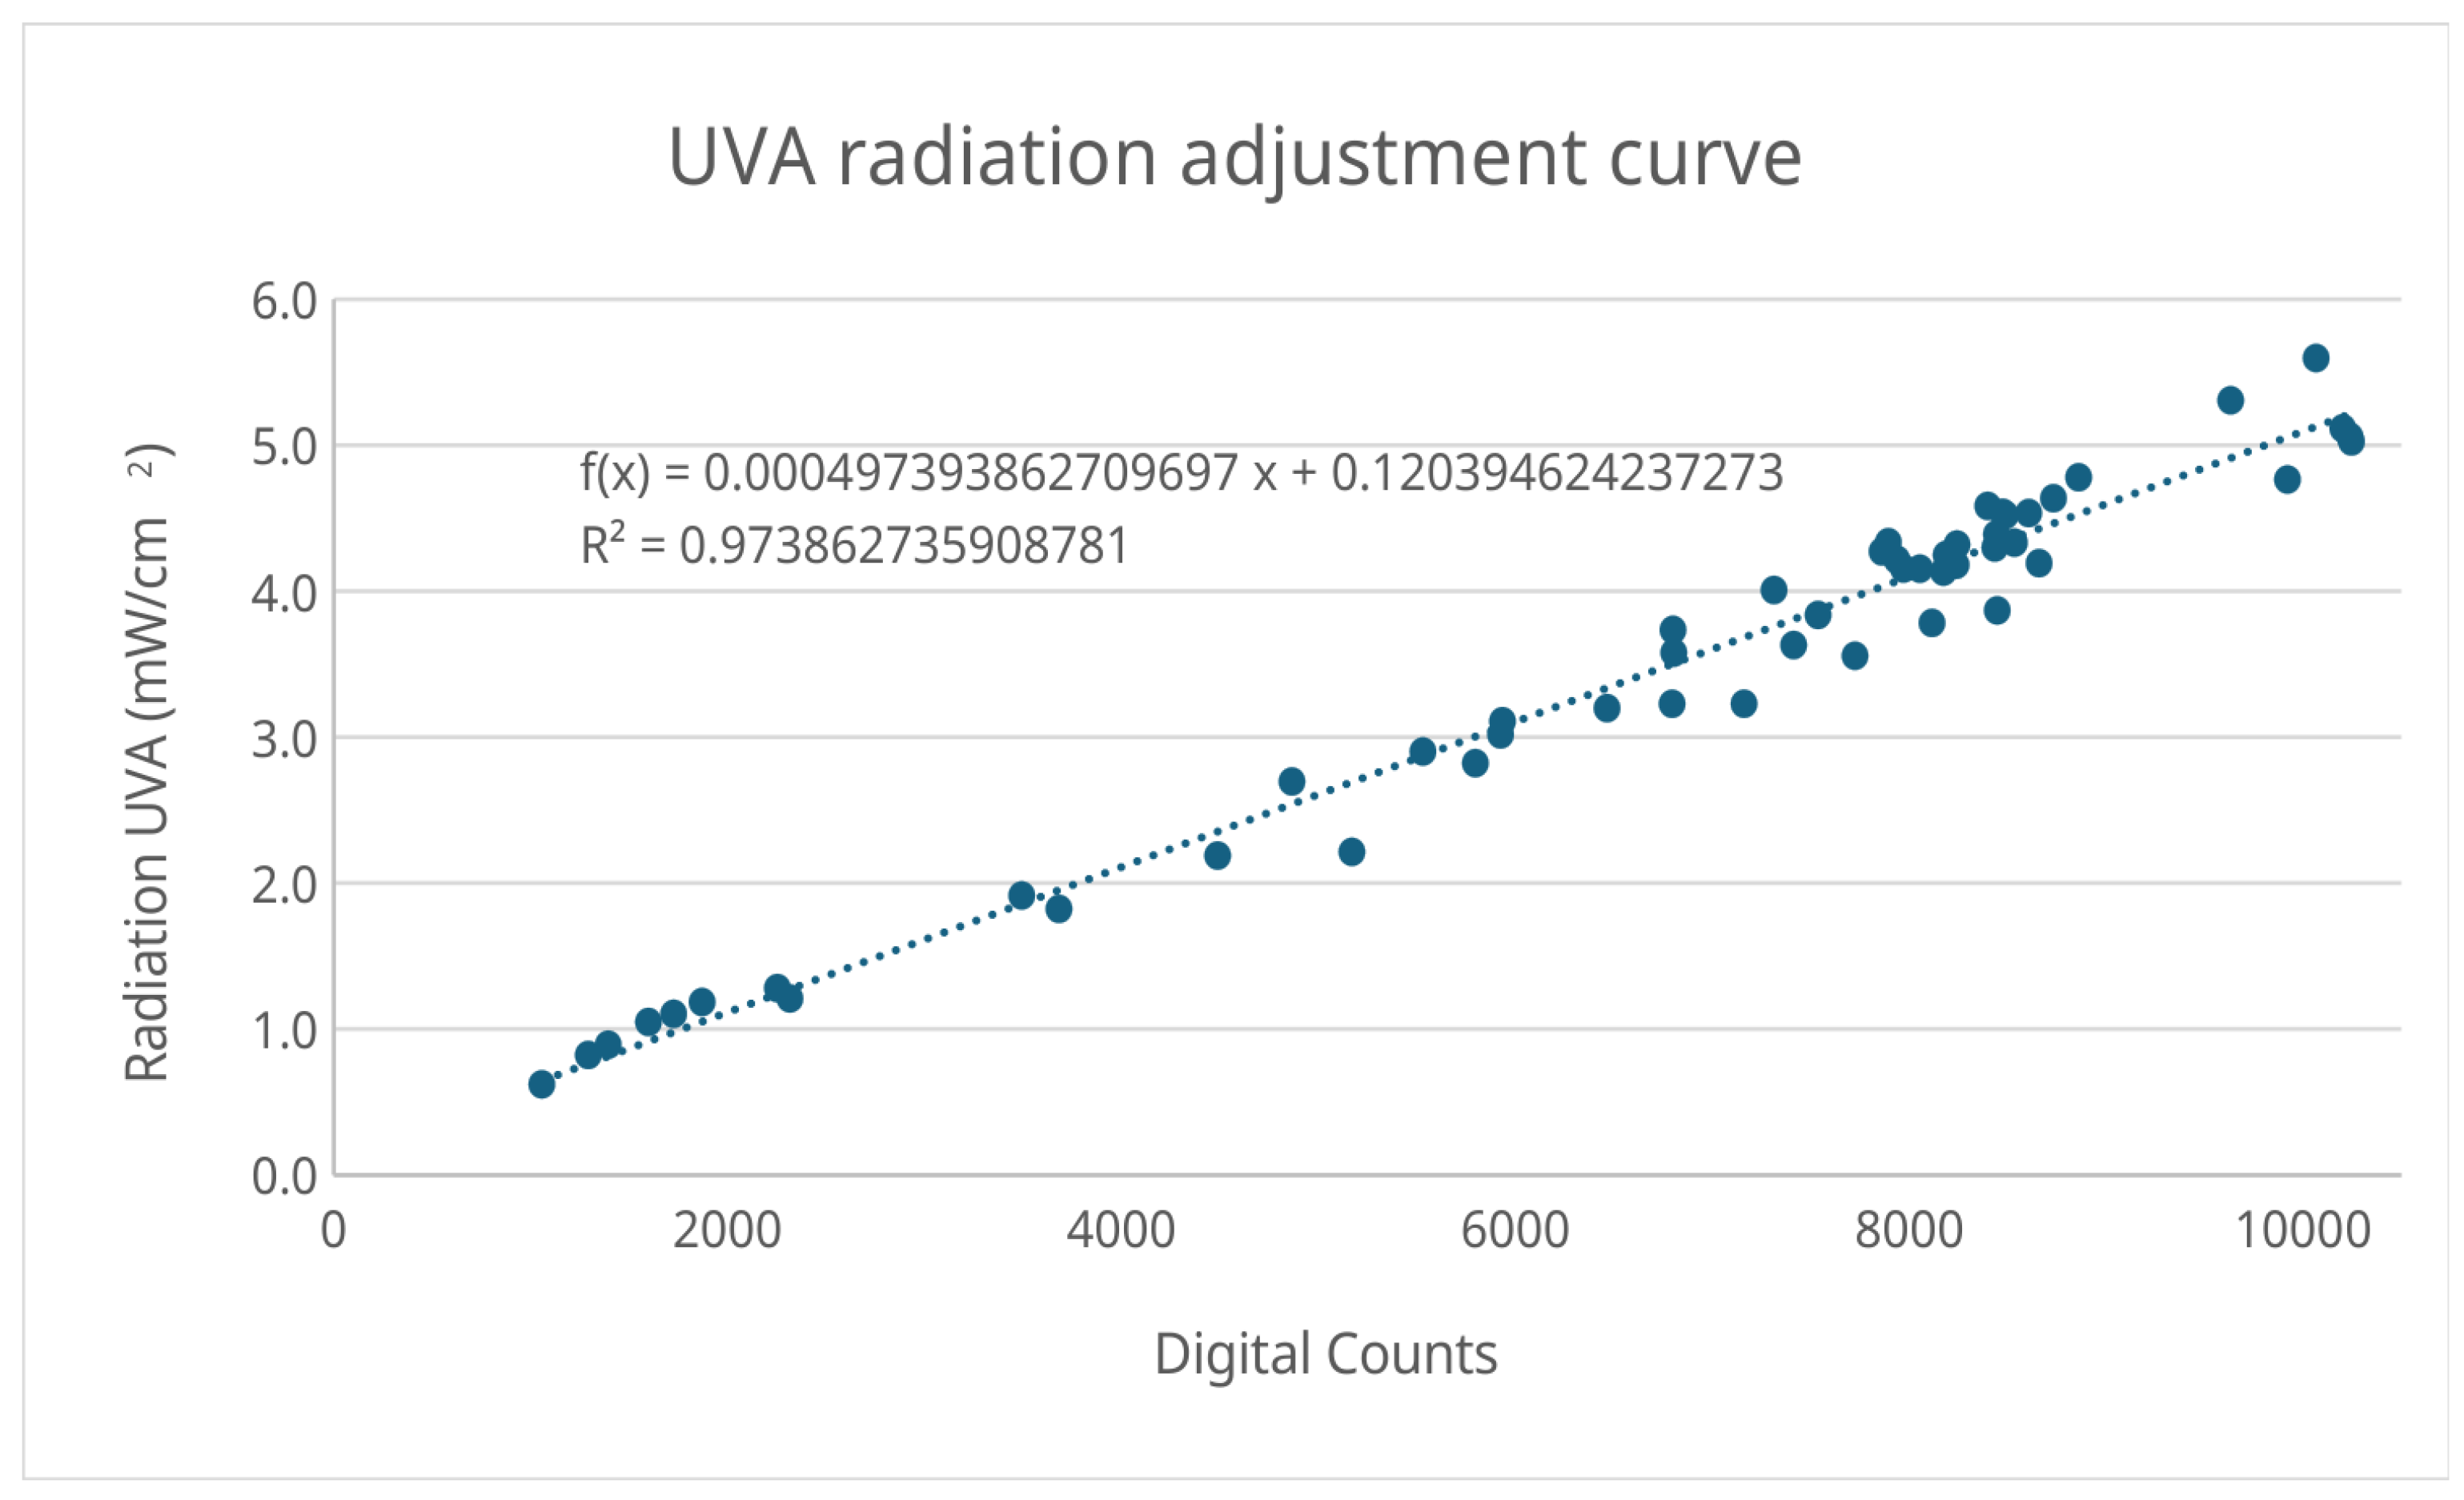
Figure 11.
UVB radiation adjustment curve – reference Black Comet spectrometer.
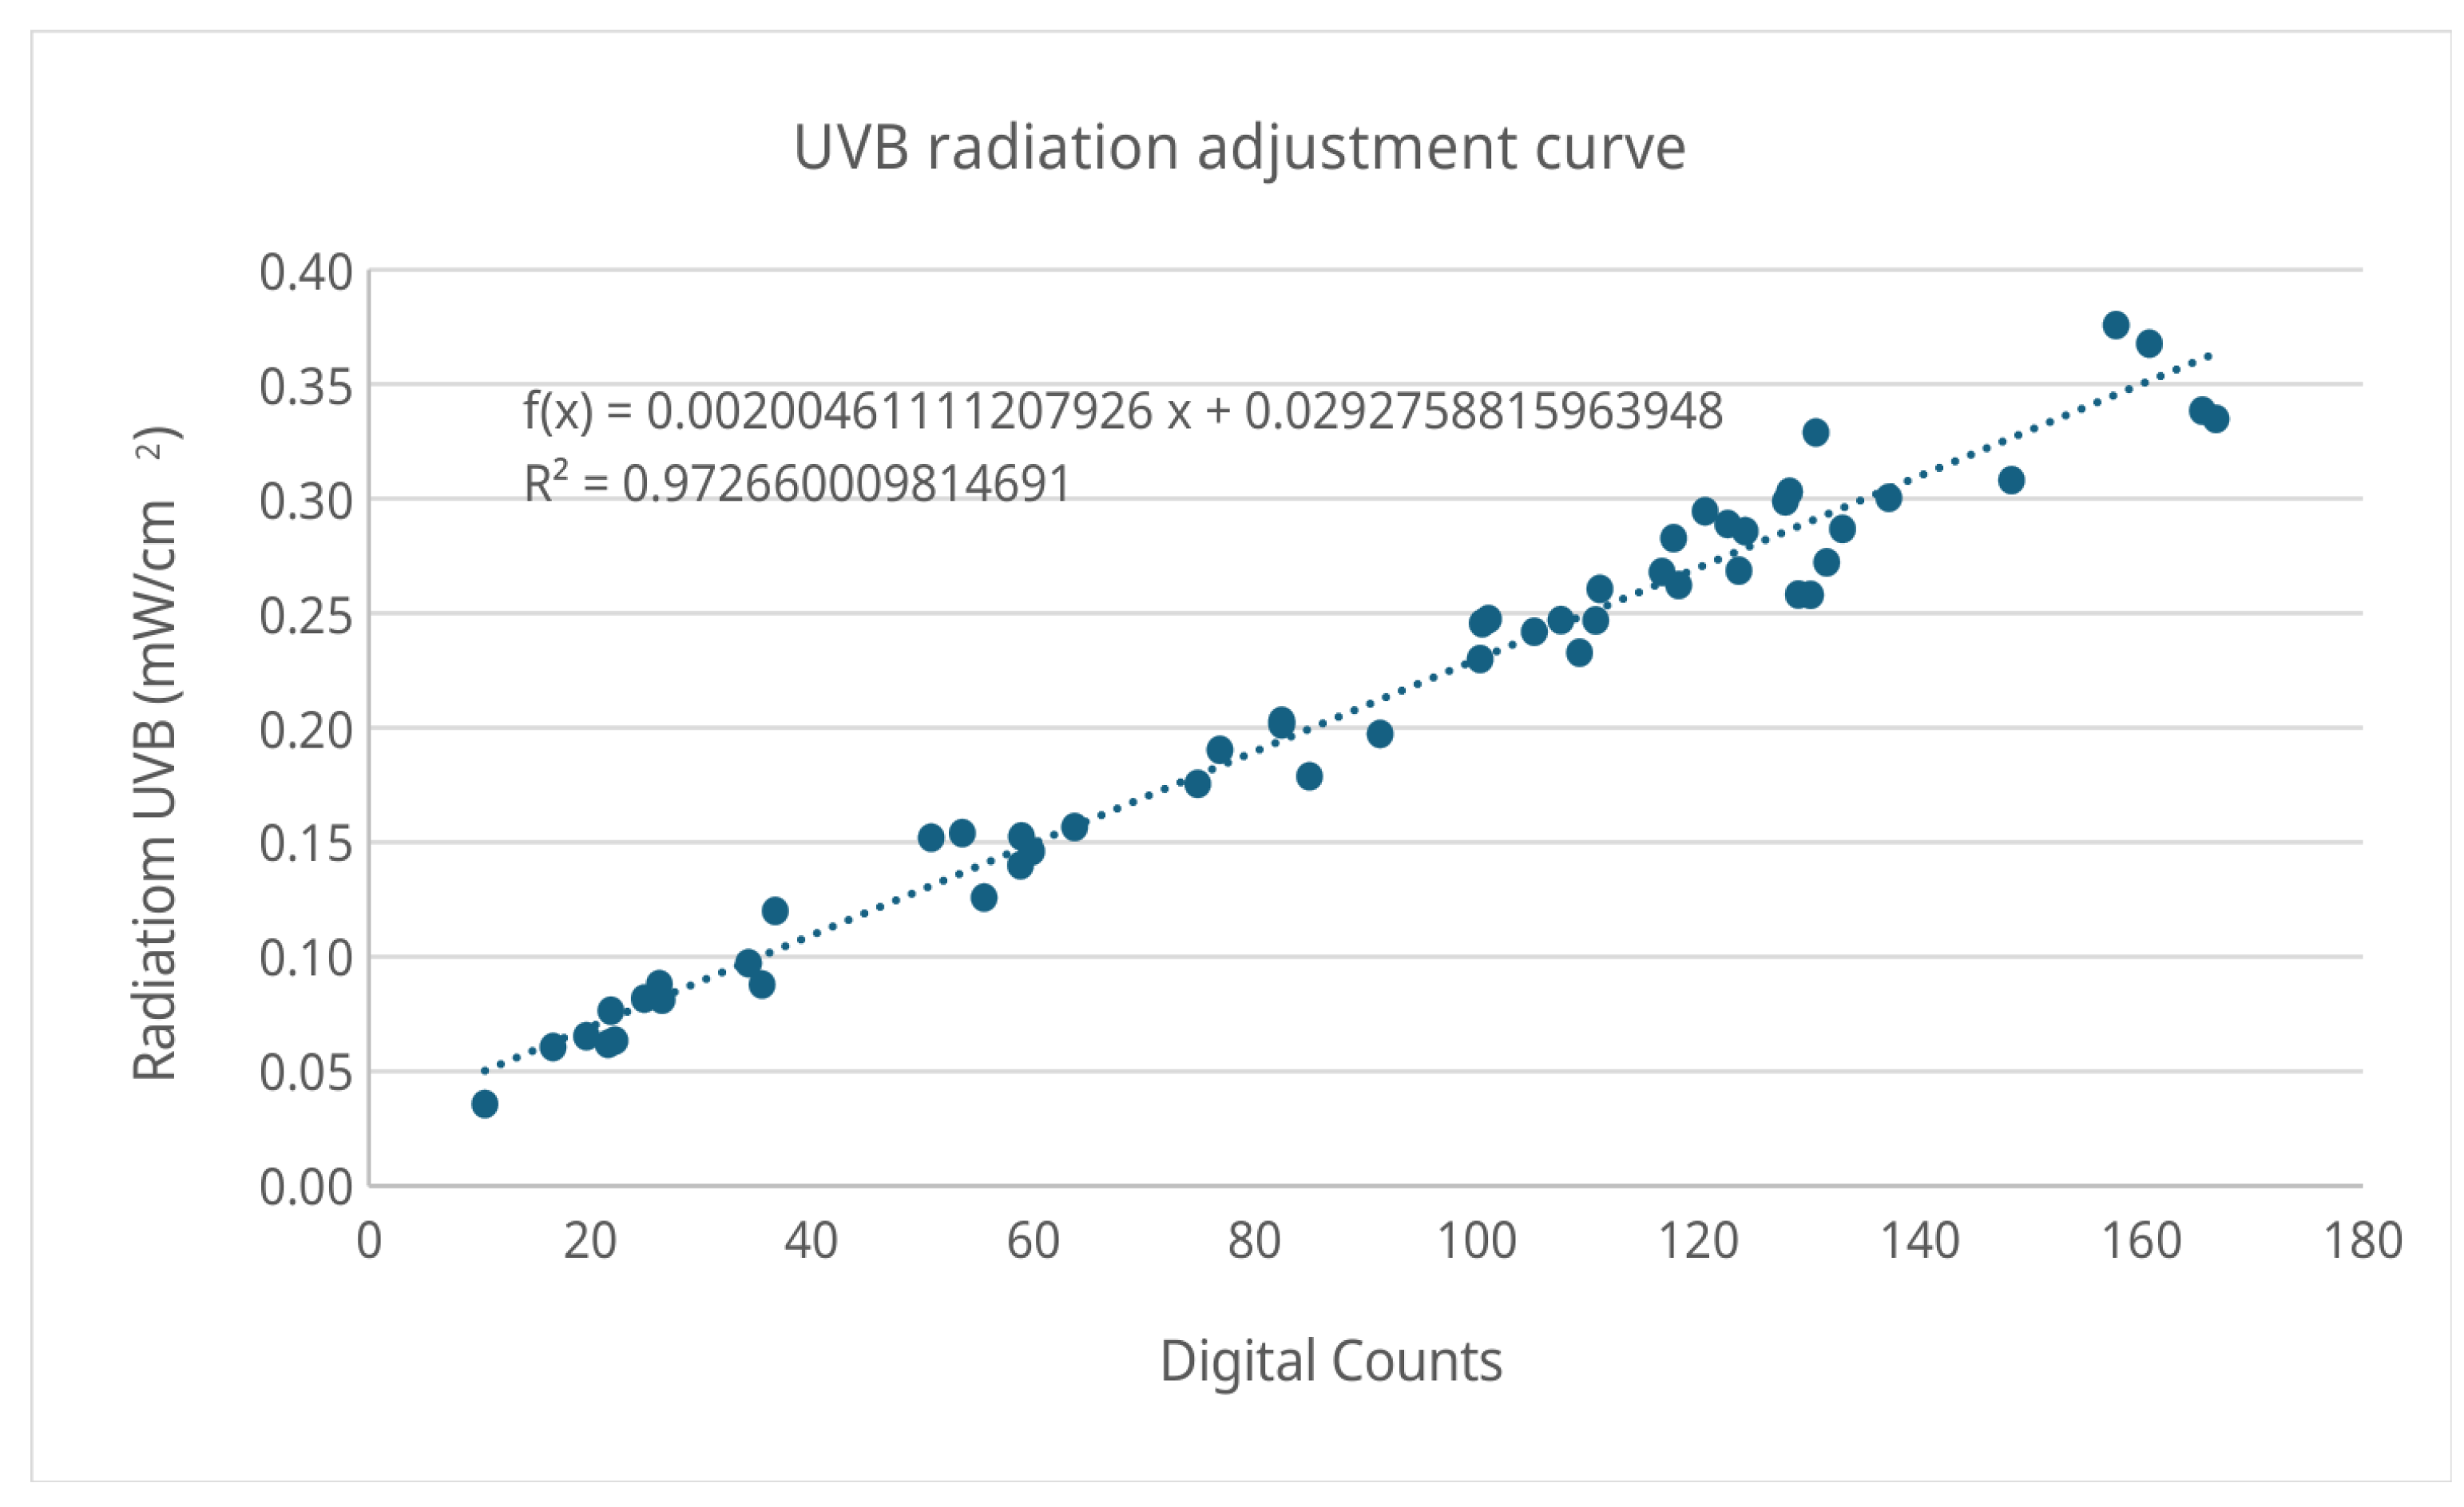
Figure 12.
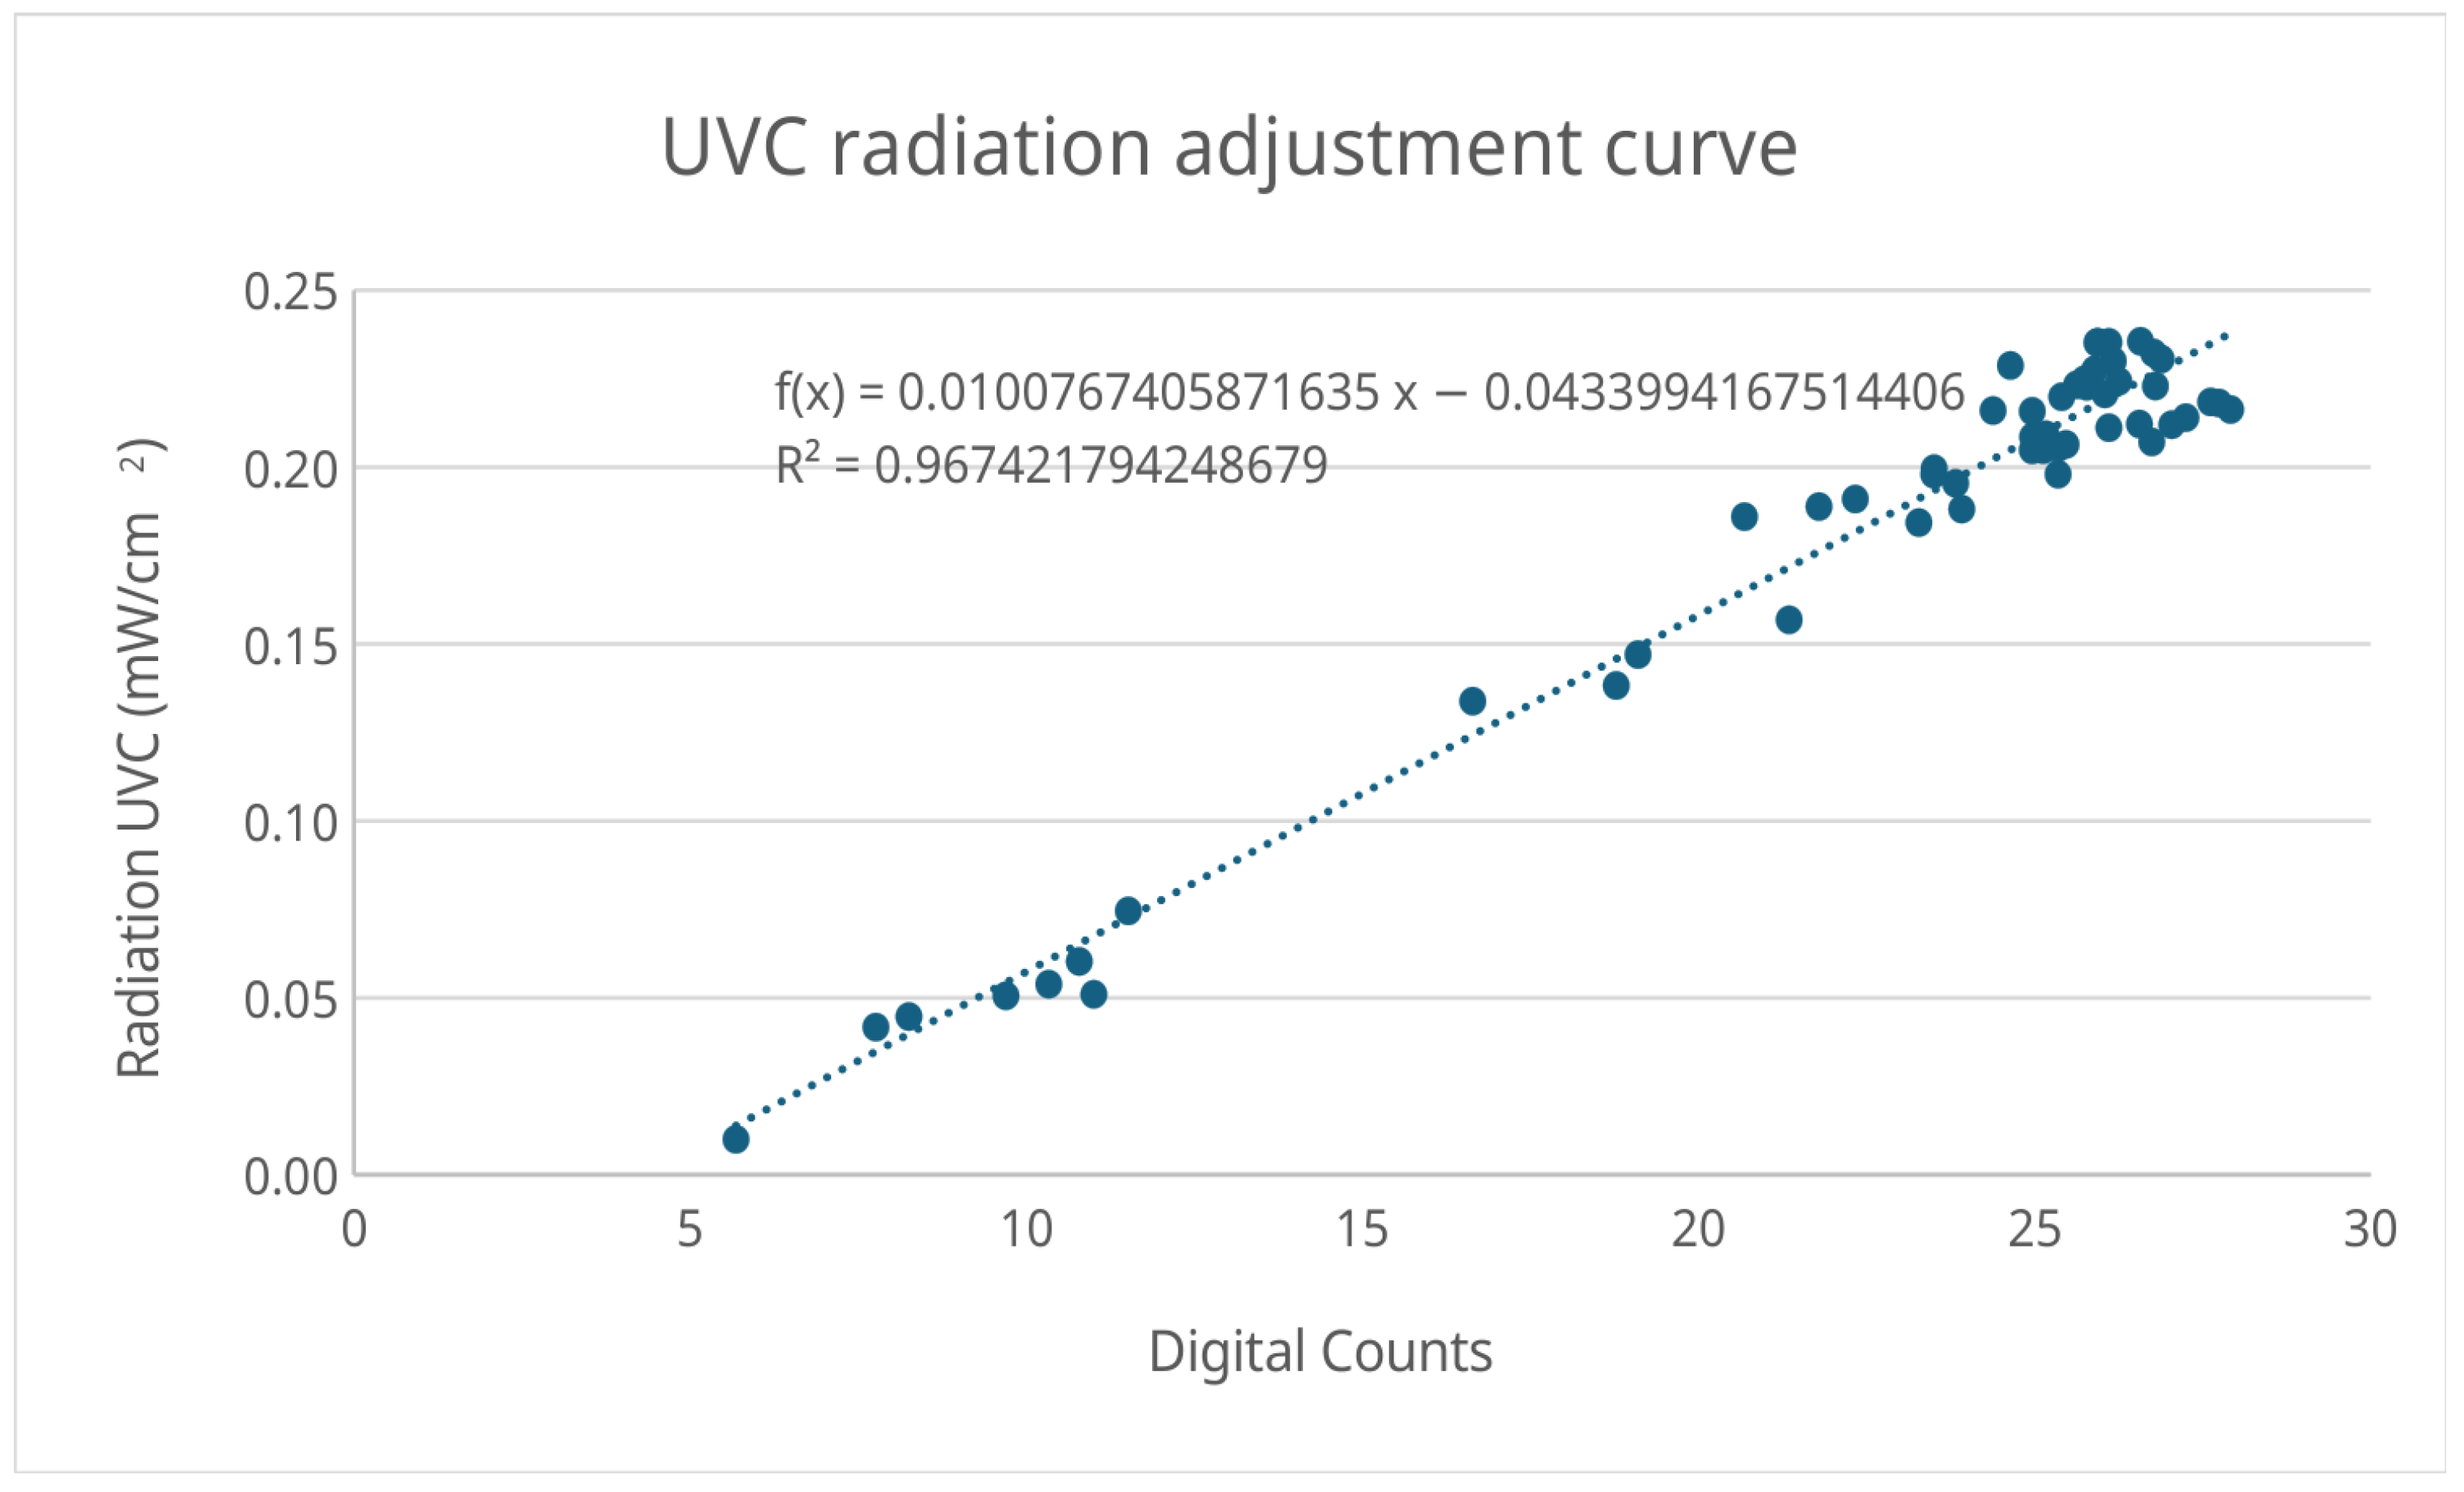
UVC radiation adjustment curve – reference Black Comet spectrometer.
Applying the residual standard deviation equation, the uncertainty of the linear regression is:
UVB Meter
This equation has a linear regression coefficient
Applying the residual standard deviation equation, the uncertainty of the linear regression is:
Black Comet – UVA
This equation has a linear regression coefficient
Applying the residual standard deviation equation, the uncertainty of the linear regression is:
Black Comet – UVB
This equation has a linear regression coefficient
Applying the residual standard deviation equation, the uncertainty of the linear regression is:
Black Comet – UVC
This equation has a linear regression coefficient
Applying the residual standard deviation equation, the uncertainty of the linear regression is:
3.4. Measurements
3.4.1. Solar Spectrum Measurements
Figure 13 shows the comparison between the adjusted spectrum measured by the pilot spectrometer versus the spectrum measured by the reference spectrometer in the city of Camaná. The total irradiance under the curve of the corrected pilot spectrometer is and the total irradiance under the curve of the reference spectrometer is , which shows that the pilot spectrometer presents a deviation of after applying the adjustment.
Figure 14 shows the comparison between the adjusted spectrum measured by the pilot spectrometer versus the spectrum measured by the reference spectrometer in the city of Arequipa. The total irradiance under the curve of the corrected spectrometer is and the total irradiance under the curve of the reference spectrometer is , which shows that the pilot spectrometer presents a deviation of after applying the adjustment.
Figure 15 shows the comparison between the adjusted spectrum measured by the pilot spectrometer versus the spectrum measured by the reference spectrometer. The total irradiance under the curve of the corrected pilot spectrometer is and the total irradiance under the curve of the reference spectrometer is , which shows that the pilot spectrometer presents a deviation of after applying the adjustment.
3.4.2. UV Radiation Measurements
Figure 16 shows the maximum values of the ultraviolet radiation index measured in the three locations. It can be observed that Sumbay presents the highest UVI, reaching values of 21, which is extremely harmful to the health of high-Andean populations living in locations at similar altitudes.

Table 2.
Comparison of UVA radiation measurement results – Black Comet reference spectrometer.
| Location | Reference UVA (mW/cm2) | Pilot UVA (mW/cm2) | Uncertainty (mW/cm2) |
|---|---|---|---|
| Camaná | 1.2 | 1.05 | 0.44 |
| Arequipa D1 | 4.3 | 4.37 | 0.50 |
| Arequipa D2 | 4.8 | 4.53 | 0.52 |
| Sumbay | 5.2 | 5.21 | 0.53 |
Table 3.
Comparison of UVB radiation measurement results – Black Comet reference spectrometer.
| Location | Reference UVB (mW/cm2) | Pilot UVB (mW/cm2) | Uncertainty (mW/cm2) |
|---|---|---|---|
| Camaná | 0.09 | 0.08 | 0.031 |
| Arequipa D1 | 0.29 | 0.28 | 0.035 |
| Arequipa D2 | 0.30 | 0.30 | 0.035 |
| Sumbay | 0.34 | 0.36 | 0.036 |
Table 4.
Comparison of UVC radiation measurement results – Black Comet reference spectrometer.
| Location | Reference UVC (mW/cm2) | Pilot UVC (mW/cm2) | Uncertainty (mW/cm2) |
|---|---|---|---|
| Camaná | 0.06 | 0.06 | 0.023 |
| Sumbay | 0.23 | 0.24 | 0.026 |
| Arequipa D2 | 0.23 | 0.23 | 0.026 |
| Arequipa D1 | 0.24 | 0.24 | 0.026 |
Table 5.
Comparison of UVA radiation measurement results – reference UVA meter.
| Location | Reference UVA (mW/cm2) | Pilot UVA (mW/cm2) | Uncertainty (mW/cm2) |
|---|---|---|---|
| Camaná | 1.3 | 1.27 | 0.28 |
| Arequipa D1 | 4.8 | 4.76 | 0.53 |
| Arequipa D2 | 4.9 | 4.92 | 0.51 |
| Sumbay | 5.4 | 5.64 | 0.57 |
Table 6.
Comparison of UVB radiation measurement results – reference UVB meter.
| Location | Reference UVB (mW/cm2) | Pilot UVB (mW/cm2) | Uncertainty (mW/cm2) |
|---|---|---|---|
| Camaná | 0.13 | 0.07 | 0.0309 |
| Arequipa D1 | 0.30 | 0.30 | 0.0380 |
| Arequipa D2 | 0.33 | 0.33 | 0.0405 |
| Sumbay | 0.38 | 0.40 | 0.0446 |
Table 7.
Comparison of ultraviolet radiation index measurements.
| Location | UVI |
|---|---|
| Camaná | 3.7 |
| Arequipa D1 | 15.7 |
| Arequipa D2 | 17.5 |
| Sumbay | 21.1 |
4. Discussion
The results obtained in this research demonstrate the technical and metrological feasibility of using low-cost hardware (Raspberry Pi HQ and AS7331 sensor) for monitoring the solar spectrum and ultraviolet radiation, provided that rigorous adjustment and calibration protocols are implemented on the instrument prior to its field use.
Regarding spectral resolution in the visible range, spatial calibration using the mercury (Hg) spectral lamp showed that the pilot spectrometer has an uncertainty margin ranging between 2.6 nm and 3.3 nm (Table 1). This linear correction of the dispersion from pixels to nanometers allowed the stabilization of the wavelength readings against simulated mechanical vibrations (transport). When comparing the integrated total irradiance of the constructed instrument against the reference spectrometer (Black Comet), notably low deviations were observed: 2.0 W/m2 in Arequipa, 15.8 W/m2 in Sumbay, and 3.6 W/m2 in Camaná. These relative error margins validate the signal conditioning methodology through Savitzky-Golay filtering and sixth-degree polynomial interpolation, overcoming the discrepancies of up to 30% reported by authors such as Xu and Huang [13] in low-cost sensors without spectral mismatch correction.
Regarding the ultraviolet radiometric calibration, the adjustment curves of the AS7331 sensor demonstrated a highly proportional and linear photovoltaic response to the incident solar irradiance. The linear regressions of the digital counts against the commercial UVA and UVB meters reached coefficients of determination () of 0.991 and 0.976, respectively, with residual uncertainties that were not significant for the order of magnitude of the measurements taken; the standard uncertainties associated with their adjustment curve are UVA = 0.0958 mW/cm2 and UVB = 0.0132 mW/cm2. On the other hand, the linear regressions of the digital counts against the Black Comet reference spectrometer reached coefficients of determination () of 0.973, 0.972, and 0.967 for UVA, UVB, and UVC radiation, respectively, with standard uncertainties associated with their adjustment curve of UVA = 0.2174 mW/cm2, UVB = 0.0153 mW/cm2, and UVC = 0.0113 mW/cm2, which are also not considered significant for the order of magnitude of the measurements taken.
Finally, the field measurements taken at different altitudes—Camaná at 0 masl, Arequipa at 2330 masl, and Sumbay at 4100 masl—confirmed the critical influence of air mass on the attenuation of UV radiation. The measurements in Sumbay yielded an extreme Ultraviolet Radiation Index (UVI) with peaks of up to 21. Furthermore, it was observed that both the reference spectrometer and the pilot spectrometer recorded UVC radiation measurements, which according to the literature should not be recorded since it should be completely attenuated in the Earth’s atmosphere. Further studies are recommended to verify whether UVC radiation is reaching the Earth’s surface at altitudes above 2300 masl or if these readings are the result of an out-of-band response, stray light, or correspond to the detection limit of the instruments used. The pilot instrument was able to perform all planned measurements without suffering saturation of the analog-to-digital converters (ADC), demonstrating that the concurrent software architecture and the algorithmic locking of the hardware allow the designed instrument to withstand the extreme radiometric conditions of the region.
5. Conclusions
Based on the design, construction, calibration, and field measurements of the proposed low-cost spectrometer and radiometer, the following conclusions are established:
- Feasibility and Accuracy: It is possible to build low-cost radiometric instrumentation (using the Raspberry Pi 4B microarchitecture, CMOS sensors, and AS7331 chips) that achieves performance and resolution proportional to scientific-grade equipment. However, its accuracy strictly depends on the implementation of analytical correction methods, dark current subtraction, and mathematical models of polynomial regression applied directly to the raw digital signal.
- Spectrometer Calibration: The spectrometer calibration process, using a mercury lamp and the sun, was successful, allowing for the correction of measured peak positions and the transformation of digital counts into spectral irradiance units. Field measurements verified that the radiometric transfer function successfully replicated the reference spectrometer curves, with maximum deviations of up to 15.8 W/m2 in the total integrated irradiance at different altitudes for irradiance measurements of 658.9 W/m2.
- Radiometer Performance: The calibration of the AS7331 sensor via linear regression yielded coefficients of determination greater than 0.95 ( > 0.95) when compared with both commercial UVA and UVB radiation meters and a laboratory-grade reference spectrometer. The readings taken in Sumbay at an altitude of 4100 masl revealed UV Index levels of up to 21, an extreme health risk value. The equipment was able to measure these continuous indices at 1 Hz without saturating, confirming its robustness for epidemiological studies.
- Impact and Application: The successful development of this instrument demonstrates the technical feasibility of constructing and calibrating low-cost instruments for performing solar radiation measurements. By drastically reducing capital costs compared to traditional instrumentation, this open-source design opens the door to the implementation of high-density climate and solar monitoring grids, which are essential for protecting public health in the Andean region and optimizing the forecasting of solar power generation in Peru.
Author Contributions
Conceptualization: Walter Daniel Leon Salas, Miguel Vizcardo Cornejo, Jose Luis Solis Veliz, and Mauricio Postigo Malaga; Methodology: Walter Daniel Leon Salas and Carlos Puma Apaza; Software: Carlos Puma Apaza; Validation: Carlos Puma Apaza and Yefry Calla Zapana; Formal Analysis: Walter Daniel Leon Salas, Miguel Vizcardo Cornejo, Jose Luis Solis Veliz, and Mauricio Postigo Malaga; Research: Carlos Puma Apaza and Yefry Calla Zapana; Resources: Miguel Vizcardo Cornejo; Data Curation Carlos Puma Apaza; Writing–Original Draft: Carlos Puma Apaza; Writing–Revision and Editing: Carlos Puma Apaza; Visualization: Carlos Puma Apaza; Supervision: Walter Daniel Leon Salas, Miguel Vizcardo Cornejo, Jose Luis Solis Veliz, and Mauricio Postigo Malaga; Project Management: Miguel Vizcardo Cornejo; Funding Acquisition: Miguel Vizcardo Cornejo. All authors have read and approved the published version of the manuscript.
Funding
This research was funded by Prociencia Concytec, grant number PE501081990-2023, and the article processing fee (APC) was also funded by Prociencia Concytec.
Institutional Review Board Statement: Institutional Review Board Statement
Not applicable.
Informed Consent Statement
Not applicable.
Data Availability Statement
The data will be available once the article is published and by writing an email to the authors.
Acknowledgments
The authors thank Prociencia Concytec for the funding and the National University of San Agustin of Arequipa for the facilities provided to carry out this research.
Conflicts of Interest
The authors declare no conflicts of interest.
Abbreviations
The following abbreviations are used in this manuscript:
| UV | Ultraviolet |
| UVA | Ultraviolet A |
| UVB | Ultraviolet B |
| UVC | Ultraviolet C |
| UVI | Ultraviolet Radiation Index |
| CIE | International Commission on Illumination |
| ADC | Analog-to-Digital Converter |
| I2C | Inter-Integrated Circuit |
| ISP | Image Signal Processor |
| CMOS | Complementary Metal-Oxide-Semiconductor |
| GUM | Guide to the Expression of Uncertainty in Measurement |
| PLA | Polylactic Acid |
| SBC | Single-Board Computer |
References
- Kinsey, G.S.; Riedel-Lyngskær, N.C.; Miguel, A.-A.; Boyd, M.; Braga, M.; Shou, C.; Cordero, R.R.; Duck, B.C.; Fell, C.J.; Feron, S.; et al. Impact of measured spectrum variation on solar photovoltaic efficiencies worldwide. Renew. Energy 2022, 196, 995–1016. [Google Scholar] [CrossRef]
- Paudyal, B.R.; Imenes, A.G. Investigation of temperature coefficients of PV modules through field measured data. Sol. Energy 2021, 224, 425–439. [Google Scholar] [CrossRef]
- Conde, L.A.; Montes-Romero, J.; Carhuavilca, A.; Perich, R.; Guerra, J.A.; Angulo, J.; Muñoz, E.; Töfflinger, J.A.; de la Casa, J. Performance evaluation and characterization of different photovoltaic technologies under the coastal, desertic climate conditions of Lima, Peru. In Proceedings of the ISES Solar World Congress 2019, Santiago, Chile, 4–7 November 2019. [Google Scholar] [CrossRef]
- Conde, L.A.; Angulo, J.R.; Sevillano-Bendezú, M.Á.; Nofuentes, G.; Töfflinger, J.A.; de la Casa, J. Spectral effects on the energy yield of various photovoltaic technologies in Lima (Peru). Energy 2021, 223, 120034. [Google Scholar] [CrossRef]
- Kinsey, G.S. Solar cell efficiency divergence due to operating spectrum variation. Sol. Energy 2021, 217, 49–57. [Google Scholar] [CrossRef]
- Hategan, S.-M.; Paulescu, M. Spectral mismatch impact on PV performance: A case study for Romania. AIP Conf. Proc. 2023, 2843, 040010. [Google Scholar] [CrossRef]
- Dirnberger, D.; Blackburn, G.; Müller, B.; Reise, C. On the impact of solar spectral irradiance on the yield of different PV technologies. Sol. Energy Mater. Sol. Cells 2015, 132, 431–442. [Google Scholar] [CrossRef]
- Fernández, E.F.; Almonacid, F.; Ruiz-Arias, J.A.; Soria-Moya, A. Analysis of the spectral variations on the performance of high concentrator photovoltaic modules operating under different real climate conditions. Sol. Energy Mater. Sol. Cells 2014, 127, 179–187. [Google Scholar] [CrossRef]
- Acuña Casafranca, S. Radiación ultravioleta en Arequipa 2016-2017. In Tesis de Segunda Especialidad; Universidad Nacional de San Agustín de Arequipa: Arequipa, Perú, 2017. [Google Scholar]
- Mayhua Choque, F.M. Estudio comparativo y modelación de la radiación global y ultravioleta en la ciudad de Arequipa. Tesis de pregrado, Universidad Nacional de San Agustín de Arequipa, Arequipa, Perú, 2019. [Google Scholar]
- Verduga-Urdánigo, F.; Cevallos-Macías, J.; Solórzano-Cadena, R. Construcción de un sistema de bajo costo para la medición de rayos ultravioleta basado en internet de las cosas. Rev. Cient. Multidiscip. Arbitr. YACHASUN 2020, 4, 73–92. [Google Scholar] [CrossRef]
- Serrano, A.; Abril-Gago, J.; Garcia-Orellana, C.J. Development of a Low-Cost Device for Measuring Ultraviolet Solar Radiation. Front. Environ. Sci. 2022, 9, 737875. [Google Scholar] [CrossRef]
- Xu, G.; Huang, X. Calibration of broadband UV radiometers–methodology and uncertainty evaluation. Metrologia 2003, 40, S21–S24. [Google Scholar] [CrossRef]
- Furia, M. Design and Construction of a Low-cost DIY Spectroscope. Tesis de pregrado, Metropolia University of Applied Sciences, Helsinki, Finlandia, 2023. [Google Scholar]
- Schubert, F.; Klameth, K.; Darou, S.; Spinner, D. Measurement uncertainties of a compact array spectrometer. Energy Procedia 2015, 77, 179–186. [Google Scholar] [CrossRef]
- Tatsiankou, V.; Hinzer, K.; Schriemer, H.; Kazadzis, S.; Kouremeti, N.; Gröbner, J.; Beal, R. Extensive validation of solar spectral irradiance meters at the World Radiation Center. Sol. Energy 2018, 166, 80–89. [Google Scholar] [CrossRef]
- Schinke, C.; Pollex, H.; Hinken, D.; Wolf, M.; Bothe, K.; Kröger, I.; Nevas, S.; Winter, S. Calibrating spectrometers for measurements of the spectral irradiance caused by solar radiation. Metrologia 2020, 57, 065027. [Google Scholar] [CrossRef]
- Nofuentes, G.; Gueymard, C.A.; Aguilera, J.; Pérez-Godoy, M.D.; Charte, F. Is the average photon energy a unique characteristic of the spectral distribution of global irradiance? Sol. Energy 2017, 149, 32–43. [Google Scholar] [CrossRef]
- Daxini, R.; Sun, Y.; Wilson, R.; Wu, Y. Direct spectral distribution characterisation using the Average Photon Energy for improved photovoltaic performance modelling. Renew. Energy 2022, 201, 1176–1188. [Google Scholar] [CrossRef]
- International Organization for Standardization. ISO 9845-1:1992; Solar Energy–Reference Solar Spectral Irradiance at the Ground at Different Receiving Conditions–Part 1: Direct Normal and Hemispherical Solar Irradiance for Air Mass 1,5. ISO: Geneva, Switzerland, 1992.
- World Health Organization; World Meteorological Organization; United Nations Environment Programme; International Commission on Non-Ionizing Radiation Protection. Global Solar UV Index: A Practical Guide; World Health Organization: Geneva, Switzerland, 2002. [Google Scholar]
- Lopo, A.B.; Spyrides, M.H.C.; Lucio, P.S.; Sigró, J. UV Index Modeling by Autoregressive Distributed Lag (ADL Model). Atmos. Clim. Sci. 2014, 4, 323–333. [Google Scholar] [CrossRef]
- Servicio Nacional de Meteorología e Hidrología del Perú (SENAMHI). Boletín Mensual: Vigilancia de la Radiación UV-B en Ciudades del País; SENAMHI: Lima, Peru, 2025; Vol. 1. [Google Scholar]
- McKenzie, R.; Smale, D.; Kotkamp, M. Relationship between UVB and erythemally weighted radiation. Photochem. Photobiol. Sci. 2004, 3, 252–256. [Google Scholar] [CrossRef] [PubMed]
- ams-OSRAM AG. AS7331 Spectral UVA/B/C Sensor Datasheet; Revision 4-00; Document DS001047; ams-OSRAM AG: Premstaetten, Austria, 2023. [Google Scholar]
- Bohlken, T.; Hagan, T.; Vasel-Be-Hagh, A.; Takshi, A. Photovoltaic plant losses: spectral mismatch. Energy Mater. 2026, 6, 600030. [Google Scholar] [CrossRef]
- Chawda, D.; Shinde, P. Effects of Solar Radiation on the Eyes. Cureus 2022, 14, e30857. [Google Scholar] [CrossRef] [PubMed]
- Narayanan, D.L.; Saladi, R.N.; Fox, J.L. Ultraviolet radiation and skin cancer. Int. J. Dermatol. 2010, 49, 978–986. [Google Scholar] [CrossRef] [PubMed]
- Quan, T.; He, T.; Kang, S.; Voorhees, J.J.; Fisher, G.J. Solar Ultraviolet Irradiation Reduces Collagen in Photoaged Human Skin by Blocking Transforming Growth Factor- Type II Receptor/Smad Signaling. Am. J. Pathol. 2004, 165, 741–751. [Google Scholar] [CrossRef] [PubMed]
Figure 3.
Positions of the peaks of the Hg lamp.
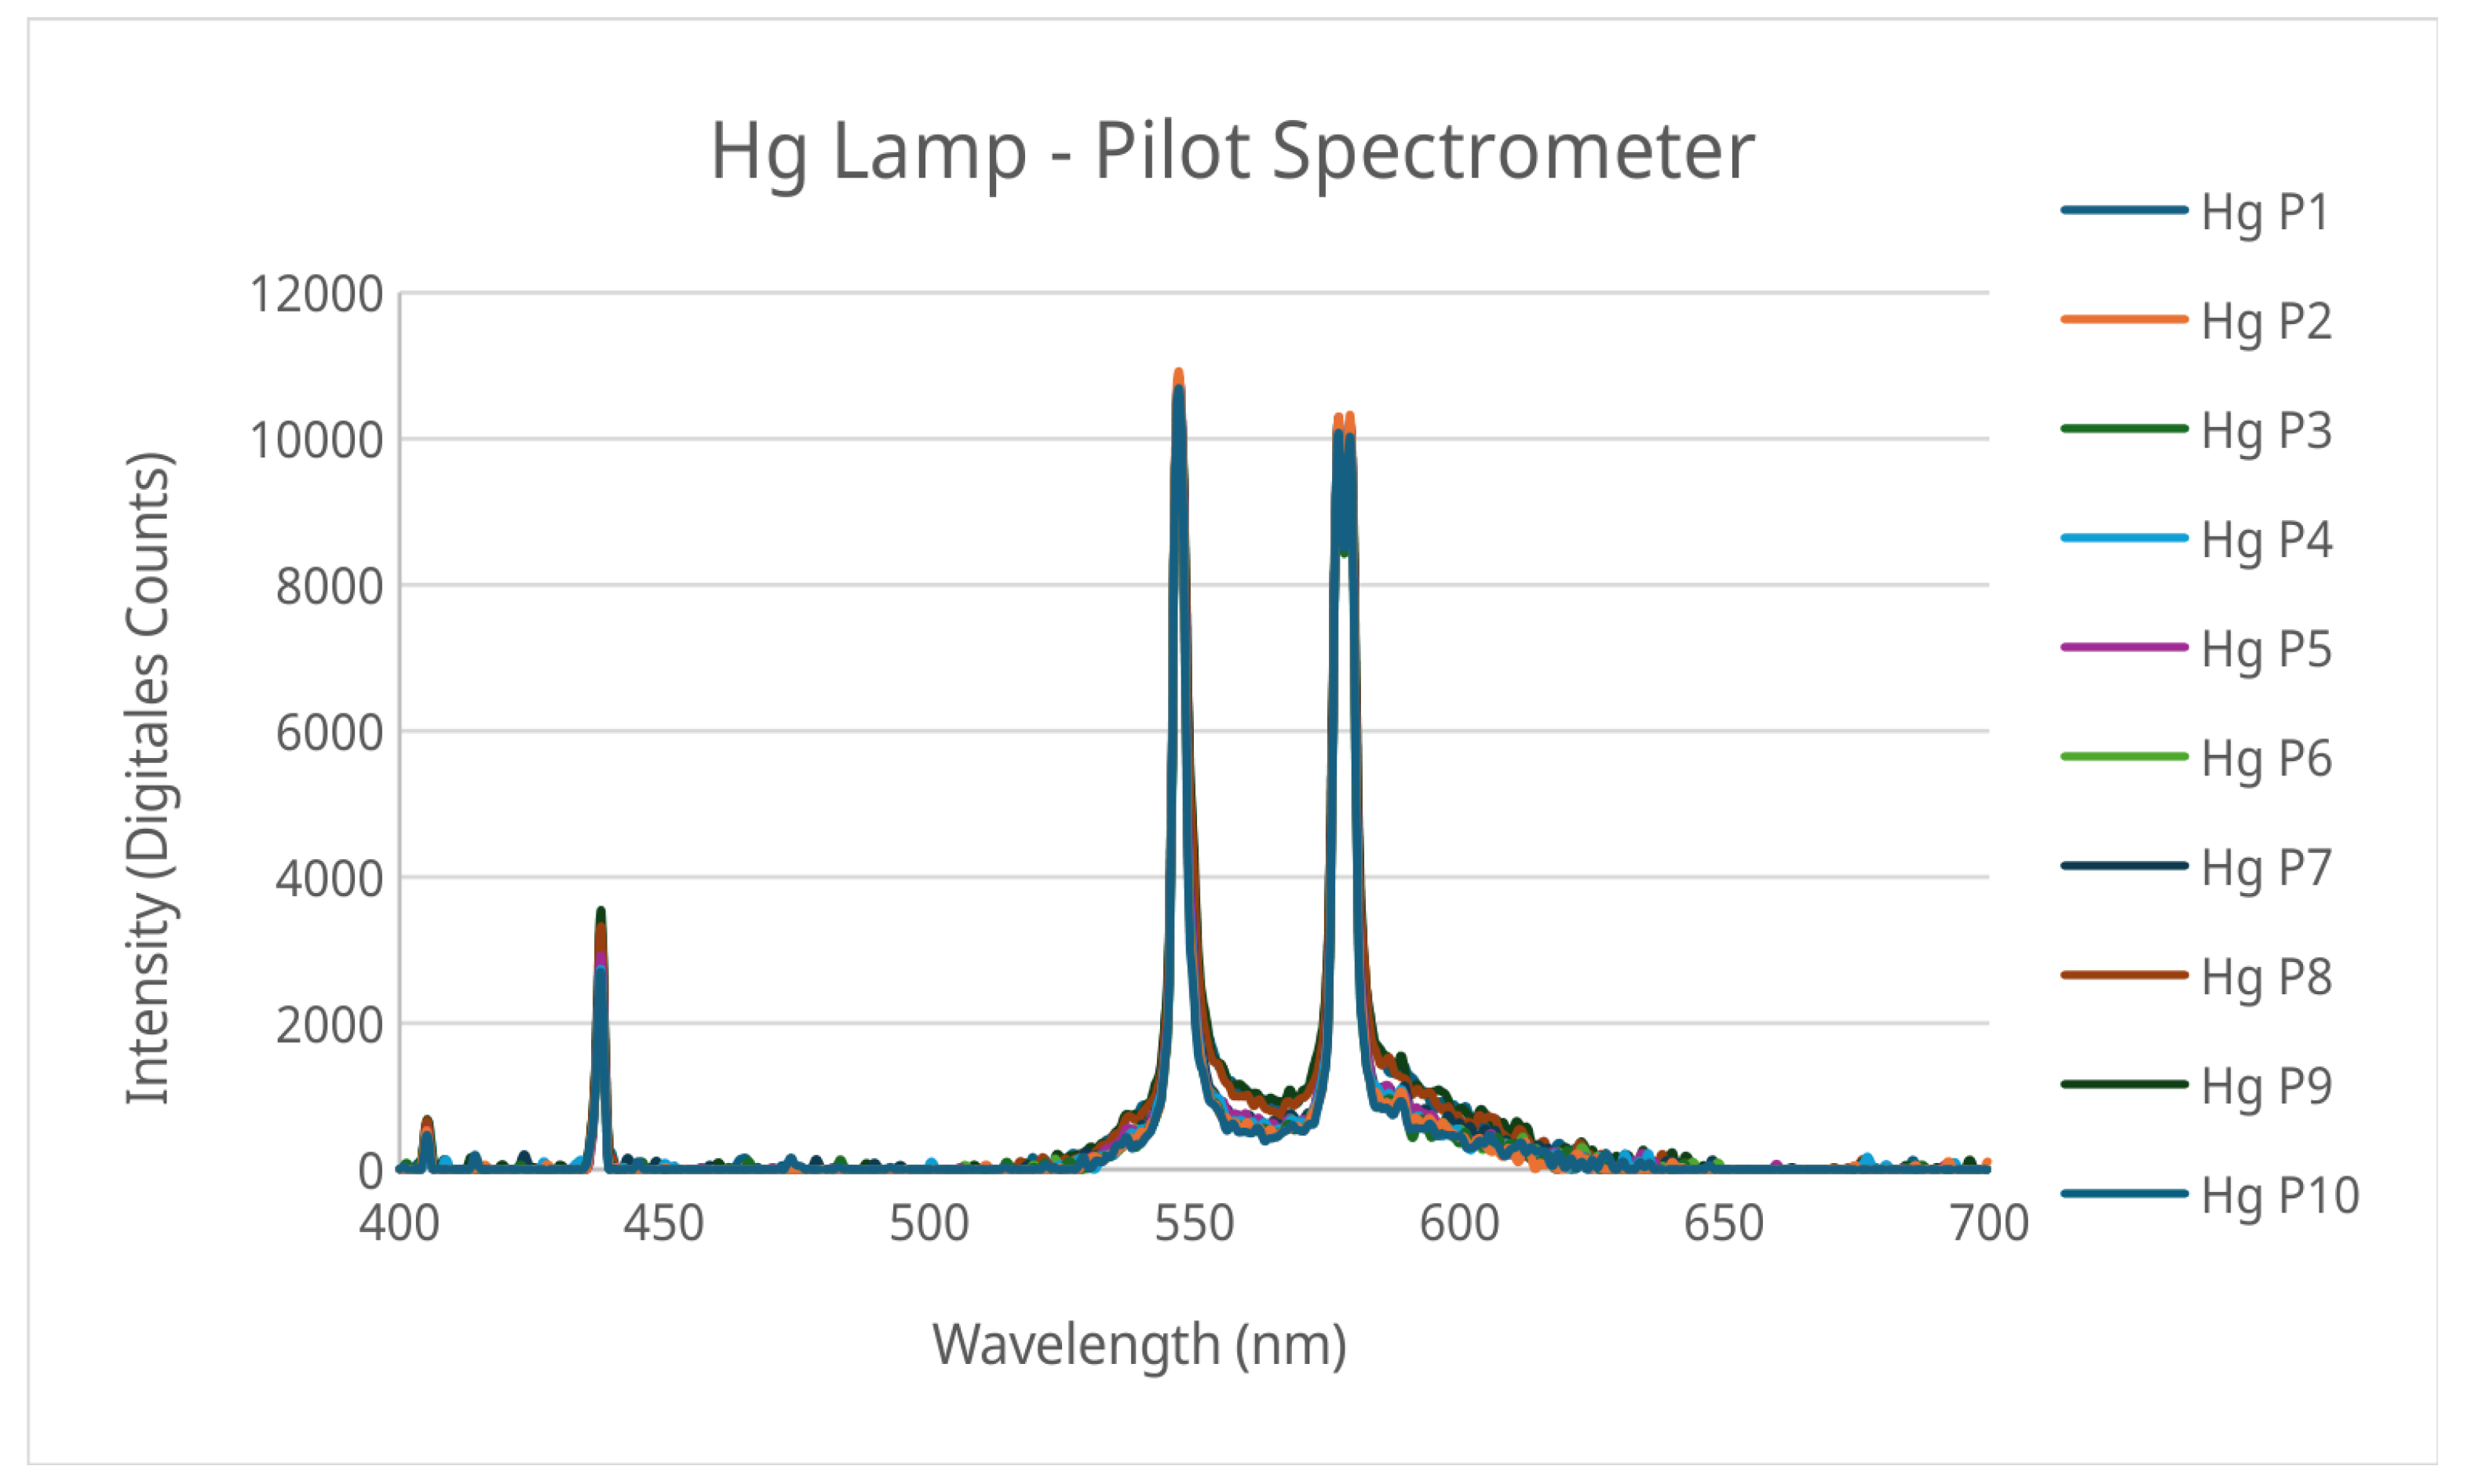
Figure 4.
Solar spectrum measured in the city of Arequipa.
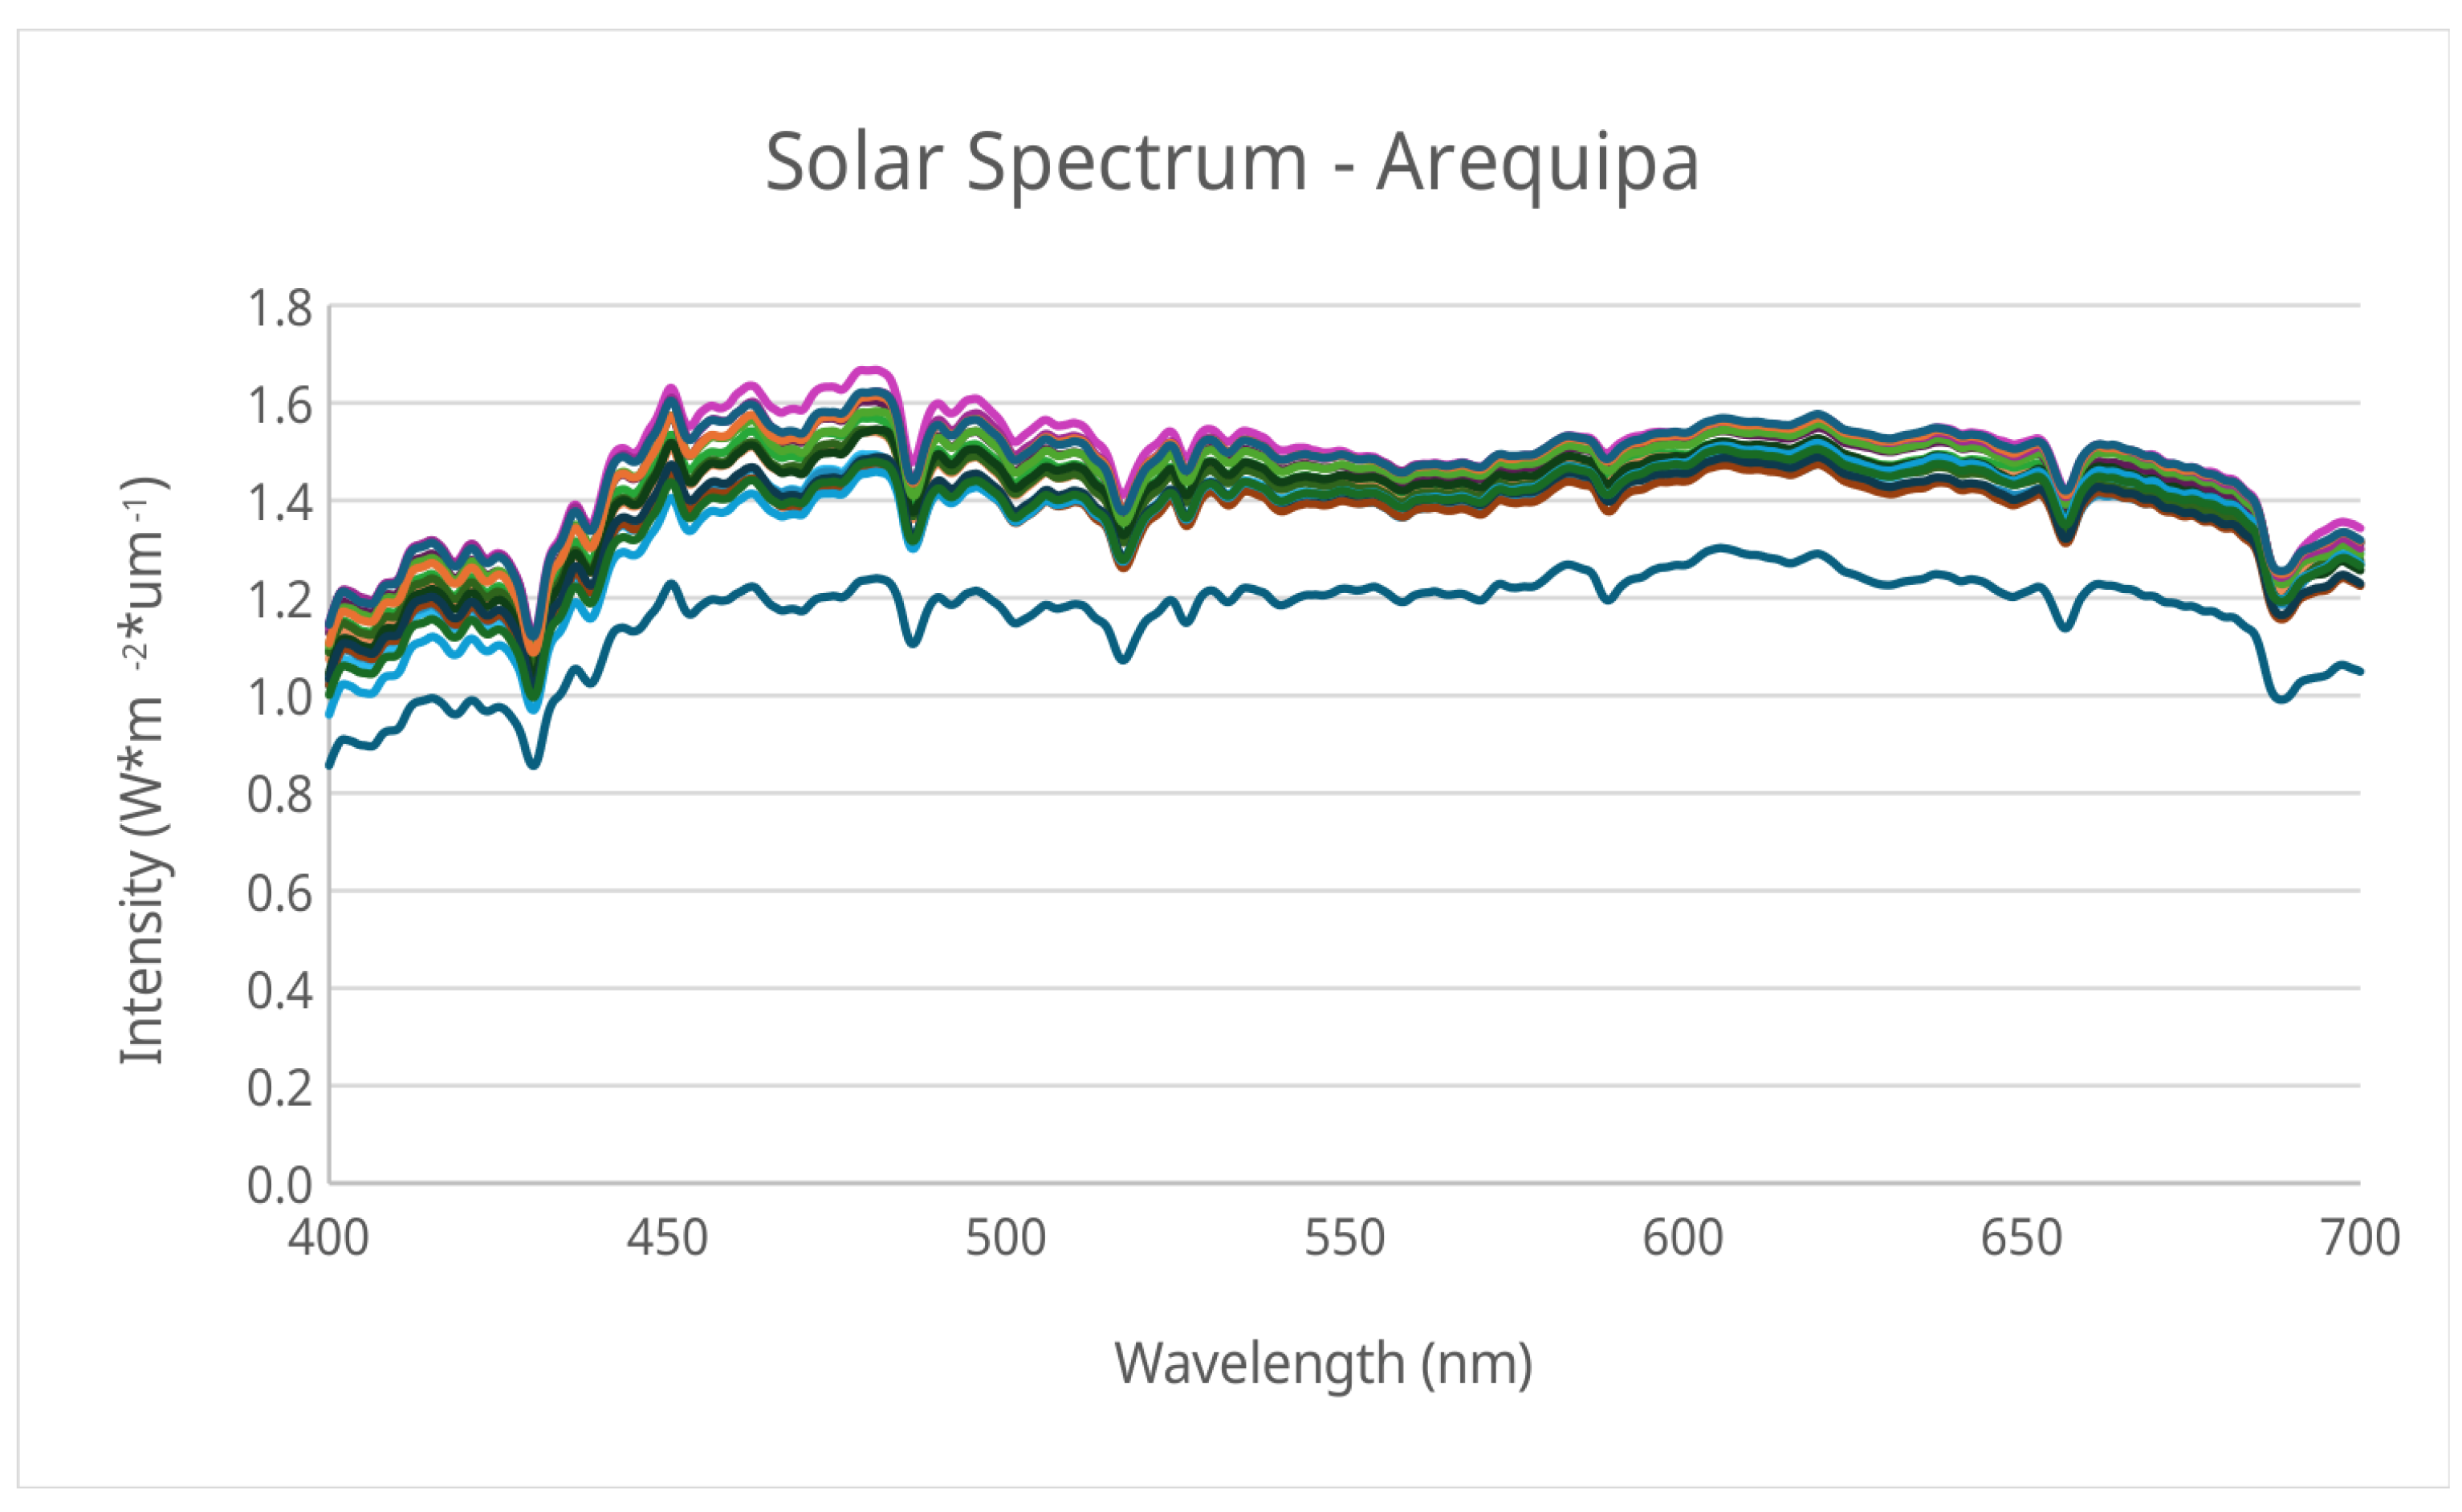
Figure 5.
Solar spectrum measured by the pilot spectrometer.
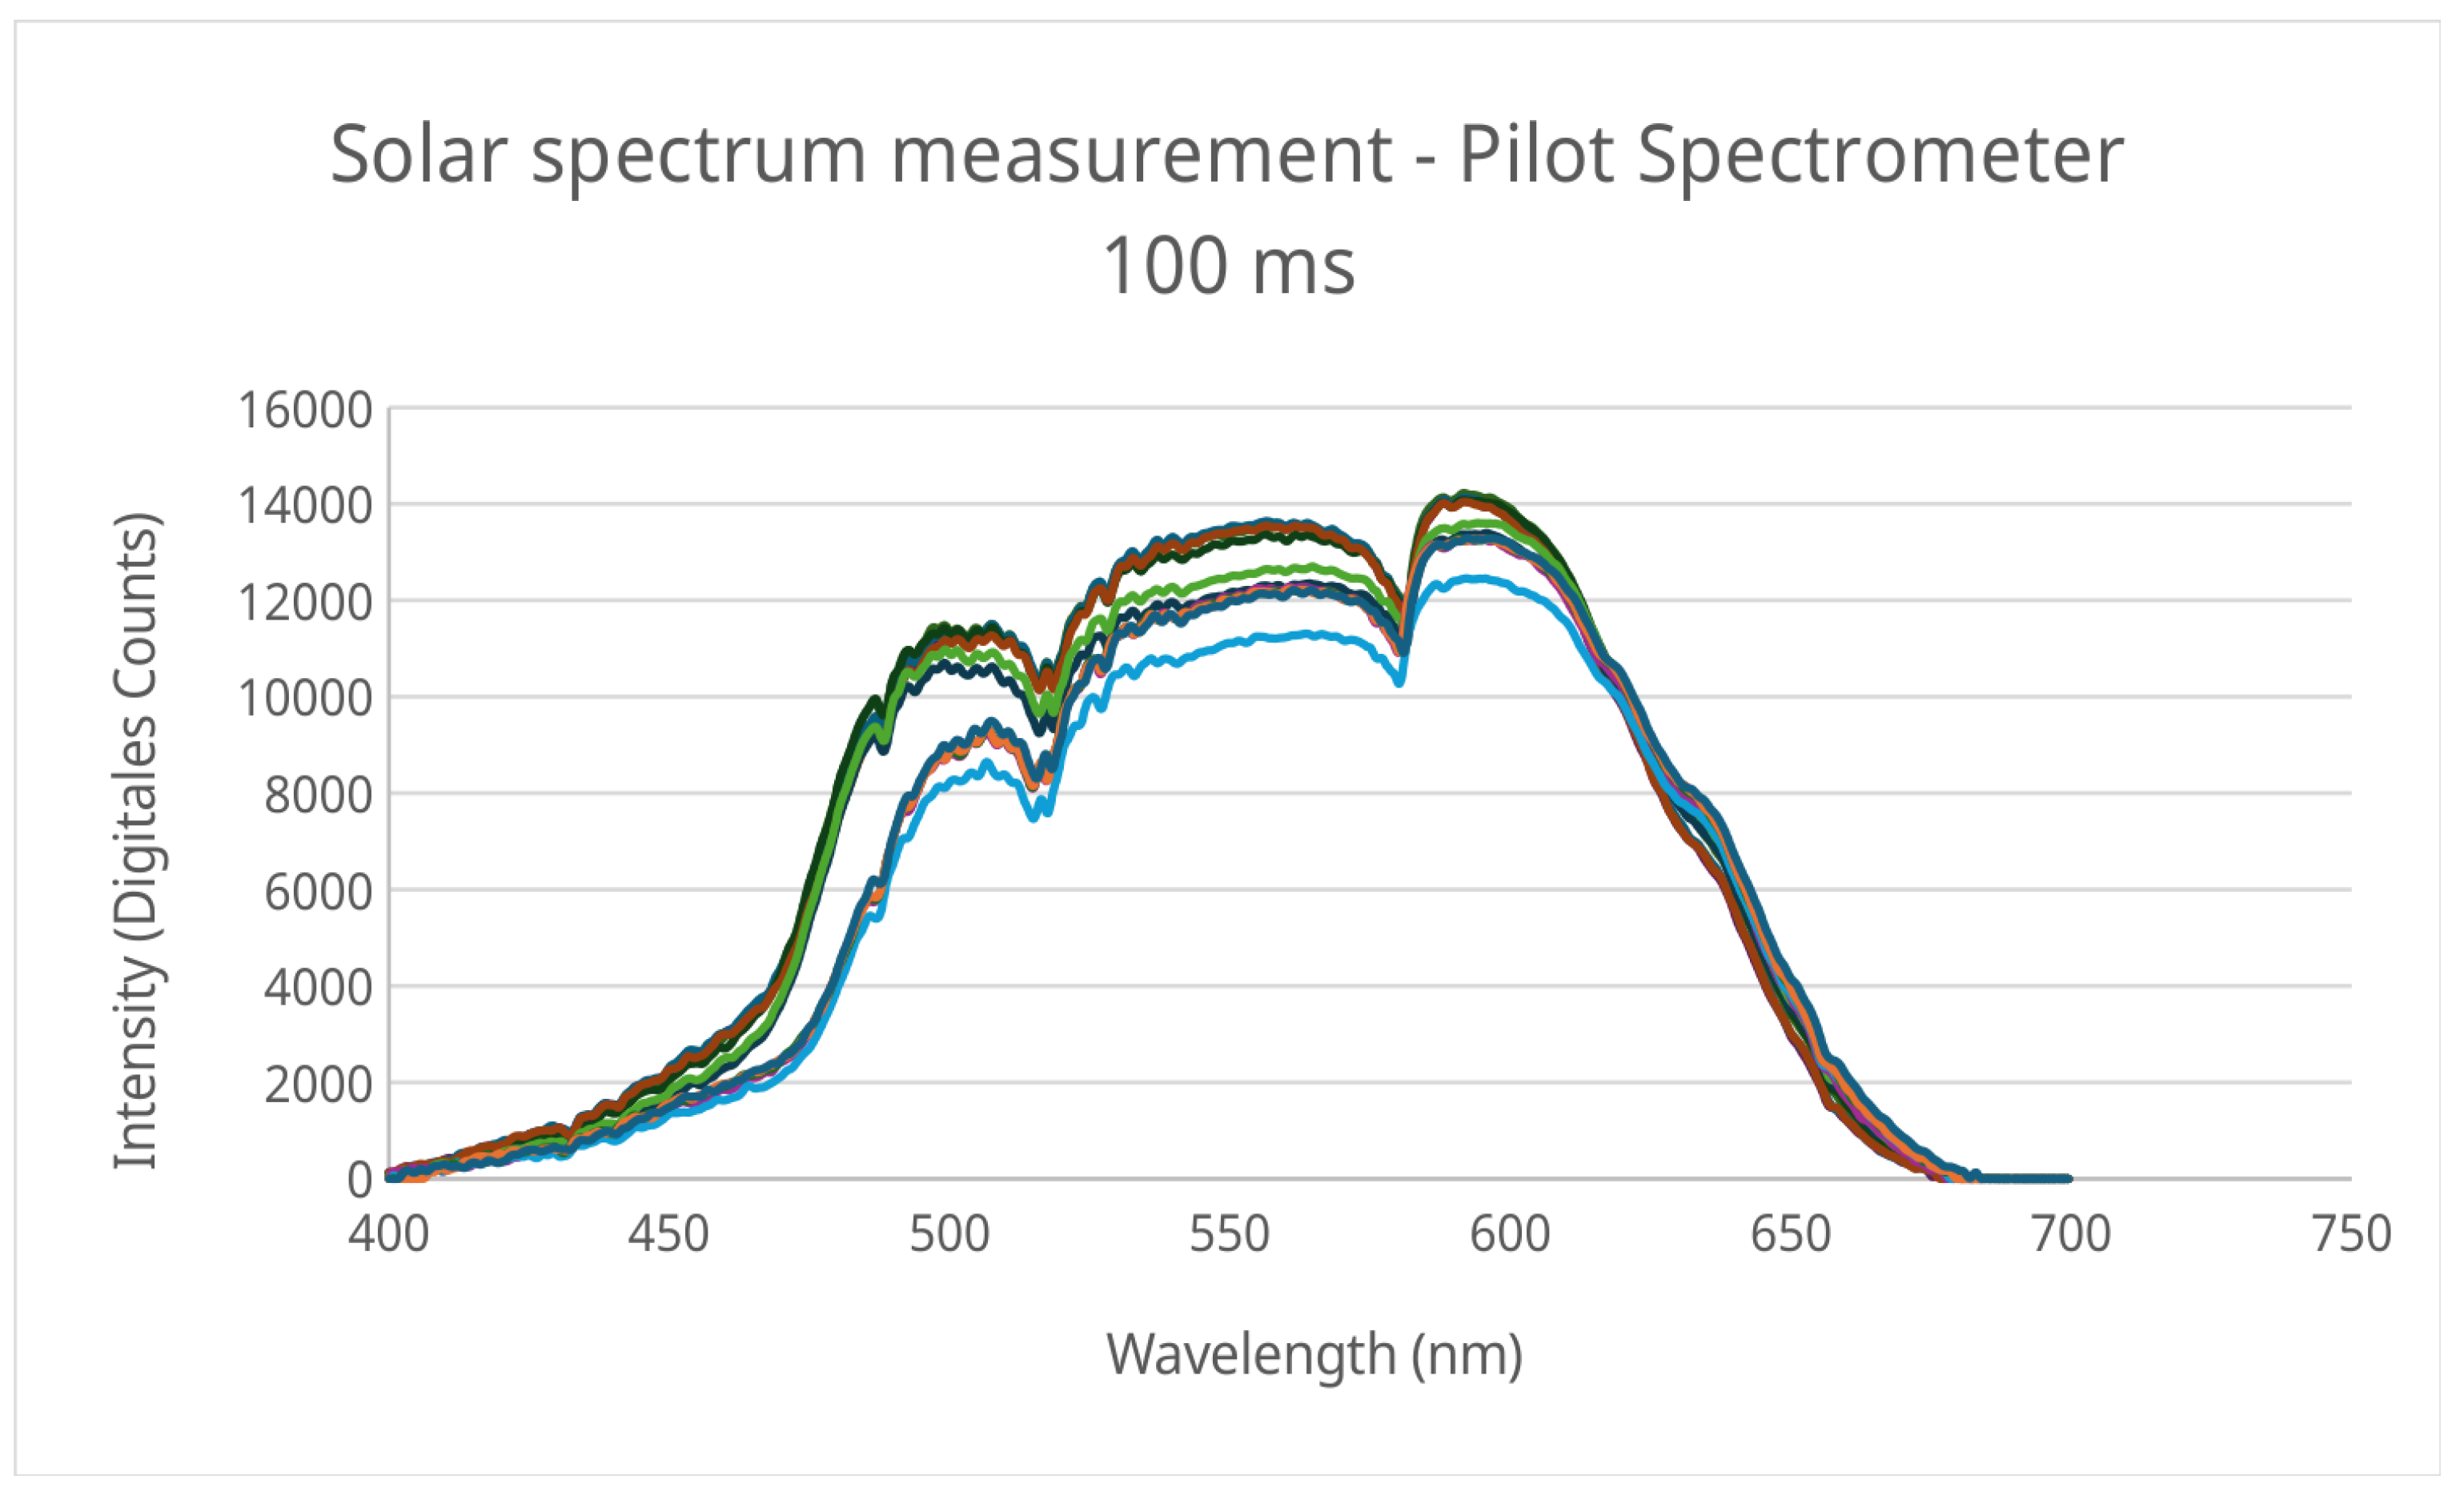
Figure 6.
Behavior curve of the solar spectrum measured by the reference spectrometer.
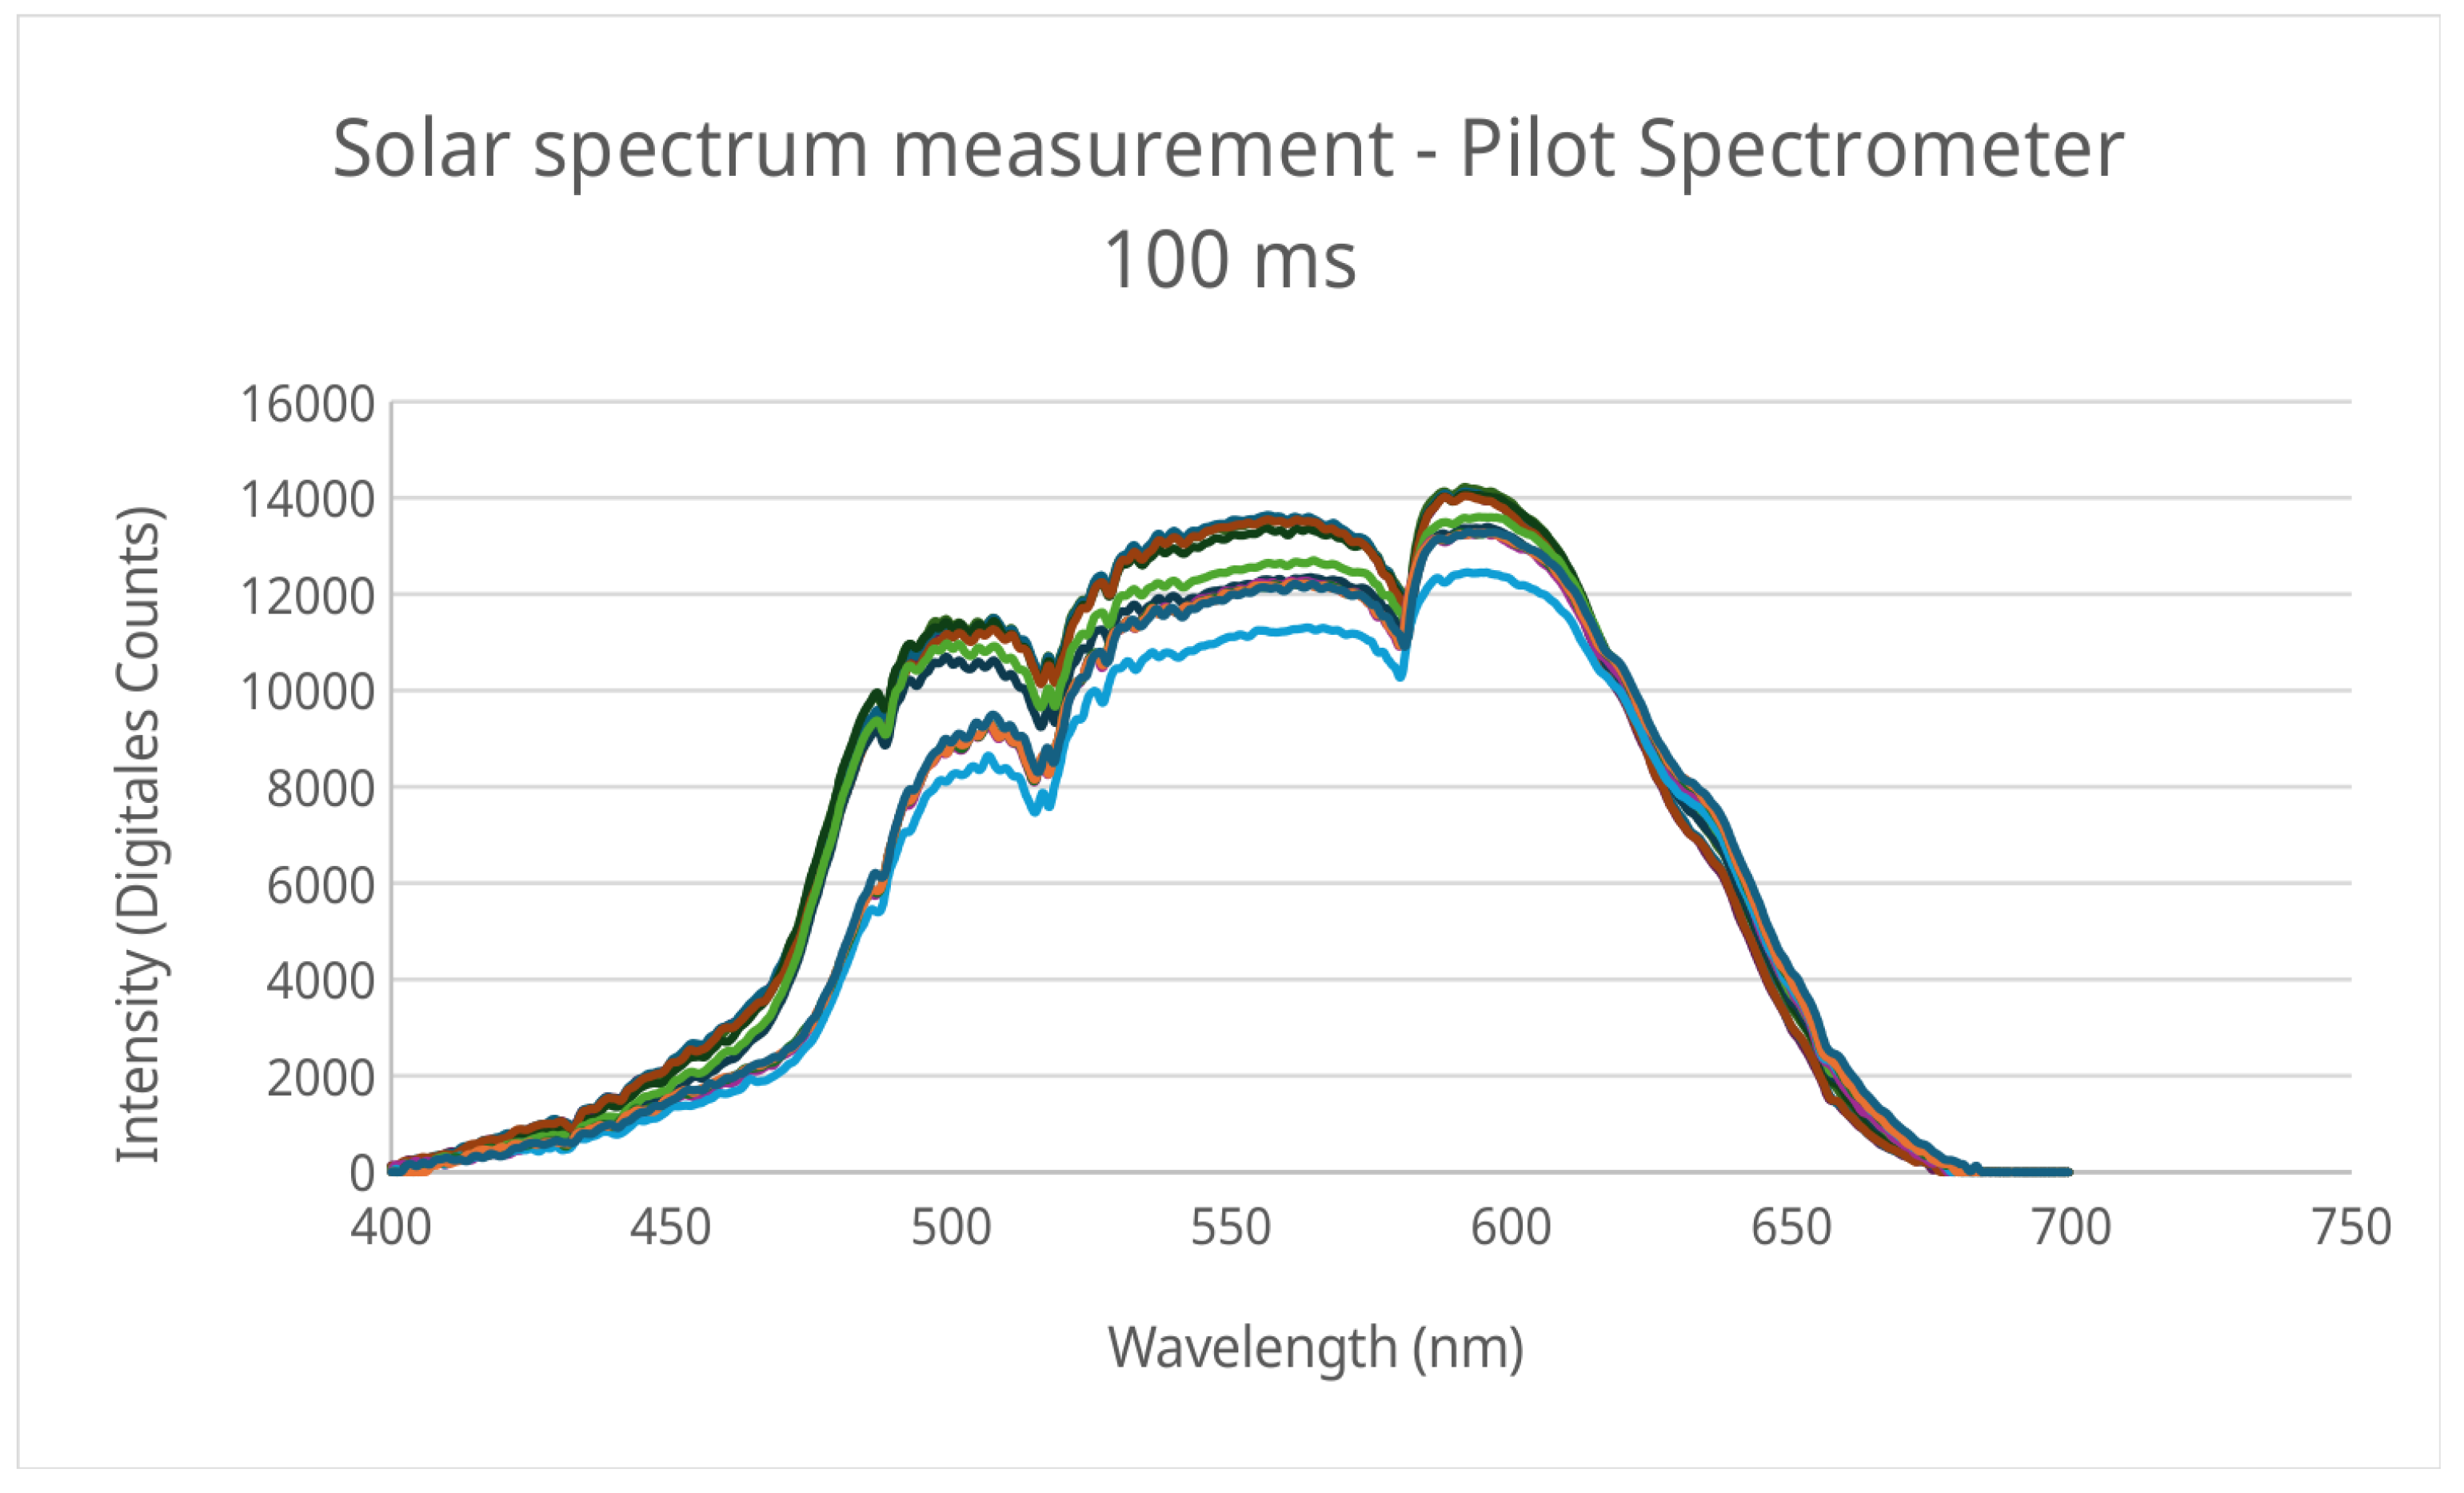
Figure 7.
Corrected spectrum.
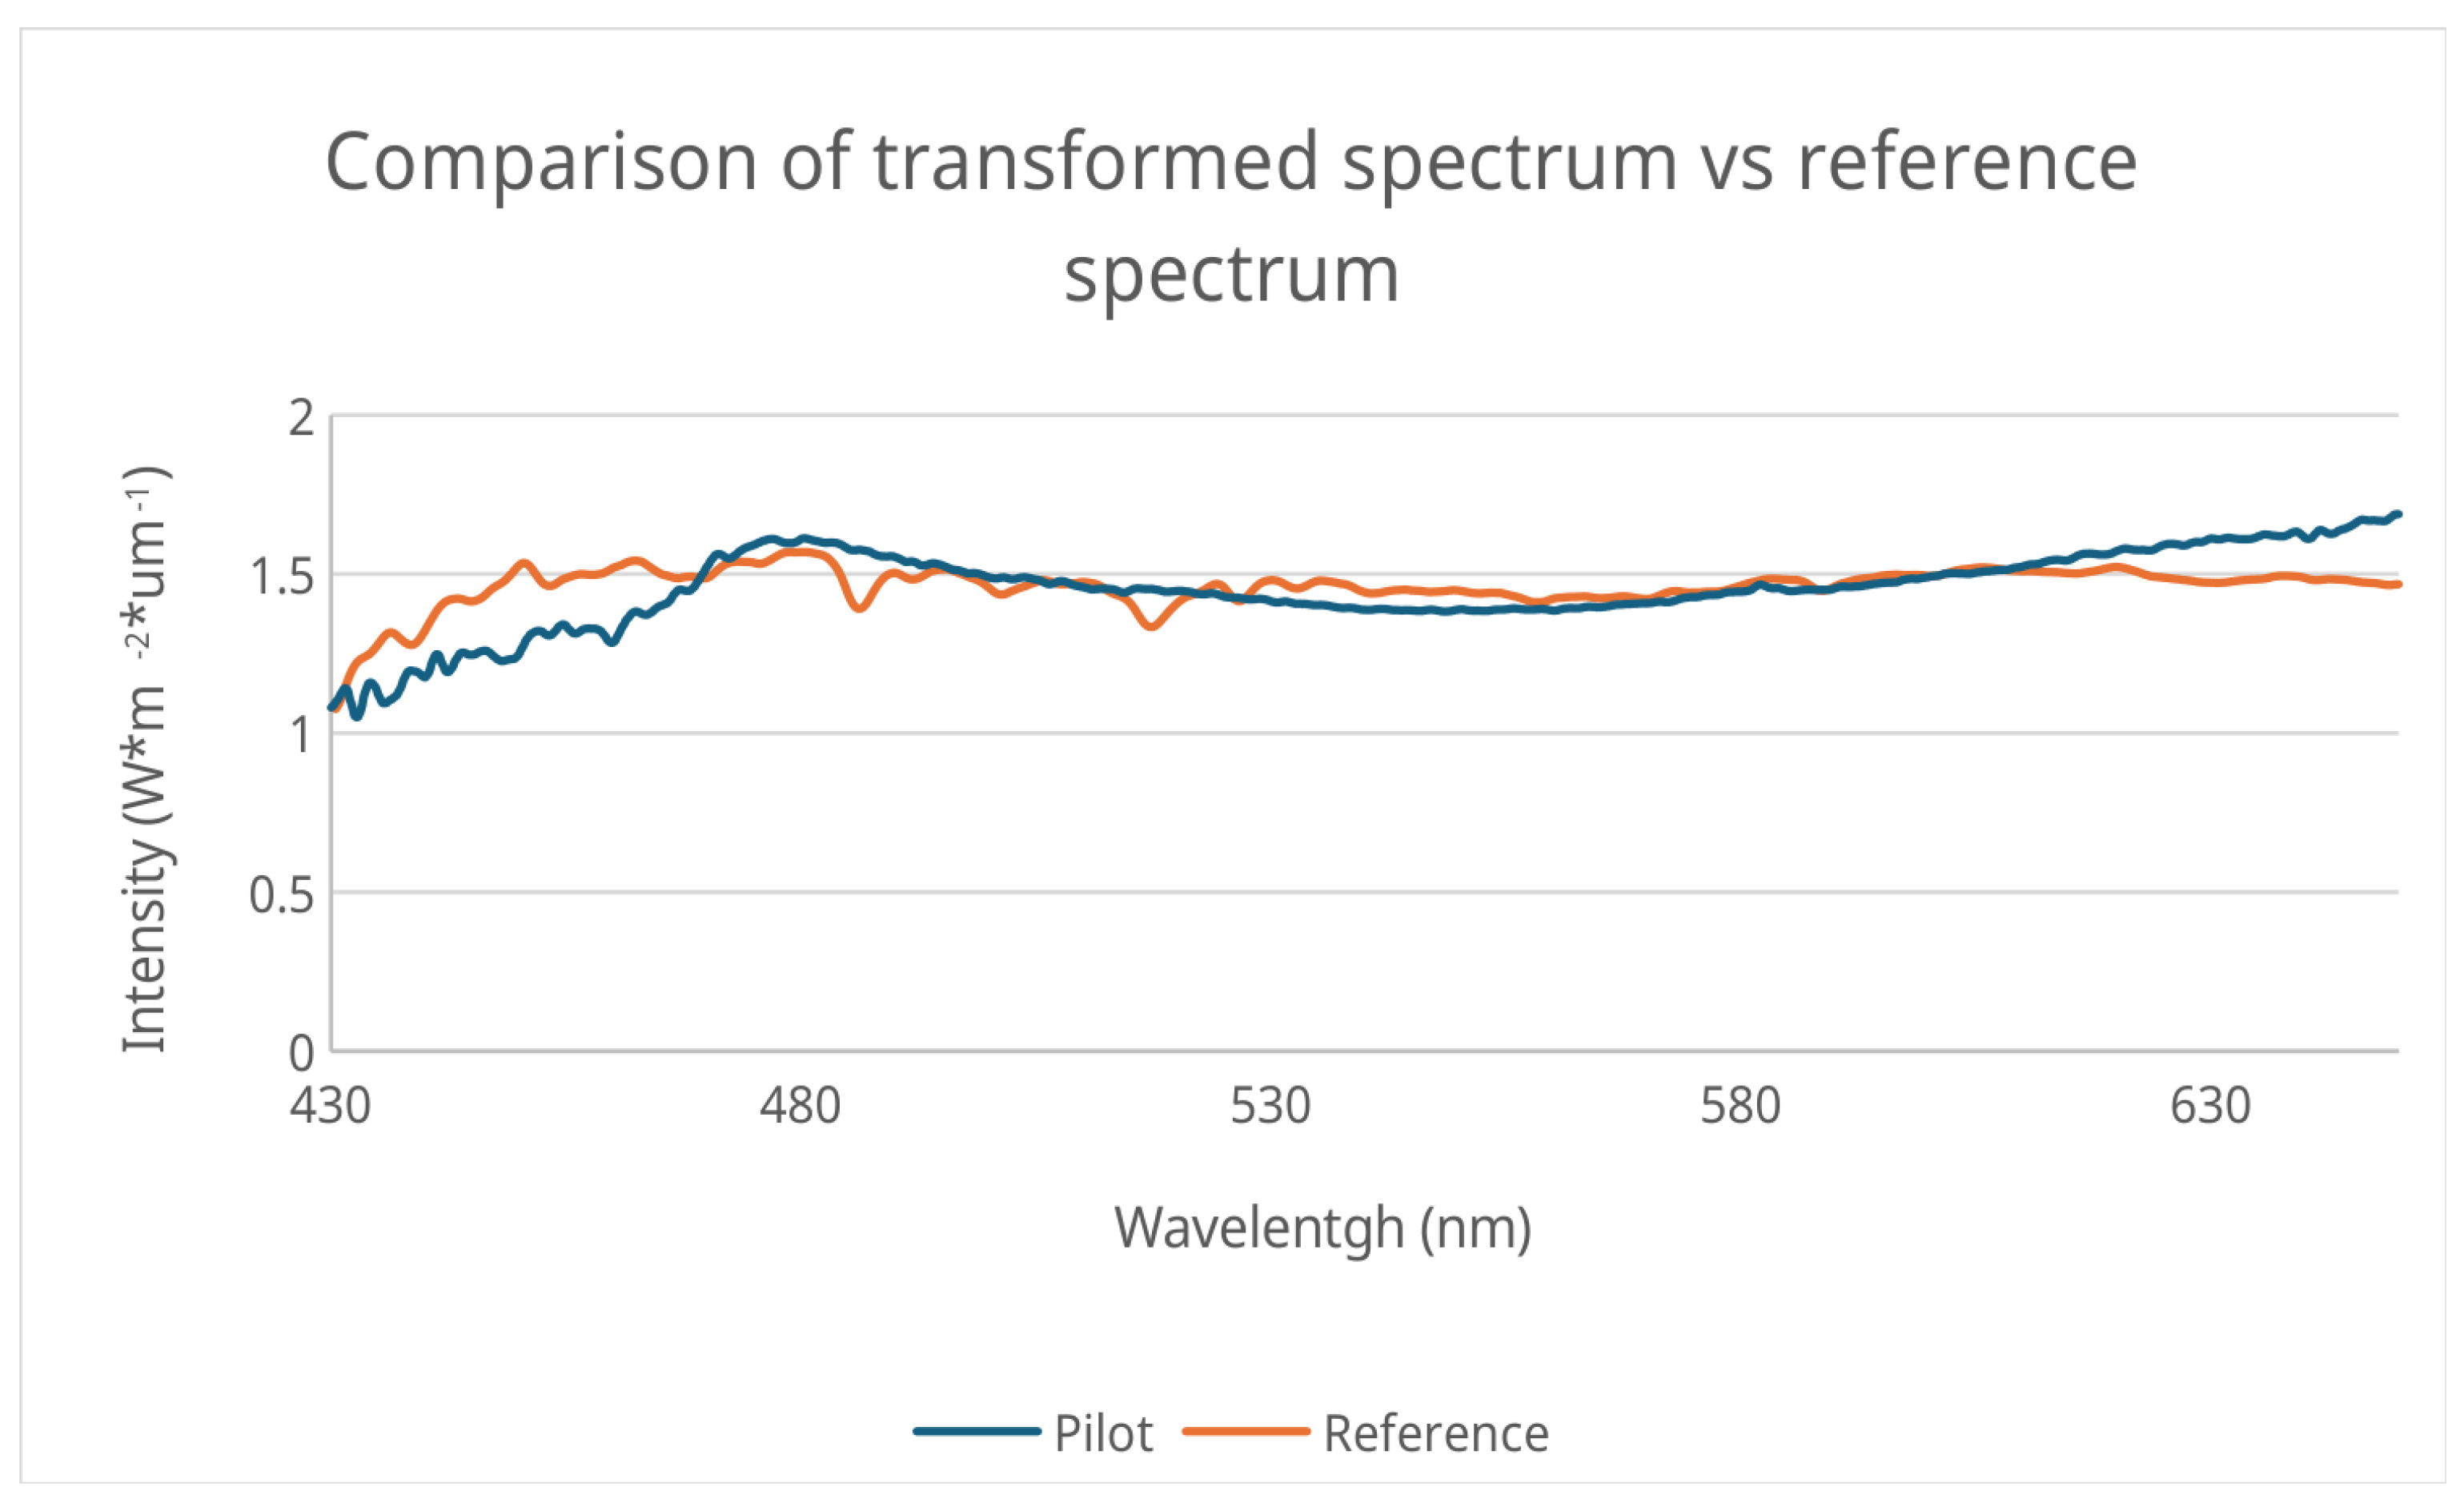
Figure 13.
Solar spectrum measurements in Camaná.
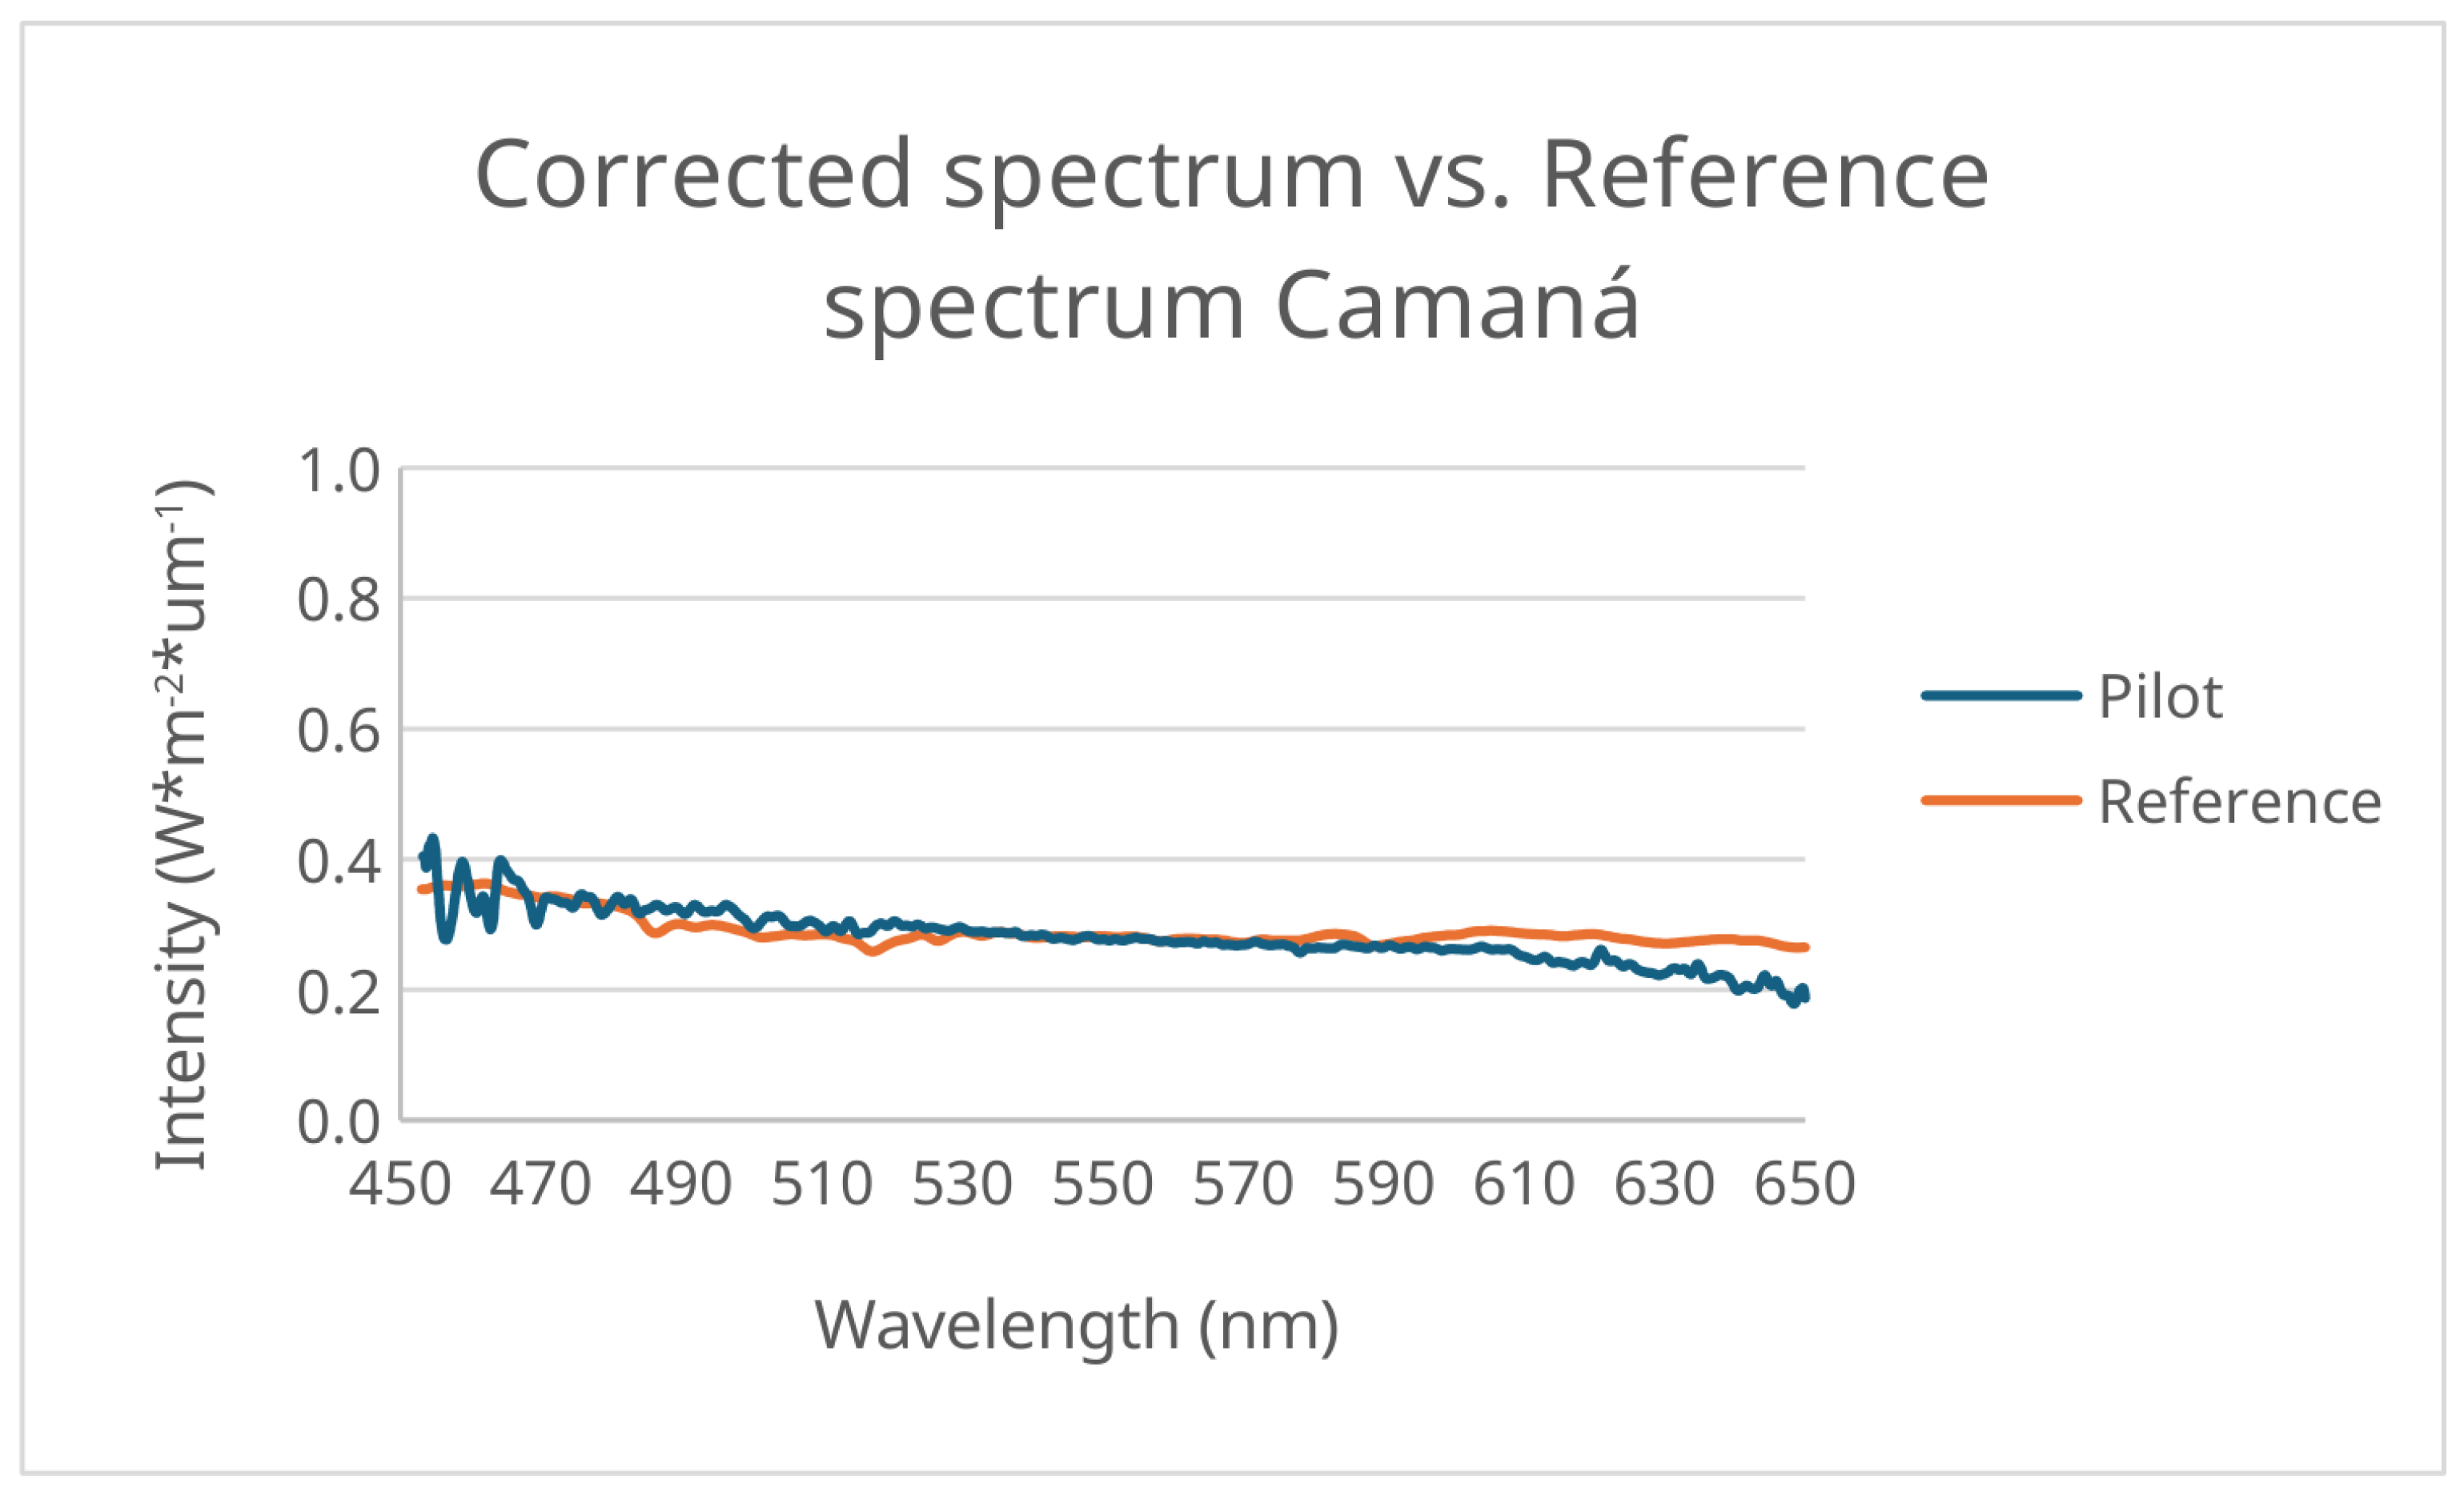
Figure 14.
Solar spectrum in Arequipa.
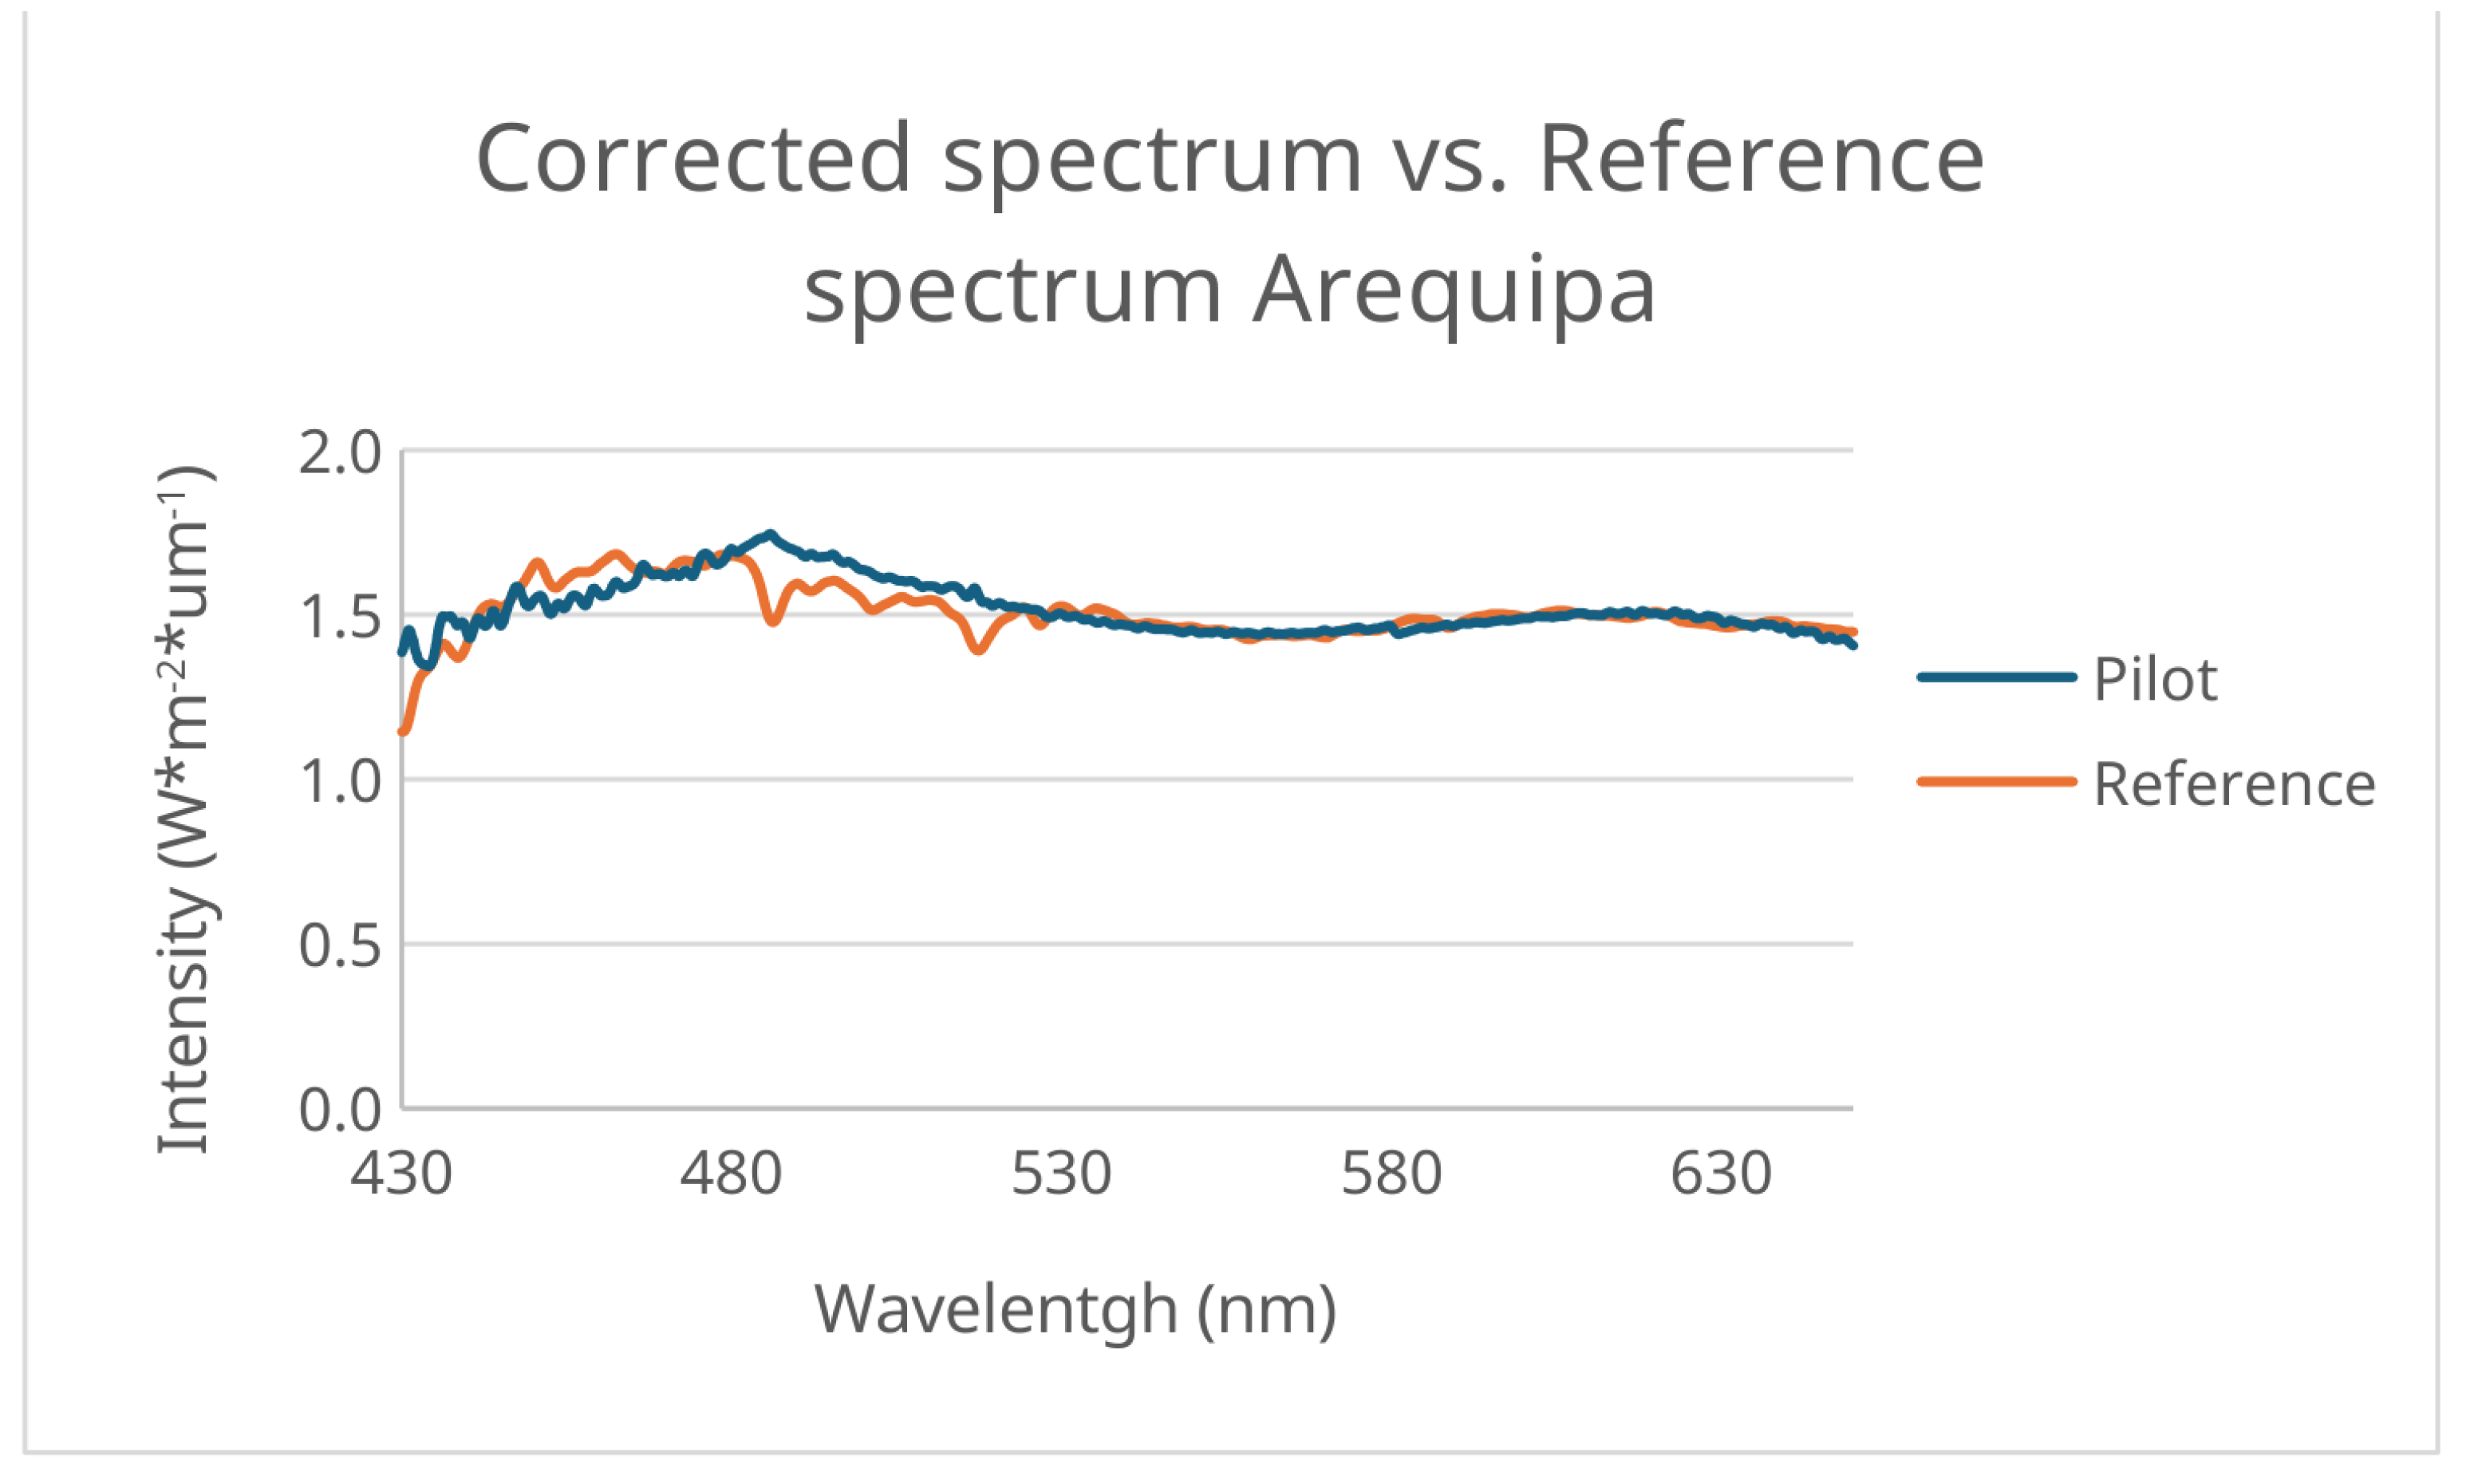
Figure 15.
Solar spectrum measurements in Sumbay.
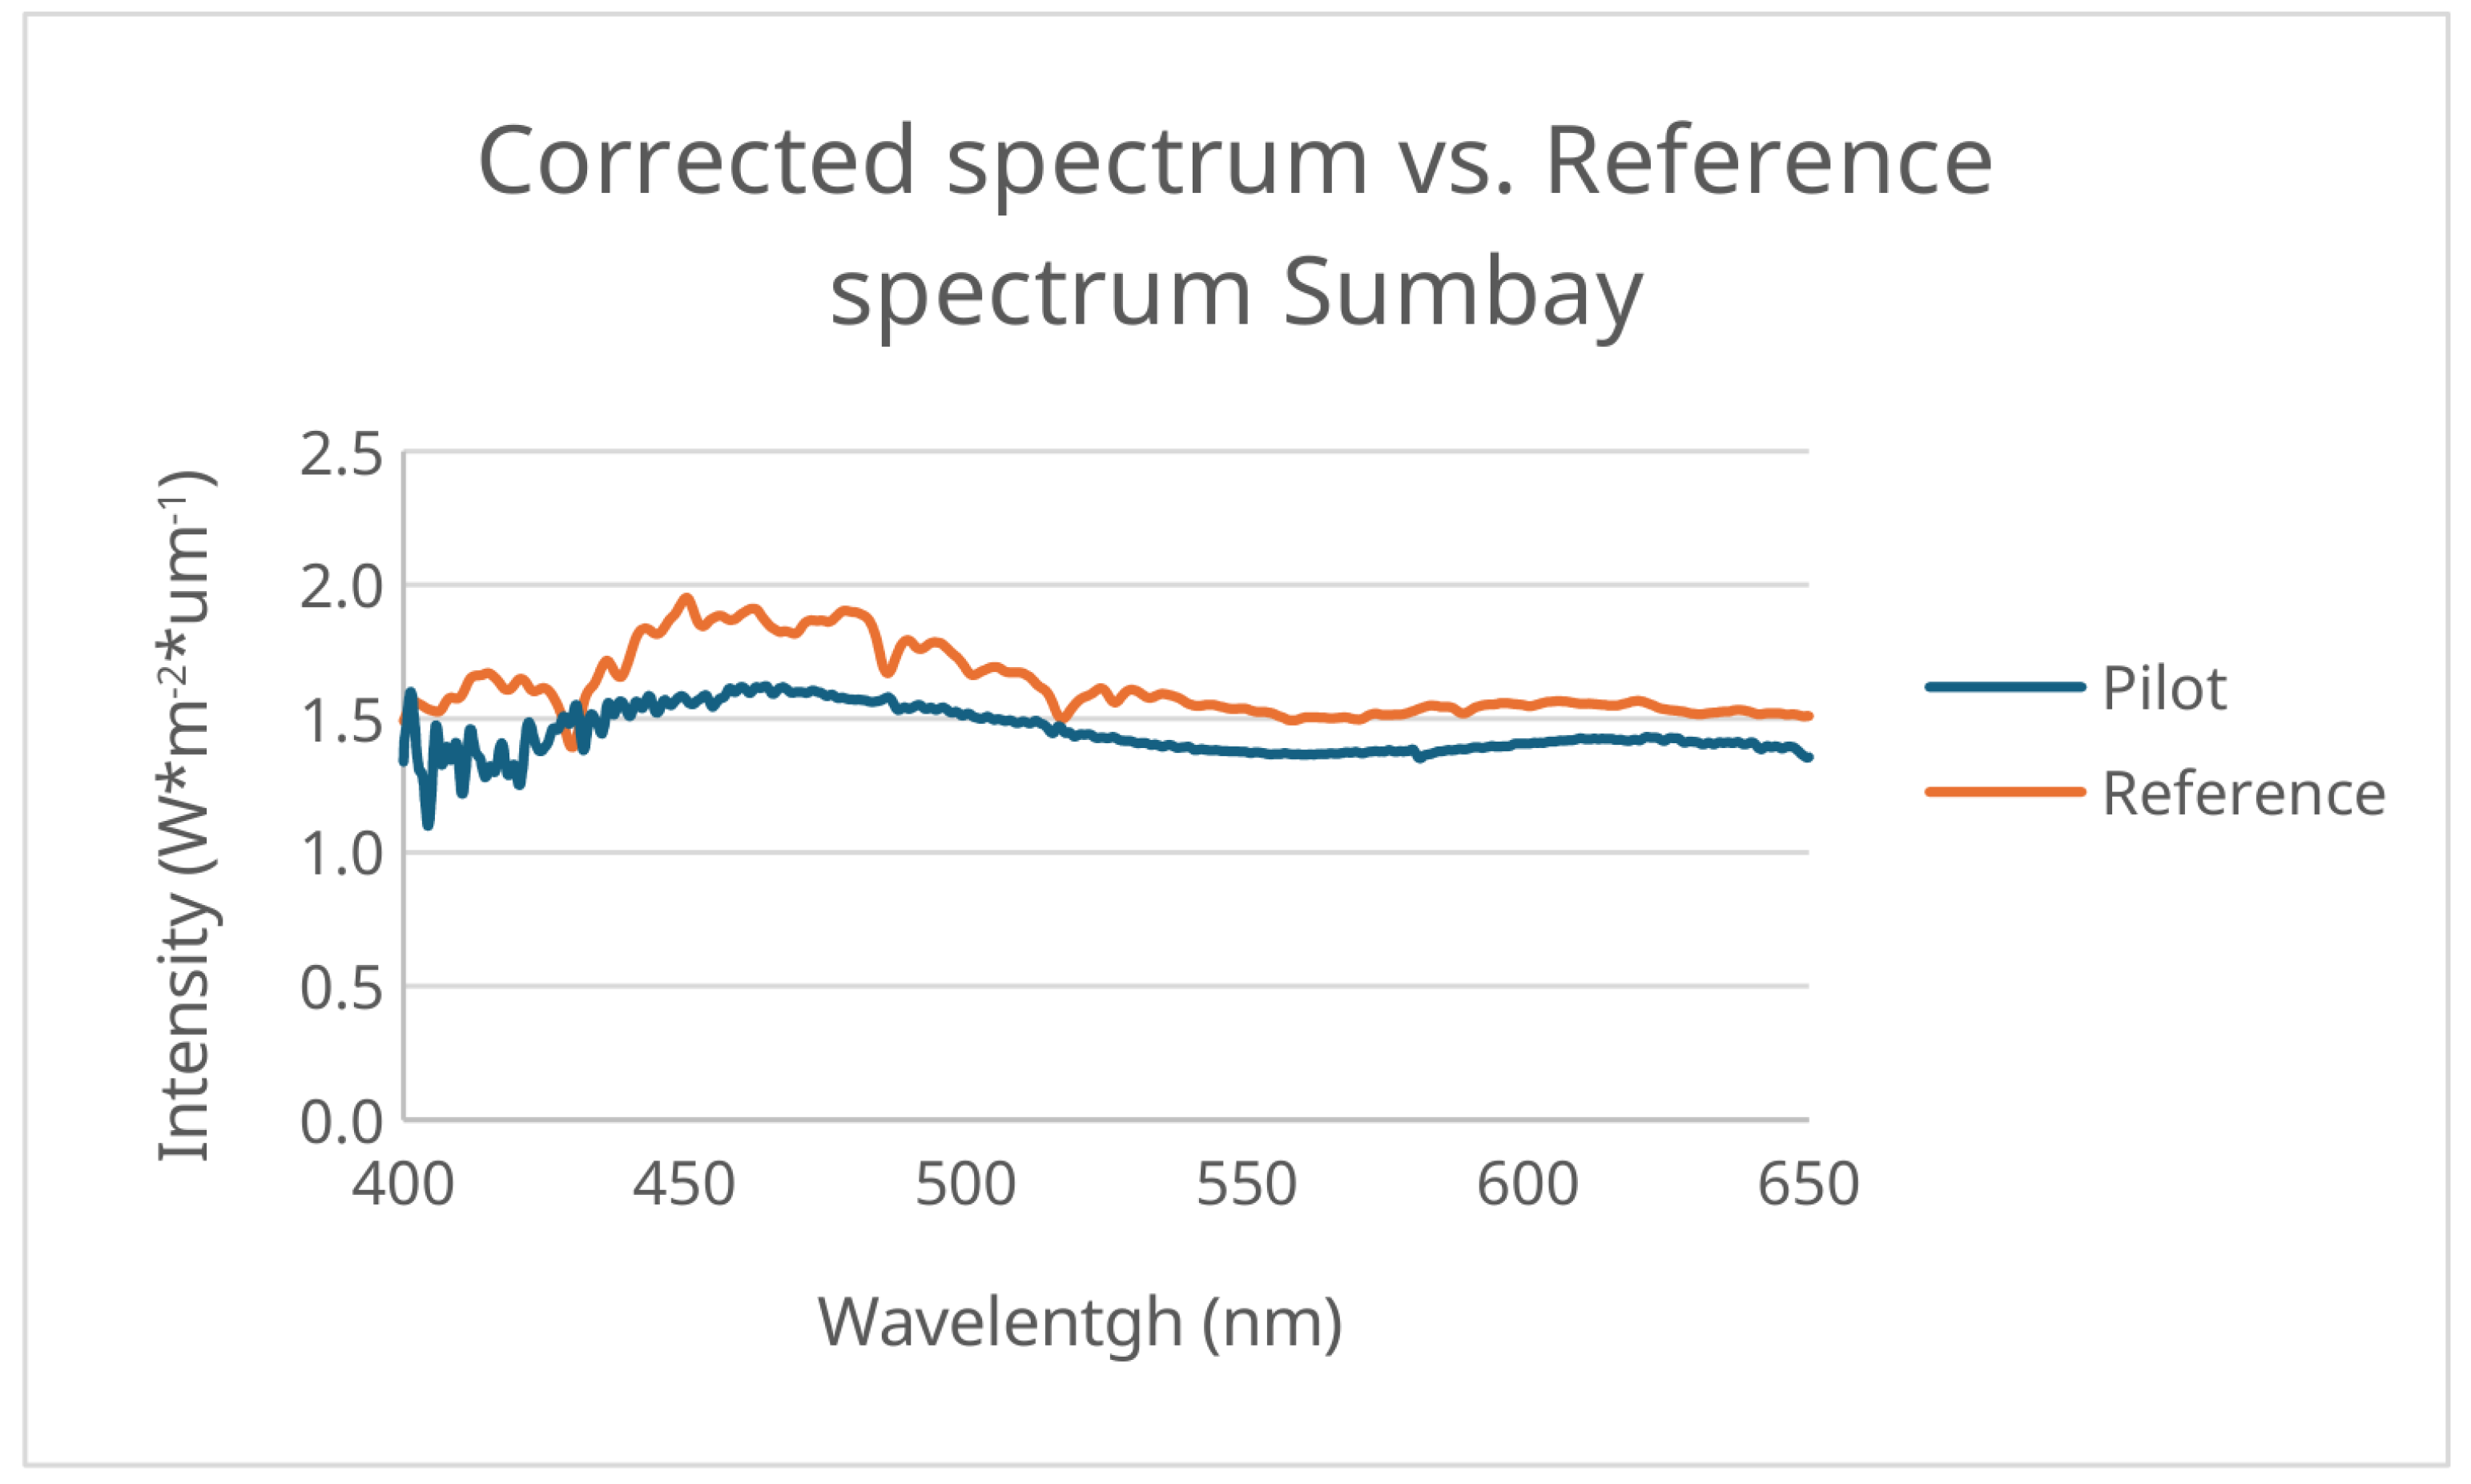
Figure 16.
Comparison of the UV radiation index in different locations.
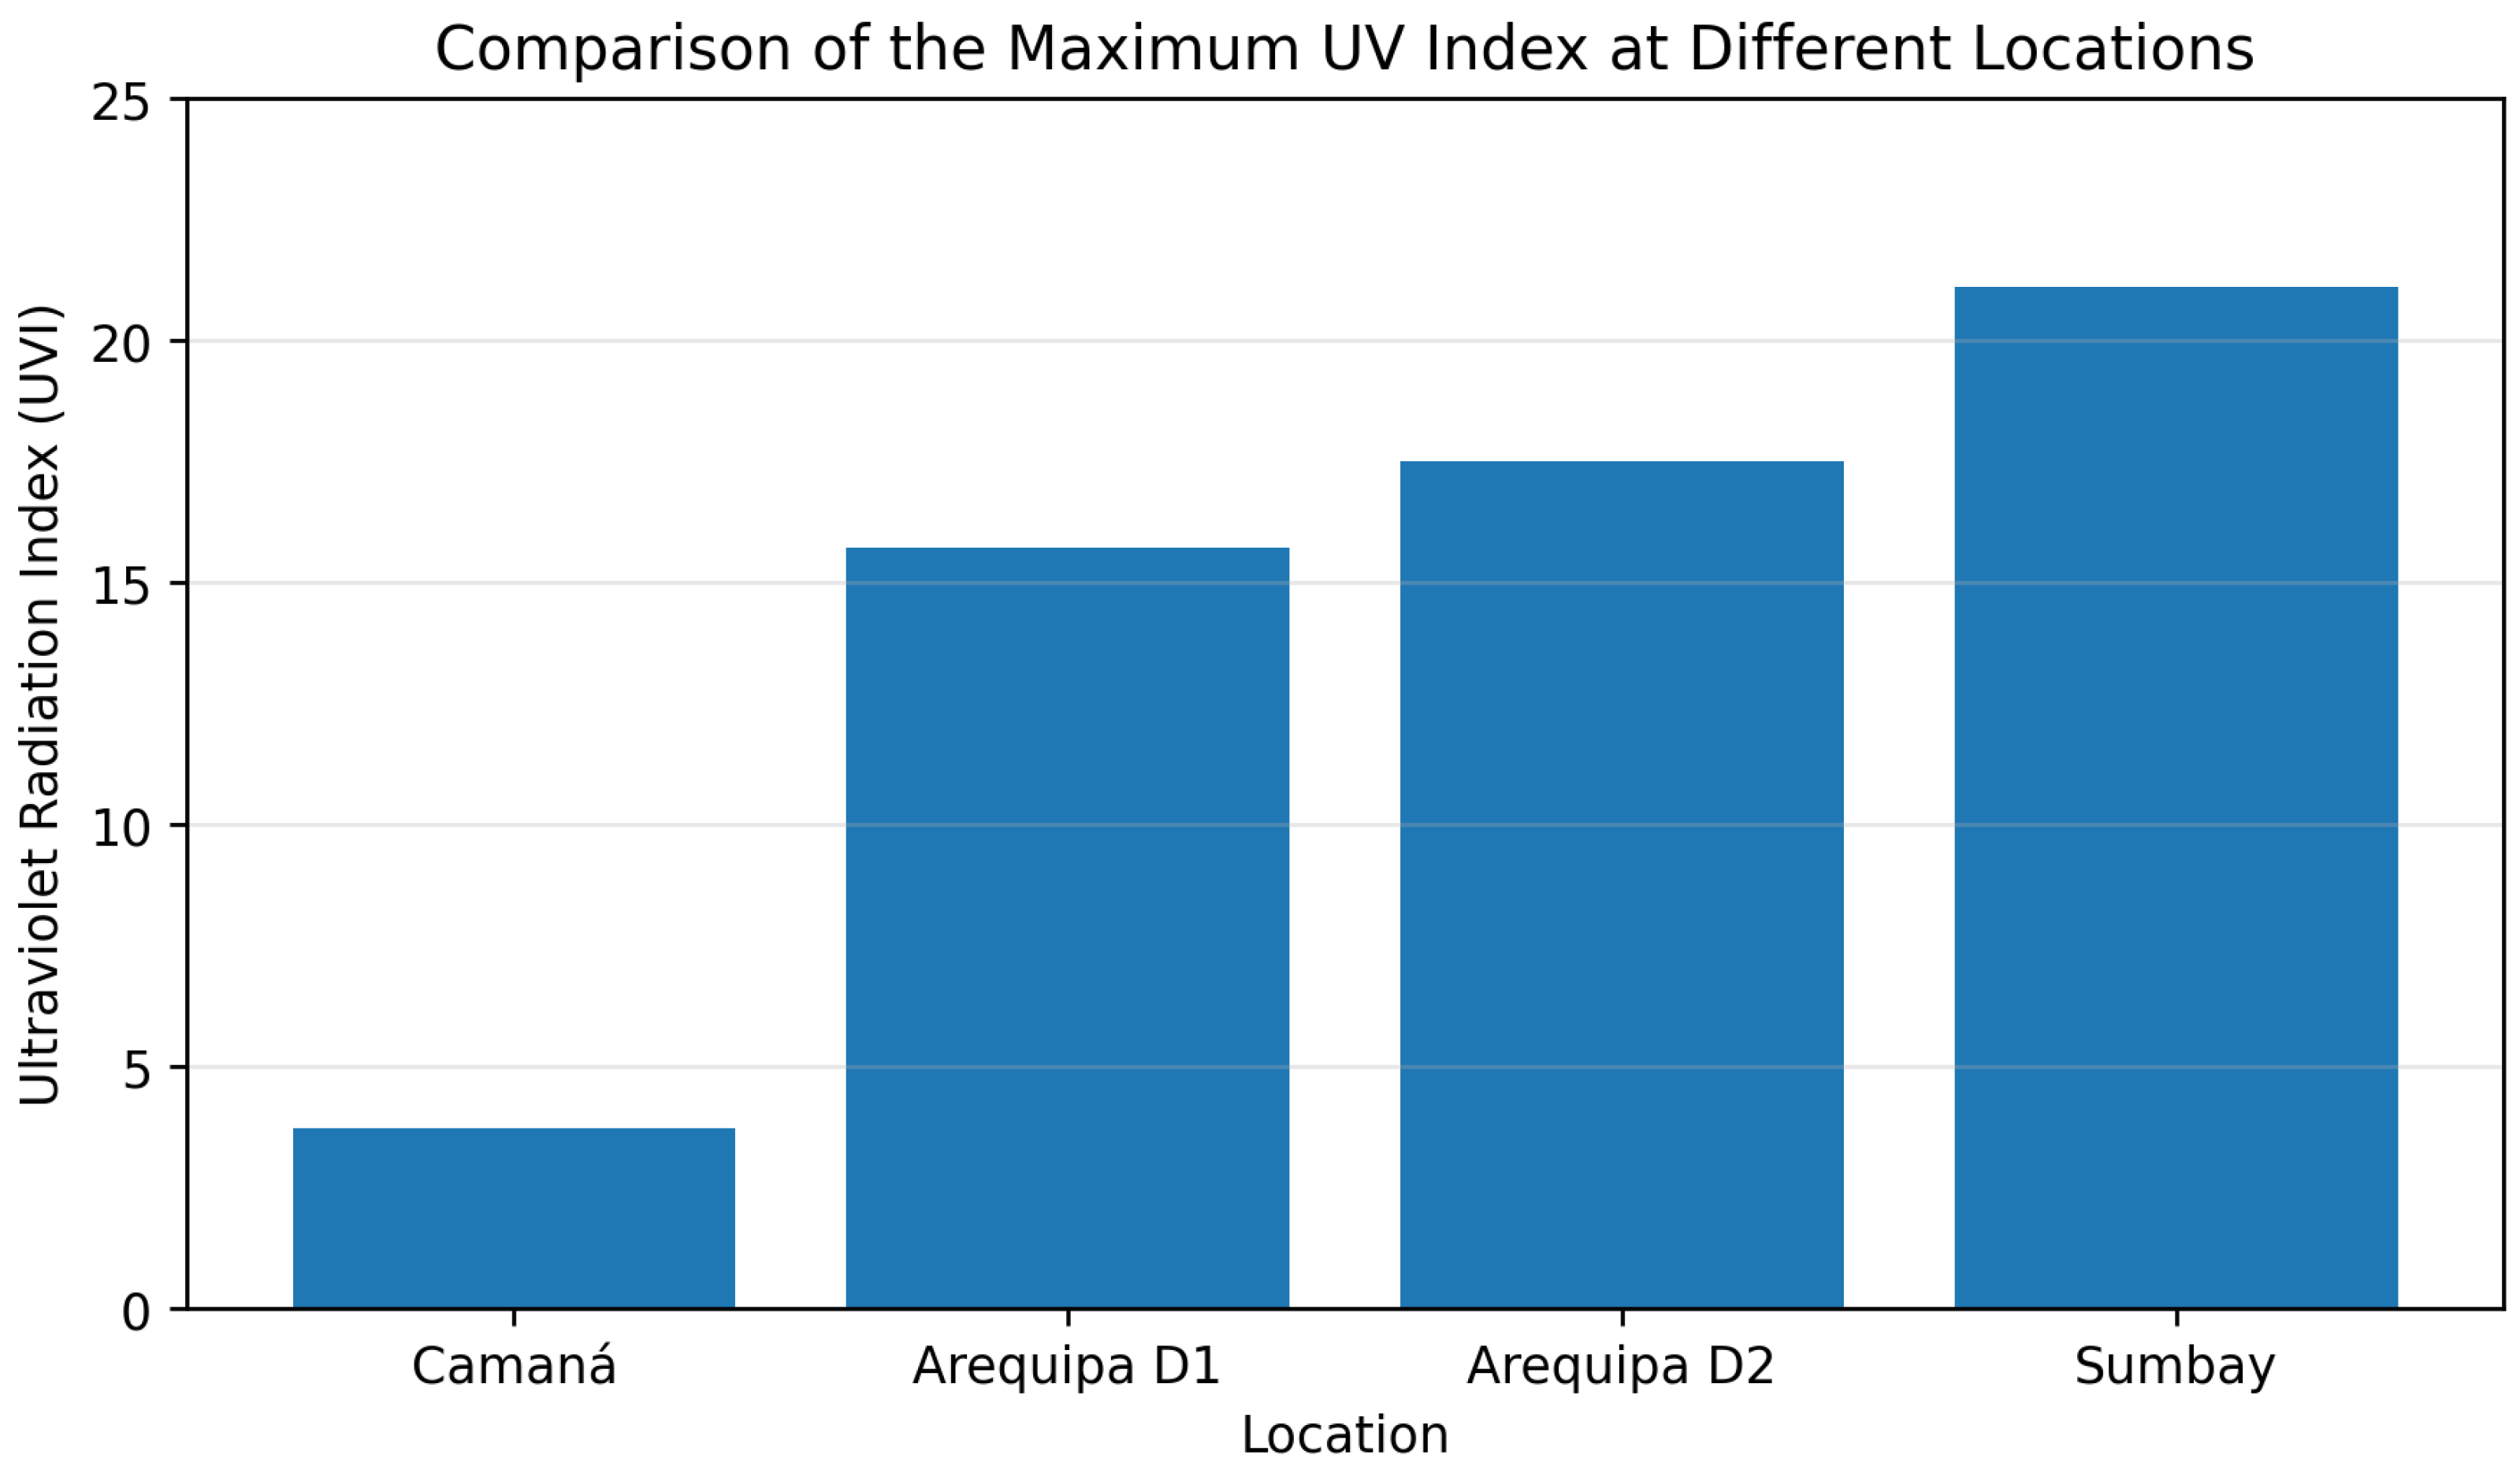
Table 1.
Peak position correction.
| Description | E. Reference (nm) | E. Pilot (nm) | Correction (nm) | Uncertainty (nm) |
|---|---|---|---|---|
| Peak 1 | 404.5 | 405.2 | -0.7 | 2.7 |
| Peak 2 | 435.5 | 438.0 | -2.5 | 2.6 |
| Peak 3 | 546.0 | 547.0 | -1.0 | 3.3 |
| Peak 4 | 577.5 | 577.2 | 0.3 | 2.6 |
Disclaimer/Publisher’s Note: The statements, opinions and data contained in all publications are solely those of the individual author(s) and contributor(s) and not of MDPI and/or the editor(s). MDPI and/or the editor(s) disclaim responsibility for any injury to people or property resulting from any ideas, methods, instructions or products referred to in the content. |
© 2026 by the authors. Licensee MDPI, Basel, Switzerland. This article is an open access article distributed under the terms and conditions of the Creative Commons Attribution (CC BY) license (http://creativecommons.org/licenses/by/4.0/).
Copyright: This open access article is published under a Creative Commons CC BY 4.0 license, which permit the free download, distribution, and reuse, provided that the author and preprint are cited in any reuse.