

Submitted:
10 August 2026
Posted:
11 August 2026
You are already at the latest version
Abstract
Large-scale water infrastructure projects require timely commissioning to generate economic returns and recover invested capital. Delays in reservoir impoundment can significantly reduce project performance by increasing capital lockup, deferring revenue generation, and amplifying financing costs. This study presents an engineering economics evaluation and forensic financial audit of the Zarima–Mayday Dam Project in northern Ethiopia, which was constructed with an initial investment of ETB 13.0 billion (approximately USD 541.67 million at 24 ETB/USD) to irrigate a 40,000-ha commercial sugarcane estate. Owing to delayed reservoir impoundment following completion of civil works, the project remained largely non-operational for approximately ten years. An engineering economics framework based on discounted cash-flow analysis was applied to quantify the economic impacts of project delay. The assessment evaluated the present value of locked capital, annual foregone agricultural revenue, Net Present Value (NPV), Internal Rate of Return (IRR), Benefit–Cost Ratio (BCR), and Capital Recovery Factor (CRF), while accounting for compound interest, inflation, and exchange-rate depreciation using an updated benchmark of 180 ETB/USD. The results indicate a cumulative economic loss of approximately ETB 378.51 billion (about USD 2.1 billion), comprising ETB 155.39 billion in compounded capital lockup and ETB 223.12 billion in foregone agricultural revenue. The Benefit–Cost Ratio declined from 1.45 to 0.28, while the Internal Rate of Return fell below the minimum acceptable discount rate, indicating a substantial deterioration in economic viability. The proposed framework provides a quantitative basis for evaluating delayed infrastructure projects and supports improved commissioning strategies, investment planning, and financial management of future large-scale dam and irrigation developments.
Keywords:
engineering economics
; capital lockup
; reservoir impoundment delay
; forensic financial audit
; discounted cash flow
; Net Present Value
; Internal Rate of Return
; Benefit–Cost Ratio
1. Introduction
The Large Zarima–Mayday Dam Reservoir Project, located in the Tekeze River Basin of northern Ethiopia, is one of the country’s strategic multipurpose water resources investments designed to support large-scale irrigated agriculture, particularly a 40,000-ha commercial sugarcane estate, while maintaining downstream environmental flows [1,2]. The project represents a substantial public infrastructure investment intended to stimulate regional economic growth through enhanced agricultural productivity, employment generation, industrial development, and improved water resources management [3,4,5].
The reservoir has a total storage capacity of 3.6 billion cubic metres (BCM). However, owing to the steep topography of the reservoir valley, the active (usable) storage is limited to approximately 785 million cubic metres (MCM) [2]. Although this physical limitation influences reservoir operation, the project’s most critical challenge is not hydraulic but economic. The project illustrates how inappropriate implementation sequencing can significantly reduce the economic value of an otherwise technically sound infrastructure investment [6,7].
Large water infrastructure projects require substantial upfront capital expenditures and typically experience extended construction periods before benefits are realized [8]. Engineering economics therefore emphasizes the synchronization of construction, commissioning, and revenue generation to minimize capital lockup and maximize investment returns [9,10]. When commissioning is delayed, projects suffer prolonged operational latency during which no economic benefits are generated, while financing costs, the time value of money, compound interest, inflation, and exchange-rate depreciation continue to erode the project’s economic viability [11]. These effects reduce the present value of future benefits, increase the effective cost of investment, and weaken key financial performance indicators [12].
The Zarima–Mayday project represents a compelling case study of engineering capital lockup. The dam was constructed with an initial investment of approximately ETB 13.0 billion, yet reservoir impoundment was not initiated during the construction phase [2]. Instead, filling was postponed until civil works had reached 100% completion, contrary to standard engineering practice in which reservoir impoundment is progressively integrated with the final stages of construction [2]. As a result, the completed infrastructure remained largely idle, with project benefits deferred by an estimated ten years, including approximately four years required for reservoir filling before full operational capacity could be achieved [2]. Consequently, a major public investment remained unproductive while anticipated irrigation development and agricultural production were substantially delayed.
The economic consequences of this implementation strategy extend far beyond the direct construction cost [13]. During the prolonged period of inactivity, the project generated no irrigation revenue to offset financing costs or recover invested capital [14]. The absence of early cash inflows created significant opportunity costs through deferred agricultural production, postponed employment creation, delayed industrial development, and reduced public investment efficiency [15]. From an engineering economics perspective, such delays substantially diminish the Net Present Value (NPV), reduce the Internal Rate of Return (IRR), lower the Benefit–Cost Ratio (BCR), extend the capital recovery period, and increase the overall economic cost of the investment [16,17,18].
These losses were further amplified by Ethiopia’s rapidly changing macroeconomic environment. Since project initiation, the exchange rate has depreciated from approximately 24 ETB/USD to about 180 ETB/USD, significantly increasing the replacement cost of infrastructure and reducing the real purchasing power of the original investment [19]. Simultaneously, persistent inflation and the cumulative effects of compound interest have increased the opportunity cost of locked public capital [20]. Without a rigorous engineering economics assessment that accounts for these macroeconomic changes, the true financial consequences of project delay and asset idleness remain substantially underestimated, limiting the ability of policymakers and infrastructure agencies to make informed investment and implementation decisions [21].
Accordingly, this study applies established engineering economics principles to quantify the financial consequences of delayed project commissioning and prolonged capital lockup. Specifically, the study aims to:
- Quantify the opportunity cost of locked public capital by estimating the present value of the initial investment over a ten-year operational latency period while accounting for inflation, compound interest, and an updated exchange rate of 180 ETB/USD.
- Evaluate the cumulative present value of foregone agricultural revenue by developing discounted cash-flow models to estimate the annual economic losses associated with delayed irrigation of the 40,000-ha command area.
- Reassess the economic feasibility of the project by recalculating key engineering economic indicators, including the Net Present Value (NPV), Benefit–Cost Ratio (BCR), Internal Rate of Return (IRR), and Capital Recovery Factor (CRF) under actual implementation conditions.
The project encompasses the dam axis, reservoir, and irrigation command area within UTM Zone 37N, extending from 1451548 m N to 1562033 m N and 321244 m E to 394095 m E. The dam is situated downstream of the confluence of the Zarima and Dukuko Rivers, controlling a catchment area of approximately 2133 km2 [2]. The Zarima River originates from the high-altitude Semien Mountains between Debark and Zarima, draining one of Ethiopia’s highest rainfall regions where the mean annual precipitation exceeds 2,000 mm [2]. These favorable hydrological conditions provide considerable runoff potential; however, their economic value depends fundamentally on timely reservoir impoundment and efficient project commissioning [22,23]. The geographical location and regional setting of the project are presented in Figure 1.
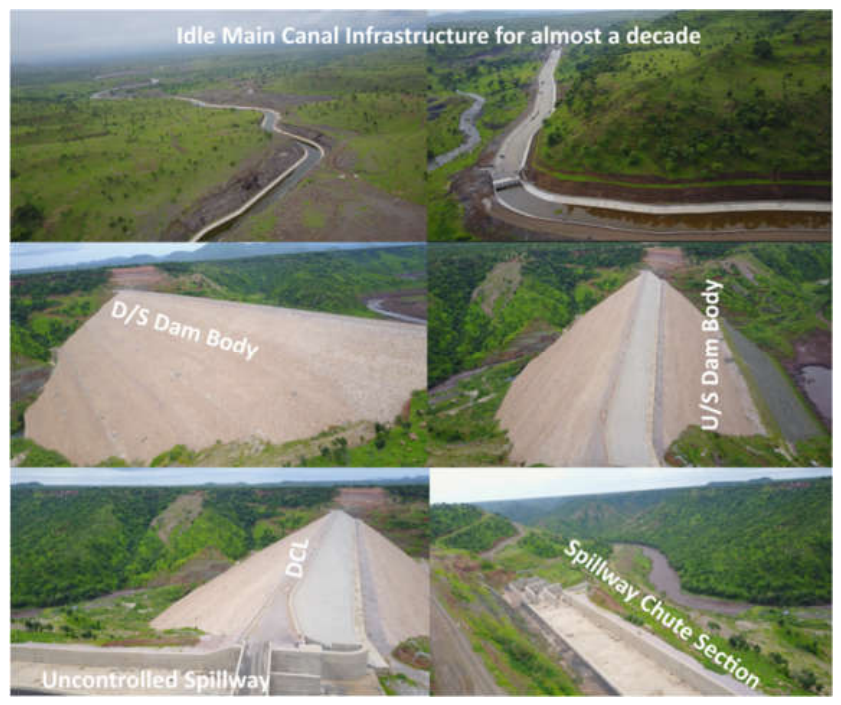
This study demonstrates that the economic success of major water infrastructure projects depends not only on sound engineering design but also on efficient implementation sequencing, timely commissioning, and effective capital management [24]. By integrating engineering economics with infrastructure performance assessment, the study provides a quantitative framework for evaluating the financial consequences of delayed project implementation and offers evidence-based guidance for improving the planning, execution, and governance of future large-scale dam and irrigation projects [25]. Appendix A presented photographic presentation of idle project.
2. Materials and Methods
The evaluation utilizes standard financial engineering and discounted cash flow models. Figure 2 illustrates the methodological workflow.
2.1. Mathematical Formulations for Engineering Economics
The economic consequences of delayed reservoir impoundment and prolonged capital lockup were evaluated using standard engineering economics principles [26]. The analytical framework integrates capital valuation, discounted cash flow analysis, opportunity-cost assessment, and investment appraisal techniques to quantify the financial implications of delayed project commissioning [27]. The principal evaluation indicators include the Present Value of Locked Capital, Annual Foregone Crop Revenue Loss, Cumulative Present Value of Lost Revenue, Net Present Value (NPV), Internal Rate of Return (IRR), Benefit–Cost Ratio (BCR), and Capital Recovery Factor (CRF) [28].
2.1.1. Present Value of Locked Capital Base (PVcap)
The future value of the initial capital investment after remaining economically inactive for n years is estimated using compound interest theory [29]: shown in equation 1.
PVcap = C0 × (1 + i)ⁿ ……..Equation 1
Where: C0 = Initial capital investment (ETB or USD), i = Annual interest rate or opportunity cost of capital, n = Number of years, PVcap = Value of the locked capital after n years (more accurately, its future value)
2.1.2. Annual Foregone Crop Revenue Loss (Lcrop,t)
The annual economic loss resulting from delayed agricultural production is estimated as shown in equation 2 [30].
Equation 2
Where: Lcrop,t = Annual foregone crop revenue loss in year t (ETB/year), Command Area = Total irrigable land (ha) ,Crop Yield = Average annual crop production per hectare (tons/ha/year), Net Marginton = Net economic benefit (profit) earned from each ton of crop (ETB/ton), (1+π)t = Inflation adjustment factor π = Annual inflation rate, t = Number of years after the base year
2.1.3. Cumulative Present Value of Lost Revenue (PVrevenue)
The cumulative present value of agricultural revenue forgone over the evaluation period is determined using discounted cash-flow analysis [31]: as shown in Equation 3.
+++……
………..Equation 3
Where: PVrevenue = Cumulative Present Value of Lost Revenue (ETB), Lcrop,t = Annual foregone crop revenue loss in year t (ETB), i = Discount rate (decimal form, e.g., 10% = 0.10), t = Year of analysis, N = Total number of years in the evaluation period.
2.1.4. Net Present Value (NPV)
The Net Present Value (NPV) is one of the most widely used financial and economic appraisal indicators for evaluating the profitability and economic viability of an investment project [17,32]. It measures the difference between the present value of all future project benefits and the present value of all project costs over the project’s evaluation period. Project profitability is evaluated using the Net Present Value criterion can be written as Equation 4.
+ + +…….+
Equation 4
Where: NPV = Net Present Value (ETB or USD), Bt = Gross benefits (revenues) generated in year t, Ct = Annual operation and maintenance (O&M) costs incurred in year t, C0 = Initial capital investment or construction cost, i = Discount rate (opportunity cost of capital), t = Year of analysis, N = Total project evaluation period (years).
The annual net benefit for each year is obtained by subtracting the annual operating cost from the annual gross benefit (Bt - Ct) [32]. Each year’s net benefit is then discounted to its present value using the selected discount rate. Finally, the initial investment cost is deducted to determine the project’s Net Present Value.
- NPV > 0: The project is economically and financially viable because the discounted benefits exceed the discounted costs.
- NPV = 0: The project exactly recovers its investment and earns the required rate of return.
- NPV < 0: The project is not economically viable because the discounted costs exceed the discounted benefits.
The NPV criterion is widely used in the economic appraisal of irrigation, water resources, and infrastructure projects because it accounts for the time value of money and evaluates the project’s overall contribution to economic welfare over its entire service life [33].
2.1.5. Internal Rate of Return (IRR)
The Internal Rate of Return is the discount rate that reduces the Net Present Value to zero [34], can be written as equation 5.
Equation 5
Where the discount rate r∗ is the Internal Rate of Return (IRR), variables: Bt = Gross benefits (revenues) in year t , Ct = Operation and maintenance (O&M) costs in year t, C0 = Initial capital investment, r∗ = Internal Rate of Return (IRR), t = Year of analysis, N = Project evaluation period (years). The IRR is the discount rate r∗ that makes the project’s Net Present Value (NPV) equal to zero. A project is generally considered economically viable if its IRR is greater than the selected discount rate or the minimum acceptable rate of return [35].
2.1.6. Benefit-Cost Ratio (BCR)
The Benefit Cost Ratio compares the present value of project benefits with the present value of project costs [8,36]: Mathematical Formula is used in engineering economics, cost–benefit analysis, and infrastructure project appraisal can be written as equation 6. .
…..Equation 6
Where: BCR = Benefit Cost Ratio, Bt = Gross benefits (revenues) in year t, Ct = Annual operation and maintenance (O&M) costs in year t, C0 = Initial capital investment, i = Discount rate, t = Year of analysis , N = Project evaluation period (years).
Decision Rule [36]
- BCR > 1 → the project’s discounted benefits exceed its discounted costs; the project is economically viable.
- BCR = 1 → the project’s discounted benefits equal its discounted costs.
- BCR < 1 → the project’s discounted costs exceed its discounted benefits; the project is not economically viable.
2.1.7. Capital Recovery Factor (CRF):
The Capital Recovery Factor converts the present value of an investment into an equivalent uniform annual cost [37,38], can be written as equation 7.
……Equation 7
Where: CRF(i,N) = Capital Recovery Factor, i = Annual discount (interest) rate, N = Project life or repayment period (years).The Capital Recovery Factor (CRF) converts the present value of an investment into an equivalent uniform annual payment over the project’s economic life [38].
2.2. Macroeconomic and Financial Assumptions
The engineering economics analysis was conducted using the macroeconomic assumptions [39,40] summarized in Table 1.
The selected discount rate represents the social opportunity cost of public capital and reflects the long-term cost of financing large-scale water infrastructure investments. Inflation, exchange-rate depreciation, and compound interest effects were incorporated into the economic analysis to estimate the cumulative financial consequences of delayed reservoir impoundment and prolonged capital lockup [41].
3. Results and Discussion
3.1. Economic Consequences of Delayed Reservoir Commissioning
The engineering economics analysis quantified the financial consequences of delayed reservoir impoundment and prolonged capital lockup associated with the Zarima–Mayday Dam Project [42,43]. The project was originally implemented with an initial capital investment of ETB 13.0 billion, equivalent to approximately USD 541.67 million at the prevailing exchange rate of 24 ETB/USD. Using the updated exchange-rate benchmark of 180 ETB/USD, the indexed replacement value of the original investment increased to approximately ETB 97.5 billion, demonstrating the significant influence of exchange-rate depreciation on the economic value of long-gestation public infrastructure projects.
Applying a 10% social opportunity discount rate, the opportunity cost of maintaining the completed infrastructure in an idle state increased progressively throughout the delay period. By Year 10, the present value of the locked capital reached ETB 155.39 billion, while the cumulative present value of foregone agricultural revenue reached ETB 223.12 billion. Consequently, the total cumulative economic loss attributable to delayed project commissioning amounted to approximately ETB 378.51 billion, equivalent to 3.88 times the indexed replacement value of the project or 29.1 times the original nominal capital investment.
Annual agricultural revenue losses were estimated using Equation (2) assuming an irrigated command area of 40,000 ha, an average sugarcane yield of 130 t ha−1¹ −1r⁻¹, and a net economic margin of ETB 2,6−12 t⁻¹. Under these assumptions, the project incurred estimated annual foregone agricultural revenue of approximately ETB 14.0 billion.
Table 2 presents the annual progression of capital lockup, discounted agricultural revenue losses, and cumulative economic losses during the ten-year implementation delay. The results indicate that both capital opportunity costs and foregone agricultural benefits increased continuously over time because of compound interest and the time value of money. Capital lockup losses increased from ETB 9.75 billion in Year 1 to ETB 155.39 billion in Year 10, while the cumulative present value of foregone agricultural production increased from ETB 14.00 billion to ETB 223.12 billion over the same period. As a result, cumulative economic losses rose from ETB 23.75 billion in Year 1 to ETB 378.51 billion by the end of the tenth year, demonstrating the rapid escalation of financial losses associated with prolonged project idleness.
These findings demonstrate that implementation delays impose economic costs substantially greater than the direct construction cost of the infrastructure itself. Beyond delaying project benefits, prolonged operational latency erodes the economic value of public capital through compounding financing costs and sustained revenue losses. From an engineering economics perspective, the results emphasize that reservoir impoundment and operational commissioning should be treated as critical financial milestones, because delays in these stages can fundamentally undermine the long-term economic performance of large-scale water infrastructure investments (Figure 3).
3.2. Economics Feasibility Assessment
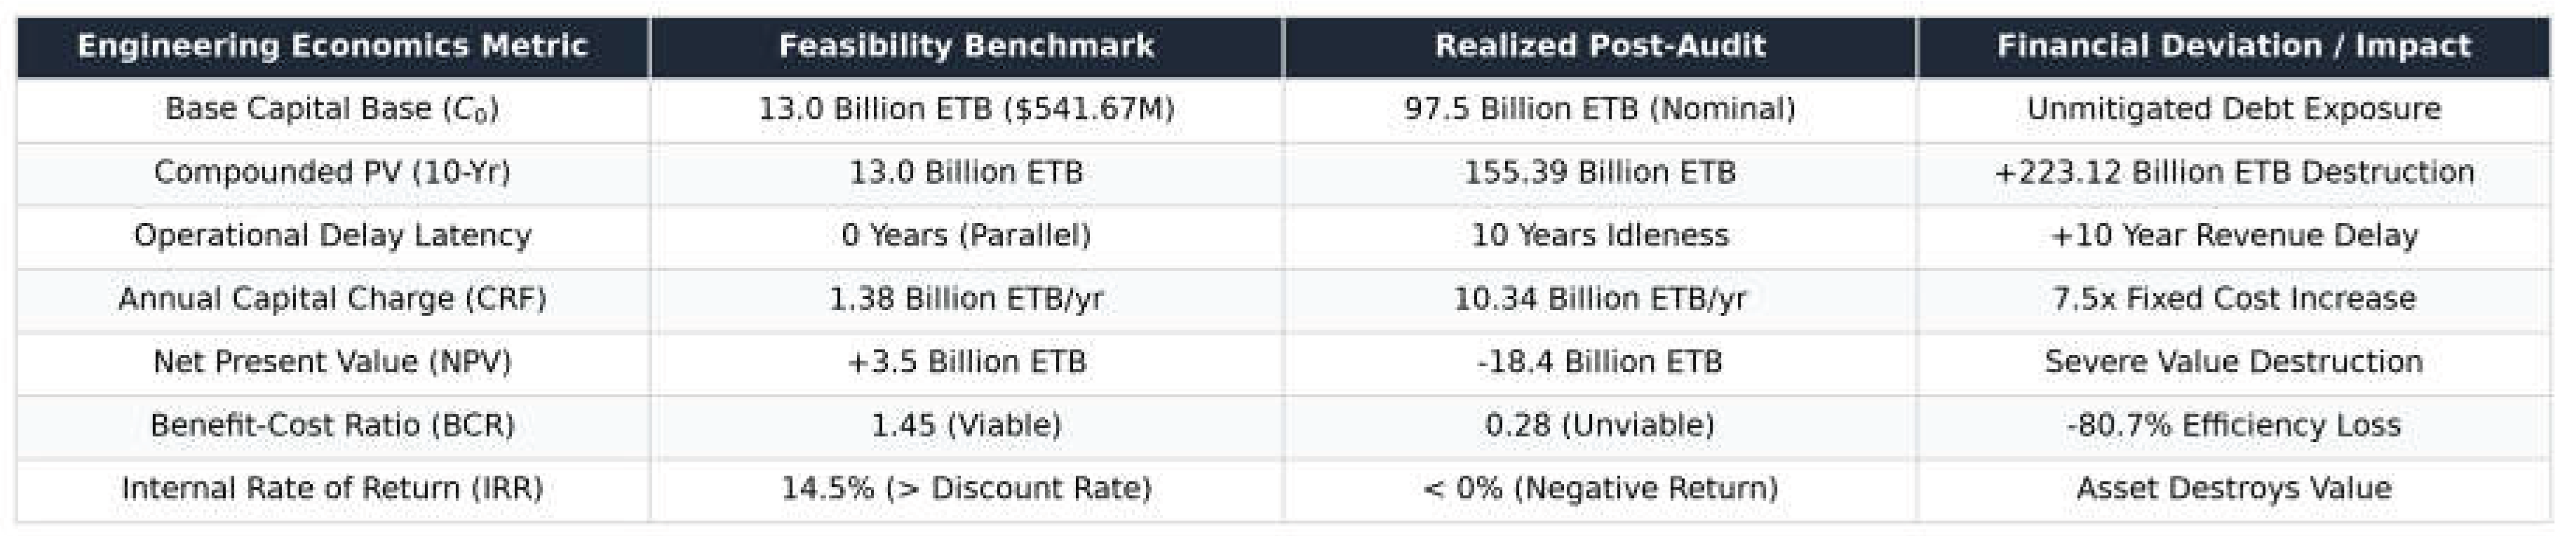
The engineering economic indicators obtained from the post-audit analysis differed substantially from those reported during the original feasibility assessment [44]. Table 3 compares the expected financial performance with the audited results after incorporating delayed commissioning, exchange-rate depreciation, inflation, and capital opportunity costs.
The post-audit engineering economics analysis reveals a substantial deterioration in the project’s financial performance compared with the original feasibility assessment (Table 3). The indexed capital value increased from the original investment of ETB 13.0 billion to an equivalent replacement value of approximately ETB 97.5 billion, reflecting the cumulative effects of exchange-rate depreciation from 24 ETB/USD to 180 ETB/USD. Consequently, the compounded present value of the locked capital increased from ETB 13.0 billion to ETB 155.39 billion, representing an additional ETB 223.12 billion in opportunity cost attributable to prolonged capital lockup. Likewise, the equivalent annual capital charge, calculated using the Capital Recovery Factor (CRF), increased from ETB 1.38 billion per year to ETB 10.34 billion per year, corresponding to an approximately 7.5-fold increase in the annual fixed capital burden.
Similarly, the project’s economic viability deteriorated considerably under the post-audit scenario. The Net Present Value (NPV) declined from an anticipated ETB 3.5 billion during the feasibility stage to −ETB 18.4 billion following ten years of operational delay, indicating that the discounted project costs substantially exceeded the discounted economic benefits. The Benefit–Cost Ratio (BCR) decreased from 1.45, indicating an economically viable investment, to 0.28, implying that each Ethiopian Birr invested generated only ETB 0.28 in discounted benefits. Furthermore, the Internal Rate of Return (IRR) declined from an expected 14.5%, which exceeded the selected 10% social discount rate, to below 0%, demonstrating that the project failed to generate a positive economic return under actual implementation conditions (Figure 4).
These findings demonstrate that prolonged implementation delays, combined with exchange-rate depreciation and the opportunity cost of locked public capital, fundamentally altered the project’s economic performance. Although the project was originally considered financially viable, the cumulative effects of delayed commissioning transformed it into an economically unviable investment. This outcome underscores the importance of integrating construction sequencing, phased commissioning, macroeconomic risk assessment, and continuous engineering economics auditing into the planning and implementation of large-scale water infrastructure projects to safeguard public investment and maximize long-term economic returns.
3.3. Sensitivity Analysis to Discount Rates
Figure 5 demonstrates the sensitivity of total present value losses to social discount rates ranging from 6% to 14%. Even at a conservative 6% rate, cumulative 10-year losses reach 318.2 Billion ETB, rising to 584.4 Billion ETB at a 14% rate. This trend demonstrates that the economic consequences of delayed commissioning become increasingly severe as the opportunity cost of public capital rises.
The sensitivity analysis confirms that delayed reservoir impoundment represents a significant financial risk under all plausible discount-rate scenarios and emphasizes the importance of timely project commissioning for protecting public investment.
3.4. Comparative Assessment with Previous Studies
The economic losses estimated in this study are broadly consistent with previous research demonstrating that implementation delays substantially reduce the financial performance of large-scale infrastructure projects. Studies by [45], [46], and [47] similarly reported that delayed commissioning increased financing costs, reduced Net Present Value, and extended capital recovery periods.
Unlike previous investigations, however, the present study explicitly integrates exchange-rate depreciation, inflation, compound interest, and opportunity-cost valuation within a unified engineering economics framework [48]. This approach provides a more comprehensive assessment of the long-term financial consequences of delayed reservoir impoundment in developing economies characterized by significant macroeconomic volatility [49,50].
3.5. Practical Implications for Infrastructure Management
The findings have several practical implications for the planning and implementation of future water infrastructure projects. First, reservoir impoundment should be integrated with the final stages of dam construction wherever technically feasible to minimize capital lockup and accelerate revenue generation [51]. Second, feasibility studies should explicitly incorporate exchange-rate uncertainty, inflation, and opportunity-cost analysis when evaluating long-gestation infrastructure investments [52]. Third, phased commissioning of irrigation command areas should be adopted to generate early cash flows and improve investment performance before full project completion. Finally, engineering economics indicators including the Net Present Value (NPV), Benefit–Cost Ratio (BCR), Internal Rate of Return (IRR), and Capital Recovery Factor (CRF) should be monitored throughout project implementation rather than being confined to the initial feasibility stage [14,40]. Continuous financial auditing can provide early warning of declining project performance and support timely corrective actions
3.6. Study Limitations
This study is subject to several limitations. The economic analysis is based on the available project data and assumes constant crop productivity, operating costs, and market conditions over the evaluation period. Although sensitivity analyses were undertaken to examine the influence of discount-rate assumptions, additional uncertainties associated with climate variability, agricultural commodity prices, future maintenance costs, and policy changes were not explicitly modeled.
Future research should integrate stochastic simulation techniques, probabilistic risk analysis, and real-options valuation to provide a more comprehensive assessment of uncertainty in large-scale water infrastructure investments.
4. Conclusions and Recommendations
4.1. Conclusions
This study presented an engineering economics evaluation and forensic financial audit of the Zarima–Mayday Dam Project to quantify the economic consequences of delayed reservoir impoundment and prolonged capital lockup. Using a discounted cash-flow framework that incorporates compound interest, inflation, opportunity cost, and exchange-rate depreciation, the analysis demonstrates the substantial financial implications of delayed commissioning for large-scale public infrastructure projects.
The results indicate that approximately ten years of operational latency generated an estimated cumulative economic loss of ETB 378.51 billion (approximately USD 2.1 billion at an exchange rate of 180 ETB/USD). Of this total, ETB 155.39 billion resulted from compounded capital lockup, while ETB 223.12 billion was attributable to foregone agricultural production within the 40,000-ha irrigation command area. The economic performance of the project deteriorated substantially, with the Benefit–Cost Ratio (BCR) declining from an anticipated 1.45 to 0.28, and the Internal Rate of Return (IRR) falling below the minimum acceptable discount rate, indicating that delayed implementation significantly reduced the project’s economic viability.
The findings highlight that the timing of reservoir impoundment and project commissioning is as critical to investment performance as engineering design and construction quality. Failure to align construction completion with phased operational commissioning can substantially reduce the economic value of public investments and delay the realization of expected development benefits [53,54]. The engineering economics framework presented in this study provides a practical methodology for evaluating the financial consequences of implementation delays and for strengthening economic decision-making in future water infrastructure projects.
4.2. Recommendations
Based on the findings of this study, the following recommendations are proposed to improve the economic performance and financial governance of future large-scale dam and irrigation projects:
- Adopt phased reservoir impoundment strategies. Reservoir filling should be integrated with the final stages of dam construction wherever technically feasible to accelerate commissioning, shorten the period of capital lockup, and reduce financing costs.
- Incorporate macroeconomic risk into project appraisal. Feasibility studies should explicitly account for inflation, exchange-rate depreciation, interest-rate variability, and the time value of money through dynamic financial modelling and sensitivity analysis to improve the robustness of long-term investment decisions.
- Implement phased operational commissioning. Large irrigation developments should be commissioned in stages to enable partial delivery of irrigation services and early revenue generation while the remaining infrastructure is completed, thereby improving cash flow and reducing opportunity costs.
- Strengthen financial governance and performance monitoring. Public infrastructure projects should include engineering economics performance indicators, including Net Present Value (NPV), Benefit–Cost Ratio (BCR), Internal Rate of Return (IRR), and Capital Recovery Factor (CRF), as mandatory monitoring and evaluation metrics throughout project implementation and operation.
- Institutionalize engineering economics audits. Independent engineering economics assessments should be conducted at key stages of project development, including planning, construction, commissioning, and post-completion evaluation, to identify financial risks early and support evidence-based investment management.
The adoption of these measures will improve capital efficiency, reduce the financial risks associated with delayed implementation, and enhance the long-term sustainability and economic performance of future public water infrastructure investments.
Author Contributions
Mehari Gebreyohannes Hiben: Conceptualization, Methodology, Investigation, Formal Analysis, Data Curation, Writing Original Draft, Writing Review & Editing, Visualization, Validation, Project Administration. Habtamu Itefa Geleta: Methodology, Investigation, Data Curation, Formal Analysis, Validation, Writing Review & Editing. Admassu Tesso: Methodology, Investigation, Formal Analysis, Validation, Writing Review & Editing, Supervision.
Funding
The authors received no specific grant from any funding agency in the public, commercial, or not-for-profit sectors. The work was conducted independently as part of the authors’ professional and academic research activities.
Ethics Statement
The authors confirm that this study was conducted in strict accordance with the academic, scientific, and professional ethical standards mandated by the publisher. This research is based entirely on non-experimental field assessments, numerical simulation modeling, and institutional engineering data records obtained from public water agencies. It does not involve human participants, animal testing, or clinical trials; consequently, specific institutional review board (IRB) approval was not required.
Data Availability Statement
Data will be made available by the corresponding author upon reasonable request, subject to any applicable institutional restrictions and confidentiality requirements.
Acknowledgments
he authors would like to express their gratitude to the Water and Energy Minister, Addis Ababa, Ethiopia, and the Ethiopian Sugar Corporation for providing access to technical project reports, hydrological records, and necessary engineering design data. We also thank the field technicians and local professionals who facilitated data collection and site inspections at the Zarema-Mayday dam.
Conflicts of Interest
The authors declare that they have no known competing financial interests, professional conflicts, or personal relationships that could have influenced the work reported in this paper.
Appendix A [2]
References
- Zegeye, M.K.; Bekitie, K.T.; Hailu, D.N. Spatio-temporal variability and trends of hydroclimatic variables at Zarima Sub-Basin North Western Ethiopia. Environ. Syst. Res. 2022, 11 27. [Google Scholar] [CrossRef]
- Hiben, M.G.; Geleta, H.I.; Ashenafi, A.A. Zarima-Mayday Dam: Impoundment Construction Gaps, Irrigation Deficits, and Reservoir Reliability, Preprints. 2026. [Google Scholar] [CrossRef]
- Kamski, B. The Kuraz Sugar Development Project (KSDP) in Ethiopia: between ‘sweet visions’ and mounting challenges. J. East. Afr. Stud. 2016, 10, 568–580. [Google Scholar] [CrossRef]
- Kamski, B. Water, sugar, and growth: the practical effects of a ‘failed’ development intervention in the southwestern lowlands of Ethiopia. J. East. Afr. Stud. 2019, 13, 621–641. [Google Scholar] [CrossRef]
- Admassie, D. Abebaw, Ethiopia - land, energy, climate change, and agricultural development: A study in the Sudano-Sahel Initiative for regional development, jobs, and food security, University of Bonn, Center for Development Research (ZEF). Bonn, 2021. Available online: https://hdl.handle.net/10419/246467.
- Lima; Herrera, T.; Tran, P.; Nelson, J. Assessment of Reservoir Drive Mechanisms and Their Influence on Cost Planning and Economic Feasibility of Water Well Drilling Projects. 2026. [Google Scholar] [PubMed]
- Pohlner, H. Institutional change and the political economy of water megaprojects: China’s south-north water transfer. Glob. Environ. Change 2016, 38, 205–216. [Google Scholar] [CrossRef]
- Vickerman, R. Cost — Benefit Analysis and Large-Scale Infrastructure Projects: State of the Art and Challenges. Environ. Plan. B Plan. Des. 2007, 34, 598–610. [Google Scholar] [CrossRef]
- Beck, G. Grid parity: The art of financing renewable energy projects in the US; CRC Press, 2020. [Google Scholar]
- Eschenbach, T.G. Engineering economy: applying theory to practice; Oxford University Press, 2011. [Google Scholar]
- Nnadi, E.O.E.; Najjobyo, J. Financial and operational effects of cost estimation inaccuracy, material price volatility, and payment delays in Nigerian construction projects. Smart Constr. Sustain. Cities 2025, 3 29. [Google Scholar] [CrossRef]
- Park, C.S.; Kim, G.; Choi, S. Engineering economics; United Stated Pearson Prentice Hall, 2007. [Google Scholar]
- Mao, C.; Xie, F.; Hou, L.; Wu, P.; Wang, J.; Wang, X. Cost analysis for sustainable off-site construction based on a multiple-case study in China. Habitat Int. 2016, 57, 215–222. [Google Scholar] [CrossRef]
- Liu, L.; Tai, H.-W.; Wang, T.; Qiao, L.; Cheng, K.-T. Analyzing cost impacts across the entire process of prefabricated building components from design to application. Sci. Rep. 2025, 15, 9300. [Google Scholar] [CrossRef] [PubMed]
- Ford, D.N.; Lander, D.M.; Voyer, J.J. A real options approach to valuing strategic flexibility in uncertain construction projects. Constr. Manag. Econ. 2002, 20, 343–351. [Google Scholar] [CrossRef]
- Datta, U.; Kalam, A.; Shi, J. The economic prospect of rooftop photovoltaic (PV) system in the commercial buildings in Bangladesh: a case study. Clean. Technol. Environ. Policy 2020, 22, 2129–2143. [Google Scholar] [CrossRef]
- Dai, Haotian; Li, Ningfan; Wang, Yuhan; Zhao, Xinrui. The Analysis of Three Main Investment Criteria: NPV IRR and Payback Period. Proc. 2022 7th Int. Conf. Financ. Innov. Econ. Dev. ICFIED 2022, 2022; Atlantis Press; pp. 185–189. [Google Scholar] [CrossRef]
- Mujuka, E.; Mburu, J.; Ogutu, A.; Ambuko, J. Returns to investment in postharvest loss reduction technologies among mango farmers in Embu County, Kenya. Food Energy Secur 2020, 9, e195. [Google Scholar] [CrossRef]
- Woldie, G.A.; Siddig, K. Macroeconomic and distributional impacts of exchange rate devaluation in Ethiopia: A computable general equilibrium approach. Heliyon 2019, 5. [Google Scholar] [CrossRef] [PubMed]
- Eaton, J. Fiscal Policy, Inflation and the Accumulation of Risky Capital. Rev. Econ. Stud. 1981, 48, 435–445. [Google Scholar] [CrossRef] [PubMed]
- Flyvbjerg, B. The Oxford handbook of megaproject management; Oxford University Press, 2017. [Google Scholar]
- Połomski, M.; Wiatkowski, M. Impounding reservoirs, benefits and risks: A review of environmental and technical aspects of construction and operation. Sustainability 2023, 15, 16020. [Google Scholar] [CrossRef]
- Chhuon, K.; Herrera, E.; Nadaoka, K. Application of Integrated Hydrologic and River Basin Management Modeling for the Optimal Development of a Multi-Purpose Reservoir Project. Water Resour. Manag. 2016, 30, 3143–3157. [Google Scholar] [CrossRef]
- Hilbig, J.; Rudolph, K.-U. Sustainable water financing and lean cost approaches as essentials for integrated water resources management and water governance: Lessons learnt from the Southern African context. Water Sci. Technol. Water Supply 2018, 19, ws2018099. [Google Scholar] [CrossRef]
- Hussain; Khalid, Q.S.; Hussain, I.; Omair, M.; Habib, M.S. A framework for project sustainability assessment and schedule optimization in multi-mode construction projects. Int. J. Manag. Sci. Eng. Manag. 2026, 0, 1–26. [Google Scholar] [CrossRef]
- McDaniel, R.R.; Hughes, R.E. Economic Implications Of Reservoir Engineering Analyses; 1971. [Google Scholar] [CrossRef]
- Razieh, Anari; Gaston, Todd L.; Randle, Timothy J.; Hotchkiss, Rollin H. New Economic Paradigm for Sustainable Reservoir Sediment Management, J. Water Resour. Plan. Manag. 2023, 149, 04022078. [Google Scholar] [CrossRef]
- Wang, S. Nt Present Value (NPV) Vs. Internal Rate of Return (IRR): Evaluating Investment Rules in Financial Markets, Highlights Bus. Econ. Manag. 2025, 59, 273–282. [Google Scholar] [CrossRef]
- Haghdadi, N.; Bruce, A.; MacGill, I.; Passey, R. Impact of Distributed Photovoltaic Systems on Zone Substation Peak Demand. IEEE Trans. Sustain. Energy 2018, 9, 621–629. [Google Scholar] [CrossRef]
- Rahman, K.U.; Hussain, A.; Ejaz, N.; Shang, S.; Balkhair, K.S.; Khan, K.U.J.; Khan, M.A.; Rehman, N.U. Analysis of production and economic losses of cash crops under variable drought: A case study from Punjab province of Pakistan. Int. J. Disaster Risk Reduct. 2023, 85, 103507. [Google Scholar] [CrossRef]
- Didar, E.; Bazargan, A.; Bagherpour, M. Cash flow risk management across multiple construction projects using value at risk. Eng. Constr. Archit. Manag. 2025, 33, 6750–6775. [Google Scholar] [CrossRef]
- Lin, J.; Dong, J.; Zheng, Y. Net Present Value As a Decision Tool During Investment: Evaluating the Effectiveness of Net Present Value (NPV) Against Traditional Investment Appraisal Techniques in Predicting the Financial Success of Technology Startups. Adv. Econ. Manag. Polit. Sci. 2025, 217, 41–60. [Google Scholar] [CrossRef]
- Balana, B.B.; Akudugu, M.A. Economic analysis of public investment in alternative agricultural water management schemes: a case study from northern Ghana. Water Int. 2023, 48, 40–62. [Google Scholar] [CrossRef]
- Mellichamp, D.A. Internal rate of return: Good and bad features, and a new way of interpreting the historic measure. Comput. Chem. Eng. 2017, 106, 396–406. [Google Scholar] [CrossRef]
- Pranoto; H. Hermawan, N. Albart, A Systematic Literature Review: Business Feasibility Analysis Using Net Present Value (NPV) and Internal Rate of Return (IRR) Methods in the Automotive Industry. J. Indones. Sos. Sains 2025, 6, 171–184. [Google Scholar] [CrossRef]
- Agusdin, R.; Aidil, N. Feasibility Analysis of Information Technology Investment Using Cost Benefit Analysis Method. Telematika 2022, 19, 245. [Google Scholar] [CrossRef]
- Piven, M.; Ukhnal, N. Long-term portfolio investments as a factor of economic recovery in the context of the circular economy. Fìnansi Ukraïni 2026, 2026, 30–45. [Google Scholar] [CrossRef]
- Julita, J.; Desmiyawati, D.; Kurnia, D.; Marpaung, R.; Iznillah, M.; Sari, R. The effect of intellectual capital on investment decisions: The mediating role of annual and audit report readability in Indonesian state-owned enterprises. Invest. Manag. Financ. Innov. 2026, 23, 235–248. [Google Scholar] [CrossRef]
- Irfan, M.; Khan, W.; Kandhro, A.; Raza, A. Integrated Impact of Financial Markets, Strategic Management, Marketing Dynamics, and Macroeconomic Policies on Sustainable Economic Growth. Inverge J. Soc. Sci. 2026, 5, 389–415. [Google Scholar] [CrossRef]
- Schwab, B.; Lusztig, P. A Comparative Analysis of the Net Present Value and the Benefit-Cost Ratio as Measures of the Economic Desirability of Investment. J. Financ. 1969, 24, 507–16. [Google Scholar] [CrossRef]
- Gut, L.; Feniuk, O. FEATURES OF DEVELOPING A POLICY FOR FINANCING CURRENT ASSETS OF AN ENTERPRISE IN CRISIS CONDITIONS. in: 2025, 16–17. [CrossRef]
- Olatunji; Rotimi, J.; Rotimi, F.; Silva, C. Causal relationship between project financing and overruns in major dam projects in Africa. Eng. Constr. Archit. Manag. 2024, 32, 6480–6508. [Google Scholar] [CrossRef]
- Połomski, M.; Wiatkowski, M. Impounding Reservoirs, Benefits and Risks: A Review of Environmental and Technical Aspects of Construction and Operation. Sustainability 2023, 15, 16020. [Google Scholar] [CrossRef]
- Sergeev; Lebedeva, O.; Evseenko, V. Post-completion audits of investment projects in mining companies. J. Adv. Res. Law. Econ. 2017, 8, 1301–1314. [Google Scholar] [CrossRef] [PubMed]
- Shankarrao, M.; Narwade, R.P.; Nagarajan, K. Multi-analytical approach for Risk identification and its management for successful Infrastructure projects. SAMRIDDHI J. Phys. Sci. Eng. Technol. 2023, 15, 282–290. [Google Scholar] [CrossRef]
- Sovacool, B.; Ryu, H. Beyond economies of scale: Learning from construction cost overrun risks and time delays in global energy infrastructure projects. Energy Res. Soc. Sci. 2025, 123, 104057. [Google Scholar] [CrossRef]
- Fuentes, J.L.; Garcia, B.; Namuag, L. A Quantitative Study on the Delays of Government Project Construction in the Department of Public Works and Highways South Cotabato 1st District Engineering Office, Int. J. Sustain. Adv. Integr. Res. 2026, 2, 1652–1661. [Google Scholar] [CrossRef]
- Obode, S.; Gini, K. Interest Rate and Exchange Rate Thresholds in Explaining Inflation Dynamics in Nigeria: Evidence from NARDL and Threshold Regression Models. Int. J. Econ. Bus. Manag. Res. 2026, 12, P. [Google Scholar] [CrossRef]
- Shah, Z.; Kumar, M.D. In the Midst of the Large Dam Controversy: Objectives, Criteria for Assessing Large Water Storages in the Developing World. Water Resour. Manag. 2008, 22, 1799–1824. [Google Scholar] [CrossRef]
- Azhar, M.; Ilyas, S.; Ali, S.; Shafiq, A. Assessing the Macroeconomic Consequences of Climate Change: Impacts on GDP Growth, Inflation Volatility, and Agricultural Productivity in Developing Economies. Rev. J. Soc. Psychol. Soc. Work. 2025, 3(No.2), 250–268. [Google Scholar] [CrossRef]
- Esmaeili-zadeh, S.; Lashkar-Ara, B. Evaluating the behavior of the Balaroud earth fill dam during impoundment in the final construction stage. J. Appl. Res. Water Wastewater 2025, 12. [Google Scholar] [CrossRef]
- Udoh, E.; Egwaikhide, F. Exchange Rate Volatility, Inflation Uncertainty and Foreign Direct Investment in Nigeria. Botsw. J. Econ. 2010, 5. [Google Scholar] [CrossRef]
- Elete, T.; Erhueh, O.V.; Akano, O.; Nwulu, E. Early startup methodologies in gas plant commissioning: An analysis of effective strategies and their outcomes 2023, 49–60. [CrossRef]
- Frank, 54; Rajaram, A.; Kaiser, K.; Le, T.; Kim, J.-H. The Power of Public Investment Management: Transforming Resources Into Assets for Growth; 2014. [Google Scholar] [CrossRef]
Figure 1.
Study location area (Source: [2], TWWSDSE).
Figure 1.
Study location area (Source: [2], TWWSDSE).
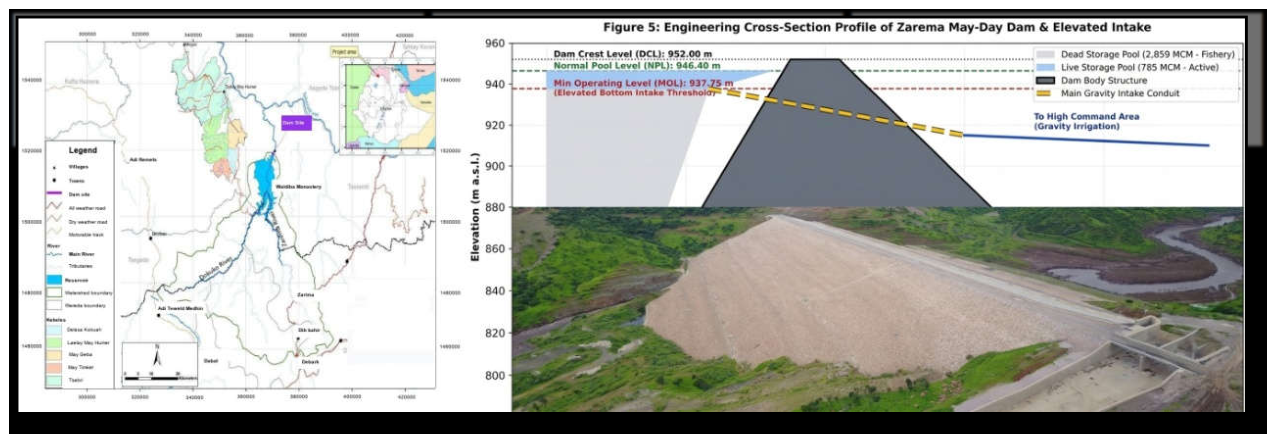
Figure 2.
Engineering Economic Forensic Evaluation Framework.

Figure 3.
Ten-Year cumulative financial value destruction trajectory.
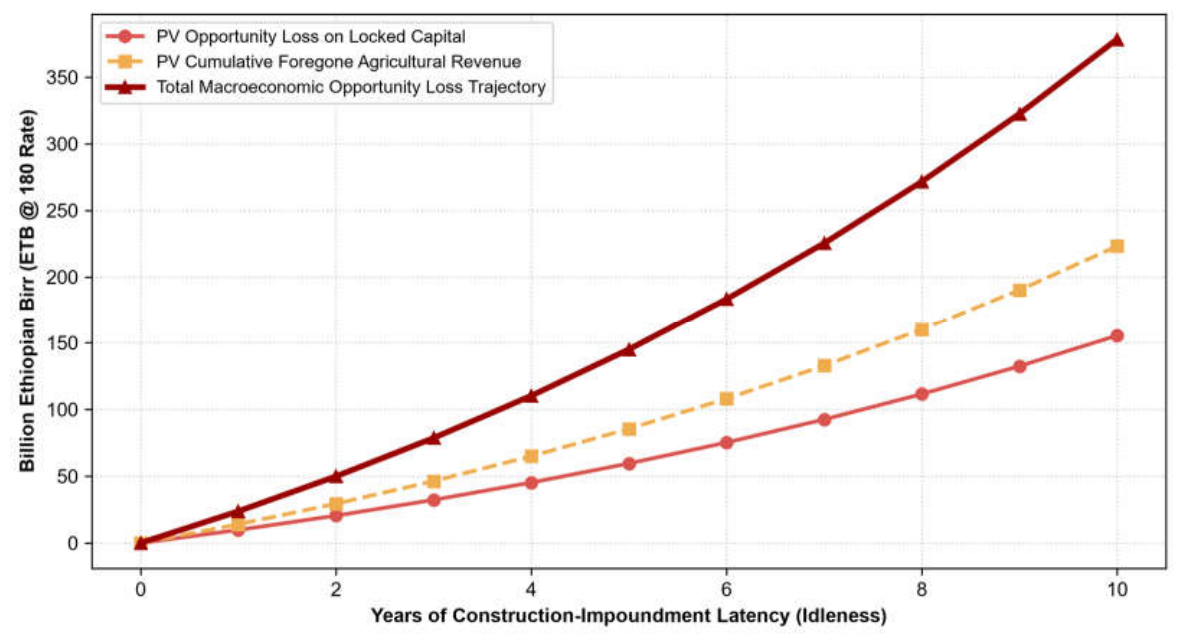
Figure 4.
Comparative deviation analyses of core economic metrics.
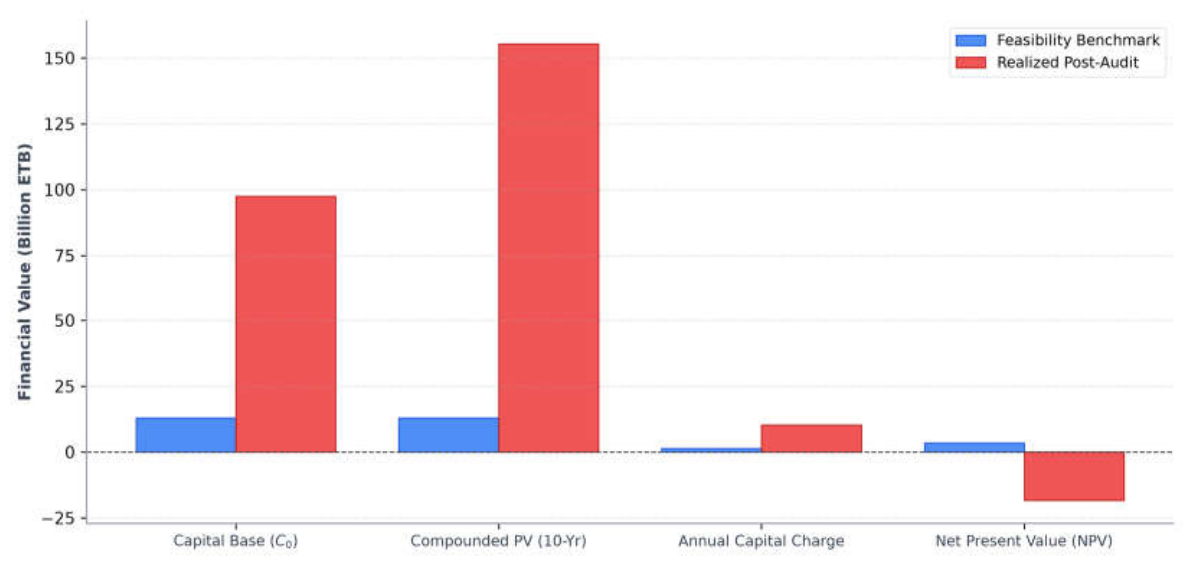
Figure 5.
Sensitivity of ten year financial lose to social discount rate.
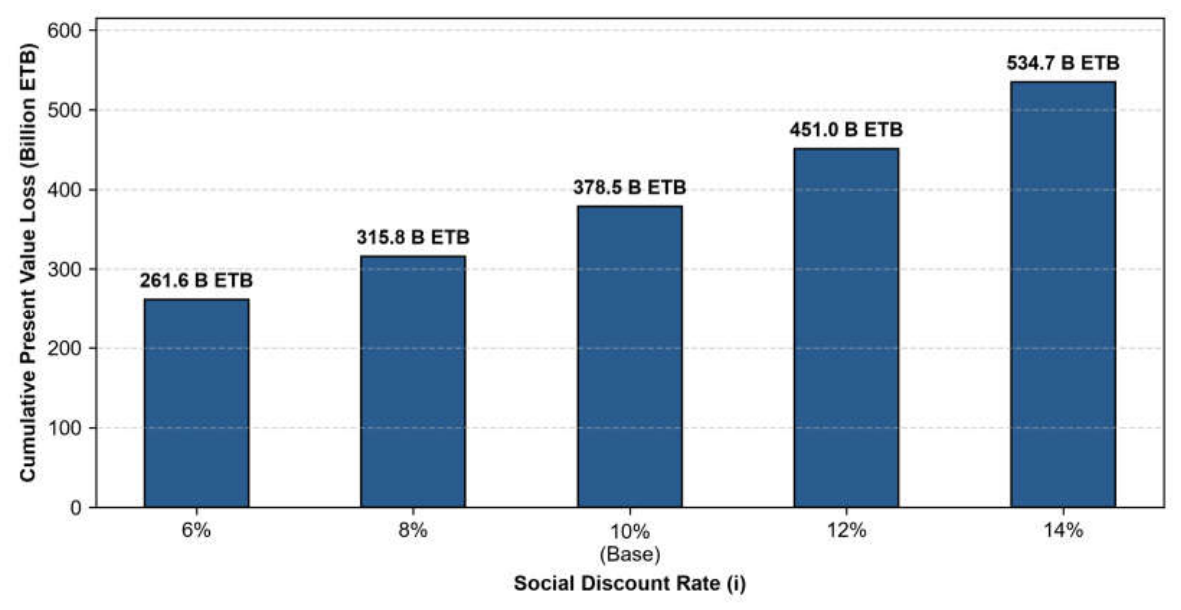

Table 1.
Macroeconomic assumptions.
|
[MACROECONOMIC & DISCOUNT RATE INPUTS] FINANCIAL PARAMETER BENCHMARKS (180 ETB/USD INDEX) ---------------------------------------------------------------------- Base Capital Outlay (C0) : $541.67 Million USD (13.0B ETB @ 24) Current Currency Replacement Base : 97.5 Billion ETB (@ 180 ETB/USD) Annual Foregone Net Crop Margin : 14.0 Billion ETB / Year Social Opportunity Discount Rate (i): 10.0% Annual Compounding Capital Recovery Factor (CRF, 10%, 30): 0.10608 (Annual Capital Cost Equivalent) |
Table 2.
Annual capital lockup, foregone agricultural revenue, and cumulative economic losses.
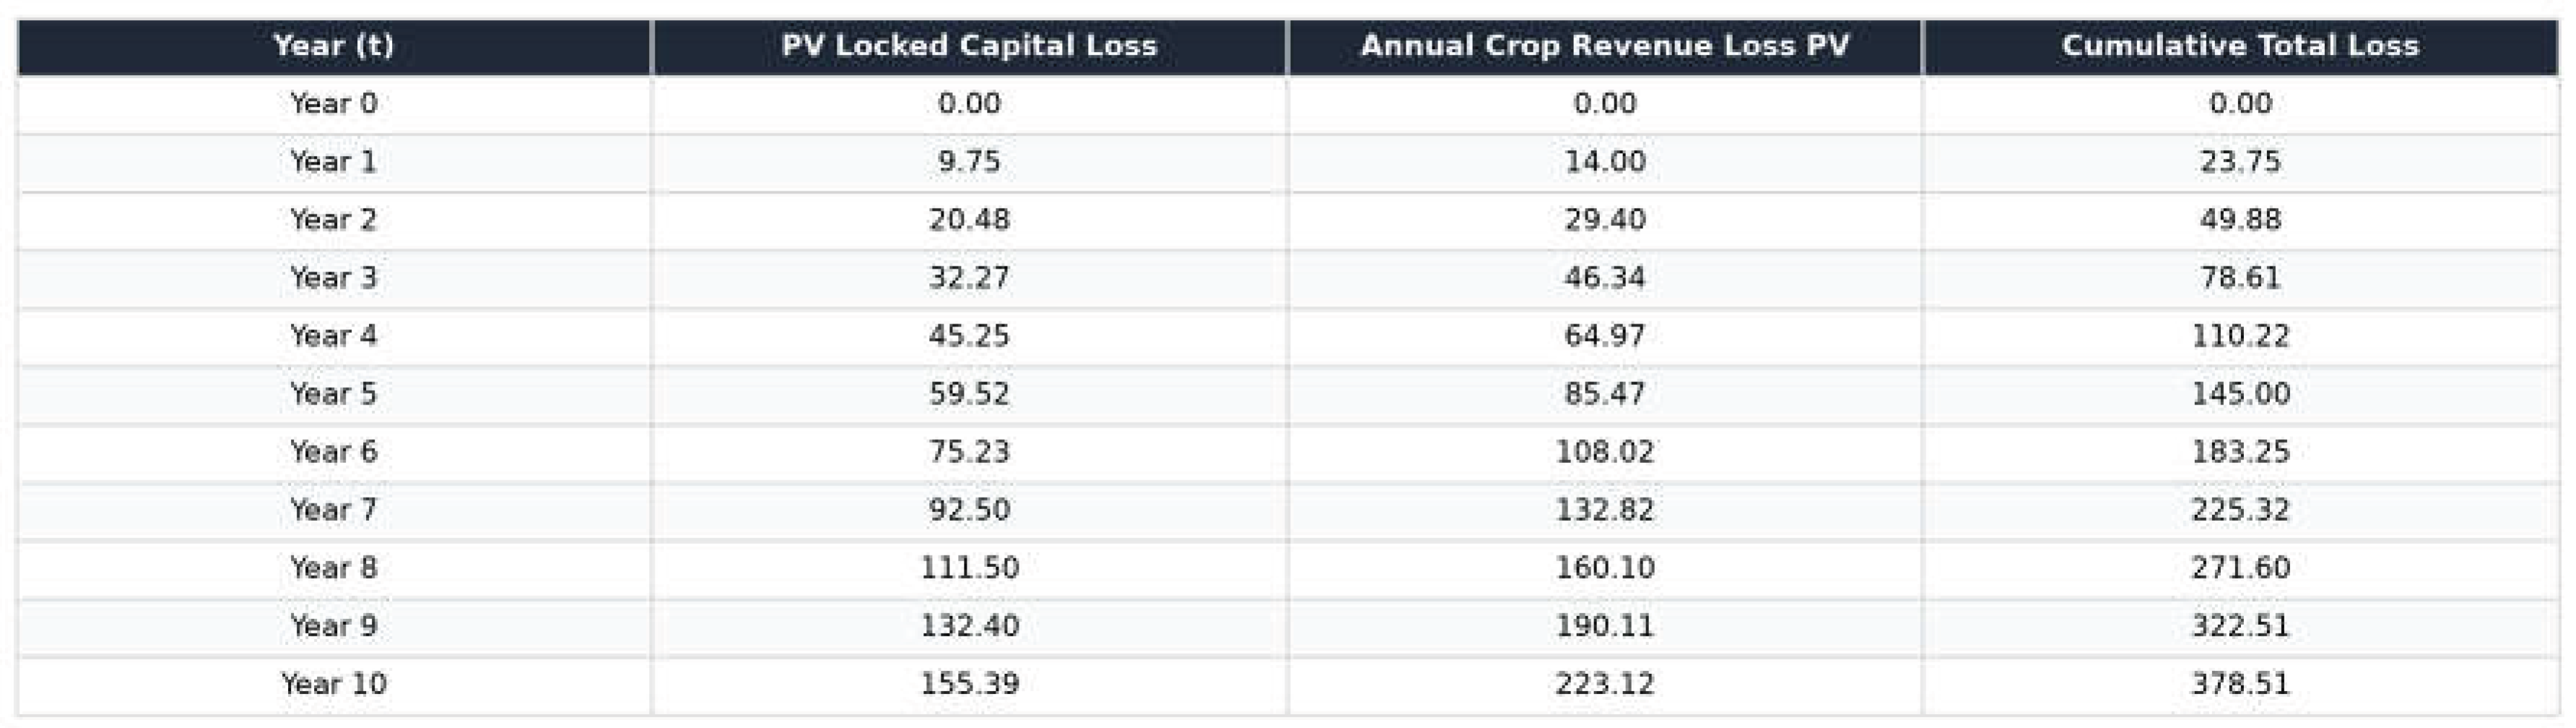 |
Table 3.
Comparison between feasibility assumptions and post-audit engineering economics indicators.
Table 3.
Comparison between feasibility assumptions and post-audit engineering economics indicators.
 |
Disclaimer/Publisher’s Note: The statements, opinions and data contained in all publications are solely those of the individual author(s) and contributor(s) and not of MDPI and/or the editor(s). MDPI and/or the editor(s) disclaim responsibility for any injury to people or property resulting from any ideas, methods, instructions or products referred to in the content. |
© 2026 by the authors. Licensee MDPI, Basel, Switzerland. This article is an open access article distributed under the terms and conditions of the Creative Commons Attribution (CC BY) license (http://creativecommons.org/licenses/by/4.0/).
Copyright: This open access article is published under a Creative Commons CC BY 4.0 license, which permit the free download, distribution, and reuse, provided that the author and preprint are cited in any reuse.


