

Submitted:
08 August 2026
Posted:
11 August 2026
You are already at the latest version
Abstract
Knowledge of linkage disequilibrium (LD) decay is a prerequisite for designing genomic selection and genome-wide association panels, yet no such characterisation exists for the indigenous goat breeds of Punjab, Pakistan. Using Illumina Caprine 50K SNP Bead Chip genotypes generated from the Punjab goat population previously used for growth and conformation GWAS (Beetal, Barbari, Daira Din Panah, Nachi, Pahari/Kajli, Local Pothwari and Teddi; N = 827 raw, 817 retained after breed-wise quality control), we estimated pairwise composite LD (r²) between SNPs up to 1 Mb apart and characterised its decay across physical distance, chromosome and breed, and summarised overall LD magnitude using the area under the LD-decay curve (AUC, r²×kb, 0–1000 kb). Mean genome-wide LD differed more than ten-fold among breeds, from r² = 0.020 (AUC = 24.5) in Beetal the largest, most numerous commercial breed (N = 588) to r² = 0.208 (AUC = 212.1) in Barbari (N = 23), with Nachi and Daira Din Panah forming a near-identical intermediate high tier (AUC = 134.2 and 134.1) and Local Pothwari, Pahari and Teddi forming a lower tier (AUC = 110.8, 96.2 and 83.5). LD decayed below r² = 0.2 within 20–30 kb in six of the seven breeds but only beyond 500 kb in Barbari; between-breed differences in LD (max r² − min r² at a given distance) were largest approximately 0.20 in the 50–300 kb range and persisted, undiminished, out to 1 Mb. This ranking was reproduced independently on every one of the 30 goat autosomes, and was not attributable to uneven marker coverage: genome-wide SNP density was closely uniform across chromosomes (14.2–17.4 SNPs/Mb, genome mean 16.2 SNPs/Mb), ruling out density as a confound. These results indicate that useful marker density for genomic prediction differs substantially by breed a sparse panel may be adequate for Barbari, whereas Beetal will require a considerably denser panel to capture equivalent haplotype information and that the small sample sizes available for five of the seven breeds should be treated as a caveat when interpreting the absolute, though not the relative, magnitude of LD. This is, to our knowledge, the first genome-wide LD decay analysis reported for Pakistani goat breeds and provides a quantitative baseline for future genomic selection and conservation-genetics work in this population.
Keywords:
linkage disequilibrium
; goat
; Capra hircus
; effective population size
; genomic selection
; 50K SNP array
; marker density
; area under the curve
; Punjab
; Pakistan
; indigenous breeds
1. Introduction
Linkage disequilibrium (LD) the non-random association of alleles at physically linked loci underlies both genome-wide association studies (GWAS) and genomic selection. The rate at which LD decays with physical distance determines the marker density required for a SNP panel to adequately tag causal variants: breeds or populations with slowly decaying LD can be characterized with sparser panels, whereas rapidly decaying LD demands denser genotyping to maintain equivalent prediction accuracy [1,2,3]. LD patterns are themselves shaped by effective population size (Ne), mating system, selection history and admixture, so characterizing LD decay also offers an indirect window onto a breed’s recent demographic history [4].
Pakistan maintains one of the world’s most diverse goat populations, with Punjab province alone hosting seven documented breeds Beetal, Daira Din Panah, Nachi (Bikaneri), Barbari, Teddi, Pahari (Kajli) and Pothwari that differ markedly in body size, coat type, production purpose and, presumably, effective population size [5]. These breeds were recently genotyped on the Illumina Caprine 50K SNP Bead Chip and used to identify genomic regions associated with body weight and conformation traits [6]. That study characterised trait-associated loci but did not examine the underlying LD architecture of the population information that is a prerequisite, rather than a byproduct, of any future genomic selection programme for these breeds.
No genome-wide LD decay analysis has previously been reported for any Pakistani goat breed. Comparable work in other populations including Italian and Moroccan native goats [7], Boer, Saanen, Alpine and Cashmere breeds [8], and Chinese indigenous breeds [9] consistently finds substantial inter-breed variation in LD decay rate, generally attributable to differences in Ne and breeding history rather than to marker density or genotyping platform. Given the contrasting demographic profiles of Punjab’s goat breeds Beetal is a large-scale, multi-strain commercial breed reared across several districts, whereas breeds such as Barbari, Daira Din Panah, Nachi and Local Pothwari are comparatively localised and numerically smaller we hypothesised that LD decay rate would differ substantially among them.
Beyond the conventional decay-curve and threshold-distance approaches used in prior goat LD studies, we additionally summarise overall LD magnitude for each breed using the area under the LD-decay curve (AUC) a single integrated statistic that is less sensitive than a single threshold crossing to noise in any one distance bin and quantify, at each physical distance, the deviation of each breed’s mean r² from the across-breed mean (Δr²), which highlights where in the genome breed differences are largest. We also explicitly test whether genome-wide marker density is sufficiently uniform across chromosomes that it could not, by itself, generate the observed inter-breed LD differences. Using the Illumina Caprine 50K genotypes from the Punjab goat population described by Moaeen-ud-Din, Muner & Khan (2022) [6], we therefore (i) quantify genome-wide and chromosome-wise LD decay for each of the seven breeds; (ii) estimate the physical distance at which mean r² falls below the commonly used genomic-selection thresholds of 0.5, 0.2, 0.1 and 0.05; (iii) rank breeds by overall LD magnitude (AUC) and quantify the pattern of between-breed divergence across the full 1-Mb window; (iv) confirm that this ranking is not an artefact of uneven SNP density; and (v) discuss the implications of breed-specific LD architecture for the design of future genomic selection and fine-mapping panels in Pakistani goats.
2. Results
2.1. Sample Composition and Quality Control
A total of 827 goats across seven Punjab breeds Beetal (n = 594), Teddi (n = 109), Pahari (n = 41), Barbari (n = 23), Daira Din Panah (n = 23), Nachi (n = 21) and Local Pothwari (n = 16) formed the starting dataset (Table 1). After breed-wise genotype quality control, 817 individuals and between 32,083 and 40,013 autosomal SNPs per breed were retained for LD estimation (Table 2). Beetal, as the numerically dominant breed, retained the largest sample (n = 588) and the largest SNP set after filtering (40,013), while the five minor breeds each retained between 16 and 23 animals.
2.2. Genome-Wide LD Decay Differs More than Ten-Fold Among Breeds
Mean pairwise r² across all SNP pairs within 1 Mb differed markedly among breeds (Table 3; Figure 1). Beetal showed by far the lowest genome-wide mean LD (r² = 0.0201, median = 0.0073), consistent with its large effective sample size and its status as a widely distributed, multi-strain commercial breed. Barbari showed the highest mean LD (r² = 0.2084, median = 0.1211) more than ten-fold greater than Beetal with Daira Din Panah (r² = 0.1310) and Nachi (r² = 0.1313) forming an intermediate-high tier, and Local Pothwari (r² = 0.1063), Pahari (r² = 0.0920) and Teddi (r² = 0.0801) forming an intermediate-low tier. The proportion of SNP pairs retaining strong LD (r² ≥ 0.5) mirrored this ranking, from 0.20% in Beetal to 12.46% in Barbari, while the proportion at r² ≥ 0.2 ranged from 0.89% (Beetal) to 37.03% (Barbari).
2.3. Overall Magnitude of LD (Area Under the Decay Curve) Confirms the Breed Ranking
To summarise overall LD magnitude with a single statistic that is less sensitive to noise in any one distance bin than a threshold-crossing distance, we computed the area under the LD-decay curve (AUC, r²×kb) for each breed across the full 0–1000 kb window (Table 4; Figure 2). This confirmed the ranking observed for mean r²: Barbari showed by far the largest AUC (212.1), roughly 8.6-fold greater than Beetal (24.5). Notably, Nachi (AUC = 134.2) and Daira Din Panah (AUC = 134.1) were almost indistinguishable from one another despite being independently sampled breeds, consistent with their overlapping home tracts along the Indus (Muzaffargarh–Layyah–Multan) [6] and a plausibly shared or recently diverged effective population. Local Pothwari (110.8), Pahari (96.2) and Teddi (83.5) formed a distinct lower tier, and Beetal (24.5) remained a clear outlier at the low end.
2.4. Distance-Class and Short-Range Decay Patterns
All seven breeds showed the expected sharp initial decline in LD within the first 10–25 kb (Supplementary Figure S1), but the rate and asymptote of decay diverged sharply thereafter. Mean r² in the 0–10 kb bin ranged narrowly from 0.499 (Beetal) to 0.634 (Daira Din Panah), showing that short-range haplotype structure at the shortest distances is broadly comparable across breeds. By the 25–50 kb bin, however, Barbari retained more than three times the LD of Beetal (0.278 vs. 0.080), and by the 500–1000 kb bin this ratio widened to more than fourteen-fold (0.193 vs. 0.014; Table 5).
2.5. LD at Specific Physical Distances Relevant to Marker-Panel Design
Table 6 reports mean r² for each breed at seven physical distances spanning the range typically relevant to SNP-panel design (10, 20, 50, 100, 200, 500 and 1000 kb), corresponding to the heatmap in Figure 3. At 10 kb, LD was substantial in every breed (r² = 0.25–0.45), showing that short-range haplotype blocks are preserved across the whole population regardless of breed-level demographic differences; divergence between breeds became visually and numerically pronounced from 20–50 kb onward. At 1 Mb, Barbari retained r² = 0.158, roughly nine times the residual LD retained by Beetal (r² = 0.018) at the same distance.
2.6. Distance at Which LD Falls Below Genomic-Selection Thresholds
The physical distance at which mean r² declined below the commonly used thresholds of 0.20, 0.10 and 0.05 differed by more than an order of magnitude between the two extreme breeds (Table 7). In Beetal, mean r² fell below 0.20 and below 0.10 within the first 20 kb, and below 0.05 by 70 kb. In Barbari, by contrast, mean r² did not fall below 0.20 until approximately 500 kb, and never fell below 0.10 or 0.05 within the 1-Mb window examined. Daira Din Panah and Nachi reached the 0.20 threshold by 30 kb but likewise did not reach the lower thresholds within 1 Mb. Pahari, Local Pothwari and Teddi were intermediate, reaching r² = 0.20 by 20 kb but requiring 90–400 kb to reach r² = 0.10, and only Pahari and Teddi reached r² = 0.05 within the 1-Mb window (at the outer edge, ~1000 kb).
2.7. Breed-Specific Decay Profiles Are Consistent Across the Full 1-Mb Window
Plotting each breed’s decay curve on an independent panel (Figure 4) confirmed that the qualitative decay shape — a steep initial drop followed by a long, shallow tail — was shared by all seven breeds, but that the height and slope of the shallow tail differed systematically. Barbari was unique in retaining a tail that hovered around, and for part of the range above, the r² = 0.20 reference line for the entire 1-Mb window; every other breed’s tail settled below 0.20 within the first 30–50 kb and thereafter declined only gradually.
2.8. Between-Breed Differences in LD Are Largest at Intermediate Distances and Persist to 1 Mb
To quantify where along the physical-distance axis breed differences were largest, we computed, at each 10-kb bin, the difference between the highest and lowest breed mean r² (Table 8; Supplementary Figure S6). This range was smallest at the shortest distance examined (0.135 at 0–10 kb, reflecting the relatively uniform short-range LD noted above) and rose sharply to approximately 0.196–0.209 by 20–300 kb, after which it declined only slightly, remaining above 0.16 out to 1 Mb. Beetal occupied the lowest-LD position at essentially every distance from 10 kb to 900 kb, while the highest-LD breed was Daira Din Panah at the shortest distance (0–10 kb) and Barbari at every distance from 10 kb outward; at the extreme edge of the window (1000 kb, based on very few SNP pairs) Local Pothwari and Pahari occupied the highest- and lowest-LD positions respectively, reflecting the reduced reliability of single-pair bins at this distance.
Figure 5.
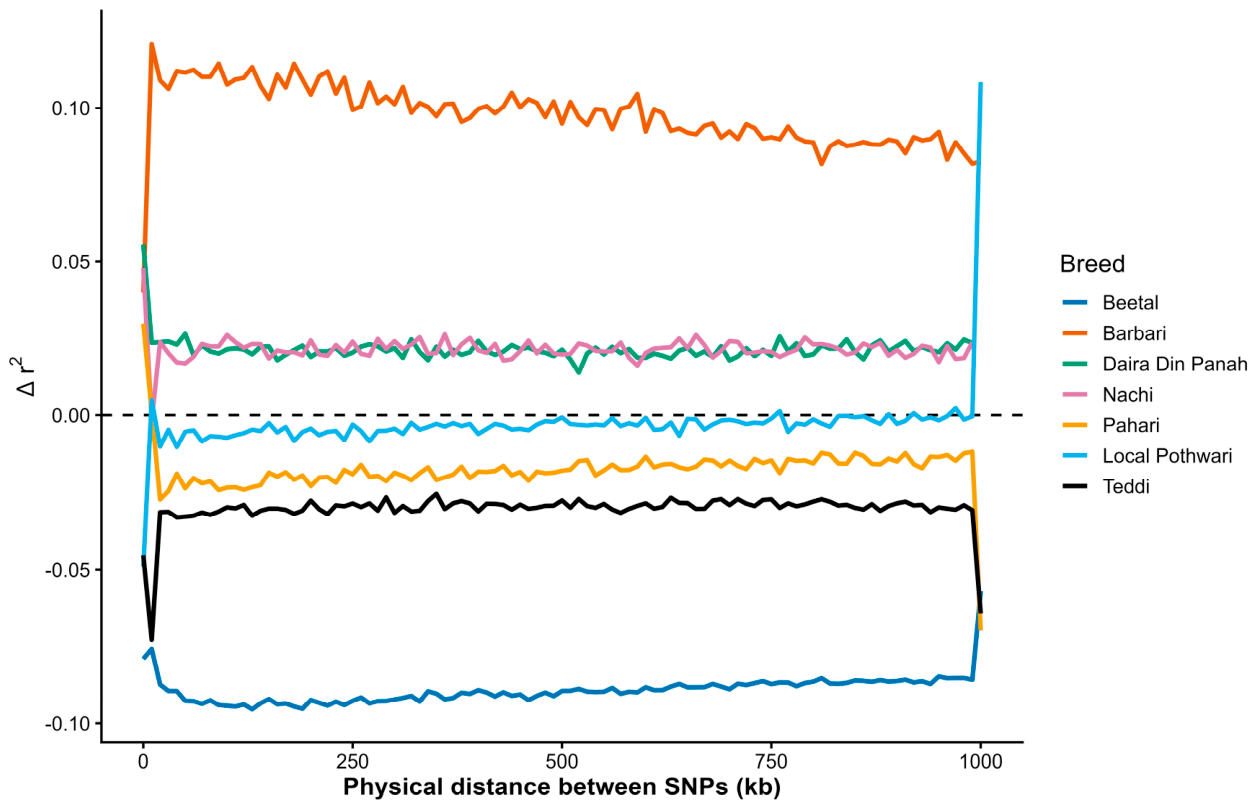
Deviation of each breed’s mean LD (Δr²) from the across-breed mean at each physical distance, illustrating that Barbari’s excess LD narrows only slightly with distance while Beetal’s deficit remains essentially constant across the full 1-Mb window.
Figure 5.
Deviation of each breed’s mean LD (Δr²) from the across-breed mean at each physical distance, illustrating that Barbari’s excess LD narrows only slightly with distance while Beetal’s deficit remains essentially constant across the full 1-Mb window.
2.9. Chromosome-Wise Consistency of the Breed Ranking
Chromosome-wise mean LD (Figure 6) showed the same breed ranking observed genome-wide, on every one of the 30 goat autosomes examined. Barbari showed the highest per-chromosome mean r² throughout (range 0.164–0.247, overall mean 0.209), Beetal the lowest throughout (range 0.015–0.027, overall mean 0.020), and the remaining five breeds occupied the same relative order — Daira Din Panah and Nachi (both ~0.131 genome-wide) above Local Pothwari (0.107), which was above Pahari (0.093) and Teddi (0.080) — on essentially every chromosome (Table 9). No chromosome showed a qualitatively different pattern from the genome-wide average for any breed, indicating that the observed LD differences reflect population-wide processes (effective population size, mating structure) rather than localised structural or selective effects on any single chromosome.
2.10. Genome-Wide Marker Density Is Uniform Across Chromosomes and Does Not Confound the Breed Comparison
Because LD estimates from array data can in principle be influenced by uneven marker coverage, we examined SNP density across the genome using the full autosomal marker map (38,890 SNPs; Table 10; Supplementary Figures S4–S5). SNP density per chromosome ranged narrowly from 14.15 SNPs/Mb (chromosome 18) to 17.43 SNPs/Mb (chromosome 12), around a genome-wide mean of 16.20 SNPs/Mb — a difference of less than 25% between the sparsest and densest chromosomes, and with no systematic relationship to chromosome length. Density within 1-Mb windows along each chromosome was likewise reasonably even, without the large gaps or dense clusters that would be expected to bias LD estimation in specific regions (Supplementary Figure S4). This close-to-uniform marker coverage indicates that the more than ten-fold breed differences in LD magnitude reported above are very unlikely to be an artefact of uneven SNP placement on the array, and instead reflect genuine differences in breed-level haplotype structure.
3. Discussion
This study provides the first genome-wide characterization of LD decay in Pakistani goat breeds, and extends the conventional decay-curve and threshold-distance approach with two additional, complementary summaries: an integrated area-under-the-curve (AUC) statistic and a distance-resolved measure of between-breed divergence (Δr²). All three approaches — mean r², AUC and Δr² — converged on the same central finding: a more than ten-fold difference in overall LD magnitude between Beetal and Barbari, with a consistent five-tier ranking reproduced across every distance bin and every autosome. This convergence across independent summary statistics increases confidence that the ranking reflects a genuine population-genetic signal rather than an artefact of any single analytical choice.
The practical implication is direct. Under the classical relationship between marker density and effective population size (Ne ≈ 1 / (4c·Δr²) for recombination distance c) [13], populations with rapidly decaying LD, such as Beetal, require markers spaced far more densely than the ~60 kb average spacing of the 50K chip to fully capture haplotype blocks, whereas populations retaining LD to hundreds of kilobases, such as Barbari, could in principle be characterised adequately with a substantially sparser and cheaper panel. The AUC ranking (Table 4) makes this practical contrast especially concrete: Barbari’s AUC of 212.1 r²×kb is 8.6-fold greater than Beetal’s 24.5, a gap of similar order to the ten-fold difference in mean r², confirming that the result is not sensitive to whether LD magnitude is summarised by a simple mean or by the full area under the decay curve.
The rapid decay observed in Beetal is consistent with its status as Punjab’s largest and most widely distributed goat breed, comprising several documented strains (Faislabadi, Nuqri, Nagri, Gujrati and MakhiChini) reared across multiple districts [6], which together imply a comparatively large effective population size and reduced genetic drift; notably, the Δr² analysis (Figure 5) shows that Beetal’s deficit relative to the across-breed mean is essentially flat across the entire 1-Mb window (roughly −0.08 to −0.09 from 20 kb outward), indicating that its low-LD architecture is a stable, distance-independent property of the breed rather than a transient effect confined to any particular scale. Conversely, the slow decay and elevated LD observed in Barbari — which did not fall below r² = 0.20 until approximately 500 kb, and whose excess over the across-breed mean narrows only gradually from roughly +0.12 at 20 kb to +0.09 near 900 kb — is consistent with a smaller, more geographically restricted effective population subject to greater drift and possibly historical bottlenecks or closer within-flock mating.
A striking secondary observation is the near-identity of Nachi and Daira Din Panah on every summary statistic examined — genome-wide mean r² (0.1313 vs. 0.1310), AUC (134.2 vs. 134.1) and chromosome-wise mean (0.1308 vs. 0.1307). Both are hairy, meat-type breeds native to overlapping tracts along the Indus (Muzaffargarh–Layyah–Multan) [6], and this degree of convergence across independent breeds and independent samples is more plausibly explained by a shared or recently diverged effective population — consistent with reported gene flow or common ancestry between geographically adjacent Punjab breeds [5,11] — than by coincidence, and would be a natural target for a dedicated population-structure analysis (e.g., FST, admixture or identity-by-descent sharing) in future work.
The between-breed range analysis (Table 8; Supplementary Figure S6) showed that breed differences were smallest at the very shortest distance examined (0–10 kb, range = 0.135) and expanded rapidly to a broad plateau of approximately 0.18–0.21 from roughly 20 kb out to 1 Mb. This pattern indicates that very short-range haplotype structure (co-inherited blocks smaller than ~10–20 kb) is comparatively conserved across all seven breeds — plausibly reflecting shared ancestral recombination architecture common to the species — whereas breed-specific demographic history becomes the dominant determinant of LD from approximately 20 kb outward. This has a direct practical corollary: a marker panel dense enough to tag the shortest-range haplotype blocks (a few SNPs per 10 kb) would perform comparably across breeds, but a sparser panel relying on LD extending beyond 20–50 kb would perform very differently by breed, remaining effective in Barbari, Nachi and Daira Din Panah but failing in Beetal.
A necessary robustness check for any LD comparison based on SNP-array genotypes is that observed differences are not an artefact of uneven marker placement. Genome-wide SNP density in the present dataset was closely uniform across all 29 autosomes (14.15–17.43 SNPs/Mb, a less than 25% range around a genome mean of 16.20 SNPs/Mb; Table 10), with no systematic relationship to chromosome length or to the chromosome-wise LD pattern in Figure 6 (the highest-LD chromosome for Barbari, chromosome 6, and the lowest-density chromosome, chromosome 18, did not coincide with any single breed’s LD extremes). This makes it very unlikely that the ten-fold breed differences reported here reflect uneven SNP coverage rather than genuine population-level differences in haplotype structure.
A caveat that must be weighed against these interpretations is sample size. Five of the seven breeds (Barbari, Daira Din Panah, Nachi, Pahari and Local Pothwari) were represented by only 16–41 animals, and r² is a known upward-biased estimator of true population LD when sample size is small [14]. This bias likely inflates the absolute magnitude of LD in these breeds to some degree, and the wide confidence bands visible for the smaller breeds in Supplementary Figure S2 reflect this reduced precision directly; the single-SNP-pair bins at the extreme edge of the 1-Mb window (e.g., the 1000-kb points in Table 6 and Table 8) are particularly unreliable and should not be over-interpreted. However, several considerations argue that the qualitative ranking reported here is unlikely to be a pure sample-size artefact. First, Beetal — with the largest sample by far (n = 588) — showed a genome-wide LD level roughly consistent with what has been reported in other large, outbred commercial goat populations genotyped on the same 50K platform [7,8,9], arguing against a systematic inflation specific to this dataset. Second, the five small-sample breeds spanned a more than 60% range in mean r² (0.080–0.131) and nearly a three-fold range in AUC (83.5–134.2) despite comparable sample sizes (16–41), indicating that sample size alone does not explain the observed ordering among them. Third, the chromosome-wise analysis (Figure 6, Table 9) and the AUC ranking (Table 4) independently reproduced the identical breed ordering, which would be an unusual coincidence if the pattern were driven purely by estimation noise. Nonetheless, we recommend that future work prioritise expanding sample sizes for Barbari, Daira Din Panah, Nachi and Local Pothwari before these LD estimates are used to fix a genomic-selection panel density, and that r² estimates for these breeds be treated as upper bounds pending validation in larger cohorts.
These results complement the recent GWAS of growth and conformation traits conducted in the same Punjab goat population [6], which reported two SNPs (on chromosomes 8 and 16) associated with all six traits examined. The present LD analysis suggests that, in Beetal — the breed contributing 594 of the 827 animals in that GWAS — the effective resolution of the 50K chip for fine-mapping such pleiotropic loci is high, given that LD decays to background levels within tens of kilobases; associated SNPs in Beetal are therefore likely to lie close to, rather than merely linked with, the underlying causal variant. In the smaller breeds, however, the persistence of LD over hundreds of kilobases means that a significant SNP is markedly less likely to pinpoint the causal gene directly, and functional follow-up in those breeds should anticipate a substantially wider candidate interval.
This study has several limitations beyond sample size. First, LD was estimated using array-derived genotypes at a fixed marker density (32,083–40,013 SNPs per breed after filtering; 38,890 SNPs in the full pre-breed-QC marker map), which imposes a lower bound on the resolution at which very short-range LD (<10 kb) can be characterised; whole-genome resequencing would be required to resolve haplotype structure at base-pair resolution. Second, we report composite pairwise r² without formally partitioning the contribution of population stratification, admixture or recent bottlenecks to the observed patterns; a targeted analysis of runs of homozygosity and effective population size trajectories, ideally combined with pedigree records where available, would clarify the demographic mechanisms underlying the LD differences reported here and would be particularly informative for testing the shared-ancestry hypothesis raised above for Nachi and Daira Din Panah. Third, breed assignment relied on farmer-reported breed identity at the time of sampling [6], and any misclassification would tend to inflate apparent within-breed LD by mixing distinct genetic backgrounds.
4. Conclusions
Genome-wide LD decays more than ten-fold faster in Beetal than in Barbari, with Daira Din Panah, Nachi, Local Pothwari, Pahari and Teddi occupying a consistent intermediate ranking that is reproduced independently by mean r², by the area under the LD-decay curve, and on every autosome, and that is not attributable to uneven genome-wide marker density. Between-breed differences are smallest at the shortest distances examined (<10 kb) and largest from approximately 20 kb to 1 Mb, indicating that short-range haplotype structure is broadly conserved across breeds while longer-range LD is dominated by breed-specific demographic history. These breed-specific LD architectures should directly inform the design of future genomic selection and fine-mapping panels for Pakistani goats: Beetal will require considerably denser marker panels than the 50K chip to fully exploit LD-based genomic prediction, while the slower-decaying breeds may be tractable with sparser, lower-cost panels, subject to confirmation in larger sample sizes. This work provides the first such baseline for Punjab’s indigenous goat breeds and is intended to support subsequent genomic selection, effective population size and conservation-genetics studies in this population.
5. Methods
5.1. Study Population and Genotype Data
Genotype data were drawn from the Punjab goat population described in detail by Moaeen-ud-Din, Muner & Khan (2022) [6], comprising 827 unrelated animals from seven documented Punjab breeds — Beetal (including its five strains: Faislabadi, Nuqri, Nagri, Gujrati and MakhiChini; n = 594), Teddi (n = 109), Pahari/Kajli (n = 41), Barbari (n = 23), Daira Din Panah (n = 23), Nachi/Bikaneri (n = 21) and Local Pothwari (n = 16), sampled from districts including Fateh Jhang, Bhakkar, Layyah, D.G. Khan, Rajanpur, Faisalabad and Jhang. Genomic DNA was extracted from EDTA whole blood and genotyped on the Illumina Caprine 50K SNP Bead Chip (53,347 SNPs) by GeneSeek (USA), as originally reported [6]. All animal sampling and handling followed protocols approved by the institutional Ethics Committee of the collaborating university and complied with the ARRIVE guidelines.
5.2. Quality Control
Starting from the shared genotype dataset, quality control was applied independently within each breed, retaining SNPs and individuals meeting standard genotype call-rate, minor allele frequency and Hardy–Weinberg equilibrium criteria in PLINK v1.9 [15,16]. Breed-wise filtering retained between 32,083 (Nachi) and 40,013 (Beetal) autosomal SNPs and between 16 (Local Pothwari) and 588 (Beetal) individuals per breed (Table 2); genome positions were assigned according to the goat reference assembly ARS1.
5.3. Linkage Disequilibrium Estimation
Pairwise composite linkage disequilibrium (r²) between all SNP pairs within 1 Mb of physical distance was estimated separately for each breed in PLINK v1.9 (--r2). SNP pairs were assigned to 10-kb physical-distance bins from 0 to 1000 kb, and mean, median, standard deviation, standard error, interquartile range and approximate 95% confidence intervals of r² were computed within each bin. Bin-level estimates were further aggregated into eight broader distance classes (0–10, 10–25, 25–50, 50–100, 100–250, 250–500, 500–1000 and >1000 kb) for summary comparison across breeds (Table 5), and mean r² at seven selected physical distances (10, 20, 50, 100, 200, 500 and 1000 kb) was extracted for cross-breed comparison (Table 6). For each breed, the physical distance at which mean r² first declined below the thresholds of 0.50, 0.20, 0.10 and 0.05 was identified from the binned decay curve (Table 7); where a threshold was not reached within the 1-Mb window examined, this is reported as ‘not reached’.
5.4. Overall LD Magnitude and Between-Breed Divergence
To provide a single integrated summary of LD magnitude for each breed, the area under the LD-decay curve (AUC, in units of r²×kb) was computed by trapezoidal integration of mean r² across the 10-kb bins spanning 0–1000 kb (Table 4). To identify the physical distances at which breeds diverged most, the across-breed mean r² was computed at each 10-kb bin, and each breed’s deviation from this mean (Δr² = breed mean r² − across-breed mean r²) was calculated (Figure 5). Independently, at each 10-kb bin the highest and lowest breed mean r² and their difference (the between-breed range) were identified (Table 8; Supplementary Figure S6).
5.5. Chromosome-Wise LD and Marker Density
LD was additionally summarised separately for each of the 30 goat autosomes to assess whether genome-wide breed differences were consistent across chromosomes (Table 9). To assess whether the observed breed differences could instead reflect uneven marker coverage, SNP density was computed for each chromosome as the number of SNPs on the full pre-breed-QC autosomal marker map (38,890 SNPs) divided by chromosome length in megabases (Table 10), and additionally tabulated in non-overlapping 1-Mb physical windows across each chromosome (Supplementary Figure S4) to check for local gaps or clusters in marker coverage.
5.6. Data Visualization
LD decay curves, short-range decay plots, breed-faceted decay panels, confidence-interval bands, chromosome-wise LD plots, the LD heatmap, the AUC ranking plot, the Δr² plot and the SNP-density plots were generated in R (ggplot2). All summary statistics reported in the Results are computed directly from the accompanying data tables and are reproduced here to two or three significant figures for readability.
Supplementary Materials
The following supporting information can be downloaded at the website of this paper posted on Preprints.org.
Author Contributions
Conceptualization, H.M.P.; methodology, H.M.P.; software, H.M.P.; validation, H.M.P. and A.M.; formal analysis, H.M.P.; investigation, H.M.P. and A.M.; resources, A.M.; data curation, H.M.P.; writing—original draft preparation, H.M.P.; writing—review and editing, H.M.P. and A.M.; visualization, H.M.P.; supervision, H.M.P.; project administration, H.M.P.; funding acquisition, H.M.P. All authors have read and agreed to the published version of the manuscript.
Funding
This research was partially funded by the Punjab Agricultural Research Board (PARB), grant number 25-973.
Institutional Review Board Statement
Ethical review and approval were waived for this study because it is a secondary analysis of pre-existing, anonymized genotype and phenotype data; no new animal experimentation, sampling or handling was performed for the present study. The blood sampling and animal-handling procedures that generated the underlying data were carried out by qualified veterinary personnel in accordance with relevant national guidelines and regulations for animal welfare and in compliance with the ARRIVE guidelines, as part of the original data-collection study describing this genotyping resource (Muner et al., 2021, Trop. Anim. Health Prod. 53, 368; Moaeen-ud-Din et al., 2022, Sci. Rep. 12, 9891).
Informed Consent Statement
Not applicable (study did not involve human subjects; verbal informed consent for animal sampling was obtained from participating farmers as described in Section 5.1).
Data Availability Statement
The genotype data underlying this analysis derive from the Punjab goat 50 K SNP genotyping resource.
Acknowledgments
The genotype data analyzed in this study originate from the Punjab goat population genotyped, quality-controlled and described by Moaeen-ud-Din, M., Muner, R.D. & Khan, M.S. (2022). “Genome wide association study identifies novel candidate genes for growth and body conformation traits in goats.” Scientific Reports, 12, 9891 (https://doi.org/10.1038/s41598-022-14018-y).
Competing Interests
The authors declare no competing interests.
References
- Sved, J.A. Linkage disequilibrium and homozygosity of chromosome segments in finite populations. Theor. Popul. Biol. 1971, 2, 125–141. [Google Scholar] [CrossRef] [PubMed]
- Hayes, B.J.; Visscher, P.M.; McPartlan, H.C.; Goddard, M.E. Novel multilocus measure of linkage disequilibrium to estimate past effective population size. Genome Res. 2003, 13, 635–643. [Google Scholar] [CrossRef] [PubMed]
- Meuwissen, T.H.E.; Hayes, B.J.; Goddard, M.E. Prediction of total genetic value using genome-wide dense marker maps. Genetics 2001, 157, 1819–1829. [Google Scholar] [CrossRef] [PubMed]
- Sved, J.A.; Cameron, E.C.; Gilchrist, A.S. Estimating effective population size from linkage disequilibrium between unlinked loci: theory and application to fruit fly outbreak populations. PLoS ONE 2013, 8, e69078. [Google Scholar] [CrossRef] [PubMed]
- Khan, M.; Khan, M.; Mahmood, S. Genetic resources and diversity in Pakistani goats. Int. J. Agric. Biol. 2008, 10, 227–231. [Google Scholar]
- Moaeen-ud-Din, M.; Muner, R.D.; Khan, M.S. Genome wide association study identifies novel candidate genes for growth and body conformation traits in goats. Sci. Rep. 2022, 12, 9891. [Google Scholar] [CrossRef] [PubMed]
- Badr Benjelloun, F.J.A.; et al. Characterizing neutral genomic diversity and selection signatures in indigenous populations of Moroccan goats (Capra hircus) using WGS data. Front. Genet. 2015, 6, 107. [Google Scholar] [CrossRef] [PubMed]
- Brito, L.F.; et al. Genetic diversity and signatures of selection in various goat breeds revealed by genome-wide SNP markers. BMC Genom. 2017, 18, 229. [Google Scholar] [CrossRef] [PubMed]
- Martin, P.M.; Palhiere, I.; Ricard, A.; Tosser-Klopp, G.; Rupp, R. Genome wide association study identifies new loci associated with undesired coat color phenotypes in Saanen goats. PLoS ONE 2016, 11, e0152426. [Google Scholar] [CrossRef] [PubMed]
- Tosser-Klopp, G.; et al. Design and characterization of a 52K SNP chip for goats. PLoS ONE 2014, 9, e86227. [Google Scholar] [CrossRef] [PubMed]
- Muner, R.D.; et al. Exploring genetic diversity and population structure of Punjab goat breeds using Illumina 50K SNP bead chip. Trop. Anim. Health Prod. 2021, 53, 368. [Google Scholar] [CrossRef] [PubMed]
- Manunza, A.; et al. A genome-wide perspective about the diversity and demographic history of seven Spanish goat breeds. Genet. Sel. Evol. 2016, 48, 52. [Google Scholar] [CrossRef] [PubMed]
- Hill, W.G.; Robertson, A. Linkage disequilibrium in finite populations. Theor. Appl. Genet. 1968, 38, 226–231. [Google Scholar] [CrossRef] [PubMed]
- Weir, B.S.; Hill, W.G. Estimating F-statistics. Annu. Rev. Genet. 2002, 36, 721–750. [Google Scholar] [CrossRef] [PubMed]
- Purcell, S.; et al. PLINK: a tool set for whole-genome association and population-based linkage analyses. Am. J. Hum. Genet. 2007, 81, 559–575. [Google Scholar] [CrossRef] [PubMed]
- Chang, C.C.; et al. Second-generation PLINK: rising to the challenge of larger and richer datasets. GigaScience 2015, 4, 7. [Google Scholar] [CrossRef] [PubMed]
Figure 1.
Genome-wide LD decay curves (mean r² in 10-kb bins) across 0–1000 kb physical distance for seven Punjab goat breeds. Dashed and dotted lines mark r² = 0.20 and 0.10.
Figure 1.
Genome-wide LD decay curves (mean r² in 10-kb bins) across 0–1000 kb physical distance for seven Punjab goat breeds. Dashed and dotted lines mark r² = 0.20 and 0.10.
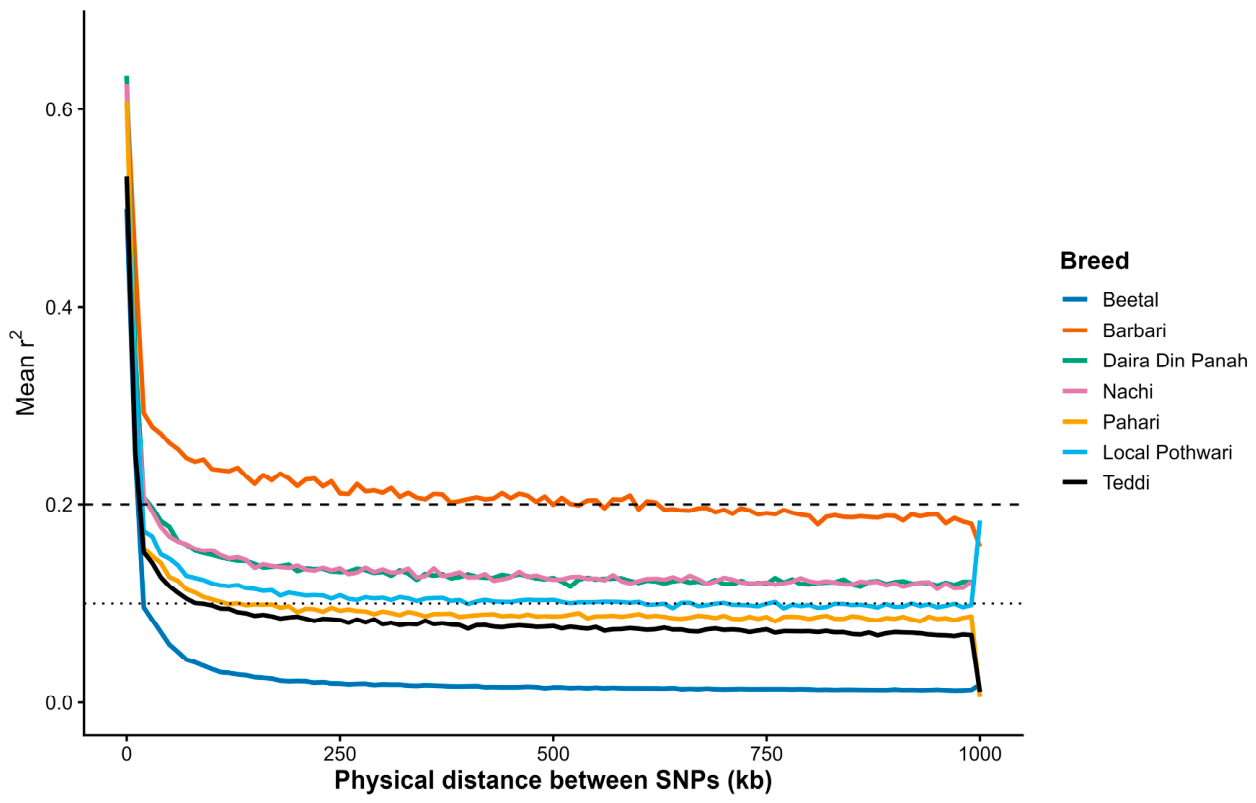
Figure 2.
Overall magnitude of linkage disequilibrium by breed, expressed as the area under the LD-decay curve (AUC, r²×kb) from 0–1000 kb.
Figure 2.
Overall magnitude of linkage disequilibrium by breed, expressed as the area under the LD-decay curve (AUC, r²×kb) from 0–1000 kb.
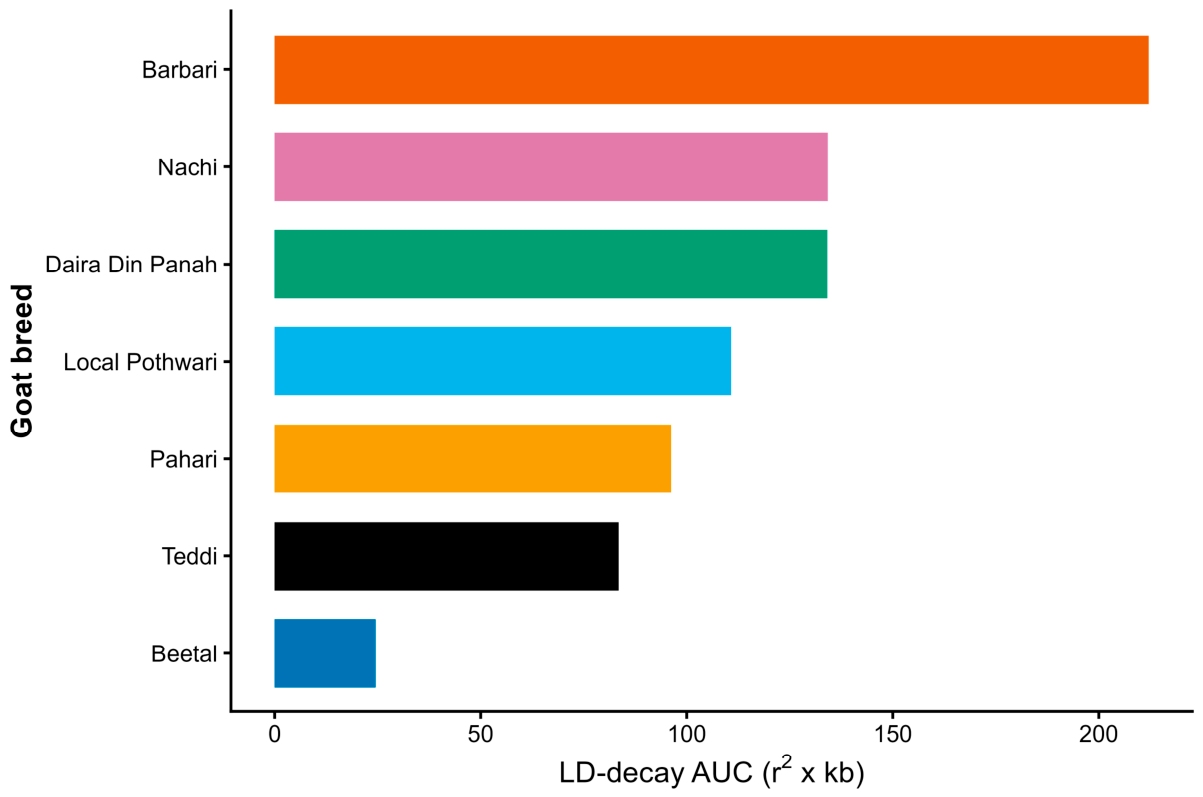
Figure 3.
Heatmap of mean pairwise LD (r²) by breed at selected physical distances (10–1000 kb).
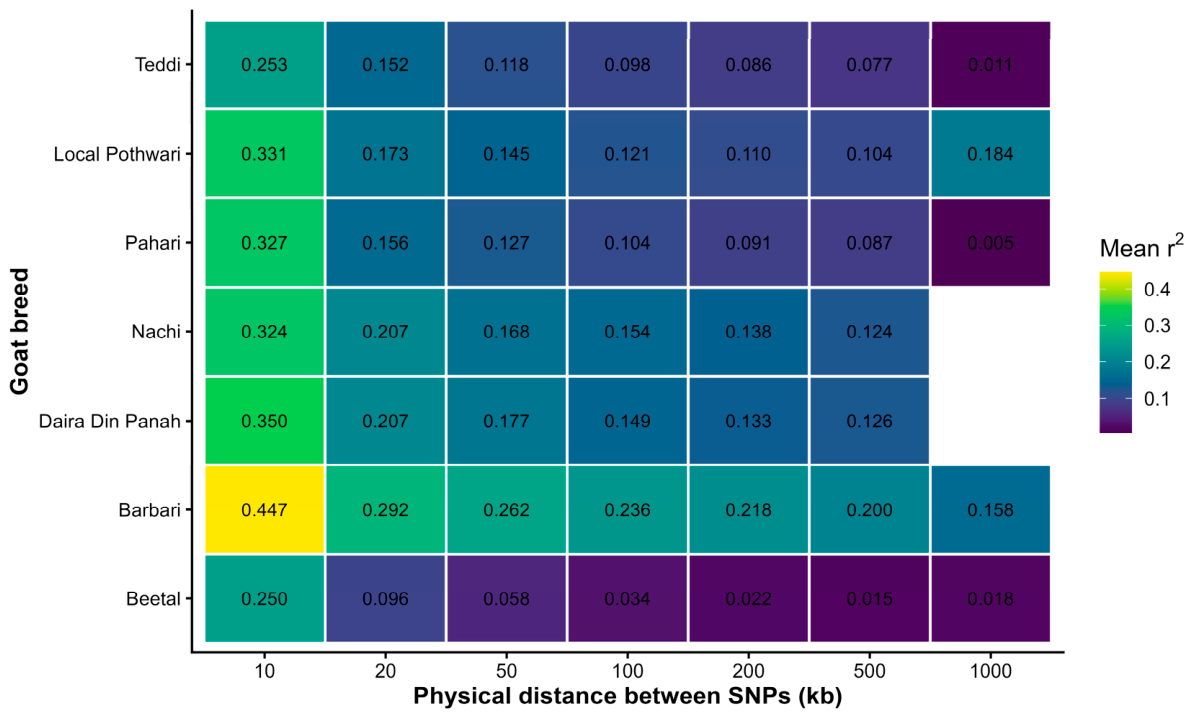
Figure 4.
Breed-specific LD decay curves plotted on independent panels. Dashed line marks r² = 0.20.
Figure 4.
Breed-specific LD decay curves plotted on independent panels. Dashed line marks r² = 0.20.
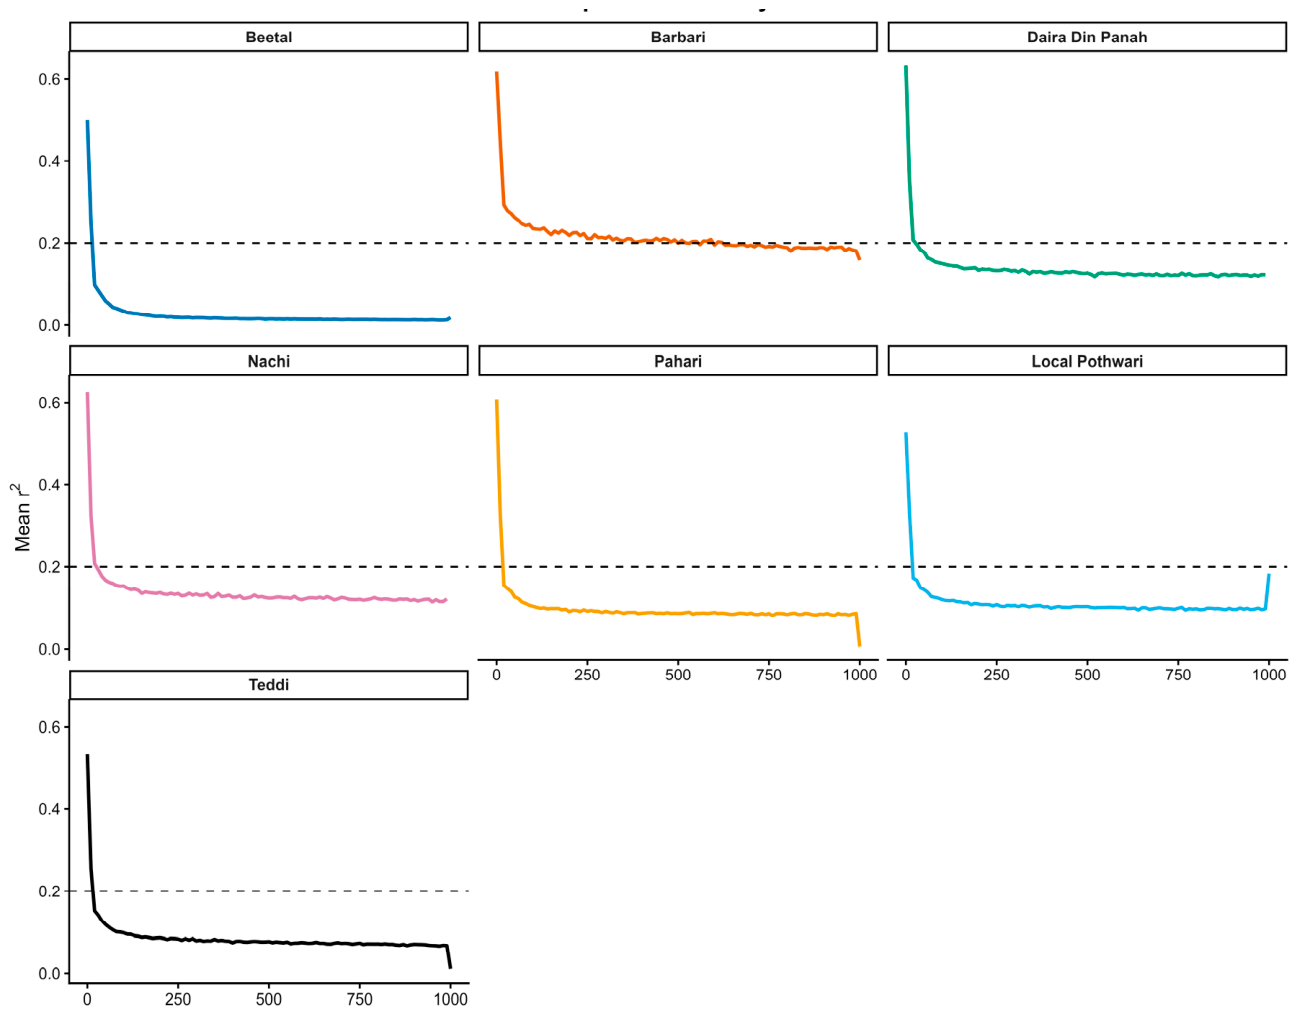
Figure 6.
Chromosome-wise mean LD (r²) for each of the 30 goat autosomes, by breed.
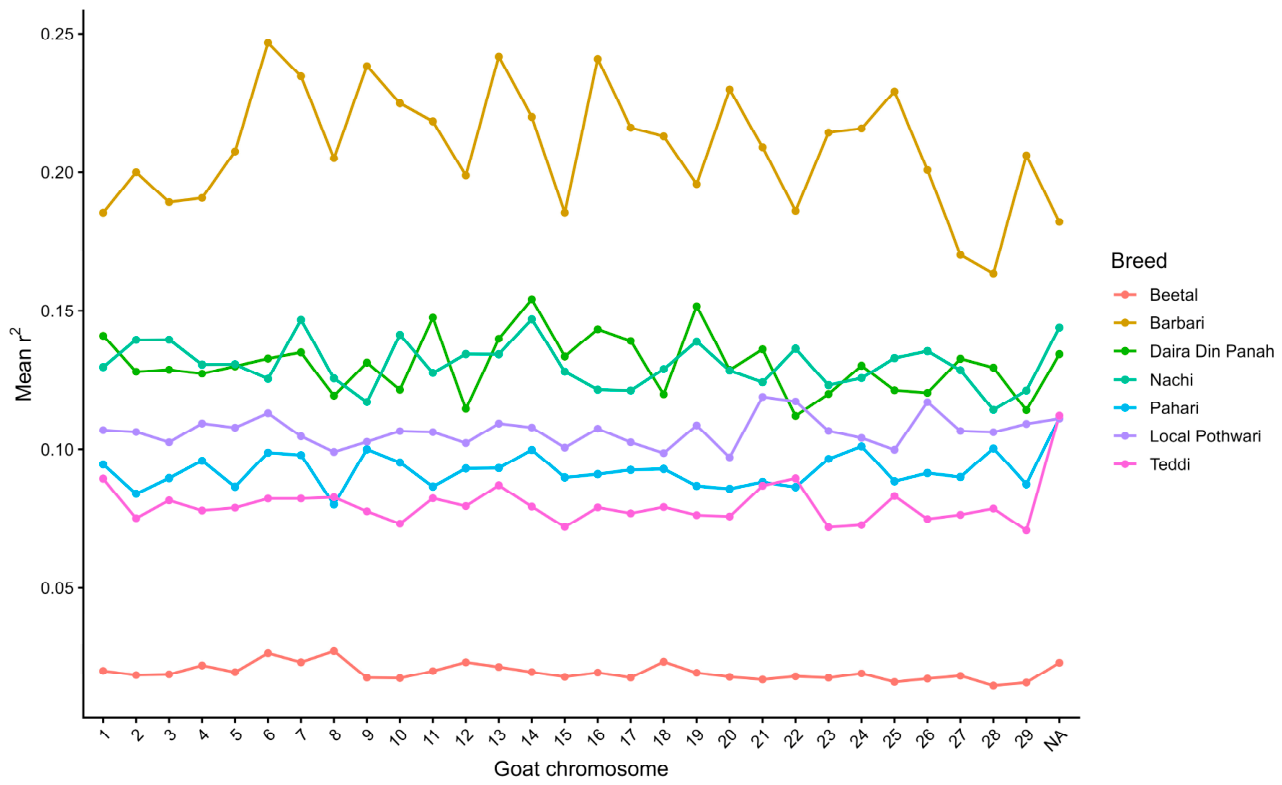

Table 1.
Raw sample size per breed prior to quality control.
| Breed | N (raw) |
|---|---|
| Barbari | 23 |
| Beetal | 594 |
| Daira Din Panah | 23 |
| Nachi | 21 |
| Pahari | 41 |
| Local Pothwari | 16 |
| Teddi | 109 |
| Total | 827 |
Table 2.
Sample and marker retention per breed after quality control filtering.
| Breed | N after QC | SNPs after QC |
|---|---|---|
| Beetal | 588 | 40,013 |
| Barbari | 23 | 32,296 |
| Daira Din Panah | 23 | 34,392 |
| Nachi | 18 | 32,083 |
| Pahari | 40 | 38,428 |
| Local Pothwari | 16 | 35,504 |
| Teddi | 109 | 38,248 |
Table 3.
Genome-wide summary of pairwise SNP LD (r², distances ≤1 Mb) by breed.
| Breed | SNP pairs | Mean r² | Median r² | SD r² | % r²≥0.20 | % r²≥0.50 |
|---|---|---|---|---|---|---|
| Beetal | 615,633 | 0.0201 | 0.0073 | 0.0482 | 0.89 | 0.20 |
| Barbari | 405,837 | 0.2084 | 0.1211 | 0.2302 | 37.03 | 12.46 |
| Daira Din Panah | 458,572 | 0.1310 | 0.0712 | 0.1572 | 23.37 | 3.99 |
| Nachi | 400,397 | 0.1313 | 0.0720 | 0.1568 | 23.71 | 3.97 |
| Pahari | 568,134 | 0.0920 | 0.0476 | 0.1178 | 14.25 | 1.27 |
| Local Pothwari | 487,319 | 0.1063 | 0.0559 | 0.1318 | 17.69 | 2.09 |
| Teddi | 564,470 | 0.0801 | 0.0396 | 0.1070 | 11.31 | 0.90 |
Table 4.
Overall LD magnitude per breed, summarized as the area under the LD-decay curve (trapezoidal integration of mean r² across 10-kb bins, 0–1000 kb) together with the mean and range of r² over the same window. Ranked from highest to lowest AUC.
Table 4.
Overall LD magnitude per breed, summarized as the area under the LD-decay curve (trapezoidal integration of mean r² across 10-kb bins, 0–1000 kb) together with the mean and range of r² over the same window. Ranked from highest to lowest AUC.
| Breed | LD-decay AUC (r²×kb) | Mean r² (0–1000 kb) | Max r² | Min r² |
|---|---|---|---|---|
| Barbari | 212.1 | 0.2138 | 0.6183 | 0.1578 |
| Nachi | 134.2 | 0.1380 | 0.6261 | 0.1150 |
| Daira Din Panah | 134.1 | 0.1379 | 0.6338 | 0.1172 |
| Local Pothwari | 110.8 | 0.1132 | 0.5292 | 0.0948 |
| Pahari | 96.2 | 0.0983 | 0.6081 | 0.0053 |
| Teddi | 83.5 | 0.0854 | 0.5328 | 0.0110 |
| Beetal | 24.5 | 0.0268 | 0.4992 | 0.0121 |
Table 5.
Mean pairwise LD (r²) by physical distance class and breed.
| Distance class | Beetal | Barbari | Daira Din Panah | Nachi | Pahari | Pothwari | Teddi |
|---|---|---|---|---|---|---|---|
| 0–10 kb | 0.499 | 0.618 | 0.634 | 0.626 | 0.608 | 0.529 | 0.533 |
| 10–25 kb | 0.206 | 0.408 | 0.307 | 0.299 | 0.286 | 0.277 | 0.231 |
| 25–50 kb | 0.080 | 0.278 | 0.193 | 0.189 | 0.146 | 0.162 | 0.137 |
| 50–100 kb | 0.045 | 0.250 | 0.160 | 0.159 | 0.116 | 0.132 | 0.106 |
| 100–250 kb | 0.025 | 0.227 | 0.139 | 0.140 | 0.097 | 0.113 | 0.088 |
| 250–500 kb | 0.017 | 0.209 | 0.129 | 0.130 | 0.089 | 0.104 | 0.079 |
| 500–1000 kb | 0.014 | 0.193 | 0.122 | 0.122 | 0.086 | 0.099 | 0.072 |
Table 6.
Mean pairwise LD (r²) by breed at selected physical distances. Blank cells indicate distances at which fewer than a handful of SNP pairs contributed to the estimate (single-pair bins at the extreme edge of the 1-Mb window), and are correspondingly less reliable.
Table 6.
Mean pairwise LD (r²) by breed at selected physical distances. Blank cells indicate distances at which fewer than a handful of SNP pairs contributed to the estimate (single-pair bins at the extreme edge of the 1-Mb window), and are correspondingly less reliable.
| Breed | 10 kb | 20 kb | 50 kb | 100 kb | 200 kb | 500 kb | 1000 kb |
|---|---|---|---|---|---|---|---|
| Barbari | 0.447 | 0.292 | 0.262 | 0.236 | 0.218 | 0.200 | 0.158 |
| Daira Din Panah | 0.350 | 0.207 | 0.177 | 0.149 | 0.133 | 0.126 | |
| Nachi | 0.324 | 0.207 | 0.168 | 0.154 | 0.138 | 0.124 | |
| Local Pothwari | 0.331 | 0.173 | 0.145 | 0.121 | 0.110 | 0.104 | 0.184 |
| Pahari | 0.327 | 0.156 | 0.127 | 0.104 | 0.091 | 0.087 | 0.005 |
| Teddi | 0.253 | 0.152 | 0.118 | 0.098 | 0.086 | 0.077 | 0.011 |
| Beetal | 0.250 | 0.096 | 0.058 | 0.034 | 0.022 | 0.015 | 0.018 |
Table 7.
Physical distance at which breed mean r² first declines below the 0.20, 0.10 and 0.05 thresholds within the 1-Mb window examined.
Table 7.
Physical distance at which breed mean r² first declines below the 0.20, 0.10 and 0.05 thresholds within the 1-Mb window examined.
| Breed | Distance to r²=0.20 (kb) | Distance to r²=0.10 (kb) | Distance to r²=0.05 (kb) |
|---|---|---|---|
| Barbari | 500 | not reached ≤ 1 Mb | not reached ≤ 1 Mb |
| Beetal | 20 | 20 | 70 |
| Daira Din Panah | 30 | not reached ≤ 1 Mb | not reached ≤ 1 Mb |
| Nachi | 30 | not reached ≤ 1 Mb | not reached ≤ 1 Mb |
| Local Pothwari | 20 | 400 | not reached ≤ 1 Mb |
| Pahari | 20 | 120 | ~1000 |
| Teddi | 20 | 90 | ~1000 |
Table 8.
Highest and lowest breed mean r² at selected physical distances, and the resulting between-breed range. The 1000-kb bin is based on a single SNP pair per breed and should be interpreted cautiously.
Table 8.
Highest and lowest breed mean r² at selected physical distances, and the resulting between-breed range. The 1000-kb bin is based on a single SNP pair per breed and should be interpreted cautiously.
| Distance (kb) | Highest r² | Highest-LD breed | Lowest r² | Lowest-LD breed | Range |
|---|---|---|---|---|---|
| 0 | 0.634 | Daira Din Panah | 0.499 | Beetal | 0.135 |
| 10 | 0.447 | Barbari | 0.250 | Beetal | 0.196 |
| 20 | 0.292 | Barbari | 0.096 | Beetal | 0.196 |
| 50 | 0.262 | Barbari | 0.058 | Beetal | 0.204 |
| 100 | 0.236 | Barbari | 0.034 | Beetal | 0.202 |
| 200 | 0.218 | Barbari | 0.022 | Beetal | 0.197 |
| 500 | 0.200 | Barbari | 0.015 | Beetal | 0.184 |
| 1000 | 0.184 | Local Pothwari | 0.005 | Pahari | 0.178 |
Table 9.
Range and mean of chromosome-wise mean LD (r²) across 30 goat autosomes, by breed.
| Breed | Min chr. mean r² | Max chr. mean r² | Mean of chr. means |
|---|---|---|---|
| Beetal | 0.0148 (chr 28) | 0.0273 (chr 8) | 0.0197 |
| Barbari | 0.1636 (chr 28) | 0.2466 (chr 6) | 0.2086 |
| Daira Din Panah | 0.1121 (chr 22) | 0.1542 (chr 14) | 0.1307 |
| Nachi | 0.1143 (chr 28) | 0.1469 (chr 7) | 0.1308 |
| Local Pothwari | 0.0971 (chr 20) | 0.1191 (chr 21) | 0.1066 |
| Pahari | 0.0803 (chr 8) | 0.1113 (chr 30) | 0.0926 |
| Teddi | 0.0709 (chr 29) | 0.1122 (chr 30) | 0.0804 |
Table 10.
Genome-wide SNP density summary across the 29 goat autosomes.
| Metric | Value |
|---|---|
| Total autosomal SNPs (full marker map) | 38,890 |
| Total autosome length | 2,400.5 Mb |
| Genome-wide mean SNP density | 16.20 SNPs/Mb |
| Minimum chromosome density | 14.15 SNPs/Mb (chr 18) |
| Maximum chromosome density | 17.43 SNPs/Mb (chr 12) |
Disclaimer/Publisher’s Note: The statements, opinions and data contained in all publications are solely those of the individual author(s) and contributor(s) and not of MDPI and/or the editor(s). MDPI and/or the editor(s) disclaim responsibility for any injury to people or property resulting from any ideas, methods, instructions or products referred to in the content. |
© 2026 by the authors. Licensee MDPI, Basel, Switzerland. This article is an open access article distributed under the terms and conditions of the Creative Commons Attribution (CC BY) license.
Copyright: This open access article is published under a Creative Commons CC BY 4.0 license, which permit the free download, distribution, and reuse, provided that the author and preprint are cited in any reuse.