

Submitted:
08 August 2026
Posted:
11 August 2026
You are already at the latest version
Abstract
Pakistan's Punjab province harbours seven documented indigenous goat breeds Beetal, Barbari, Daira Din Panah, Nachi, Pahari, Local Pothwari and Teddi that together underpin smallholder meat and milk production across the province. Despite their economic and genetic importance, the historical demography of these breeds has not previously been reconstructed from genome-wide marker data. Using Illumina Caprine 50 K SNP Bead Chip genotypes from 827 unrelated animals, we applied a linkage-disequilibrium (LD)–based method to reconstruct effective population size (Ne) trajectories spanning approximately 11 to 5,000 generations ago for each breed. All seven breeds showed an ancestral Ne of 2,700–4,500 that increased to a mid-history peak of 3,400–8,300 individuals roughly 1,400–2,300 generations ago, followed by a pronounced and accelerating decline toward the present. At the most recent distance class examined (~11 generations ago), estimated Ne ranged from 63 (Barbari) to 968 (Beetal), representing declines of 78.4% to 97.7% relative to ancestral levels. Five of the seven breeds (Barbari, Daira Din Panah, Nachi, Pahari and Teddi) presently show a recent Ne below 150, and six of seven fall below the FAO threshold of 100 associated with elevated risk of inbreeding depression and loss of adaptive genetic variation over the short term. These results indicate that recent demographic and breeding-management pressures, rather than ancient bottlenecks, are the dominant driver of contemporary genetic erosion in Punjab goat breeds, and they provide a quantitative, breed-specific evidence base for prioritising in situ and ex situ conservation and structured breeding programmes.
Keywords:
effective population size
; linkage disequilibrium
; SNP
; goat
; Capra hircus
; genetic diversity
; Punjab
; Pakistan
; conservation genomics
1. Introduction
Effective population size (Ne) is one of the most informative parameters in conservation and quantitative genetics because it summarises, in a single value, the combined effects of genetic drift, inbreeding accumulation and the erosion of additive genetic variance within a population. Populations with small Ne lose genetic diversity faster, accumulate inbreeding more rapidly, and have reduced long-term capacity to respond to selection or to adapt to environmental and disease pressures. The Food and Agriculture Organization (FAO) and the Convention on Biological Diversity have therefore recommended Ne as a core indicator of genetic risk in livestock breeds, with Ne below 50 considered critical, Ne between 50 and 100 considered endangered, and Ne above 500 generally regarded as necessary to preserve long-term evolutionary potential [1,2].
Pakistan is the third-largest goat-producing country in the world, with an estimated national population of 78.2 million head, of which Punjab province accounts for approximately 37% [3,4]. Seven distinct, well-documented goat breeds are reared across Punjab: Beetal, Daira Din Panah, Nachi (Bikaneri), Barbari, Teddi, Pahari (Kajli) and Local Pothwari, each associated with a distinct home tract, morphology and production purpose ranging from large dual-purpose meat-and-milk types (Beetal) to small, highly prolific breeds favoured for religious sacrifice and smallholder systems (Teddi, Barbari) [5,6]. These breeds have recently been genotyped on the Illumina Caprine 50 K SNP Bead Chip and characterised for genetic diversity, population structure and genome-wide association with growth and conformation traits [7,8]. However, the historical demographic trajectory of these breeds—how their effective population size has changed from ancient founding events through to the present day—has not previously been reconstructed.
Genome-wide SNP data allow Ne to be estimated not only at the present generation but also at successive time points in the past, because the extent of linkage disequilibrium (LD) between markers separated by a given physical distance reflects the effective population size a corresponding number of generations ago: LD between closely linked markers persists over many generations and therefore reflects ancient Ne, whereas LD between more distant markers decays rapidly and reflects recent Ne. This LD-based approach, first formalised by Hayes et al. [9] and subsequently implemented in tools such as SNeP [10], has been widely applied to reconstruct the demographic history of cattle, sheep, pigs and, more recently, goat breeds, including a genome-wide survey of Spanish goat breeds [11]. Because the method requires no pedigree information, it is particularly well suited to smallholder-managed indigenous breeds such as those of Punjab, for which multi-generation pedigrees are rarely available.
The present study uses the same 50 K SNP genotype resource generated for the Punjab goat breeds to reconstruct breed-specific Ne trajectories spanning roughly 5,000 generations of history, quantify the magnitude of recent genetic erosion relative to ancestral population size, and rank breeds by their current genetic-risk status. These results are intended to complement previous diversity and association-mapping work on these breeds [7,8] and to provide an evidence base for breed-specific conservation and breeding-management recommendations.
2. Results
2.1. Sample Composition and Genotype Quality Control
A total of 827 goats belonging to seven Punjab breeds were genotyped on the Illumina Caprine 50 K SNP Bead Chip. Breed-specific quality control (SNP call rate ≥ 0.95, animal call rate ≥ 0.95, minor allele frequency ≥ 0.05) was applied independently within each breed prior to LD-based analysis, since per-breed allele frequency spectra and sample sizes differ substantially and pooling before filtering would bias rare-variant-driven LD estimates. Retained sample sizes ranged from 16 animals (Local Pothwari) to 588 animals (Beetal), and the number of SNPs passing quality control ranged from 32,083 (Nachi) to 40,013 (Beetal) (Table 1).
2.2. Historical Ne Trajectories
LD-based reconstruction across 18 physical-distance classes (10 kb to 4,500 kb midpoints, corresponding to approximately 11 to 4,992 generations ago) revealed a consistent demographic signature across six of the seven breeds: a moderate ancestral Ne of 3,300–4,500 individuals around 4,700–5,000 generations ago, a rise to a mid-history maximum of 3,800–8,300 individuals approximately 1,400–2,300 generations ago, and a subsequent, progressively steepening decline toward the present (Figure 1, Figure 2). Beetal showed the highest trajectory throughout the reconstructed history, peaking at Ne ≈ 8,308 around 1,729 generations ago before falling to Ne = 968 at the most recent distance class. Local Pothwari followed a similar rise-and-fall pattern with a lower peak (Ne ≈ 6,950). Daira Din Panah, Nachi, Pahari and Teddi showed a tightly clustered pattern with peaks of Ne ≈ 4,000–5,700 in the same 1,400–2,300-generation window.
Barbari was the only breed that did not display a mid-history expansion: its Ne declined almost monotonically from 2,748 at the earliest reconstructed time point to 63 at the most recent, indicating a long, sustained contraction rather than a recent-onset decline (Figure 3).
2.3. Recent Effective Population Size and Breed Ranking
At the most recent distance class analysed (mean physical distance ≈ 4,499 kb, corresponding to ~11 generations ago), estimated Ne differed by more than 15-fold among breeds (Table 2, Figure 4). Beetal retained by far the largest contemporary effective population size (Ne = 968), consistent with its status as the most numerous and widely distributed breed and its five recognised strains. Local Pothwari (Ne = 215) and Teddi (Ne = 139) occupied intermediate positions, while Nachi (119), Pahari (107), Daira Din Panah (91) and Barbari (63) all showed recent Ne below 150. Six of the seven breeds fall below the FAO Ne = 100 threshold associated with elevated short-term inbreeding risk, and Barbari and Daira Din Panah fall within the range flagged as approaching critical status.
2.4. Magnitude of Recent Genetic Erosion
Comparison of ancestral and recent Ne estimates (Table 2, Figure 5) showed that every breed has undergone a substantial contraction in effective population size, but the magnitude of decline was markedly uneven. Barbari (−97.7%) and Daira Din Panah (−97.2%) showed the most severe proportional erosion, followed closely by Nachi (−96.9%), Pahari (−96.8%) and Teddi (−96.8%). Local Pothwari, despite having a comparatively large ancestral Ne, also declined by 95.2%. Beetal showed the least severe proportional decline (−78.4%), consistent with its larger contemporary population and the maintenance of multiple recognised strains, but even this decline is substantial in absolute terms (a loss of 3,514 effective breeding individuals).
3. Discussion
This study provides the first genome-wide, LD-based reconstruction of historical effective population size for the documented goat breeds of Punjab, Pakistan. Two demographic signatures emerge from the analysis. First, six of the seven breeds share a common deep-history pattern of a moderate ancestral Ne, a mid-history expansion peaking roughly 1,400–2,300 generations ago, and a subsequent decline a trajectory broadly consistent with early post-domestication population growth followed by breed formation and, in the most recent period, contraction associated with modern livestock management. Second, and more strikingly, all seven breeds show a pronounced and accelerating loss of effective population size in the most recent generations, with proportional declines of 78–98% relative to ancestral levels. Because the LD-based method places this decline predominantly within the last few hundred generations well within the era of organised breeding, market-driven selection and, for several breeds, restriction to a narrow home tract the pattern points to recent breeding and management practices, rather than ancient founder effects, as the principal driver of contemporary genetic erosion.
The breed-level heterogeneity in current Ne has direct conservation implications. Beetal, the largest and most widely distributed breed with five recognised strains (Faisalabadi, Nuqri, Nagri, Gujrati and MakhiChini) and preferred for its size at Eid-ul-Azha, retains a comparatively robust recent Ne of 968, likely reflecting both its larger census population and greater effective breeding-male diversity across strains and sub-populations. In contrast, Barbari and Daira Din Panah both minor breeds with restricted home tracts in D.G. Khan, Rajanpur, Layyah and Muzaffargarh—show recent Ne below 100, placing them in the FAO endangered category and indicating an elevated risk of inbreeding depression, reduced fertility and diminished response to future selection if current management continues unchanged. Nachi, Pahari and Teddi occupy an intermediate but still concerning position, with recent Ne between 100 and 150.
The unique demographic profile of Barbari a long, continuous decline without the mid-history expansion phase seen in the other breeds may reflect its small and geographically restricted population throughout its history, its comparatively recent formal recognition as a distinct breed, and its selection primarily for milk and meat traits within closed, small-scale flocks resembling a deer in conformation. This continuous-decline signature contrasts with the expansion-then-contraction pattern of the other breeds and suggests that Barbari's conservation priority should not be interpreted solely from its percentage decline (which is comparable to several other breeds) but also from its consistently small absolute Ne across its reconstructed history.
These findings complement previous work on the same genotype resource that characterised genetic diversity, population structure and genome-wide associations with body weight and conformation traits in these breeds [7,8]. Taken together, the two analyses indicate that despite meaningful phenotypic and genomic differentiation among the seven breeds, several are simultaneously experiencing rapid contemporary loss of effective population size—a combination that increases the urgency of coordinated, breed-specific conservation action. Practical measures indicated by the present results include: (i) expanding the pool of registered breeding males and equalising male reproductive contribution, particularly in Barbari, Daira Din Panah and Nachi; (ii) establishing rotational or cooperative mating schemes across flocks within a breed's home tract to reduce co-ancestry; (iii) prioritising cryopreservation of semen and, where feasible, embryos from genetically distinct sires as an ex situ safeguard, especially for breeds with recent Ne below 100; and (iv) incorporating genomic Ne monitoring into future sampling rounds to track whether management interventions arrest the observed decline.
Several limitations should be considered when interpreting these results. LD-based Ne estimates for the most ancient distance classes are sensitive to sample size, and the smallest breed sample (Local Pothwari, n = 16) yields wider uncertainty around its historical trajectory than the larger Beetal and Teddi samples; the sample-size correction applied here (adjusted r² = mean r² − 1/n) mitigates but does not eliminate this effect. LD-based Ne also reflects the breeding population contributing to the genotyped sample and may not fully capture unsampled sub-populations or recent cross-breeding. Nonetheless, the consistency of the qualitative pattern—universal recent decline, breed-specific magnitude tracking known differences in population size and management—across breeds of very different sample size and history lends confidence to the overall conclusions.
4. Conclusions
Genome-wide LD-based reconstruction shows that all seven documented goat breeds of Punjab have experienced a severe contraction in effective population size in the recent past, with declines of 78–98% relative to ancestral levels and six of seven breeds currently below the FAO Ne = 100 threshold for elevated inbreeding risk. Beetal remains comparatively secure, but Barbari, Daira Din Panah, Nachi, Pahari and Teddi warrant urgent, breed-specific conservation attention, including expansion of the effective breeding-male pool, structured mating schemes, and ex situ genetic banking. These findings establish a quantitative baseline against which the effectiveness of future conservation interventions in Punjab's indigenous goat genetic resources can be measured.
5. Methods
5.1. Ethics Declaration
This study reused genotype and phenotype data collected from a survey of goat-keeping farmers together with blood sampling of their animals. Participants provided verbal informed consent for animal blood sampling and for related survey questions. Collection of blood samples and all animal-handling procedures were performed in accordance with relevant guidelines and regulations for animal welfare, and the study was carried out in compliance with the ARRIVE guidelines.
5.2. Breeds and Sampling
Blood samples were collected by jugular venepuncture into EDTA vacutainers from unrelated animals of all seven documented Punjab goat breeds: Beetal (including its five recognised strains Faisalabadi, Nuqri, Nagri, Gujrati and MakhiChini), Teddi, Pahari (Kajli), Local Pothwari, Daira Din Panah, Barbari and Nachi (Bikaneri). Sampling was carried out across the principal home tracts of each breed in Punjab, and animal identity was recorded to ensure that sampled individuals were unrelated and representative of each breed.
5.3. Genotyping and Quality Control
Genomic DNA was extracted from whole blood and genotyped using the Illumina Caprine 50 K SNP Bead Chip, which covers 53,347 SNPs distributed across the whole caprine genome (ARS1 assembly). After merging, 827 unrelated animals across the seven breeds passed initial quality control. For the present LD-based Ne analysis, quality control was subsequently applied independently within each breed in PLINK [12], removing SNPs with a genotyping call rate below 0.95 (--geno 0.05), animals with a call rate below 0.95 (--mind 0.05), and SNPs with a minor allele frequency below 0.05 (Table 3). Breed-specific filtering was used because pooling animals of very different sample size prior to MAF filtering would differentially bias the retained SNP set and downstream LD estimates for the smaller breeds.
5.4. LD-Based Estimation of Historical Effective Population Size
For each breed, pairwise LD (r²) was calculated between autosomal SNPs across 18 physical-distance classes spanning 0–5,000 kb (bin boundaries: 0–20, 20–30, 30–40, 40–50, 50–75, 75–100, 100–150, 150–200, 200–300, 300–400, 400–500, 500–750, 750–1,000, 1,000–1,500, 1,500–2,000, 2,000–3,000, 3,000–4,000 and 4,000–5,000 kb). Mean and median r² were computed per distance class per breed, and mean r² was corrected for finite sample size using adjusted r² = mean r² − 1/n, where n is the number of genotyped animals retained for that breed after quality control. For each distance class, the corresponding genetic distance (c, in Morgans) was derived from the mean physical distance assuming a constant recombination rate of 1 cM/Mb, and effective population size at the generation corresponding to that distance class was estimated as Ne = (1/r² − 1) / (4c), following the standard LD-based Ne framework of Hayes et al. [9], with the number of generations before present corresponding to a given distance class estimated as t = 1 / (2c). This approach yields, for each breed, a continuous trajectory of Ne estimates from approximately 11 generations ago (largest physical distance, 4,000–5,000 kb) to approximately 5,000 generations ago (smallest physical distance, 0–20 kb). ‘Recent Ne’ in the Results refers to the estimate at the most recent distance class available for each breed; ‘ancestral Ne’ refers to the estimate at the 0–20 kb (deepest) distance class.
5.5. Statistical Software
Quality control and LD calculations were performed in PLINK [12]. Historical Ne trajectories, breed-specific plots, and comparative ancestral-versus-recent summaries were generated in R.
Author Contributions
Conceptualization, H.M.P.; methodology, H.M.P.; software, H.M.P.; validation, H.M.P. and A.M.; formal analysis, H.M.P.; investigation, H.M.P. and A.M.; resources, A.M.; data curation, H.M.P.; writing—original draft preparation, H.M.P.; writing—review and editing, H.M.P. and A.M.; visualization, H.M.P.; supervision, H.M.P.; project administration, H.M.P.; funding acquisition, H.M.P. All authors have read and agreed to the published version of the manuscript.
Funding
This research was partially funded by the Punjab Agricultural Research Board (PARB), grant number 25-973.
Institutional Review Board Statement
Ethical review and approval were waived for this study because it is a secondary analysis of pre-existing, anonymized genotype and phenotype data; no new animal experimentation, sampling or handling was performed for the present study. The blood sampling and animal-handling procedures that generated the underlying data were carried out by qualified veterinary personnel in accordance with relevant national guidelines and regulations for animal welfare and in compliance with the ARRIVE guidelines, as part of the original data-collection study describing this genotyping resource (Muner et al., 2021, Trop. Anim. Health Prod. 53, 368; Moaeen-ud-Din et al., 2022, Sci. Rep. 12, 9891).
Informed Consent Statement
Not applicable (study did not involve human subjects; verbal informed consent for animal sampling was obtained from participating farmers as described in Section 5.1).
Data Availability Statement
The genotype data underlying this analysis derive from the Punjab goat 50 K SNP genotyping resource.
Acknowledgments
The genotype data analyzed in this study originate from the Punjab goat population genotyped, quality-controlled and described by Moaeen-ud-Din, M., Muner, R.D. & Khan, M.S. (2022). “Genome wide association study identifies novel candidate genes for growth and body conformation traits in goats.” Scientific Reports, 12, 9891 (https://doi.org/10.1038/s41598-022-14018-y).
Competing Interests
The authors declare no competing interests.
References
- Wright, S. Evolution in Mendelian populations. Genetics 1931, 16, 97–159.
- FAO. Molecular Genetic Characterization of Animal Genetic Resources; FAO Animal Production and Health Guidelines No. 9; Food and Agriculture Organization of the United Nations: Rome, Italy, 2011.
- GOP. Economic Survey of Pakistan; Government of Pakistan: Islamabad, Pakistan, 2020.
- GOP. Pakistan Livestock Census; Government of Pakistan: Islamabad, Pakistan, 2006.
- Moaeen-ud-Din, M. Goat Breeds of Pakistan—Revisited, 1st ed.; Amazon: Seattle, WA, USA, 2020.
- Khan, M.; Khan, M.; Mahmood, S. Genetic resources and diversity in Pakistani goats. Int. J. Agric. Biol. 2008, 10, 227–231.
- Muner, R.D.; et al. Exploring genetic diversity and population structure of Punjab goat breeds using Illumina 50 K SNP bead chip. Trop. Anim. Health Prod. 2021, 53, 368. [CrossRef]
- Moaeen-ud-Din, M.; Muner, R.D.; Khan, M.S. Genome wide association study identifies novel candidate genes for growth and body conformation traits in goats. Sci. Rep. 2022, 12, 9891.
- Hayes, B.J.; Visscher, P.M.; McPartlan, H.C.; Goddard, M.E. Novel multilocus measure of linkage disequilibrium to estimate past effective population size. Genome Res. 2003, 13, 635–643. [CrossRef]
- Barbato, M.; Orozco-terWengel, P.; Tapio, M.; Bruford, M.W. SNeP: a tool to estimate trends in effective population size using genome-wide SNP data. Front. Genet. 2015, 6, 109.
- Manunza, A.; et al. A genome-wide perspective about the diversity and demographic history of seven Spanish goat breeds. Genet. Sel. Evol. 2016, 48, 52. [CrossRef]
- Purcell, S.; et al. PLINK: a tool set for whole-genome association and population-based linkage analyses. Am. J. Hum. Genet. 2007, 81, 559–575.
Figure 1.
Historical effective population size (Ne) of seven Punjab goat breeds reconstructed from genome-wide linkage disequilibrium, plotted against generations before present (linear scale).
Figure 1.
Historical effective population size (Ne) of seven Punjab goat breeds reconstructed from genome-wide linkage disequilibrium, plotted against generations before present (linear scale).
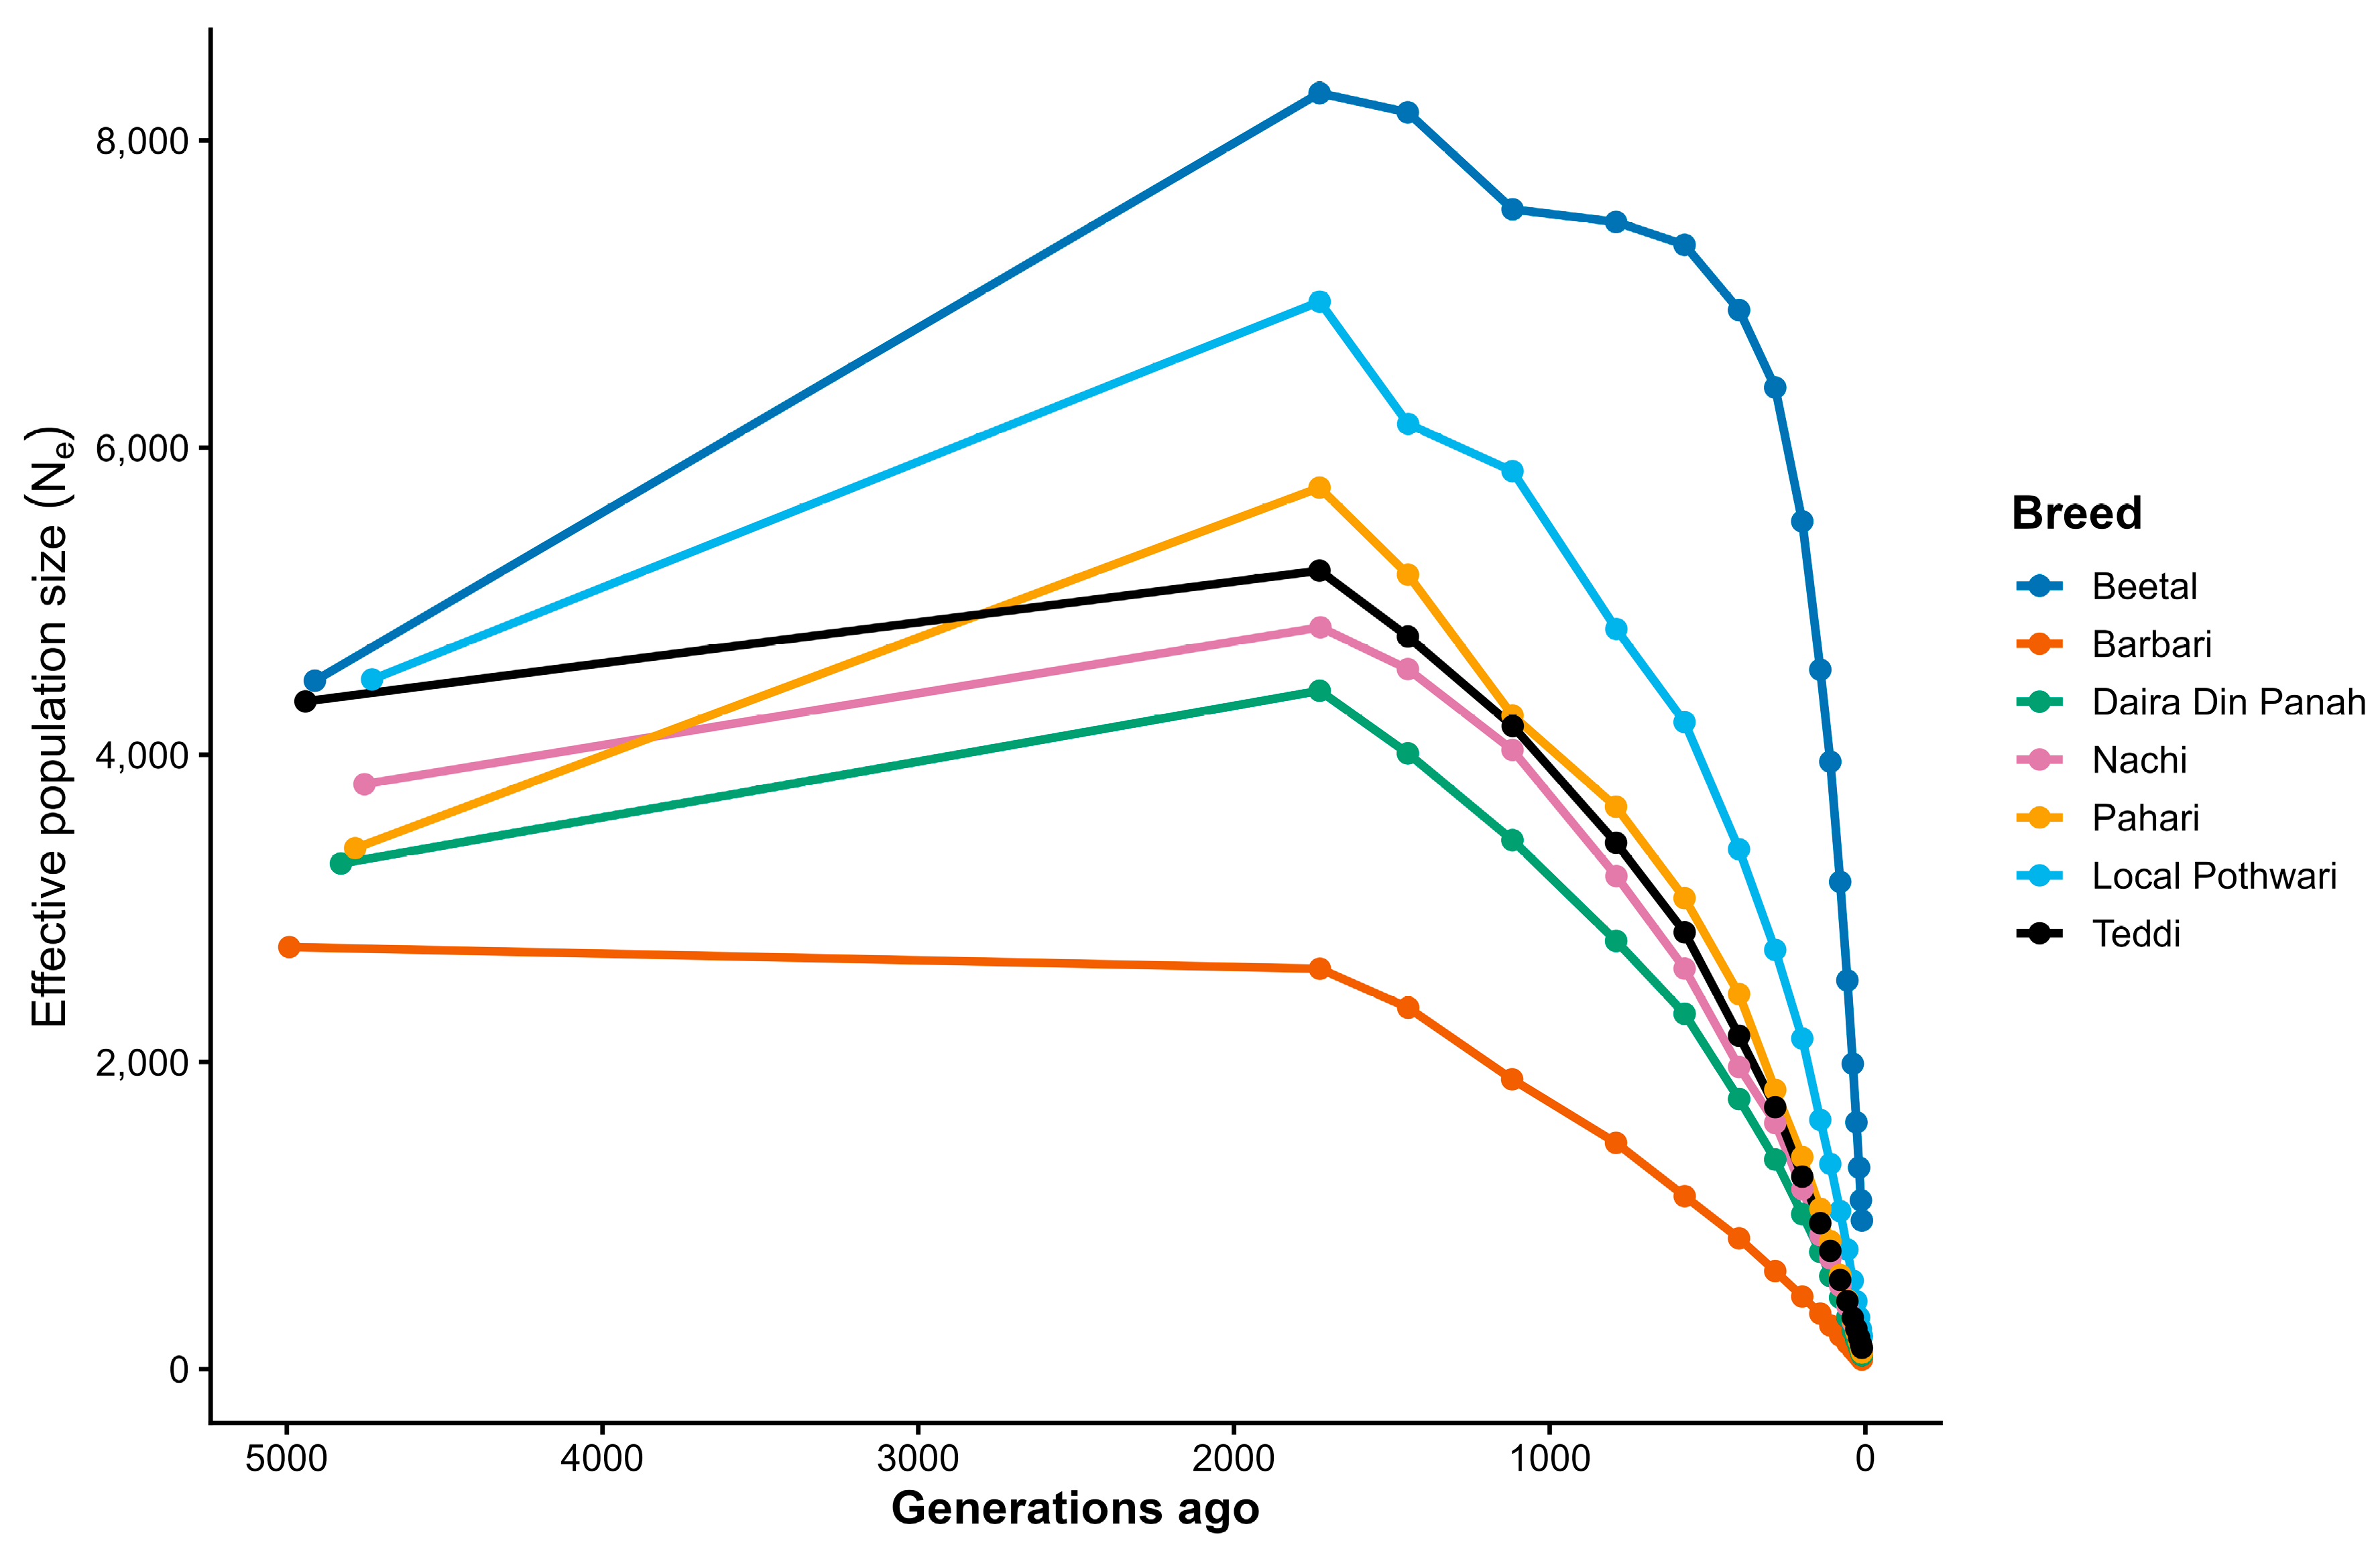
Figure 2.
The same historical Ne reconstruction shown on a log–log scale, which resolves the shared demographic trajectory across breeds — a gradual ancestral rise followed by a sharp, near-universal recent decline.
Figure 2.
The same historical Ne reconstruction shown on a log–log scale, which resolves the shared demographic trajectory across breeds — a gradual ancestral rise followed by a sharp, near-universal recent decline.
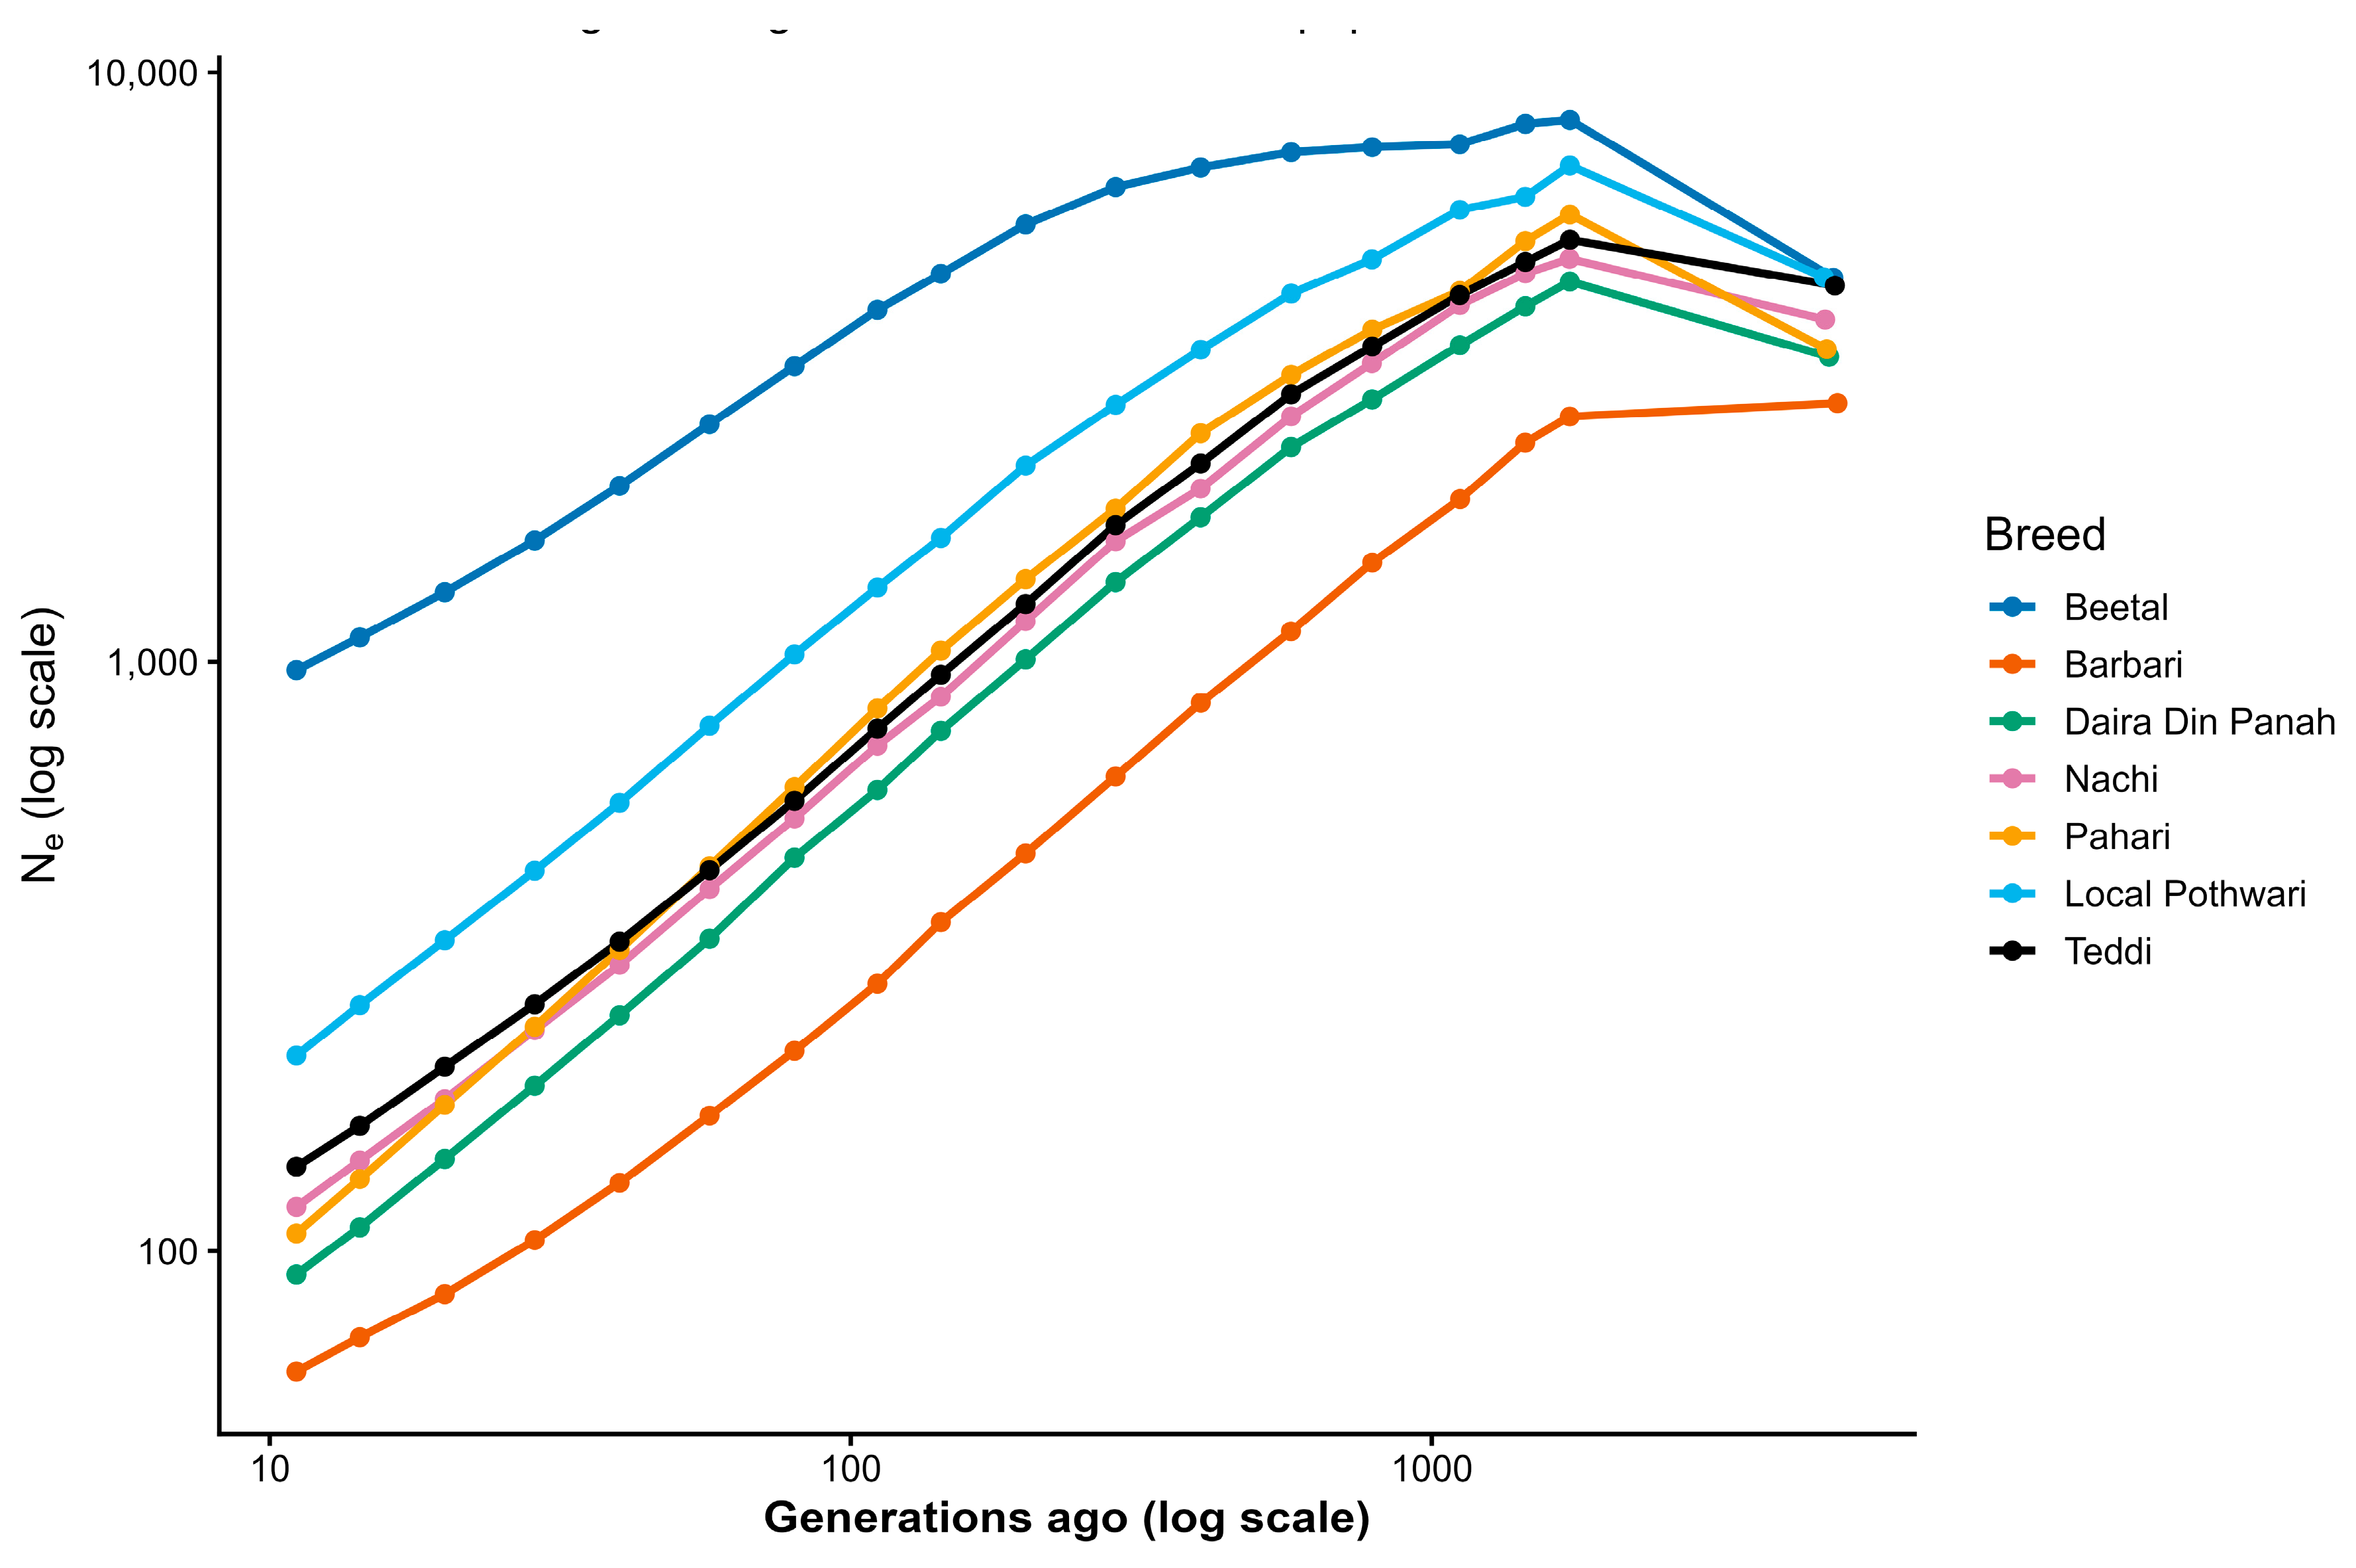
Figure 3.
Breed-specific historical Ne trajectories shown on independent y-axis scales, highlighting that Barbari uniquely lacks the mid-history expansion phase observed in the other six breeds.
Figure 3.
Breed-specific historical Ne trajectories shown on independent y-axis scales, highlighting that Barbari uniquely lacks the mid-history expansion phase observed in the other six breeds.
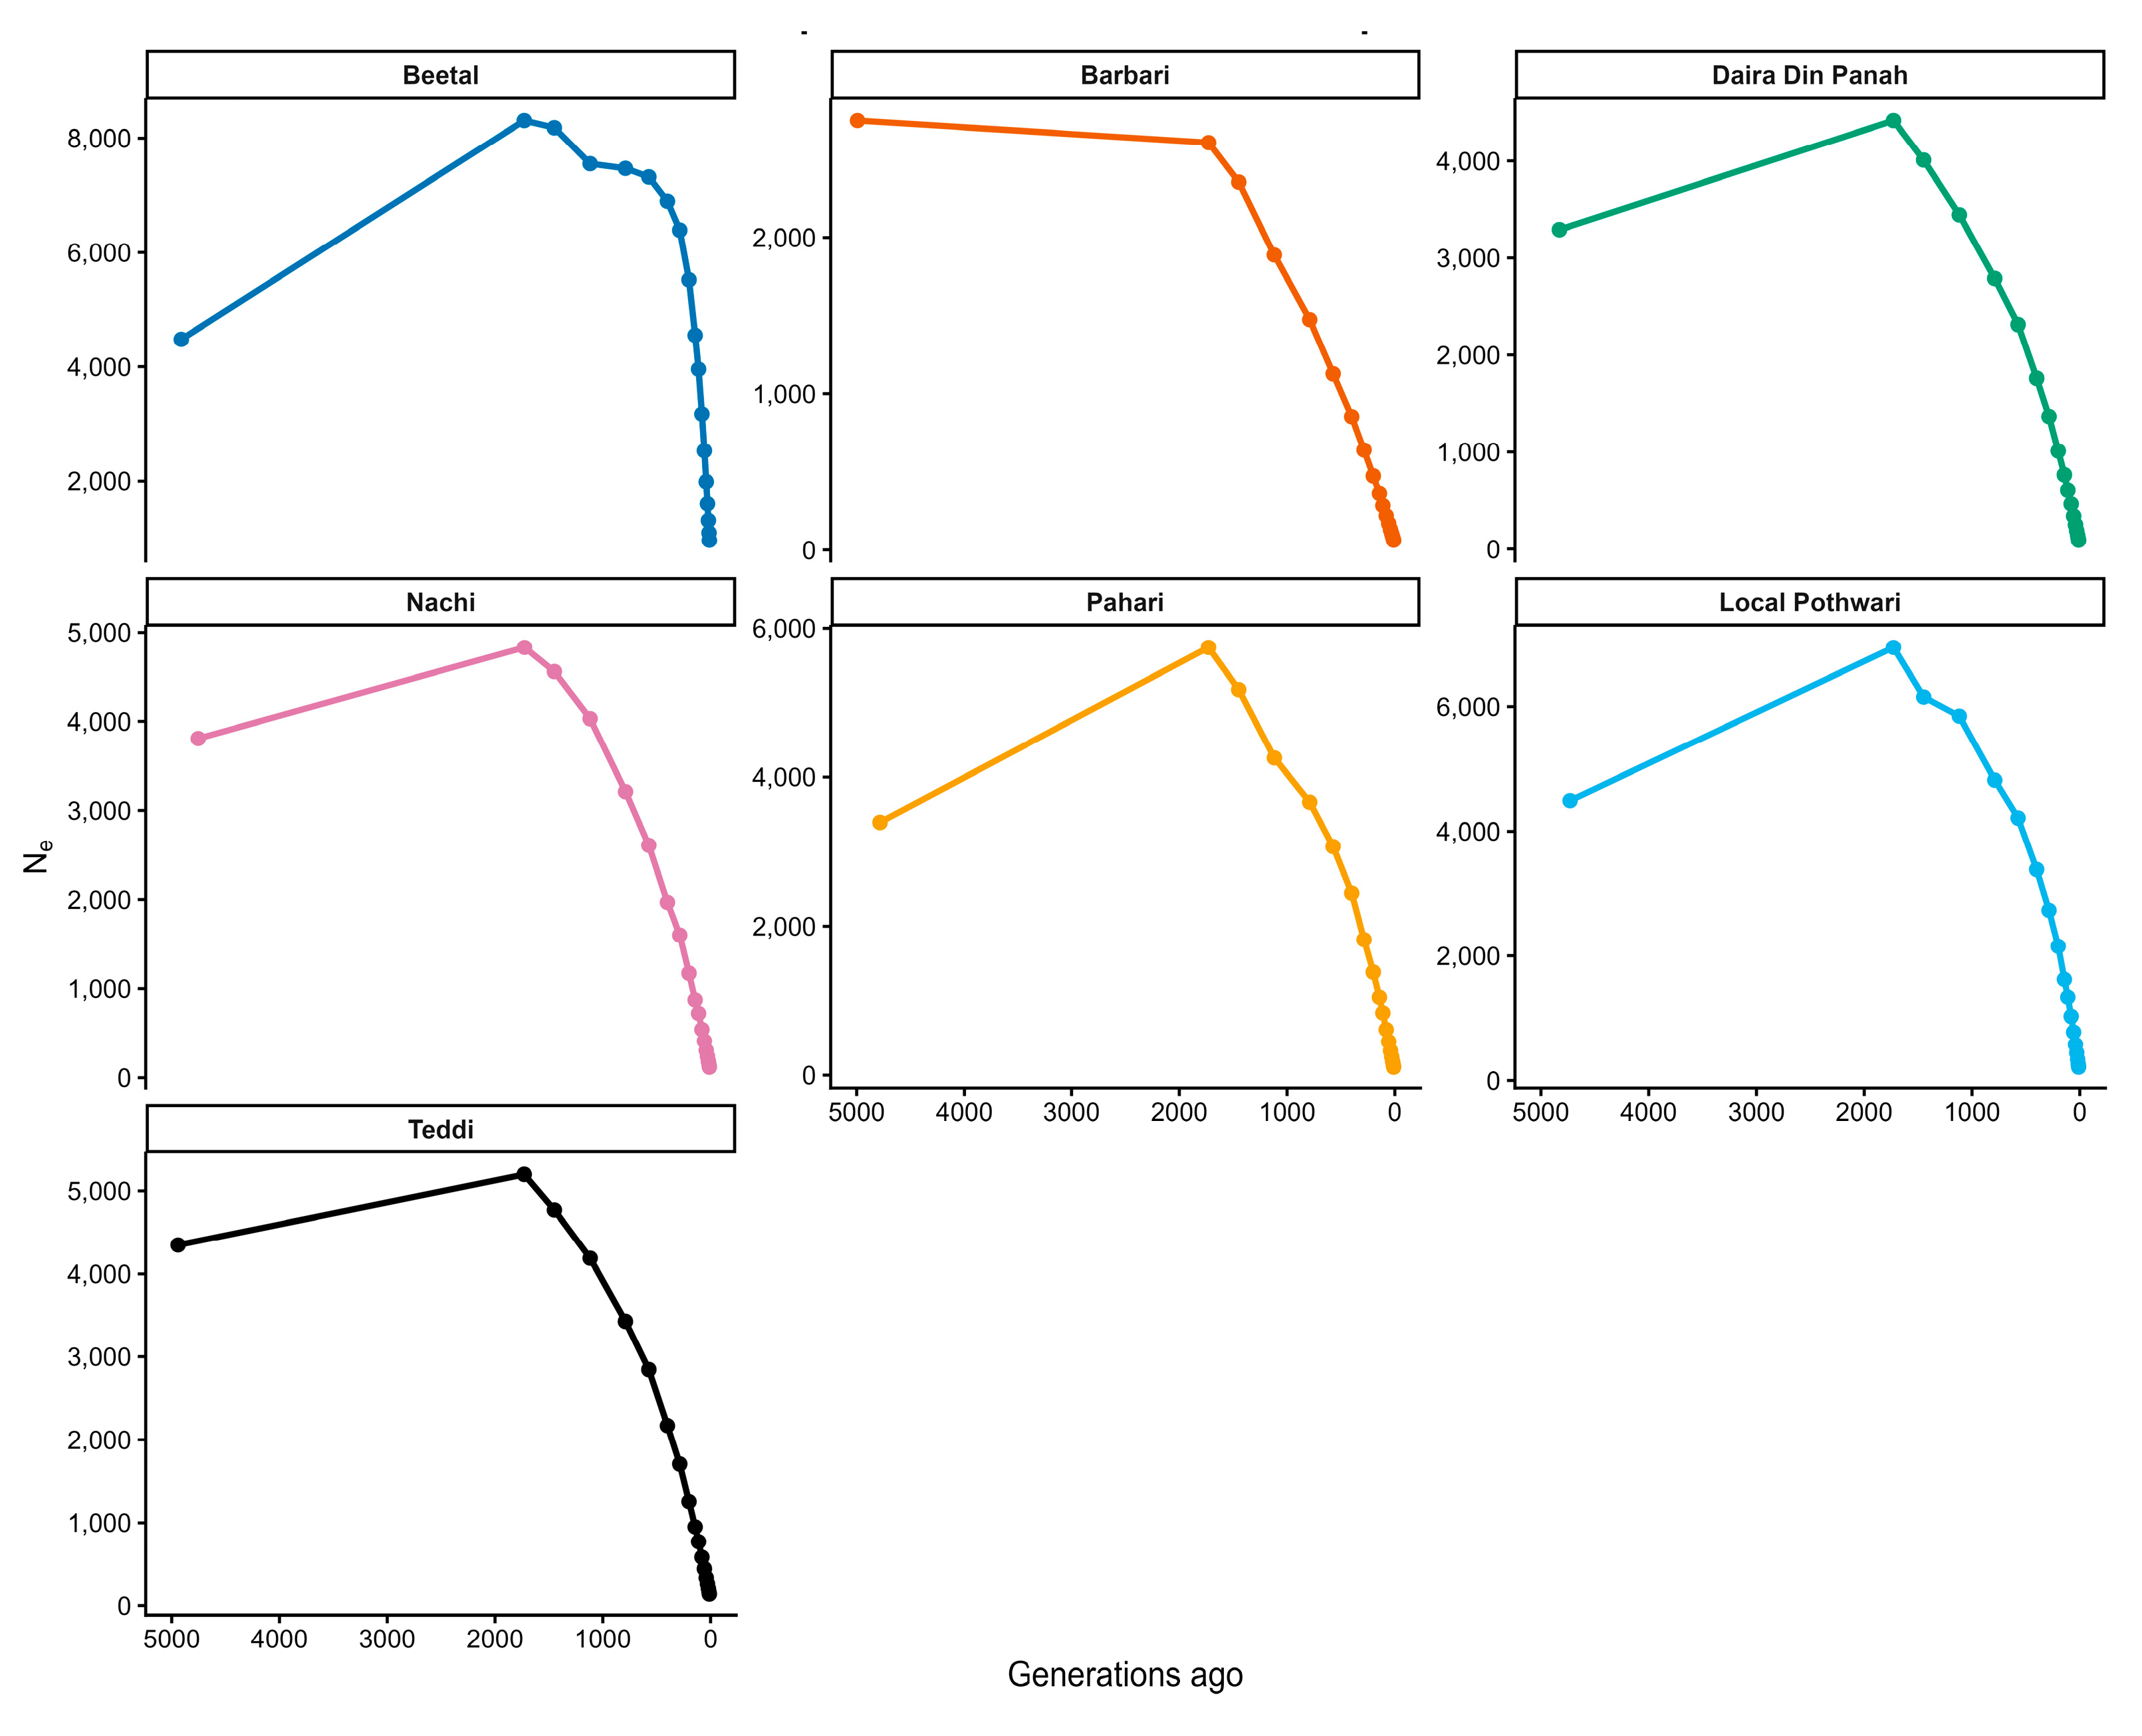
Figure 4.
Recent effective population size (Ne) by breed, estimated at the most recent LD distance class available for each breed.
Figure 4.
Recent effective population size (Ne) by breed, estimated at the most recent LD distance class available for each breed.
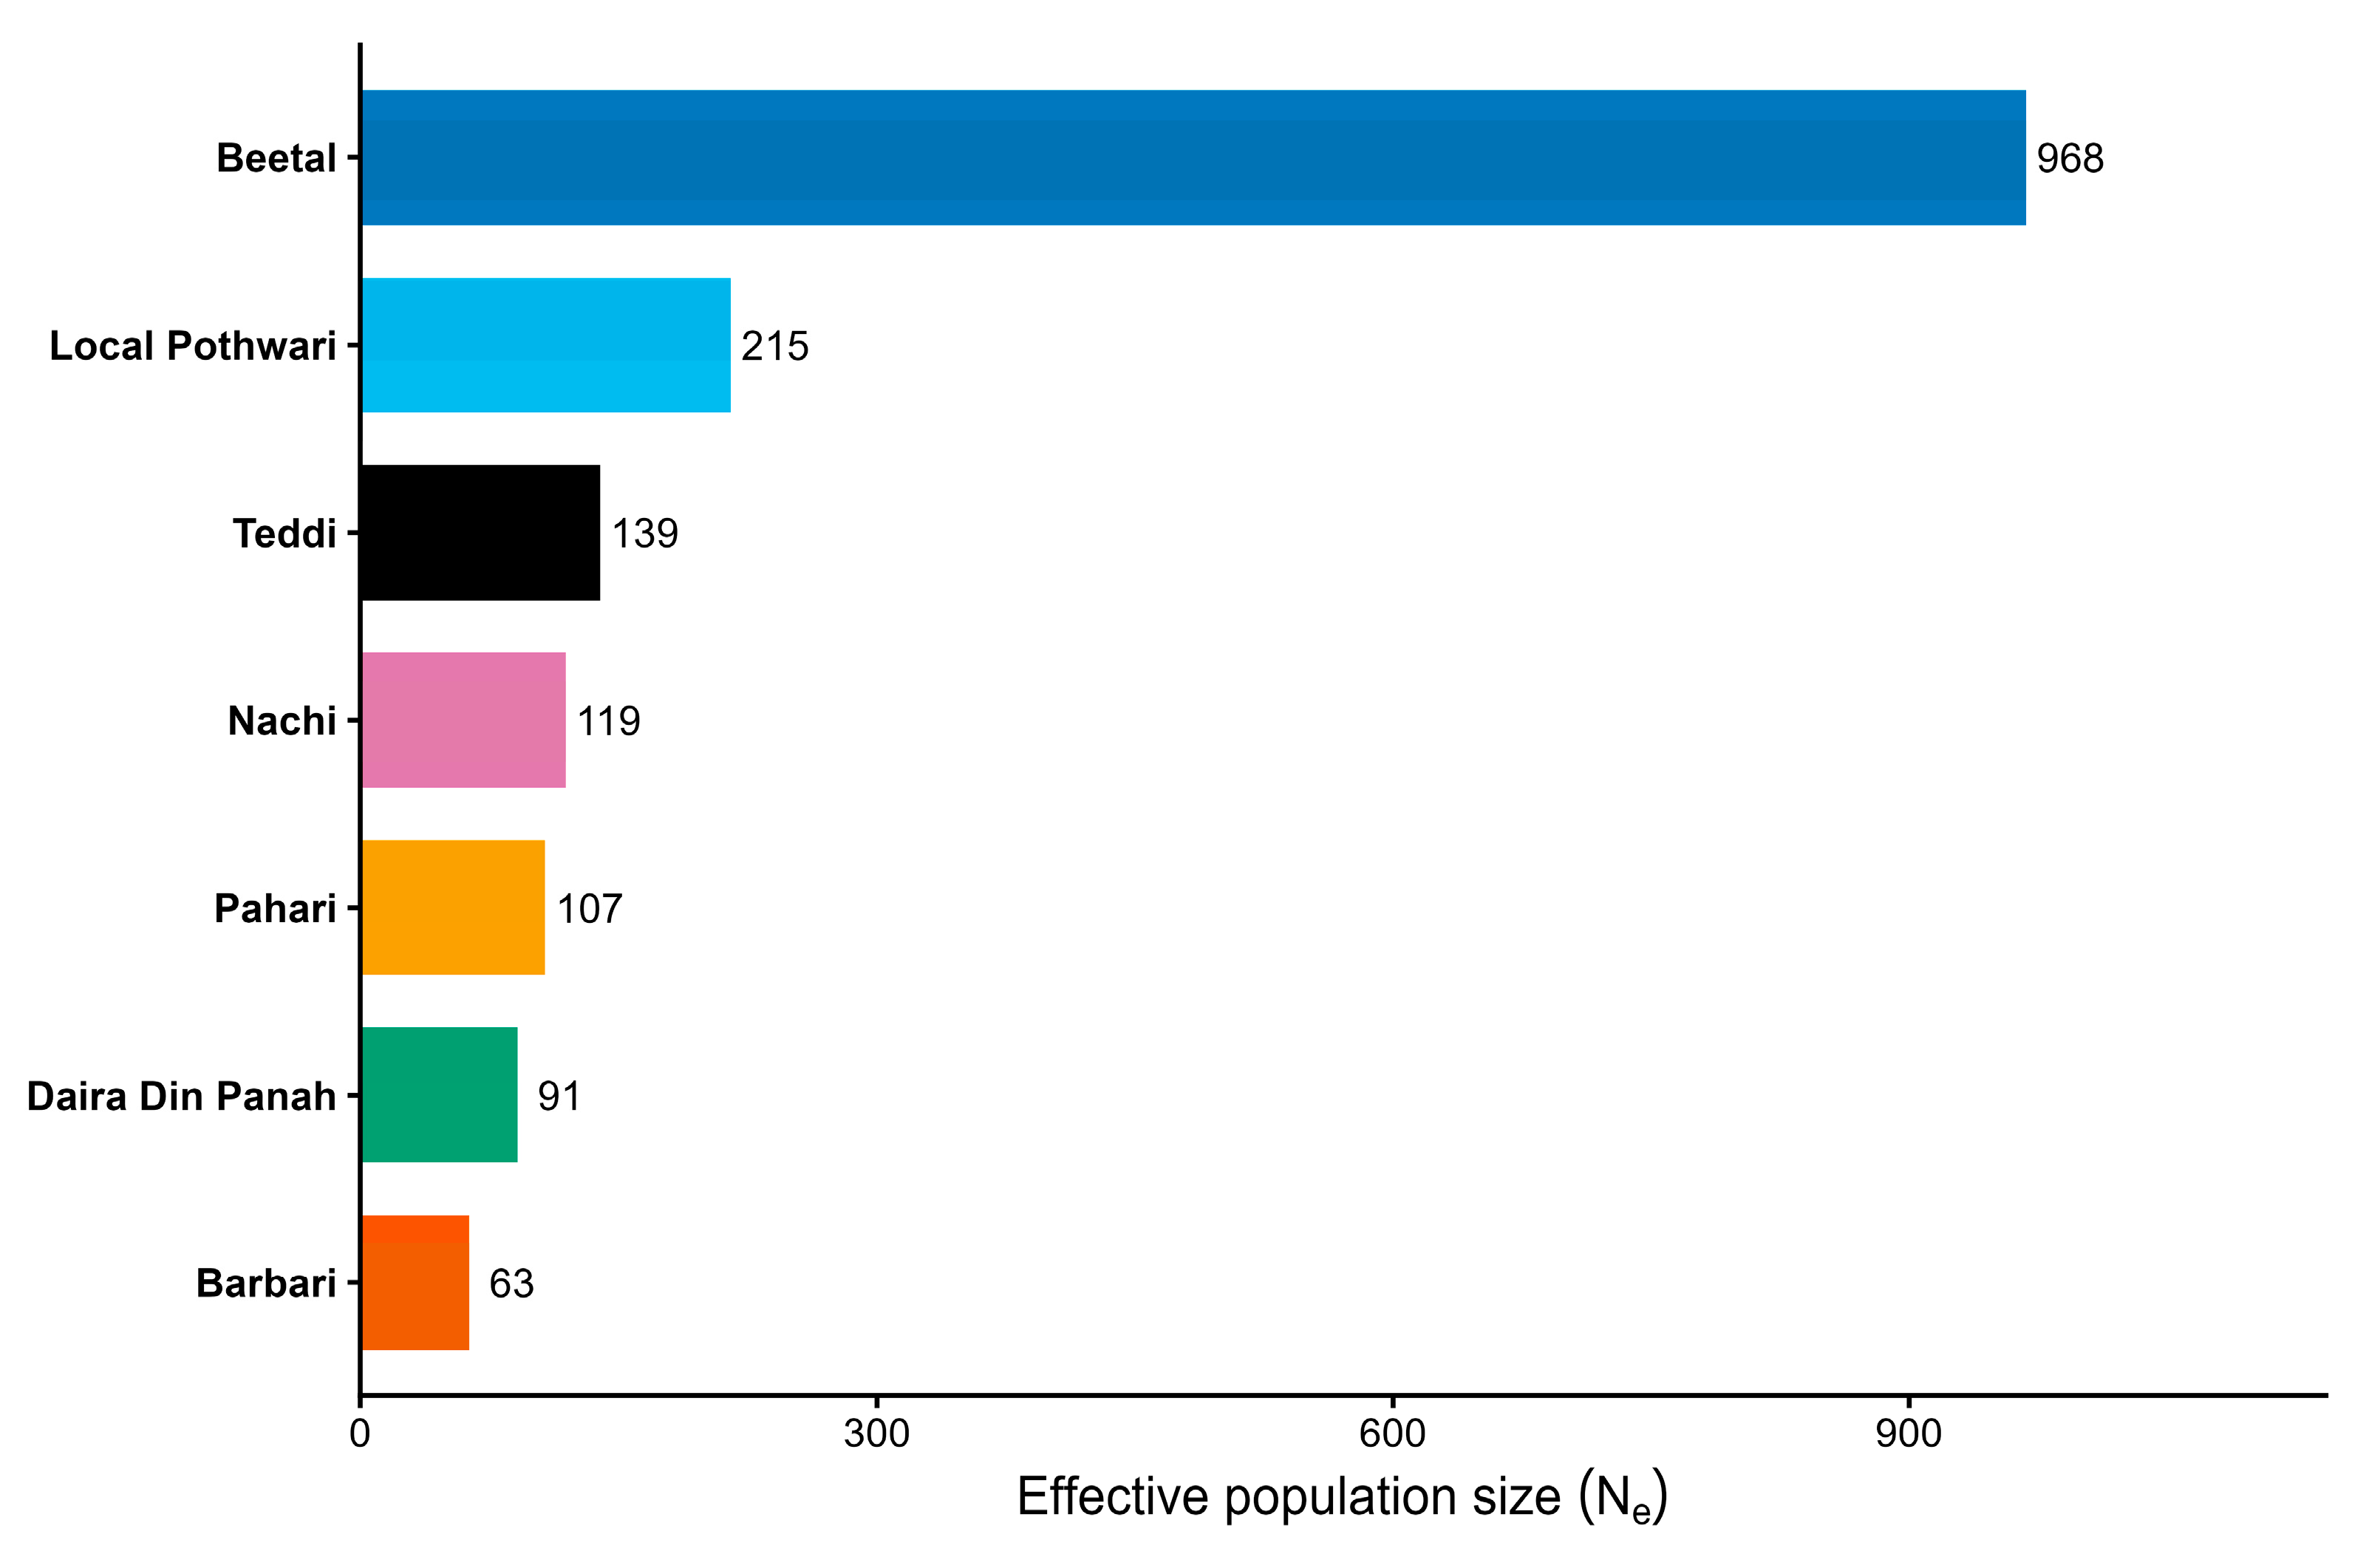
Figure 5.
Ancestral versus recent effective population size for each breed, illustrating the near-universal and severe contraction across all seven Punjab goat breeds.
Figure 5.
Ancestral versus recent effective population size for each breed, illustrating the near-universal and severe contraction across all seven Punjab goat breeds.
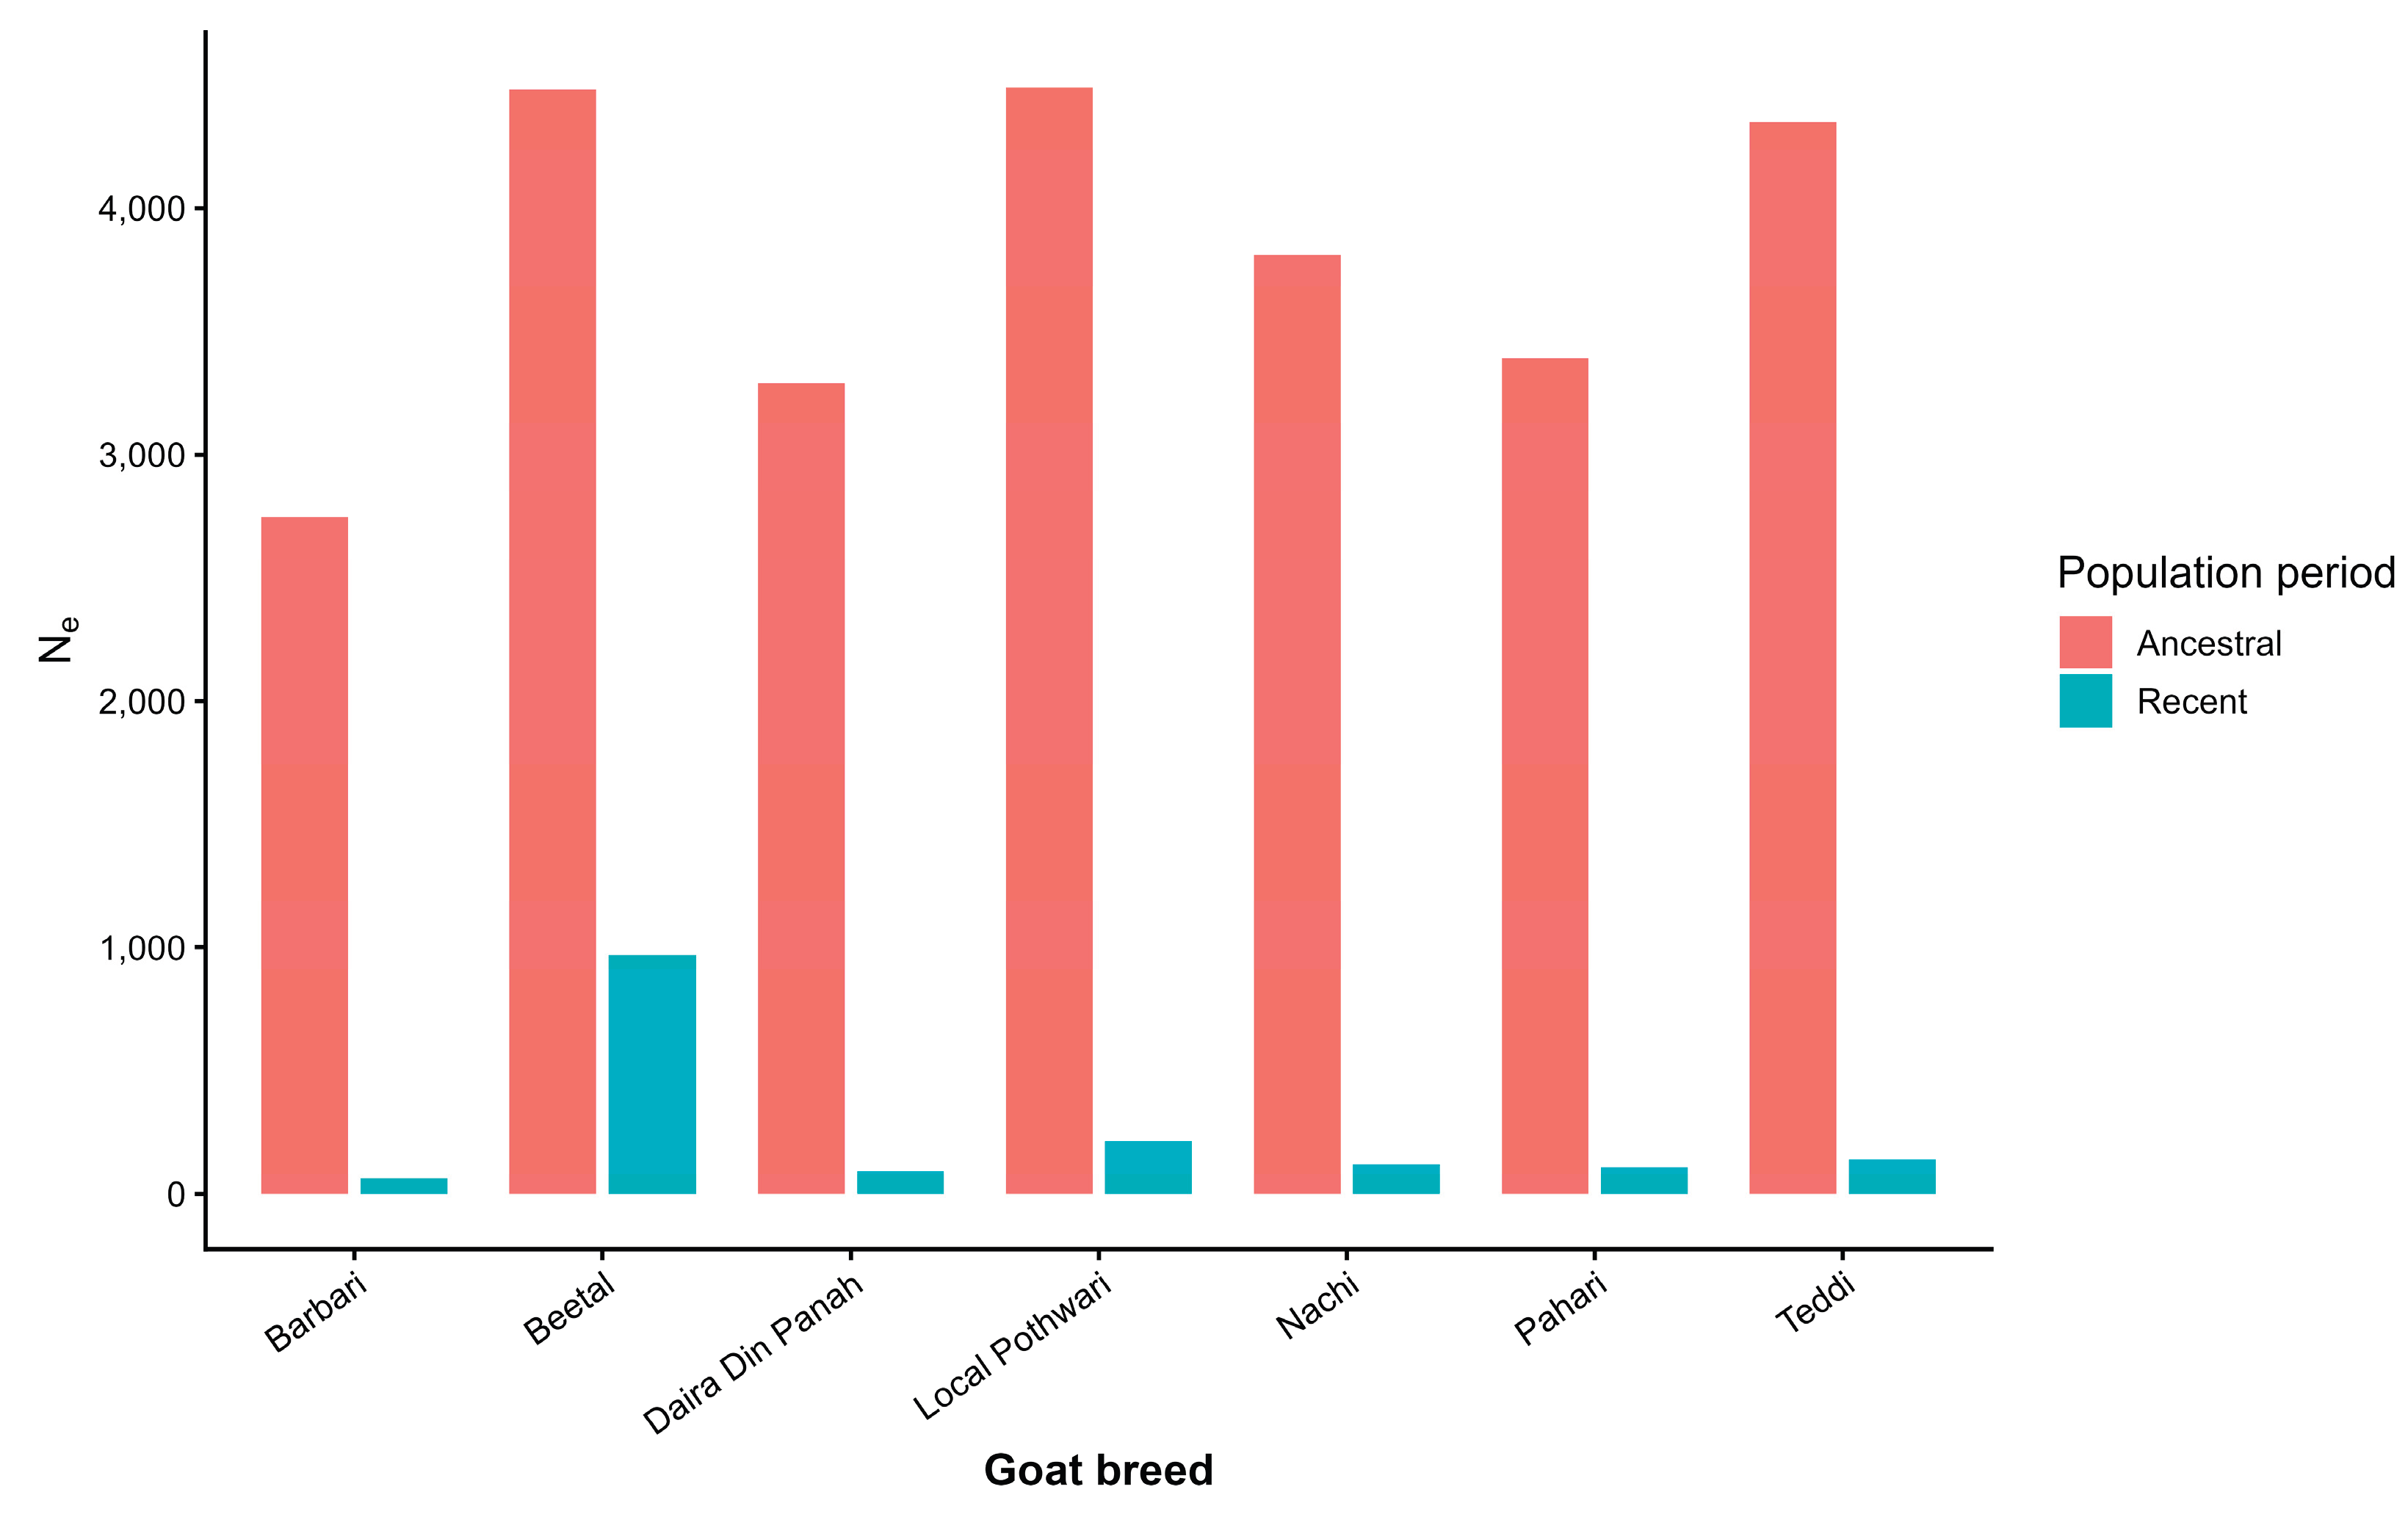

Table 1.
Sample sizes and post-quality-control SNP counts by breed.
| Breed | N (raw) | N (post-QC) | SNPs retained (post-QC) |
| Beetal | 594 | 588 | 40,013 |
| Teddi | 109 | 109 | 38,248 |
| Pahari | 41 | 40 | 38,428 |
| Local Pothwari | 16 | 16 | 35,504 |
| Daira Din Panah | 23 | 23 | 34,392 |
| Barbari | 23 | 23 | 32,296 |
| Nachi | 21 | 18 | 32,083 |
Values are unique unrelated animals; SNP counts reflect the goat 50 K Bead Chip (53,347 SNPs) after per-breed filtering for call rate and minor allele frequency ≥ 0.05.
Table 2.
Ancestral and recent effective population size, absolute and percentage change, and conservation-risk ranking by breed.
Table 2.
Ancestral and recent effective population size, absolute and percentage change, and conservation-risk ranking by breed.
| Breed | N | Ancestral Ne (~4,700–5,000 gen. ago) | Recent Ne (~11 gen. ago) | Change | % Change | Risk Rank |
| Beetal | 588 | 4,482 | 968 | −3,514 | −78.4% | 1 |
| Local Pothwari | 16 | 4,491 | 215 | −4,276 | −95.2% | 2 |
| Teddi | 109 | 4,348 | 139 | −4,209 | −96.8% | 3 |
| Nachi | 18 | 3,808 | 119 | −3,689 | −96.9% | 4 |
| Pahari | 40 | 3,392 | 107 | −3,285 | −96.8% | 5 |
| Daira Din Panah | 23 | 3,292 | 91 | −3,201 | −97.2% | 6 |
| Barbari | 23 | 2,748 | 63 | −2,685 | −97.7% | 7 |
Risk rank = 1 (largest, lowest-risk recent Ne) to 7 (smallest, highest-risk recent Ne). Ancestral Ne corresponds to the 0–20 kb distance class (deepest reconstructed time point); recent Ne corresponds to the 4,000–5,000 kb distance class.
Table 3.
Parameters used for the LD-based effective population size analysis.
| Parameter | Value |
| SNP missingness threshold (--geno) | 0.05 |
| Animal missingness threshold (--mind) | 0.05 |
| Minor allele frequency threshold | 0.05 |
| Maximum LD distance considered | 5,000 kb |
| Assumed recombination rate | 1 cM/Mb |
| LD statistic | r² |
| Sample-size correction | Adjusted r² = mean r² − 1/n |
| Ne equation | Ne = (1/r² − 1) / (4c) |
| Generations-ago equation | t = 1 / (2c) |
Disclaimer/Publisher’s Note: The statements, opinions and data contained in all publications are solely those of the individual author(s) and contributor(s) and not of MDPI and/or the editor(s). MDPI and/or the editor(s) disclaim responsibility for any injury to people or property resulting from any ideas, methods, instructions or products referred to in the content. |
© 2026 by the authors. Licensee MDPI, Basel, Switzerland. This article is an open access article distributed under the terms and conditions of the Creative Commons Attribution (CC BY) license (http://creativecommons.org/licenses/by/4.0/).
Copyright: This open access article is published under a Creative Commons CC BY 4.0 license, which permit the free download, distribution, and reuse, provided that the author and preprint are cited in any reuse.