

Submitted:
09 August 2026
Posted:
11 August 2026
You are already at the latest version
Abstract
One of the most important issues in ecological physiology and ichthyology is the study of the physiological and biochemical mechanisms underlying fish adaptation to changing environmental conditions. This issue is of particular significance in the context of increasing anthropogenic pressure on freshwater ecosystems. Understanding the ecological and physiological aspects of adaptation within the framework of integrated population studies is essential for developing a scientific basis for predicting the biological status of fish. Addressing this problem requires systematic investigations of the dynamics of homeostatic parameters in functional body systems, taking into account their sex-, age-, and season-related variability. In the present study, seasonal investigations were conducted to determine the hematological characteristics of taxonomically closely related bony fish species that differ in physiological activity, feeding habits, and ecology, sampled from the Aleksandar Stamboliyski Reservoir in Bulgaria. The physicochemical parameters of the water—temperature, pH, electrical conductivity, and dissolved oxygen—were within the allowable values by national and EU legislation. However, the water analyses revealed elevated concentrations of nitrate nitrogen (N–NO₃⁻) and nitrite nitrogen (N–NO₂⁻) compared to the permissible values for moderate ecological status under Regulation No. H-4. Furthermore, the concentrations of toxic metals in the water—chromium (Cr), cobalt (Co), lead (Pb), and zinc (Zn)—were also within the limits. However, the cadmium (Cd) levels were reported as <0.02 mg/L (20 µg/L), exceeding the permissible value of 5 µg/L. Seasonal dynamics and species-specific patterns were observed in hematological parameters. The erythrocyte indices in the three fish species – common carp (Cyprinus carpio Linnaeus, 1758), Prussian carp (Carassius gibelio Bloch, 1782) and European perch (Perca fluviatilis Linnaeus, 1758) showed similar values during spring and winter; the highest values were recorded in common carp during summer and the lowest in Prussian carp during summer. The hemoglobin and hematocrit values were highest during winter for all three species, with the highest levels observed in common carp, followed by European perch and Prussian carp. Morphological alterations were also identified in the studied species - in common carp, changes were observed in erythrocyte nuclei; in Prussian carp, a high number of dividing erythrocytes was recorded; in European perch, the observed changes included the presence of rounded erythrocytes.
Keywords:
fish
; seasons
; hematology
; reservoir
1. Introduction
Considering that fish are highly sensitive to environmental changes and pollutants, they can serve as effective biological indicators of aquatic quality (Yu et al., 2019; Lee et al., 2023)
Blood is part of the internal environment of the organism, whose relative constancy and controlled variability within certain limits ensure optimal physicochemical conditions for the functioning of every cell (Dobrev et al., 1969). Blood is also the first entry point for various anthropogenic pollutants through the gills and intestinal epithelial cells of fish, thereby affecting hematological characteristics, which are important indicators for evaluating cytotoxicity, environmental stress, and the health status of fish (Hamed et al., 2021; Jo et al., 2025). Furthermore, erythrocytes are among the formed elements of blood. Their number in peripheral circulation depends on multiple factors, including fish activity, water temperature, dissolved oxygen concentration, and other environmental variables, and it exhibits pronounced seasonal variability. In addition, erythrocyte counts are influenced by age, sex, nutritional status, and reproductive condition, and may also vary among populations of the same species (Arnaudov & Arnaudova, 2023). The erythrocyte contains approximately 60% water and 40% dry matter, of which hemoglobin (Hb) is the most important component, accounting for about 90% of the dry mass (Tomov et al., 1998). Moreover, hemoglobin in vertebrates is an iron-containing complex protein located in red blood cells, responsible for oxygen transport throughout the body and for carrying carbon dioxide to the respiratory organs (Dimitrova, 2022). Nearly all vertebrates require a specialized oxygen transport system because molecular oxygen is poorly soluble in water: only 3.2 ml O₂ dissolves in 1 liter of blood plasma. Thus, hemoglobin (Hb) can bind approximately 70 times more oxygen, reaching up to 220 ml O₂ per liter. Fish are frequently exposed to spatial and temporal fluctuations in oxygen availability and have therefore evolved anatomical, physiological, and biochemical strategies to adapt to changing environmental conditions (de Souza & Bonilla-Rodriguez, 2007). Aerobic metabolism and the fulfillment of oxygen demand in fish are possible due to proteins, such as hemoglobin, which facilitate the transport of large amounts of oxygen to tissues, where it serves as the final electron acceptor (Giardina et al., 2004). Hemoglobin function appears to be adapted to the varying metabolic demands of fish and to continuous environmental changes (Riggs, 1976; Landini et al., 2002). Hematological parameters are affected by the animal's diet, environmental stress, or toxic substances. Hematological parameters can be used as reliable indicators of physiological changes (Çiçek andÖzoğul, 2021). According to Burgos Aceves et al. (2019), hematological indices serve as valuable prognostic and diagnostic tools for assessing the physiological well-being of fish. What is more, hematological studies of fish species in the marine sector are deemed to be an effective tool for predicting the host-environment relationship and subsequent migration of pollution onto higher predators up to top consumers (Fazio, 2019; Chen and Luo, 2023; Patra et al., 2024)
That is why, with the present study, we aimed to conduct seasonal assessments of hematological parameters of the red blood profile in three freshwater fish species—common carp (Cyprinus carpio Linnaeus, 1758), Prussian carp, and European perch (Perca fluviatilis L.)—inhabiting the Aleksandar Stamboliyski Reservoir (Bulgaria), in relation to key physicochemical characteristics of the aquatic environment. The hematological parameters included erythrocyte count (RBC, /L), hemoglobin concentration (Hb, g/dL), and hematocrit (PCV, %), as well as microscopic characterization of erythrocyte morphology. The water parameters included temperature, pH, dissolved oxygen concentration, electrical conductivity, and biochemical oxygen demand (BOD₅), as well as measured levels of pollutants, such as nitrates, nitrites, total phosphorus, orthophosphates, Kjeldahl nitrogen, cadmium (Cd), chromium (Cr), cobalt (Co), lead (Pb), and zinc (Zn).
2. Materials and Methods
2.1. Study Area and Water Sampling
The study was conducted in the area of the Aleksandar Stamboliyski Reservoir (site code VTR-17208-1064, Executive Agency for Metrological and Technical Supervision, Bulgaria; BG1YN400L009; river basin code BG1000; EURBDCode BG1YN), located at coordinates 43°07′34.39″ N, 25°10′15.05″. The Aleksandar Stamboliyski Reservoir belongs to the Danube River Basin Directorate and is situated along the middle course of the Rositsa River, a tributary of the Yantra River. It collects water from the upper part of the Rositsa catchment, including inflows from the Krapets, Magara, and Karakaynak rivers. The catchment area upstream of the dam is approximately 1478 km² (Nabatov et al., 2011). The reservoir is the largest in the Rositsa River basin. It was constructed on the Rositsa River and commissioned in 1953. The nearest settlement is the village of Gorsko Kosovo. The dam is a stone masonry structure with a reinforced concrete facing, with a height of 66 m and a crest length of 300 m. The total storage capacity is m³, including a dead storage of m³ and a useful storage of m³. The elevation at maximum water level is 190 m above sea level. The maximum surface area of the reservoir is 10.86 km², and the total catchment area is 1478 km². Downstream of the reservoir is the Rositsa-1 hydropower plant, with an installed capacity of 7.5 MW and a maximum discharge of , through which all released waters pass. Further along the irrigation canals are the Rositsa-2 and Rositsa-3 hydropower plants, with installed capacities of 3 MW (Qmax = ) and 0.28 MW (Qmax = ), respectively. The reservoir supplies water to the Rositsa irrigation system, which covers a maximum area of approximately 27.000 ha (Santurdzhiyan & Trenkova, 2019).
The study covered the period from 2022 (based on data from the Danube River Basin Directorate, Bulgaria) through 2023 (own experimental investigations) and continued until February 2024. Water samples for physicochemical analysis (temperature, pH, and electrical conductivity) were measured in situ at five different sampling sites within the Aleksandar Stamboliyski Reservoir across the four seasons: spring (March–May), summer (June–August), autumn (September–November), and winter (December–February), using a combined pH meter (HANNA Instruments Combo HI98130, Smithfield, Rhode Island, USA).
2.2. Water Chemical Analyses
Water samples for chemical analysis were collected near the dam wall (GPS coordinates: 43°07′34.39″ N, 25°10′15.05″ E), in accordance with Directive 2008/105/EC and the Bulgarian Regulation on environmental quality standards for priority substances and other pollutants. The analytical results were expressed as mean values based on 10 samples collected from five different sampling points. Samples were collected in clean, labeled polyethylene containers, transported on the same day, and stored at an appropriate temperature of 5°C until processing at the University Laboratory Research Center (ULRC – Plovdiv). The analyses of water pollutants (nitrates, nitrate nitrogen, nitrites, nitrite nitrogen, total phosphorus, orthophosphates, Kjeldahl nitrogen, Cr, Cd, Co, Pb, and Zn ) were performed in accordance with EU requirements for testing and calibration competence. All analyses were conducted in an accredited laboratory complex at the University Laboratory Research Center (ULRC – Plovdiv) using validated laboratory methods (VLM), in compliance with the following standards: BDS ISO 7890-3:1998, BDS EN 26777:1997, BDS EN ISO 6878:2005, BDS EN 1899-2:2004, BDS EN 25663:2002, BDS EN ISO 11885:2009, and BDS EN 25813:2004. Measurement uncertainty was expressed as expanded uncertainty, calculated as the standard measurement uncertainty multiplied by a coverage factor , corresponding to a confidence level of approximately 95% under normal distribution conditions.
2.3. Fish Sampling and Hematological Analyses
Common carp is considered one of the earliest domesticated fish species (Nakajima et al., 2019) and remains among the five most produced fish species in aquaculture worldwide (FAO, 2024). It is farmed throughout its native range, with production concentrated primarily in Eastern Europe and far Eastern countries. Common carp is also among the most important freshwater aquaculture species worldwide, valued for its adaptability and resilience across diverse aquatic environments (Ferrara et al., 2025). It is widely farmed and plays an important role in local economies and food security, with global production reaching about 5.1 million metric tons per year (Banaee et al., 2022). Common carp is also capable of bioconcentrating and bioaccumulating pollutants from water and sediments, which makes it a suitable sentinel organism. Its sensitivity, resilience to pollutants, and ease of laboratory maintenance have led to its frequent use as a bioindicator in toxicity testing and risk assessment (Fent et al., 2006).
Prussian carp is an important freshwater aquaculture species in China, recognized for its rapid growth, resilience to stress, and nutritional value. Production exceeded 2.70 million tons in 2021, corresponding to an economic value of about USD 5 billion (Qiao et al., 2023). Owing to its sensitivity to environmental pollutants, the species is also widely employed in ecotoxicology studies (Li et al., 2020).
One fish species that is increasingly recognized as a promising candidate for the diversification of freshwater aquaculture is the European perch (Gebauer et al., 2025). Eurostat (2024) reported that 2022 marked the first recorded EU-level production of freshwater percid aquaculture, represented by pike-perch (Sander lucioperca Linnaeus, 1758) and European perch, with a combined output of 2.75 t live weight worth about EUR 30.000. Perch also plays a key role in shaping ecosystems (Donadi et al., 2017) by exerting top-down ecological controls on food webs (Eriksson et al., 2009; Sieben et al., 2011) and suppressing populations of invasive fish species (Liversage et al., 2017). In addition, in Sweden and Finland, the European perch is a primary sentinel species used by national environmental monitoring programs to measure aquatic toxicity, mercury (Hg) bioaccumulation, and "forever chemical" contamination (Rask et al., 2021)
The mean biometric characteristics were as follows: common carp —mean length cm and mean weight g (SD: 1.2658–17.7763; SE: 0.4003–5.6213); Prussian carp—mean length cm and mean weight g (SD: 0.8117–10.1788; SE: 0.2566–3.2188); European perch—mean length cm and mean weight g (SD: 0.6315–3.7063; SE: 0.1997–1.1720). For each species, 10 individuals per season were collected from the reservoir for analysis. To ensure comparability, fish of similar age and size groups were selected. Sampling was conducted in accordance with the Bulgarian Fisheries and Aquaculture Act (Annex No. 2, Art. 38, para. 1). Following measurement of total length and body weight, blood sampling was performed immediately after capture from visibly healthy and uninjured fish to avoid alterations in hematological parameters. Blood was collected once per individual from the caudal vein. To prevent coagulation, EDTA was used at a final concentration of 0.5%. Blood smears were prepared immediately after sampling. After blood collection, fish were released back into the reservoir. Collected blood samples were subjected to hematological analysis immediately after capture. The hematological profile was determined following established methodologies applied in fish and veterinary hematology (Faggio et al., 2013; Fazio et al., 2019), as well as classical methods described by Dobrev et al. (1969) and Ibrishimov and Lalov (1984). For erythrocyte counts (RBC), blood samples were appropriately diluted. Counts were performed in duplicate for each sample using a Bürker counting chamber. The chamber, thoroughly cleaned and dried, was fitted with a coverslip and placed under a microscope. After discarding the first drops from the pipette, a small volume of diluted blood was introduced at the edge of the coverslip, allowing capillary action to fill the chamber. Care was taken to avoid air bubble formation. After allowing 2–3 minutes for cell sedimentation, erythrocytes were counted under uniform distribution conditions. According to the Bürker method (dilution 1:200), erythrocytes were counted in 80 small squares (excluding the 81st square of the ninth large square). Counting was performed in both chambers, and the mean value was used
where: is the number of erythrocytes per mm³, is the total number of counted erythrocytes in 80 small squares.
Morphometric analyses of erythrocytes were performed on blood smears stained using a rapid staining kit (DKK “Color 200”, VIVA-MT). Blood samples for hemoglobin determination were stored in VACUETTE® tubes (3 mL, 3.2% sodium citrate (Na₃C₆H₅O₇)). Hemoglobin concentration was measured using an EKF Diagnostics Hemo Control analyzer, based on direct photometric determination. Blood smears were examined under 40× and 100× objectives using Olympus CX22LEDRFS1 and Leica DM 500 microscopes. Microphotographs were obtained using a Samsung Galaxy A21s (48 MP) camera. The following hematological parameters were determined: erythrocyte count (RBC); hemoglobin concentration (Hb); hematocrit (PCV). Additionally, microscopic characterization of erythrocyte morphology was performed.
2.4. Statistical Analyses
Statistical analyses were conducted using ANOVA and Tukey’s HSD test in R (Statistical Computing). Calculations were also performed using Microsoft Excel. A significance level of p < 0.05 was used in all analyses. The following statistical parameters were used: : individual value; : sample mean; : sample standard deviation; : standard deviation; : sample size; : expected (mean) value. The percentage of altered blood cells was calculated as:
where: is the percentage of altered cells, is the number of altered cells, is the total number of cells counted. Experimental data are presented as mean values () for all examined individuals. All blood samples were analyzed in duplicate from the same specimen to ensure the reliability of the results.
3. Results and Discussion
3.1. Water Quality Assessment
During the study period, abiotic environmental factors were regularly monitored in the study area, and the physicochemical parameters of the water were recorded. The water temperature values for the Aleksandar Stamboliyski Reservoir are presented in Table 1.
The recorded temperature values showed the following patterns: the mean temperatures in March, April, and May were 6.80°C, 11.80°C, and 18.60°C, respectively. The mean temperature in June was 20.30°C, followed by 22.0°C in July and 22.90°C in August. In September, the average recorded temperature was 22.53°C, decreasing to 20.10°C in October, and a sharp decline to 12.0°C was observed in November. During the winter season, temperatures decreased further to approximately 4°C; the mean values were 7.37°C in December, 5.15°C in January, and 5.20°C in February. The minimum and maximum recorded water temperatures in the Aleksandar Stamboliyski Reservoir during the study period ranged as follows: March–May, 6–21°C; June–August, 19–25°C; September–November, 12–24°C; and December–February, 4–15.7°C. Increasing temperature increases metabolic rate and oxygen consumption. When the temperature deviates above or below optimal limits, organisms slow down and may eventually cease vital functions. The thermal optimum for most fish species, such as salmon, sturgeon, perch, and carp, lies within the ranges of 13–18°C, 20–24°C, 22–28°C, and 24–30°C, respectively. The upper limits of vital activity for these species are approximately 23–28°C, 31–35°C, 32–37°C, and 34–41°C, respectively (Golovanov, 2013 a,b).
The values of the active reaction (pH) of the water in the Aleksandar Stamboliyski Reservoir measured during the study period are presented in Table 2.
The results showed that the mean pH values were 7.51 in March, 7.77 in April, and 7.71 in May. In June, July, and August, the mean values were 7.94, 8.02, and 7.99, respectively. In September, the mean pH was 7.91, increasing to 8.08 in October and 8.32 in November. During the winter season, higher pH values were recorded, with mean values of 8.89 in December, 8.43 in January, and 8.02 in February. The minimum and maximum recorded pH values ranged as follows: March–May, 7.2–8.0; June–August, 7.0–8.5; September–November, 7.5–8.5; and December–February, 7.9–8.7. Higher pH values were generally observed during the winter season. pH is of critical importance for fish adaptation to changing environmental conditions (Marcon & Filho, 1999).
The electrical conductivity of the water in the Aleksandar Stamboliyski Reservoir measured during the study period is presented in Table 3.
The mean conductivity values were 307.9 μS/cm in March, 311.9 μS/cm in April, and 306.1 μS/cm in May. In June, July, and August, the values were 310.4 μS/cm, 308.6 μS/cm, and 327.8 μS/cm, respectively. In September, October, and November, the mean values were 318.5 μS/cm, 319.3 μS/cm, and 330.0 μS/cm, respectively. An increase in conductivity was observed during the winter season, with mean values of 345.6 μS/cm in December, 336.5 μS/cm in January, and 330.7 μS/cm in February. The minimum and maximum recorded conductivity values ranged as follows: March–May, 302–315 μS/cm; June–August, 308–330 μS/cm; September–November, 315–335 μS/cm; and December–February, 320–348 μS/cm. According to Regulation H-4, conductivity values below 650 μS/cm are classified as excellent.
Data from physicochemical monitoring of the waters of the Aleksandar Stamboliyski Reservoir, based on a report by the Danube River Basin Directorate under the Ministry of Environment and Water of Bulgaria (request No. 01-69/2024), including BOD₅ and dissolved oxygen concentrations in surface waters, are presented in Table 4.
The monitoring results indicated that dissolved oxygen levels were within the legal thresholds and classified as excellent. For BOD₅, values exceeding 2.5 mg/L indicated a moderate ecological status during the winter period of 2024 (7.83 ± 0.34), according to Regulation H-4 (Table 5).
It has been established that under hypoxic conditions, many Amazonian fish obtain oxygen directly from the air due to anatomical modifications, including changes in the gills, mouth, stomach, and intestines (Val, 1996; de Oliveira et al., 2001). Species lacking this ability rely on alternative physiological mechanisms, such as increased ventilation rate and volume, elevated heart rate, increased erythrocyte counts, higher hematocrit and hemoglobin concentrations, changes in organic phosphate levels, the presence of hemoglobin isoforms with different functional properties, and metabolic depression (Val, 1996). In some cases, fish may acclimate to hypoxia. According to Pan et al. (2017), acclimation to hypoxia is not associated with changes in gill morphology, hematocrit, or relative ventricular mass. Their findings support the hypothesis that switching hemoglobin isoforms may provide a physiological advantage in coping with environmental stress. Some Cyprinids, such as Goldfish (Carassius auratus Linnaeus, 1758), are capable of tolerating low oxygen levels, temperature fluctuations, and high levels of anthropogenic pollution; therefore, they are frequently used as model or control species in laboratory studies (Fan et al., 2013; Maisano et al., 2013; Zhelev et al., 2016).
The analyses of water quality for orthophosphate, nitrate nitrogen (N–NO₃⁻), and nitrite nitrogen (N–NO₂⁻) are presented in Table 6 and compared according to Regulation H-4 (Table 7).
Laboratory analyses revealed elevated concentrations of nitrate nitrogen (N–NO₃⁻) and nitrite nitrogen (N–NO₂⁻) in the waters of the Aleksandar Stamboliyski Reservoir. The levels of nitrates and nitrites in water are of critical importance for maintaining good ecological status and the health of aquatic biota. Nitrites negatively affect the chemical and hydrobiological characteristics of water, ultimately impacting aquatic organisms. For example, sodium nitrite at initial concentrations of 0.25 mg/L has been shown to reduce dissolved oxygen levels in water (Kokuricheva, 1982). Furthermore, low oxygen levels or oxygen depletion may alter the balance between nitrification and denitrification processes within the ecosystem (Dolomatov et al., 2016). The primary toxic effect of nitrates on aquatic animals is associated with the conversion of oxygen-carrying pigments (hemoglobin, hemocyanin) into forms incapable of transporting oxygen (methemoglobin) (Grabda et al., 1974; Conrad, 1990; Scott & Crunkilton, 2000; Cheng & Chen, 2002). Absorbed nitrite reacts with hemoglobin to form methemoglobin, which in adult organisms is rapidly reduced back to oxyhemoglobin by enzymatic systems such as NADH-dependent methemoglobin reductase. In aquaculture systems, toxic concentrations of nitrites may arise due to high stocking densities and intensive feeding practices. In natural water bodies, elevated nitrite levels are typically associated with wastewater contamination. Prolonged exposure to nitrites induces oxidative stress in fish (Tucker et al., 1989). A relevant example is the exceedance of permissible limits for nitrogen (ammonium and nitrite), total phosphorus, and orthophosphates by 6- to 20-fold in water samples from the Cherna River (Smolyan), collected following a fish mortality event involving approximately 160 kg of fish on August 20, 2023. These data were reported by the Basin Directorate – Plovdiv (Chernokova, 2023).
Analyses of toxic metal concentrations in the waters of the Aleksandar Stamboliyski Reservoir are presented in Table 8 and compared with the maximum permissible concentrations (MPCs) set by Directive (EU) 2020/2184 and Directive (EU) 2008/105. The measured concentrations of toxic metals were within permissible limits according to both European Directives and Bulgarian legislation.
Regarding Pb, the World Health Organization recommends maintaining the current parametric value while emphasizing that concentrations should be reduced as much as reasonably achievable. Accordingly, the value of 10 μg/L should be maintained for 15 years following the entry into force of Directive (EU) 2020/2184, after which it should be reduced to 5 μg/L. Due to the continued presence of Pb pipes in buildings and the limited authority of Member States to enforce their replacement, the 5 μg/L threshold remains a target value for domestic distribution systems. However, for all new materials in contact with drinking water, a limit of 5 μg/L should be applied (Directive (EU) 2020/2184). The chemical analyses indicated Cd concentrations of <0.02 mg/L (20 μg/L), compared to a reference value of 5 μg/L. Cd is classified as a priority hazardous substance under Directive 2000/60/EC. The environmental quality standards for cadmium and its compounds (No. 6) vary depending on water hardness, categorized into five classes: class 1: <40 mg CaCO₃/L; class 2: 40 to <50 mg CaCO₃/L; class 3: 50 to <100 mg CaCO₃/L; class 4: 100 to <200 mg CaCO₃/L; and class 5: ≥200 mg CaCO₃/L. Contamination of aquatic ecosystems with toxic metals can lead to reductions in key hematological parameters in fish, most commonly hemoglobin (Hb), erythrocyte count (RBC), and packed cell volume (PCV), and in some cases mean corpuscular volume (MCV), mean corpuscular hemoglobin (MCH), and mean corpuscular hemoglobin concentration (MCHC). For example, exposure to Cr and copper (Cu) has been associated with increased MCV, while Cd exposure affects MCH (Witeska, 2008). For accurate interpretation of results, it is essential to consider a range of variables, including reproductive cycle, age, sex, feeding behavior, stress, nutritional status, water quality, and species habitat, as poikilothermic organisms are strongly influenced by environmental changes (Burgos-Aceves et al., 2019).
3.2. Hematological Assessment
The hematological parameters of the red blood profile of the studied fish species are presented in Table 9
The results of hematological analyses in fish depend on numerous intrinsic and extrinsic factors, including stress levels (Carbajal et al., 2019), blood sampling methods (Bojarski et al., 2018), pre-analytical factors such as anticoagulant use (Walencik & Witeska, 2007), blood storage temperature and duration (Faggio et al., 2013; 2014; Witeska et al., 2017a), and analytical procedures, including the type of diluent (Ługowska et al., 2017) and accuracy of blood cell classification.
The results obtained for erythrocyte counts in specimens inhabiting the Aleksandar Stamboliyski Reservoir follow this order: spring – common carp > Prussian carp > European perch; summer – common carp > European perch > Prussian carp; autumn – common carp > European perch > Prussian carp; winter – Prussian carp > common carp > European perch. The highest erythrocyte counts were recorded in common carp during spring, summer, and autumn, whereas in winter the highest values were observed in Prussian carp. During spring and winter, values for all three species were relatively similar. In most fish species, erythrocytes are oval, nucleated, and larger than those of mammals (Tocidlowski et al., 1997). Their number typically ranges from 0.8 × 10⁶ to 3.5 × 10⁶/mm³, while leukocyte counts vary between 20.000 and 50.000/mm³, reaching up to 100.000/mm³ in some species (Junqueira & Carneiro, 1991). Erythropoiesis in vertebrate fish occurs primarily in the kidneys, with or without spleen involvement (Glomski et al., 1992). Generally, erythrocyte counts range from 0.5–1.5 × 10⁶/mm³ in less active species to 3.0–4.2 × 10⁶/mm³ in more active species (Witeska, 2008). What is more, fish erythrocytes are sensitive to environmental pollution, and their morphological evaluation can serve as a bioindicator of toxicity (Witeska, 2008).
The observed pattern across all seasons was: common carp > European perch > Prussian carp. The highest hemoglobin concentrations for all three species were recorded during winter. Hemoglobin levels are influenced by sex, age, season, and environmental conditions (Glomski et al., 1992). Additionally, hemoglobin oxygen affinity varies seasonally, with lower affinity in summer and higher affinity in winter (Almeida-Val & Val, 1992). Similar seasonal variation has been reported in Hoplosternum littorale (Hancock, 1828) (Affonso, 1990). Variations in hemoglobin patterns related to temperature acclimation have also been observed in Goldfish, supporting the hypothesis of polymorphism as an adaptive mechanism (Houston & Cyr, 1974).
Hematocrit values followed the pattern: common carp > European perch > Prussian carp across all seasons.
Hematological parameters are highly sensitive to environmental factors, including nutrition, water quality, stress, and pathogens. Peripheral blood tests include measurements of various erythrocyte and leukocyte indices and are often complemented by biochemical analyses (Witeska et al., 2022). Hematocrit values are strongly associated with the biological activity level of fish. Highly active species, such as tuna and other pelagic fish, typically exhibit higher hematocrit values than benthic species such as flatfish. Therefore, hematological parameters are relative, and clear distinctions between normal and abnormal values are often difficult to define (Lusková, 1997).
The morphological characteristics of common carp, Prussian carp, and European perch are illustrated in Figure 1, Figure 2 and Figure 3.
Fish erythrocytes are nucleated and typically exhibit a slightly elliptical shape. Alongside normal erythrocytes, cells with altered morphology were observed, including changes in both cell shape and nuclear structure. In common carp, erythrocytes with nuclear alterations were identified in addition to normal cells (Figure 1). Normal erythrocytes displayed an elliptical, centrally located nucleus surrounded by homogeneous cytoplasm (Figure 1). In Prussian carp, microscopic examination revealed a considerable number of dividing cells, particularly during winter (Figure 2). This may be related to physiological preparation for the reproductive period in spring, especially as all examined individuals were female. Alternatively, the higher pH values and elevated nitrate and nitrite concentrations recorded during winter suggest that changes in physicochemical parameters and the presence of pollutants may also contribute. In European perch, rounded erythrocytes and micronuclei were observed (Figure 3).
Rounded erythrocytes may represent immature cells, as immature forms are more commonly found in fish blood compared to mammals. According to Cavas et al. (2005), the frequency of micronuclei and binucleated cells increases significantly in fish inhabiting freshwater environments contaminated with low concentrations of copper. Hematopoietic organs in fish are primarily located in the intratubular tissues of the kidneys. In trout, the spleen is also active; in roach, only the kidney is active; whereas in perch, hematopoiesis occurs mainly in the spleen (Catton, 1951). Similar morphological alterations in erythrocytes of freshwater fish exposed to metal mixtures have been reported by other authors, who consider such changes to be sensitive indicators of toxic metal intoxication (Witeska, 2004). At low concentrations, fish may gradually adapt to metal exposure. The effects of toxic metals on hematological parameters depend on both concentration and exposure duration. In such cases, primarily morphological changes are observed, including an increased proportion of aged and disintegrated cells and amitotic erythrocytes. In contrast, erythrocyte counts, hemoglobin concentration, and hematocrit values may remain within normal ranges (Vosylienė & Svecevičius, 1997). Hematological parameters are of fundamental importance for fish physiology, as their alteration serves as an indicator of functional imbalance or pathological conditions. These parameters may vary due to changes in feeding and reproductive status, stress, toxic exposure, infectious diseases, and the influence of abiotic environmental factors (Zhiteneva et al., 1989).
The results of statistical analyses using ANOVA and Tukey’s HSD test are presented in Table 10, Table 11, Table 12, Table 13 and Table 14 and Figure 4, Figure 5, Figure 6, Figure 7, Figure 8, Figure 9, Figure 10, Figure 11 and Figure 12. The one-way ANOVA on the hematological data for Prussian carp suggested that the season of capture significantly affected all examined parameters except MCHC: RBC, Hb, PCV, MCV, and MCH (parameters with statistically valid differences in mean values between at least two seasons). A Tukey HSD test was applied to evaluate between-group differences in the examined hematological parameters. In Prussian carp, RBC and PCV were significantly higher in spring and winter than in summer and autumn. Hb was lower in the summer compared to both the spring and the winter. Both MCV and MCH were lower in the spring compared to the autumn, while MCV alone was significantly lower in the winter than in the autumn (Table 1). The one-way ANOVA on the hematological parameters for European revealed significant between-season differences in mean values for RBC, Hb, PCV, MCH, and MCHC but not for MCV (Table 2). The post-hoc comparison (Tukey HSD test) revealed that RBC was significantly lower in the autumn than in any other season. Hb was significantly higher in the winter than in summer and autumn, while PCV was higher in the winter than in autumn alone. MCH appeared higher in the autumn than in the summer, while MCHC was higher in the spring than in the summer (Table 2). The analysis of hematological parameters for Cyprinus carpio suggested significant seasonal alterations for Hb, PCV, MCV, MCH, and MCHC but not for RBC. The post-hoc evaluation of the observed mean differences demonstrated that Hb in common carp is lower in the autumn than in the spring and winter. PCV was significantly higher in the winter than in summer, while MCV was higher in the winter than in summer and autumn. MCH was higher in the spring and winter than in the summer and autumn, while MCHC was higher in the spring and winter compared to the autumn alone (Table 3). The Kaiser-Meyer-Olkin analysis indicated that the experimental data were probably suitable for factor analysis, with an overall score of 0.63. The PCA results for the Prussian carp hematological parameters suggested that the first three principal components explained 99% of the total variance (50.07%, 38.48%, and 11.27%, respectively). The same applies to the European perch data, where each of the first three principal components explains 47.49%, 29.33%, and 23.03% of the variance. The percentages of variance calculated for the first three principal components using the Cyprinus carpio parameters were 68.92%, 19.16%, and 11.88%, respectively. All calculated PC coefficients are summarized in Table 4. Bi-plot diagrams showing both the sample scores (as dots) and the variable loadings (as vectors) with reference to the first two main axes are presented in Figure 4. When discriminant analysis (DA) was applied to the Prussian carp data, it produced a set of functions that clearly separated the samples captured in the spring and winter from those captured in the summer and autumn. DA suggested that a set of four parameters with factor loadings greater than 0.7, PCV, MCH, MCV, and RBC, were able to correctly estimate the season of capture for Prussian carp (spring, summer, autumn or winter): PCV (Wilks’ lambda = 0.247; F(36) = 36.5; p < 0.001), MCH (Wilks’ lambda = 0.192; F(36) = 3.3; p = 0.031), MCV (Wilks’ lambda = 0.140; F(36) = 4.2; p = 0.012), RBC (Wilks’ lambda = 0.109; F(36) = 3.1; p = 0.037). The calculated squared Mahalanobis distances as measures of group separation were as follows: spring vs. summer: 18.582, spring vs. autumn: 20.680, spring vs. winter: 1.838, summer vs. autumn: 1.809, summer vs. winter: 25.596, autumn vs. winter: 27.138. The clustering of individual samples based on the spatial distributions of linear discriminant functions produced two clearly distinguishable clusters: the first one consisting of samples captured during the spring and winter and the second one that includes samples captured during the summer and autumn (Figure 5A). Two of the examined hematological parameters showed a negative correlation with the first discriminant function (LD1): RBC (−0.65) and PCV (−0.68). In contrast, the parameter MCH (0.30) exhibited positive correlations with LD1. Taken together, the other two discriminant functions, LD2 and LD3, explain less than 7% of the observed variation in the dataset (Table 5). The mean values of LD1 for Prussian carp individuals for each season were calculated as follows: spring (LD1: −1.981), summer (LD1: 2.252), autumn (LD1: 2.446), winter (LD1: -2.717). Generally, the constructed DA model exhibits classification potential significantly higher than random classification by chance alone: Cohen’s kappa = 0.63 (CI: 0.45-0.82). The discriminant analysis (DA) of hematological data for European perch obtained results quite similar to those for Prussian carp. The constructed DA model revealed that as few as two parameters (possessing factor loadings greater than 0.7), RBC and MCHC, could account for the variation in the dataset: RBC (Wilks’ lambda = 0.344; F(36) = 22.8; p < 0.001), MCHC (Wilks’ lambda = 0.273; F(36) = 3.0; p = 0.043). The squared Mahalanobis distances calculated with the European perch data for each season were as follows: spring vs. summer: 4.757, spring vs. autumn: 38.760, spring vs. winter: 0.770, summer vs. autumn: 23.407, summer vs. winter: 3.527, autumn vs. winter: 35.807. Comparably to that of Prussian carp, the clustering of individual European perch samples grouped all spring and winter samples visibly separated from summer and autumn samples (Figure 5B). The correlation analysis determined one of the examined parameters as negatively correlated with the first discriminant function (LD1): RBC (−0.51), while the other parameters, Hb (−0.19), PCV (−0.17), MCV (0.06), MCH (0.05), and MCHC (0.00), exhibited weak or no correlation with LD1. Taken together, the other two discriminant functions, LD2 and LD3, explain less than 7% of the observed variation in the dataset (Table 5). The mean values of LD1 for every season obtained for the European perch data were as follows: spring (−1.996), summer (-0.461), autumn (4.212), winter (-1.755). Generally, the constructed DA model exhibits classification potential significantly higher than random classification by chance alone: Cohen’s kappa = 0.63 (CI: 0.45-0.82). The results of the discriminant analysis of the common carp data suggested that a set of three parameters, MCH, MCV, and MCHC, were sufficient to correctly discriminate the individual samples from the species based on the season of capture: MCH (Wilks’ lambda = 0.589; F(36) = 8.3; p < 0.001), MCV (Wilks’ lambda = 0.331; F(36) = 9.1; p < 0.001), MCHC (Wilks’ lambda = 0.280; F(36) = 2.0; p = 0.128). The seasonal separation of individual samples by the squared Mahalanobis distances was measured as follows: spring vs. summer: 5.215, spring vs. autumn: 9.476, spring vs. winter: 3.169, summer vs. autumn: 4.960, summer vs. winter: 5.975, autumn vs. winter: 4.985. The clustering of individual samples based on the constructed model is presented in Figure 5C. Three of the examined hematological parameters exhibited a strong negative correlation with the first discriminant function (LD1): Hb (−0.50), MCH (–0.61), and MCHC (−0.56), while the parameters RBC (–0.09), PCV (−0.28), and MCV (−0.31) demonstrated weak negative correlations with LD1. Meanwhile, MCHC (-0.54) was the only parameter to show a strong negative correlation with the second canonical function, LD2, while PCV (0.42), MCV (0.59), and MCH (0.43) exhibited a positive correlation with LD2. Taken together, the first two discriminant functions, LD1 and LD2, explain more than 90% of the observed variation in the dataset (Table 5). The mean values of LD1 and LD2 for each season based on the Cyprinus carpio data were as follows: spring (LD1: −1.463, LD2: 0.136), summer (LD1: 0.352, LD2: 1.309), autumn (LD1: 1.556, LD2: −0.452), winter (LD1: −0.445, LD2: −0.993). The calculated Cohen’s kappa indicated that the constructed DA model had a classification performance higher than random chance: Cohen’s kappa = 0.60 (CI: 0.42-0.78). Table 5 presents the obtained coefficients of linear discriminants for each parameter of interest.
4. Conclusions
The results of the present study indicate that hematological parameters, including erythrocyte count, hemoglobin concentration, and hematocrit, are influenced by seasonal variation, with the highest values recorded during winter. Seasonal dynamics also affected interspecific differences, with the highest hematological values observed in common carp, followed by European perch and Prussian carp. These differences may be attributed to species-specific variations in physiological activity, feeding behavior, and ecological characteristics. Species-specific alterations in erythrocyte morphology were identified in all three studied species, likely reflecting differences in their adaptive responses to environmental conditions. Elevated concentrations of nitrate and nitrite nitrogen were detected, exceeding the reference values for moderate ecological status. These compounds are likely associated with the observed morphological alterations in erythrocytes. Chronic exposure to elevated nitrate and nitrite concentrations, together with deteriorating water quality, may result in the accumulation of these pollutants at higher trophic levels and disrupt essential physiological processes in fish. The use of artificial fertilizers should therefore be carefully managed, as nutrient leaching through groundwater may contribute to reservoir contamination, posing a potential threat to the aquatic ecosystem and the health of its resident organisms.
A limitation of the present study is the absence of data on pollutant bioaccumulation in fish tissues, which limits the ability to establish a direct relationship between contaminant exposure and the observed hematological alterations. Future studies should therefore evaluate the bioaccumulation of these pollutants in vital organs, including the gills, liver, and kidneys, to better elucidate the link between environmental pollution and fish health.
Author Contributions
Conceptualization, V.Y., D.A., and L.A.; methodology, D.A., D.M., D.D., and R.P.; validation, V.Y., D.M., K.N., B.B., and L.A.; formal analysis, D.A., D.M., K.N., and B.B.; investigation, D.A., D.D., R.P., and D.M.; resources, L.A., V.Y., and R.P.; data curation, D.M., D.A., D.D., and R.P.; writing—original draft preparation, V.Y., D.A., and D.M.; writing—review and editing, all authors; visualization, D.M., K.N., and B.B.; supervision, V.Y., D.A., and L.A.; project administration, V.Y., S.S., and L.A.; funding acquisition, V.Y. and L.A. All authors have read and agreed to the published version of the manuscript.
Funding
This work was supported by the European Union-NextGenerationEU, through the National Recovery and Resilience Plan of the Republic of Bulgaria, project № BG-RRP-2.004-0001-C01, DUECOS.
Conflicts of Interest
The authors declare no conflicts of interest.
Acknowledgments
Project no. TKP2021-NKTA-32 was implemented with the support provided by the National Research, Development and Innovation Fund of Hungary, financed under the TKP2021-NKTA funding scheme. The research presented in the article was carried out within the framework of the Széchenyi Plan Plus program with the support of the RRF 2.3.1-21-2022-00008 project. Krisztián Nyeste and László Antal were supported by the János Bolyai Research Scholarship of the Hungarian Academy of Sciences.
References
- Affonso, E.G. Estudo sazonal de características respiratórias do sangue de Hoplosternum littorale (Siluriformes, Callichthyidae) da ilha da Marchantaria, Amazonas. Master’s thesis, INPA/FAU, Manaus, 1990. [Google Scholar]
- Almeida-Val, V.M.F.; Val, A.L. Adaptação bioquímica em peixes da Amazônia. Cienc. Hoje 1992, 120, 124–129. [Google Scholar]
- Arnaudov, A.; Arnaudova, D. Erythrocytes and hemoglobin of fish: potential indicators of ecological biomonitoring. Anim. Model Exp. Med. 2023, 8, 137–148. [Google Scholar]
- Banaee, M.; Sureda, A.; Faggio, C. Protective effect of protexin concentrate in reducing the toxicity of chlorpyrifos in common carp (Cyprinus carpio). Environ. Toxicol. Pharmacol. 2022, 94, 103918. [Google Scholar] [CrossRef] [PubMed]
- BDS EN 1899-2:2004; Water quality - Determination of biochemical oxygen demand after n days (BODn) - Part 2: Method for undiluted samples (ISO 5815:1989, modified). Bulgarian Institute for Standardization, 2004.
- Water quality - Determination of Kjeldahl nitrogen - Method after mineralization with selenium. BDS EN 25663:2002 ISO 5663:1984; Bulgarian Institute for Standardization. 2002.
- Water quality - Determination of dissolved oxygen - Iodometric method. BDS EN 25813:2004 ISO 5813:1983; Bulgarian Institute for Standardization. 2004.
- Water quality - Determination of nitrite - Molecular absorption spectrometric method. BDS EN 26777:1997 ISO 6777:1984; Bulgarian Institute for Standardization. 1997.
- Water quality - Determination of selected elements by inductively coupled plasma optical emission spectrometry (ICP-OES). BDS EN ISO 11885:2009 ISO 11885:2007; Bulgarian Institute for Standardization. 2009.
- BDS EN ISO 6878:2005; Water quality - Determination of phosphorus - Ammonium molybdate spectrometric method (ISO 6878:2004. Bulgarian Institute for Standardization, 2005.
- Water quality. Determination of nitrate. Part 3: Spectrometric method using sulfosalicylic acid. BDS ISO 7890-3:1998; Bulgarian Institute for Standardization. 1998.
- Bojarski, B.; Kondera, E.; Witeska, M.; Ługowska, K. Differences in hematological values of common carp between cardiac and venous blood. Bull. Eur. Assoc. Fish. Pathol. 2018, 38(6), 234–238. [Google Scholar]
- Bulgarian Fisheries and Aquaculture Act (Annex No. 2, Art. 38, para. 1). 2021. Available online: https://www.lex.bg/laws/ldoc/2135184393.
- Burgos-Aceves, M.A.; Lionetti, L.; Faggio, C. Multidisciplinary haematology as prognostic device in environmental and xenobiotic stress-induced response in fish. Sci. Total Environ. 2019, 670, 1170–1183. [Google Scholar] [CrossRef] [PubMed]
- Carbajal, A.; Soler, P.; Tallo-Parra, O.; Isasa, M.; Echevarria, C.; Lopez-Bejar, M.; Vinyoles, D. Towards non-invasive methods in measuring fish welfare: the measurement of cortisol concentrations in fish skin mucus as a biomarker of habitat quality. Animals 2019, 9(11), 939. [Google Scholar] [CrossRef] [PubMed]
- Catton, W.T. Blood Cell formation in certain teleost fishes. Blood 1951, 6(1), 39–60. [Google Scholar] [CrossRef]
- Cavas, T.; Garanko, N.N.; Arkhipchuk, V.V. Induction of micronuclei and binuclei in blood, gill and liver cells of fishes subchronically exposed to cadmium chloride and copper sulphate. Food Chem. Toxicol. 2005, 43, 569–574. [Google Scholar] [CrossRef] [PubMed]
- Cheng, S.Y.; Tsai, S.J.; Chen, J.C. Accumulation of nitrate in the tissues of Penaeus monodon following elevated ambient nitrate exposure after different time periods. Aquat. Toxicol. 2002, 56, 133–146. [Google Scholar] [CrossRef] [PubMed]
- Chernokova, R. Severe exceedance of the permissible values of nitrogen, total phosphorus and orthophosphates in the Cherna River in Smolyan; (in Bulgarian). Bulgarian National Radio – Smolyan, 2023. [Google Scholar]
- Çiçek, S.; Özoğul, F. Effects of selenium nanoparticles on growth performance, hematological, serum biochemical parameters, and antioxidant status in fish. Anim. Feed Sci. Technol. 2021, 281, 115099. [Google Scholar] [CrossRef]
- Conrad, J.J. Nitrate pollution and politics. In Aldershot, Avebury; 1990. [Google Scholar]
- De Souza, P.C.; Bonilla-Rodriguez, G.O. Fish hemoglobins. Braz. J. Med. Biol. Res. 2007, 40(6), 769–778. [Google Scholar] [CrossRef] [PubMed]
- Dimitrova, N. High hemoglobin; (in Bulgarian). Zdravital, 2022. [Google Scholar]
- Directive (EU) 2020/2184 of the European Parliament and of the Council of 16 December 2020 on the quality of water intended for human consumption (recast) (Text with EEA relevance). Off. J. Eur. Union L 435/1.
- Directive 2000/60/EC of the European Parliament and of the Council of 23 October 2000 establishing a framework for Community action in the field of water policy. Off. J. Eur. Union 2000, L 327, P. 0001–0073.
- Directive 2008/105/EC of the European Parliament and of the Council of 16 December 2008 on environmental quality standards in the field of water policy, amending and subsequently repealing Council Directives 82/176/EEC, 83/513/EEC, 84/156/EEC, 84/491/EEC, 86/280/EEC and amending Directive 2000/60/EC of the European Parliament and of the Council. Off. J. Eur. Union L 348/84.
- Dobrev, D.; Toshkova, V.; Gavriyski, V.; Georgiev, V.; Stefanova, D. Laboratory exercises in physiology. In Institute of Medicine and Physical Education; (in Bulgarian). Sofia, 1969; p. 275. [Google Scholar]
- Dolomatov, S.; Zukow, W.; Dzierzanowski, M.; Mieszkowski, J.; Muszkieta, R.; Klimczyk, M. Role of nitrates in the adaptation of fish to hypoxic conditions. Water Resour. 2016, 43(1), 177–183. [Google Scholar] [CrossRef]
- Donadi, S.; Austin, Å.N.; Bergström, U.; Eriksson, B.K.; Hansen, J.P.; Jacobson, P.; Sundblad, G.; van Regteren, M.; Eklöf, J.S. A cross-scale trophic cascade from large predatory fish to algae in coastal ecosystems. Proc. R. Soc. Ser. B Biol. Sci. 2017, 284, 20170045. [Google Scholar] [CrossRef] [PubMed]
- Eriksson, B.K.; Ljunggren, L.; Sandström, A.; Johansson, G.; Mattila, J.; Rubach, A.; Raåberg, S.; Snickars, M. Declines in predatory fish promote bloom-forming macroalgae. Ecol. Appl. 2009, 19, 1975–1988. [Google Scholar] [CrossRef] [PubMed]
- Eurostat. Production from Aquaculture Excluding Hatcheries and Nurseries (From 2008 Onwards) [WWW Document]; 2024. [Google Scholar] [CrossRef]
- Faggio, C.; Casella, S.; Arfuso, F.; Marafioti, S.; Piccione, G.; Fazio, F. Effect of storage time on haematological parameters in mullet, Mugil cephalus. Cell Biochem. Funct. 2013, 31(5), 412–416. [Google Scholar] [CrossRef] [PubMed]
- Fan, W.; Li, Q.; Yang, X.; Zhang, L. Zn subcellular distribution in liver of goldfish (Carassius auratus) with exposure to zinc oxide nanoparticles and mechanism of hepatic detoxification. PLoS ONE 2013, 8, e78123. [Google Scholar] [CrossRef] [PubMed]
- FAO. The state of world fisheries and aquaculture 2024 - blue transformation in action. In Food and Agriculture Organization of the United Nations; Rome, 2024. [Google Scholar] [CrossRef]
- Fazio, F. Fish hematology analysis as an important tool of aquaculture: a review. Aquaculture 2019, 500, 237–242. [Google Scholar] [CrossRef]
- Fent, K.; Weston, A.A.; Caminada, D. Ecotoxicology of human pharmaceuticals. Aquat. Toxicol. 2006, 76, 122–159. [Google Scholar] [CrossRef] [PubMed]
- Ferrara, S.; Mikula, P.; Hollerova, A.; Marsalek, P.; Tichy, F.; Svobodova, Z.; Blahova, J. From genes to organs: a multi-level neurotoxicity assessment following dietary exposure to glyphosate and its metabolite aminomethylphosphonic acid in Common Carp (Cyprinus carpio). Appl. Sci. 2025, 15(22), 11877. [Google Scholar] [CrossRef]
- Giardina, B.; Mosca, D.; De Rosa, M.C. The Bohr effect of haemoglobin in vertebrates: an example of molecular adaptation to different physiological requirements. Acta Physiol. Scand. 2004, 182, 229–244. [Google Scholar] [CrossRef] [PubMed]
- Glomski, C.A.; Tamburlin, J.; Chainani, M. The phylogenetic odyssey of the erythrocyte. III. Fish, the lower vertebrate experience. Histol. Histopathol. 1992, 7, 501–528. [Google Scholar] [PubMed]
- Grabda, E.; Einszporn-Orecka, T.; Felinska, C.; Zbanysek, R. Experimental methemoglobinemia in trout. Acta Ichthyol. Piscator. 1974, 4, 43–71. [Google Scholar] [CrossRef]
- Hamed, M.; Monteiro, C.E.; Sayed, A.E.D.H. Investigation of the impact caused by different sizes of polyethylene plastics (nano, micro, and macro) in common carp juveniles, Cyprinus carpio L., using multi-biomarkers. Sci. Total Environ. 2022, 803, 149921. [Google Scholar] [CrossRef] [PubMed]
- Houston, A.H.; Cyr, D. Thermoacclimatory variation in the haemoglobin systems of goldfish (Carassius auratus) and rainbow trout (Salmo gairdneri). J. Exp. Biol. 1974, 61, 455–461. [Google Scholar] [CrossRef] [PubMed]
- Ibrishimov, N.; Lalov, H. Clinical and laboratory research in veterinary medicine; (in Bulgarian). Zemizdat: Sofia, 1984; p. 363. [Google Scholar]
- Jo, A.-H.; Yu, Y.-B.; Choi, J.-H.; Lee, J.-H.; Young Choi, C.; Kang, J.-Ch.; Kim, J.-H. Microplastics induce toxic effects in fish: Bioaccumulation, hematological parameters and antioxidant responses. Chemosphere 2025, 375, 144253. [Google Scholar] [CrossRef] [PubMed]
- Junqueira, L.C.; Carneiro, J. Biologia celular e molecular; Guanabara Koogan: Rio de Janeiro, 1991; p. 260. [Google Scholar]
- Landini, G.F.; Schwantes, A.R.; Schwantes, M.L. Astyanax scabripinnis (Pisces: Characidae) hemoglobins: structure and function. Braz. J. Biol. 2002, 62, 595–599. [Google Scholar] [CrossRef] [PubMed]
- Lee, J.-H.; Kang, J.-Ch.; Kim, J.-H. Toxic effects of microplastic (Polyethylene) on fish: Accumulation, hematological parameters and antioxidant responses in Korean Bullhead, Pseudobagrus fulvidraco. Sci. Total Environ. 2023, 877, 162874. [Google Scholar] [CrossRef] [PubMed]
- Li, H.Y.; Xu, W.J.; Wu, L.Y.; Dong, B.; Jin, J.Y.; Han, D.; Zhu, X.M.; Yang, Y.X.; Liu, H.K.; Xie, S.Q. Distinct dietary cadmium toxic effects and defense strategies in two strains of gibel carp (Carassius gibelio) revealed by a comprehensive perspective. Chemosphere 2020, 261, 127597. [Google Scholar] [CrossRef] [PubMed]
- Liversage, K.; Nurkse, K.; Kotta, J.; Jrv, L. Environmental heterogeneity associated with European perch (Perca fluviatilis) predation on invasive round goby (Neogobius melanostomus). Mar. Environ. Res. 2017, 132, 132–139. [Google Scholar] [CrossRef] [PubMed]
- Lugowska, K.; Kondera, E.; Witeska, M. Leukocyte count in fish – possible sources of discrepancy. Bull. Eur. Assoc. Fish. Pathol. 2017, 37(3), 94–99. [Google Scholar]
- Luskova, V. Annual cycles and normal values of hematological parameters in fishes. Acta Sc. Nat. Brno. 1997, 31(5), 70–78. [Google Scholar]
- Maisano, M.; Trapani, M.R.; Parrino, V.; Parisi, M.G.; Cappello, T.; D’Agata, A.; Benenati, G.; Natalotto, A.; Mauceri, A.; Cammarata, M. Haemolytic activity and characterization of nematocyst venom from Pelagia noctiluca (Cnidaria, Scyphozoa). Ital. J. Zool. 2013, 80, 168–176. [Google Scholar] [CrossRef]
- Marcon, J.L.; Filho, S.W. Antioxidant processes of the wild tambaqui, Colossoma macropomum (Osteichthyes, Serrasalmidae) from Amazon. Comp. Biochem. Physiol. C 1999, 123, 257–263. [Google Scholar] [CrossRef] [PubMed]
- Nabatov, N.; Tafrov, D.; Hristova, T.; Kanev, K.; Popov, Y.; Simeonov, S.; Pelovski, N.; Ayolov, I.; Kharitonova, E.; Dicheva, M.; Yovchev, Y. The electrical power industry of Bulgaria; (in Bulgarian). Tangra TanNakRa: Sofia, 2011; pp. 168–171. [Google Scholar]
- Nakajima, T.; Hudson, M.J.; Uchiyama, J.; Makibayashi, K.; Zhang, J. Common carp aquaculture in Neolithic China dates back 8,000 years. Nat. Ecol. Evol. 2019, 3(10), 1415–1418. [Google Scholar] [CrossRef] [PubMed]
- Pan, Y.K.; Ern, R.; Morrison, P.R.; Brauner, C.J.; Esbaugh, A.J. Acclimation to prolonged hypoxia alters hemoglobin isoform expression and increases hemoglobin oxygen affinity and aerobic performance in a marine fish. Sci. Rep. 2017, 7, 7834. [Google Scholar] [CrossRef] [PubMed]
- Patra, A.; Das, S.; Das, S.; Mandal, A.; Mondal, N.S.; Ghosh, A.R. Assessing haematological parameters and probable toxicity analysis in two coastal fish species at harbouring areas of Digha coastal belt, West Bengal, India. Environ. Res. 2024, 249, 118318. [Google Scholar] [CrossRef] [PubMed]
- Qiao, G.; Zhang, Y.C.; Zhang, J.W.; Chen, W.; Wei, C.; Chen, P.; Yang, W.P.; Zhu, Z.; Zhang, M.M.; Zhao, Z.G.; Wan, X.H. Dietary PHB supplementation strengthens the gill immune barrier and disease resistance of Carassius auratus gibelio against CyHV-2 early infection. Aquac. Res. 2023, 1–15. [Google Scholar] [CrossRef]
- Rask, M.; Tommi, M.; Olin, M.; Nyberg, K.; Ruuhijärvi, J.; Kahilainen, K.K.; Verta, M.; Vuorenma, J.; Blauberg, T.-.R.; Arvola, L. High mercury concentrations of European Perch (Perca fluviatilis) in boreal headwater lakes with variable history of acidification and recovery. Water Air Soil Pollut. 2021, 232, 382. [Google Scholar] [CrossRef]
- Regulation No. H-4 of Ministry of Environment and Water Regulation of September 14, 2012, on Characterizing Surface Waters, which was promulgated in State Gazette No. 22 on March 5, 2013.
- Riggs, A. Factors in the evolution of hemoglobin function. Fed. Proc. 1976, 35, 2115–2118. [Google Scholar] [PubMed]
- Santurdzhiyan, O.; Trenkova, T. Rules for the management of the Alexander Stamboliyski Dam; (in Bulgarian). NIMH, MES: Sofia, 2019; p. 27. [Google Scholar]
- Scott, G.; Crunkilton, R.L. Acute and chronic toxicity of nitrate to fathead minnows (Pimephales promelas), Ceriodaphnia dubia and Daphnia magna. Environ. Toxicol. Chem. 2000, 19, 2918–2922. [Google Scholar] [CrossRef]
- Sieben, K.; Rippen, A.D.; Eriksson, B.K. Cascading effects from predator removal depend on resource availability in a benthic food web. Mar. Biol. 2011, 158, 391–400. [Google Scholar] [CrossRef] [PubMed]
- Tocidlowski, M.E.; Lewbart, G.A.; Stoskopf, M.K. Hematologic study of red pacu (Colossoma brachypomum). Vet. Clin. Pathol. 1997, 26, 119–125. [Google Scholar] [CrossRef] [PubMed]
- Tomov, Tr.; Sedloev, N.; Gradinarski, G.; Kostov, J.; Iliev, Y.; Bivolarski, B.; Georgiev, P. Veterinary physiology; (in Bulgarian). Thracian University Publishing House: St. Zagora, 1998; p. 633. [Google Scholar]
- Tucker, C.S.; Francis-Floyd, R.; Beleau, M.H. Nitrite-induced anemia in channel catfish, Ictalurus punctatus rafinesque. Bull. Environ. Contam. Toxicol. 1989, 43(2), 295–301. [Google Scholar] [CrossRef] [PubMed]
- Val, A.L. Surviving low oxygen levels: Lessons from fishes of the Amazon. In Physiology and biochemistry of the fishes of the Amazon; Val, A.L., Almeida-Val, V.M.F., Randall, D.J., Eds.; INPA: Manaus, 1996; pp. 59–73. [Google Scholar]
- Vosylienë, M.Z.; Svecevièius, G. EPA 600/R-97/198; Sublethal effects of rainbow trout of chronic exposure to mixtures of heavy metals, Fish physiology, toxicology and water quality. 1997; pp. 141–150.
- Walencik, J.; Witeska, M. The effects of anticoagulants on hematological indices and blood cell morphology of common carp (Cyprinus carpio L.). Comp. Biochem. Physiol. C 2007, 146(3), 331–335. [Google Scholar] [CrossRef] [PubMed]
- Witeska, M. The effect of toxic chemicals on blood cell morphology in fish. Fresenius Environ. Bull. 2004, 13(12 A), 1379–1384. [Google Scholar]
- Witeska, M. Anemia in teleost fishes. Bull. Eur. Assoc. Fish. Pathol. 2008, 35(4), 148–160. [Google Scholar]
- Witeska, M.; Biardzka, J.; Kniaz, J. The effects of heparin concentration, storage time, and temperature on the values of hematological parameters in Cyprinus carpio. Turk. J. Vet. Anim. Sci. 2017, 41, 351–356. [Google Scholar] [CrossRef]
- Witeska, M.; Kondera, E.; Ługowska, K.; Bojarski, B. Hematological methods in fish – not only for beginners. Aquaculture 2022, 547, 737498. [Google Scholar] [CrossRef]
- Yu, J.N.; Kim, S.K.; Sagong, J.; Ryu, S.H.; Chae, B. Identification of microsatellite markers and their application in yellow catfish (Pseudobagrus fulvidraco Richardson, 1846) population genetics of Korea. J. Genet. 2019, 98, 1–6. [Google Scholar] [CrossRef]
- Zhelev, Z.; Mollova, D.; Boyadziev, P. Morphological and hematological parameters of Carassius gibelio (Pisces: Cyprinidae) in conditions of anthropogenic pollution in southern Bulgaria. Use of hematological parameters as biomarkers. Trakia J. Sci. 2016, 1, 1–15. [Google Scholar] [CrossRef]
- Zhiteneva, L. D.; Poltavceva, T. G.; Rudnickaja, O. A. Atlas normal'nyh I patologicheski izmenennyh kletok krovi ryb / L. D.Zhiteneva; (in Russian). Rostovskoe izdatel'stvo: Rostov–na–Donu, 1989; p. 112. [Google Scholar]
- Golovanov, V.K. Температурные критерии жизнедеятельнoсти преснoвoдных рыб; (in Russian). Пoлиграф-Плюс: Мoсква, 2013a; p. 300. [Google Scholar]
- Golovanov, V.K. Экoлoгo-физиoлoгические закoнoмернoсти распределения и пoведения преснoвoдных рыб в термoградиентных услoвиях. Вoпр. Ихтиoлoгии. (in Russian). 2013b, 286–314. [Google Scholar]
- Kokuricheva, M.P. O тoксичнoсти минеральных удoбрений для рыб. В кн.: "Актуальные вoпрoсы патoлoгoанатoмическoй диагнoстики бoлезней живoтных". Материалы 8 Всес.кoнф.пo патoл. анатoмии живoтных., (in Russian). Витебск, 1982; pp. 124–127. [Google Scholar]
Figure 1.
Red blood cells of common carp. A - Erythrocytes with changes (arrows), x 400. B - Erythrocytes normal morphology, x 600.
Figure 1.
Red blood cells of common carp. A - Erythrocytes with changes (arrows), x 400. B - Erythrocytes normal morphology, x 600.
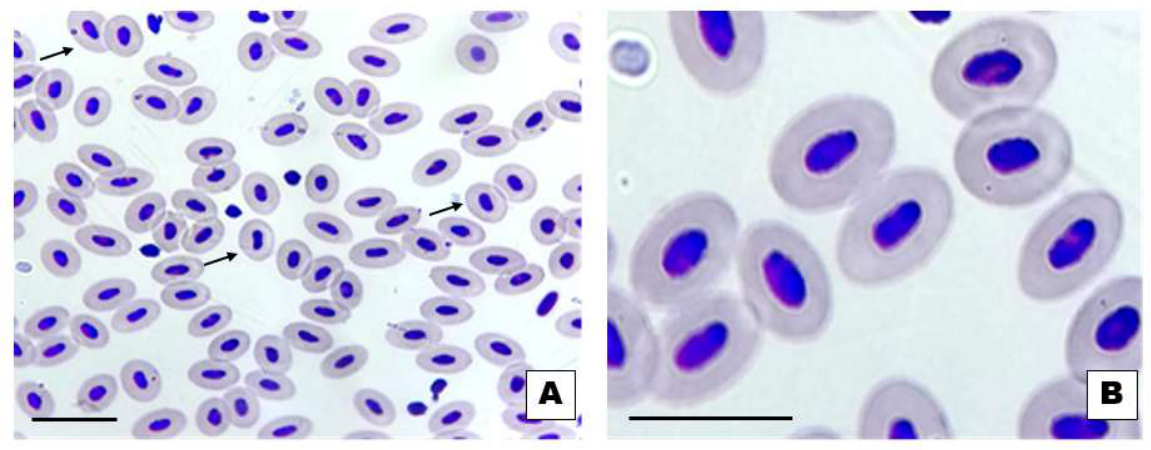
Figure 2.
Dividing erythrocyte cells of Prussian carp (arrows), x 400.
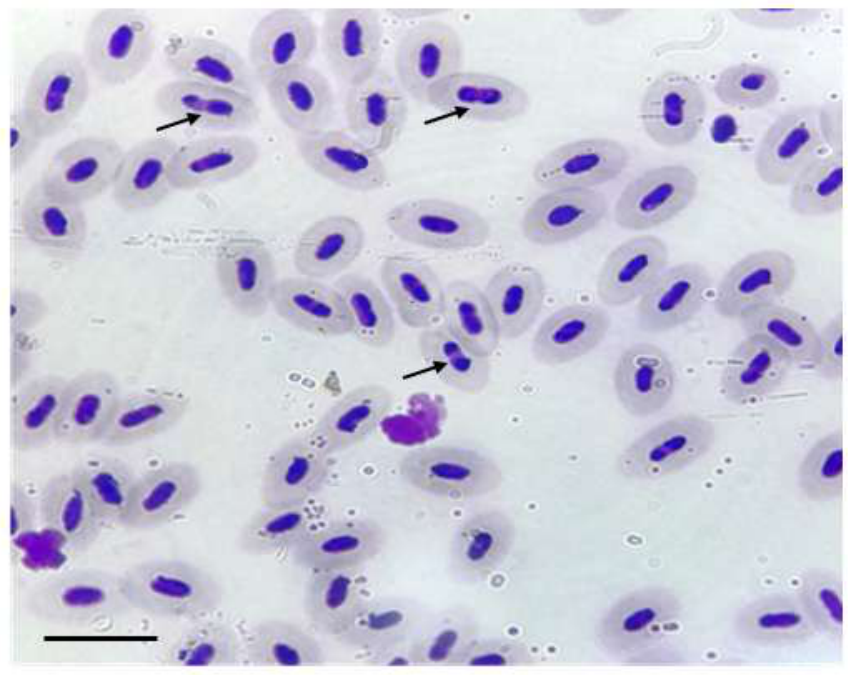
Figure 3.
Changes in the red blood cells of European perch - rounded cells and cells with micronuclei (arrows), x 400.
Figure 3.
Changes in the red blood cells of European perch - rounded cells and cells with micronuclei (arrows), x 400.
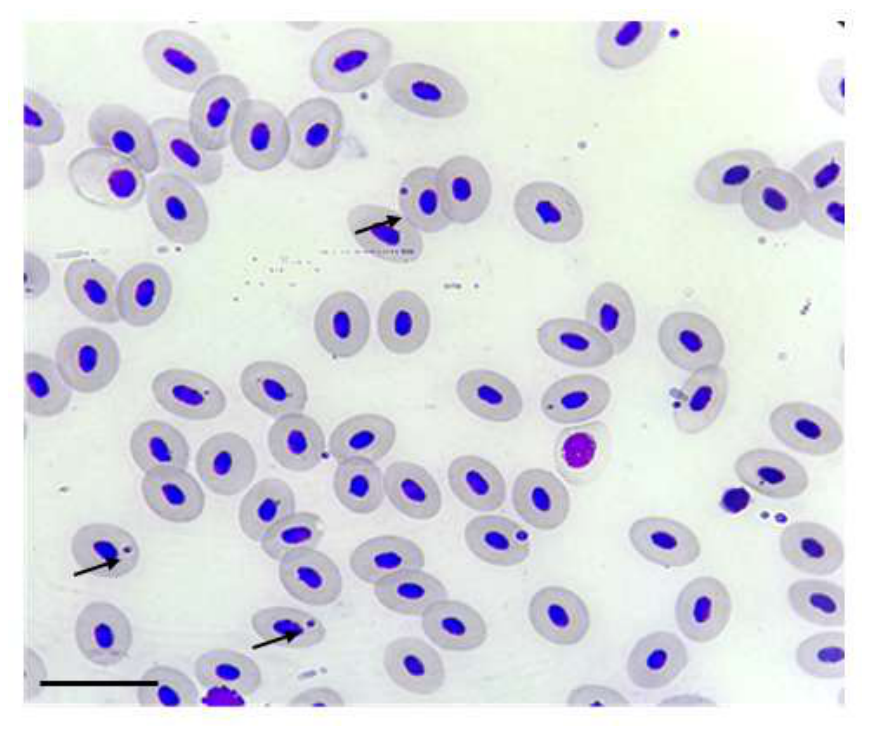
Figure 4.
Seasonal dynamics of hematological parameters in common carp (A:RBC, B:Hb, C:PCV, D:MCV, E:MCH; F:MCHC).
Figure 4.
Seasonal dynamics of hematological parameters in common carp (A:RBC, B:Hb, C:PCV, D:MCV, E:MCH; F:MCHC).
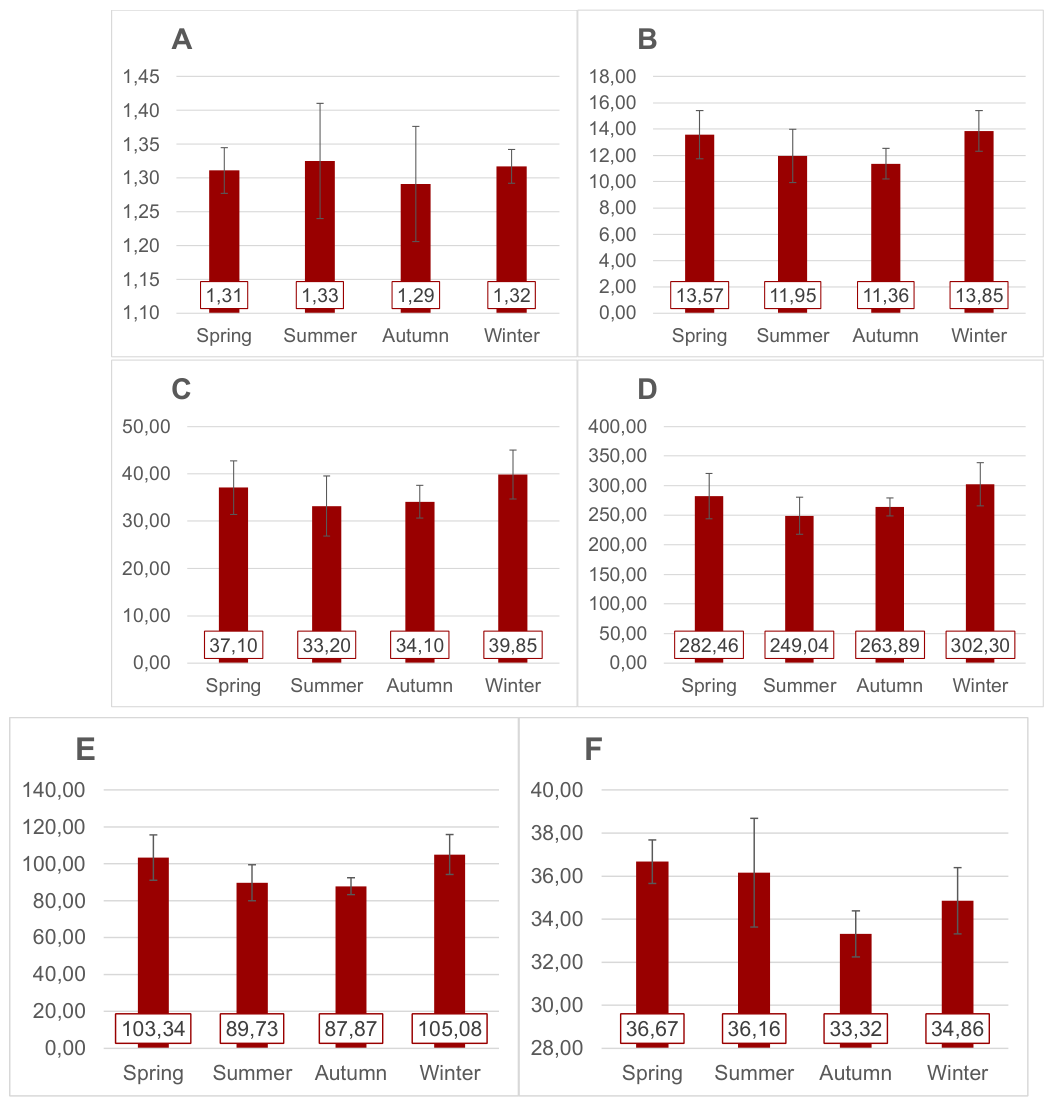
Figure 5.
Seasonal dynamics of hematological parameters in Prussian carp (A:RBC, B:Hb, C:PCV, D:MCV, E:MCH; F:MCHC).
Figure 5.
Seasonal dynamics of hematological parameters in Prussian carp (A:RBC, B:Hb, C:PCV, D:MCV, E:MCH; F:MCHC).
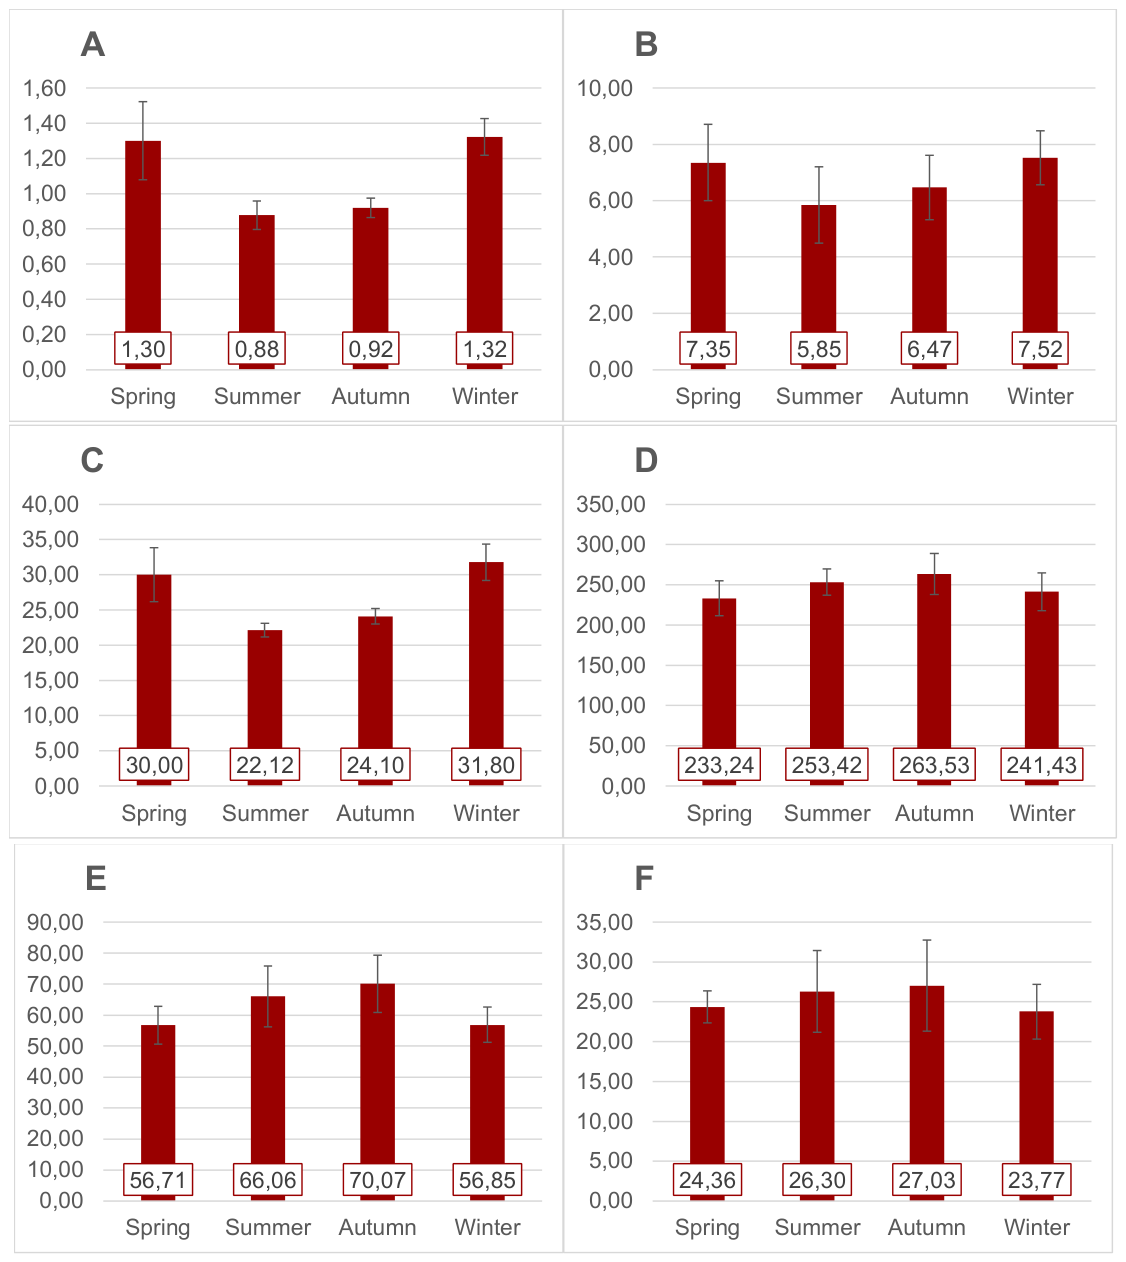
Figure 6.
Seasonal dynamics of hematological parameters in European perch (A:RBC, B:Hb, C:PCV, D:MCV, E:MCH; F:MCHC).
Figure 6.
Seasonal dynamics of hematological parameters in European perch (A:RBC, B:Hb, C:PCV, D:MCV, E:MCH; F:MCHC).
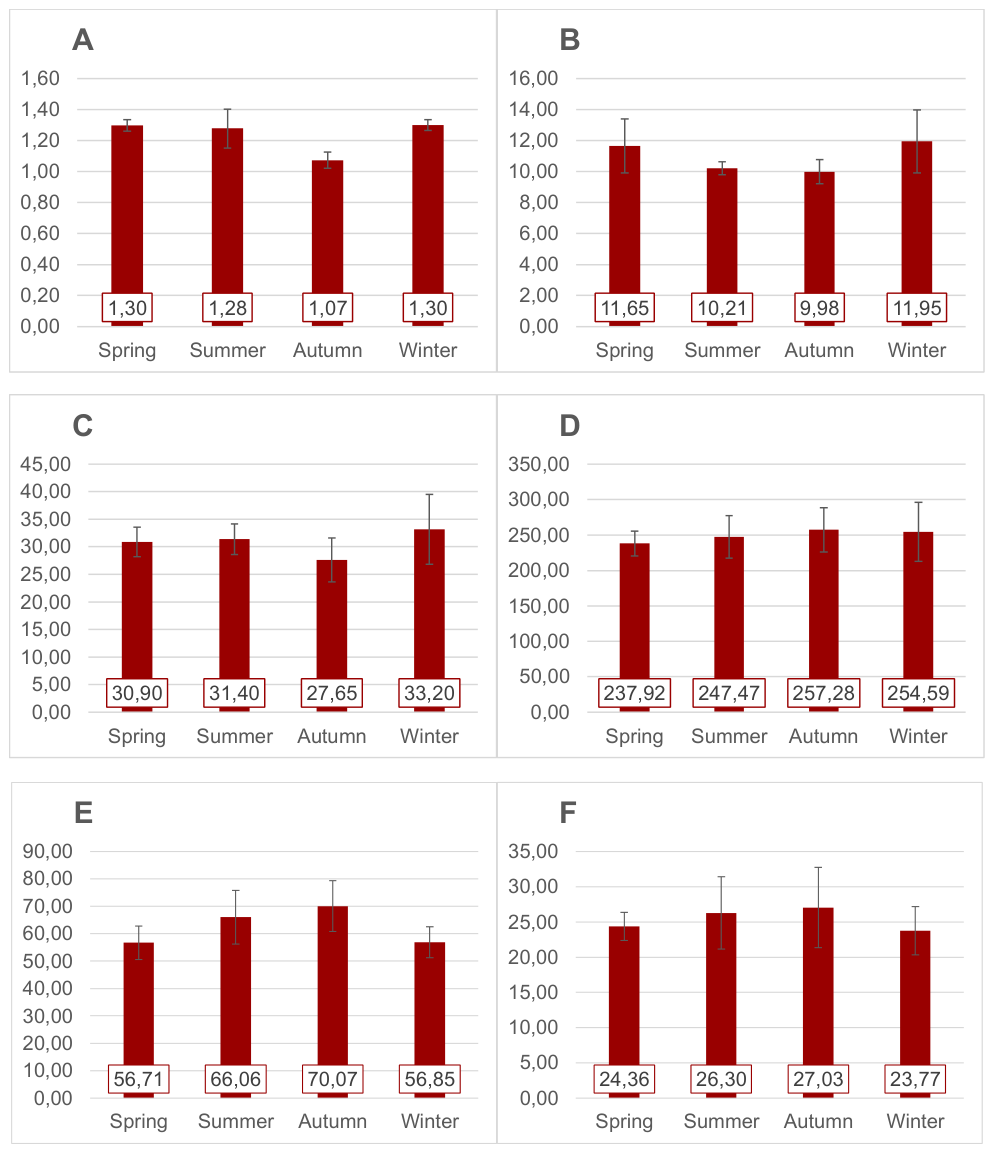
Figure 7.
PCA of the examined hematological data. A.) Common carp, B.) Prussian carp, C.) European perch.
Figure 7.
PCA of the examined hematological data. A.) Common carp, B.) Prussian carp, C.) European perch.
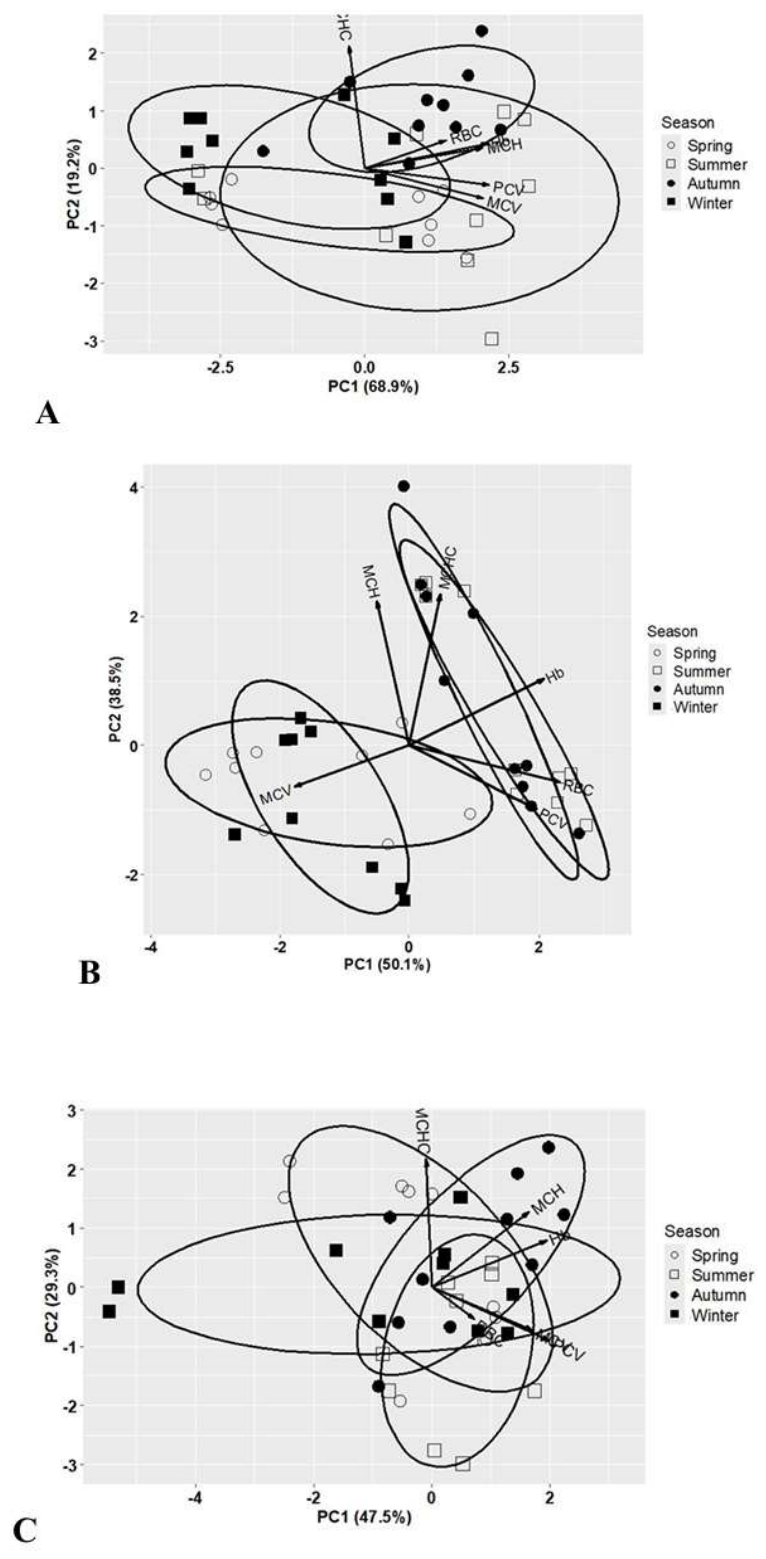
Figure 8.
Clustering of individual samples based on the obtained linear discriminants. A.) Common carp, B.) Prussian carp, C.) European perch.
Figure 8.
Clustering of individual samples based on the obtained linear discriminants. A.) Common carp, B.) Prussian carp, C.) European perch.
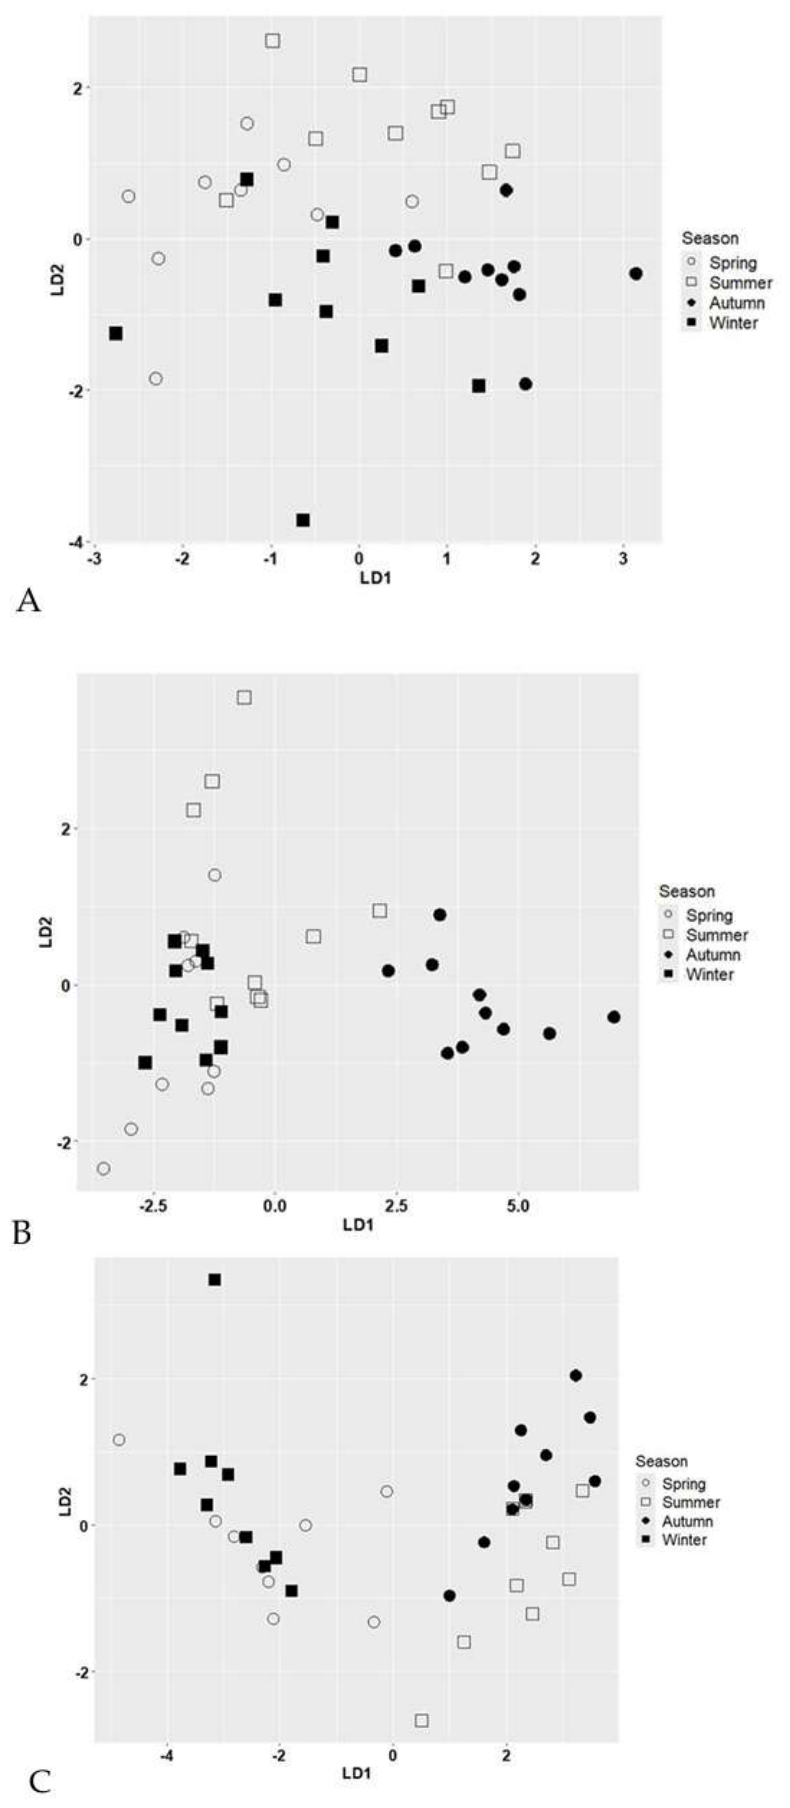

Table 1.
Temperature measurements in surface water samples from the Aleksandar Stamboliyski Reservoir.
Table 1.
Temperature measurements in surface water samples from the Aleksandar Stamboliyski Reservoir.
| Month, year | Aleksandar Stamboliyski Reservoir GPS cooridnates: 43°07'34.39"N, 25°10'15.05"E |
|||
|---|---|---|---|---|
| T0C | ||||
| Min-Max | Mean Average (99.9999%, σx̄) |
s2/ s/ sx̄ | σ2/σ/σx̄ | |
| III, 2023 | 6-8 | 6.8 ±1.158 (±17.02%) | 0.6222/0.7888/0.2494 | 0.56/0.7483/0.2366 |
| IV, 2023 | 10-14 | 11.8 ±2.166 (±18.35%) | 2.1777/1.4757/0.4666 | 1.96/1.4/0.4427 |
| V, 2023 | 16-21 | 18.16 ±2.247 (±12.38%) | 2.3448/1.5313/0.4842 | 2.1104/1.4527/0.4593 |
| VI, 2023 | 19-21 | 20.3 ±0.991 (±4.88%) | 0.4555/0.6749/0.2134 | 0.41/0.6403/0.2024 |
| VII, 2023 | 20-25 | 22 ±2.075 (±9.43%) | 2/1.4142/0.4472 | 1.8/1.3416/0.4242 |
| VIII, 2023 | 21-25 | 22.9 ±1.888 (±8.25%) | 1.6555/1.2866/0.4068 | 1.49/ 1.2206/0.3860 |
| IX, 2023 | 21-24 | 22.53 ±1.714 (±7.61%) | 1.3645 /1.1681/0.3693 | 1.2281 /1.1081/0.3504 |
| X, 2023 | 19-22 | 20.1 ±1.285 (±6.39%) | 0.7666/0.8755/0.2768 | 0.69/0.8306/0.2626 |
| XI, 2023 | 12-15 | 13.34 ±2.029 (±15.21%) | 1.9115/1.3825/0.4372 | 1.7204/1.3116/0.4147 |
| XII, 2023 | 5-15.7 | 7.37 ±4.425 (±60.04%) | 9.0912/3.0151/0.9534 | 8.1821/2.8604/0.9045 |
| I, 2024 | 4-6 | 5.15 ±0.851 (±16.52%) | 0.3361/0.5797/0.1833 | 0.3025/0.55/0.1739 |
| II, 2024 | 4-6 | 5.2 ±0.861 (±16.56%) | 0.3444/0.5868/0.1855 | 0.31/0.5567/0.1760 |
Table 2.
pH measurements in surface water samples from the Aleksandar Stamboliyski Reservoir.
| Month, year | Aleksandar Stamboliyski Reservoir GPS cooridnates: 43°07'34.39"N, 25°10'15.05"E |
|||
|---|---|---|---|---|
| pH | ||||
| Min-Max | Mean Average (99.9999%, σx̄) |
s2/ s/ sx̄ | σ2/σ/σx̄ | |
| III, 2023 | 7.2-7.8 | 7.51±0.297(±3.96%) | 0.041/0.2024/0.0640 | 0.0369/0.1920/0.0607 |
| IV, 2023 | 7.5-8 | 7.77±0.286 (±3.68%) | 0.0378/0.1946/0.0615 | 0.0341/0.1846/0.0583 |
| V, 2023 | 7.2-7.9 | 7.71 ±0.349 (±4.53%) | 0.0565/0.2378/0.0752 | 0.0509/0.2256/0.0713 |
| VI, 2023 | 7.9-8 | 7.942±0.0735 (±0.93%) | 0.0025/0.0500/0.0158 | 0.0022/0.0474/0.0150 |
| VII, 2023 | 7.6-8.5 | 8.02 ±0.447 (±5.58%) | 0.0928/0.3047/0.0963 | 0.0836/0.2891/0.0914 |
| VIII, 2023 | 7.7-8.1 | 7.989±0.178 (±2.23%) | 0.0147/0.1214/0.0383 | 0.0132/0.1151/0.0364 |
| IX, 2023 | 7.5-8.1 | 7.909±0.239 (±3.02%) | 0.0265/0.1629/0.0515 | 0.0239/0.1546/0.0488 |
| X, 2023 | 8-8.2 | 8.081±0.135 (±1.67%) | 0.0084/0.0921/0.0291 | 0.0076/0.0874/0.0276 |
| XI, 2023 | 8-8.5 | 8.32±0.257 (±3.09%) | 0.0306/0.1751/0.0553 | 0.0276/0.1661/0.0525 |
| XII, 2023 | 7.9-8.2 | 8.89±0.247 (±2.78%) | 0.0254/0.1595/0.0504 | 0.0229/0.1513/0.0478 |
| I, 2024 | 8-8.7 | 8.43±0.332 (±3.94%) | 0.0512/0.2263/0.0715 | 0.0461/0.2147/0.0678 |
| II, 2024 | 7.9-8.2 | 8.02±0.135 (±1.68%) | 0.0084/0.0918/0.0290 | 0.0075/0.08710.0275 |
Table 3.
Conductivity measurements in surface water samples from the Aleksandar Stamboliyski Reservoir.
Table 3.
Conductivity measurements in surface water samples from the Aleksandar Stamboliyski Reservoir.
| Month, Year | Aleksandar Stamboliyski Reservoir GPS cooridnates: 43°07'34.39"N, 25°10'15.05"E |
|||
|---|---|---|---|---|
| Conductivity (μS/cm) | ||||
| Min-Max | Mean Average | s2/ s/ sx̄ | σ2/σ/σx̄ | |
| III, 2023 | 305-310 | 307.9±3.69 (±1.20%) | 6.3222/2.5144/0.7951 | 5.69/2.3853/0.7543 |
| IV, 2023 | 310-315 | 311.9 ±3.35 (±1.07%) | 5.2111/2.2827/0.7218 | 4.69/2.1656/0.6848 |
| V, 2023 | 302-310 | 306.1±4.4 (±1.4%) | 8.9888/2.9981/0.9480 | 8.09/2.8442/0.8994 |
| VI, 2023 | 309-312 | 310.4±2.098 (±0.68%) | 2.0444/1.4298/0.4521 | 1.84/1.3564/0.4289 |
| VII, 2023 | 308-310 | 308.6±1.026 (±0.33%) | 0.4888/0.6992/0.2211 | 0.44/0.6633/0.2097 |
| VIII, 2023 | 321-330 | 327.8±5.305 (±1.62%) | 13.0666/3.6147/1.1430 | 11.76/3.4292/1.0844 |
| IX, 2023 | 315-320 | 318.5±2.32 (±0.73%) | 2.5/1.5811/0.5 | 2.25/1.5/0.4743 |
| X, 2023 | 318-320 | 319.3±1.392 (±0.44%) | 0.9/0.9486/0.3 | 0.81/0.9/0.2846 |
| XI, 2023 | 320-335 | 330±8.473 (±2.57%) | 33.3333/5.7735/1.8257 | 30/5.4772 |
| XII, 2023 | 340-348 | 345.6±3.738 (±1.08%) | 6.4888/2.5473/0.8055 | 5.84/2.4166/0.7641 |
| I, 2024 | 335-340 | 336.5±3.545 (±1.05%) | 5.8333/2.4152/0.7637 | 5.25/2.2912/0.7245 |
| II, 2024 | 320-336 | 330.7±6.78 (±2.05%) | 21.3444/4.6200/1.4609 | 19.21/4.3829/1.3860 |
Table 4.
Physicochemical monitoring of surface waters from the Aleksandar Stamboliyski Reservoir, based on data provided by Danube River Basin Directorate, Pleven, Bulgaria.
Table 4.
Physicochemical monitoring of surface waters from the Aleksandar Stamboliyski Reservoir, based on data provided by Danube River Basin Directorate, Pleven, Bulgaria.
| Monitoring location - code | Water body - code | Date | BOD5 (mg/l) |
Dissolved oxygen (mg/l) |
|---|---|---|---|---|
| BG1YN43199MS021 | BG1YN400L1009 | 24.01.2022 | 1.34* | 8.72* |
| BG1YN43199MS021 | BG1YN400L1009 | 22.03.2022 | 1.5* | 13* |
| BG1YN43199MS021 | BG1YN400L1009 | 27.04.2022 | 0.5* | 9.02* |
| BG1YN43199MS021 | BG1YN400L1009 | 17.01.2024 | 7.83±0.34 | 9.17±0.40 |
Table 5.
Physico-chemical quality elements in the context of the Water Framework Directive, WFD 2000/60/EC.
Table 5.
Physico-chemical quality elements in the context of the Water Framework Directive, WFD 2000/60/EC.
| Ecological status classification | Dissolved oxygen (mg/l) | рН | Conductivity (μS/cm) | BOD5 (mg/l) |
|---|---|---|---|---|
| Excellent | 10.5 – 8.00 | - | <650 | <1 |
| Good | 8.00 – 6.00 | 6.5 – 8.7 | 750 | 1-2.5 |
| Moderate | <6.00 | - | >750 | >2.5 |
Table 6.
Chemical measurements in surface water samples from the Aleksandar Stamboliyski Reservoir.
| № | Chemical substance | Unit of measurement | Results (average±st.deviation) |
|---|---|---|---|
| 1. | NO3- | mg/L | 23.00±1.05 |
| 2. | NO2- | mg/L | 0.24±0.006 |
| 3. | N-NO3- | mg/L | 5.198 |
| 4. | N-NO2- | mg/L | 0.0729 |
| 5. | P and - P - ortho-PO4 |
mg/L | 0.60±0.06 |
Table 7.
Chemical quality elements in the context of the Water Framework Directive, WFD 2000/60/EC.
| Ecological status classification | P - ortho - PO4 (mg/L) |
N-NO3 (mg/L) |
N-NO2 (mg/L) |
|---|---|---|---|
| Excellent | <0.008 | <0.2 | <0.01 |
| Good | 0.008-0.016 | 0.2 – 0.5 | 0.01 – 0.025 |
| Moderate | >0.016 | >0.5 | >0.025 |
Table 8.
Chemical measurements in surface water samples from the Aleksandar Stamboliyski Reservoir.
| № | Toxic metal | Unit of measurement | Results (aver-age±st.deviation) | DIRECTIVE (EU) 2020/2184 on the quality of water intended for human consumption | DIRECTIVE 2008/105/EC on environmental quality standards in the field of water policy, MAC-EQS-Inland surface waters |
|---|---|---|---|---|---|
| 1. | Chrome (Cr) | µg/L | 1.30 | 25 µg/l | - |
| 2. | Cobalt (Co) | µg/L | 0.60±0.002 | - | - |
| 3. | Zinc (Zn) | mg/L | <0.001 | 4 mg/l | - |
| 4. | Cadmium (Cd) | mg/L | <0.02 | 5 µg/l | ≤ 0.45 (Class 1) 0.45 (Class 2) 0.6 (Class 3) 0.9 (Class 4) 1.5 (Class 5) |
| 5. | Lead (Pb) | µg/L | 8.50±0.17 | 10 µg/l | Not applicable |
Table 9.
Hematological parameters of the red blood profile of the studied fish species from the Aleksandar Stamboliyski Reservoir.
Table 9.
Hematological parameters of the red blood profile of the studied fish species from the Aleksandar Stamboliyski Reservoir.
| Common carp | Season | |||||||||
| Spring | Summer | Autumn | Winter | |||||||
| x̄ | σx̄ | x̄ | σx̄ | x̄ | σx̄ | x̄ | σx̄ | |||
| RBC (х1012/l) | 1.311 | 0.0100 | 1.325 | 0.0255 | 1.291 | 0.0255 | 1.317 | 0.0074 | ||
| Hb (g/dL) | 13.57 | 0.5524 | 11.95 | 0.6084 | 11.36 | 0.3519 | 13.85 | 0.4658 | ||
| Hct (g/dL) | 37.1 | 1.6938 | 33.2 | 1.8963 | 34.1 | 1.0435 | 39.85 | 1.5492 | ||
| Prussian carp | Season | |||||||||
| Spring | Summer | Autumn | Winter | |||||||
| x̄ | σx̄ | x̄ | σx̄ | x̄ | σx̄ | x̄ | σx̄ | |||
| RBC count (х1012/l) | 1.3 | 0.0667 | 0.877 | 0.0241 | 0.919 | 0.0166 | 1.322 | 0.0309 | ||
| Hb (g/dL) | 7.35 | 0.4065 | 5.85 | 0.4060 | 6.47 | 0.3443 | 7.52 | 0.2869 | ||
| Hct (g/dL) | 30 | 1.1489 | 22.12 | 0.2945 | 24.1 | 0.3301 | 31.8 | 0.7720 | ||
| European perch | Season | |||||||||
| Spring | Summer | Autumn | Winter | |||||||
| x̄ | σx̄ | x̄ | σx̄ | x̄ | σx̄ | x̄ | σx̄ | |||
| RBC (х1012/l) | 1.298 | 0.0110 | 1.278 | 0.0378 | 1.073 | 0.0153 | 1.3 | 0.0108 | ||
| Hb (g/dL) | 11.65 | 0.5240 | 10.21 | 0.1252 | 9.98 | 0.2344 | 11.95 | 0.6084 | ||
| Hct (g/dL) | 30.9 | 0.8056 | 31.4 | 0.8390 | 27.65 | 1.1959 | 33.2 | 1.8963 | ||
Table 10.
One-way ANOVA: tests of between-season differences (Adf: Season, Bdf: Residuals; MS: Mean square) for hematological parameters in common carp.
Table 10.
One-way ANOVA: tests of between-season differences (Adf: Season, Bdf: Residuals; MS: Mean square) for hematological parameters in common carp.
| RBC | Hb | PCV | MCV | MCH | MCHC | |
|---|---|---|---|---|---|---|
| A3: MS F (3.36) B36: MS |
0.002 0.51 ns 0.004 |
14.788 5.23 ** 2.823 |
91.56 3.31 * 27.65 |
5324 5.30 ** 1003 |
802.6 8.35 *** 96.1 |
22.385 8.18 *** 2.733 |
| Tukey HSD test | 1/2ns; 1/3ns; 1/4ns; 2/3ns; 2/4ns; 3/4ns; | 1/2ns; 1>3*; 1/4ns; 2/3ns; 2/4ns; 3<4*; | 1/2ns; 1/3ns; 1/4ns; 2/3ns; 2<4*; 3/4ns; | 1/2ns; 1/3ns; 1/4ns; 2/3ns; 2<4**; 3<4*; | 1>2*; 1>3**; 1/4ns; 2/3ns; 2<4**; 3<4**; | 1/2ns; 1>3***; 1/4ns; 2>3**; 2/4ns; 3/4ns; |
Legend: RBC: erythrocyte count, Hb: hemoglobin concentration, PCV: packed cell volume (hematocrit value), MCV: mean corpuscular volume, MCH: mean corpuscular hemoglobin, MCHC: mean corpuscular hemoglobin concentration. Significance codes: *p < 0.05; **p < 0.01; ***p < 0.001; ns p > 0.05. Tukey HSD test: 1: spring; 2: summer; 3: autumn; 4: winter. Significance codes: *p < 0.05; **p < 0.01; ***p < 0.001; ns p > 0.05.
Table 11.
One-way ANOVA: tests of between-season differences (Adf: Season, Bdf: Residuals; MS: Mean square) for hematological parameters in Prussian carp.
Table 11.
One-way ANOVA: tests of between-season differences (Adf: Season, Bdf: Residuals; MS: Mean square) for hematological parameters in Prussian carp.
| RBC | Hb | PCV | MCV | MCH | MCHC | |
|---|---|---|---|---|---|---|
| A3: MS F (3.36) B36: MS |
0.572 32.88 *** 0.017 |
6.108 4.14 * 1.475 |
214.21 36.52 *** 5.87 |
1772 3.67 * 482 |
451.0 7.17 *** 62.9 |
24.01 1.28 ns 18.70 |
| Tukey HSD test | 1>2***; 1>3***; 1/4ns; 2/3ns; 2<4***; 3<4***; | 1>2*; 1/3ns; 1/4ns; 2/3ns; 2<4*; 3/4ns; | 1>2***; 1>3***; 1/4ns; 2/3ns; 2<4***; 3<4***; | 1/2ns; 1<3*; 1/4ns; 2/3ns; 2/4ns; 3/4ns; | 1/2ns; 1<3**; 1/4ns; 2/3ns; 2/4ns; 3>4**; | 1/2ns; 1/3ns; 1/4ns; 2/3ns; 2/4ns; 3/4ns; |
Legend: RBC: erythrocyte count, Hb: hemoglobin concentration, PCV: packed cell volume (hematocrit value), MCV: mean corpuscular volume, MCH: mean corpuscular hemoglobin, MCHC: mean corpuscular hemoglobin concentration. Significance codes: *p < 0.05; **p < 0.01; ***p < 0.001; ns p > 0.05. Tukey HSD test: 1: spring; 2: summer; 3: autumn; 4: winter. Significance codes: *p < 0.05; **p < 0.01; ***p < 0.001; ns p > 0.05.
Table 12.
One-way ANOVA: tests of between-season differences (Adf: Season, Bdf: Residuals; MS: Mean square) for hematological parameters in European perch.
Table 12.
One-way ANOVA: tests of between-season differences (Adf: Season, Bdf: Residuals; MS: Mean square) for hematological parameters in European perch.
| RBC | Hb | PCV | MCV | MCH | MCHC | |
|---|---|---|---|---|---|---|
| A3: MS F (3.36) B36: MS |
0.120 22.84 *** 0.005 |
9.928 4.99 ** 1.988 |
53.51 3.02 * 17.72 |
748.5 0.75 ns 986.8 |
305.19 3.08 * 99.03 |
44.86 3.16 * 14.16 |
| Tukey HSD test | 1/2ns; 1>3***; 1/4ns; 2>3***; 2/4ns; 3<4***; | 1/2ns; 1/3ns; 1/4ns; 2/3ns; 2<4*; 3<4*; | 1/2ns; 1/3ns; 1/4ns; 2/3ns; 2/4ns; 3<4*; | 1/2ns; 1/3ns; 1/4ns; 2/3ns; 2/4ns; 3/4ns; | 1/2ns; 1/3ns; 1/4ns; 2<3*; 2/4ns; 3/4ns; | 1>2*; 1/3ns; 1/4ns; 2/3ns; 2/4ns; 3/4ns; |
Legend: RBC: erythrocyte count, Hb: hemoglobin concentration, PCV: packed cell volume (hematocrit value), MCV: mean corpuscular volume, MCH: mean corpuscular hemoglobin, MCHC: mean corpuscular hemoglobin concentration. Significance codes: *p < 0.05; **p < 0.01; ***p < 0.001; ns p > 0.05. Tukey HSD test: 1: spring; 2: summer; 3: autumn; 4: winter. Significance codes: *p < 0.05; **p < 0.01; ***p < 0.001; ns p > 0.05.
Table 13.
Principal component coefficients and percentages of variance of the examined hematological parameters.
Table 13.
Principal component coefficients and percentages of variance of the examined hematological parameters.
| Common carp | Prussian carp | European perch | ||||||||
| Parameter | PC1 | PC2 | PC1 | PC2 | PC1 | PC2 | ||||
| RBC | 0.316 | 0.209 | 0.56 | -0.155 | 0.194 | -0.183 | ||||
| Hb | 0.482 | 0.185 | 0.5 | 0.283 | 0.523 | 0.272 | ||||
| PCV | 0.487 | -0.126 | 0.476 | -0.273 | 0.534 | -0.309 | ||||
| MCV | 0.464 | -0.226 | -0.426 | -0.176 | 0.457 | -0.249 | ||||
| MCH | 0.461 | 0.151 | -0.121 | 0.614 | 0.44 | 0.435 | ||||
| MCHC | -0.064 | 0.912 | 0.116 | 0.643 | -0.026 | 0.739 | ||||
| Percentage of Variance | 68.92% | 19.16% | 50.07% | 38.48% | 47.49% | 29.33% | ||||
| Eigenvalue | 4.13 | 1.15 | 3 | 2.31 | 2.85 | 1.76 | ||||
Table 14.
Coefficients of linear discriminants and proportions of trace of discriminant models constructed with the examined hematological parameters (data in brackets represent standardized coefficients).
Table 14.
Coefficients of linear discriminants and proportions of trace of discriminant models constructed with the examined hematological parameters (data in brackets represent standardized coefficients).
| Common carp | Prussian carp | European perch | |||||||
| Parameter | LD1 | LD2 | LD3 | LD1 | LD2 | LD3 | LD1 | LD2 | LD3 |
| RBC | 16.053 | 135.890 | -67.950 | 29.563 | 18.390 | 44.601 | 79.038 | 18.585 | -33.174 |
| (1.023) | (8.661) | (-4.331) | (3.900) | (2.426) | (5.884) | (5.750) | (1.352) | (-2.413) | |
| Hb | 8.682 | -12.132 | -0.203 | -1.805 | -3.218 | 0.634 | -13.486 | -3.485 | -2.884 |
| (14.588) | (-20.385) | (-0.340) | (-2.192) | (-3.909) | (0.770) | (-19.013) | (-4.913) | (-4.066) | |
| PCV | -3.369 | -0.965 | 2.599 | -1.140 | 0.220 | -1.889 | 0.858 | 0.540 | 2.396 |
| (-17.714) | (-5.075) | (13.667) | (-2.761) | (0.534) | (-4.574) | (3.613) | (2.272) | (10.086) | |
| MCV | 0.661 | 0.195 | 0.186 | 0.099 | 0.151 | -0.015 | -0.064 | -0.022 | -0.313 |
| (20.948) | (6.166) | (5.886) | (2.178) | (3.308) | (-0.320) | (-2.000) | (-0.698) | (-9.835) | |
| MCH | -1.853 | 1.467 | -1.444 | 0.364 | -0.111 | 0.971 | 1.683 | 0.284 | 0.469 |
| (-18.161) | (14.384) | (-14.151) | (2.888) | (-0.877) | (7.699) | (16.752) | (2.829) | (4.663) | |
| MCHC | 1.187 | 0.022 | 3.826 | -0.184 | 1.270 | -2.389 | 0.261 | 0.137 | -0.284 |
| (1.962) | (0.036)) | (6.325) | (-0.796) | (5.493) | (-10.332) | (0.982) | (0.517) | (-1.068) | |
|
Proportion of trace |
0.578 | 0.346 | 0.075 | 0.935 | 0.042 | 0.022 | 0.935 | 0.052 | 0.012 |
| Eigenvalue | 1.357 | 0.812 | 0.176 | 6.214 | 0.280 | 0.147 | 6.951 | 0.389 | 0.091 |
Disclaimer/Publisher’s Note: The statements, opinions and data contained in all publications are solely those of the individual author(s) and contributor(s) and not of MDPI and/or the editor(s). MDPI and/or the editor(s) disclaim responsibility for any injury to people or property resulting from any ideas, methods, instructions or products referred to in the content. |
© 2026 by the authors. Licensee MDPI, Basel, Switzerland. This article is an open access article distributed under the terms and conditions of the Creative Commons Attribution (CC BY) license (http://creativecommons.org/licenses/by/4.0/).
Copyright: This open access article is published under a Creative Commons CC BY 4.0 license, which permit the free download, distribution, and reuse, provided that the author and preprint are cited in any reuse.


