

Submitted:
07 August 2026
Posted:
10 August 2026
You are already at the latest version
Abstract
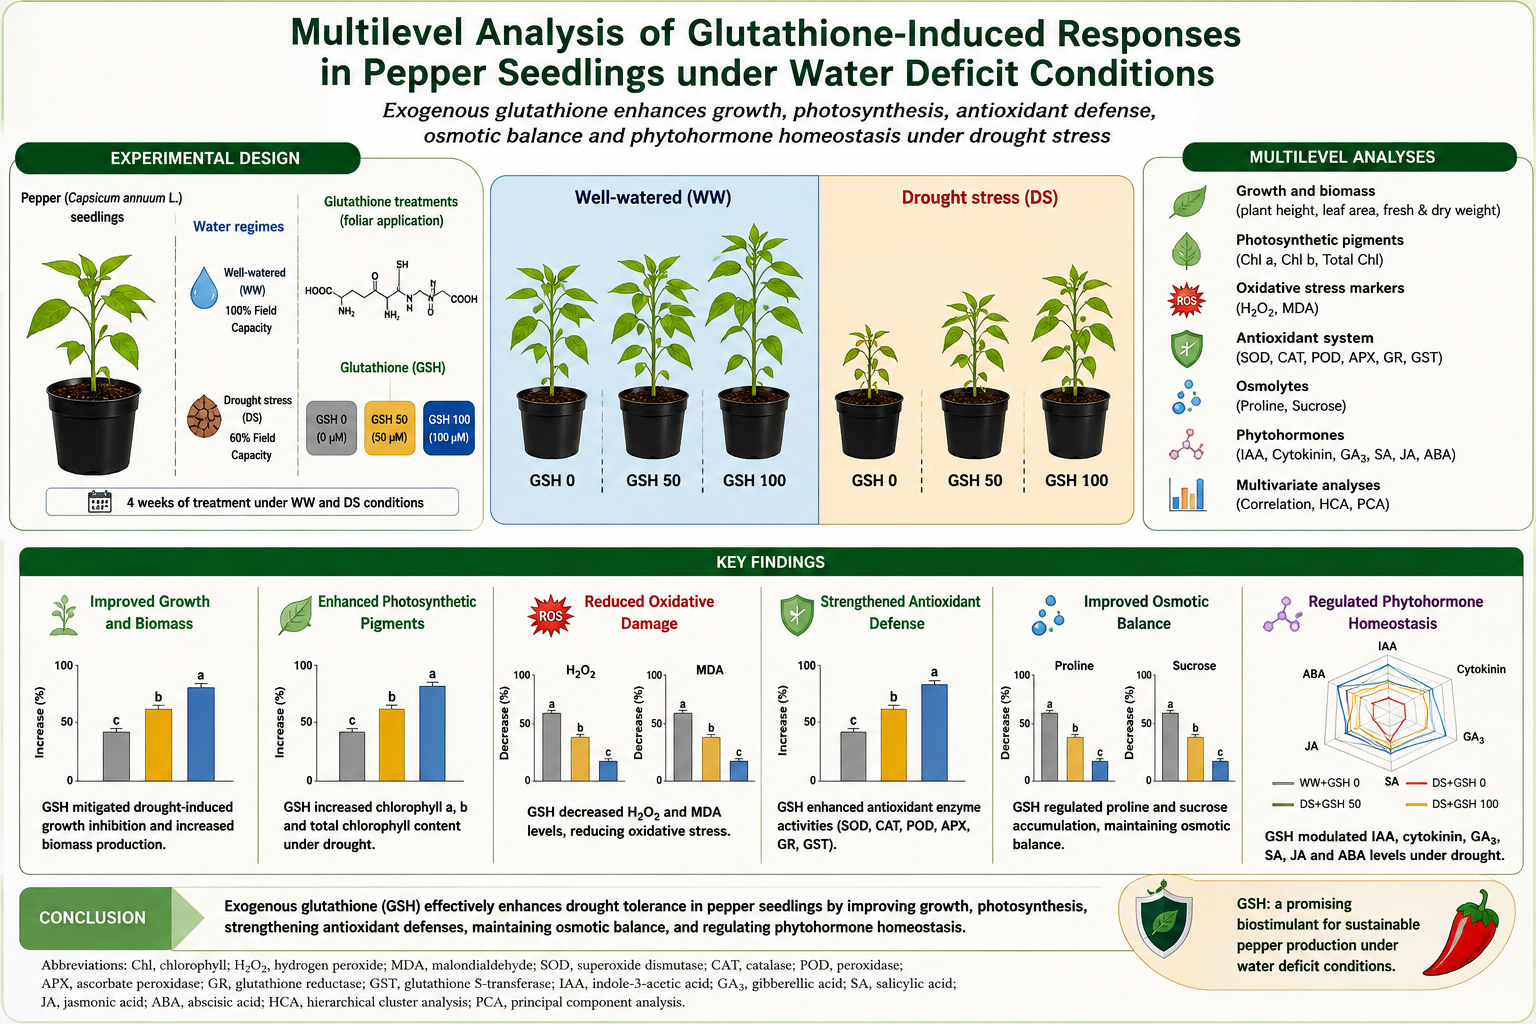
Drought stress is a major abiotic factor that negatively affects plant growth, physiological processes, and yield in pepper cultivation. This study evaluated the ameliorative effects of exogenous glutathione (GSH) at 50 µM and 100 µM in pepper seedlings grown under water-restricted conditions (60% field capacity), using morphological, physiological, and biochemical parameters. Water restriction caused significant reductions in seedling height, stem diameter, leaf area, and plant and root fresh and dry weights, and decreased chlorophyll a, chlorophyll b, and total chlorophyll content, as well as plant growth hormones. Conversely, water restriction significantly increased hydrogen peroxide (H₂O₂), malondialdehyde (MDA), proline, sucrose, and abscisic acid (ABA) content. Glutathione application, on the other hand, significantly reduced water-restriction-induced growth damage, increased biomass production and chlorophyll content, and supported the antioxidant defense capacity of plants by decreasing H₂O₂ and MDA levels, which are indicators of oxidative stress. It also improved osmotic balance by regulating proline and sucrose accumulation and increased seedling adaptation to water restriction. In conclusion, exogenous GSH is an effective and viable biostimulant for increasing drought tolerance in pepper seedlings and has significant potential for sustainable pepper cultivation under water-deficit conditions.
Keywords:
Capsicum annuum L.
; glutathione
; drought
; antioxidant system
; biostimulant
1. Introduction
Drought is a water deficiency resulting from a sustained decrease in precipitation and high evaporation rates, leading to insufficient moisture for normal plant growth and development [1]. Globally, drought is considered one of the most destructive factors reducing crop production, surpassing other environmental stressors, and poses the most serious threat to global food security and sustainable agriculture [2,3]. With global climate change, it is estimated that 50% of arable land could be affected by drought stress by 2050. Drought, which can cause losses of up to 70% depending on crop species, leads to economic damage as well as loss of agricultural land, desertification, ecosystem degradation, and food shortages, significantly impacting human health [4,5,6,7,8,9].
Drought is a complex, multifaceted stress that affects plants at the morphological, physiological, biochemical, and molecular levels [1,10]. Water deficiency causes turgor loss and inhibits cell expansion, leading to reduced plant height, smaller leaf area, leaf curling, premature senescence, and chlorosis. Plants may increase their root-to-stem ratio to optimize water uptake [2,5,7]. To conserve water, plants close their stomata and restrict CO2 uptake, reducing photosynthetic capacity, slowing the transpiration rate, and decreasing leaf relative water content and water potential [1,11,12]. Excessive accumulation of reactive oxygen species (ROS) in cells causes oxidative stress and damage to proteins, lipids, and DNA. In response, osmoprotectants such as proline, glycine betaine, and sugars accumulate, enhancing osmotic regulation and antioxidant enzyme activity [3,13,14]. These effects damage seed germination, seedling development, flowering, fruit set, and ripening, resulting in reduced plant growth, development, and yield [5,6,7].
Glutathione (GSH; γ-glutamyl-cysteinyl-glycine) is an important tripeptide thiol compound that is widely found in plant tissues, is low molecular weight, water soluble, and non-protein [15,16]. It plays a role in the plant defense system as a direct antioxidant and vital signaling molecule in cellular processes [17,18]. GSH is composed of the amino acid glutamate, cysteine, and glycine [19]. The bond between glutamate and cysteine in its structure is established via a γ-carboxyl group, and this special bond provides high stability by protecting the molecule from degradation by aminopeptidases [15,16]. Its biosynthesis involves a two-stage ATP-dependent process. In the first stage, the γ-glutamylcysteine synthetase (γ-ECS) enzyme, which is the rate-limiting step of the synthesis, combines glutamate and cysteine to form γ-glutamylcysteine [17,20]. In the second step, the GSH synthetase (GSHS or GS) enzyme synthesizes the final GSH molecule by adding glycine to γ-glutamylcysteine [19,20]. The fundamental mechanism of action of GSH is based on the redox (reduction-oxidation) capacity of its sulfhydryl (-SH) group [18]. GSH, as a key component of the ascorbate-glutathione cycle, provides electrons to convert oxidized ascorbate (DHA) back to its reduced form (AsA), and in the process, it itself is oxidized to the GSSG form [18,19,20,21]. It is the most important determinant of cellular redox status, and the GSH reductase (GR) enzyme reduces GSSG back to GSH using NADPH and maintains this balance [18,19,20]. It conjugates herbicides and xenobiotics through the glutathione S-transferase (GST) enzyme, trapping or inactivating them in the vacuole [15,18]. It plays a role in cell division, root meristem function, embryo development, and the regulation of flowering time [17,22]. It also has significant effects on plant stress tolerance. GSH has several functions in stressed plants, including directly scavenging ROS and coordinating stress tolerance as a signaling agent that regulates gene expression and metabolic processes [15,22]. In fact, exogenous GSH is used to mitigate the negative effects of various environmental stressors (drought, salinity, heavy metals, extreme temperatures, etc.), and exogenous GSH application promotes plant growth, maintains photosynthetic capacity, and stabilizes cellular redox balance.
GSH directly chelates certain metal ions and also serves as the precursor for phytochelatein biosynthesis [19,23]. When applied externally, it has been shown to promote growth by reducing lead (Pb) toxicity in wheat and chromium (Cr) toxicity in rice [23,24]. It is an important cofactor in the detoxification of methylglyoxal (MG), a toxic compound in stress [25]. MG is converted to D-lactate via the glyoxalase system (Gly I and Gly II enzymes) where GSH is used [15,25]. During drought, GSH is effective in regulating stomal conductance, maintaining tissue water content (RWC), and balancing plant water loss by increasing the levels of osmoprotectants such as proline [26,27]. GSH is effective in reducing heat-induced lipid peroxidation (MDA) and preventing chlorophyll degradation, thereby preserving photosynthetic capacity [18,27]. Furthermore, it helps maintain chloroplast membrane fluidity and stabilize antioxidant enzyme activities at low temperatures, thereby reducing cold damage [21,28].
Peppers are one of the most widely produced and consumed vegetable species in the world. Regular irrigation is crucial in their cultivation. Insufficient irrigation negatively affects all processes, from plant growth and development to fruit set and ripening. There is a lack of sufficient studies on the effect of exogenous GSH application on peppers under drought stress. In this study, the mechanism of action of exogenous GSH application on drought-stressed peppers at the morphological, physiological, and biochemical levels was investigated.
2. Results
According to the two-way ANOVA results, water regime (WR) and GSH application significantly affected most growth and morphological characteristics (Table 1). Specifically, the individual effects of WR and GSH were significant for plant height (PH), stem diameter (SD), leaf area (LA), plant and root fresh weights (PFW and RFW), and plant and root dry weights (PDW and RDW) (p<0.001). However, chlorophyll content (CC-SPAD) was not statistically affected by the applications (Table 1). A significant interaction was observed between WR and GSH for SD (p<0.05), LA (p<0.001), PFW (p<0.001), RFW (p<0.001), PDW (p<0.05), and RDW (p<0.001). However, the interaction effect on PH was not significant (Table 1).
PH, SD, and LA were significantly inhibited under drought stress (DS) but markedly improved with exogenous GSH application (Figure 1a, c, d). Under adequate irrigation (WW), both PH and LA consistently increased with high GSH doses. Compared to the GSH-free control (WW+GSH0; PH: 15.17 cm; LA: 155.43 cm² plant⁻¹), the 100 µM GSH application (WW+GSH100) yielded the highest values (PH: 19.13 cm; LA: 269.58 cm² plant⁻¹), representing increases of approximately 26% and 73%, respectively (Figure 1a, d). Stem diameter was highest in WW+GSH50 (3.48 cm) (Figure 1c). Shoot and root biomass were highest in WW+GSH100 (Figure 1e–h; Figure 2). 100 µM GSH increased PFW from 6.05 to 8.88 g (~47%) and PDW from 0.43 to 0.70 g (~63%) per plant compared to untreated controls (Figure 1e, g). Under drought conditions, all vegetative parameters were lowest in DS+GSH0, but GSH supplementation mitigated these reductions (Figure 1a–h; Figure 2a). PH and LA per plant decreased to 12.07 cm and 110.17 cm², respectively, in DS+GSH0. PH increased by approximately 22% with 100 µM GSH (DS+GSH100). LA was significantly higher at 137.75 cm² per plant with 100 µM GSH (DS+GSH100) (Figure 1a, d). Stem diameter also increased by approximately 15% in DS+GSH100 compared to DS+GSH0 (Figure 1c). Biomass accumulation was lowest in DS+GSH0, but GSH provided a significant increase, as shown in the extended radar profiles (Figure 1e–h; Figure 2a). PFW and PDW increased by approximately 35% and 54%, respectively, in DS+GSH100, while RFW and RDW were approximately 54% and 39% higher compared to DS+GSH0 (Figure 1e–h). Overall, the growth and biomass results (Figure 1a–h), together with the comprehensive view obtained from the radar graphs, show that foliar application of GSH (especially at 100 µM) significantly increased the developmental vigor of pepper plants (Figure 1a–h; Figure 2; Table 1). The large increase in radar field at DS+GSH100, compared to the highly mitigating effect of DS+GSH0, demonstrates that GSH is significantly effective in reducing drought-induced growth suppression and supporting biomass stability (Figure 1a–h; Figure 2a).
According to the two-way ANOVA results, WR significantly affected chlorophyll a, chlorophyll b, and total chlorophyll content (p < 0.001). GSH application had a significant effect on chlorophyll b and total chlorophyll (p < 0.001), but its effect on chlorophyll a was not statistically significant. A significant WR × GSH interaction was found specifically for chlorophyll b (p < 0.001), while the interaction did not significantly affect chlorophyll a and total chlorophyll content (Table 1). Drought stress significantly reduced pigment content, but exogenous GSH increased it in both water regimes (Figure 3 a–c). Under WW conditions, the highest pigment levels occurred in WW + GSH 100. Compared to WW + GSH 0, 100 µM GSH increased chlorophyll b by 25,78% (to 3.98 mg g⁻¹) and total chlorophyll by 9,92% (to 9.64 mg g⁻¹) (Figure 3b, c). Chlorophyll a was also highest at WW + GSH 100 (5.66 mg g⁻¹), but its increase was only 0.96% compared to WW + GSH 0 (Figure 3a). In DS plants, the lowest levels of significantly reduced pigment content were observed at DS + GSH 0 (Figure 3a, c). GSH treatment increased chlorophyll content; in DS + GSH 50, chlorophyll b reached 3.76 mg g⁻¹ (+17.43%) and total chlorophyll reached 8.41 mg g⁻¹ (+11.16%) (Figure 3b, c). In DS + GSH 100 treatment, chlorophyll a and total chlorophyll reached 4.68 mg g⁻¹ and 8.16 mg g⁻¹, respectively, showing increases of 7.10% and 7.92% compared to DS + GSH 0 treatment (Figure 3 a-c). Radar graphs further confirmed these patterns, with wider radar fields in WW + GSH 100 and DS + GSH 50/GSH 100 treatments indicating increased pigment levels (Figure 3 a-c; Figure 2b).
According to the two-way ANOVA results, WR, GSH, and their interaction (WR × GSH) showed significant effects (p<0.001) on hydrogen peroxide (H₂O₂) and malondialdehyde (MDA) (Table 1). Under WW conditions, 100 µM GSH reduced H₂O₂ levels from 8.93 mmol kg⁻¹ in WW+GSH0 to 6.04 mmol kg⁻¹ in WW+GSH100, representing a 32.41% decrease. MDA, on the other hand, slightly increased from 15.44 to 18.93 mmol kg⁻¹ under the same treatments (Figure 4a). Under DS, oxidative stress markers were highest in untreated DS+GSH0, with H₂O₂ (17.14 mmol kg⁻¹) and MDA (37.22 mmol kg⁻¹) values. GSH supplementation significantly mitigated this damage, reducing H₂O₂ and MDA levels in DS+GSH100 to 8.57 and 20.85 mmol kg⁻¹, respectively, representing a decrease of approximately 50% and 44% compared to DS+GSH0 (Figure 4a, b).
The accumulation of proline and sucrose was significantly affected by both WR and GSH (p<0.001). A significant interaction was observed between WR and GSH for sucrose (Table 1). Under WW conditions, proline levels increased from 0.04 mmol kg⁻¹ in WW+GSH0 to 0.07 mmol kg⁻¹ in WW+GSH100, showing an increase of 109.87%. Similarly, sucrose levels increased from 0.17% to 0.84%, showing an increase of 406.20% (Figure 4c, d). This stimulating effect intensified under DS. Proline and sucrose in DS+GSH100 reached 0.10 mmol kg⁻¹ and 1.90%, respectively, showing increases of 97.55% and 200.30% compared to DS+GSH0 (Figure 4c, d).
GSH significantly increased the activities of antioxidant enzymes SOD, CAT, and POD under both WW and DS conditions (p<0.001), with marked WR × GSH interactions observed for SOD and CAT (Table 1). Under irrigation conditions, 100 µM GSH increased the activities of SOD, CAT, and POD increased by 87.60%, 106.51%, and 164.57%, respectively (Figure 4e–g). While DS alone increased primary antioxidant activity, GSH provided an additional significant increase. In DS+GSH100, SOD, CAT, and POD activities reached 164.56, 2252.44, and 167.17 EU g⁻¹ FW, respectively, showing increases of 20.99%, 141.72%, and 52.73% compared to DS+GSH0 (Figure 4e–g).
Integrated radar field analysis confirmed these findings, demonstrating that GSH's suppression of oxidative markers, along with a simultaneous increase in osmoprotective and antioxidant enzyme systems, contributed to higher physiological resilience (Figure 4a–g; Figure 2c and d). The significant broadening of the radar field in DS+GSH100 compared to DS+GSH0 highlights that the 100 µM dose effectively enhances stress tolerance and maintains cellular homeostasis under water-deficient conditions (Figure 4a–g; Figure 2c and d).
ANOVA results showed that WR, GSH administration, and their interaction (WR × GSH) had highly significant effects on the endogenous levels of all measured phytohormones, including indole-3-acetic acid (IAA), cytokinin, abscisic acid (ABA), gibberellic acid (GA), salicylic acid (SA), and jasmonic acid (JA) (Table 1).
Under WW conditions, GSH application significantly increased growth-related hormone levels. IAA levels increased from 1.75 ng/mg in the control group (GSH0) to 11.93 ng/mg with 50 µM GSH and to 23.03 ng/mg with 100 µM GSH, showing increases of 580.95% and 1214.85%, respectively (Figure 5a,b). Cytokinin levels similarly increased from 0.74 ng/g DW in the WW+GSH0 group to 5.00 ng/g DW in the WW+GSH100 group, showing an increase of 580.72% (Figure 5a, b). Drought stress (DS) caused a significant decrease in these hormones, with cytokinin levels falling to 0.16 ng/g dry weight in untreated DS+GSH0 plants. However, GSH supplementation led to a significant improvement; in the DS+GSH100 group, IAA and cytokinin levels increased to 2.55 ng/mg and 1.96 ng/g dry weight, respectively, representing increases of 173.95% and 1135.85% compared to the untreated drought control (Figure 5a, b).
ABA levels were significantly affected by the treatments, with drought stress causing a high increase to 233.12 ng/g DW in the DS+GSH0 group (Figure 5c). Under WW conditions, the addition of 50 µM GSH reduced ABA content from 114.13 to 72.99 ng/g DW, a decrease of 36.04%. The 100 µM GSH dose (115.63 ng/g DW) did not differ significantly from the control group (Figure 5c). Conversely, under DS, GSH application effectively reduced stress-induced ABA levels, with ABA in the DS+GSH100 group decreasing by 12.55% to 203.87 ng/g DW compared to untreated drought crops (Figure 5c).
GSH applications significantly increased GA, SA, and JA levels under both irrigation conditions (Figure 5d–f). In WW plants, a 100 µM GSH treatment increased GA by 237.31% (7.35 ng/g DW), SA by 415.12% (2.88 ng/g DW), and JA by 13.34% (0.61 ng/g DW) relative to the WW+GSH0 control (Figure 5d–f). Under DS, SA (0.14 ng/g DW) and JA (0.14 ng/g DW) were lowest in the DS+GSH0 group. Under DS, 100 µM GSH significantly increased these levels, with GA 44.04%, SA 1291.59%, and JA 222.25% higher than in the DS control (Figure 5d–f).
Radar plot analysis confirms that GSH-regulated growth and defense hormones contribute to a stronger and more resilient physiological state (Figure 5a–f; Figure 2e). The extended radar profile in the DS+GSH100 group compared to the untreated DS group shows that the 100 µM GSH dose effectively balances hormones and increases drought resistance (Figure 5a–f; Figure 2e).
Pearson correlation analysis revealed strong and highly significant relationships between morphological, physiological, and biochemical characteristics of pepper plants (Figure 6; Table S1). Growth and biomass parameters such as PH, SD, LA, PDW, and RDW were closely related, with correlation coefficients of at least 0.93 (p<0.001). These vegetative growth characteristics also showed significant positive correlations with photosynthetic pigments, particularly total chlorophyll content (r≥0.94, P<0.01), and growth-promoting hormones such as IAA (r=0.88, P<0.05 for PH) and GA (r=0.82, P<0.05 for PH). In contrast, growth performance was negatively affected by the stress hormone ABA, which was inversely correlated with RDW (r=−0.93, P<0.01) and PFW (r=−0.90, P<0.05). Oxidative stress markers H2O2 and MDA also showed significant negative correlations with various growth and hormonal parameters, particularly with JA (r = -0.93, P < 0.01) (Figure 6; Table S1). The biochemical defense system showed a high correlation, with osmolytes (proline and sucrose) and antioxidant enzymes (CAT and POD) showing a positive correlation. Sucrose content showed a positive correlation with CAT activity (r=0.99, p<0.001), while proline was strongly associated with both CAT (r=0.94, p<0.01) and POD activities (r=0.95, p<0.01) (Figure 6; Table S1).
Hierarchical clustering analysis of the treatments revealed three distinct main groups based on their overall physiological and biochemical profiles (Figure 7). Group 1 included well-irrigated treatments supplemented with exogenous GSH (WW+GSH50 and WW+GSH100). Group 2 consisted of a well-irrigated control group without GSH application (WW+GSH0). Group 3 integrated all DS treatments (DS+GSH100, DS+GSH0, and DS+GSH50). Within the DS group, the DS+GSH100 treatment formed a separate sub-cluster exhibiting a different grouping pattern compared to the DS+GSH0 and DS+GSH50 treatments (Figure 7).
The variable dendrogram grouped the measured parameters into three main clusters based on their response patterns across the treatments (Figure 7). Cluster 1 (shown in green) integrated growth-related parameters (PH, LA, PFW, PDW, RFW, RDW, SD), photosynthetic pigments (Chl-a, Chlo-b, Total Chl), and growth-promoting phytohormones (IAA, GA, Cytokinin, SA, JA). Cluster 2 (shown in blue) included biochemical components associated with antioxidant defense and osmotic regulation, particularly sucrose, proline, and CAT and POD activities. Cluster 3 (shown in orange) grouped oxidative stress markers (H2O2, MDA), the stress hormone ABA, and other physiological stress indicators (SOD, CC) (Figure 7).
The heat map showed that well-irrigated groups (Group 1 and Group 2) had higher values for Cluster 1 variables and lower values for Cluster 3 variables (Figure 7). In contrast, groups under DS that lacked GSH or had low GSH content (DS+GSH0 and DS+GSH50) showed the highest intensities for oxidative damage markers and ABA (Cluster 3), while exhibiting the lowest levels for growth and pigment parameters (Cluster 1). DS+GSH100 application exhibited a different profile, characterized by high levels for Cluster 2 variables (antioxidants and osmolytes) compared to other DS groups (Figure 7).
Multivariate relationships between experimental applications and measured variables were further elucidated by three-dimensional principal component analysis with Varimax rotation (3D PCA), where the first three components (RPC1, RPC2, and RPC3) explain a significant portion (93.22%) of the total cumulative variance (Table 2). RPC1, explaining 35.57% of the variance, is primarily defined by high positive loadings for growth-promoting hormones and plant traits, particularly IAA (0.9219), GA (0.8897), cytokinin (0.8472), and leaf area (0.8172), representing the plant's developmental vigor and hormonal optimization (Table 2). RPC2, explaining 21.75% of the variance, was characterized by strong negative loadings for defense-related biochemical parameters, including proline (-0.9692), sucrose (-0.9478), and CAT activity (-0.9665), thus reflecting the status of osmoprotective and antioxidant scavenging systems (Table 2). RPC3, explaining an additional 35.91% of the variance, highlighted the balance between structural/pigment integrity and oxidative damage. It showed high positive loadings for JA (0.8963), Chl-α (0.8168), and RDW (0.7742), in contrast to high negative loadings for MDA (-0.9753), ABA (-0.8319), and H₂O₂ (-0.7631) (Table 2).
The spatial distribution of treatments in the 3D PCA biplot showed a clear separation according to WR and GSH application (Figure 8). Well-watered (WW) groups were clearly separated from DS groups. WW+GSH100 application exhibited the strongest association with the positive vectors of RPC1 and RPC3, consistent with maximum leaf area, photosynthetic pigments, and growth-promoting phytohormones (Figure 8). In contrast, untreated drought plants (DS+GSH0) were located close to the vectors of H₂O₂, MDA, and ABA, confirming the severe oxidative stress and growth restriction associated with this group (Figure 8). Specifically, GSH supplementation (DS+GSH100) under water deficiency caused a marked shift in the PCA space away from indicators of oxidative stress towards vectors representing antioxidant enzymes and osmolytes, demonstrating a systemic restructuring of the plant's physiological and biochemical defense profile (Figure 8).
PCA results successfully distinguished the experimental groups and demonstrated that the biological changes caused by GSH were dose-dependent and highly coordinated (Table 2; Figure 8). The strong concordance of the WW+GSH100 and DS+GSH100 groups with growth-promoting and stress-reducing variables, respectively, confirms that GSH application optimizes hormonal balance and strengthens cellular defense mechanisms (Table 2; Figure 8). This multidimensional distribution demonstrates that high loading values for growth characteristics and enzymes directly reflect the superior performance and resilience of GSH-treated plants. The isolation of the DS+GSH0 group highlights the dominance of stress markers under untreated drought conditions (Table 2; Figure 8).
4. Discussion
This study investigated the effects of exogenous GSH application on water-restricted pepper seedlings and determined that GSH mitigated the reduced plant growth and development caused by water restriction. In the study, seedling height, stem diameter, and leaf area were significantly reduced in pepper seedlings. The most prominent effect of drought stress on plant growth is the suppression of growth parameters [29,30]. Due to drought, decreased water potential in cells reduces turgor pressure and inhibits cell wall elasticity and cell expansion, resulting in reduced plant height and stem thickness [29,31]. In addition, drought stress slows down activity in meristematic tissues, restricting cell number increase and leading to a decline in plant growth [32,33]. Furthermore, reduced leaf area is the most critical determinant of photosynthetic capacity and water loss in plants. In water stress situations, plants reduce leaf area to minimize water loss through transpiration. This is a defense strategy developed by the plant to conserve its water capacity [1,34]. Even mild drought conditions cause leaf cells to stop elongating in plants, leading to the formation of smaller leaves. It also accelerates leaf senescence, causing existing leaves to fall off and shrink [12,35,36]. In the study, water restriction resulted in a significant decrease in plant biomass (fresh and dry weights of plants and roots). Stress-induced stomatal closure decreases the amount of CO2 inside the leaf, thus slowing the rate of photosynthesis and reducing the amount of net assimilation products [1,37]. Drought reduces the activity of key enzymes responsible for carbon fixation, such as Rubisco, and causes oxidative damage to the photosynthetic apparatus, preventing the synthesis of structural components such as proteins and carbohydrates, leading to fresh and dry weight loss [12,38]. Decreased synthesis of polysaccharides such as cellulose, hemicellulose, and pectin, which make up the stem cell wall, due to drought inhibits stem cell growth and the formation of new root hairs, leading to a decrease in root biomass [1,39]. Furthermore, reduced water and nutrient uptake due to drought negatively affects root tissue development [4,40]. Morphological reductions in pepper seedlings due to water restriction result from cessation of cell expansion due to low turgor, decreased photosynthesis due to stomatal closure, and insufficient assimilates.
Water restriction decreased chlorophyll content (a, b, and total) in pepper leaves. One reason for the decreased chlorophyll amount due to drought is oxidative stress caused by excessive accumulation of ROS in the cells [29,38]. ROS such as superoxide radicals and hydrogen peroxide produced by stress cause lipid peroxidation in chloroplast membranes, disrupting membrane stability and leading to chlorophyll degradation [41,42]. Reduced CO2 influx due to stomatal closure leads to electron accumulation in photosystems and photo-oxidation of chlorophyll pigments [11,43]. Drought not only breaks down chlorophyll but also halts the synthesis of new chlorophyll molecules at different stages. This is because the activity of key enzymes in the chlorophyll biosynthesis pathway decreases due to water deficiency [1], while enzymes that accelerate the natural degradation processes of chlorophyll (chlorophyllase, pheophytinase, etc.) increase, thus accelerating pigment loss in leaves [12]. Furthermore, drought and insufficient uptake of elements such as magnesium (Mg), a key component of the chlorophyll molecule, and iron (Fe), which plays a role in its synthesis, from the soil are other reasons for the decrease in chlorophyll [44,45]. In this study, the decrease in chlorophyll in pepper seedlings resulted from ROS-induced membrane degradation, enzymatic chlorophyll degradation, and arrests during the synthesis phase.
Increases in H2O2, MDA, proline, sucrose, and ABA content in pepper plants under drought stress are key indicators of the plant's response and adaptation mechanisms to oxidative damage. The fastest and most fundamental response to drought stress is ABA synthesis [7,46]. Decreased soil water potential accelerates ABA biosynthesis, transporting it through the xylem to the leaves, activating Ca channels in guard cells, and closing stomata. This is a defense strategy to minimize water loss through transpiration [5,29,47,48]. Drought stress triggers ROS production in cells, leading to oxidative stress [10,38]. Reduced CO2 fixation due to closed stomata causes electron accumulation, the formation of superoxide (O2-) anion, which is then converted by enzymes into the more stable H2O2 [1,12]. Accumulation of H2O2 and hydroxyl radicals in cells disrupts cell membrane integrity and releases the breakdown product MDA. High MDA levels are an indicator of drought damage to the plant [7,46]. Proline, which accumulates in the cell cytoplasm, lowers the intracellular water potential, thus retaining water in the cell and maintaining turgor pressure [49,50], while also acting as a ROS scavenger, membrane stabilizer, and protein protector [51,52]. In drought conditions, stored starch is converted into soluble sugars such as sucrose and glucose to maintain osmotic balance in plants [1,53]. These sugars replace water molecules, stabilizing the structure of proteins and membrane phospholipids, thus preventing excessive drying and cell collapse [12]. In conclusion, in peppers, increased ABA during water restriction acts as a signal for stress perception and water conservation, while the production of H2O2, another byproduct and secondary messenger of stress, increases. Stress-induced damage increases MDA, and the accumulation of proline and sucrose indicates that the plant is trying to maintain turgor under harsh conditions; these are defense compounds developed to stabilize the cell. In this study, reduced growth in pepper seedlings is a consequence of the plant's survival and water conservation mechanisms. Increased ABA biosynthesis under drought stress reduces the expression and levels of genes involved in the biosynthesis of growth-regulating cytokinins, auxins, and gibberellins [3]. The reductions in seedling height, stem diameter, and leaf area that we observed in pepper seedlings are directly related to the inability to synthesize these growth hormones or their enzymatic destruction.
These negative effects of drought on pepper seedlings were mitigated by exogenously applied GSH, which supported growth under stressful conditions. In pepper plants, the increased tolerance to drought stress provided by GSH is based on a multi-layered mechanism involving strengthening the antioxidant defense system, regulation of hormonal balance, osmotic adaptation, and preservation of morphological structures. GSH is a low-molecular-weight metabolite involved in the antioxidant defense system of plants. Previous studies have reported that exogenous GSH upregulates AsA-GSH cycle-related genes under abiotic stresses [16,28]. This increase in genes is effective in raising the activity of enzymes such as APX and GR, and in clearing H2O2 and superoxide anions accumulated in cells [21,28]. Similarly, treatment with GSH in chickpeas under drought conditions increased chlorophyll synthesis and antioxidant enzyme activity [54]. It has been reported that GSH administration prevents lipid peroxidation (MDA) by reducing H2O2 levels [11,25]. In another study, the effect of GSH applied to seedlings on increasing tolerance by reducing lipid peroxidation caused by salt stress in tomato was significant [55]. Similar results have been obtained in studies showing that externally applied GSH increases tolerance to drought conditions in plants. Indeed, it has been descripted that, GSH increased plant height, biomass and chlorophyll content, while MDA decreased [16,56]. It reduces electrolyte leakage by protecting the cell membrane and prevents oxidative damage by preserving the structural integrity of cells [16,24]. GSH helps maintain relative water content, turgor pressure, and cell dehydration by regulating proline and total soluble sugar levels [51,57,58]. In this study, GSH application may have contributed to hormonal regulation in pepper plants. Indeed, it has been stated that GSH determines the overall growth strategy of the plant by interacting with the signaling pathways of hormones such as ABA, auxin and JA [59,60]. Endogenous GSH stimulates cell division (mitosis) in the root meristematic zone, increasing root elongation and absorption surface area [57,61]. This may allow access to deeper water during drought. It maintains plant biomass production by conserving photosynthetic pigments (chlorophyll a, b) and increasing APX/GR activities; this results in improved seedling height, fresh and dry weight, and leaf area [16,21]. Under stress conditions, GSH application increased survival rate and yield in maize, while in wheat, it strengthened antioxidant defense capacity, mitigating drought-induced damage and growth retardation [57,62]. In mung beans, it was observed to protect the plant by coordinating both the antioxidant defense system and the glyoxalase system that clears cytotoxic methylglyoxal [27]. The results we obtained from the study were along similar lines.
4. Materials and Methods
In the study, pepper (Capsicum annuum L. cv. Tatı sivri) seeds were initially sown in a peat:perlite (2:1/v:v) mixture. After approximately 30 days, seedlings were transferred to 1.5-liter pots containing soil:peat:sand (1:1/v:v:v). Applications were carried out by spraying a Glutathione (Sigma-Aldrich) solution (prepared with 1% Tween 20) at 50 µM and 100 µM onto the leaves. Glutathione treatments began 3 days after seedling planting and were repeated three times at one-week intervals. Irrigation was carried out at 100% and 60% of field capacity, based on soil moisture measurements (Wet Sensor, Delta-T Devices). After seedling planting, all pots were brought to field capacity, and deficit irrigation began after the first GSH application. The study concluded after 40 days of transplanting, and morphological, physiological, and biochemical analyses were performed.
The study was conducted using a randomized plot design with a total of 108 plants, comprising three replicates, two irrigations well-watered (WW, 100%) and drought stress (DS, 60% field capacity)), three GSH doses (GSH0:0 (control), GSH50:50 µM, and GSH100:100 µM), and 6 plants per replicate.
In all plants within each replicate, measurements were taken for plant height, stem diameter, plant fresh weight, plant dry weight, root fresh weight, and root dry weight. Leaf area was measured using an area meter (CI-202 Portable Laser Leaf Area Meter, CID Bio-Science, USA). Chlorophyll a, chlorophyll b, and total chlorophyll content in fresh leaf samples from each replicate were measured with a spectrophotometer at wavelengths of 645 and 663 nm and calculated as mg g-1 fresh weight.
For biochemical analyses, fresh leaf samples stored at -80°C were used. To measure H₂O₂, samples were extracted in trichloroacetic acid (TCA) and then centrifuged at 12,000 × g for 15 minutes at 4°C. Potassium phosphate buffer (pH 7.0) and potassium iodate (KI) were then added to the supernatant, and the absorbance was measured at 390 nm. A standard curve was used to calculate the H₂O₂ content [63].
To determine malondialdehyde (MDA) content, samples were homogenized in TCA and reacted with thiobarbituric acid (TBA). Absorbance was measured at 450, 532, and 600 nm using a spectrophotometer (Thermo Scientific™ Multiskan™ GO Microplate Spectrophotometer), and MDA concentration was calculated using an extinction coefficient of 155 mM⁻¹ cm⁻¹ [64].
Proline content was measured according to the method of Bates et al. [65]. Fresh leaf samples were centrifuged in sulfosalicylic acid, and the reaction mixture was incubated with acid ninhydrin and glacial acetic acid at 95 °C for 70 minutes. Absorbance was measured at 520 nm, and proline concentration was determined from a calibration curve.
Sucrose content was analyzed according to the method of Liu and Huang [66]. Leaf samples were collected in ethanol, and absorbance was measured using spectrophotometry. Sucrose concentration was determined according to a standard calibration curve.
To determine the activity of antioxidant enzymes catalase (CAT), peroxidase (POD), and superoxide dismutase (SOD), fresh plant leaf samples were powdered by adding liquid nitrogen to a mortar, then centrifuged at 15000 g and 4°C for 15 minutes after adding cold homogenization buffer. The supernatant obtained after centrifugation was used as a source for measuring antioxidant enzyme activity [67,68]. For CAT, the decrease in absorbance occurring during the conversion of H2O2 in the medium to O2 and H2O was read at 240 nm [69], and the results were calculated as enzyme units per g of leaf (EU g leaf-1) [70]. For POD, the increase in absorbance caused by the colored compound, the product of the reaction with guaiacol H2O2 as the substrate, was monitored at 470 nm [67] and the results were expressed as enzyme units per leaf (EU g leaf-1)) [71]. For SOD, it was determined spectrophotometrically at 560 nm by inhibiting the photochemical reduction of nitro blue tetrazolium, and the values were calculated as EU g leaf-1 [72,73].
Plant samples for hormone analysis were purified using the method first described by Kuraishi et al. [74], and hormone contents were separated using a Zorbax Eclipse-AAA C-18 column on an Agilent 1200 HPLC instrument as described by Turan et al. [75] (2014) and determined with a UV detector.
The obtained data were analyzed using R software. Treatment effects were evaluated using one-way analysis of variance (ANOVA), and mean comparisons were made using Tukey's HSD test at a 5% significance level (P < 0.05). Results are presented as mean ± standard error (SE). Pearson correlation analysis was performed to determine the relationships between the measured parameters. In addition, principal component analysis (PCA) with Varimax rotation and hierarchical clustering analysis based on Euclidean distance and Ward's method were performed to investigate multivariate relationships between treatments and variables. Graphical visualizations were created using the ggplot2, pheatmap, plotly, and fmsb packages in R. For each group of functional parameters, radar plots were created from treatment means using fmsb, and minimum-maximum values were normalized between treatments (0-1).
5. Conclusions
Water deficit markedly reduced the growth, photosynthetic performance, and physiological status of pepper seedlings by increasing OD and altering hormone balance. Our findings demonstrate that glutathione had significant protective effects, especially at 100 µM, against these harmful impacts by enhancing antioxidant defenses and osmotic adjustment to salt-stress damage, preserving chlorophyll content, and stimulating growth-associated phytohormones while decreasing ABA (abscisic acid) accumulation. A coordinated physiological response associated with enhanced water-stress resistance was confirmed by multivariate analyses and attributed to the action of both GSH and its precursor(s). Taken together, these results indicate that exogenous glutathione is an effective biostimulant that increases drought tolerance in pepper and may be a sustainable approach to vegetable production under conditions of limited water supply. These findings should be further validated in the field, and additional studies are needed to determine how GSH functions quantitatively at the molecular level to enable crops to tolerate drought.
Supplementary Materials
The following supporting information can be downloaded at Table S1
Author Contributions
M.E., E.Y. (Esma Yigider), E.Y. planned and designed the research. S.O., M.E, E.Y. (Esma Yigider) performed experiments. ME, E.Y. (Esma Yigider), M.A., M.T., S.O. performed analysis. M.A., M.E., E.Y. performed data analysis. M.E., M.A., E.Y. wrote draf manuscript. All authors reviewed, edited and approved the final manuscript.
Funding
This research received no external funding
Data Availability Statement
The data supporting this study can be shared upon reasonable request.
Conflicts of Interest
The authors declare no conflicts of interest.
Abbreviations
The following abbreviations are used in this manuscript:
| GSH | Glutathione |
| ROS | Reactive oxygen species |
| H2O2 | Hydrogen peroxide |
| MDA | Malondialdehyde |
| CAT | Catalase |
| POD | Peroxidase |
| SOD | Superoxidase |
| ABA | Abscisic acid |
| IAA | Indole acetic acid |
| GA | Gibberellic acid |
| JA | Jasmonic acid |
References
- Farooq, M.; Hussain, M.; Wahid, A.; Siddique, K. H. M. Drought stress in plants: an overview. Plant Responses to Drought Stress: From Morphological to Molecular Features. 2012, 1–33. [Google Scholar] [CrossRef]
- Anjum, S. A.; Ashraf, U.; Zohaib, A.; Tanveer, M.; Naeem, M.; Ali, I.; Tabassum, T.; Nazir, U. Growth and development responses of crop plants under drought stress: a review. Zemdirbyste-Agriculture 2017, 104, 267–276. [Google Scholar] [CrossRef]
- Wahab, A.; Abdi, G.; Saleem, M. H.; Ali, B.; Ullah, S.; Shah, W.; Mumtaz, S.; Yasin, G.; Muresani, C.C.; Marc, R. A. Plants’ physio-biochemical and phyto-hormonal responses to alleviate the adverse effects of drought stress: A comprehensive review. Plants 2022, 11(13), 1620. [Google Scholar] [CrossRef] [PubMed]
- Rouphael, Y.; Cardarelli, M.; Schwarz, D.; Franken, P.; Colla, G. Effects of drought on nutrient uptake and assimilation in vegetable crops. In Plant responses to drought stress: from morphological to molecular features; Springer Berlin Heidelberg: Berlin, Heidelberg, 2012; pp. 171–195. [Google Scholar] [CrossRef]
- Hussain, S.; Hussain, S.; Qadir, T.; Khaliq, A.; Ashraf, U.; Parveen, A.; Sagib, M.; Rafiq, M. Drought stress in plants: An overview on implications, tolerance mechanisms and agronomic mitigation strategies. Plant Sci. Today 2019, 6(4), 389–402. [Google Scholar] [CrossRef]
- Begna, T. Effects of drought stress on crop production and productivity. Int. J. Res. Stud. Agric. Sci. 2020, 6(9), 34–43. [Google Scholar] [CrossRef]
- Seleiman, M. F.; Al-Suhaibani, N.; Ali, N.; Akmal, M.; Alotaibi, M.; Refay, Y.; Battaglia, M. L. Drought stress impacts on plants and different approaches to alleviate its adverse effects. Plants 2021, 10(2), 259. [Google Scholar] [CrossRef] [PubMed]
- Khan, Z.; Jan, R.; Asif, S.; Farooq, M.; Jang, Y. H.; Kim, E. G.; Kim, K. M. Exogenous melatonin induces salt and drought stress tolerance in rice by promoting plant growth and defense system. Sci. Rep. 2024, 14(1), 1214. [Google Scholar] [CrossRef] [PubMed]
- Şimşek, Ö.; Isak, M. A.; Dönmez, D.; Dalda Şekerci, A.; İzgü, T.; Kaçar, Y. A. Advanced biotechnological interventions in mitigating drought stress in plants. Plants 2024, 13(5), 717. [Google Scholar] [CrossRef] [PubMed]
- Kaur, G.; Asthir, B. Molecular responses to drought stress in plants. Biol. Plant. 2017, 61(2), 201–209. [Google Scholar] [CrossRef]
- Oguz, M. C.; Aycan, M.; Oguz, E.; Poyraz, I.; Yildiz, M. Drought stress tolerance in plants: interplay of molecular, biochemical and physiological responses in important development stages. Physiologia 2022, 2(4), 180–197. [Google Scholar] [CrossRef]
- Zahra, N.; Hafeez, M. B.; Kausar, A.; Al Zeidi, M.; Asekova, S.; Siddique, K. H.; Farooq, M. Plant photosynthetic responses under drought stress: Effects and management. J. Agron. Crop Sci. 2023, 209(5), 651–672. [Google Scholar] [CrossRef]
- Hernández, I.; Cela, J.; Alegre, L.; Munné-Bosch, S. Antioxidant defenses against drought stress. In Plant responses to drought stress: from morphological to molecular features; Springer Berlin Heidelberg: Berlin, Heidelberg, 2012; pp. 231–258. [Google Scholar] [CrossRef]
- Ozturk, M.; Turkyilmaz Unal, B.; García-Caparrós, P.; Khursheed, A.; Gul, A.; Hasanuzzaman, M. Osmoregulation and its actions during the drought stress in plants. Physiol. Plant. 2021, 172(2), 1321–1335. [Google Scholar] [CrossRef] [PubMed]
- Hasanuzzaman, M.; Nahar, K.; Anee, T. I.; Fujita, M. Glutathione in plants: biosynthesis and physiological role in environmental stress tolerance. Physiol. Mol. Biol. Plants 2017, 23(2), 249–268. [Google Scholar] [CrossRef] [PubMed]
- Koh, Y. S.; Wong, S. K.; Ismail, N. H.; Zengin, G.; Duangjai, A.; Saokaew, S.; Tang, S. Y. Mitigation of environmental stress-impacts in plants: Role of sole and combinatory exogenous application of glutathione. Front. Plant Sci. 2021, 12, 791205. [Google Scholar] [CrossRef] [PubMed]
- Ogawa, K. I. Glutathione-associated regulation of plant growth and stress responses. Antioxid. Redox Signal. 2005, 7(7-8), 973–981. [Google Scholar] [CrossRef] [PubMed]
- Csiszár, J.; Horváth, E.; Bela, K.; Gallé, Á. Glutathione-related enzyme system: glutathione reductase (GR), glutathione transferases (GSTs) and glutathione peroxidases (GPXs). In Redox state as a central regulator of plant-cell stress responses; Springer International Publishing: Cham, 2016; pp. 137–158. [Google Scholar] [CrossRef]
- Noctor, G.; Arisi, A. C. M.; Jouanin, L.; Kunert, K. J.; Rennenberg, H.; Foyer, C. H. Glutathione: biosynthesis, metabolism and relationship to stress tolerance explored in transformed plants. J. Exp. Bot. 1998, 49(321), 623–647. [Google Scholar] [CrossRef]
- Gill, S. S.; Anjum, N. A.; Hasanuzzaman, M.; Gill, R.; Trivedi, D. K.; Ahmad, I.; Tuteja, N. Glutathione and glutathione reductase: a boon in disguise for plant abiotic stress defense operations. Plant Physiol. Biochem. 2013, 70, 204–212. [Google Scholar] [CrossRef] [PubMed]
- Nahar, K.; Hasanuzzaman, M.; Alam, M. M.; Fujita, M. Exogenous spermidine alleviates low temperature injury in mung bean (Vigna radiata L.) seedlings by modulating ascorbate-glutathione and glyoxalase pathway. Int. J. Mol. Sci. 2015, 16(12), 30117–30132. [Google Scholar] [CrossRef] [PubMed]
- Noctor, G.; Mhamdi, A.; Chaouch, S.; Han, Y. I.; Neukermans, J.; Marquez-Garcia, B. E. L. E. N.; Foyer, C. H. Glutathione in plants: an integrated overview. Plant Cell Environ. 2012, 35(2), 454–484. [Google Scholar] [CrossRef] [PubMed]
- Qiu, B.; Zeng, F.; Cai, S.; Wu, X.; Haider, S. I.; Wu, F.; Zhang, G. Alleviation of chromium toxicity in rice seedlings by applying exogenous glutathione. J. Plant Physiol. 2013, 170(8), 772–779. [Google Scholar] [CrossRef] [PubMed]
- Hasanuzzaman, M.; Nahar, K.; Rahman, A.; Mahmud, J. A.; Alharby, H. F.; Fujita, M. Exogenous glutathione attenuates lead-induced oxidative stress in wheat by improving antioxidant defense and physiological mechanisms. J. Plant Interact. 2018, 13(1), 203–212. [Google Scholar] [CrossRef]
- Nahar, K.; Hasanuzzaman, M.; Alam, M. M.; Fujita, M. Glutathione-induced drought stress tolerance in mung bean: coordinated roles of the antioxidant defence and methylglyoxal detoxification systems. AoB Plants 2015, 7, plv069. [Google Scholar] [CrossRef] [PubMed]
- Çevik, S.; Ünyayar, S. The effects of exogenous application of ascorbate and glutathione on antioxidant system in cultivated Cicer arietinum and wild type C. reticulatum under drought stress. Süleyman Demirel Univ. J. Nat. Aplplied Sci. 2015, 19(1), 91–97. Available online: https://izlik.org/JA34CW23TH.
- Nahar, K.; Hasanuzzaman, M.; Alam, M. M.; Fujita, M. J. B. P. Roles of exogenous glutathione in antioxidant defense system and methylglyoxal detoxification during salt stress in mung bean. Biol. Plant. 2015, 59(4), 745–756. [Google Scholar] [CrossRef]
- Yao, M.; Ge, W.; Zhou, Q.; Zhou, X.; Luo, M.; Zhao, Y.; Ji, S. Exogenous glutathione alleviates chilling injury in postharvest bell pepper by modulating the ascorbate-glutathione (AsA-GSH) cycle. Food Chem. 2021, 352, 129458. [Google Scholar] [CrossRef] [PubMed]
- Farooq, M.; Wahid, A.; Kobayashi, N. S. M. A.; Fujita, D. B. S. M. A.; Basra, S. M. Plant drought stress: effects, mechanisms and management. In Sustainable agriculture; Springer Netherlands: Dordrecht, 2009; pp. 153–188. [Google Scholar] [CrossRef]
- Anjum, S. A.; Xie, X.; Wang, L. C.; Saleem, M. F.; Man, C.; Lei, W. Morphological, physiological and biochemical responses of plants to drought stress. Afr. J. Agric. Res. 2011, 6(9), 2026–2032. [Google Scholar] [CrossRef]
- Neumann, P. M. The role of cell wall adjustments in plant resistance to water deficits. Crop Sci. 1995, 35(5), 1258–1266. [Google Scholar] [CrossRef]
- Hussain, M.; Malik, M. A.; Farooq, M.; Ashraf, M. Y.; Cheema, M. A. Improving drought tolerance by exogenous application of glycinebetaine and salicylic acid in sunflower. J. Agron. Crop Sci. 2008, 194(3), 193–199. [Google Scholar] [CrossRef]
- Jaleel, C. A.; Llorente, B. E. Drought stress in plants: A review on water relations. Biosci. Res. 2009, 6(1), 20–27. [Google Scholar]
- Sinclair, T. R.; Muchow, R. C. System analysis of plant traits to increase grain yield on limited water supplies. Agron. J. 2001, 93(2), 263–270. [Google Scholar] [CrossRef]
- Alves, A. A.; Setter, T. L. Response of cassava leaf area expansion to water deficit: cell proliferation, cell expansion and delayed development. Ann. Bot. 2004, 94(4), 605–613. [Google Scholar] [CrossRef] [PubMed]
- Munné-Bosch, S.; Alegre, L. Die and let live: leaf senescence contributes to plant survival under drought stress. Funct. Plant Biol. 2004, 31(3), 203–216. [Google Scholar] [CrossRef] [PubMed]
- Flexas, J.; Medrano, H. Drought-inhibition of photosynthesis in C3 plants: stomatal and non-stomatal limitations revisited. Ann. Bot. 2002, 89(2), 183–189. [Google Scholar] [CrossRef] [PubMed]
- Reddy, A. R.; Chaitanya, K. V.; Vivekanandan, M. Drought-induced responses of photosynthesis and antioxidant metabolism in higher plants. J. Plant Physiol. 2004, 161(11), 1189–1202. [Google Scholar] [CrossRef] [PubMed]
- Piro, G.; Leucci, M. R.; Waldron, K.; Dalessandro, G. Exposure to water stress causes changes in the biosynthesis of cell wall polysaccharides in roots of wheat cultivars varying in drought tolerance. Plant Sci. 2003, 165(3), 559–569. [Google Scholar] [CrossRef]
- Aroca, R.; Ruiz-Lozano, J. M. Regulation of root water uptake under drought stress conditions. In Plant responses to drought stress: from morphological to molecular features; Springer Berlin Heidelberg: Berlin, Heidelberg, 2012; pp. 113–127. [Google Scholar] [CrossRef]
- Ashraf, M. H. P. J. C.; Harris, P. J. Photosynthesis under stressful environments: An overview. Photosynthetica 2013, 51(2), 163–190. [Google Scholar] [CrossRef]
- Li, M.; Kim, C. Chloroplast ROS and stress signaling. Plant Commun. 2022, 3(1). [Google Scholar] [CrossRef] [PubMed]
- Anjum, F.; Yaseen, M.; Rasul, E.; Wahid, A.; Anjum, S. Water stress in barley (Hordeum vulgare L.). II. Effect on chemical composition and chlorophyll contents. Pak. J. Agric. Sci. 2003, 40(1-2), 45–49. [Google Scholar]
- Sivakumar, R.; Nandhitha, G. K.; Chandrasekaran, P.; Boominathan, P.; Senthilkumar, M. Impact of pink pigmented facultative methylotroph and PGRs on water status, photosynthesis, proline and NR activity in tomato under drought. Int. J Curr. Microbiol. App Sci 2017, 6(6), 1640–1651. [Google Scholar] [CrossRef]
- Han, L.; Zhang, M.; Du, L.; Zhang, L.; Li, B. Effects of Bacillus amyloliquefaciens QST713 on photosynthesis and antioxidant characteristics of Alfalfa (Medicago sativa L.) under drought stress. Agronomy 2022, 12(9), 2177. [Google Scholar] [CrossRef]
- Lata, C.; Muthamilarasan, M.; Prasad, M. Drought stress responses and signal transduction in plants. In Elucidation of Abiotic Stress Signaling in Plants: Functional Genomics Perspectives; Springer New York: New York, NY, 2015; Volume 2, pp. 195–225. [Google Scholar] [CrossRef]
- Aroca, R. Plant responses to drought stress. From Morphol. To Mol. Featur. 2012, 1–5. [Google Scholar] [CrossRef]
- Kim, J. H.; Sung, J. H.; Shahid, S.; Chung, E. S. Future hydrological drought analysis considering agricultural water withdrawal under SSP scenarios. Water Resour. Manag. 2022, 36(9), 2913–2930. [Google Scholar] [CrossRef]
- Serraj, R. A. C. H. I. D.; Sinclair, T. R. Osmolyte accumulation: can it really help increase crop yield under drought conditions? Plant Cell Environ. 2002, 25(2), 333–341. [Google Scholar] [CrossRef] [PubMed]
- Basu, S.; Ramegowda, V.; Kumar, A.; Pereira, A. Plant adaptation to drought stress. F1000Research 2016, 5, F1000–Faculty. [Google Scholar] [CrossRef] [PubMed]
- Kishor, P. K.; Sangam, S.; Amrutha, R. N.; Laxmi, P. S.; Naidu, K. R.; Rao, K. S.; Sreenivasulu, N. Regulation of proline biosynthesis, degradation, uptake and transport in higher plants: its implications in plant growth and abiotic stress tolerance. Curr. Sci. 2005, 424–438. [Google Scholar]
- Szabados, L.; Savouré, A. Proline: a multifunctional amino acid. Trends Plant Sci. 2010, 15(2), 89–97. [Google Scholar] [CrossRef] [PubMed]
- Chaves, M. M. Effects of water deficits on carbon assimilation. J. Exp. Bot. 1991, 42(1), 1–16. [Google Scholar] [CrossRef]
- El-Beltagi, H. S.; Mohamed, H. I.; Sofy, M. R. Role of ascorbic acid, glutathione and proline applied as singly or in sequence combination in improving chickpea plant through physiological change and antioxidant defense under different levels of irrigation intervals. Molecules 2020, 25(7), 1702. [Google Scholar] [CrossRef] [PubMed]
- Zhou, Y.; Wen, Z.; Zhang, J.; Chen, X.; Cui, J.; Xu, W.; Liu, H. Y. Exogenous glutathione alleviates salt-induced oxidative stress in tomato seedlings by regulating glutathione metabolism, redox status, and the antioxidant system. Sci. Hortic. 2017, 220, 90–101. [Google Scholar] [CrossRef]
- Khalid, M. F.; Huda, S.; Yong, M.; Li, L.; Li, L.; Chen, Z. H.; Ahmed, T. Alleviation of drought and salt stress in vegetables: crop responses and mitigation strategies. Plant Growth Regul. 2023, 99(2), 177–194. [Google Scholar] [CrossRef]
- Pei, L.; Che, R.; He, L.; Gao, X.; Li, W.; Li, H. Role of exogenous glutathione in alleviating abiotic stress in maize (Zea mays L.). J. Plant Growth Regul. 2019, 38(1), 199–215. [Google Scholar] [CrossRef]
- Sohag, A. A. M.; Tahjib-Ul-Arif, M.; Polash, M. A. S.; Belal Chowdhury, M.; Afrin, S.; Burritt, D. J.; Afzal Hossain, M. Exogenous glutathione-mediated drought stress tolerance in rice (Oryza sativa L.) is associated with lower oxidative damage and favorable ionic homeostasis. Iran. J. Sci. Technol. Trans. A Sci. 2020, 44(4), 955–971. [Google Scholar] [CrossRef]
- Chen, J. H.; Jiang, H. W.; Hsieh, E. J.; Chen, H. Y.; Chien, C. T.; Hsieh, H. L.; Lin, T. P. Drought and salt stress tolerance of an Arabidopsis glutathione S-transferase U17 knockout mutant are attributed to the combined effect of glutathione and abscisic acid. Plant Physiol. 2012, 158(1), 340–351. [Google Scholar] [CrossRef] [PubMed]
- Cheng, M. C.; Ko, K.; Chang, W. L.; Kuo, W. C.; Chen, G. H.; Lin, T. P. Increased glutathione contributes to stress tolerance and global translational changes in Arabidopsis. Plant J. 2015, 83(5), 926–939. [Google Scholar] [CrossRef] [PubMed]
- Vernoux, T.; Wilson, R. C.; Seeley, K. A.; Reichheld, J. P.; Muroy, S.; Brown, S.; Sung, Z. R. The root meristemless1/cadmium sensitive2 gene defines a glutathione-dependent pathway involved in initiation and maintenance of cell division during postembryonic root development. Plant Cell 2000, 12(1), 97–109. [Google Scholar] [CrossRef] [PubMed]
- Iqbal, K.; Ibrahim, M.; Khattak, A.; Khan, S. A.; Nawaz, G. Exogenous application of glutathione induces wheat tolerance to heavy metal stress by modulating the antioxidative enzymatic defenses. Acta Physiol. Plant. 2024, 46(10), 92. [Google Scholar] [CrossRef]
- Shams, M.; Ekinci, M.; Ors, S.; Turan, M.; Agar, G.; Kul, R.; Yildirim, E. Nitric oxide mitigates salt stress effects of pepper seedlings by altering nutrient uptake, enzyme activity and osmolyte accumulation. Physiol. Mol. Biol. Plants 2019, 25(5), 1149–1161. [Google Scholar] [CrossRef] [PubMed]
- Zhang, J. H.; Huang, W. D.; Liu, Y. P.; Pan, Q. H. Effects of temperature acclimation pretreatment on the ultrastructure of mesophyll cells in young grape plants (Vitis vinifera L. cv. Jingxiu) under cross-temperature stresses. J. Integr. Plant Biol. 2005, 47(8), 959–970. [Google Scholar] [CrossRef]
- Bates, L. S.; Waldren, R. P. A.; Teare, I. D. Rapid determination of free proline for water-stress studies. Plant Soil 1973, 39(1), 205–207. [Google Scholar] [CrossRef]
- Liu, X.; Huang, B. Carbohydrate accumulation in relation to heat stress tolerance in two creeping bentgrass cultivars. J. Am. Soc. Hortic. Sci. 2000, 125(4), 442–447. [Google Scholar] [CrossRef]
- Angelini, R.; Manes, F.; Federico, R. Spatial a functional correlation between daimine- oxsidase and peroxidase activities and their dependence upon deetilation and wounding in chick-pea. Planta 1990, 182, 89–96. [Google Scholar] [CrossRef] [PubMed]
- Angelini, R.; Federico, R. Histochemical evidence of polyamine oxidation and generation of hydrogen- peroxide in the cell wall. J. Plant Physiol. 1989, 135, 212–217. [Google Scholar] [CrossRef]
- Havir, E.A.; McHale, N.A. Biochemical and developmental characterization of multiple forms of catalase in tobacco leaves. Plant Physiol. 1987, 84, 450–455. [Google Scholar] [CrossRef] [PubMed]
- Gong, Y.; Toivonen, P.M.; Wiersma, P.A.; Lu, C.; Lau, O.L. Effect of freezing on the activity of catalase in apple flesh tissue. J. Agric. Food Chem. 2000, 48, 5537–5542. [Google Scholar] [CrossRef] [PubMed]
- Jin, P.; Wang, H.; Zhang, Y.; Huang, Y.; Wang, L.; Zheng, Y. UV-C enhances resistance against gray mold decay caused by Botrytis cinerea in strawberry fruit. Sci. Hortic. 2017, 225, 106–111. [Google Scholar] [CrossRef]
- Agarwal, S.; Pandey, V. Antioxidant enzyme responses to NaCl stress in Cassia angustifolia. Biol. Plant 2004, 48, 555–560. [Google Scholar] [CrossRef]
- Yordanova, R.Y.; Christov, K.N.; Popova, L.P. Antioxidative enzymes in barley plants subjected to soil flooding. Env. Exper Bot. 2004, 51, 93–101. [Google Scholar] [CrossRef]
- Kuraishi, S.; Tasaki, K.; Sakurai, N.; Sadatoku, K. Changes in levels of cytokinins in etiolated squash seedlings after illumination. Plant Cell Physiol. 1991, 32, 585–591. [Google Scholar] [CrossRef]
- Turan, M.; Ekinci, M.; Yildirim, E.; Güneş, A.; Karagöz, K.; Kotan, R.; Dursun, A. Plant growth-promoting rhizobacteria improved growth, nutrient, and hormone content of cabbage (Brassica oleracea) seedlings. Turk. J. Agric. 2014, 38, 327–333. [Google Scholar] [CrossRef]
Figure 1.
Effects of glutathione (GSH) application on growth and biomass characteristics of pepper plants under well-watered (WW) and drought stress (DS) conditions. (a) plant height (PH), (b) chlorophyll content (CC, SPAD), (c) stem diameter (SD), (d) leaf area (LA), (e) plant fresh weight (PFW), (f) root fresh weight (RFW), (g) plant dry weight (PDW), and (h) root dry weight (RDW). Bars represent the mean ± standard error (SE). Different lowercase letters above the bars indicate statistically significant differences among GSH treatments within the same water regime (WW or DS) according to Tukey's multiple comparison test (p < 0.05).
Figure 1.
Effects of glutathione (GSH) application on growth and biomass characteristics of pepper plants under well-watered (WW) and drought stress (DS) conditions. (a) plant height (PH), (b) chlorophyll content (CC, SPAD), (c) stem diameter (SD), (d) leaf area (LA), (e) plant fresh weight (PFW), (f) root fresh weight (RFW), (g) plant dry weight (PDW), and (h) root dry weight (RDW). Bars represent the mean ± standard error (SE). Different lowercase letters above the bars indicate statistically significant differences among GSH treatments within the same water regime (WW or DS) according to Tukey's multiple comparison test (p < 0.05).
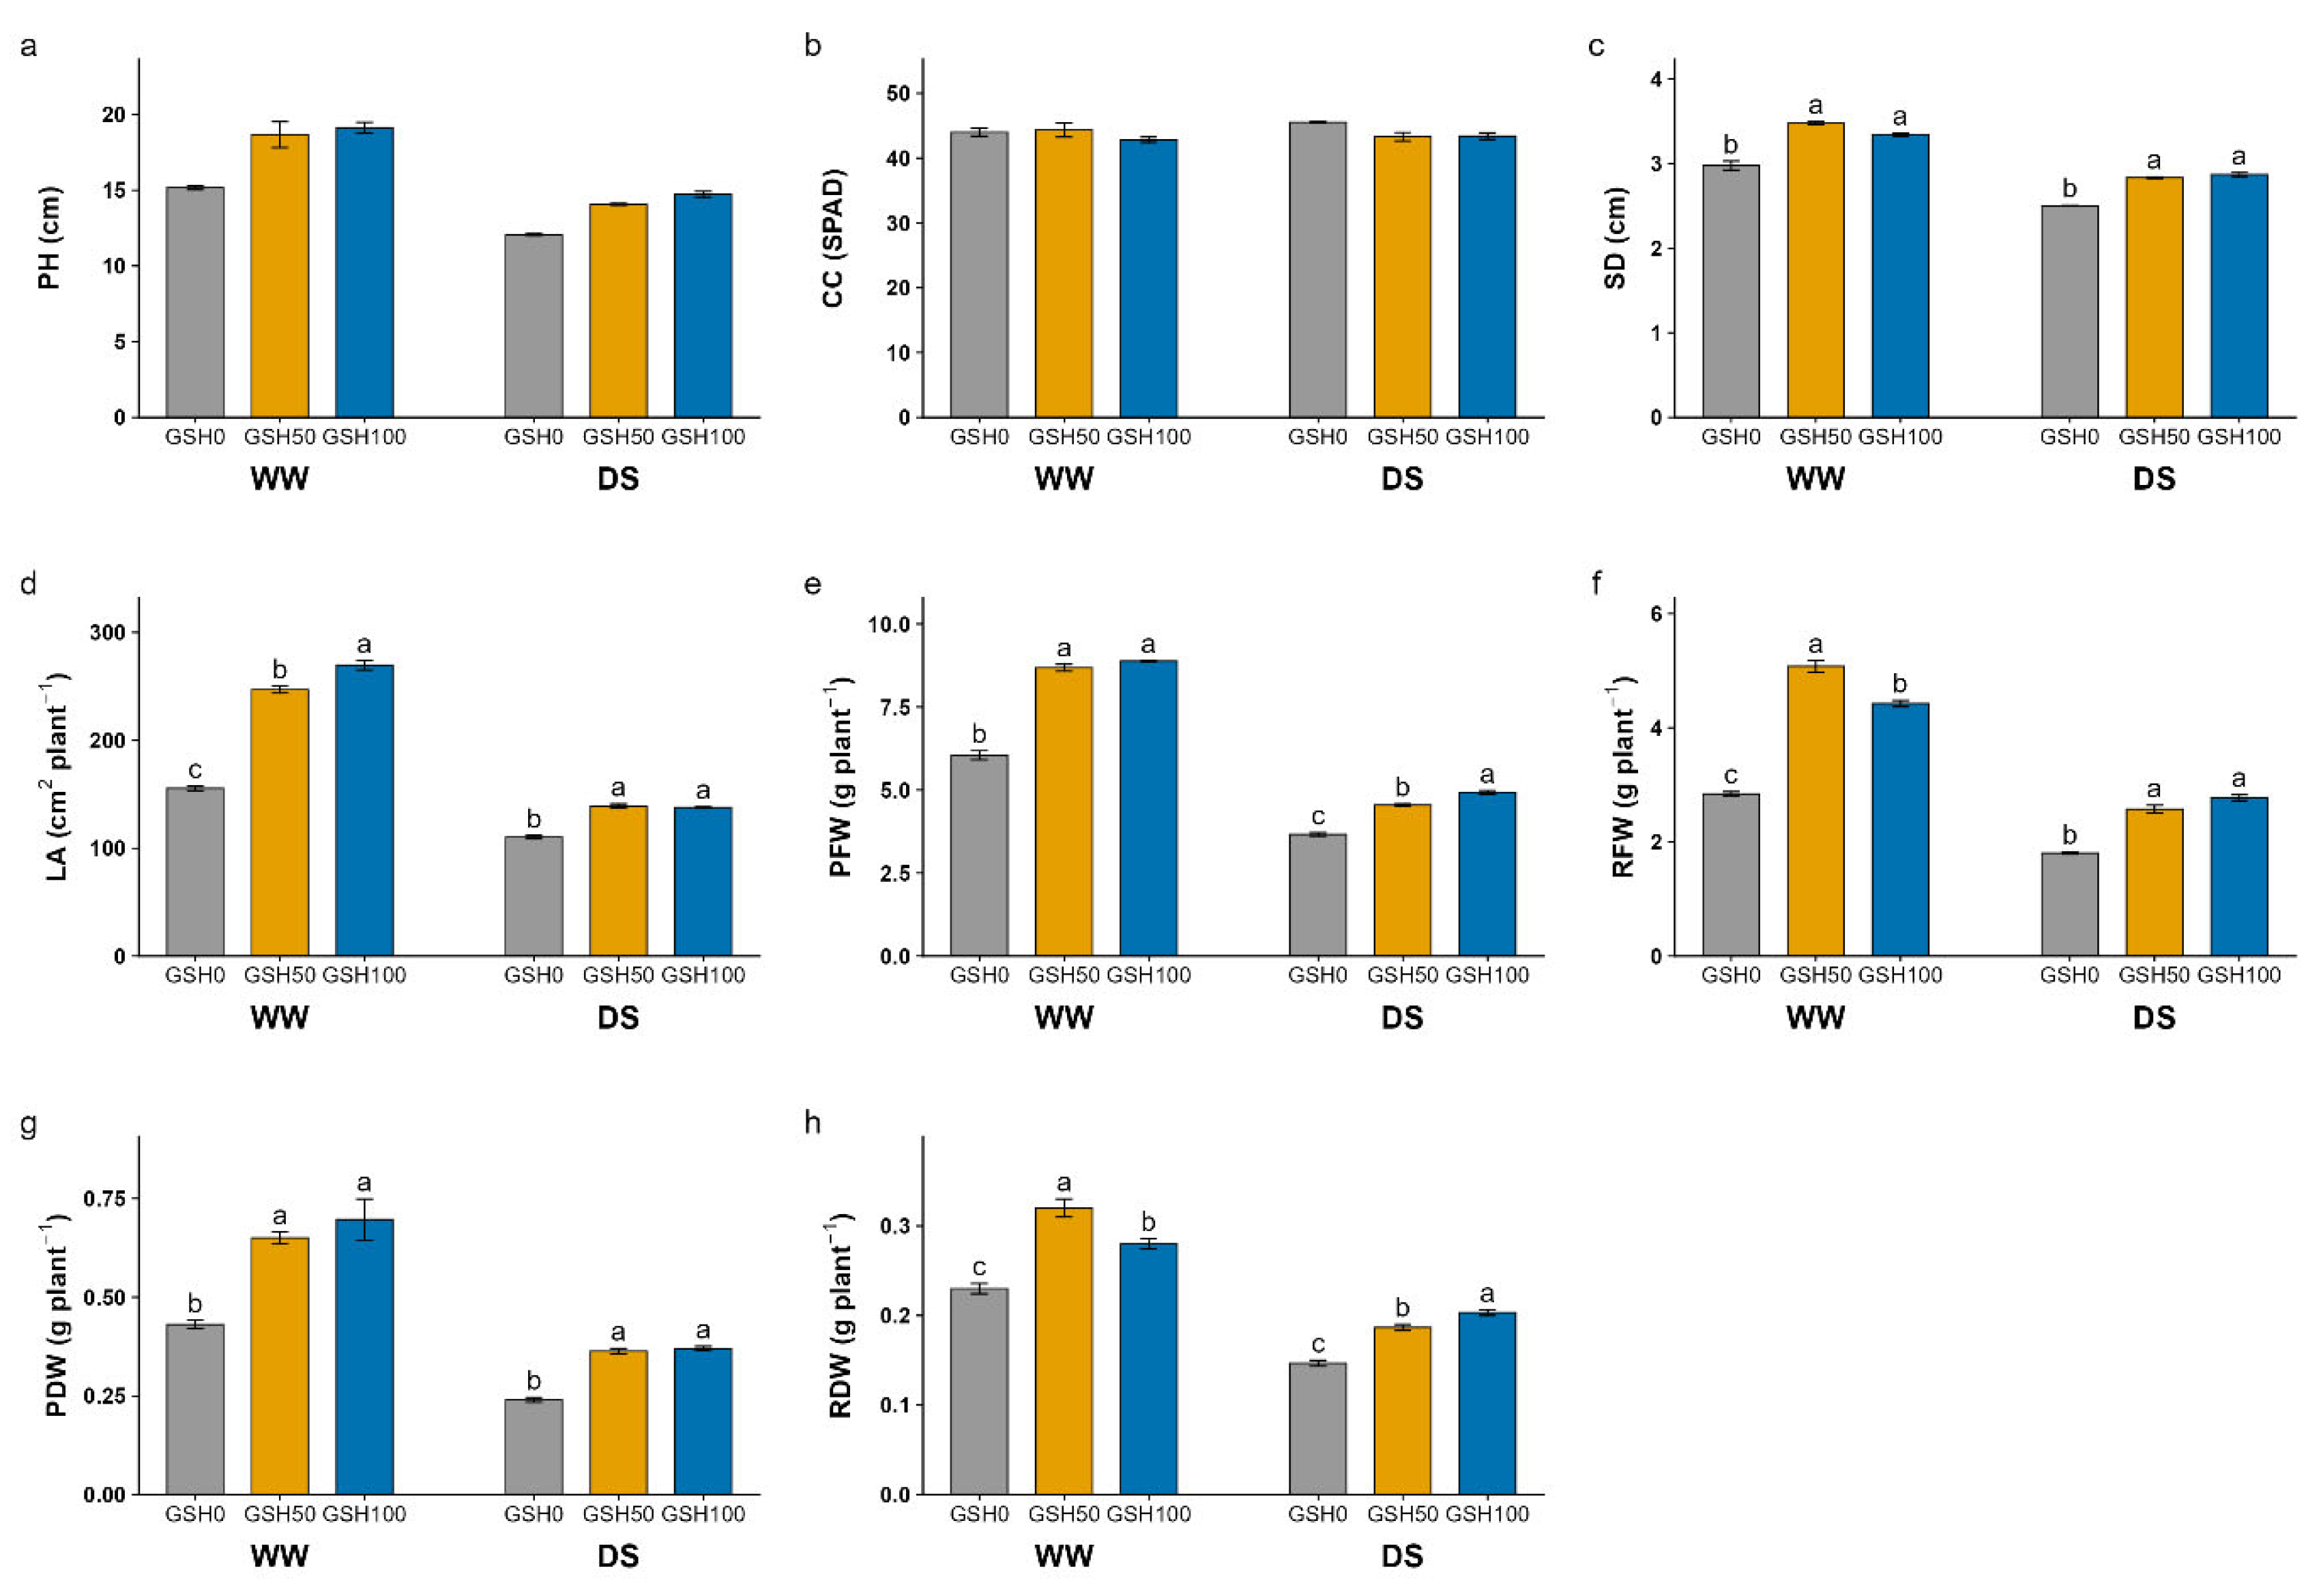
Figure 2.
Radar charts illustrating the effects of glutathione (GSH) application on the relative responses of measured parameters in pepper plants under well-watered (WW) and drought stress (DS) conditions. (a) growth and biomass traits, (b) photosynthetic pigments (c) oxidative stress markers and osmolytes, (d) antioxidant enzyme activities, and (e) phytohormone levels. The abbreviations of the analyzed variables are provided in Table 1.
Figure 2.
Radar charts illustrating the effects of glutathione (GSH) application on the relative responses of measured parameters in pepper plants under well-watered (WW) and drought stress (DS) conditions. (a) growth and biomass traits, (b) photosynthetic pigments (c) oxidative stress markers and osmolytes, (d) antioxidant enzyme activities, and (e) phytohormone levels. The abbreviations of the analyzed variables are provided in Table 1.
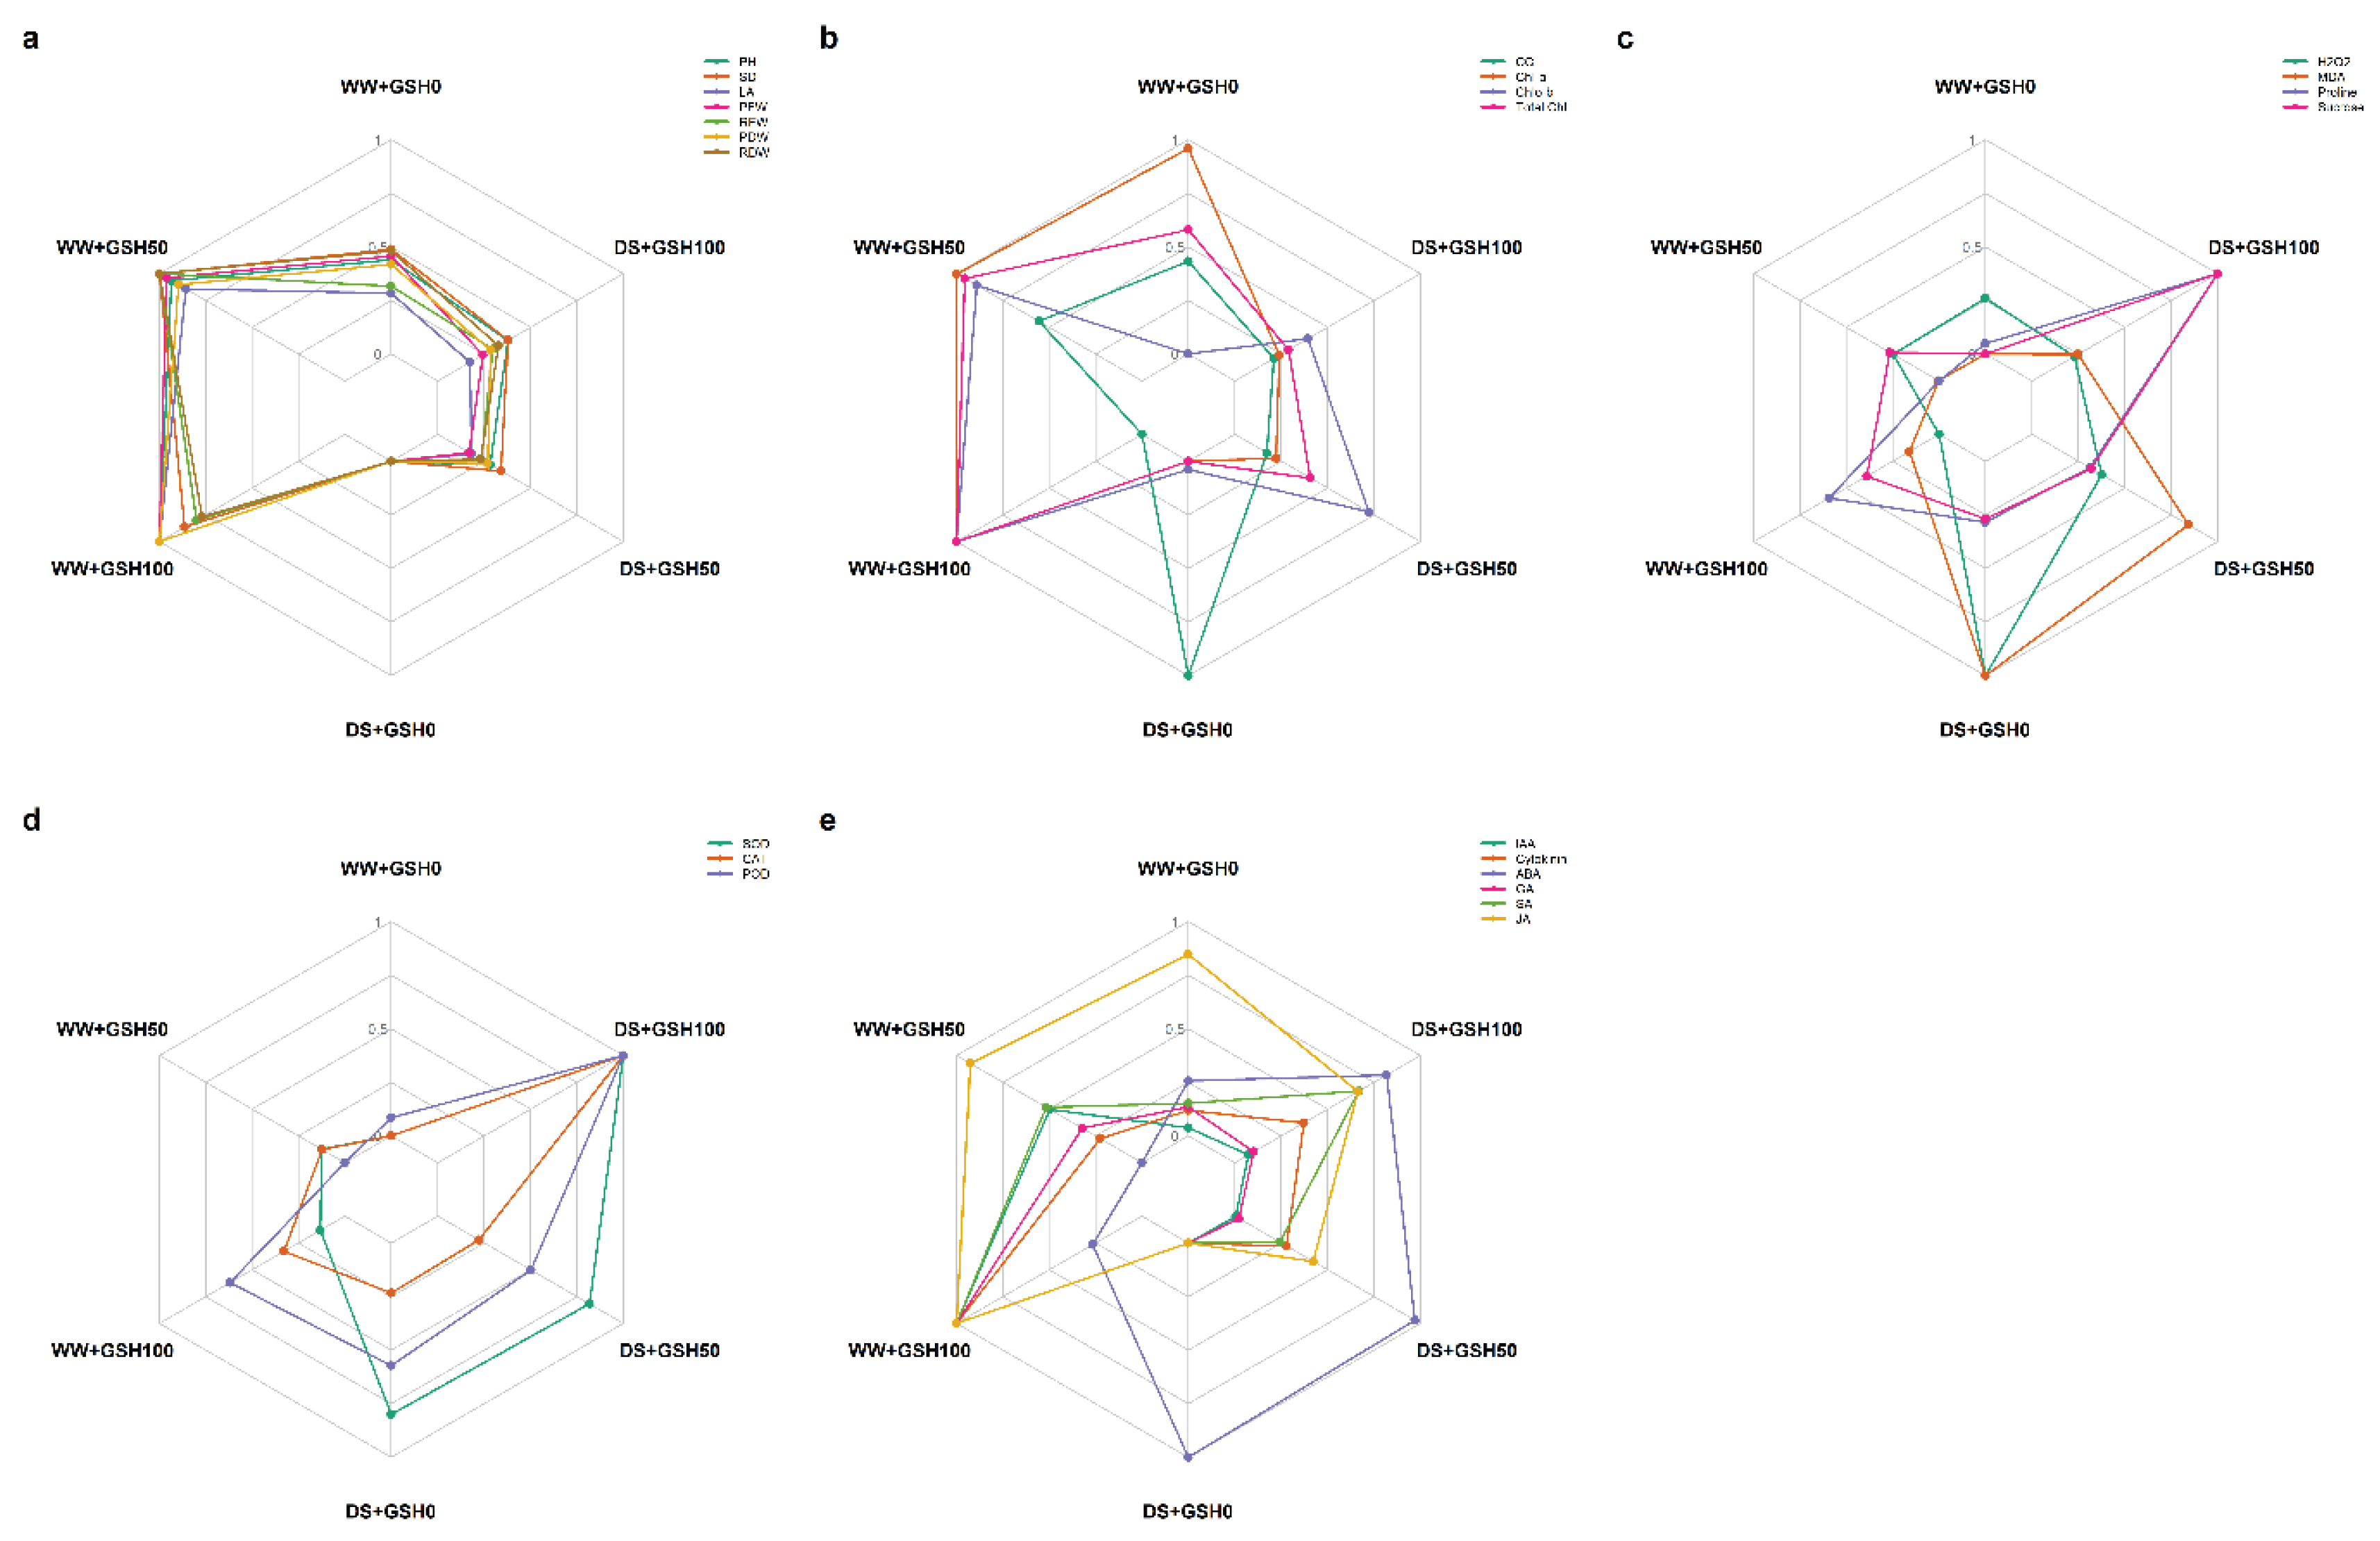
Figure 3.
Effects of glutathione (GSH) application on photosynthetic pigments of pepper plants under well-watered (WW) and drought stress (DS) conditions. (a) chlorophyll a, (b) chlorophyll b, and (c) total chlorophyll. Bars represent the mean ± standard error (SE). Different lowercase letters above the bars indicate statistically significant differences among GSH treatments within the same water regime (WW or DS) according to Tukey's multiple comparison test (P < 0.05).
Figure 3.
Effects of glutathione (GSH) application on photosynthetic pigments of pepper plants under well-watered (WW) and drought stress (DS) conditions. (a) chlorophyll a, (b) chlorophyll b, and (c) total chlorophyll. Bars represent the mean ± standard error (SE). Different lowercase letters above the bars indicate statistically significant differences among GSH treatments within the same water regime (WW or DS) according to Tukey's multiple comparison test (P < 0.05).
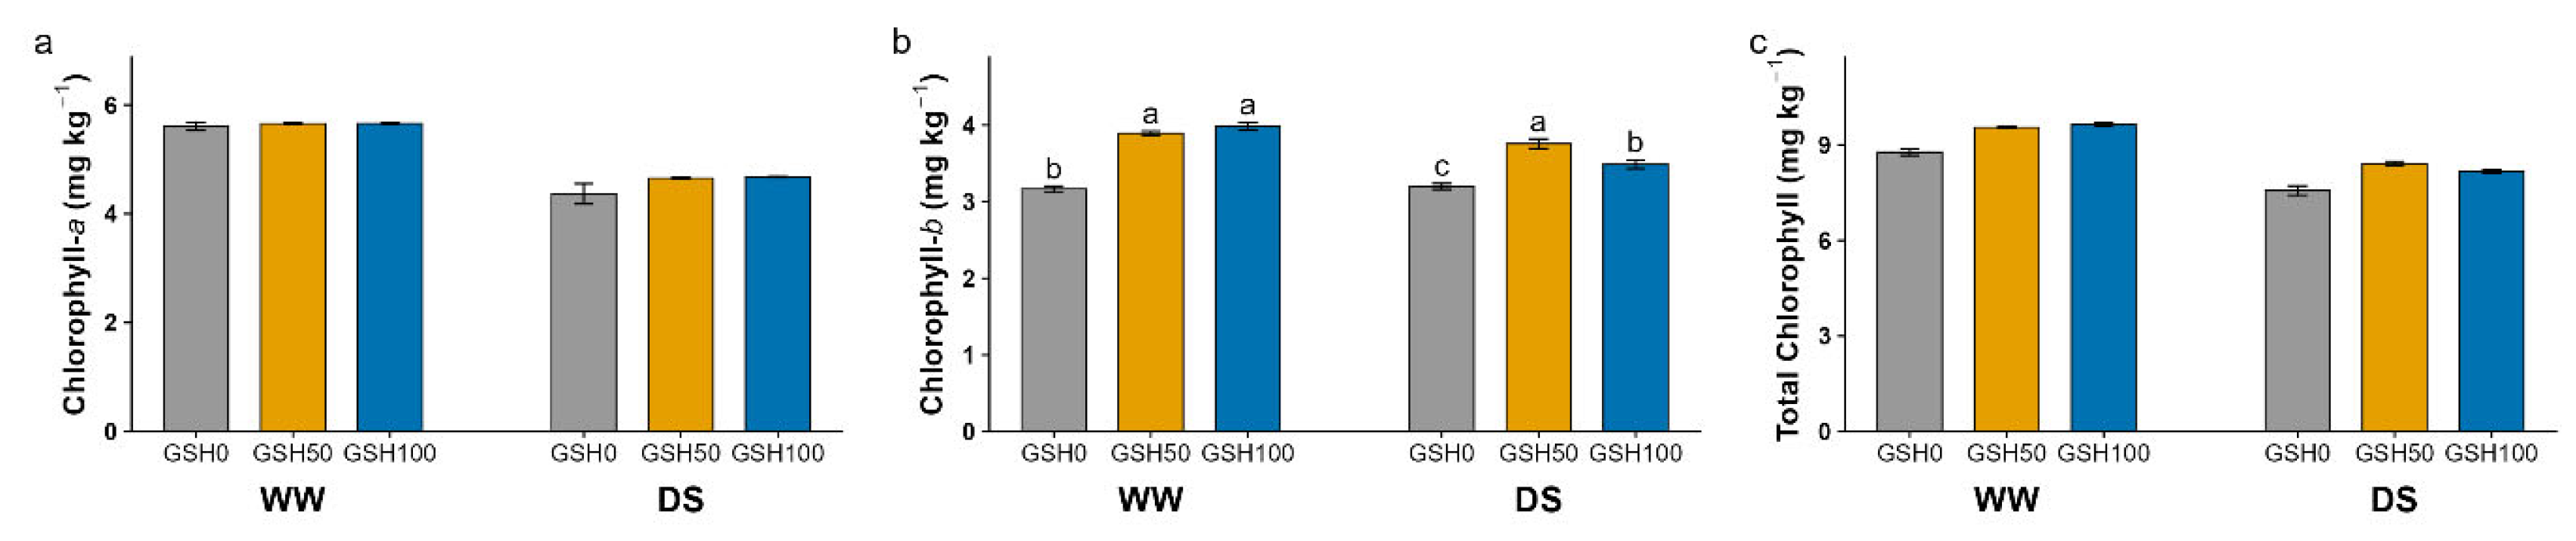
Figure 4.
Effects of glutathione (GSH) application on oxidative stress markers, osmolyte accumulation, and antioxidant enzyme activities in pepper plants under well-watered (WW) and drought stress (DS) conditions. (a) hydrogen peroxide (H₂O₂), (b) malondialdehyde (MDA), (c) proline, (d) sucrose, (e) superoxide dismutase (SOD), (f) catalase (CAT), and (g) peroxidase (POD). Bars represent the mean ± standard error (SE). Different lowercase letters above the bars indicate statistically significant differences among GSH treatments within the same water regime (WW or DS) according to Tukey's multiple comparison test (p < 0.05).
Figure 4.
Effects of glutathione (GSH) application on oxidative stress markers, osmolyte accumulation, and antioxidant enzyme activities in pepper plants under well-watered (WW) and drought stress (DS) conditions. (a) hydrogen peroxide (H₂O₂), (b) malondialdehyde (MDA), (c) proline, (d) sucrose, (e) superoxide dismutase (SOD), (f) catalase (CAT), and (g) peroxidase (POD). Bars represent the mean ± standard error (SE). Different lowercase letters above the bars indicate statistically significant differences among GSH treatments within the same water regime (WW or DS) according to Tukey's multiple comparison test (p < 0.05).
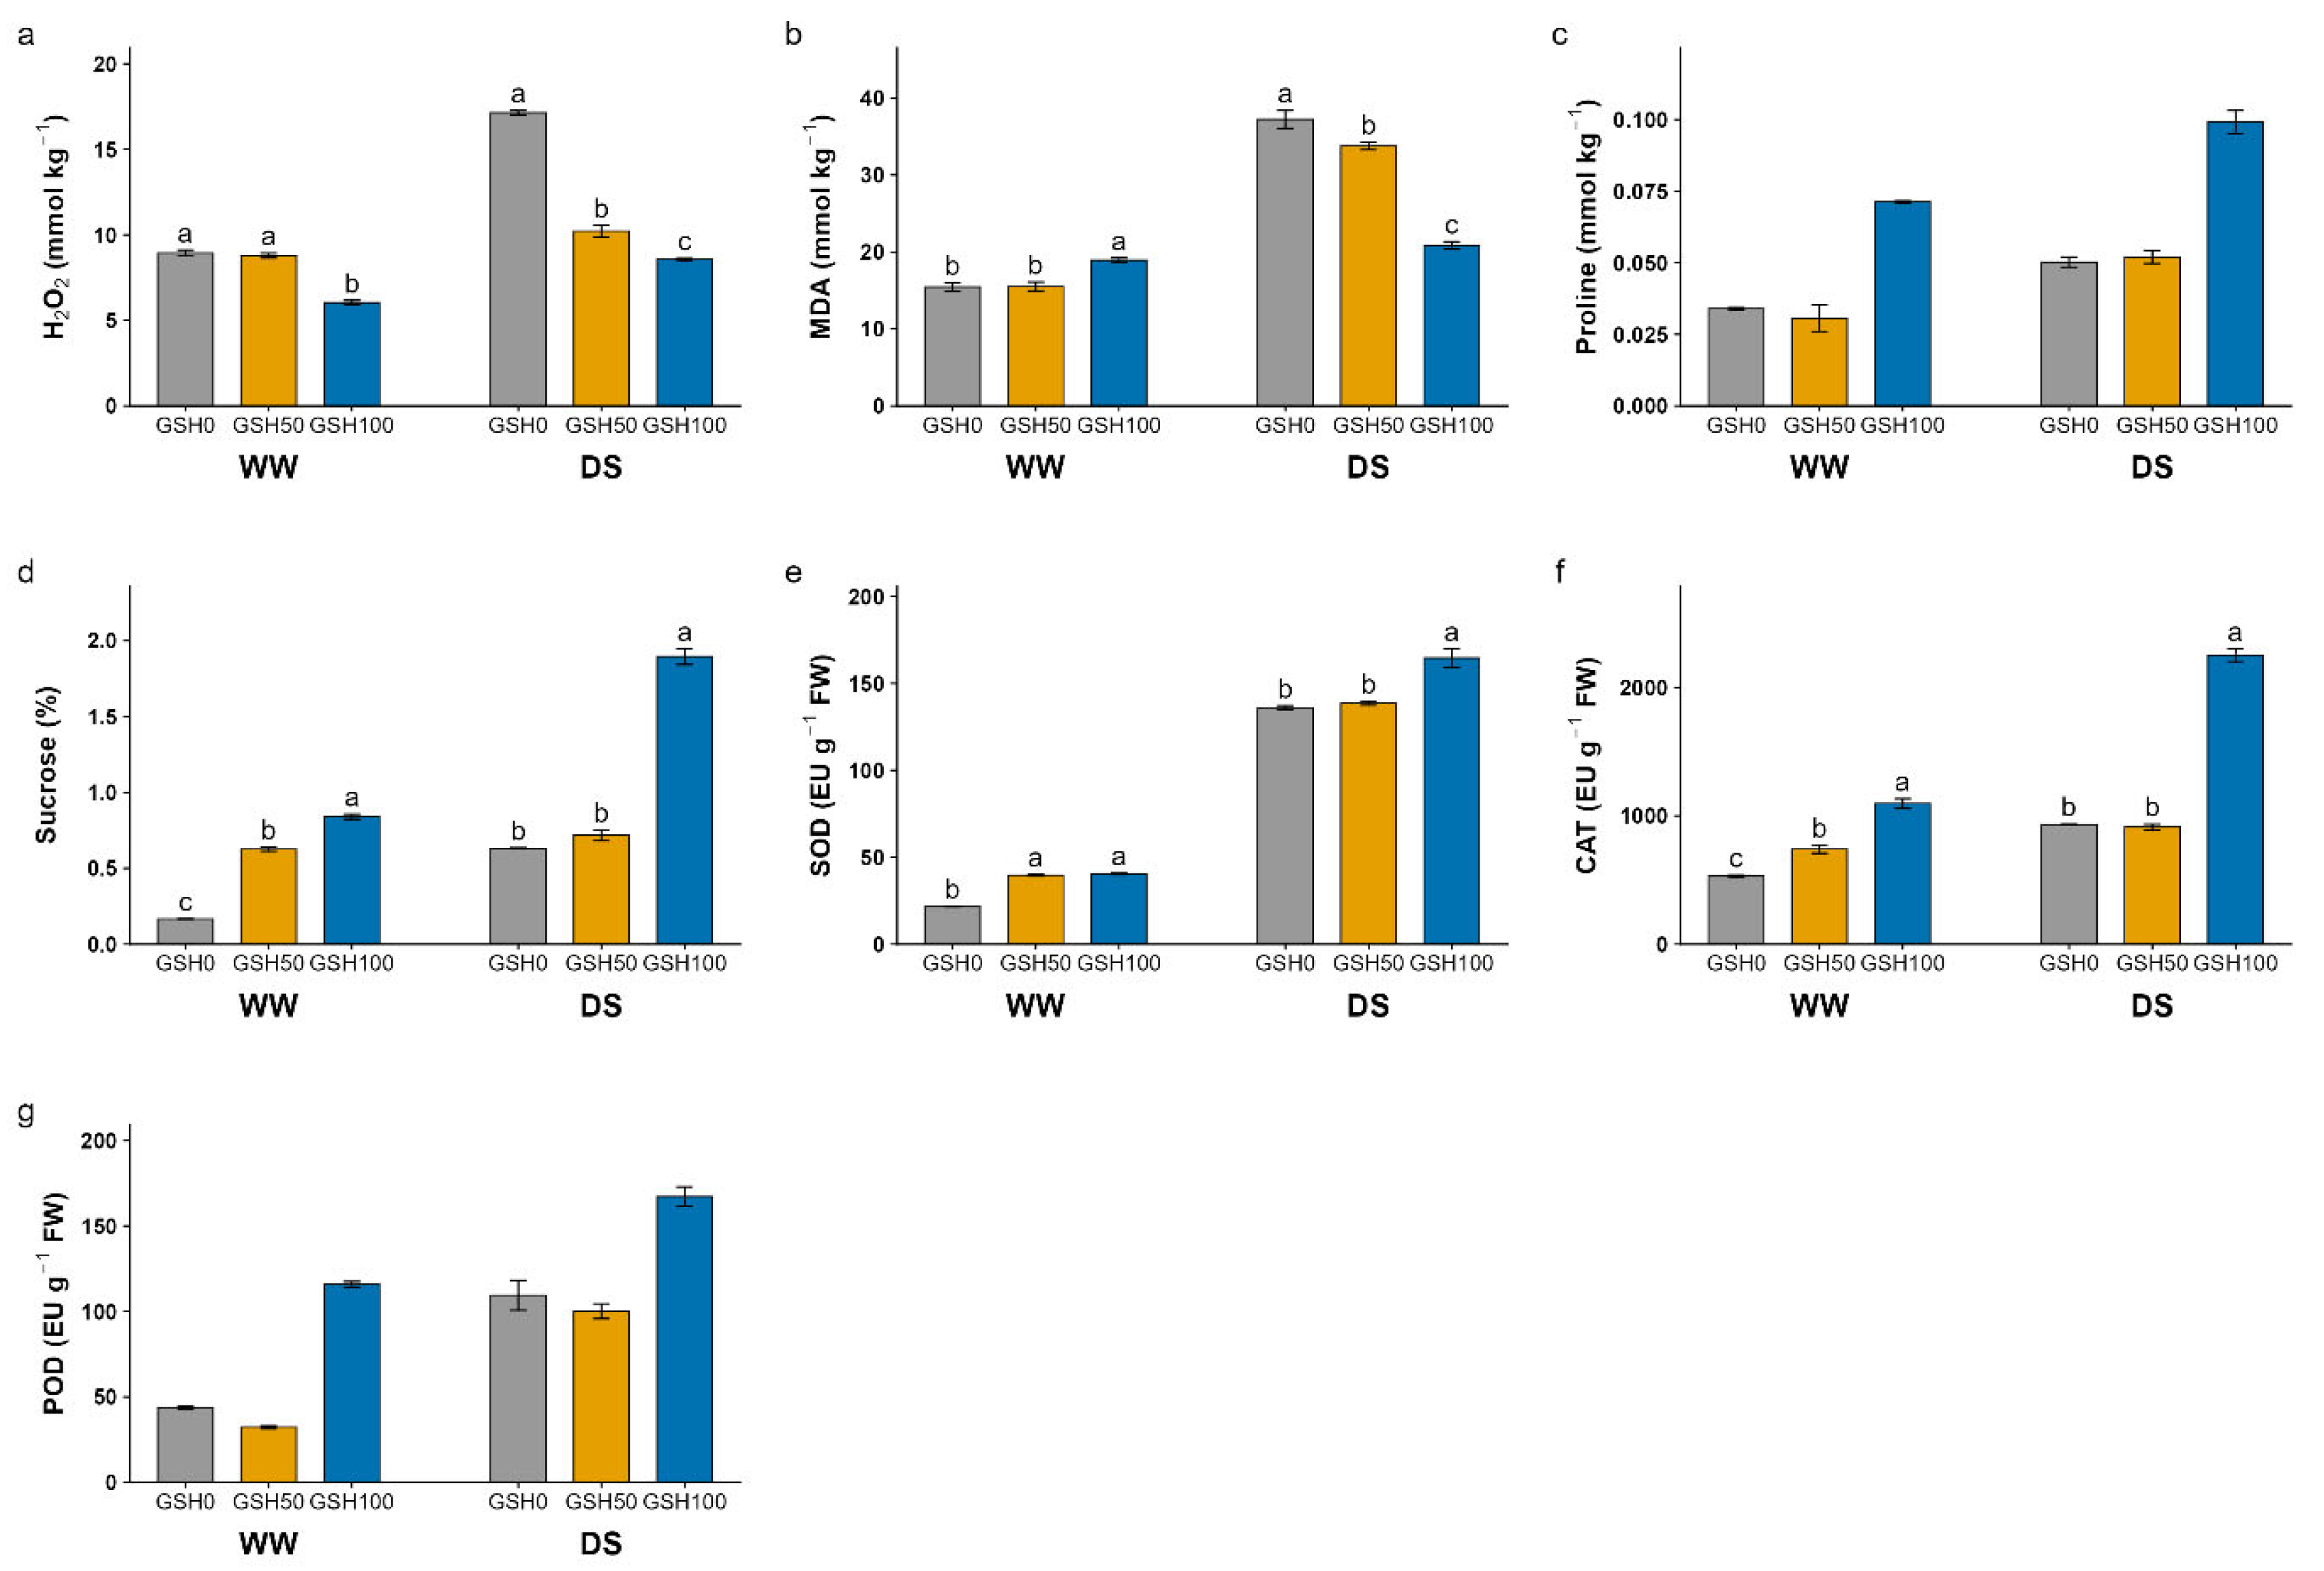
Figure 5.
Effects of glutathione (GSH) application on endogenous phytohormone levels in pepper plants under well-watered (WW) and drought stress (DS) conditions. (a) indole-3-acetic acid (IAA), (b) cytokinin, (c) abscisic acid (ABA), (d) gibberellic acid (GA), (e) salicylic acid (SA), and (f) jasmonic acid (JA). Bars represent the mean ± standard error (SE). Different lowercase letters above the bars indicate statistically significant differences among GSH treatments within the same water regime (WW or DS) according to Tukey's multiple comparison test (P < 0.05).
Figure 5.
Effects of glutathione (GSH) application on endogenous phytohormone levels in pepper plants under well-watered (WW) and drought stress (DS) conditions. (a) indole-3-acetic acid (IAA), (b) cytokinin, (c) abscisic acid (ABA), (d) gibberellic acid (GA), (e) salicylic acid (SA), and (f) jasmonic acid (JA). Bars represent the mean ± standard error (SE). Different lowercase letters above the bars indicate statistically significant differences among GSH treatments within the same water regime (WW or DS) according to Tukey's multiple comparison test (P < 0.05).
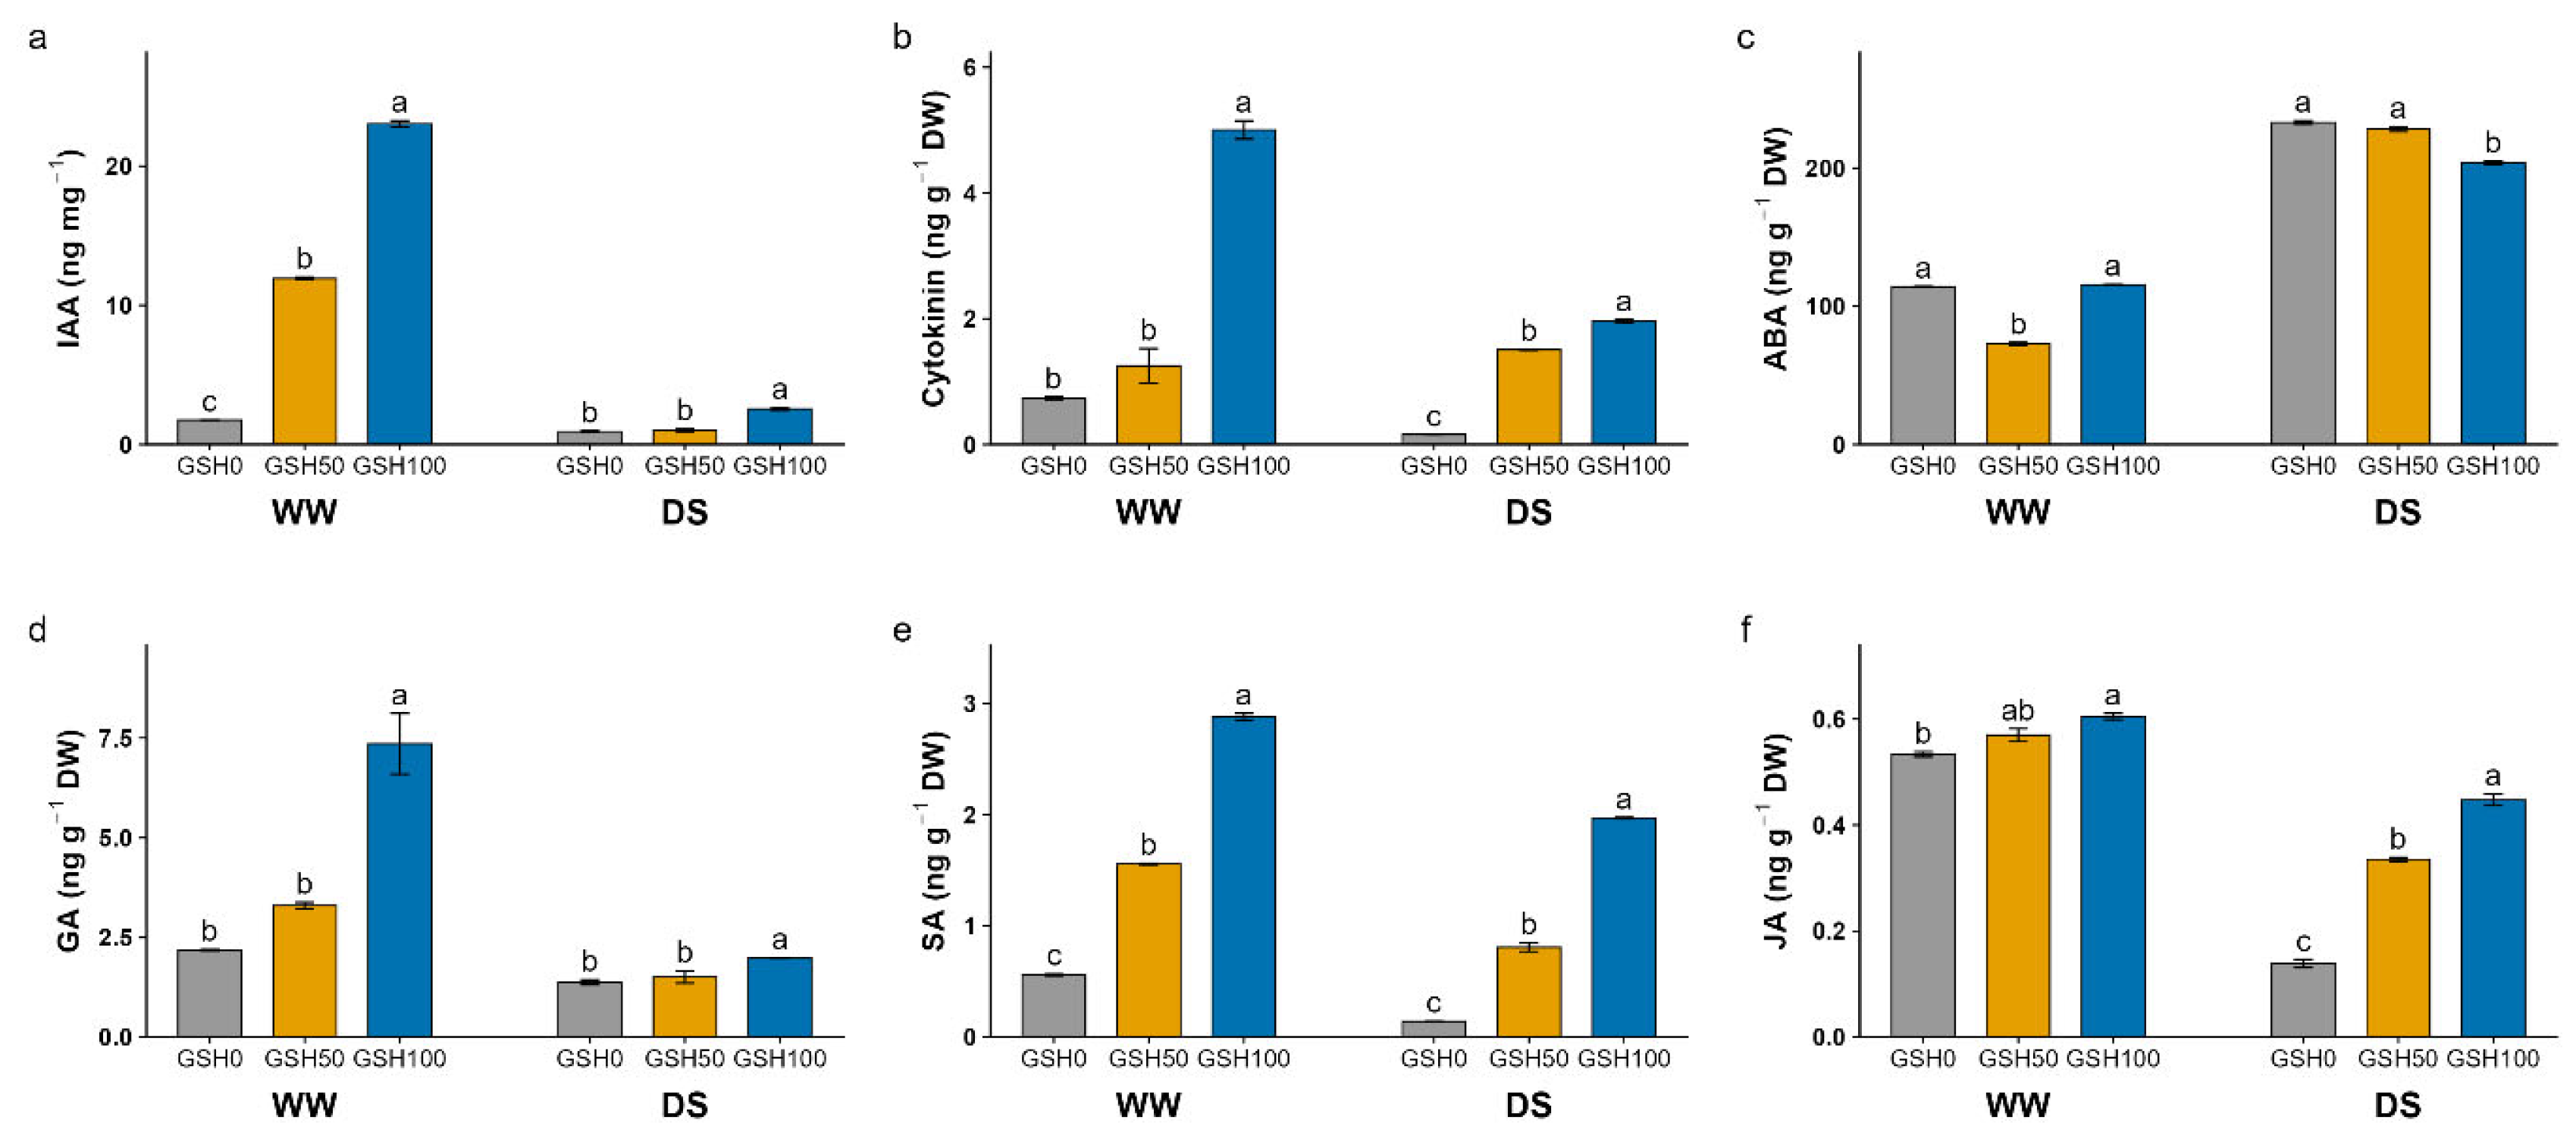
Figure 6.
Pearson correlation heatmap showing the relationships among the measured morphological, physiological, biochemical, and phytohormone parameters in pepper plants. Correlation coefficients (r) are represented by the color scale, ranging from −1 (strong negative correlation, red) to +1 (strong positive correlation, blue), with white indicating no correlation. Asterisks indicate statistically significant correlations (p < 0.05, p < 0.01, and p < 0.001). The abbreviations of the analyzed variables are provided in Table 1.
Figure 6.
Pearson correlation heatmap showing the relationships among the measured morphological, physiological, biochemical, and phytohormone parameters in pepper plants. Correlation coefficients (r) are represented by the color scale, ranging from −1 (strong negative correlation, red) to +1 (strong positive correlation, blue), with white indicating no correlation. Asterisks indicate statistically significant correlations (p < 0.05, p < 0.01, and p < 0.001). The abbreviations of the analyzed variables are provided in Table 1.
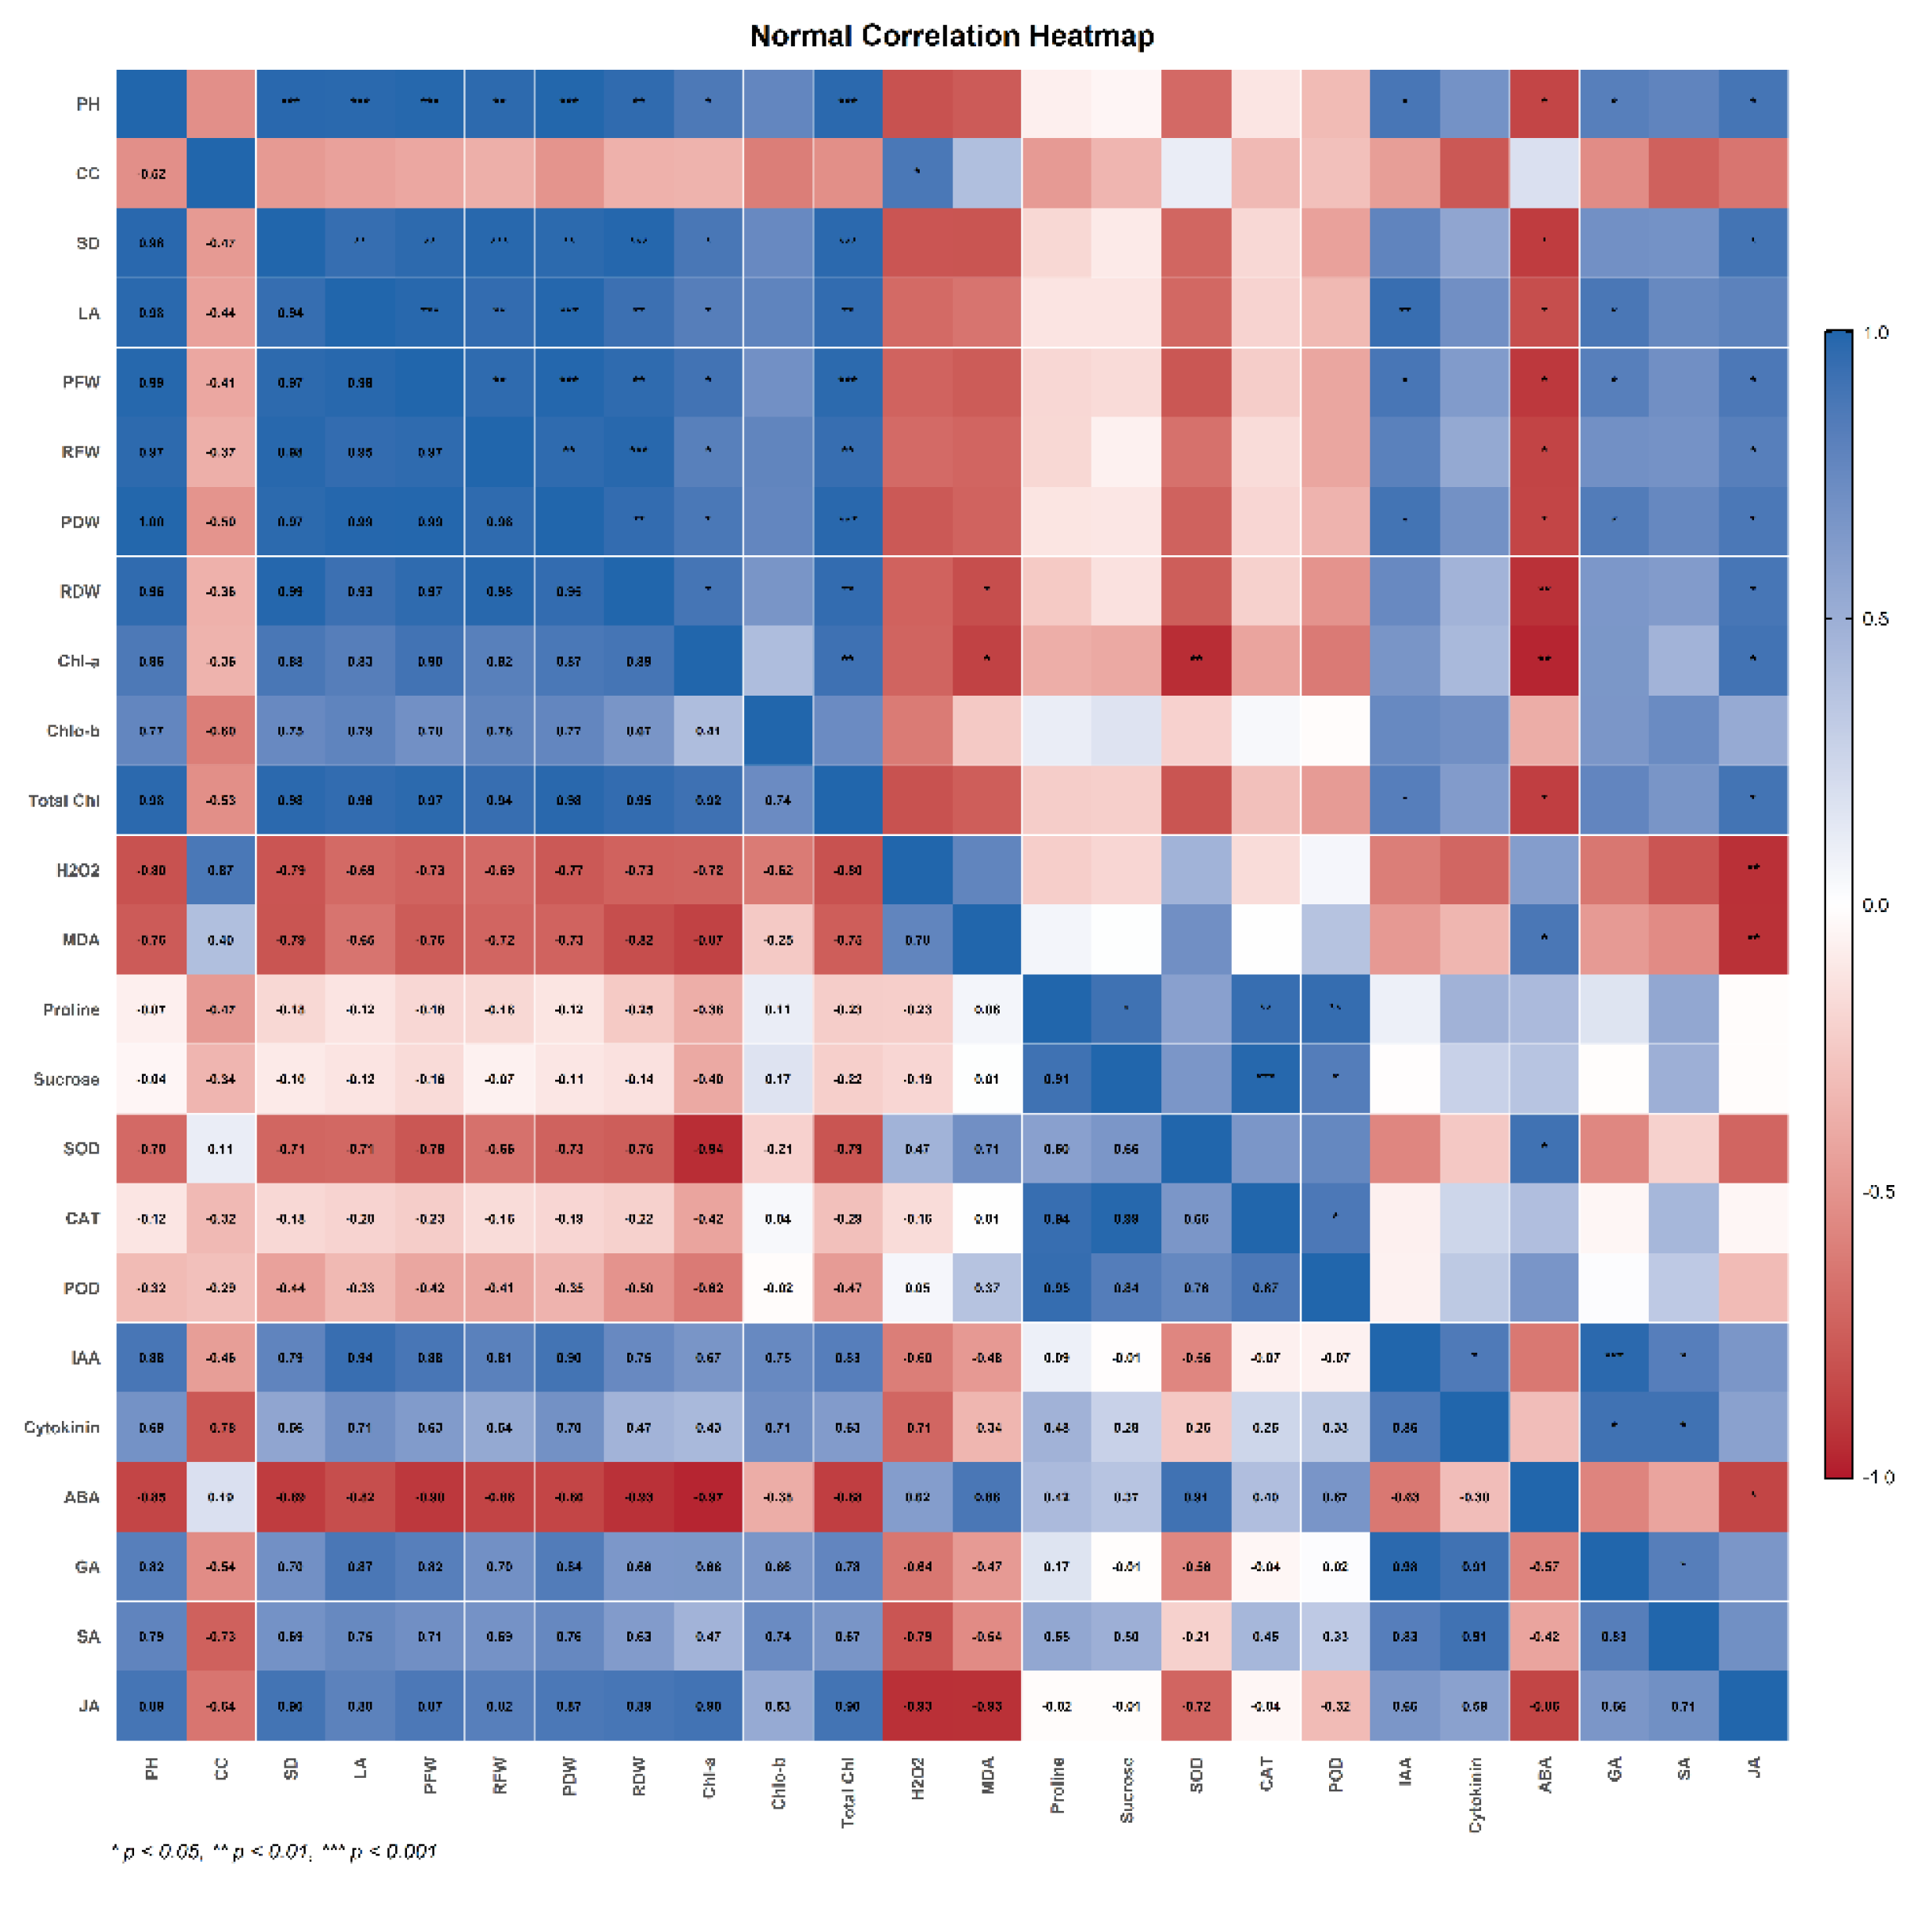
Figure 7.
Hierarchical clustering heatmap of the measured morphological, physiological, biochemical, and phytohormone traits across glutathione (GSH) treatments under well-watered (WW) and drought stress (DS) conditions. Rows represent the experimental treatments, whereas columns represent the analyzed variables. Color intensity represents standardized values (Z-scores), ranging from −1.5 (blue, lower relative values) to +1.5 (red, higher relative values), with white indicating values close to the overall mean. The dendrograms illustrate the hierarchical clustering of both treatments and variables based on their similarity. The abbreviations of the analyzed variables are provided in Table 1.
Figure 7.
Hierarchical clustering heatmap of the measured morphological, physiological, biochemical, and phytohormone traits across glutathione (GSH) treatments under well-watered (WW) and drought stress (DS) conditions. Rows represent the experimental treatments, whereas columns represent the analyzed variables. Color intensity represents standardized values (Z-scores), ranging from −1.5 (blue, lower relative values) to +1.5 (red, higher relative values), with white indicating values close to the overall mean. The dendrograms illustrate the hierarchical clustering of both treatments and variables based on their similarity. The abbreviations of the analyzed variables are provided in Table 1.
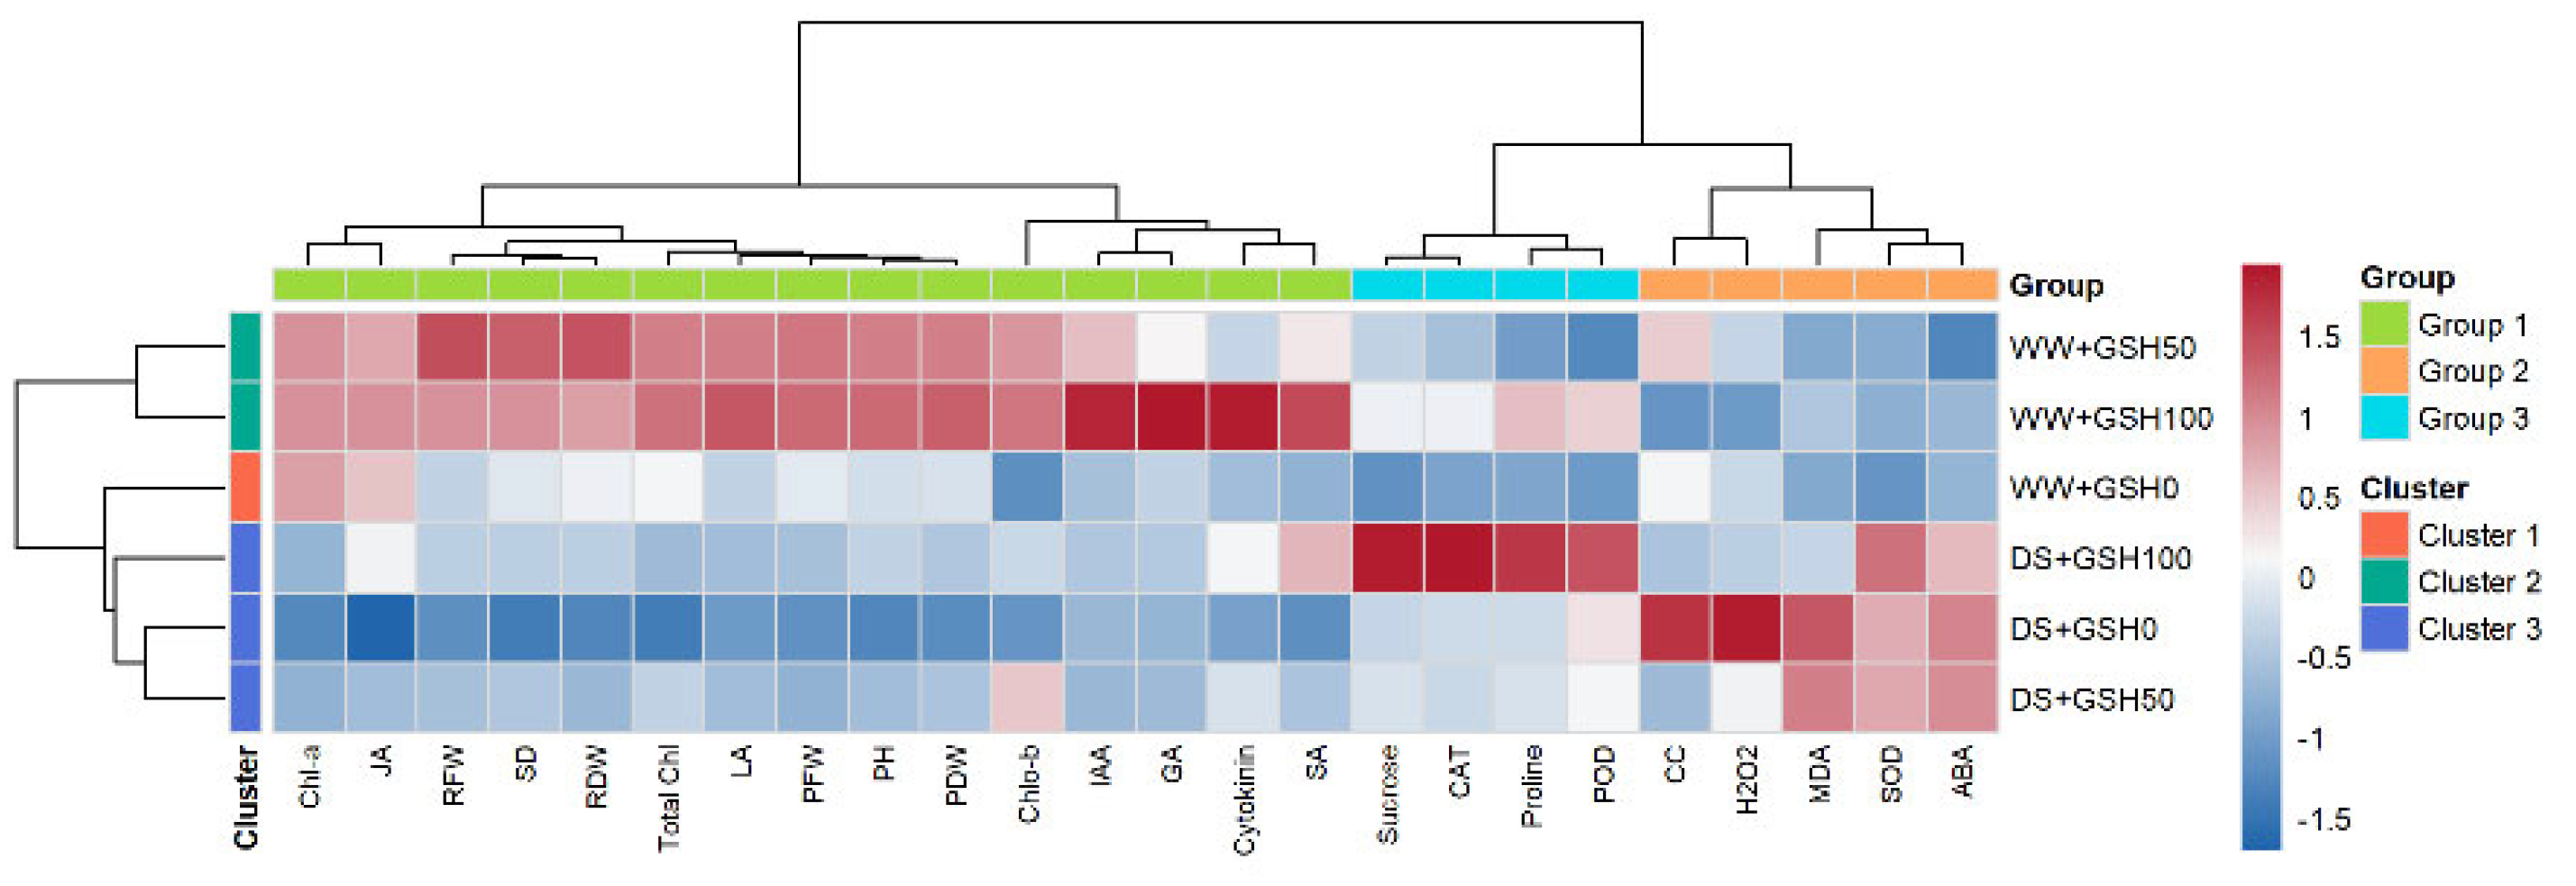
Figure 8.
Three-dimensional Varimax-rotated principal component analysis (3D PCA) biplot showing the associations among experimental treatments and the measured morphological, physiological, biochemical, and phytohormone variables in pepper plants. Experimental treatments are represented by points, whereas arrows indicate the loading vectors of the analyzed variables. The abbreviations of the analyzed variables are provided in Table 1.
Figure 8.
Three-dimensional Varimax-rotated principal component analysis (3D PCA) biplot showing the associations among experimental treatments and the measured morphological, physiological, biochemical, and phytohormone variables in pepper plants. Experimental treatments are represented by points, whereas arrows indicate the loading vectors of the analyzed variables. The abbreviations of the analyzed variables are provided in Table 1.
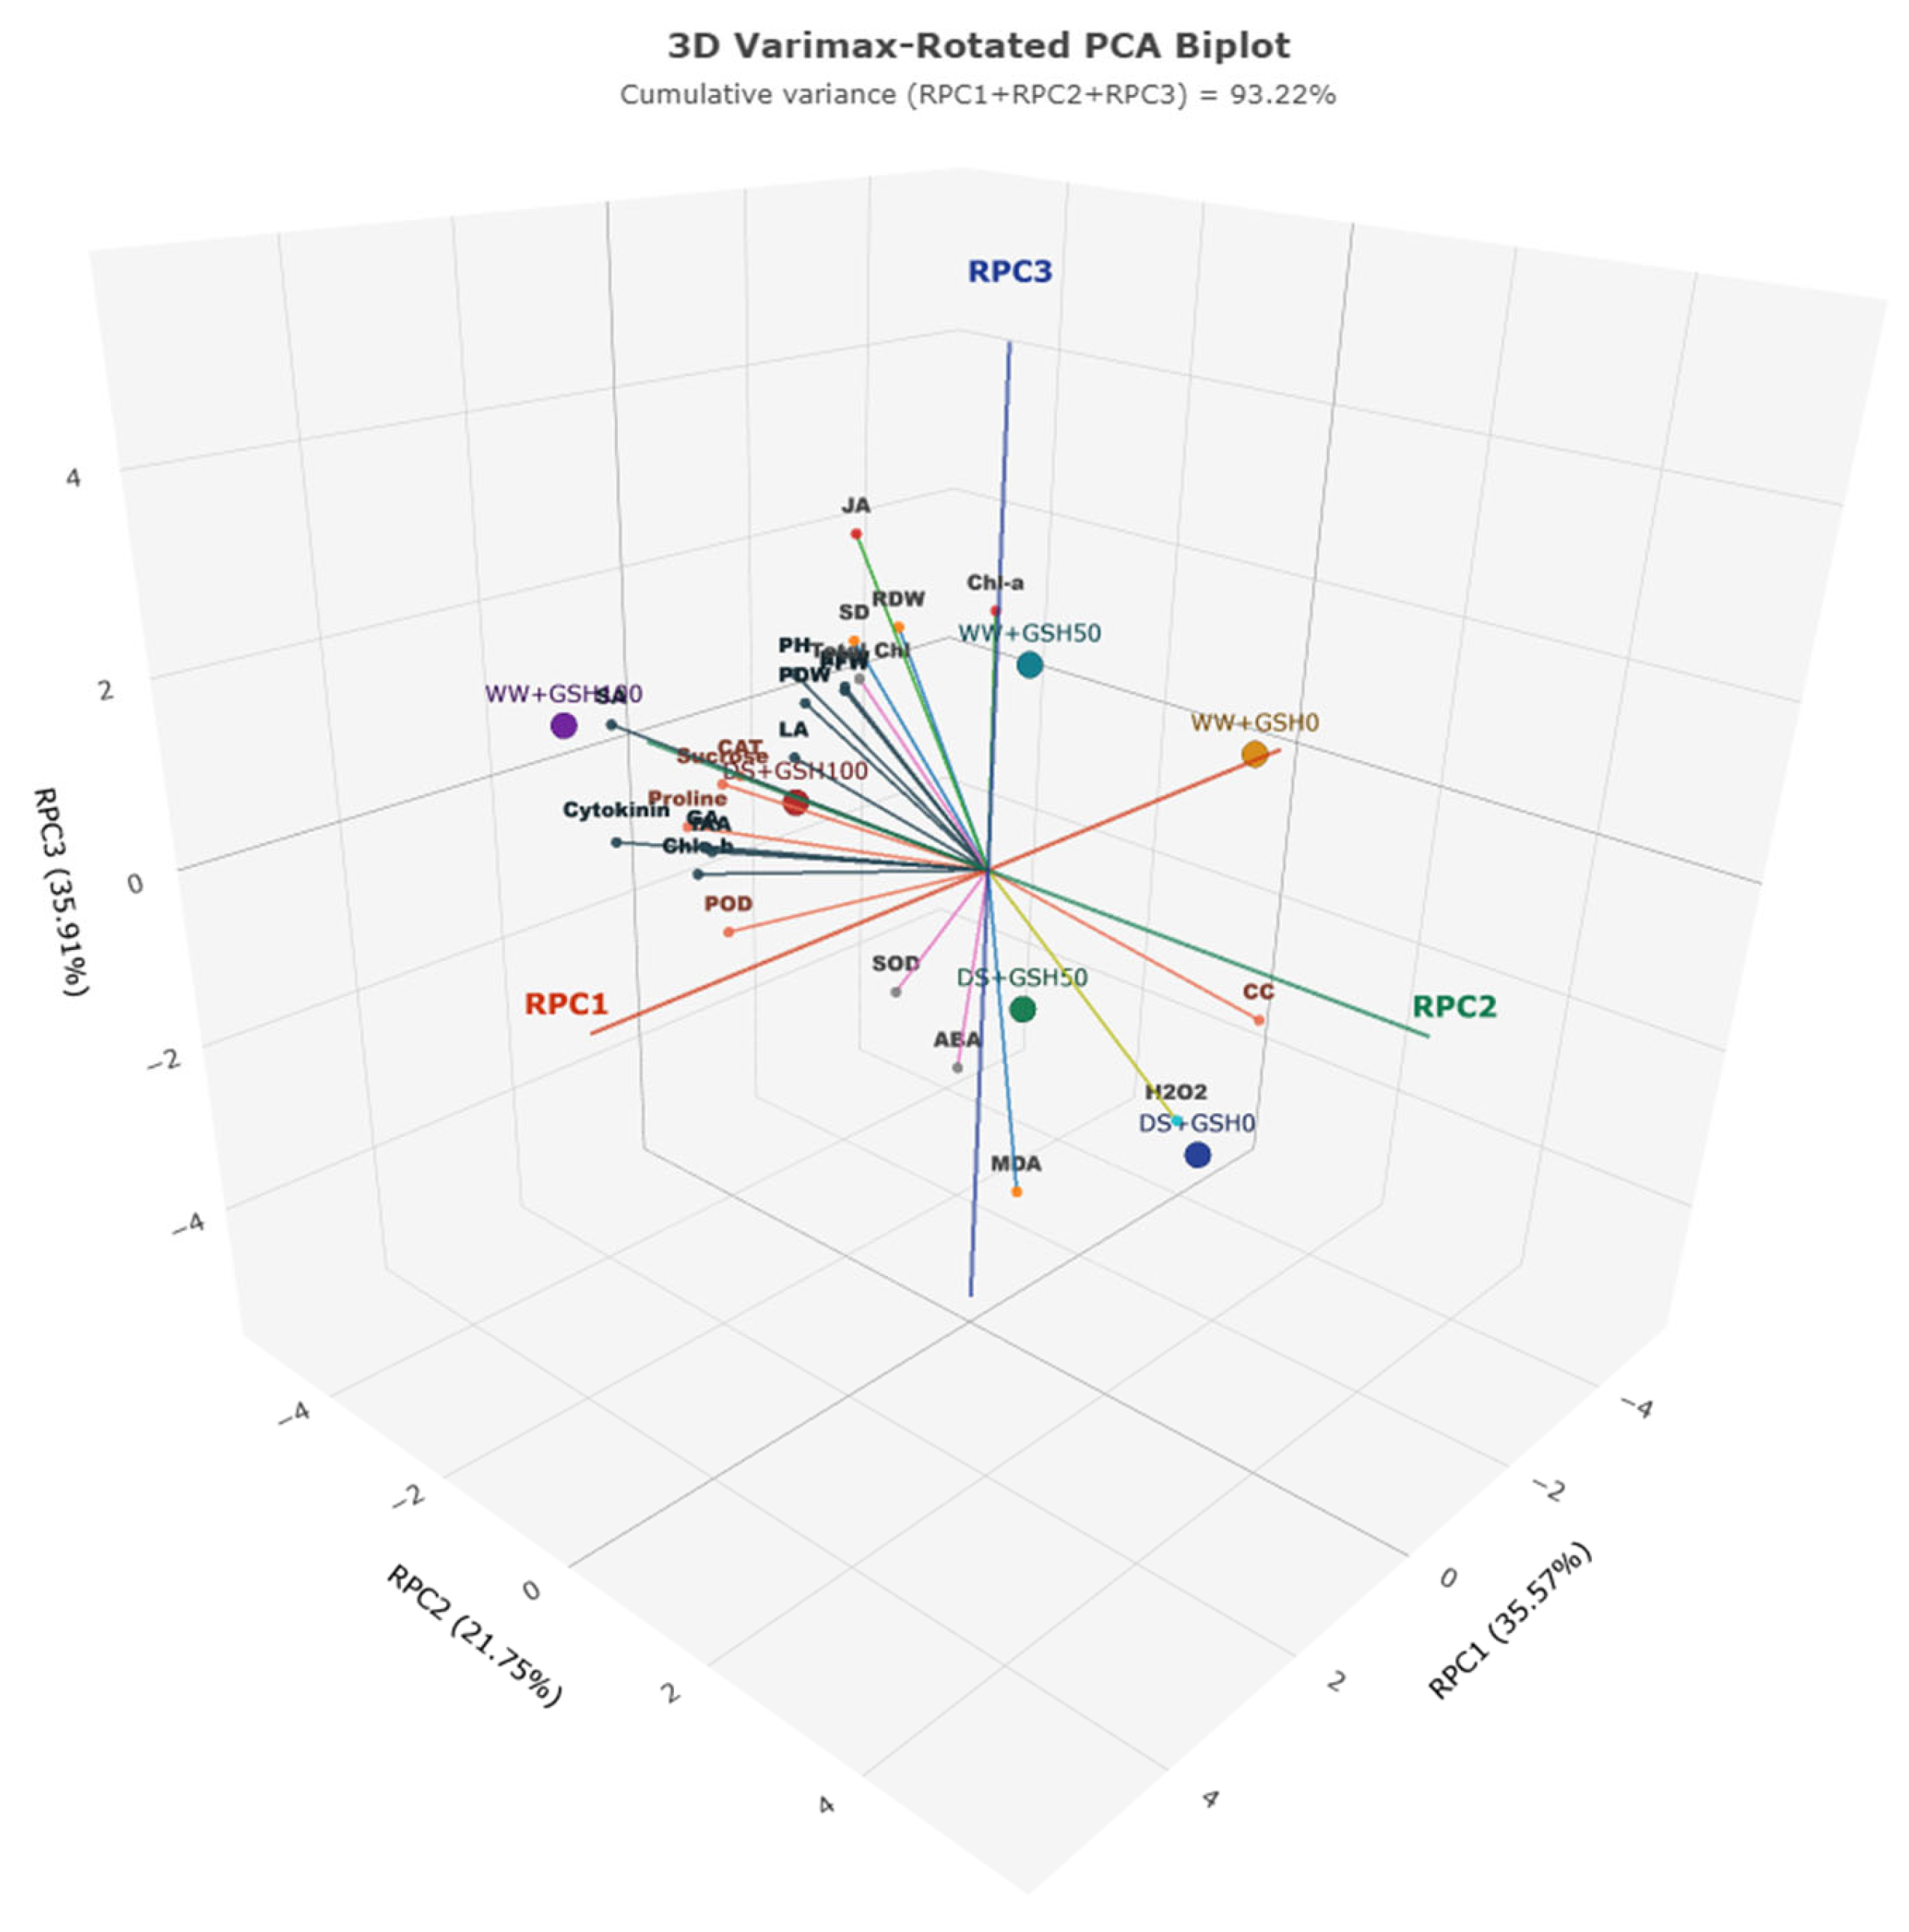

Table 1.
Mean squares from two-way analysis of variance for the effects of water regime (WR), foliar glutathione (GSH), and their interaction (WR × GSH) on growth, physiological, biochemical, and hormonal traits of pepper.
Table 1.
Mean squares from two-way analysis of variance for the effects of water regime (WR), foliar glutathione (GSH), and their interaction (WR × GSH) on growth, physiological, biochemical, and hormonal traits of pepper.
| Parameter | WR | GSH | WR × GSH | Error |
| (df = 1) | (df = 2) | (df = 2) | (df = 12) | |
| PH (cm) | 73.12*** | 18.86*** | 0.9914ns | 0.4583 |
| CC (SPAD) | 0.5689ns | 4.115ns | 2.521ns | 1.192 |
| SD (cm) | 1.269*** | 0.3116*** | 0.01417* | 0.00209 |
| LA (cm²/plant) | 40,580*** | 8,755*** | 2,996*** | 20.40 |
| PFW (g/plant) | 54.78*** | 7.395*** | 1.388*** | 0.01809 |
| RFW (g/plant) | 13.46*** | 3.939*** | 0.8146*** | 0.01167 |
| PDW (g/plant) | 0.3235*** | 0.06915*** | 0.00729* | 0.00157 |
| RDW (g/plant) | 0.04302*** | 0.00721*** | 0.00144*** | 0.000100 |
| Chl-a (mg/g) | 5.178*** | 0.06196ns | 0.03026ns | 0.02004 |
| Chl-b (mg/g) | 0.1805*** | 0.7262*** | 0.1088*** | 0.00663 |
| Total Chl (mg/g) | 7.279*** | 1.204*** | 0.04790ns | 0.02286 |
| H₂O₂ (mmol/kg) | 73.98*** | 50.24*** | 19.90*** | 0.1020 |
| MDA (mmol/kg) | 881.0*** | 66.95*** | 168.7*** | 1.271 |
| Proline (mmol/kg) | 0.00215*** | 0.00379*** | 0.0000500ns | 0.0000200 |
| Sucrose (%) | 1.300*** | 1.498*** | 0.3539*** | 0.00229 |
| SOD (EU/g FW) | 56,950*** | 849.0*** | 240.6*** | 16.27 |
| CAT (EU/g FW) | 1,497,000*** | 1,616,000*** | 397,900*** | 2,800 |
| POD (EU/g FW) | 17,080*** | 9,990*** | 121.0ns | 66.03 |
| IAA (ng/mg) | 518.9*** | 197.4*** | 145.0*** | 0.04137 |
| Cytokinin (ng/g DW) | 5.655*** | 14.51*** | 4.411*** | 0.04878 |
| ABA (ng/g DW) | 65,740*** | 800.9*** | 1,694*** | 3.572 |
| GA (ng/g DW) | 31.78*** | 13.87*** | 8.667*** | 0.3086 |
| SA (ng/g DW) | 2.154*** | 6.537*** | 0.09427*** | 0.00132 |
| JA (ng/g DW) | 0.3090*** | 0.05496*** | 0.02199*** | 0.000200 |
Values are mean squares. Significance (based on the F-test against the error term) is shown for the WR, GSH and WR × GSH sources. *** p < 0.001, ** p < 0.01, * p < 0.05; ns, not significant. Mean squares are given to four significant figures. WR, water regime; GSH, glutathione; PH, plant height; CC, chlorophyll content (SPAD); SD, stem diameter; LA, leaf area; PFW/RFW, plant/root fresh weight; PDW/RDW, plant/root dry weight; Chl, chlorophyll; MDA, malondialdehyde; SOD, superoxide dismutase; CAT, catalase; POD, peroxidase; IAA, indole-3-acetic acid; ABA, abscisic acid; GA, gibberellic acid; SA, salicylic acid; JA, jasmonic acid.
Table 2.
Varimax-rotated principal component loadings of the measured traits.
| Variable | RPC1 | RPC2 | RPC3 |
| PH | 0.7244 | 0.0617 | 0.6786 |
| CC | -0.4644 | 0.5311 | -0.3873 |
| SD | 0.6204 | 0.1335 | 0.7444 |
| LA | 0.8172 | 0.1554 | 0.5414 |
| PFW | 0.7065 | 0.1911 | 0.6692 |
| RFW | 0.6653 | 0.1516 | 0.6587 |
| PDW | 0.7568 | 0.1259 | 0.6377 |
| RDW | 0.5525 | 0.1971 | 0.7742 |
| Chl-a | 0.4216 | 0.35 | 0.8168 |
| Chlo-b | 0.8484 | -0.1159 | 0.2046 |
| Total Chl | 0.6808 | 0.2083 | 0.6931 |
| H2O2 | -0.452 | 0.3134 | -0.7631 |
| MDA | -0.143 | 0.0267 | -0.9753 |
| Proline | 0.1182 | -0.9692 | -0.1354 |
| Sucrose | 0.0088 | -0.9478 | -0.036 |
| SOD | -0.3297 | -0.606 | -0.6589 |
| CAT | -0.0746 | -0.9665 | -0.0386 |
| POD | 0.0569 | -0.8819 | -0.4393 |
| IAA | 0.9219 | 0.0125 | 0.3175 |
| Cytokinin | 0.8472 | -0.3907 | 0.1983 |
| ABA | -0.3577 | -0.3877 | -0.8319 |
| GA | 0.8897 | -0.0512 | 0.3016 |
| SA | 0.7369 | -0.5232 | 0.4176 |
| JA | 0.4189 | -0.0582 | 0.8963 |
| Eigen value | 8.536 | 5.22 | 8.617 |
| Variance (%) | 35.57 | 21.75 | 35.91 |
| Cumulative variance (%) | 35.57 | 57.32 | 93.22 |
Abbreviations were provided in Table 1.
Disclaimer/Publisher’s Note: The statements, opinions and data contained in all publications are solely those of the individual author(s) and contributor(s) and not of MDPI and/or the editor(s). MDPI and/or the editor(s) disclaim responsibility for any injury to people or property resulting from any ideas, methods, instructions or products referred to in the content. |
© 2026 by the authors. Licensee MDPI, Basel, Switzerland. This article is an open access article distributed under the terms and conditions of the Creative Commons Attribution (CC BY) license (http://creativecommons.org/licenses/by/4.0/).
Copyright: This open access article is published under a Creative Commons CC BY 4.0 license, which permit the free download, distribution, and reuse, provided that the author and preprint are cited in any reuse.