

Submitted:
06 August 2026
Posted:
10 August 2026
You are already at the latest version
Abstract
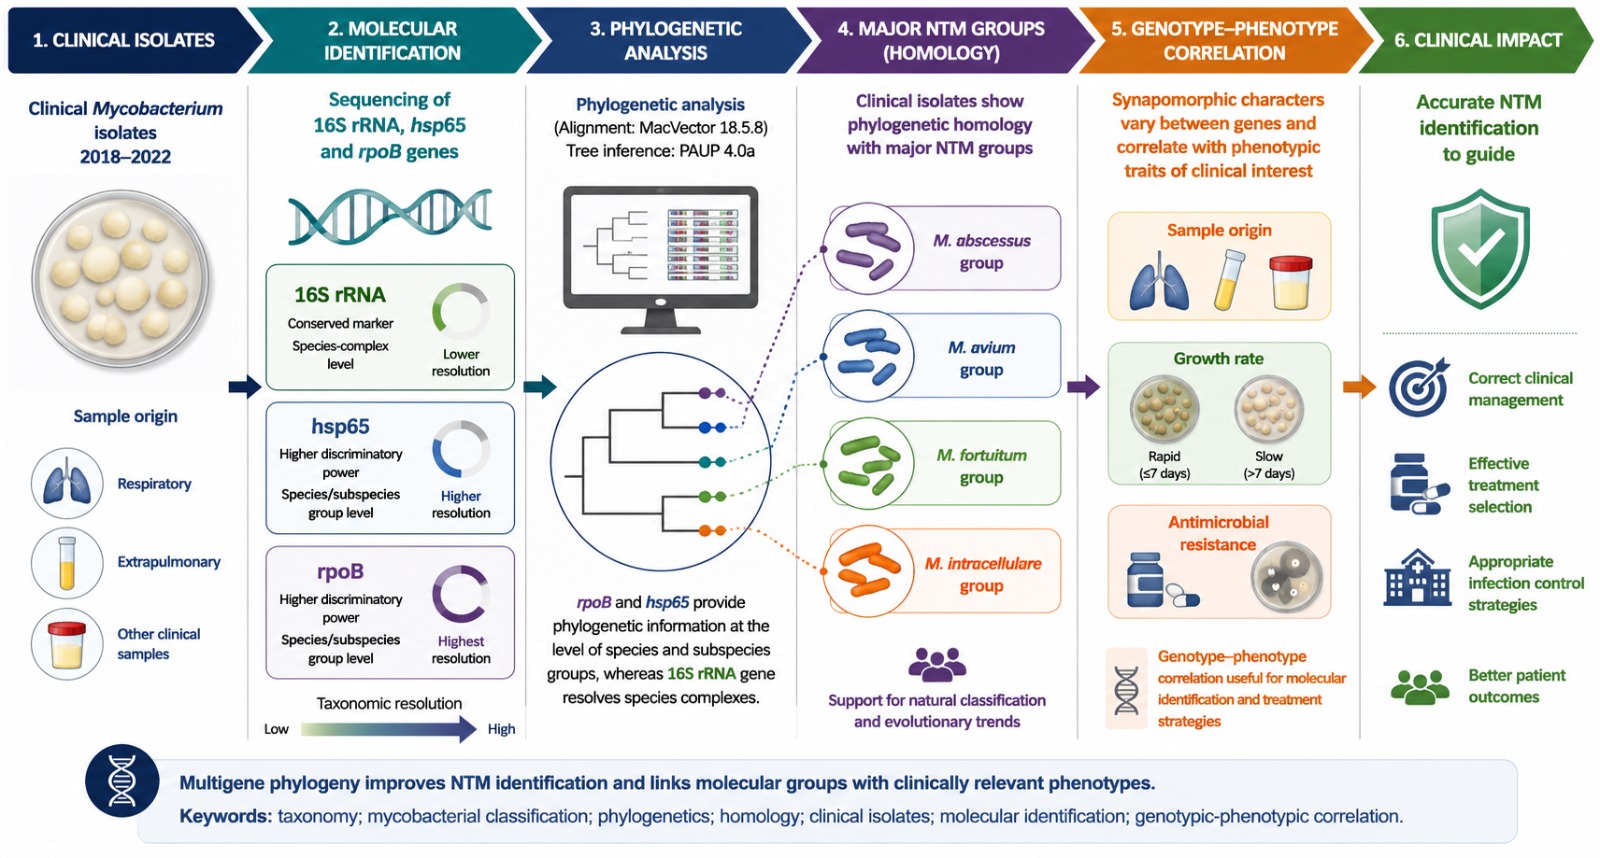
Due to the differential treatment required by non-tuberculous mycobacteria (NTM) infections, accurate identification in clinical isolates is necessary for correct management, effective treatment, and appropriate control strategies. Traditional methods, including phenotypic tests, are slow, cumbersome, and often not definitive. PCR-based methods, such as restriction fragment length polymorphism analysis, are still very time-consuming and sometimes lead to inaccurate identification because they handle fragments of different sequences but do not agree with their evolutionary origin. Sequencing is the most accurate method for species identification, with the 16S rRNA, hsp65, and rpoB genes being considered as candidates for phylogenetic and diagnostic studies. In this study, we developed a phylogenetic analysis using the 16S rRNA, hsp65, and rpoB gene sequences of Mycobacterium clinical isolates, collected between 2018 and 2022, for taxonomic categorization of Mycobacterium species, and evaluated their use for Mycobacterium species identification of clinical interest. In addition, we analyzed the genotype-phenotype correlation using characteristics such as sample origin, growth rate, and antimicrobial resistance. An alignment matrix was built (MacVector 18.5.8) based on the sequences generated in this study and sequences retrieved from NCBI, and phylogenetic analyses were performed using PAUP 4.0a. The rpoB and hsp65 markers showed phylogenetic information at the level of groups of species and subspecies, while the 16S rRNA gene was shown to be the most conserved gene, yielding a structure at the level of species complexes that can be used as a first level of identification. The clinical isolates showed phylogenetic homology with the M. abscessus, M. avium, M. fortuitum, and M. intracellulare groups. The synapomorphic characters varied between genes analyzed, showing a correlation between genotype and phenotype useful for evolutionary trends, natural classification, and molecular identification methods for clinical and treatment purposes. Keywords: taxonomy; mycobacterial classification; phylogenetics; homology; clinical isolates; molecular identification; genotypic-phenotypic correlation.
Keywords:
taxonomy
; mycobacterial classification
; phylogenetics
; homology
; clinical isolates
; molecular identification
; genotypic-phenotypic correlation
1. Introduction
Nontuberculous mycobacteria species (NTM) are a group of environmental organisms that can be found in water, including drinking water, soil, animals, plants, food, vegetation, and human feces. These species have the potential to cause diverse pathologies, ranging from pulmonary, skin and soft tissue infections to deeper infections with or without systemic dissemination. Some NTM species are well-recognized pathogens, while others are only recently emerging, and their pathogenic potential remains unknown [1,2].
Currently, diseases caused by NTM have increased compared to M. tuberculosis. This may be related to the introduction of more sensitive laboratory techniques, the development of genomic techniques that allow faster diagnosis of mycobacterial diseases and a rapid differentiation of NTM [3]. More than 150 Mycobacterium species have been identified, with a fast pace increase in species identified due to the advancement of genetic techniques [4]. The progress of genetics and the development of mathematical models for analysis, in addition to the contribution of the global network of genetic sequences available in real time in public domain databases, have contributed to the advancement and more common use of phylogenetic analyses [5].
Phylogenetic and taxonomic studies of Mycobacterium species have been largely based on the analysis of the 16S RNA gene. Its high information content, conserved nature and presence in all organisms have made this gene a suitable candidate for phylogenetic analysis and identification. However, some limitations persist, mainly the genetic similarity (greater than 94%) that exists between species of the genus Mycobacterium [6]. For this reason, the combination of molecular marker analysis, such as rpoB and hsp65, together with the analysis of the 16S rRNA gene, has become an effective system for identifying mycobacterial species [7]. The 65 kDa heat shock protein gene (hsp65), highly conserved among mycobacterial species with hypervariable regions [8], and the rpoB gene, which encodes the β-subunit of RNA polymerase and contains regions of conserved sequences flanking highly variable regions [9], are used as alternative or complementary tools to identify mycobacteria [10].
Correct identification of NTM species is important for selecting the appropriate treatment for patients or epidemiological purposes [11]. Treatment depends on the specific NTM species and may range from the use of one or more antimicrobials, anti-tuberculous agents, to surgical debridement. Therefore, most NTM isolates should be identified at the species level and not only as species groups [12], both for treatment and to establish whether it is a colonizer of the clinical specimen or a true pathogen.
NTM species are traditionally classified by their growth rates into rapidly growing mycobacteria (RGM) and slowly growing mycobacteria (SGM) based on the time required for visible colony formation. Species that produce visible colonies on subculture plates within 3–7 days are classified as RGM, whereas those that take longer than 7 days are classified as SGM [13].
Because NTMs are a heterogeneous group of microorganisms, drug susceptibility greatly varies within species [14]. Currently, treatment of almost all RGM infections includes antibiotics such as macrolides (clarithromycin, azithromycin), sulfas (trimethoprim-sulfamethoxazole), aminoglycosides (amikacin, tobramycin), quinolones (moxifloxacin, ciprofloxacin), oxazolidinones (linezolid), cephamycins (cefoxitin), carbapenemics (imipenem), and tetracyclines (minocycline, doxycycline and tigecycline). While for infections caused by the SGM group, the regimen additionally includes ethambutol, isoniazid, streptomycin, and rifampicin (anti-tuberculous) [15].
Differences in antimicrobial susceptibility that determine treatment options among different mycobacteria mean that identification of NTMs to the species level is becoming increasingly important clinically. Mycobacterial susceptibility testing, therefore, is important for appropriate patient management and should be performed on clinically significant isolates of certain NTMs [12].
Although intraspecific and interspecific variations among mycobacteria from different geographic regions have been extensively studied using DNA sequences of 16S rRNA, rpoB and hsp65 genes, for ecological genetic studies, phylogenetic and evolutionary analyses, there is a lack of information on genetic variation among mycobacteria isolated from populations from various geographic regions, where mycobacterial infection is a major health problem [16]. Similarly, Ecuador has limited information on the genetic and epidemiological diversity of mycobacteria isolated from human samples [17] and in greater proportion in environmental NTM [18].
Therefore, in this study, we propose to develop a phylogenetic analysis using 16S rRNA, hsp65 and rpoB gene sequences for taxonomic categorization and accurate species identification, genotype-phenotype correlation and understanding of the prevalence and phylogenetic structure of NTM isolated from clinical samples from a private laboratory in the city of Quito, Ecuador.
2. Materials and Methods
2.1. Samples/Sequences Selected for the Study
All 2018-2022 samples (57) of the Mycobacterium genus stored in the Microbiology service of Zurita & Zurita Laboratories, with respiratory and non-respiratory origin, were selected for PCR amplification and sequencing. Previously, NTMs were identified using acid-fast staining (Ziehl-Neelsen). Samples were seeded in Loewenstein-Jensen medium and Middlebrook 7H9 on the BACTEC 320 automated bacteriological system. For the purpose of this study, the previously isolated and identified strains were thawed and subcultured on chocolate agar medium for fast-growing strains and on Lowenstein-Jensen medium for slow-growing strains and incubated at 35°C with 5% CO2.
Definitive identification was performed by molecular methods using 16S rRNA, rpoB, and hsp65 gene sequencing. The sequences were entered into GenBank for preliminary identification; however, in certain cases where the species are closely related, the sequences could not be definitively identified. Therefore, all species were subjected to phylogenetic analysis.
Fisher's test was used to evaluate differences in the data for the different mycobacterial species analyzed. Statistical significance was set at p < 0.05. Analyses were performed in Past4.06b [19].
2.2. Antimicrobial Resistance Analysis
Positive samples were detected by the BACTEC 960 system (Becton Dickinson, USA). Antibiotic resistance testing was evaluated using the broth microdilution technique (MIC) with Sensititre system plates (Thermo Fisher Scientific, USA) for slow-growing NTM (SLOMYCO) and fast-growing NTM (RAPIDMYCO), according to the manufacturer's recommendations [11].
The antibiotics tested for RGM were trimethoprim/sulfamethoxazole, amikacin, clarithromycin, moxifloxacin, ciprofloxacin, linezolid, doxycycline, tigecycline, tobramycin, imipenem, minocycline, amoxicillin/clavulanic acid, cefepime, ceftriaxone, and for SGM were: trimethoprim/sulfamethoxazole, amikacin, clarithromycin, moxifloxacin, ciprofloxacin, linezolid, doxycycline, ethambutol, streptomycin, ethionamide, isoniazid, rifabutin, and rifampicin. The interpretation was performed according to CLSI guidelines [20]. Many mycobacteria do not have established breakpoints, therefore, in addition to the CLSI, other guidelines were used [21]. The antibacterial resistance index (ARI) [22] was calculated to assess resistance in the different mycobacterial species identified. This index relates pathogen susceptibility and antibiotic use to represent the overall level of resistance and efficacy of antibiotic therapy [23].
2.3. Genomic Extraction, Amplification and Sequencing
Genomic DNA was extracted using the QIAamp DNA Minikit kit (QIAgen, Hilden, Germany) directly from chocolate agar medium or Lowenstein-Jensen's medium once NTMs formed visible colonies. Procedures and reagents were used according to the manufacturer's protocol. Eluted DNA was stored at -20°C until PCR analysis. Amplification of 16S rRNA, rpoB and hsp65 genes was performed. The primers for amplification and the expected amplicon sizes are listed in Table 1.
The following cycling conditions were used: initial denaturation of 4 min at 95°C; 35 cycles of 30s at 95°C, 1 min at 60°C (hsp65), 55°C (rpoB), 57°C (16S rRNA), 1 min at 72°C; and a final extension of 10 min at 72°C. PCR products were visualized on 1.5% agarose gel electrophoresis under ultraviolet light.
The PCR products of the three genes were sequenced by the Sanger method using the same amplification primers, with the exception of the 16S rRNA gene, where primers 518F (5'-CCAGCAGCAGCCGCGGGGTAATACG-3') and 800R (5'-TACCAGGGTATCTAATCC-3') were used to cover the entire region [26].
2.4. Sequence Alignment and BLAST
The sequences produced by the forward and reverse primers were aligned using Sequencher 5.4.6 (Gene Codes Corporation, Ann Arbor, MI, USA) to obtain a consensus sequence [27], labeled with a respective code. Consensus sequences were aligned against the NCBI GenBank database using the BLASTn local alignment tool to obtain preliminary identity assessments, including percent nucleotide similarity and coverage values. Mycobacterial sequences for each marker (16S rRNA, rpoB, and hsp65) were retrieved from NCBI. A total of 167 sequences were included: 53 for 16S rRNA, 57 for rpoB, and 57 for hsp65. Sequences from related reference groups and outgroups, such as Tsukamurella species, Gordonia, and Nocardia [28], were also incorporated in the analysis. The Mycobacterium species and reference-group sequences used are listed in Supplementary Table 1, along with their respective localities, sample origins, and GenBank accession numbers.
An alignment matrix was constructed for each gene or marker using ClustalW in MacVector software 18.5.8 with Gap Creation Penalty-GOP and Gap Extension Penalty-GEP parameters of 30.0 and 10.0, respectively, looking for the highest degree of positional homology.
2.5. Phylogenetic Analysis
The respective aligned matrices were used for the phylogenetic hypothesis reconstruction as a second level of identification, using PAUP 4.0a (build 169) software for Maximum Parsimony (MP) optimization [29] and MEGAX for Maximum Likelihood (ML) were conducted using MEGA version X [30,31] of the 16S rRNA, rpoB and hsp65 genes.
The nucleotide substitution model of each matrix for ML analysis was calculated by Model Test under MEGAX, calculated by Akaike's criterion, and Bayesian Information Criterion (BIC). The ML tree was constructed with an initial MP tree and the respective model for each matrix-gene-marker.
MP construction was performed with 1,000 replicates of random addition of taxa and characters and branch swapping with TBR (Tree Bisection and Reconnection). Subsequently, homologous character reweighting was performed using the recalculated consistency index (RCI) and values. The branch support (in percentages) was obtained using 1,000 bootstrap pseudoreplicates of the matrix as a posteriori statistical support of clades or branches [32]. The sequence of analyses is based on previous work [28,33,34]. Using the same methodological approach, after performing individual analyses for each gene, a concatenated analysis of all three genes was conducted to confirm the final topology and assess the contribution of the information of each gene to the combined phylogeny.
As a third level of verification of molecular identification and for purposes of classification into complexes, groups, and verification of phylogenetic species (phylogenetic species concept), each monophyletic clade was evaluated by inter- and intra-clade divergence through the construction of distance matrices using the uncorrected p-distance model, as well as between sequences obtained from NCBI and those obtained in the laboratory.
2.6. Ethical Considerations
The mycobacteria samples come from the Zurita & Zurita Laboratories Biomedical Research Unit strain, which approved the use of mycobacteria from the strain, and has no information related to patient data.
3. Results
Sensitivity profile data, the nature of the clinical specimen, growth type, and year of collection were collected for all isolates. Most mycobacteria were isolated from respiratory specimens (31/57; 54.4%), followed by skin and soft tissues (25/57; 43.8%) and an effusion (1/57; 1.8%).
Of 57 samples, three (3/57; 5.26%) were identified as M. tuberculosis and 54 (94.74%) as NTM by phenotypic methods. In 24.56% (14/57) of the cases, NTMs were classified as SGM, and 70.17% (40/57) as RGM.
3.2. Antimicrobial Resistance Analysis
3.2.1. Analysis of Antimicrobial Resistance in RGMs
All isolates were subjected to susceptibility testing. Amikacin was the most active drug against RGM. No isolates were resistant to amikacin. A single isolate was resistant to tigecycline. For clarithromycin, 7.5% (3/40) of RGM were resistant. The resistance rate to linezolid was 42.5%. Resistance rates to amoxicillin/clavulanic acid, cefepime, and ceftriaxone showed 100% resistance in all isolates in the RGM group. Resistance rates to minocycline (32/40; 80%), imipenem (25/40; 62.5%), tobramycin (27/40; 67.5%), doxycycline (32/40; 80%), ciprofloxacin (33/40; 82.5%), moxifloxacin (20/40; 50%), and trimethoprim/sulfamethoxazole (25/40; 62.5%) were high for RGM (Table 2).
3.2.2. Analysis of Antimicrobial Resistance in SGMs
Resistance to clarithromycin was not observed in any isolate. Resistance rates to ciprofloxacin (6/14; 42.8%), linezolid (6/14; 42.8%), trimethoprim/sulfamethoxazole (5/14; 35.7%), moxifloxacin (5/14; 35.7%), ethionamide (4/14; 28.6%), rifabutin (3/14; 21.4%), amikacin (2/14; 14.3%), rifampicin (2/14; 14.3%), ethambutol (2/14; 14.3%), were less than 50% with the exception of streptomycin (7/14; 50%), isoniazid (7/14; 50%) and doxycycline (11/14; 78.6%) (Table 3).
Differences were observed between the two types of mycobacteria in terms of the ARI (0.54 vs. 0.25). RGM showed a higher rate of resistance compared to SGM. The 3 subspecies of M. abscessus showed the highest rate of resistance among RGM in terms of the ARI (0.65). Within the SGM group, strains belonging to M. avium exhibited a higher resistance rate, as indicated by the ARI (0.41). After analysis of the ARI, M. abscessus-chelone complex showed a higher value than the other complexes, with a value of 0.61.
3.3. Molecular Identification by Phylogenetic Analysis
Phylogenetic trees of the three 16S rRNA, rpoB and hsp65 genes were constructed, first from the genes separately and then using the concatenated data from a single alignment data set. All trees were rooted using the sequences of Nocardia, Gordonia and Tsukamurella species as outgroups, forming a monophyletic and basal group concerning Mycobacterium species, which were internally placed in a monophyletic group. The topologies and most of the interrelationships between Mycobacterium species were very similar and consistent in all the trees constructed, as well as the MP and ML results.
3.3.1. 16S rRNA Gene Phylogenetic Analysis
For the construction of the phylogenetic tree based on the 16S rRNA gene, an alignment matrix of 1400 base pairs or positional characters by 102 sequences or taxa was used. The resulting tree is shown in Figure 1. It was possible to observe the grouping of the Mycobacterium members into four main clades. Two of these clades are composed of slow-growing species, while the other two clades are composed of fast-growing species. Within the clade of fast-growing species, the basal subclade corresponds to the group we refer to as "Fortuitum", which encompasses most of the other fast-growing species and the inner or derived subclade as "Abscessus-Chelonae". Relationships among species in the "Fortuitum" subclade were difficult to discern, unlike members of the "Abscessus-Chelonae" subclade, which formed a monophyletic lineage with a bootstrap value of 100% within the other fast-growing Mycobacterium species and comprises the deepest-branching lineage among Mycobacterium species. For the case of M. phlei, M. thermoresistible and M. monacense species, which compose the fast-growing species and belong to the subclade "Fortuitum", the formation of an earlier branching lineage within the genus Mycobacterium was observed.
Of the two clades of slow-growing mycobacteria, the subclade designated as "Tuberculosis-Avium" contains most of the clinically important mycobacterial species, such as M. tuberculosis and M. avium; and the "Terrae" subclade, which forms a sister and derivative clade with the "Tuberculosis-Avium" subclade.
The percentage of divergence of the 16S rRNA sequences within each subclade was low; the species of the "Terrae" subclade had a value of 1.46%, of the "Tuberculosis-Avium" subclade a value of 1.23%, of the "Abscessus-Chelonae" subclade a value of 0.93%, and of the "Fortuitum" subclade a value of 1.15%. For the case of complexes, the divergence percentages were for M. tuberculosis complex 0.35%, M. avium complex 0.079%, M. intracellulare complex 0.20%, M. abscessus-chelonae complex 0.20% and M. fortuitum complex 0.1%.
The divergence between M. tuberculosis and M. avium complexes was 1.80%, between M. tuberculosis and M. intracellulare was 2%, between M. avium and M. intracellulare was 0.6% and the divergence between M. abscessus-chelonae and M. fortuitum complexes was 3.97 %.
Of the 54 samples analyzed using the 16S rRNA gene, only three isolates were identified to species level: sample L572 as M. marinum, L535 as M. chelonae and L39 as M. fortuitum. The other isolates were identified at the complex or group level, the most predominant being M. abscessus-chelonae complex
3.3.2. rpoB Gene Analysis
For the rpoB gene, an alignment matrix comprising 720 nucleotide positions across 102 sequences (taxa) was used. Phylogenetic analysis of this region yields a different topology than that obtained from the 16S rRNA gene. The rpoB gene tree based on the mycobacterial is shown in Figure 2.
In the rpoB tree topology, Mycobacterium is shown as a monophyletic clade with respect to the reference groups. The formation of two supported and differentiated monophyletic groups was observed. Group A is formed by the species belonging to the M. tuberculosis, M. avium-intracellulare and M. fortuitum complexes and group B is formed by the species of the M. abscessus-chelonae complex, which shows an earlier branching within the genus Mycobacterium. This species location on the tree is related to antibiotic susceptibility; thus the species belonging to M. abscessus-chelonae complex with a higher ARI value form a separate clade with respect to the other mycobacterial species (Figure 2).
The rpoB gene could not differentiate among subspecies or variants within the different mycobacterial complexes. An exception was the M. abscessus complex, in which M. chelonae was clearly distinguished from the M. abscessus complex. However, differentiation among subspecies within the M. abscessus complex was not achieved, with M. bolletii and M. massiliense clustering together as M. bolletii/massiliense. Only M. abscessus subsp. abscessus formed a well-supported monophyletic group with the related isolates (bootstrap = 100%). The percentage of sequence divergence among species within each complex was 1.54% for the M. tuberculosis complex, 0.33% for the M. avium complex, 0.80% for the M. intracellulare complex, 2.76% for the M. abscessus–chelonae group, and 3.20% for the M. fortuitum complex.
The divergence between M. tuberculosis and M. avium complexes was 14.89%, between M. tuberculosis and M. intracellulare was 14.61%, between M. avium and M. intracellulare was 5.6%, and the divergence between M. abscessus-chelonae and M. fortuitum complexes was 12.28%.
Of the 57 clinical isolates, 39 isolates were identified to species level: 28 isolates were identified as M. abscessus, of which 22 were identified to subspecies level as M. abscessus subsp. abscessus; seven isolates were identified as M. chelonae; three as M. fortuitum; and one as M. marinum, the rest were only identified to complex or group level.
3.3.3. hsp65 Gene Analysis
Finally, the analysis was performed with the hsp65 gene, using an alignment matrix of 400 base pairs or positional characters for 105 sequences or taxa. It is possible to visualize the formation of two clearly defined groups: those belonging to the M. abscessus-chelonae complex, M. tuberculosis, M. avium, M. intracellulare, and the second group formed by the M. fortuitum complex that presents a more basal branching (Figure 3). After the statistical analysis of the demographic characteristics, it was identified that the clade differentiation could be related to the type of sample, obtaining that the species belonging to the clade A are more frequently isolated from respiratory samples, while those of the clade B are mainly isolated from non-respiratory samples (p=0.0157).
The percentage of divergence of species within complexes for M. tuberculosis had a value of 1.68%, M. avium a value of 0.11%, M. intracellulare a value of 1.10%, M. abscessus-chelonae a value of 2.98% and M. fortuitum a value of 2.10%. The divergence between M. tuberculosis and M. avium complexes was 7.02%, between M. tuberculosis and M. intracellulare was 7.46%, between M. avium and M. intracellulare was 4.16% and the divergence between M. abscessus-chelonae and M. fortuitum complexes was 6.90%.
Thirty-five (61.4%) isolates were species of the M. abscessus complex, with M. abscessus subsp. abscessus being the most predominant of the subspecies with 22 isolates (62.8%), followed by M. abscessus subsp. massiliense with 5 isolates (14.3%) and M. abscessus subsp. bolletii with 1 isolate (2.8%). Seven (20%) isolates were from the M. chelonae group. Three isolates were identified in the M. tuberculosis complex, but failed to differentiate their individual species. In the case of M. intracellulare complex, only two isolates were differentiated as M. intracellulare, the other 3 isolates were identified only at the complex level. In the case of M. avium complex, only the subspecies M. avium subsp. hominissuis was differentiated among the other subspecies, forming a branch with 7 isolates with a bootstrap of 86%. One isolate failed to differentiate beyond the M. avium complex level.
For M. fortuitum complex, it was possible to differentiate between species of this complex, obtaining 2 isolates belonging to the species M. conceptionense and 3 isolates belonging to M. fortuitum. In addition, 1 isolate was identified as M. marinum.
3.3.4. Analysis of Concatenated Genes
Another phylogenetic tree was constructed based on concatenated sequences of the 3 genes analyzed, achieving a better recovery of the species level, including those belonging to the clade "Fortuitum", which was not achieved with the analysis of the 3 individual genes (Figure 4). It was not possible to differentiate between the subspecies M. bolleti and M. massillense. The topology was similar to that of the phylogenetic tree obtained with the rpoB gene.
Sequence divergence within each complex was 1.09% for M. tuberculosis, 0.15% for M. avium, 0.62% for M. intracellulare, 1.29% for M. abscessus-chelonae and 2.26% for M. fortuitum. The divergence between M. tuberculosis and M. avium complexes was 5.72%, between M. tuberculosis and M. intracellulare was 5.87%, and between M. avium and M. intracellulare was 2.37%. Finally, the divergence between M. abscessus-chelonae and M. fortuitum complexes was 6.4%.
In the concatenated analysis, M. chelonae was identified with seven isolates (bootstrap support 78%), M. fortuitum with three isolates (bootstrap support 58%), M. conceptionense with two isolates (bootstrap support 96%), M. abscessus subsp. abscessus (bootstrap support 70%), M. marinum with one isolate (bootstrap support 100%), and M. intracellulare with three isolates (bootstrap support 91%).
Among the three genes analyzed, the hsp65 typing method showed better agreement for species- and subspecies-level identification, whereas the concatenated analysis provided superior overall phylogenetic topology.
This study identified 35 (64.8%) isolates belonging to the Mycobacterium abscessus complex, making it the most prevalent group. These included Mycobacterium abscessus subsp. abscessus (n = 29), Mycobacterium abscessus subsp. massiliense (n = 5), and Mycobacterium abscessus subsp. bolletii (n = 1). In addition, seven Mycobacterium chelonae isolates (12.9%) were identified as a separate species. The remaining isolates were identified as Mycobacterium avium subsp. hominissuis (n = 7, 12.9%), Mycobacterium fortuitum (n = 3, 5.5%), Mycobacterium intracellulare (n = 2, 3.7%), Mycobacterium conceptionense (n = 2, 3.7%), and Mycobacterium marinum (n = 1, 1.8%). Four isolates were identified only at the complex level: one (1.8%) Mycobacterium avium complex and three (5.5%) Mycobacterium intracellulare complex.
4. Discussion
The incidence of NTM infections in clinical specimens has increased in several regions of the world, so the immediate diagnosis and clear and accurate identification of NTM species causing the disease has become a necessity [35]. In Ecuador, the incidence of atypical mycobacteria in clinical specimens is unknown and the only available data are case reports of some species, including M. scrofulaceum [36], M. terrae [37], M. abscessus subsp. abscessus [38], M. timonense [39] and M. monacense [40]. Therefore, the present study proposes a way to accurately identify mycobacteria and determine the diversity of species isolated from clinical samples.
Molecular techniques have enabled accurate, rapid, and reliable identification of mycobacterial species, with whole-genome sequencing regarded as the gold standard for NTM identification [41]. However, these approaches are expensive, require specialized expertise, and are not readily available in routine laboratories in resource-limited contexts [42]. As an alternative, sequencing of highly conserved yet hypervariable regions, such as the 16S rRNA (~1500 bp), rpoB (~3500 bp), and hsp65 (~1600 bp) genes, has become more widespread in diagnostic workflows [43]. Many studies have focused on partial regions within these genes that balance sufficient conservation with intraspecies variability to achieve accurate identification while reducing costs. In our study, we analyzed the full-length 16S rRNA gene (1500 bp), a 400 bp fragment of hsp65 [24], and a 720 bp fragment of rpoB [10].
Phylogenetic analysis of 16S rRNA, rpoB and hsp65 generally showed topologically similar trees. In the case of the 16S rRNA tree, clades comprising most of the slow-growing mycobacteria were clearly differentiated from the fast-growing species. This differentiation is evident due to the insertion of 12 to 14 nucleotides in the 16S rRNA sequences in SGM, which are often used as a marker to differentiate between RGM and SGM [44]. In the analysis performed in this study, a 12-nucleotide insertion was observed in SGM mycobacteria belonging to the "Tuberculosis" subclade, and a 14-nucleotide insertion belonging to mycobacteria of the "Terrae" subclade (Figure 1).
Regarding the phylogenetic analysis of the rpoB gene, the M. abscessus-chelonae complex separated from the M. fortuitum complex, forming a separate clade. This differentiation may be related to resistance characteristics, as species in the M. abscessus–chelonae complex exhibit higher ARI values than other mycobacteria. Being members of the M. abscessus-chelonae complex, belonging to group B, the bacteria with higher resistance rates compared to mycobacteria grouped with group A [45,46] (Figure 2). Statistical analyses of antimicrobial resistance profiles showed that members of the M. abscessus-chelonae complex presented the highest ARI (0.61) with respect to the other species. This phenotype has generally been attributed to mycobacterial envelope impermeability, with the cell wall of M. abscessus and M. chelonae being 10 to 20 times less permeable than other mycobacteria, due to the higher lipid content, which coincides with M. abscessus-chelonae complex being the most resistant to antibiotics [47].
The rpoB gene contains additional useful information related to rifampicin susceptibility of a particular species (or strain) of mycobacteria [48]. Rifampicin resistance is largely associated with mutations in an 81 bp fragment of the rpoB gene, in addition to other mechanisms such as reduced cell wall permeability or an enhanced efflux pump [15].
RGM, with common representatives including M. abscessus [49] and M. fortuitum [50], exhibit intrinsic resistance to rifampicin. In contrast, SGM such as M. tuberculosis often develop acquired resistance mediated by mutations in the rpoB gene or by overexpression of efflux pumps [51]. Rifampicin resistance in M. abscessus is attributed to its distinctive cell wall, characterized by higher lipid content and the presence of ADP ribosyltransferases, rather than the rpoB mutations that predominate in many other mycobacteria [52]. Although M. fortuitum is classified as an RGM, rifampicin resistance in this species has also been linked to rpoB gene mutations similar to those observed in M. tuberculosis [53], which makes M. fortuitum a useful surrogate for M. tuberculosis in susceptibility testing studies. These differences in resistance phenotypes may reflect the clear phylogenetic separation observed between these species.
The divergence in the phylogenetic analysis of rpoB could also be related to the G+C% content in mycobacterial species. It is known that the rpoB gene allows an efficient estimation of bacterial G+C% content [54], therefore the species found in group A, corresponding to the M. tuberculosis, M. avium, M. intracellulare and M. fortuitum complexes, which present higher G+C% contents, with values of 65.6%, 69.1%, 68% [55] 2021) and 66% [56], respectively, formed a monophyletic group differentiated from members of group B species corresponding to the M. abscessus-chelonae complex that present the lowest G+C% values, with a value of 64.2% [57].
Finally, the hsp65 gene tree showed a clustering of the M. abscessus-chelonae, M. tuberculosis, M. intracellulare and M. avium complex species into a single clade separate from the M. fortuitum complex members. This structured topology between clades could be related to sample type or origin, which upon statistical analysis showed a statistically significant difference of clades vs. sample type (p= 0.0157), suggesting that there is a higher prevalence of species isolated from respiratory samples in clade A in contrast to clade B. Species of the M. abscessus-chelonae complex have been isolated more frequently from respiratory infections, a characteristic shared with the slow-growing mycobacteria, as opposed to M. fortuitum, which produces a wide variety of extrapulmonary diseases, 60% of cases being cutaneous infections [45]. It has been established that three species make up the vast majority of pulmonary infections by atypical mycobacteria; these are: M. avium, M. kansasii and M. abscessus [58], similar to the results obtained in our analysis.
The hsp65 gene encodes a virulence-associated protein that plays an important role in mycobacterial latency [59]. Accordingly, divergence observed in phylogenetic analyses of hsp65 may reflect the pathogenic potential within the genus Mycobacterium, dividing more pathogenic species into group A and less pathogenic species into group B. Slow-growing species, most notably M. tuberculosis and M. leprae, are generally the most pathogenic, whereas most rapidly growing species exhibit lower pathogenicity. An exception is M. abscessus, which, owing to its extensive repertoire of virulence factors, phenotypically resembles slow-growing pathogens [60]. For example, a comparative study of pulmonary disease caused by M. abscessus and M. avium highlighted similarities in pathogenicity [45]. Moreover, at the cellular level, M. abscessus mimics features of pathogenic slow-growing mycobacteria, such as the ability to survive and replicate within macrophages. In contrast, M. fortuitum cannot multiply within macrophages and is rapidly cleared from infected cells [61].
Phylogenetic analyses yielded molecular identification of nine species using 16S rRNA, rpoB and hsp65 genes as molecular markers, with M. abscessus subsp. abscessus being the most prevalent species, followed by M. chelonae and M. avium subsp hominissuis. Not all molecular markers were able to reach species level identification, similar to the result reported by Ledesma et al., [28]. The hsp65 gene yielded optimal results in terms of species and subspecies identification.
Although the 16S rRNA gene is commonly used for bacterial identification and has a large amount of information in the NCBI database [62], for NTMs, the sequences show little interspecific variation, so it may not distinguish closely related species [28], with sequencing of the 16S rRNA region alone being insufficient [63]. In our study, only three isolates were identified to species level using the 16S rRNA gene: M. marinum, M. chelonae, and M. fortuitum.
In this study, the percentage of divergence between the M. abscessus-chelonae, M. tuberculosis and M. bovis, M. fortuitum complexes was lower using the 16S rRNA gene compared to rpoB and hsp65, which corroborates the difficulty in distinguishing the species using 16S rRNA sequences alone. Members of these complexes could be better distinguished by analysis of the hsp65 and rpoB genes.
The rpoB gene, which encodes the b subunit of RNA polymerase, has emerged as a candidate gene for phylogenetic analyses and identification of bacteria, especially when studying closely related strains [54]. Several studies have indicated that the hypervariable region of the rpoB¸ gene located between positions 2300 and 3300 is best suited for phylogenetic identification and discrimination at the species and subspecies level [54]. In our study, 39 isolates were identified to species level, 7 isolates as M. chelonae, 3 as M. fortuitum, 1 as M. marinum and 28 were identified as M. abscessus, of which 22 were identified to subspecies level as M. abscessus subsp. abscessus.
In the case of the closely related subspecies M. abscessus, M. bolletii and M. masiliense, the rpoB region alone was not sufficient for good discrimination [64]. Finding divergence values of 0.0% between M. bolletii and M. masiliense subspecies and 2.03% between M. abscessus and M. bolletii, M. masiliense. Between-group divergence values <2% in rpoB sequences indicate that these groups belong to the same species [65]. This was more marked for M. massiliense and M. bolletii, than for M. abscessus. The rpoB sequences in the strains of the M. massiliense and M. bolletii groups did not diverge. Therefore, according to Adékambi et al. [65] criteria, M. massiliense and M. bolletii for this analysis do not constitute different species. The importance of correctly identifying the subspecies of M. abscessus lies in their antimicrobial profile. M. abscessus and M. bolletii are known to have inducible macrolide resistance due to the presence of the functional erm(41) gene, while M. massiliense is susceptible because this gene is truncated and non-functional [66]. Therefore, the correct identification of M. abscessus subspecies is of clinical relevance.
The hsp65 gene is a good option for the identification of RGM, because it shows more variability than the 16S rRNA and rpoB genes [67]. In this study, it was possible to identify the subspecies of M. abscessus by analyzing the hsp65 gene, obtaining a percentage of divergence of 0.64% between the subspecies M. bolletii and M. masiliense, 1.28% between M. abscessus and M. masiliense and 1.41% between M. abscessus and M. bolletii. This gene is part of the 60 kDa heat shock protein family and has been considered a useful phylogenetic marker in several bacterial genera, due to its highly conserved primary structures [68]. The presence of a single copy of the gene in the genome means that it is not easily transferred from one bacterium to another, unlike the rpoB gene [68], it is suitable for phylogenetic studies of species or closely related strains [70]. Analysis based on the hsp65 gene identified 53 isolates to species level, seven belonging to M. chelonae, 28 to M. abscessus (22 to M. abscessus; five to M. massiliense; one to M. bolletii), three to M. tuberculosis, two to M. intracellulare, seven to M. avium-hominissuis, one to M. marinum, two to M. conceptionense and three to M. fortuitum.
The partial paraphyletic location of some fast-growing species belonging to the subclade "Fortuitum" and the subclade "Terrae" present in the tree based on 16S rRNA, rpoB and hsp65 were resolved in the tree constructed with concatenated nucleotide sequences, therefore, the increasing availability of markers spanning the entire bacterial genome allows the construction of more robust phylogenetic trees, thus providing a reliable understanding of the relationships within the genus Mycobacterium [71]. The concatenated analysis yielded improved topology and enabled identification of most isolates at the species and subspecies levels, with the exception of two isolates that could only be resolved at the complex level, consistent with findings from other genome-wide studies. Thus, increased genomic information facilitates more accurate inference of evolutionary relationships, clearer demarcation of taxa, and enhanced understanding of interrelationships among these mycobacterial species [44].
5. Conclusions
Synapomorphic characters (shared positional homologies of an immediate common ancestor) for the identification and reliable demarcation of different monophyletic clades of mycobacteria varied among genes analyzed, with correlation observed between the hsp65 gene and pathogenicity phenotypes and sample type, rpoB with resistance profile, G-C% content, and 16S rRNA with growth rate.
The 16S rRNA gene was more conserved and showed less variability compared to the rpoB and hsp65 genes. The hsp65 and rpoB genes showed greater variability, which allowed an optimal identification approach at the species level and even at the subspecies level, as in the case of the hsp65 gene. These phylogenetic results emphasize that molecular markers other than the 16S rRNA gene should be applied to obtain an accurate phylogenetic and evolutionary scheme, and concatenated analyses of genes with greater phylogenetic information at specific levels.
Clinical samples showed phylogenetic homology with the groups of M. abscessus (Mycobacterium abscessus subsp. abscessus, Mycobacterium abscessus subsp. massiliense, Mycobacterium abscessus subsp. bolletii), M. avium (Mycobacterium avium subsp. hominissuis), M. fortuitum, M. intracellulare and M. marinum.
Author Contributions
"Conceptualization, JCN. and GS.; methodology, JCN.; software, JCN.; validation, JCN, GS. and JZ.; formal analysis, GS and JCN.; resources, JCN and JZ.; data curation, GS.; writing-preparation of original draft, GS.; writing-revision and editing, GS, JCN and JRRI.; final visualization, JCN and JRRI.; supervision, JCN and JZ.; administration and project management, JZ and JCN.; acquisition of funds, JZ and JCN. "All authors have read and agree to the final version of the manuscript.".
Funding
"This research was funded by DII-UISEK-P011617_(JCN) and by the Biomedicine Research Unit of Zurita & Zurita Laboratorios".
Institutional Review Board Statement
The mycobacteria samples come from the Zurita & Zurita Laboratories Biomedical Research Unit strain, which approved the use of mycobacteria from the strain, and has no information related to patient data.
Data Availability Statement
We encourage all authors of articles published in MDPI journals to share their research data. In this section, please provide details regarding where data supporting reported results can be found, including links to publicly archived datasets analyzed or generated during the study. Where no new data were created, or where data is unavailable due to privacy or ethical restrictions, a statement is still required. Suggested Data Availability Statements are available in section “MDPI Research Data Policies” at https://www.mdpi.com/ethics.
Acknowledgments
To the Microbiology area of Zurita & Zurita Laboratorios.
Conflicts of Interest
The authors declare that they have no conflicts of interest.
References
- Eisenstadt, J., & Hall, G. S. (1995). Microbiology and classification of mycobacteria. Clinics in Dermatology,13 (3), 197-206. [CrossRef]
- Rahama, O., & Thaker, H. (2013). Atypical mycobacteria: an important differential for the general physician. Clinical Medicine,13 (5), 504. [CrossRef]
- Field, S. K., & Cowie, R. L. (2006). Lung Disease Due to the Most Common Nontuberculous Mycobacteria. CHEST,129 (6), 1653-1672. [CrossRef]
- Tortoli, E. (2003). Impact of genotypic studies on mycobacterial taxonomy: the new mycobacteria of the 1990s. Clinical Microbiology Reviews,16 (2), 319-354. [CrossRef]
- Faria, S., Joao, I., & Jordao, L. (2015). General Overview on Nontuberculous Mycobacteria, Biofilms, and Human Infection. Journal of Pathogens,2015 , 1-10. [CrossRef]
- Devulder, G., de Montclos, M. P., & Flandrois, J. P. (2005). A multigene approach to phylogenetic analysis using the genus Mycobacterium as a model. International Journal of Systematic and Evolutionary Microbiology,55 (Pt 1), 293-302. [CrossRef]
- Maleki, M. R., Kafil, H. S., Harzandi, N., & Moaddab, S. R. (2017). Identification of nontuberculous mycobacteria isolated from hospital water by sequence analysis of the hsp65 and 16S rRNA genes. Journal of Water and Health,15 (5), 766-774. [CrossRef]
- Telenti, A., Marchesi, F., Balz, M., Bally, F., Bottger, E. C., & Bodmer, T. (1993). Rapid identification of mycobacteria to the species level by polymerase chain reaction and restriction enzyme analysis. Journal of Clinical Microbiology,31 (2), 175-178. [CrossRef]
- Boor, K. J., Duncan, M. L., & Price, C. W. (1995). Genetic and transcriptional organization of the region encoding the beta subunit of Bacillus subtilis RNA polymerase. The Journal of Biological Chemistry,270 (35), 20329-20336. [CrossRef]
- Adékambi, T., Colson, P., & Drancourt, M. (2003). rpoB-Based Identification of Nonpigmented and Late-Pigmented Rapidly Growing Mycobacteria. Journal of Clinical Microbiology,41 , 5699-5708. [CrossRef]
- Huang, W. C., Yu, M. C., & Huang, Y. W. (2020). Identification and drug susceptibility testing for nontuberculous mycobacteria. Journal of the Formosan Medical Association,119 , S32-S41. [CrossRef]
- Griffith, D. E., Aksamit, T., Brown-Elliott, B. A., Catanzaro, A., Daley, C., Gordin, F., Holland, S. M., Horsburgh, R., Huitt, G., Iademarco, M. F., Iseman, M., Olivier, K., Ruoss, S., Von Reyn, C. F., Wallace, R. J., & Winthrop, K. (2007). An official ATS/IDSA statement: Diagnosis, treatment, and prevention of nontuberculous mycobacterial diseases. American Journal of Respiratory and Critical Care Medicine,175 (4), 367-416. [CrossRef]
- Runyon, E. H. (1965). Typical Mycobacteria:Their classification. The American Review of Respiratory Disease,91 , 288-289. [CrossRef]
- Zhou, L., Xu, D., Liu, H., Wan, K., Wang, R., & Yang, Z. (2020). Trends in the Prevalence and Antibiotic Resistance of Non-tuberculous Mycobacteria in Mainland China, 2000-2019: Systematic Review and Meta-Analysis. Frontiers in Public Health,8, 295. [CrossRef]
- Saxena, S., Spaink, H. P., & Forn-Cuní, G. (2021). Drug Resistance in Nontuberculous Mycobacteria: Mechanisms and Models. Biology,10 (2), 1-22. [CrossRef]
- Hoefsloot, W., Van Ingen, J., Andrejak, C., Ängeby, K., Bauriaud, R., Bemer, P., Beylis, N., Boeree, M. J., Cacho, J., Chihota, V., Chimara, E., Churchyard, G., Cias, R., Daza, R., Daley, C. L., Dekhuijzen, P. N. R., Domingo, D., Drobniewski, F., Esteban, J., ... Wagner, D. (2013). The geographic diversity of nontuberculous mycobacteria isolated from pulmonary samples: an NTM-NET collaborative study. European Respiratory Journal,42 (6), 1604-1613. [CrossRef]
- Buele Chica, D. C. (2021). Characterization of resistance genes in atypical mycobacteria isolated at the microbiological research center (CIM) in the period 2014 - 2019. http://localhost:8080/xmlui/handle/123456789/4471.
- Mușoiu Cedeño, V. E. (2020). Isolation and genotyping of the first environmental mycobacteria in north-central Ecuador. https://repositorio.uisek.edu.ec/handle/123456789/3692.
- Hammer, Ø., Harper, D. A. T., & Ryan, P. D. (2001). PAST: Paleontological statistics software package for education and data analysis. Palaeontologia Electronica,4 (9), 1-9. http://palaeo-electronica.org/2001_1/past/issue1_01.htm.
- CLSI (2018). Susceptibility Testing of Mycobacteria, Nocardiae, and Other Aerobic Actinomycetes. In 3rd. ed. CLSI document M24-A2. Clinical and Laboratory Standards Institute. https://www.ncbi.nlm.nih.gov/books/NBK544374/.
- Vega, D., Moreno, J. E., & Mansilla, E. C. (2016). Methods for determination of antimicrobial susceptibility in mycobacteria. Enfermedades infecciosas y microbiologia clinica, 35(8), 529–535. [CrossRef]
- Mohanta, T., & Goel, S. (2014). Prevalence of antibiotic-resistant bacteria in three different aquatic environments over three seasons. Environmental Monitoring and Assessment,186 (8), 5089-5100. [CrossRef]
- Klein, E. Y., Tseng, K. K., Pant, S., & Laxminarayan, R. (2019). Tracking global trends in the effectiveness of antibiotic therapy using the Drug Resistance Index. BMJ Global Health,4 (2), e001315. [CrossRef]
- Telenti, A., Marchesi, F., Balz, M., Bally, F., Bottger, E. C., & Bodmer, T. (1993). Rapid identification of mycobacteria to the species level by polymerase chain reaction and restriction enzyme analysis. Journal of Clinical Microbiology,31 (2), 175-178. [CrossRef]
- Heuer, H., Krsek, M., Baker, P., Smalla, K., & Wellington, E. M. H. (1997). Analysis of actinomycete communities by specific amplification of genes encoding 16S rRNA and gel-electrophoretic separation in denaturing gradients. Applied and Environmental Microbiology,63 (8), 3233. [CrossRef]
- Ghyselinck, J., Pfeiffer, S., Heylen, K., Sessitsch, A., & De Vos, P. (2013). The Effect of Primer Choice and Short Read Sequences on the Outcome of 16S rRNA Gene Based Diversity Studies. PLOS ONE,8 (8), e71360. [CrossRef]
- Edgar, R. C. (2004). MUSCLE: multiple sequence alignment with high accuracy and high throughput. Nucleic Acids Research,32 (5), 1792. [CrossRef]
- Ledesma, Y., Echeverría, G., Claro-Almea, F. E., Silva, D., Guerrero-Freire, S., Rojas, Y., Bastidas-Caldes, C., Navarro, J. C., & de Waard, J. H. (2022). The Re-Identification of Previously Unidentifiable Clinical Non-Tuberculous Mycobacterial Isolates Shows Great Species Diversity and the Presence of Other Acid-Fast Genera. Pathogens,11 (10), 1159. [CrossRef]
- Swofford, D. L. 2002. PAUP*. Phylogenetic Analysis Using Parsimony (*and Other Methods). Version 4. Sinauer Associates, Sunderland, Massachusetts.
- Kumar S, Stecher G, Li M, Knyaz C, and Tamura K (2018) MEGA X: Molecular Evolutionary Genetics Analysis across computing platforms. Molecular Biology and Evolution 35:1547-1549.
- Stecher G, Tamura K, and Kumar S (2020) Molecular Evolutionary Genetics Analysis (MEGA) for macOS. Molecular Biology and Evolution(. [CrossRef]
- Felsenstein, J., 1985. Confidence limits on phylogenies: an approach using the bootstrap. Evolution (N. Y) 39, 783–791. [CrossRef]
- Carrillo-Bilbao G, Navarro JC, Martin-Solano S, Chávez-Larrea MA, Cholota-Iza C, Saegerman C. First Molecular Identification of Trypanosomes and Absence of Babesia sp. DNA in Faeces of Non-Human Primates in the Ecuadorian Amazon. Pathogens. 2022 Dec 7;11(12):1490. [CrossRef]
- De la Cadena E, Camacho M, Vaca F, Enríquez S, Eleizalde MC, Arrivillaga-Henríquez J, Mendoza M, Navarro JC, Ramírez-Iglesias JR. Molecular identification of Trypanosoma theileri in cattle from the Ecuadorian Amazon. Vet Parasitol Reg Stud Reports. 2023 Jan;37:100824. [CrossRef]
- Sharma, S., & Upadhyay, V. (2020). Epidemiology, diagnosis & treatment of non-tuberculous mycobacterial diseases. The Indian Journal of Medical Research,152 (3), 185. [CrossRef]
- Nasre-Nasser, R., & Muñoz-López, G. (2018). Mycobacterium scrofulaceum infection in a child from the Galapagos Islands - Ecuador. Revista Chilena de Infectología,35 (6), 705-709. [CrossRef]
- Palacios Vargas, D. V. (2021). Mycobacterium terrae: case report. Revista Ecuatoriana de Ciencia, Tecnología e Innovación En Salud Pública, 1-4. [CrossRef]
- Moreno-Izquierdo, C., Zurita, J., Contreras-Yametti, F. I., & Jara-Palacios, M. A. (2020). Mycobacterium abscessus subspecies abscessus infection associated with cosmetic surgical procedures: Cases series. IDCases,22 . [CrossRef]
- Zurita, J., Ortega-Paredes, D., Mora, M., Espinel, N., Parra, H., Febres, L., & Zurita-Salinas, C. (2014). Characterization of the first report of Mycobacterium timonense infecting an HIV patient in an Ecuadorian hospital. Clinical Microbiology and Infection,20 (12), O1113-O1116. [CrossRef]
- Romero, J. J., Herrera, P., Cartelle, M., Barba, P., Tello, S., & Zurita, J. (2016). Panniculitis caused by Mycobacterium monacense mimicking erythema induratum: A case in Ecuador. New Microbes and New Infections,10 , 112-115. [CrossRef]
- Dohál, M., Porvazník, I., Solovič, I., & Mokrý, J. (2021). Whole Genome Sequencing in the Management of Non-Tuberculous Mycobacterial Infections. Microorganisms,9 (11). [CrossRef]
- Kwon, Y. S., Daley, C. L., & Koh, W. J. (2019). Managing antibiotic resistance in nontuberculous mycobacterial pulmonary disease: challenges and new approaches. Https://Doi.Org/10.1080/17476348.2019.1638765,13 (9), 851–861. [CrossRef]
- Kim, S. H., & Shin, J. H. (2018). Identification of nontuberculous mycobacteria using multilocus sequence analysis of 16S rRNA, hsp65, and rpoB. Journal of Clinical Laboratory Analysis,32 (1). [CrossRef]
- Gupta, R. S., Lo, B., & Son, J. (2018). Phylogenomics and comparative genomic studies robustly support division of the genus Mycobacterium into an emended genus Mycobacterium and four novel genera. Frontiers in Microbiology,9 (FEB), 67. [CrossRef]
- Brown-Elliott, B. A., & Wallace, R. J. (2002). Clinical and taxonomic status of pathogenic nonpigmented or late-pigmenting rapidly growing mycobacteria. Clinical Microbiology Reviews,15 (4), 716-746. [CrossRef]
- Lee, M. R., Sheng, W. H., Hung, C. C., Yu, C. J., Lee, L. N., & Hsueh, P. R. (2015). Mycobacterium abscessus complex infections in humans. Emerging Infectious Diseases,21 (9), 1638-1646. [CrossRef]
- Ganapathy, U. S., Dartois, V., & Dick, T. (2019). Repositioning rifamycins for Mycobacterium abscessus lung disease. Expert Opinion on Drug Discovery,14 (9), 867. [CrossRef]
- Kim, Bum Joon, Lee, S. H., Lyu, M. A., Kim, S. J., Bai, G. H., Kim, S. J., Chae, G. T., Kim, E. C., Cha, C. Y., & Kook, Y. H. (1999). Identification of Mycobacterial Species by Comparative Sequence Analysis of the RNA Polymerase Gene (rpoB). Journal of Clinical Microbiology,37 (6), 1714. [CrossRef]
- Chopra, S., Matsuyama, K., Hutson, C., & Madrid, P. (2011). Identification of antimicrobial activity among FDA-approved drugs for combating Mycobacterium abscessus and Mycobacterium chelonae. Journal of Antimicrobial Chemotherapy,66 (7), 1533-1536. [CrossRef]
- Woodley, C. L., Kilburn, J. O., David, H. L., & Silcox, V. A. (1972). Susceptibility of Mycobacteria to Rifampin. Antimicrobial Agents and Chemotherapy,2 (4), 245. [CrossRef]
- Sha, W., Weng, X. hua, Xiao, H. ping, & He, G. jun. (2003). [Investigation of drug-resistance to rifampin and rpoB gene sequence analysis of Mycobacterium abscessus]. Zhonghua Jie He He Hu Hu Xi Za Zhi = Zhonghua Jiehe He Huxi Zazhi = Chinese Journal of Tuberculosis and Respiratory Diseases,26 (9), 544-547. https://europepmc.org/article/med/14521758.
- Lambert, P. A. (2002). Cellular impermeability and uptake of biocides and antibiotics in Gram-positive bacteria and mycobacteria. Journal of Applied Microbiology,92 (s1), 46S-54S. [CrossRef]
- Gillespie, S. H., Basu, S., Dickens, A. L., O'Sullivan, D. M., & McHugh, T. D. (2005). Effect of subinhibitory concentrations of ciprofloxacin on Mycobacterium fortuitum mutation rates. Journal of Antimicrobial Chemotherapy,56 (2), 344-348. [CrossRef]
- Adékambi, T., Drancourt, M., & Raoult, D. (2009). The rpoB gene as a tool for clinical microbiologists. Trends in Microbiology,17 (1), 37-45. [CrossRef]
- Cuevas-Córdoba, B., Fresno, C., Haase-Hernández, J. I., Barbosa-Amezcua, M., Mata-Rocha, M., Muñoz-Torrico, M., Salazar-Lezama, M. A., Martínez-Orozco, J. A., Narváez-Díaz, L. A., Salas-Hernández, J., González-Covarrubias, V., & Soberón, X. (2021). A bioinformatics pipeline for Mycobacterium tuberculosis sequencing that cleans contaminant reads from sputum samples. PLOS ONE,16 (10), e0258774. [CrossRef]
- Ho, Y. S., Adroub, S. A., Aleisa, F., Mahmood, H., Othoum, G., Rashid, F., Zaher, M., Ali, S., Bitter, W., Pain, A., & Abdallah, A. M. (2012). Complete Genome Sequence of Mycobacterium fortuitum subsp. fortuitum Type Strain DSM46621. Journal of Bacteriology,194 (22), 6337. [CrossRef]
- Sassi, M., & Drancourt, M. (2014). Genome analysis reveals three genomospecies in Mycobacterium abscessus. BMC Genomics,15 (1), 1-10. [CrossRef]
- Winburn, B., & Sharman, T. (2022). Atypical Mycobacterial Disease. StatPearls. https://www.ncbi.nlm.nih.gov/books/NBK556117/.
- Sakai, T., Hisaeda, H., Ishikawa, H., Maekawa, Y., Zhang, M., Nakao, Y., Takeuchi, T., Matsumoto, K., Good, R. A., & Himeno, K. (1999). Expression and role of heat-shock protein 65 (HSP65) in macrophages during Trypanosoma cruzi infection: involvement of HSP65 in prevention of apoptosis of macrophages. Microbes and Infection,1 (6), 419-427. [CrossRef]
- Ferrell, K. C., Johansen, M. D., Triccas, J. A., & Counoupas, C. (2022). Virulence Mechanisms of Mycobacterium abscessus: Current Knowledge and Implications for Vaccine Design. Frontiers in Microbiology,13 , 557. [CrossRef]
- Roux, A. L., Viljoen, A., Bah, A., Simeone, R., Bernut, A., Laencina, L., Deramaudt, T., Rottman, M., Gaillard, J. L., Majlessi, L., Brosch, R., Girard-Misguich, F., Vergne, I., de Chastellier, C., Kremer, L., & Herrmann, J. L. (2016). The distinct fate of smooth and rough Mycobacterium abscessus variants inside macrophages. Open Biology,6 (11). [CrossRef]
- Clarridge, J. E. (2004). Impact of 16S rRNA Gene Sequence Analysis for Identification of Bacteria on Clinical Microbiology and Infectious Diseases. Clinical Microbiology Reviews,17 (4), 840. [CrossRef]
- Zhou, L., Ma, C., Xiao, T., Li, M., Liu, H., Zhao, X., Wan, K., & Wang, R. (2019). A new single gene differential biomarker for mycobacterium tuberculosis complex and non-tuberculosis mycobacteria. Frontiers in Microbiology,10 (AUG), 1887. [CrossRef]
- Zelazny, A. M., Root, J. M., Shea, Y. R., Colombo, R. E., Shamputa, I. C., Stock, F., Conlan, S., McNulty, S., Brown-Elliott, B. A., Wallace, R. J., Olivier, K. N., Holland, S. M., & Sampaio, E. P. (2009). Cohort study of molecular identification and typing of Mycobacterium abscessus, Mycobacterium massiliense, and Mycobacterium bolletii. Journal of Clinical Microbiology,47 (7), 1985-1995. [CrossRef]
- Adékambi, T., Berger, P., Raoult, D., & Drancourt, M. (2006). rpoB gene sequence-based characterization of emerging non-tuberculous mycobacteria with descriptions of Mycobacterium bolletii sp. nov, Mycobacterium phocaicum sp. nov. and Mycobacterium aubagnense sp. nov. International Journal of Systematic and Evolutionary Microbiology,56 (Pt 1), 133-143. [CrossRef]
- Borek, A., Zabost, A., Głogowska, A., Filipczak, D., & Augustynowicz-Kopeć, E. (2022). New RAPMYCOI SensititreTM Antimicrobial Susceptibility Test for Atypical Rapidly Growing Mycobacteria (RGM). Diagnostics (Basel, Switzerland),12 (8). [CrossRef]
- Ringuet, H., Akoua-Koffi, C., Honore, S., Varnerot, A., Vincent, V., Berche, P., Gaillard, J. L., & Pierre-Audigier, C. (1999). hsp65 sequencing for identification of rapidly growing mycobacteria. Journal of Clinical Microbiology,37 (3), 852-857. [CrossRef]
- Chang, Y. H., Shangkuan, Y. H., Lin, H. C., & Liu, H. W. (2003). PCR assay of the groEL gene for detection and differentiation of Bacillus cereus group cells. Applied and Environmental Microbiology,69 (8), 4502-4510. [CrossRef]
- Kim, Byoung Jun, Hong, S. H., Kook, Y. H., & Kim, B. J. (2013). Molecular Evidence of Lateral Gene Transfer in rpoB Gene of Mycobacterium yongonense Strains via Multilocus Sequence Analysis. PLoS ONE,8 (1), 51846. [CrossRef]
- Kim, H., Kim, S. H., Shim, T. S., Kim, M. N., Bai, G. H., Park, Y. G., Lee, S. H., Chae, G. T., Cha, C. Y., Kook, Y. H., & Kim, B. J. (2005). Differentiation of Myocobacterium species by analysis of the heat-shock protein 65 gene (hsp65). International Journal of Systematic and Evolutionary Microbiology,55 (4), 1649-1656. [CrossRef]
- Gupta, R. S., Lo, B., & Son, J. (2018). Phylogenomics and comparative genomic studies robustly support division of the genus Mycobacterium into an emended genus Mycobacterium and four novel genera. Frontiers in Microbiology,9 (FEB), 67. [CrossRef]
Figure 1.
Phylogenetic analysis of the 16S rRNA gene of Mycobacterium species. The bars to the right of the tree show the correlation between the monophyletic groups and the natural classification by species complexes, big clades and growth type. Additionally, the colors reinforce the correlation of the lineages with the large-scale classification. The statistical values (%) of bootstrap support are shown on the branches. The base of the tree is rooted with outgroups. The lower bar shows the relationship between evolutionary lines and the number of mutations.
Figure 1.
Phylogenetic analysis of the 16S rRNA gene of Mycobacterium species. The bars to the right of the tree show the correlation between the monophyletic groups and the natural classification by species complexes, big clades and growth type. Additionally, the colors reinforce the correlation of the lineages with the large-scale classification. The statistical values (%) of bootstrap support are shown on the branches. The base of the tree is rooted with outgroups. The lower bar shows the relationship between evolutionary lines and the number of mutations.
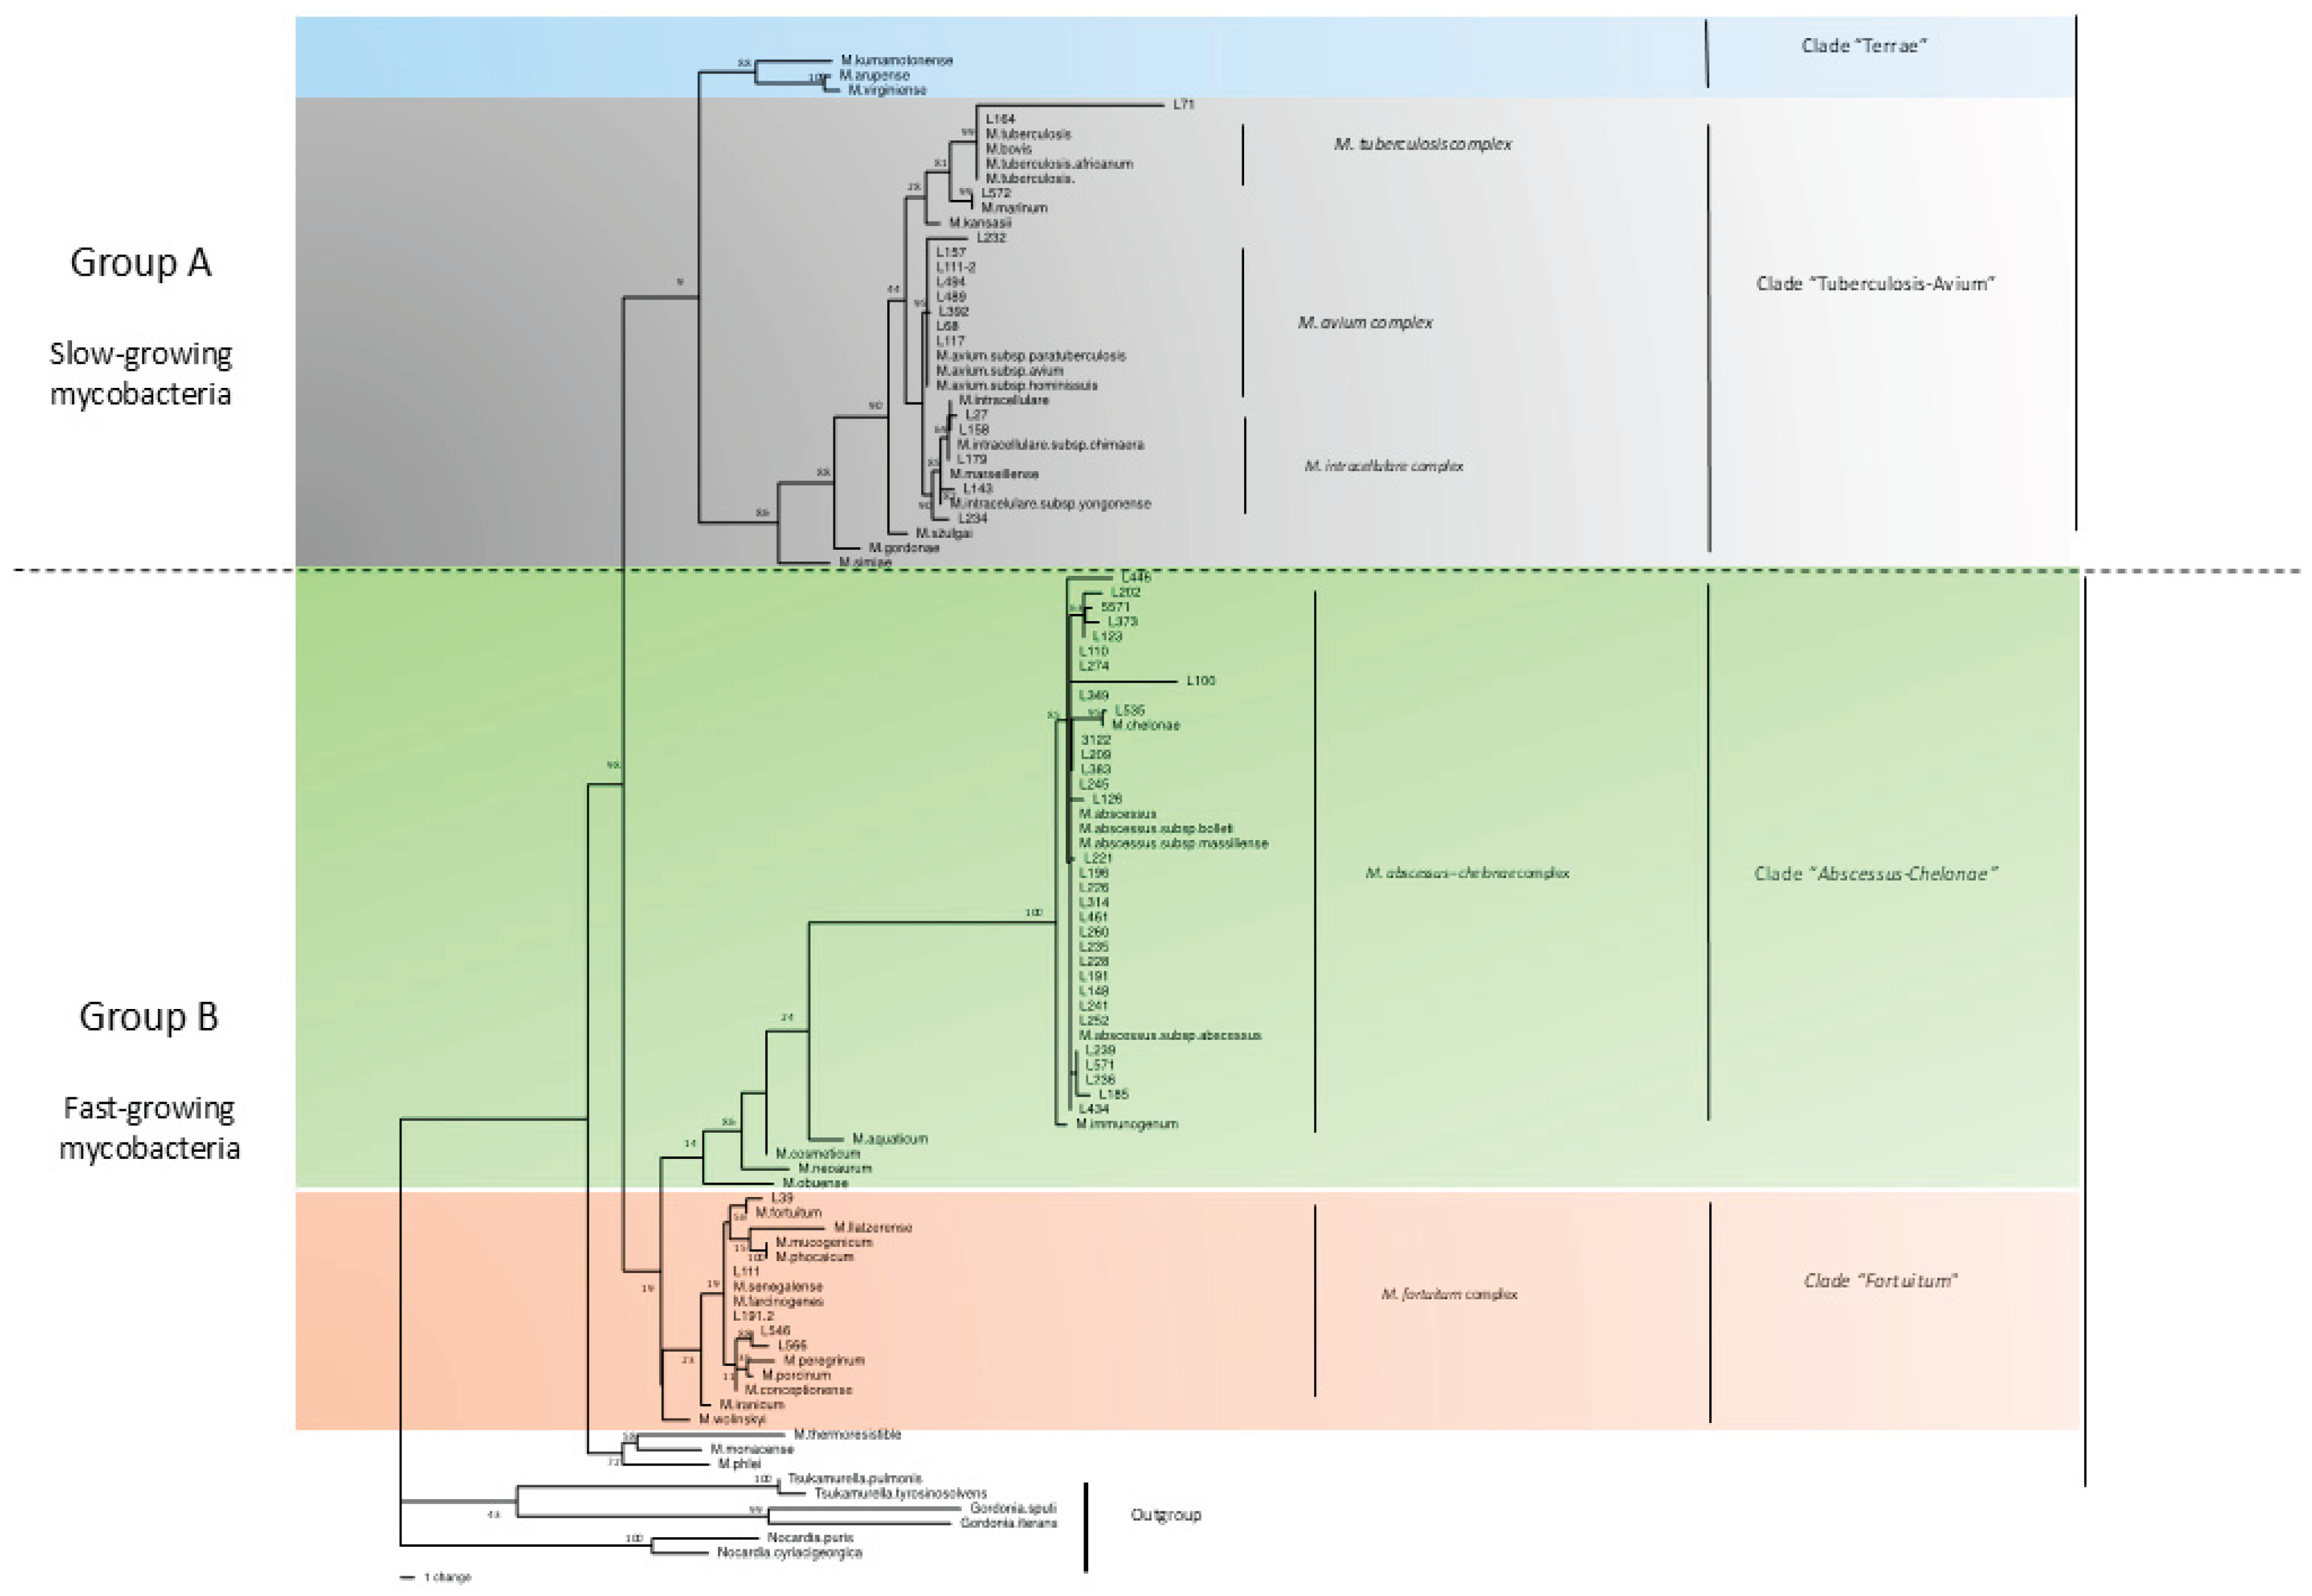
Figure 2.
Phylogenetic analysis of the rpoB gene of Mycobacterium species. The bars to the right of the tree show the correlation between the monophyletic groups and the natural classification by species complexes. Additionally, the colors reinforce the correlation of the lineages with the large-scale classification. Discontinuous lines show the two big lineages A and B (higher ARI value). The statistical values (%) of bootstrap support are shown on the branches. The base of the tree is rooted with outgroups. The lower bar shows the relationship between evolutionary lines and the number of mutations.
Figure 2.
Phylogenetic analysis of the rpoB gene of Mycobacterium species. The bars to the right of the tree show the correlation between the monophyletic groups and the natural classification by species complexes. Additionally, the colors reinforce the correlation of the lineages with the large-scale classification. Discontinuous lines show the two big lineages A and B (higher ARI value). The statistical values (%) of bootstrap support are shown on the branches. The base of the tree is rooted with outgroups. The lower bar shows the relationship between evolutionary lines and the number of mutations.
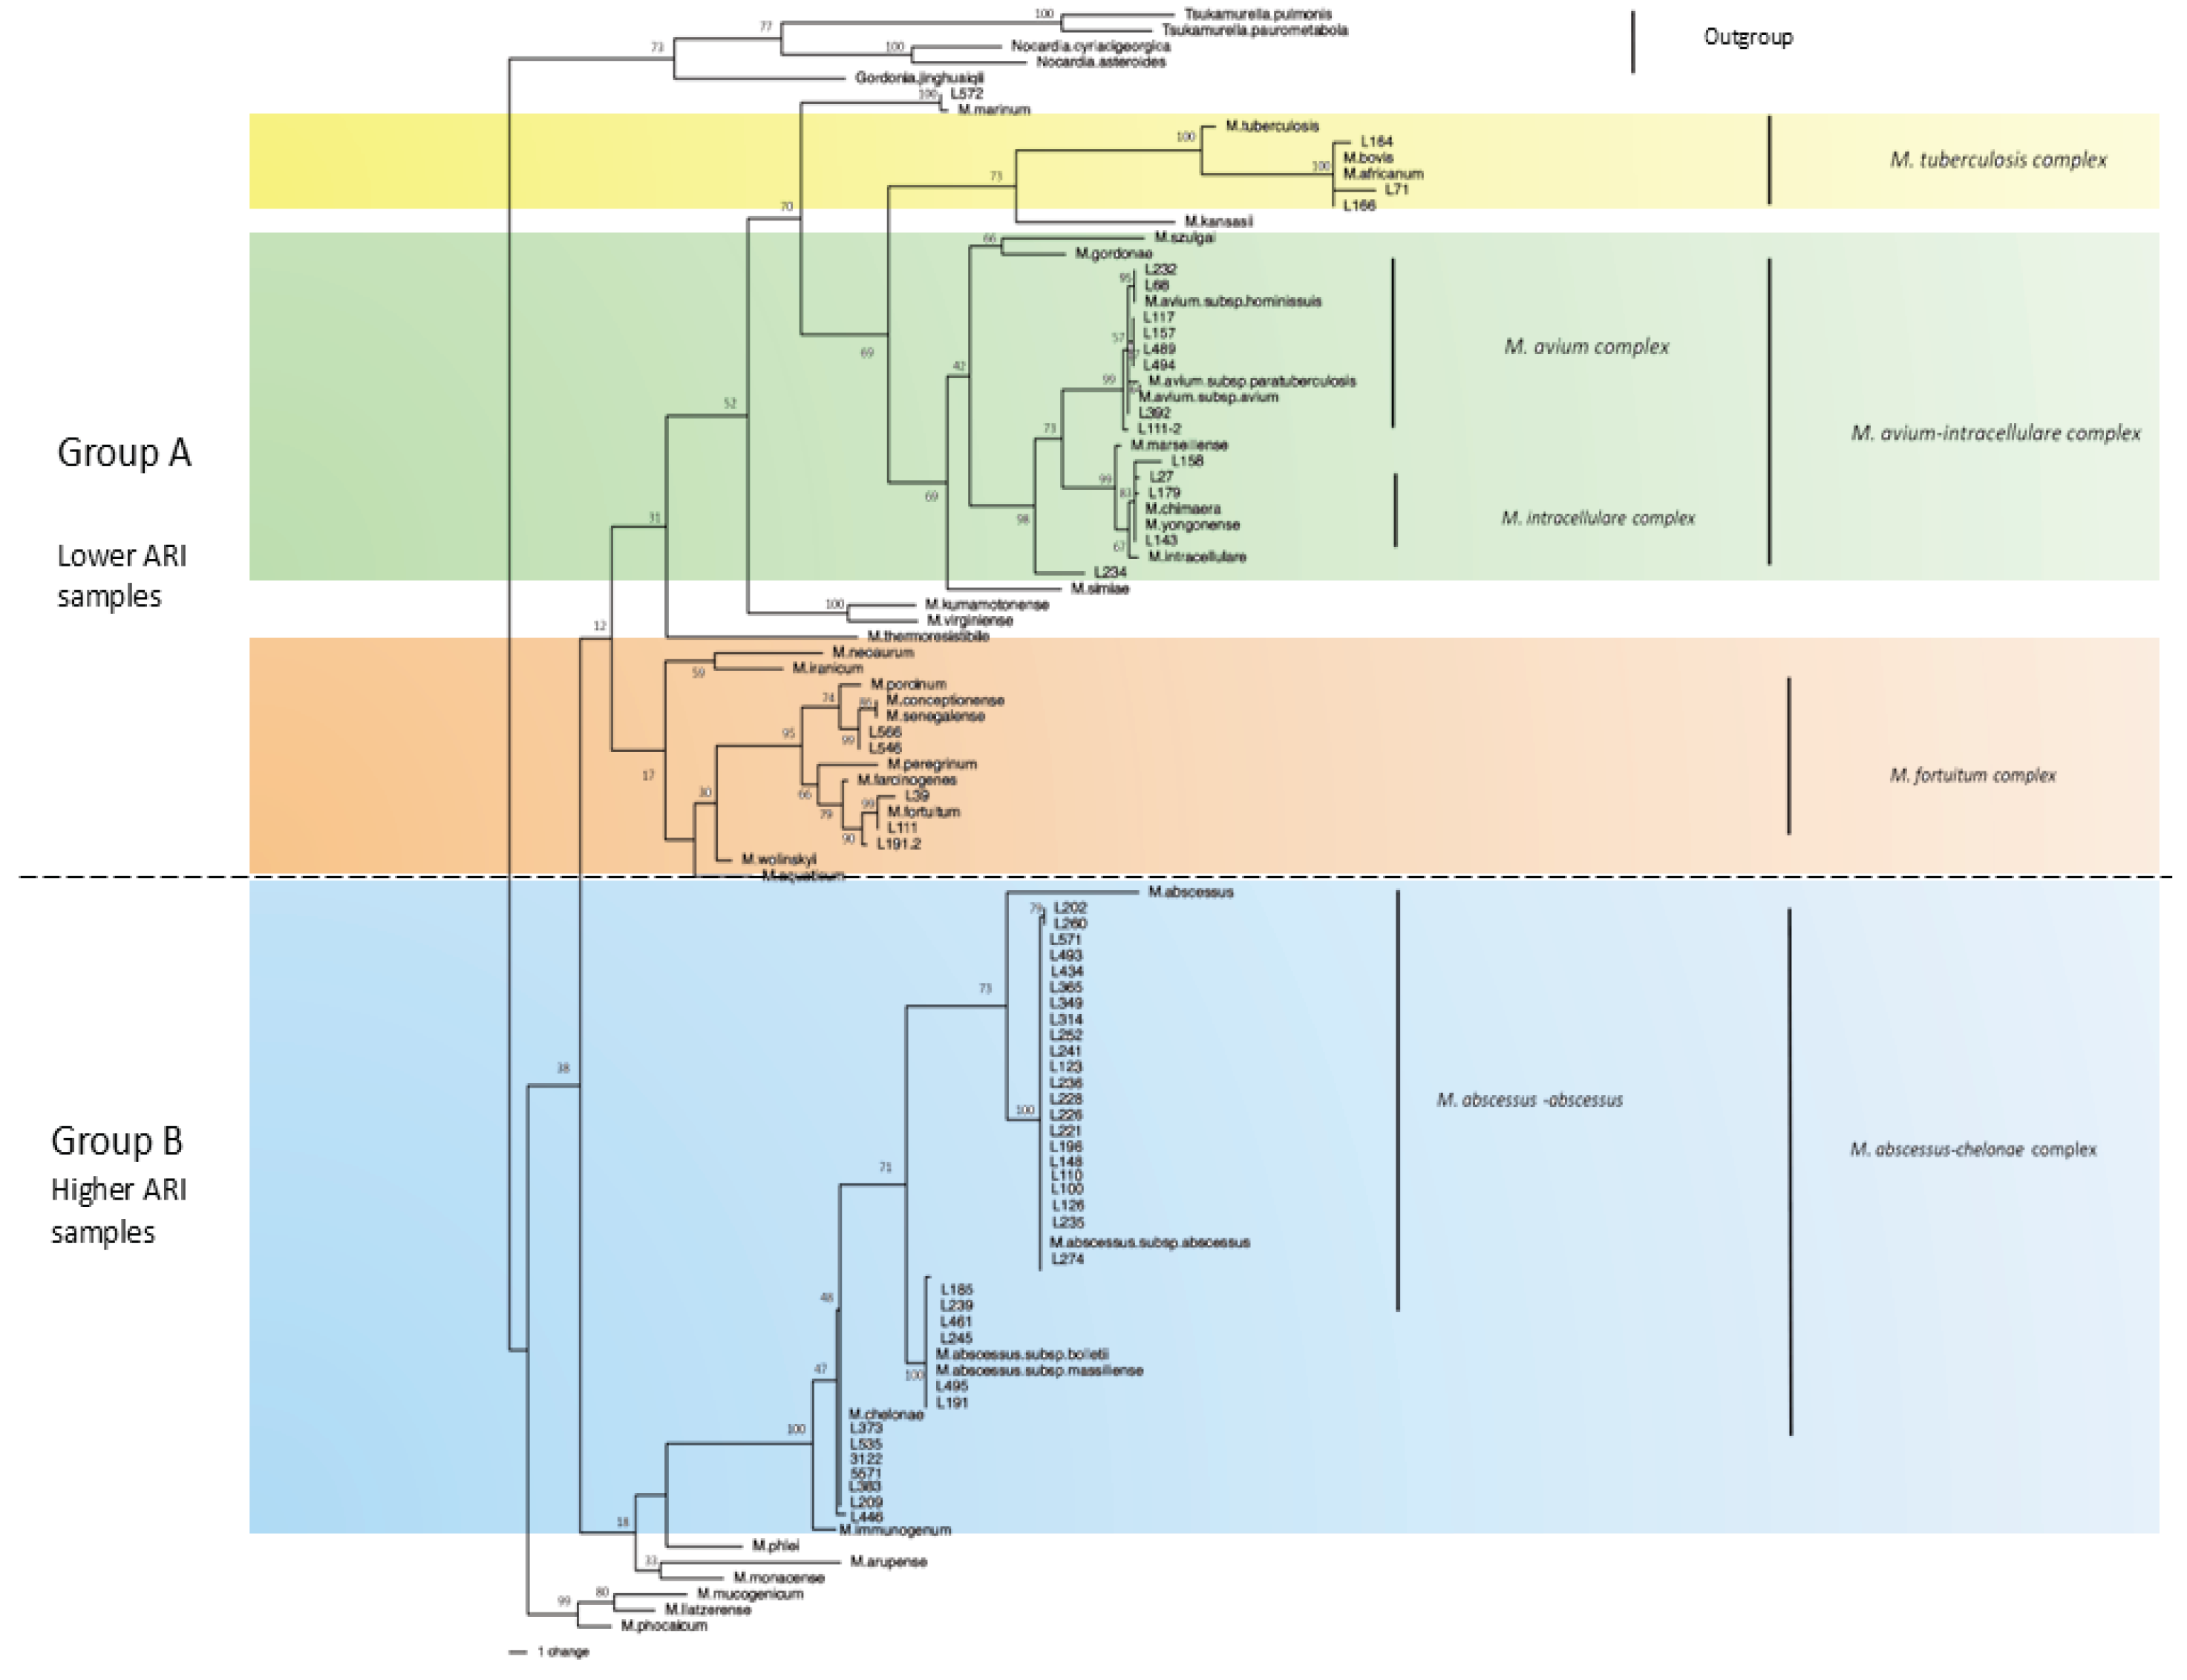
Figure 3.
Phylogenetic analysis of the hsp65 gene of Mycobacterium species. The bars to the right of the tree show the correlation between the monophyletic groups and the natural classification by species complexes. Additionally, the colors reinforce the correlation of the lineages with the large-scale classification. Discontinuous lines shown the two big lineages A (respiratory samples) and B (non-respiratory samples). The statistical values (%) of bootstrap support are shown on the branches. The base of the tree is rooted with outgroups. The lower bar shows the relationship between evolutionary lines and the number of mutations.
Figure 3.
Phylogenetic analysis of the hsp65 gene of Mycobacterium species. The bars to the right of the tree show the correlation between the monophyletic groups and the natural classification by species complexes. Additionally, the colors reinforce the correlation of the lineages with the large-scale classification. Discontinuous lines shown the two big lineages A (respiratory samples) and B (non-respiratory samples). The statistical values (%) of bootstrap support are shown on the branches. The base of the tree is rooted with outgroups. The lower bar shows the relationship between evolutionary lines and the number of mutations.
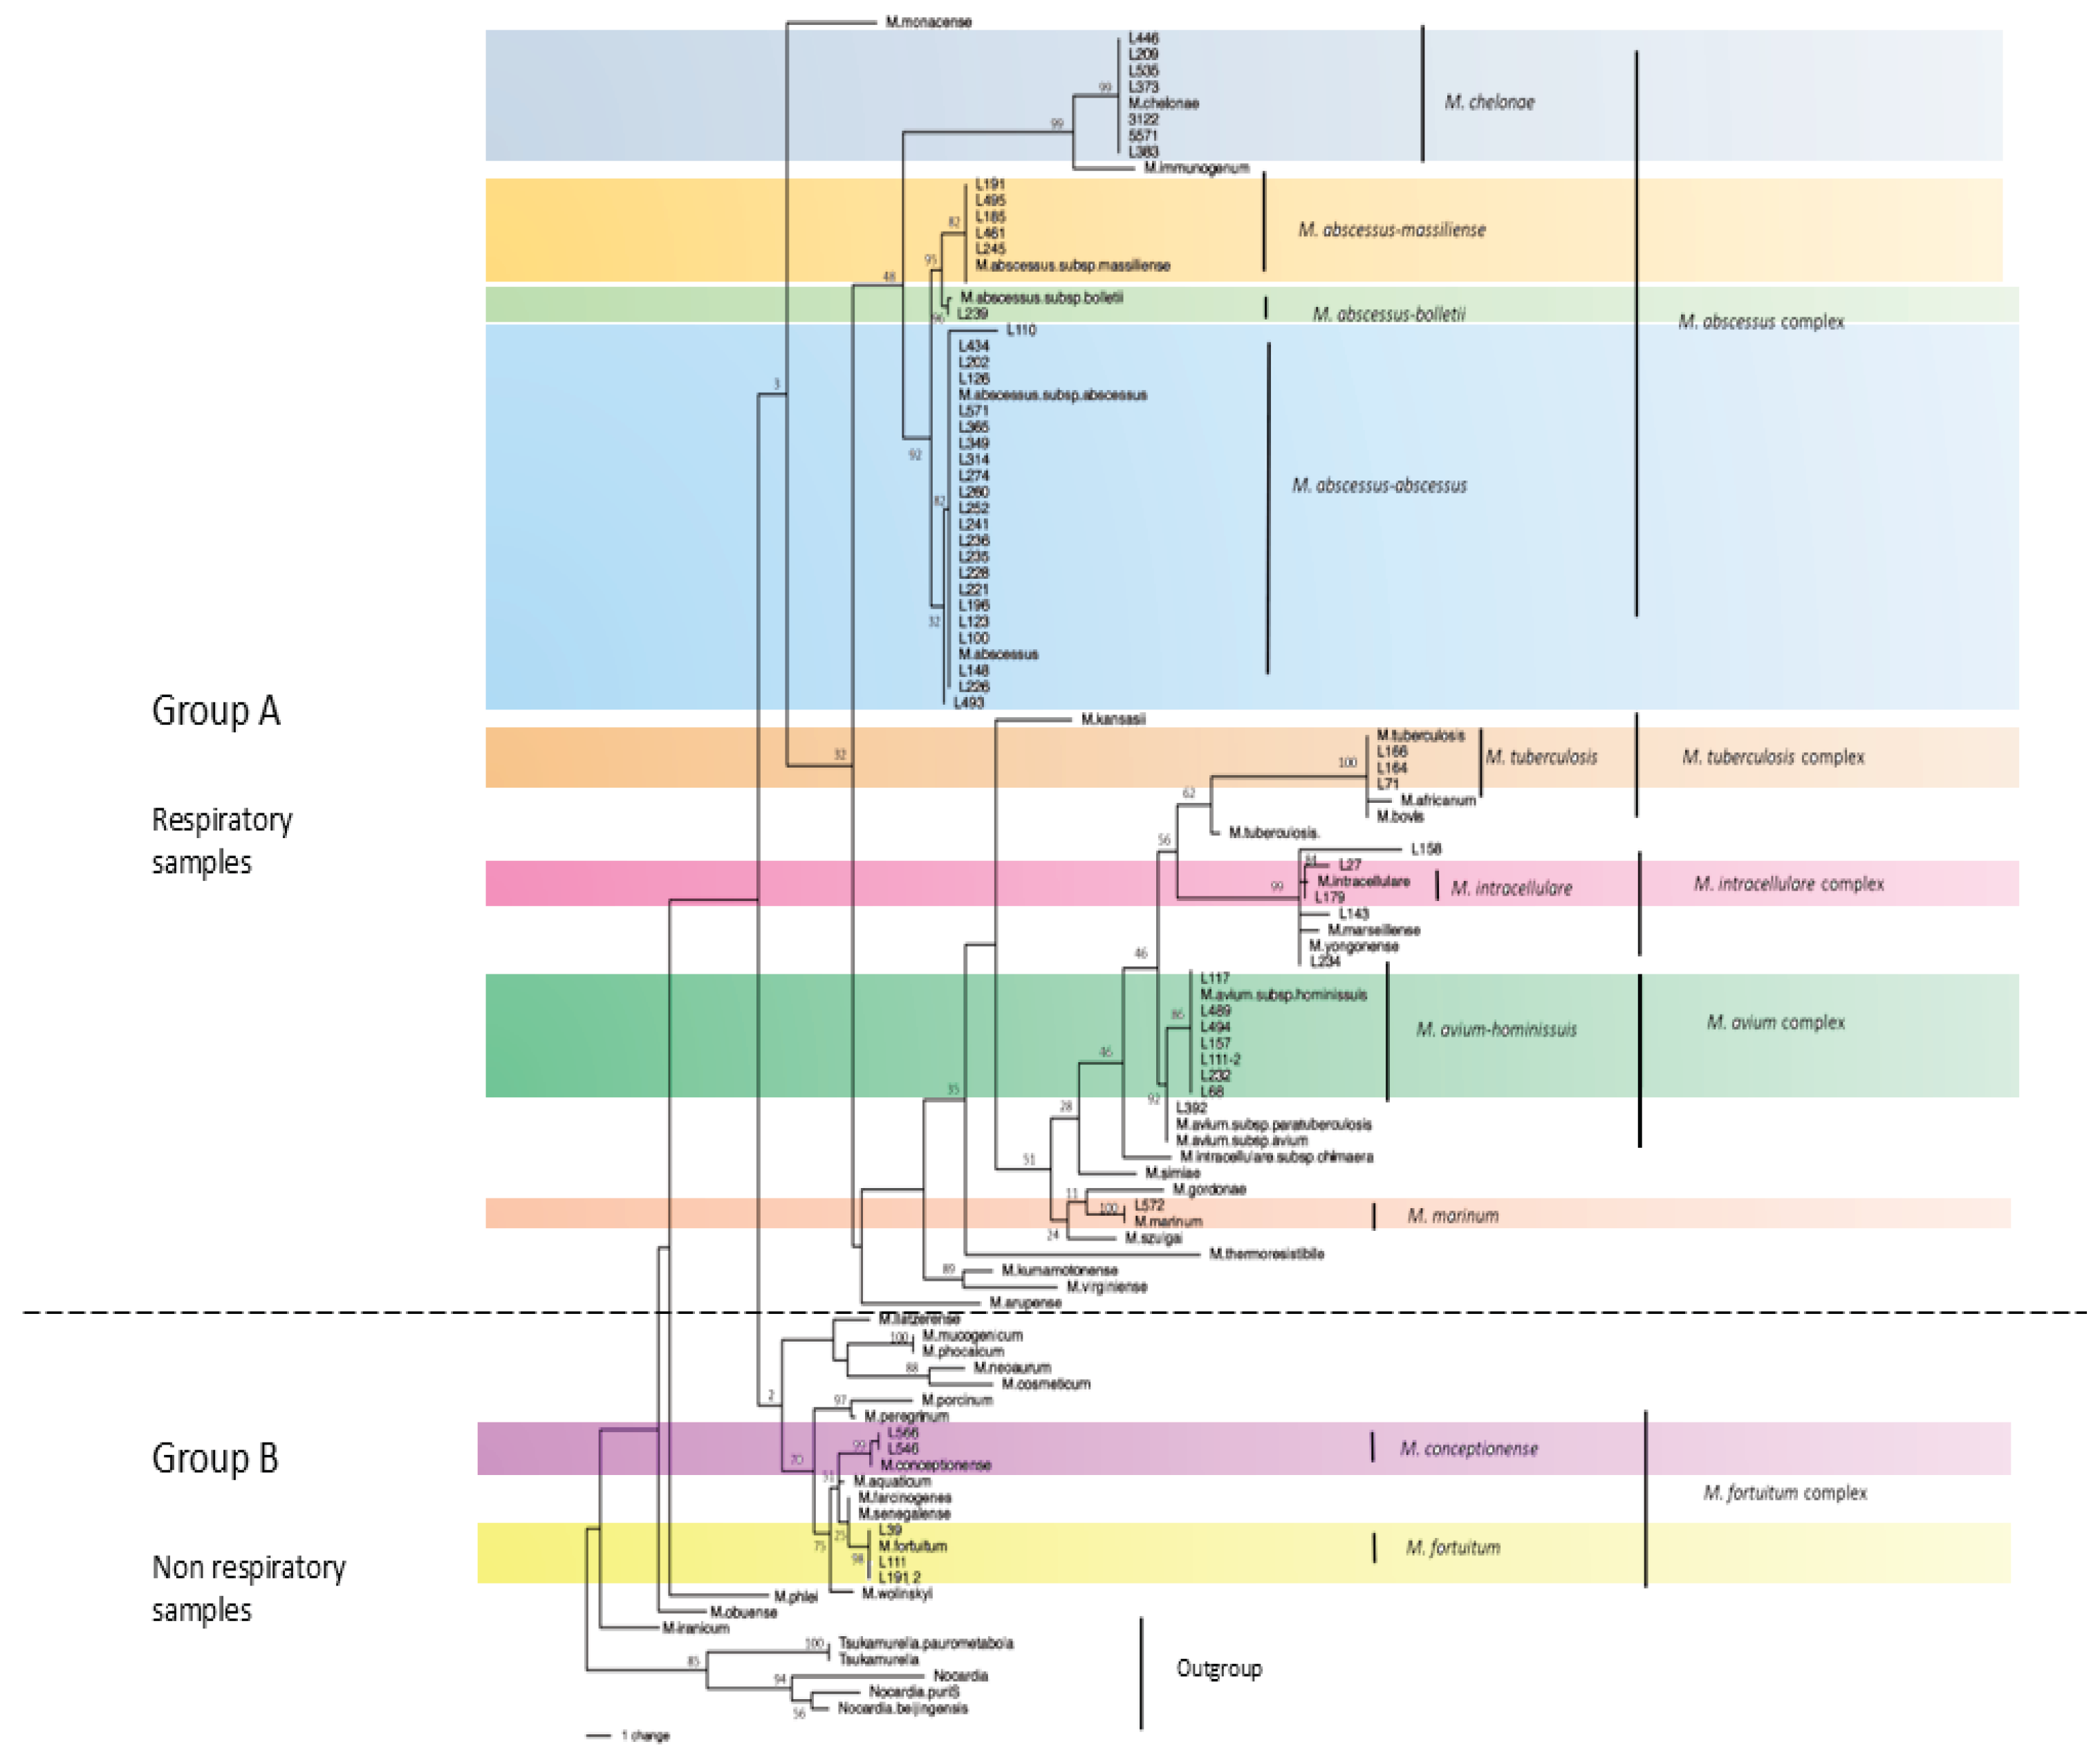
Figure 4.
Concatenated phylogeny analysis of Mycobacterium species with the three genes evaluated. The bars to the right of the tree show the correlation between the monophyletic groups and the natural classification by species complexes. Additionally, the colors reinforce the highly recovering lineage of the species/subspecies level. The statistical values (%) of bootstrap support are shown on the branches. The base of the tree is rooted with outgroups. The lower bar shows the relationship between evolutionary lines and the number of mutations.
Figure 4.
Concatenated phylogeny analysis of Mycobacterium species with the three genes evaluated. The bars to the right of the tree show the correlation between the monophyletic groups and the natural classification by species complexes. Additionally, the colors reinforce the highly recovering lineage of the species/subspecies level. The statistical values (%) of bootstrap support are shown on the branches. The base of the tree is rooted with outgroups. The lower bar shows the relationship between evolutionary lines and the number of mutations.
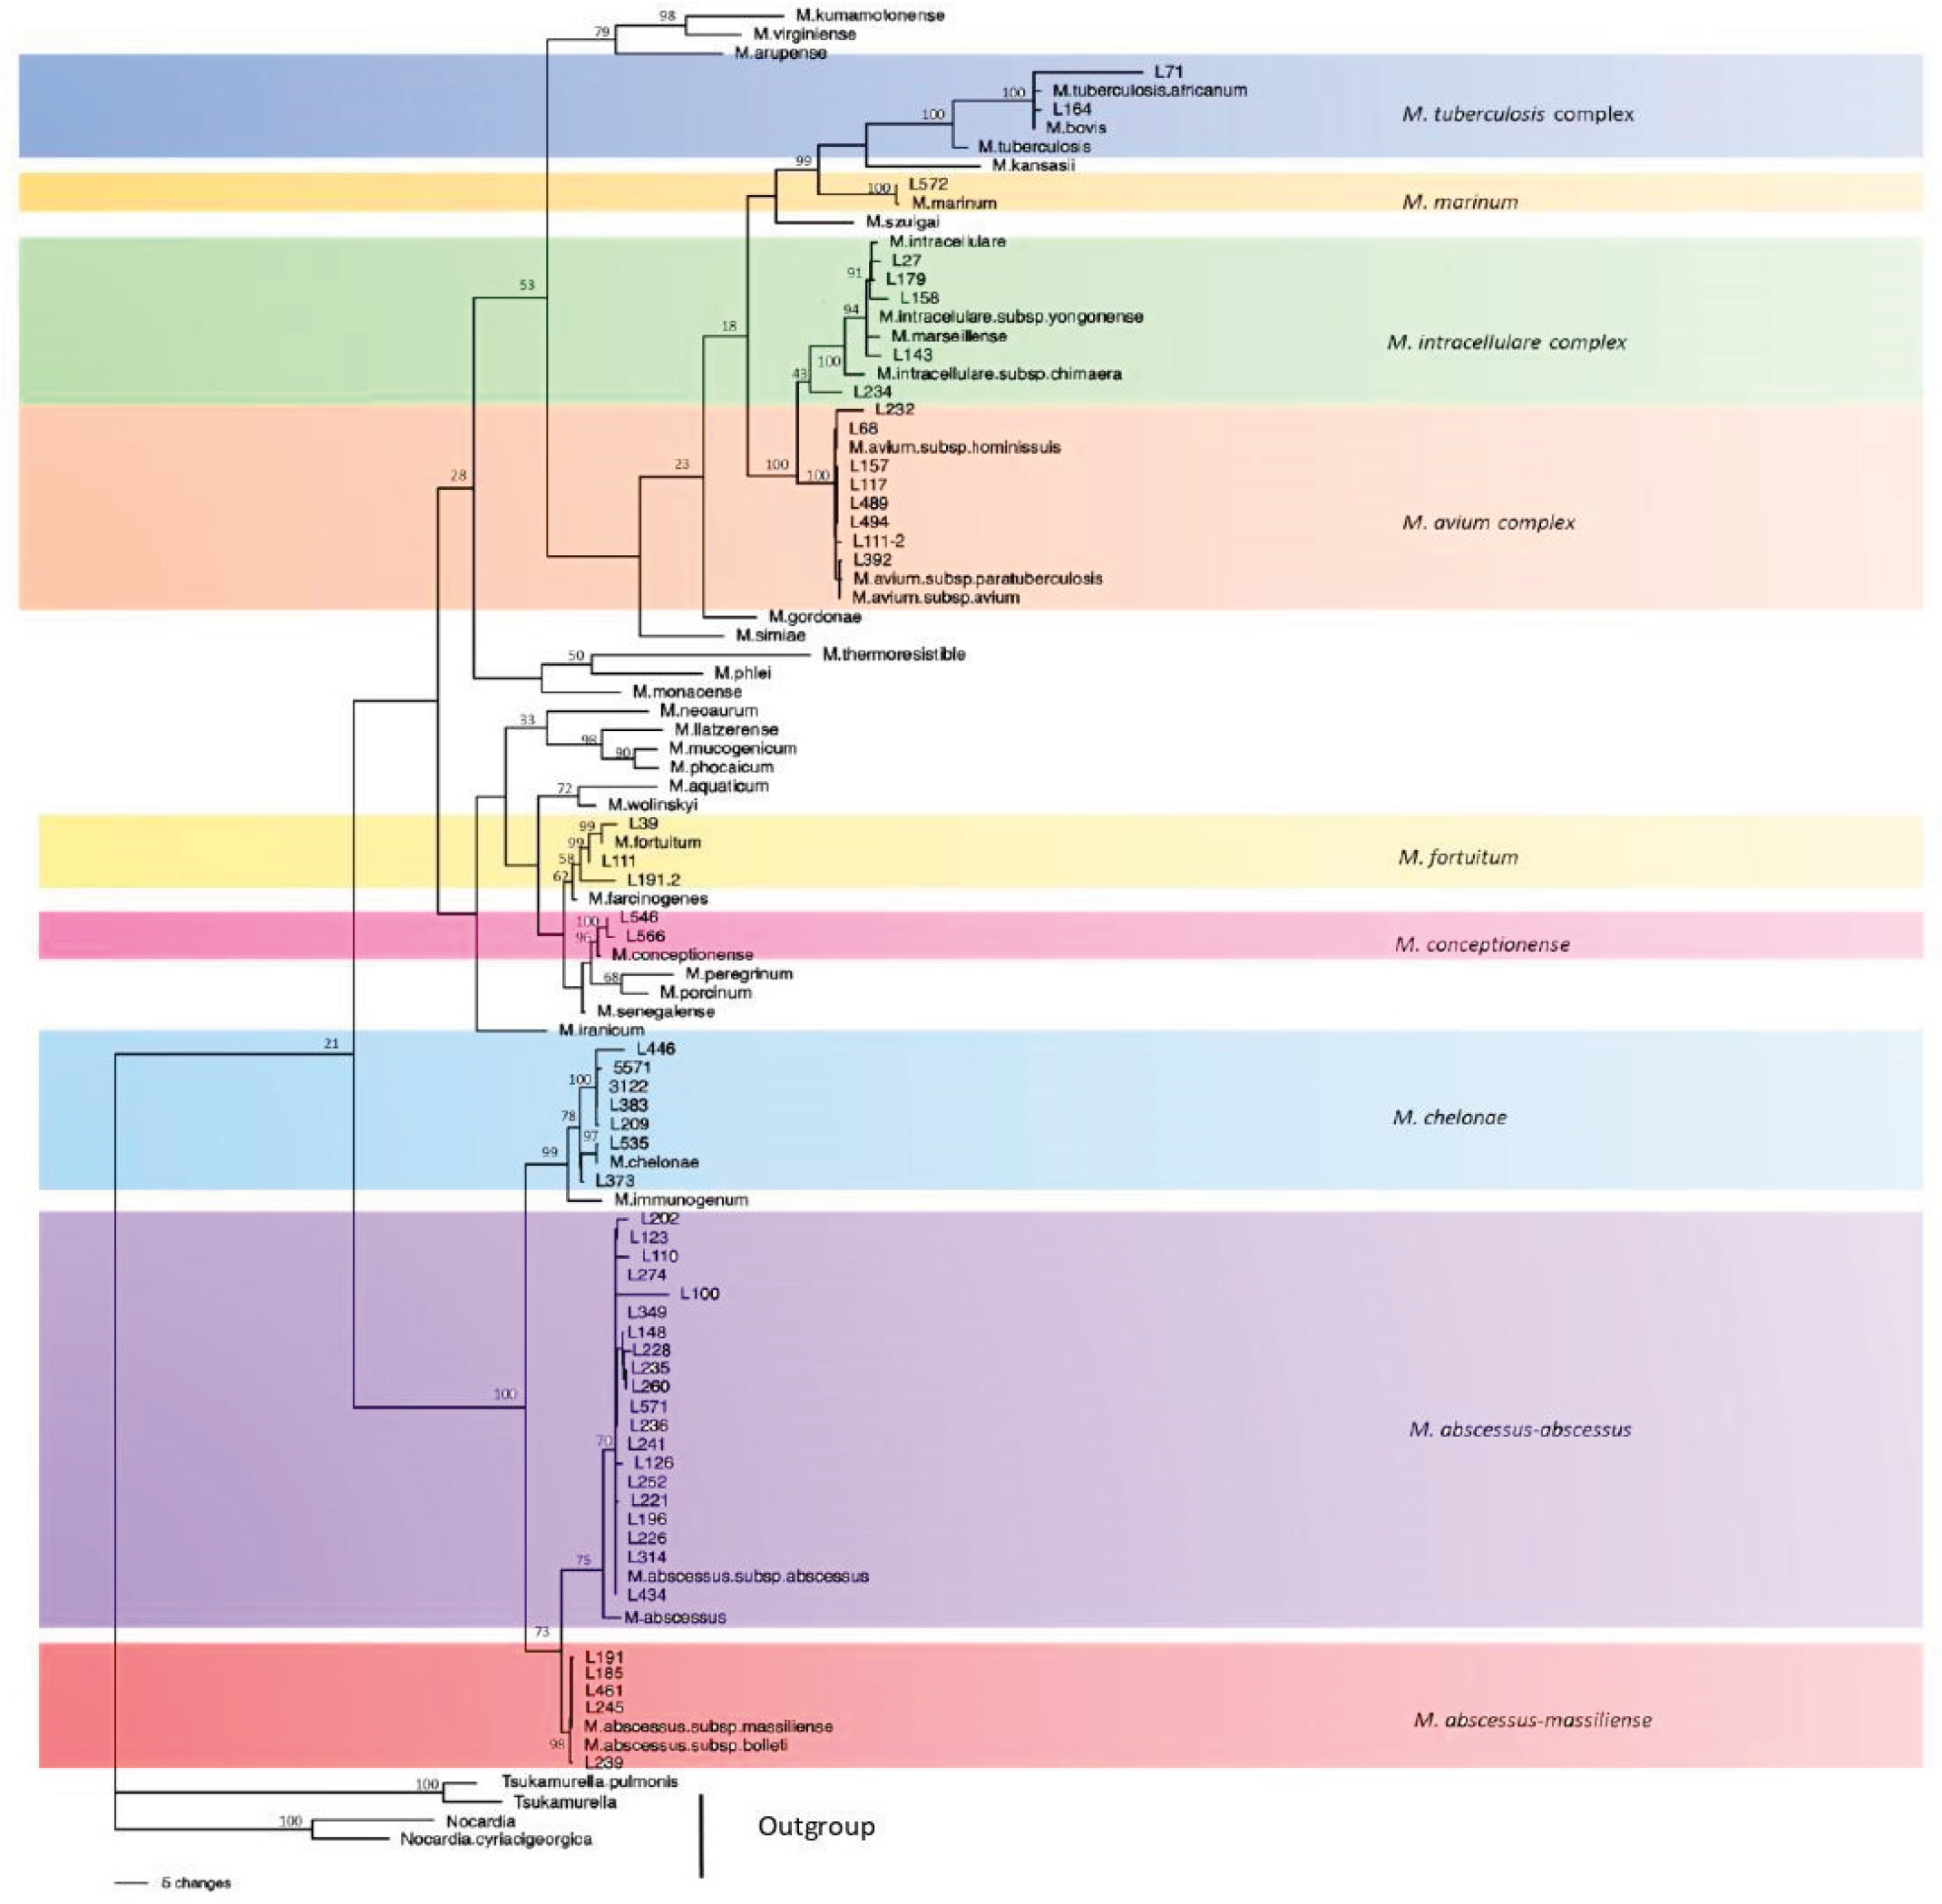

Table 1.
Primers used for 16S rRNA, rpoB and hsp65 gene amplification.
| Genes | Primers | Sequence | Fragment size | Reference |
|---|---|---|---|---|
| hsp65 | TB 11 | ACCAACGATGGTGTGTGTCCT | 400 bp | [24] |
| TB 12 | CTTGTCGAACCGCATACC | |||
| 16S rRNA | 27F | AGAGTTTGATCMTGGCTCAG | 1500 bp | [25] |
| 1492R | TACGGYTACCTTGTTACGACTT | |||
| rpoB | rpoB-R | AGCGGCTGCTGGGCTGGGTGATCATC | 720 bp | [10] |
| rpoB-F | GGCAAGGTCACCCCCCGAAGGG |
Table 2.
Susceptibility profile of fast-growing mycobacteria using the Sensititre system.
| Fast-growing mycobacteria | |||||||||||||||
|---|---|---|---|---|---|---|---|---|---|---|---|---|---|---|---|
| Strain (n) | Susceptibility | Trimethoprim/sulfamethoxazole n (%) | Amikacin n (%) | Clarithromycin n (%) | Moxifloxacin n (%) | Ciprofloxacin n (%) | Linezolid n (%) | Doxycycline n (%) | Tigecycline n (%) | Tobramycin n (%) | Imipenem n (%) | Minocycline n (%) | Amoxicillin/clavulanic acid n (%) | Cefepime n (%) | Ceftriaxone n (%) |
| Mycobacterium abscessus subsp. abscessus (22) | Susceptible | 11 (50%) | 22 (100%) | 20 (90.9%) | 9 (40.9%) | 0 (0%) | 13 (59.1%) | 1 (4.5%) | 21 (95.4%) | 4 (18.2%) | 3 (13.6%) | 0 (0%) | 0 (0%) | 0 (0%) | 0 (0%) |
| Resistant | 11 (50%) | 0 (0%) | 2 (10%) | 13 (59%) | 22 (100%) | 9 (40.9%) | 21 (95.4%) | 1 (4.5%) | 18 (81.8%) | 19 (86.4%) | 22 (100%) | 22 (100%) | 22 (100%) | 22 (100%) | |
| Mycobacterium abscessus subsp. massiliense (5) | Susceptible | 0 (0%) | 5 (100%) | 5 (100%) | 1 (20%) | 1 (20%) | 3 (60%) | 1 (20%) | 5 (100%) | 1 (20%) | 1 (20%) | 1 (20%) | 0 (0%) | 0 (0%) | 0 (0%) |
| Resistant | 5 (100%) | 0 (0%) | 0 (0%) | 4 (80%) | 4 (80%) | 2 (40%) | 4 (80%) | 0 (0%) | 4 (80%) | 4 (80%) | 4 (80%) | 5 (100%) | 5 (100%) | 5 (100%) | |
| Mycobacterium abscessus subsp. bolletii (1) | Susceptible | 1 (100%) | 1 (100%) | 1 (100%) | 0 (0%) | 0 (0%) | 0 (0%) | 0 (0%) | 1 (100%) | 1 (100%) | 0 (0%) | 0 (0%) | 0 (0%) | 0 (0%) | 0 (0%) |
| Resistant | 0 (0%) | 0 (0%) | 0 (0%) | 1 (100%) | 1 (100%) | 1 (100%) | 1 (100%) | 0 (0%) | 0 (0%) | 1 (100%) | 1 (100%) | 1 (100%) | 1 (100%) | 1 (100%) | |
| Mycobacterium chelonae (7) | Susceptible | 0 (0%) | 7 (100%) | 7 (100%) | 5 (71.4%) | 1 (14.3%) | 5 (71.4%) | 3 (42.8%) | 7 (100%) | 7 (100%) | 7 (100%) | 3 (42.8%) | 0 (0%) | 0 (0%) | 0 (0%) |
| Resistant | 7 (100%) | 0 (0%) | 0 (0%) | 2 (28.6%) | 6 (85.7%) | 2 (28.6%) | 4 (57.1%) | 0 (0%) | 0 (0%) | 0 (0%) | 4 (57.1%) | 7 (100%) | 7 (100%) | 7 (100%) | |
| Mycobacterium conceptionense (2) | Susceptible | 0 (0%) | 2 (100%) | 2 (100%) | 2 (100%) | 2 (100%) | 0 (0%) | 2 (100%) | 2 (100%) | 0 (0%) | 2 (100%) | 2 (100%) | 0 (0%) | 0 (0%) | 0 (0%) |
| Resistant | 2 (100%) | 0 (0%) | 0 (0%) | 0 (0%) | 0 (0%) | 2 (100%) | 0 (0%) | 0 (0%) | 2 (100%) | 0 (0%) | 0 (0%) | 2 (100%) | 2 (100%) | 2 (100%) | |
| Mycobacterium fortuitum (3) | Susceptible | 3 (100%) | 3 (100%) | 2 (66.7%) | 3 (100%) | 3 (100%) | 2 (66.7%) | 2 (66.7%) | 3 (100%) | 0 (0%) | 2 (66.7%) | 2 (66.7%) | 0 (0%) | 0 (0%) | 0 (0%) |
Table 3.
Susceptibility profile of slow-growing mycobacteria using the Sensititre system.
| Slow-growing mycobacteria | |||||||||||||||||||
|---|---|---|---|---|---|---|---|---|---|---|---|---|---|---|---|---|---|---|---|
| Strain (n) | Susceptibility | Trimethoprim/sulfamethoxazole n (%) | Amikacin n (%) | Clarithromycin n (%) | Moxifloxacin n (%) | Ciprofloxacin n (%) | Linezolid n (%) | Doxycycline n (%) | Ethambutol n (%) | Streptomycin n (%) | Ethionamide n (%) | Isoniazid n (%) | Rifabutin n (%) | Rifampicin n (%) | |||||
| Mycobacterium marinum (1) | Susceptible | 1 (100%) | 1 (100%) | 1 (100%) | 1 (100%) | 1 (100%) | 1 (100%) | 0 (0%) | 1 (100%) | 1 (100%) | 1 (100%) | 0 (0%) | 1 (100%) | 1 (100%) | |||||
| Resistant | 0 (0%) | 0 (0%) | 0 (0%) | 0 (0%) | 0 (0%) | 0 (0%) | 1 (100%) | 0 (0%) | 0 (0%) | 0 (0%) | 1 (100%) | 0 (0%) | 0 (0%) | ||||||
| Mycobacterium avium subsp hominissuis (7) | Susceptible | 4 (57.1%) | 6 (85.7%) | 7 (100%) | 3 (42.8%) | 3 (42.8%) | 2 (28.6%) | 2 (28.6%) | 5 (71.4%) | 3 (42.8%) | 5 (71.4%) | 3 (42.8%) | 6 (85.7%) | 5 (71.4%) | |||||
| Resistant | 3 (42.9%) | 1 (14.3%) | 0 (0%) | 4 (57.1%) | 4 (57.1%) | 5 (71.4%) | 5 (71.4%) | 2 (28.6%) | 4 (57.1%) | 2 (28.6%) | 4 (57.1%) | 1 (14.3%) | 2 (28.6%) | ||||||
| Mycobacterium aviumcomplex (1) | Susceptible | 0 (0%) | 0 (0%) | 1 (100%) | 1 (100%) | 1 (100%) | 1 (100%) | 1 (100%) | 1 (100%) | 1 (100%) | 1 (100%) | 1 (100%) | 1 (100%) | 1 (100%) | |||||
| Resistant | 1 (100%) | 1 (100%) | 0 (0%) | 0 (0%) | 0 (0%) | 0 (0%) | 0 (0%) | 0 (0%) | 0 (0%) | 0 (0%) | 0 (0%) | 0 (0%) | 0 (0%) | ||||||
| Mycobacterium intracellulare (2) | Susceptible | 2 (100%) | 2 (100%) | 2 (100%) | 2 (100%) | 2 (100%) | 2 (100%) | 0 (0%) | 2 (100%) | 1 (50%) | 2 (100%) | 1 (50%) | 2 (100%) | 2 (100%) | |||||
| Resistant | 0 (0%) | 0 (0%) | 0 (0%) | 0 (0%) | 0 (0%) | 0 (0%) | 2 (100%) | 0 (0%) | 1 (50%) | 0 (0%) | 1 (50%) | 0 (0%) | 0 (0%) | ||||||
| Mycobacterium intracellularecomplex (3) | Susceptible | 2 (66.7%) | 3 (100%) | 3 (100%) | 2 (66.7%) | 1 (33.3%) | 2 (66.7%) | 0 (0%) | 3 (100%) | 1 (33.3%) | 1 (33.3%) | 1 (33.3%) | 1 (33.3%) | 3 (100%) | |||||
| Resistant | 1 (33.3%) | 0 (0%) | 0 (0%) | 1 (33.3%) | 2 (66.7%) | 1 (33.3%) | 3 (100%) | 0 (0%) | 2 (66.7%) | 2 (66.7%) | 2 (66.7%) | 2 (66.7%) | 0 (0%) | ||||||
Disclaimer/Publisher’s Note: The statements, opinions and data contained in all publications are solely those of the individual author(s) and contributor(s) and not of MDPI and/or the editor(s). MDPI and/or the editor(s) disclaim responsibility for any injury to people or property resulting from any ideas, methods, instructions or products referred to in the content. |
© 2026 by the authors. Licensee MDPI, Basel, Switzerland. This article is an open access article distributed under the terms and conditions of the Creative Commons Attribution (CC BY) license (http://creativecommons.org/licenses/by/4.0/).
Copyright: This open access article is published under a Creative Commons CC BY 4.0 license, which permit the free download, distribution, and reuse, provided that the author and preprint are cited in any reuse.