

Submitted:
24 July 2026
Posted:
10 August 2026
You are already at the latest version
Abstract
Background: Permanent residents at extreme altitudes face severe chronic hypoxia, driving excessive erythrocytosis (EE) and chronic mountain sickness (CMS). However, the clinical spectrum of EE remains poorly characterized, and standardized diagnostic criteria (e.g., the Qinghai CMS score) may lack phenotypic accuracy at extreme elevations. This study aims to characterize the specific clinical features associated with an expanded red blood cell mass in extreme-altitude inhabitants. Methods: A cross-sectional study was conducted in La Rinconada, Peru (>5,100 m), the highest permanent human settlement. The cohort comprised 117 adult residents (73 men, 44 women). We evaluated the association between hemoglobin (Hb) concentrations and systemic symptomatology using standardized clinical assessments and validated instruments, including the Harvard Step Test (HST), Headache Impact Test (HIT-6), Mini Tinnitus Questionnaire, Douleur Neuropathique 4 (DN4), mMRC dyspnea scale, PSQI, and Montreal Cognitive Assessment (MoCA). Results: Clinical profiling revealed a non-linear, symptom-specific relationship between Hb levels and clinical manifestations. Elevated Hb correlated with decreased cardiovascular fitness (HST, p<0.001) and increased dizziness. Paradoxically, individuals with relatively lower Hb levels experienced higher intensities of oppressive chest pain (p<0.001) and more disabling headaches (HIT-6, p=0.005). Furthermore, higher Hb was significantly associated with preserved cognitive function (MoCA, p<0.05). Crucially, Hb levels showed no significant association with classic CMS symptoms such as dyspnea, cyanosis, paresthesias, or sleep disturbances. Conclusions: At extreme altitudes, EE exhibits a dual pathophysiological nature—acting as a vital compensatory mechanism for neurocognitive preservation while simultaneously driving hemodynamic compromise. The stark dissociation between absolute red blood cell mass and classic CMS symptomatology challenges current diagnostic paradigms, highlighting the urgent clinical need to recalibrate CMS diagnostic criteria for extreme-altitude populations.
Keywords:
altitude
; hypoxia
; erythrocytosis
; hemoglobin
; high-altitude epidemiology
; clinical manifestations
; chronic mountain sickness
; cognitive impairment
1. Introduction
An estimated 60 to 80 million individuals worldwide reside permanently at altitudes above 2,500 meters (m) [1]. Driven by economic activities such as mining, migration to high-altitude settlements continues to expand this demographic group. Chronic exposure to hypobaric hypoxia induces a cascade of physiological adaptations designed to optimize oxygen transport and maintain cellular bioenergetics [2]. However, when this adaptive process fails, it can lead to Monge’s disease [3], also known as chronic mountain sickness (CMS), a maladaptive syndrome characterized by excessive erythrocytosis (EE), severe hypoxemia, headache, fatigue, cyanosis, and sleep disturbances. Globally, CMS affects 5% to 10% of permanent residents at high altitudes, with prevalence rates rising to 30% to 35% in specific Andean urban centers [4], making it a major public health concern. Its prevalence varies widely, influenced by factors such as altitude, sex, age, ethnicity, and diagnostic criteria [3]; for instance, while native Tibetans rarely develop the condition, it remains prevalent among Han Chinese migrants (17.8%) [5].
The progressive clinical deterioration in CMS profoundly impacts the respiratory, cardiovascular, and neurological systems [4]. At its core, severe hypoxemia and sleep apneas drive pathological excessive erythropoiesis (EE) [6]. The resulting hyperviscosity, coupled with oxidative-inflammatory-nitrosative stress (OXINOS), induces systemic endothelial dysfunction and severe hemodynamic overload, evidenced by pulmonary and systemic hypertension [4,6]. Neurologically, CMS significantly reduces mean cerebral blood flow velocity [7]. Ultimately, this sustained hypoperfusion and cardiovascular maladaptation exponentially increase the risk of cor pulmonale, ischemic cerebrovascular events, and irreversible cognitive decline [4].
In La Rinconada, Peru (5,100 m), the highest permanent human settlement, the reported CMS prevalence is 14% [8]. Paradoxically, this rate is lower than in other Andean mining centers like Cerro de Pasco (4,380 m), underscoring the multifactorial etiology of CMS. Despite this severe clinical burden [9,10], the granular manifestations of the disease remain poorly characterized. Consequently, clinical assessment relies almost exclusively on the standardized CMS score [4], due to the lack of validated diagnostic alternatives.
The Qinghai consensus defines CMS primarily by EE, setting hemoglobin (Hb) thresholds of ≥21 g/dL for men and ≥19 g/dL for women [11,12]. However, compensatory hematopoiesis is strictly altitude-dependent. The absence of altitude-specific physiological baselines for Hb and hematocrit complicates the accurate diagnosis of both EE and unrelated hematological disorders. Extrapolating these lower-altitude thresholds to extreme elevations risks severe clinical misclassification, posing a significant public health challenge and impeding appropriate medical management.
The objective of this study is to evaluate the association between Hb concentrations and the clinical manifestations observed in permanent residents of La Rinconada. Through detailed clinical evaluations of individuals with elevated Hb levels, we analyzed the specific symptoms associated with these hematological parameters and their impact on daily functioning. These findings will refine the phenotypic stratification of EE and improve the clinical interpretation of elevated Hb levels in conditions of extreme altitude.
2. Materials and Methods
2.1. Study Population and Design
This was an observational, cross-sectional study. A total of 117 (73 men and 44 women) permanent residents of La Rinconada, aged between 18 and 73 years, were recruited during medical outreach programs organized in collaboration with the La Rinconada Miners' Association. Written informed consent was obtained from all individuals prior to enrollment. Consistent with the observational design of the study, no experimental interventions were administered.
2.2. Data Collection
A cross-sectional study was conducted in La Rinconada, Peru (>5,100 m). Data collection was performed in a controlled indoor environment to mitigate extreme climatic fluctuations. To ensure a basal physiological state, an absolute resting period of 5 minutes was standardized prior to the evaluations, with no fasting requirement.
The initial clinical evaluation comprised anthropometric measurements, and the recording of vital signs: blood pressure and heart rate (Riester Ri-Champion digital sphygmomanometer) and oxygen saturation (SpO₂) (Nellcor OxiMax N-65 pulse oximeter; 1% resolution). The presence of peripheral cyanosis in the distal extremities (hands and fingers), lips, and oral mucosa was clinically assessed, with its severity staged (absent, mild, moderate, and severe) using the specific cyanosis item from the CMS Questionnaire [13]. Respiratory rate was quantified through passive observation for 1 minute without the patient's awareness, recording the average of two independent measurements. Subsequently, dyspnea was stratified using the modified Medical Research Council (mMRC) scale (grades 0-4) [14]. Systemic symptomatology was documented through structured screening: chest pain (absent, oppressive, sharp; intensity), palpitations (absent, spontaneous, exertional), fatigue (absent, spontaneous, exertional; response to rest: no improvement, improvement), dizziness (present/absent), edema (absent/present, morning and night), and extremity paresthesias (yes/no)[15]. Concurrently, validated instruments were administered: MoCA (global cognition), PSQI (sleep quality), HIT-6 (headache), and the Mini-THI questionnaire (tinnitus), with its impact categorized as mild, moderate, severe, or very severe [16].
Following this, the hematological profile was obtained via digital capillary puncture; the first two drops were discarded, and the third was processed in situ to quantify Hb concentration (azidemethemoglobin method; HemoCue Hb 201+) and Hct (microcentrifugation; HemataStat II).
Finally, cardiopulmonary fitness was determined using the Harvard Step Test [17]. The protocol consisted of two methodological phases. Initially, following equipment calibration, participants remained seated in absolute rest for 3 to 5 minutes to ensure hemodynamic stabilization and the recording of a baseline heart rate [17]. During the execution phase, participants completed continuous four-step ascending and descending cycles on a 40-cm rigid bench, strictly adhering to the cadence of a metronome (Piccolo Wittner 836 Taktell). The maintenance of an upright posture and full biomechanical extension of the lower limbs during each cycle were rigorously monitored. The effort was capped at a maximum of 5 minutes, with premature termination established in the event of extreme exhaustion or the functional inability to sustain the rhythm for 15 consecutive seconds, documenting the exact working time in seconds [17]. Immediately following the effort, participants adopted a seated position to initiate passive recovery. The heart rate was manually quantified across three specific 30-second intervals: 1:00-1:30, 2:00-2:30, and 3:00-3:30 minutes post-exercise. The sum of these three partial measurements was employed as the core variable to calculate the Physical Fitness Index using the standard equation,
Formula 1. Physical Fitness Index using the standard equation. Sec, Seconds, PR, Heart rate [18].
2.3. Statistical Analysis
A database was created in Microsoft Excel (v16, Microsoft Corporation, Redmond, WA, USA) for the systematic recording of clinical and demographic data. Qualitative variables were summarized as absolute frequencies and percentages. Quantitative variables, whose distribution did not conform to normality (assessed using the Shapiro-Wilk test), are presented as median and interquartile range.
For bivariate analysis, associations between qualitative variables were assessed using Pearson's chi-squared test, applying the Yates' correction or Fisher's exact test when necessary (expected frequencies <5). Comparisons of quantitative variables between two independent groups were performed using the Mann-Whitney U test, and between three or more groups using the Kruskal-Wallis test. Correlations between continuous quantitative variables were assessed using Spearman's rank correlation coefficient (ρ). A p-value <0.05 was considered statistically significant in a two-tailed test. All statistical analyses were performed using Python version 3.11.6, employing the SciPy library (v1.10.1) for statistical tests and pandas (v1.5.3) Python package for data treatment.
2.4. Ethical Aspects
Prior to the start of the study, participants were fully informed about the objectives and procedures, and informed consent was obtained from each of them. The research protocol was approved on April 15, 2025, by the Ethics Committee of the University of San Martín de Porres, and received Federal Guarantees for the Protection of Human Subjects (FWA No. 00015320) and was registered with the Institutional Review Board of the U.S. Department of Health and Human Services (IRB/HHS No. 00003251).
3. Results
3.1. Baseline Characteristics of the Population
Baseline clinical and demographic characteristics of the study cohort (n = 117) are summarized in Table 1. The median residence time at high altitude was 18.0 years (IQR, 12.0–25.0). Median Hb concentration was 19.0 g/dL (IQR, 17.5–21.5), and SpO₂ was 83% (SpO2)(IQR, 81–85). Median systolic blood pressure (SBP) and diastolic blood pressure (DBP) were 114 mm Hg (IQR, 103–121) and 73 mm Hg (IQR, 69–79), respectively, corresponding to a mean arterial pressure of 86.7 mm Hg (IQR, 80.0–93.3). The median body mass index (BMI) was 27.2 kg/m² (IQR, 24.8–28.4) (Table 1).
Upon stratification by sex, median Hb concentration was significantly higher in men than in women (20.0 g/dL [IQR, 18.0–22.2] vs 18.1 g/dL [IQR, 17.3–19.2]; p < 0.001). No significant sex-based differences were observed in high-altitude residence time (p = 0.158), baseline SpO₂ (84% vs 83%; p = 0.134), or any of the assessed cardiovascular parameters, including mean arterial pressure (p = 0.813). Similarly, median BMI did not differ significantly between men and women (27.6 kg/m² vs 25.4 kg/m²; P = 0.077) (Table 1).
3.2. Cardiovascular Symptoms
3.2.1. Chest Pain
Chest pain was present in 64.1% (75/117) of the cohort, predominantly described as oppressive. The presence and quality of chest pain differed significantly by sex (p < 0.001). Women were more likely to report oppressive chest pain than men (81.8% vs 43.8%), whereas men more frequently reported an absence of symptoms (50.7% vs 11.4%). Sharp chest pain was rare, occurring in only 5.5% of men and 6.8% of women. (Table 2)
Hb concentrations differed significantly based on the presence of chest pain. Patients experiencing chest pain had lower median Hb levels compared with those reporting an absence of pain (18.3 g/dL [IQR, 17.4–19.3] vs 22.0 g/dL [IQR, 19.6–23.0]; Mann-Whitney U = 2610.50; p < 0.001) (Figure 1). Additionally, Hb levels demonstrated a significant, moderate inverse correlation with chest pain intensity (⍴ = -0.537; p < 0.001). (Figure 2)
3.2.2. Palpitations
Palpitations were present in 89.7% of the cohort. These episodes were predominantly spontaneous (n = 89) rather than exertion-induced (n = 16). The presentation of palpitations did not differ significantly by sex (p = 0.083). Specifically, spontaneous palpitations occurred in 71.2% of men and 84.1% of women, whereas an absence of this symptom was noted in 9.6% and 11.4% of men and women, respectively (Table 2). Median Hb concentrations were similar between patients with and without palpitations (19.0 g/dL [IQR, 17.5–21.5] vs 17.7 g/dL [IQR, 16.9–21.1]; Mann-Whitney U = 437.0; p = 0.084)
3.2.3. Fatigue
Fatigue was a nearly universal clinical feature, affecting 96.6% of the cohort. Most patients experienced unprovoked fatigue (n = 102), with exertional fatigue occurring in a smaller subset (n = 11). The clinical presentation of fatigue did not differ significantly by sex (p = 0.643). Unprovoked fatigue was predominant in both groups, reported by 84.9% of men and 90.9% of women, whereas the symptom was completely absent in only 4.1% of men and 2.3% of women (Table 2). Hb concentrations did not differ significantly between patients with and without fatigue (19.0 g/dL [IQR, 17.5–21.5] vs 18.0 g/dL [IQR, 17.2–18.9]; Mann-Whitney U = 146.5; p = 0.236). However, among patients with fatigue, those whose symptoms did not improve with rest exhibited significantly lower median Hb concentrations compared with those whose fatigue was alleviated by rest (17.3 g/dL [IQR, 16.9–17.5] vs 19.8 g/dL [IQR, 18.8–22.1]; Mann-Whitney U = 167.0; p < 0.001).
3.2.5. Edema
Edema was present in 33.3% (39/117) of the study cohort. The prevalence of this clinical sign did not differ significantly by sex (37.0% in men vs 27.3% in women; p = 0.380) (Table 2). Median Hb concentrations were similar between patients with and without edema (19.43 g/dL [IQR, 17.50–22.48] vs 19.00 g/dL [IQR, 17.530–21.000]; Mann-Whitney U = 1421.500; p = 0.300). Among patients with edema, Hb levels did not differ significantly based on the timing of symptom onset, with comparable concentrations observed between those experiencing morning versus evening edema (19.33 g/dL [IQR, 17.650–21.500] vs 19.02 g/dL [IQR, 17.500–22.540]; Mann-Whitney U = 109.50; p = 0.597) (Figure 3).
3.2.6. Cardiovascular Function and Physical Performance
The physical efficiency index calculated by the Harvard step test was used for assessment, revealing a strong negative correlation between this index and Hb level (ρ = -0.778; p < 0.001) (Figure 4).
3.3. Respiratory Symptoms Cyanosis
3.3.1. Respiratory Pattern
Globally, 57.3% (n = 67) presented with eupnea and 42.7% (n = 50) with tachypnea, showing no significant sex-based differences (eupnea: 57.5% in men vs. 56.8% in women; p = 1.000) (Table 2). There was no statistically significant difference in median hemoglobin concentrations between patients presenting with eupnea (18.87 g/dL [IQR, 17.49–20.75]) and those with tachypnea (19.67 g/dL [IQR, 17.60–21.83]) (Mann-Whitney U = 1994.0, p = 0.079). Median SpO2 was significantly higher in patients presenting with eupnea (84.0% [IQR, 82.00–86.0]) compared with those presenting with tachypnea (83.0% [IQR, 80.25–84.0]) (Mann-Whitney U = 1317.5, p = 0.048).
3.3.2. Cyanosis
Peripheral cyanosis was the predominant phenotype (44.4%; n = 52), followed by generalized (31.6%; n = 37) and central (19.7%; n = 23); only 4.3% (n = 5) of patients presented without this sign. Phenotypic distribution differed significantly by sex (p = 0.024, chi-squared test). Although peripheral cyanosis was the most frequent manifestation in both cohorts, females exhibited a higher proportion of central cyanosis compared to males (31.8% vs. 12.3%), whereas males presented with a higher frequency of the generalized form (Table 2).
No significant differences were observed across the cyanosis categories (absent, peripheral, central, and generalized, respectively) regarding median hemoglobin concentrations (21.60 g/dL [IQR, 19.80–21.80], 18.87 g/dL [IQR, 17.73–21.00], 18.33 g/dL [IQR, 17.42–19.68], and 19.50 g/dL [IQR, 17.50–22.20]; Kruskal-Wallis H = 3.45, p = 0.328) or median SpO2 levels (83.0 [IQR, 81.0–84.0], 83.0 [IQR, 79.0–84.0], 83.0 [IQR, 81.0–85.0], and 84.0 [IQR, 82.0–85.0]; Kruskal-Wallis H = 2.01, p = 0.571)
3.3.3. Dyspnea
The absence of dyspnea (Grade 0) was the predominant presentation in both men (39.7%; n = 29) and women (45.5%; n = 20), followed by mild symptoms (Grade 1: 32.9% and 38.6%, respectively), with no significant sex-based differences in severity distribution (p = 0.545; chi-squared) (Table 2). There was no statistically significant difference in median hemoglobin concentrations across the dyspnea groups: without dyspnea (19.20 g/dL [IQR, 17.80–21.83]), grade 1 (18.83 g/dL [IQR, 17.50–21.00]), grade 2 (19.10 g/dL [IQR, 17.25–21.43]), and grade 3 (18.87 g/dL [IQR, 17.47–19.50]) (Kruskal-Wallis H = 2.23, p = 0.527). There was no statistically significant difference in median STO2 levels across the evaluated dyspnea categories: grade 1 (84.0 [IQR, 81.0–86.0]), grade 2 (82.0 [IQR, 80.25–83.75]), and grade 3 (82.0 [IQR, 80.0–83.0]) (Kruskal-Wallis H = 3.28, p = 0.194). Despite a slight decrease in SpO₂ medians at higher clinical grades, the inverse correlation lacked statistical significance (ϱ = -0.221; p = 0.070; Spearman), confirming that symptom worsening does not predict progressive desaturation (Figure 5).
3.4. Neurological Symptoms
3.4.1. Headache
The overall prevalence of headaches in the study sample was 73.5% (n=86). When analyzed by sex, the symptom was proportionally more frequent in women (79.5%) than in men (69.9%); however, a Chi-square test revealed that this difference was not statistically significant (p = 0.351) (Table 3). Regarding hematological parameters, participants who experienced headaches presented significantly higher mean Hb levels (19.05 g/dL) than asymptomatic participants (18.47 g/dL) (Mann-Whitney U=1722.5; p = 0.0162).
Within the symptomatic subgroup (n=86), the distribution of headache types showed that hypoxia-attributed headache was the most frequent (75.6%, n=65). Other presentations included tension-type headache (10.5%, n=9), migraine (7.0%, n=6), migraine with aura (3.5%, n=3), and cluster headache (3.5%, n=3). A Fisher's exact test revealed a statistically significant difference in the distribution of these specific subtypes between men and women (p = 0.015). Notably, migraines and migraines with aura were exclusively observed in men, whereas cluster headaches were exclusively reported by women in this cohort (Table 3). However, when evaluating the relationship between specific headache types and Hb concentrations, a highly significant difference was found (Kruskal-Wallis test, H = 20.55, p < 0.001). Patients with tension-type headaches exhibited the highest median Hb levels (22.47 g/dL), followed by migraines (20.85 g/dL) and hypoxia-related headaches (19.00 g/dL), whereas cluster headaches and migraines with aura presented the lowest medians (17.50 g/dL).
3.4.2. Headache Functional Impact (HIT-6)
Finally, the HIT-6 questionnaire was administered to assess the functional impact of headaches on daily quality of life. As illustrated in Figure 6, patients reporting "little or no impact" (n=10) exhibited the highest median Hb levels (22.3 g/dL), whereas those in the "severe impact" category (n=42) showed the lowest median (18.2 g/dL). Statistical analysis using the Kruskal-Wallis test revealed highly significant differences in Hb concentrations across the four impact severity categories (H = 17.72, p = 0.0005).
3.4.3. Paresthesias
The overall presence of paresthesia was highly prevalent, affecting 72.6% of the total sample (n=85). The stratification by sex demonstrated a remarkably homogeneous distribution, with the symptom being present in 75.0% of women and 71.2% of men. A Chi-square test confirmed that there is no significant association between sex and the presence of paresthesia (p = 0.819). Among the symptomatic subgroup, the vast majority (89.4%, n=76) met the criteria for a significant probability of neuropathic pain according to the DN4 scale, with no significant differences between sexes (p = 0.147) (Table 3).
3.4.4. Tinnitus
Tinnitus was present in 47.9% of the participants (n=56). The prevalence was slightly higher in women (52.3%) than in men (45.2%), although a Chi-square test indicated this difference was not statistically significant (p = 0.582). Among the symptomatic individuals, severity was classified using the MTHI scale: 42.9% experienced mild tinnitus, 25.0% moderate, 16.1% severe, and 16.1% very severe. To evaluate whether symptom severity differed by sex, Fisher's exact test was applied, revealing statistically significant variations in severity levels between males and females (p = 0.017). Specifically, severe cases of tinnitus were observed exclusively in men, while women predominantly presented with mild to moderate severity (Table 3).
Furthermore, when evaluating only the symptomatic subgroup to determine whether symptom severity influenced hematological parameters, no significant differences were found with respect to clinical severity levels for Hb (H = 2.06, p = 0.559), using the Kruskal-Wallis test. Hb distributions remained consistent across the mild (n=24), moderate (n=14), severe (n=9), and very severe (n=9) categories. These results demonstrate that, while there is a sex-mediated interaction in the presence of tinnitus, the specific severity of the condition according to the MTHI scale is not associated with Hb concentrations.
3.4.5. Dizziness
Dizziness was reported by approximately one-third of the overall cohort (n=40). Stratification by sex revealed a highly significant difference in the prevalence of this symptom (P < .001). Specifically, men experienced a substantially higher rate of dizziness compared with women (47.2% vs 13.6%). Conversely, the vast majority of women (86.4%) reported a complete absence of the symptom, compared to 52.8% of men (Table 3).
Hb concentrations differed significantly according to the presence of dizziness. Specifically, patients who presented with dizziness exhibited significantly higher Hb levels compared with those who reported an absence of this symptom (median, 21.83 g/dL [IQR, 21.20–22.80] vs 18.00 g/dL [IQR, 17.38–19.04]; Mann-Whitney U = 360.00, P < .001) (Figure 7).
3.4.6. Neurocognitive Manifestations
Of the 117 participants assessed, 67 (57.3%) exhibited mild cognitive impairment, 29 (24.8%) moderate impairment, 3 (2.6%) severe impairment, and 18 (15.4%) normal cognition. A Chi-square test of independence revealed no significant differences in the distribution of cognitive impairment severity between men (n = 73) and women (n = 44) (p = 0.138). Men accounted for all cases of severe impairment and the majority of mild cases (n = 46) (Table 3). Higher Hb concentrations were more frequently observed in participants with normal cognitive function, whereas lower values were prevalent among those with mild cognitive impairment. Notably, severe cognitive impairment was observed exclusively in the cohort with low Hb levels. Furthermore, a Spearman's rank correlation analysis demonstrated a weak, yet statistically significant, positive relationship between Hb concentrations and total MoCA scores (⍴ = 0.187, p < 0.05), indicating slightly better cognitive performance at higher Hb levels.
3.4.7. Sleep Quality
Of the 117 participants assessed, 85 (72.6%) exhibited poor sleep quality [PSQI] scores 6-21), whereas 32 (27.4%) reported good sleep quality (scores 0-5). A Chi-square test of independence revealed no significant differences in sleep quality categories by sex (p = 1.000) (Table 3). Furthermore, a Spearman's rank correlation analysis demonstrated no statistically significant relationship between Hb concentrations and total PSQI scores (rho = 0.05, p = 0.569).
4. Discussion
4.1. Baseline Characteristics of the Population
In this study, we characterized the clinical and demographic profile of extreme-altitude residents in La Rinconada, revealing a population with markedly elevated Hb levels but preserved normotension. Physiologically, profound hypoxemia drives erythropoiesis to sustain tissue oxygenation. However, this compensatory elevation in Hb inherently increases blood viscosity, vascular resistance, and cardiac workload, which can ultimately impair systemic oxygen transport[8].
High-altitude inhabitants face a significant burden of EE and CMS. In contrast to Tibetan cohorts, who demonstrate evolutionary adaptation with lower Hb concentrations and minimized CMS prevalence [6], previous data from La Rinconada report notably higher prevalences for both conditions [8,19]. Although the Qinghai Score remains the diagnostic standard for CMS [4,20], pronounced Hb elevations in extreme-altitude populations (>5000 m) frequently decouple from classic CMS symptomatology. Our cohort's clinical presentation aligns with this discordance, complicating accurate clinical evaluation and underscoring the lack of a precise CMS definition tailored to extreme environments [21].
The observed male predominance in our study sample likely reflects the mining-centric occupational landscape characteristic of the region [22]. Overall Hb concentrations exhibited a distinct sex-based disparity, with higher levels in males. This dimorphism may be attributable to regular menstrual blood loss and the putative protective role of estrogen against EE via GATA1-mediated erythroid apoptosis—a physiological benefit that attenuates postmenopause [23].
Despite the extreme altitude and profound baseline hypoxia, hemodynamic parameters remained within normotensive limits. This physiological finding contrasts with reports of nocturnal hypertension and altered exercise responses in other high-altitude cohorts [24], suggesting potential temporal or population-specific adaptive mechanisms. Furthermore, the cohort's prevailing overweight status diverges from the traditional paradigm of altitude-induced weight loss. This indicates that the expected metabolic demands of hypoxia may be superseded by the predominant influence of regional dietary shifts or socioeconomic factors [25].
4.2. Cardiovascular Symptoms
4.2.1. Chest Pain
Contrary to the traditional assumption that ischemic symptoms at high altitude are solely driven by hyperviscosity from EE, our findings reveal that chest pain, predominantly oppressive, was paradoxically associated with significantly lower median Hb levels compared to asymptomatic individuals. Furthermore, a moderate inverse correlation was observed between Hb concentration and chest pain intensity (⍴ = -0.537). According to previous studies, this could be explained by a decrease in the blood's oxygen-carrying capacity at relatively lower Hb levels in this extreme environment, likely leading to direct myocardial hypoxia (ischemia) and limiting the compensatory capacity of cardiovascular responses [26]. This situation leads to persistent cardiac overload, characterized by increased oxygen demand in the presence of reduced supply, within a context of hypoxic pulmonary vasoconstriction and pulmonary hypertension. Consequently, in this population, chest pain could represent a clinical manifestation of the imbalance between the cardiovascular stress imposed by severe environmental hypoxia and an insufficient erythropoietic response to compensate for it [8,26].
Far from contradicting existing literature, this clinical behavior complements previous reports demonstrating that frank excessive erythrocytosis (Hb > 18 g/dL or hematocrit > 54%) induces alterations such as sigmoid hypertrophy, which produces an obstruction of the left ventricular outflow tract that manifests clinically with chest pain and dyspnea in natives, without the need for underlying atherosclerotic coronary disease [27].
This could be explained by the synergistic interaction between vascular remodeling and hyperviscosity. Chronic alveolar hypoxia induces the neomuscularization of pulmonary arterioles, which increases vascular resistance and triggers hypoxia-associated pulmonary hypertension (HAPH) [20,22]. Upon this already altered hemodynamic bed, blood hyperviscosity acts as a critical mechanical aggravator that exponentially elevates flow resistance. Consequently, chest pain results from a dual ischemic impact: the right ventricular pressure overload imposed by HAPH, coupled with the deterioration of the coronary microcirculation due to hyperviscosity [28].
Similarly, our results integrate coherently with the therapeutic model of Villafuerte et al., who demonstrated that the reduction of erythrocyte mass via phlebotomy alleviates symptoms in patients with severe EE [29].
4.2.2. Palpitations
The overwhelming prevalence of palpitations in our cohort aligns with established observations in hypoxic environments; however, the clinical presentation diverges significantly from existing literature. While earlier expedition studies (>4100 m) predominantly document exertion-induced palpitations linked to sinus tachycardia and tachyarrhythmias during acute exposure[30,31], our chronically exposed residents primarily reported spontaneous episodes.
This shift in symptomatology from exertion-driven to spontaneous triggers highlights the distinct pathophysiological adaptations between acute altitude stress and chronic extreme-altitude residence. In both scenarios, hypoxia acts as a potent driver of sympathetic nervous system hyperactivity, altering chronotropic modulation and inducing palpitations [8,30]. Crucially, in our cohort, the occurrence of palpitations was independent of both sex and Hb concentrations. This lack of association with Hb levels is particularly noteworthy, as it suggests that the arrhythmogenic susceptibility in this population is primarily mediated by hypoxia-induced autonomic dysregulation rather than the direct mechanical or hemodynamic burden (hyperviscosity) of an expanded red blood cell mass.
4.2.3. Fatigue
The near-universal prevalence of fatigue in our cohort highlights the profound metabolic toll of extreme-altitude residence. Notably, while fatigue affected the vast majority of the population, a critical functional divergence emerged regarding recovery. Individuals who found symptomatic relief through rest possessed markedly higher Hb levels compared to those whose fatigue was refractory. In the context of severe hypobaric hypoxia, an expanded red blood cell mass appears to confer a functional advantage by ensuring sufficient oxygen-carrying capacity to restore muscular oxygen homeostasis during periods of rest, thereby effectively compensating for the environmental deficit [32].
The profound baseline oxygen desaturation observed in this population further reflects the physiological hardship imposed by both the extreme altitude and the demanding physical topography of the settlement [33]. Under such conditions of chronic hypoxia, fatigue originates predominantly at a central level, functioning as a neurological safeguard against critical cerebral deoxygenation during exertion. Consequently, oxygen transport capacity, indirectly reflected by systemic oxygen saturation, becomes a highly sensitive determinant of exercise tolerance and physical performance. These findings suggest that, at extreme altitudes, a robust elevation in Hb concentration acts as a crucial compensatory buffer facilitating physiological recovery, whereas blunted erythropoietic responses leave individuals vulnerable to unremitting central and peripheral fatigue. [33,34].
4.2.5. Edema
Peripheral edema emerged as a notable clinical sign in a substantial proportion of our cohort. Traditionally, in high-altitude Andean populations, EE has been described as a maladaptive process associated with pulmonary hypertension and an increased susceptibility to edematous phenomena [26,35]. Within the context of chronic mountain sickness (CMS), clinical manifestations and cardiovascular complications, such as right heart failure, are frequently attributed to chronic hypoxia-induced erythrocytosis. This condition promotes a state of hyperviscosity, diminishing erythrocyte deformability, enhancing cellular aggregation, and impairing capillary transit. Consequently, increased peripheral vascular resistance and capillary hydrostatic pressure, coupled with hypoxia-induced endothelial dysfunction, facilitate fluid extravasation into the interstitium [35,36].
Crucially, however, our results demonstrated that neither the presence of edema nor its temporal onset (morning versus evening) showed any significant association with baseline Hb concentrations or sex. This stark dissociation between absolute red blood cell mass and edematous manifestations directly challenges the classic paradigm that hyperviscosity is the primary driver of fluid extravasation in this population. Instead, it aligns with emerging perspectives suggesting that erythrocytosis should be interpreted primarily as a marker of the profound hypoxic state, within an adaptive spectrum, rather than an obligatory cause of specific CMS symptoms [37]. Our findings indicate that, at extreme altitudes (>5,100 m), the development of peripheral edema is likely driven by multifactorial hemodynamic responses independent of circulating Hb levels. Idiosyncratic differences in hypoxic pulmonary vasoconstriction, secondary right ventricular strain, and direct hypoxia-driven changes in endothelial permeability likely play a more definitive role in precipitating interstitial fluid retention than the simple mechanical burden of an expanded erythrocyte mass.
4.2.6. Cardiovascular Function and Physical Performance
The evaluation of physical efficiency via the Harvard step test revealed a strong negative correlation with Hb concentrations, indicating that individuals with higher Hb levels exhibited poorer cardiovascular recovery and diminished exercise tolerance. While our previous findings suggest that an expanded erythrocyte mass offers protective benefits at rest, such as preserving cognitive function and alleviating baseline central fatigue, this negative correlation highlights the severe hemodynamic trade-offs of excessive erythrocytosis during physical exertion [38]. Under conditions of extreme hypobaric hypoxia, pronounced elevations in Hb drastically increase blood viscosity and peripheral vascular resistance. During dynamic physical stress, this hyperviscosity imposes a significant mechanical afterload on the myocardium, limiting the heart's ability to adequately augment cardiac output and thereby reducing overall cardiovascular efficiency [38,39].
Conversely, individuals with comparatively lower Hb levels within this high-altitude cohort demonstrated higher physical efficiency indices, reflecting a more favorable hemodynamic profile for exertion. Reduced blood viscosity minimizes chronic myocardial overload, allowing for a more efficient chronotropic response and better myocardial oxygenation during the step test [38,40]. These observations indicate that while robust erythropoiesis is a fundamental compensatory mechanism to preserve resting tissue oxygenation at extreme altitudes, it simultaneously acts as a pathophysiological substrate that compromises dynamic cardiovascular capacity.
Therefore, our findings underscore a dual paradigm in high-altitude adaptation: the optimal Hb concentration represents a delicate physiological compromise. Exceedingly high Hb levels, while averting resting hypoxemia, contribute to exertional intolerance and may drive the development of right ventricular strain, cardiomyopathy, and chronic pulmonary hypertension [4,11].
The interindividual variability in this erythropoietic response, likely modulated by underlying genetic factors [41], translates into profound differences in functional capacity, bearing critical implications for the occupational and cardiovascular health of populations permanently residing in these harsh environmental conditions.
4.3. Respiratory Symptoms
4.3.1. Respiratory Rate
Regarding respiratory manifestations, although our study found no significant differences in hemoglobin concentration according to the ventilatory pattern, a markedly elevated erythrocyte burden was observed across the entire cohort. Specifically, we recorded mean levels of 18.87 g/dL in patients with eupnea and 19.67 g/dL in those with tachypnea. These values are consistent with previous studies, which demonstrate that concentrations of 18.1 g/dL are typically associated with the shallower ventilation reported in Andean populations, suggesting an underlying state of chronic maladaptation [42]. This persistence of elevated hemoglobin, which is not mitigated by an increased respiratory rate, could be explained by a blunted hypoxic ventilatory response that limits the efficiency of gas exchange. Faced with this inefficient ventilation, the body is forced to depend on an exacerbated erythropoietic response. This mechanism, mediated by an overstimulation of the erythropoietin axis in response to hypoxia, reflects a high metabolic cost in which tachypnea is insufficient to compensate for hypoxemia, thus perpetuating a vicious cycle of tissue hypoxia and secondary erythrocytosis [43].
4.3.2. Cyanosis
Cyanosis was an almost universal sign in our cohort, displaying a predominant peripheral phenotype with a distinct sexual dimorphism: females exhibited a higher proportion of central cyanosis, whereas males presented more frequently with the generalized form. This aligns with the superior physiological adaptation typically observed in Andean females, which is mediated by the protective effect of estrogen and progesterone on ventilatory control [44]. This hormonal advantage becomes evident postmenopause; as female ventilatory function declines, hemoglobin levels rise dramatically, and the prevalence of clinical signs such as cyanosis equalizes with that of males[45].
A central finding of this study is the evident dissociation between the clinical presentation of cyanosis and classical physiological markers. Primarily, no significant differences were observed between cyanosis categories and hemoglobin concentrations. Paradoxically, the subset of patients presenting entirely without cyanosis exhibited the highest median hemoglobin levels in the cohort. Although this appears to contradict previous reports linking excessive erythrocytosis with greater cyanosis and venous dilation [29], this discrepancy likely stems from clinical subjectivity and the multifactorial nature of the sign. The visual perception of cyanosis depends heavily on the evaluator and the patient's skin phototype, which explains why it does not perfectly correlate with peak hemoglobin levels.
Similarly, no association was evidenced between the type or severity of cyanosis and peripheral oxygen saturation (SpO₂). In fact, oxygen saturation levels remained remarkably stable across all clinical presentations, demonstrating that a visually more severe or generalized presentation does not translate into a greater reduction in peripheral oxygenation. Physiologically, cyanosis reflects the absolute amount of deoxyhemoglobin in the capillaries rather than the global degree of systemic oxygenation. Given the compensatory polycythemia in high-altitude residents, the volume of deoxyhemoglobin easily surpasses the visual threshold without necessarily implying critical tissue hypoxemia. Thus, the clinical inspection of Andean cyanosis illustrates an increase in local erythrocyte mass, but it does not function as a direct or linear indicator of systemic oxygenation [46].
4.3.3. Dyspnea
Regarding dyspnea, the absence of symptoms (Grade 0) was the predominant presentation in both sexes, followed closely by mild symptoms, revealing a marked clinical-physiological dissociation. Symptom severity was completely independent of hemoglobin concentration, contrasting with previous evidence [47] that associates extreme hematocrit levels (>80%) with hyperviscosity and incapacitating dyspnea. In our cohort, erythrocyte mass did not predict symptom severity, suggesting an adaptive tolerance threshold where local mechanisms successfully mitigate the hemodynamic impact of erythrocytosis.
Similarly, the lack of a statistically significant association between dyspnea and oxygen saturation (SpO₂) —despite a slight, non-significant downward trend observed at higher clinical grades— supports the thesis that, in acclimatized populations, vascular remodeling temporarily optimizes the ventilation/perfusion ratio [48]. Thus, dyspnea does not represent a proportional response to hypoxemia, but rather a marker of "adaptive failure" that emerges only when pulmonary hypertension and right ventricular overload exhaust the functional reserve capacity.
This phenomenon is accentuated by the "blunted hypoxic ventilatory response" characteristic of Andean inhabitants [49], whose reduced central chemoreceptor sensitivity allows them to tolerate profound desaturations. In summary, chronic altitude exposure redefines ventilatory control and the perception of exertion. The organism prioritizes functional stability, relegating dyspnea to a late sign of right-sided cardiovascular decompensation, rather than a mere reflection of hypoxemia.
4.4. Neurological Symptoms
4.4.1. Headache Incidence
Headache emerged as a highly prevalent neurological symptom, demonstrating a robust association with elevated Hb concentrations. This phenomenon is likely driven by cerebral hemodynamic alterations secondary to EE, wherein heightened blood viscosity precipitates cerebral venous stasis [50]. The resultant increase in cerebrovascular resistance diminishes cerebral blood flow and elevates intracranial pressure, ultimately compromising microcirculatory perfusion and restricting oxygen delivery to neural tissue despite an augmented arterial oxygen content [51]. These observations align with prior investigations demonstrating that permanent residents at extreme altitudes exhibit significantly reduced cerebral blood flow compared to sea-level populations—an adaptation linked to hypoxia-induced vasodilation and relative hypercapnia [52,53]. Furthermore, hypoxia-driven polycythemia critically exacerbates blood viscosity, acting as a primary catalyst for headaches [54]. Conversely, while polycythemia fundamentally serves as a compensatory mechanism against chronic hypoxia, the manifestation of headaches may signal a maladaptive physiological threshold rather than direct erythrocyte toxicity [37].
Although our cohort exhibited only a marginal trend toward lower peripheral oxygen saturation (SpO₂) among symptomatic patients, the broader literature firmly establishes hypoxemia as a critical trigger. Studies in permanent high-altitude residents consistently demonstrate that pronounced SpO₂ desaturation is strongly predictive of both the incidence and increased frequency of headache episodes [55,56].
4.4.2. Types of Headaches
The overall prevalence of headaches in the present cohort was substantial, marginally exceeding Peruvian national estimates [57]. Contrary to global epidemiological patterns of primary headaches, which classically exhibit a strong female predominance [58], our cohort demonstrated a sex-neutral distribution (Table 3).
These clinical phenotypes stratified along distinct hemoglobin (Hb) gradients. Tension-type headaches and migraines were associated with the highest degree of polycythemia, whereas cluster headaches and migraines with aura occurred in individuals with comparatively lower Hb concentrations. This divergence underscores a complex pathophysiological interplay, suggesting that distinct neurovascular mechanisms driving specific headache phenotypes may be uniquely modulated by the degree of erythrocytosis and sex-specific hormonal profiles.
The prominent attribution of headaches to hypoxic stress aligns seamlessly with established literature on high-altitude headache, a quintessential manifestation at elevations exceeding 3,000 meters [59]. The comparatively lower incidence of classical primary headaches in this context implies a profound interaction between individual genetic predisposition and overriding environmental stressors, a concept consistent with the International Classification of Headache Disorders (ICHD-3) guidelines [60].
Furthermore, functional assessments revealed a paradoxical paradigm: greater headache-related disability was observed in subjects with relatively lower Hb levels (Figure 6). This suggests that under conditions of extreme environmental hypobaric hypoxia, robust polycythemia may function as an essential compensatory mechanism to meet cerebral oxygen demands, potentially attenuating the disabling functional impact of altitude-induced cephalalgia [61].
4.4.3. Paresthesia
Paresthesia emerged as a highly prevalent symptom characterized by strong indicators of neuropathic pain on the DN4 scale; however, it paradoxically correlated with relatively lower Hb concentrations. This inverse association diverges from classical descriptions [4] and indicates that altitude-induced sensory neuropathy is not fundamentally driven by extreme polycythemia or hyperviscosity. Although paresthesia remains a standard component of the clinical scoring system for CMS, our findings challenge its utility as a reliable surrogate for erythrocytosis-driven severity, contradicting earlier assumptions [62]. Consequently, the clinical weighting of paresthesia within the CMS diagnostic score warrants cautious interpretation. In this high-altitude context, these sensory disturbances likely reflect a distinct, direct hypoxemic neuropathy or peripheral microvascular ischemia, rather than a rheological consequence of elevated red blood cell mass.
4.4.4. Tinnitus
Tinnitus exhibited no significant association with hemoglobin concentrations in either occurrence or severity, fundamentally challenging its diagnostic utility within the Chronic Mountain Sickness (CMS) clinical spectrum. While currently featured in the Qinghai CMS Score [63], our data imply that this auditory manifestation operates independently of erythropoietic progression. Furthermore, the exclusive presentation of severe tinnitus in men indicates a sex-mediated modulation, likely reflecting divergent neurosensory or microvascular responses to hypoxia rather than hyperviscosity. Consequently, tinnitus appears to be a nonspecific environmental response, warranting a critical reappraisal of its inclusion in established CMS diagnostic criteria.
4.4.5. Dizziness
Dizziness demonstrated a robust association with elevated hemoglobin (Hb) concentrations, emerging as a prominent neurological manifestation of an expanded red blood cell mass. Notably, the clinical presentation of this symptom exhibited a pronounced male predominance, underscoring a critical sex-based disparity in high-altitude tolerance. Pathophysiologically, this phenomenon is likely driven by excessive erythrocytosis, which fundamentally compromises rheological capacity. The resultant hyperviscosity exacerbates both peripheral and cerebrovascular resistance, culminating in a relative reduction in cerebral blood flow [64]. This cascade generates a localized state of neural tissue hypoperfusion that clinically manifests as dizziness. Given its strong, direct correlation with exacerbated polycythemia, the current omission of dizziness from the standardized Chronic Mountain Sickness (CMS) diagnostic scoring criteria [4] warrants critical reassessment in future high-altitude medical consensuses.
4.4.6. Neurocognitive Manifestations
The high prevalence of cognitive impairment in this extreme-altitude cohort underscores the profound neurological toll of chronic hypoxia. While previous literature suggests male high-altitude residents are more susceptible to cognitive decline due to sleep apnea and reduced cerebral perfusion [13,65], our findings revealed no sex-based disparity. This implies that the ubiquitous stress of severe environmental hypoxia overrides sex-specific vulnerabilities, acting as a universal driver of neurocognitive dysfunction.
Furthermore, our data challenge traditional lowland paradigms, which describe a U-shaped association where both anemia and excessive erythrocytosis increase dementia risk and cerebral white matter degradation [66,67]. In contrast, our cohort demonstrated a positive correlation between Hb concentrations and cognitive preservation, with relatively lower Hb levels aligning with the most pronounced deficits.
Pathophysiologically, hypoxia induces neuroinflammation via microglial activation and proinflammatory cytokines (e.g., IL-1, MCP-1, TNF-α), mediating cognitive decline [68]. In Andean populations at extreme altitudes, a failure to mount a robust erythropoietic response—resulting in lower Hb—likely exacerbates cerebral tissue hypoxemia. Thus, an expanded red blood cell mass functions not as a deleterious hyperviscosity factor, but as a vital compensatory mechanism sustaining cerebral oxygenation and neuronal integrity.
Consequently, erythrocyte mass and associated oxygen-transport proteins could serve as peripheral biomarkers of neurocognitive status in high-altitude residents [69]. Ultimately, the cognitive impact of erythrocytosis in these environments depends on a delicate balance: achieving adequate cerebral oxygen delivery while mitigating hypoxic neuroinflammation.
4.4.7. Sleep Quality
The pervasive incidence of poor sleep quality across the cohort, irrespective of sex, underscores the profound and independent impact of chronic hypobaric hypoxia on sleep architecture. This widespread deterioration aligns with current physiological models, which posit that high-altitude environments inherently disrupt sleep through mechanisms such as hypoxia-induced ventilatory instability, central sleep apnea, and periodic breathing, also known as Cheyne-Stokes respiration [70,71]. These altered respiratory patterns generate frequent micro-arousals that severely fragment rest and drastically reduce deep sleep phases, ultimately leading to the subjective perception of insufficient sleep[72,73,74]. Notably, the absence of a correlation between hemoglobin levels and sleep quality suggests that individual erythropoietic responses do not mitigate these structural sleep disturbances. Instead, clinical evidence indicates that altitude-induced sleep fragmentation operates independently of polycythemia and is more closely linked to the severe, ubiquitous nocturnal hypoxemia driven by the environment [47,75]. Consequently, sleep deterioration appears to be a universal physiological consequence of high-altitude exposure, overriding baseline hematological adaptations.
5. Conclusions
At extreme altitudes (>5,100 m), hemoglobin concentration does not function as a simple, linear biomarker of clinical deterioration. Instead, it exhibits a complex, dual pathophysiological role with marked phenotypic heterogeneity. While pronounced EE drives maladaptive hemodynamic consequences, evidenced by impaired physical fitness, altered cardiovascular performance, and prevalent dizziness, it concurrently serves a critical adaptive function. Specifically, robust polycythemia appears essential for preserving neurocognitive integrity and mitigating the severe ischemic and somatic symptoms, such as oppressive chest pain and debilitating headaches, that disproportionately affect residents with blunted erythropoietic responses. This dual dynamic challenges the traditional paradigm that attributes altitude-related morbidity solely to hyperviscosity.
Crucially, our findings reveal a stark dissociation between absolute red blood cell mass and several classic manifestations of CMS, including dyspnea, cyanosis, paresthesia, and sleep fragmentation. Consequently, relying on these variables as surrogate markers for EE severity is clinically inadequate in this population. These results suggest the need to re-evaluate and refine standardized diagnostic tools, such as the Qinghai CMS Score, tailoring them to the unique physiological realities of extreme-altitude environments. Integrating variables with a stronger pathophysiological correlation will facilitate more precise clinical stratification, effectively distinguishing between successful physiological adaptation and true maladaptive disease.
Authors’ contributions: Conceptualization: MY, GV, IHZ, HOTR; methodology: GV, MY, IHZ, ASG, KRAP, SRLS; formal analysis: IHZ, MY, GV, MRCC, HOTR, BLCE; MEBI; investigation: MY, IHZ, MRCC, SRLS, CDLC, DYOQ, YAPF; resources: IHZ, ASG, JRAM, ACCP, MGHV, CALC; data curation: IHZ, BLCE, JRAM, KRAP, MRCC, HOTR. Drafting the original: IHZ, MY, GV, MEBI, MEPF, ANGC, MGHV; Review and editing: YAPF, CDLC, MACC, GV, MAP, YMCA; visualization: IHZ, DYOQ, CALC; ACCP, MEBI, OEMC; Supervision: IHZ, GV; Project administration: IHZ; Funding acquisition IHZ. All authors have read, reviewed, and agreed to the published version of the article.Funding: M.Y. is supported by the National Institute of Health National Heart Lung and Blood grant R00 HL164888.
Funding
M.Y. is supported by the National Institute of Health National Heart Lung and Blood grant R00 HL164888.
Institutional Review Board Statement
. The research protocol was approved on April 15, 2025, by the Ethics Committee of the University of San Martín de Porres, and received Federal Guarantees for the Protection of Human Subjects (FWA No. 00015320) and was registered with the Institutional Review Board of the U.S. Department of Health and Human Services (IRB/HHS No. 00003251).
Informed Consent Statement
Prior to the start of the study, participants were fully informed about the objectives and procedures, and informed consent was obtained from each of them.
Data Availability Statement
The data are available to anyone wishing to verify and check the results.
Conflicts of interest
The authors declare no conflicts of interest.
Acknowledgments
We thank the study participants for their time and willingness to collaborate.
Abbreviations
The following abbreviations are used in this manuscript:
| CMS | Chronic Mountain Sickness |
| EE | Excessive erythrocytosis |
| Hb | Hemoglobin |
| Hct | Hematocrit |
| SBP | Systolic blood pressure |
| DBP | Diastolic blood pressure |
| HR | Heart rate |
| SpO₂ | Oxygen saturation |
| BMI | Body mass index |
| MoCA | Montreal Cognitive Assessment |
| PSQI | Pittsburgh Sleep Quality Index |
| HIT-6 | Headache Functional Impact |
References
- Ortiz-Prado, E.; Izquierdo-Condoy, J.S.; Vasconez-Gonzalez, J.; Salazar-Santoliva, C.; Teo, T.K.; A, L.-C.; Viscor, G. Quantifying the Global Population Residing at Different Altitudes. Front Hum. Dyn. 2026, 8. [Google Scholar] [CrossRef]
- Burtscher, J.; Mallet, R.T.; Sah, A.; Gassmann, M.; Burtscher, M.; Iturriaga, R. Physiological Differences Underlying Divergent Hypoxia Responses and Altitude Adaptations in Humans, Rats and Mice. Compr. Physiol. 2025, 15, 70077. [Google Scholar] [CrossRef] [PubMed]
- Zila-Velasque, J.P.; Grados-Espinoza, P.; Goicochea-Romero, P.A.; Tapia-Sequeiros, G.; Pascual-Aguilar, J.E.; Ruiz-Yaringaño, A.J.; Barros-Sevillano, S.; Ayca-Mendoza, J.; Nieto-Gutierrez, W. Mountain Sickness in Altitude Inhab-Itants of Latin America: A Systematic Review and Meta-Analysis. PLoS ONE 2024, 19. [Google Scholar] [CrossRef] [PubMed]
- Villafuerte, F.C.; Corante, N. Chronic Mountain Sickness: Clinical Aspects, Etiology, Management, and Treat-Ment. High Alt. Med. Biol. 2016, 17, 61–69. [Google Scholar] [CrossRef] [PubMed]
- Jiang, C.; Chen, J.; Liu, F.; Luo, Y.; Xu, G.; Shen, H.Y.; Gao, Y.; Gao, W. Chronic Mountain Sickness in Chinese Han Males Who Mi-Grated to the Qinghai-Tibetan Plateau: Application and Evaluation of Diagnostic Criteria for Chronic Mountain Sickness. BMC Public Health 2014. [Google Scholar] [CrossRef] [PubMed]
- Villafuerte, F.C.; Simonson, T.S.; Bermudez, D.; León-Velarde, F. High-Altitude Erythrocytosis: Mechanisms of Adaptive and Maladaptive Responses. Physiol. Bethesda 2022. [Google Scholar] [CrossRef] [PubMed]
- Claydon, V.E.; Gulli, G.; Slessarev, M.; Appenzeller, O.; Zenebe, G.; Gebremedhin, A.; Hainsworth, R. Cerebrovascular Responses to Hypoxia and Hypocapnia in Ethiopian High Altitude Dwellers. Stroke 2008, 39, 336–342. [Google Scholar] [CrossRef] [PubMed]
- Hancco, I.; Bailly, S.; Baillieul, S.; Doutreleau, S.; Germain, M.; Pépin, J.L.; Verges, S. Excessive Erythrocytosis and Chronic Mountain Sickness in Dwellers of the Highest City in the World. Front. Physiol. 2020, 11, 773. [Google Scholar] [CrossRef] [PubMed]
- Savioli, G.; Ceresa, I.F.; Gori, G.; Fumoso, F.; Gri, N.; Floris, V.; Varesi, A.; Martuscelli, E.; Marchisio, S.; Longhitano, Y.; et al. Pathophysiology and Therapy of High-Altitude Sickness: Practical Approach in Emergency and Critical Care. J. Clin. Med. 2022, 11. [Google Scholar] [CrossRef] [PubMed]
- Zhong, Y.; Zhang, F.; Li, Q.; Hao, D.; Shi, Z.; Liu, Y.; Zhu, S.; Tsering, P.; Wu, Y. Hematological Characteristics, Oxidative Stress, and Patient-Reported Symptoms in Tibetan Patients with Chronic Mountain Sickness at 4500 m Altitude. Front. Physiol. 2025, 16. [Google Scholar] [CrossRef] [PubMed]
- León-Velarde, F.; Maggiorini, M.; Reeves, J.T.; Aldashev, A.; Asmus, I.; Bernardi, L.; Ge, R.L.; Hackett, P.; Kobayashi, T.; Moore, L.G.; et al. Consensus Statement on Chronic and Subacute High Altitude Diseases. High Alt. Med. Biol. 2005, 6, 147–157. [Google Scholar] [CrossRef] [PubMed]
- Corante, N.; Anza-Ramírez, C.; Figueroa-Mujíca, R.; Macarlupú, J.L.; Vizcardo-Galindo, G.; Bilo, G.; Parati, G.; Gamboa, J.L.; León-Velarde, F.; Villafuerte, F.C. Excessive Erythrocytosis and Cardiovascular Risk in Andean Highlanders. High Alt. Med. Biol. 2018, 19, 221–231. [Google Scholar] [CrossRef] [PubMed]
- Shanjun, Z.; Shenwei, X.; Bin, X.; Huaijun, T.; Simin, Z.; Peng, L. Individual Chronic Mountain Sickness Symptom Is an Early Warning Sign of Cognitive Impairment. Physiol. Behav. 2020, 214, 112748. [Google Scholar] [CrossRef] [PubMed]
- Yorke, J.; Khan, N.; Garrow, A.; Tyson, S.; Singh, D.; Vestbo, J.; Jones, P.W. Evaluation of the Individual Activity Descriptors of the mMRC Breathlessness Scale: A Mixed Method Study. Int. J. Chron. Obstruct. Pulmon. Dis. 2022, 17, 2289–2299. [Google Scholar] [CrossRef] [PubMed]
- Métodos Clínicos, 3a ed.; Butterworths, 1990; ISBN 978-0-409-90077-4.
- Langguth, B.; De Ridder, D. Minimal Clinically Important Difference of Tinnitus Outcome Measurement Instruments—A Scoping Review. J. Clin. Med. 2023, 12, 7117. [Google Scholar] [CrossRef] [PubMed]
- Boby, F.A.; Ahmed, M.; Mahmud, I. Dataset of Harvard Step Test Results for Assessing Cardiovascular Fitness in Female Cricketers in Bangladesh. Data Brief. 2025, 60, 111449. [Google Scholar] [CrossRef] [PubMed]
- Kim, D.-H.; Cho, Y.-H.; Seo, T.-B.; Kim, D.-H.; Cho, Y.-H.; Seo, T.-B. Correlation between Physical Efficiency Index Using Harvard Step Test and Heart Rate Variation in College Students. J. Exerc. Rehabil. 2022, 18, 389–394. [Google Scholar] [CrossRef] [PubMed]
- Doutreleau, S.; Ulliel-Roche, M.; Hancco, I.; Bailly, S.; Oberholzer, L.; Robach, P.; Brugniaux, J.V.; Pichon, A.; Stauf-fer, É.; Perger, E.; et al. Cardiac Remodelling in the Highest City in the World: Effects of Alti-Tude and Chronic Mountain Sickness. Eur. J. Prev. Cardiol. 2022, 29, 2154–2162. [Google Scholar] [CrossRef] [PubMed]
- Garrido, E.; Maglia, J.; Castillo, O. Acute, subacute and chronic mountain sickness. Rev. Clin. Esp. Barc. 2021, 221(8), 481–490. [Google Scholar] [CrossRef] [PubMed]
- Gatterer, H.; Villafuerte, F.C.; Ulrich, S.; Bhandari, S.S.; Keyes, L.E.; Burtscher, M. Enfermedades de la altitud. Nat. Rev. Primer 2024. [Google Scholar] [CrossRef] [PubMed]
- Larmer, B. The Real Price of Gold. Natl. Geogr. 2009. [Google Scholar] [CrossRef]
- Azad, P.; Villafuerte, F.C.; Bermudez, D.; Patel, G.; Haddad, G.G. Protective Role of Estrogen against Excessive Erythrocytosis in Monge’s Disease. Exp. Mol. Med. 2021, 53, 125–135. [Google Scholar] [CrossRef] [PubMed]
- Lang, M.; Bilo, G.; Caravita, S.; Parati, G. Blood Pressure and High Altitude: Physiological Response and Clinical Management. Medwave 2021, 13;21(4), e8194. [Google Scholar] [CrossRef] [PubMed]
- Pramsohler, S.; Burtscher, M.; Rausch, L.; Netzer, N.C. Weight Loss and Fat Metabolism during Multi-Day High-Altitude So-Journs: A Hypothesis Based on Adipocyte Signaling. 2022, 10. [Google Scholar]
- Sánchez, K.; Ballaz, S.J. Might a High Hemoglobin Mass Be Involved in Non-Cardiogenic Pulmonary Edema? The Case of the Chronic Maladaptation to High-Altitude in the Andes. Med. Hypotheses 2021, 146, 110418. [Google Scholar] [CrossRef] [PubMed]
- Díaz-Lazo, A.V. Factores asociados a hipertrofia sigmoidea en personas adultas que habitan en altura. Rev. Médica Hered. 2020, 31, 229–234. [Google Scholar] [CrossRef]
- Xu, X.-Q.; Jing, Z.-C. High-Altitude Pulmonary Hypertension. Eur. Respir. Rev. 2009, 18, 13–17. [Google Scholar] [CrossRef] [PubMed]
- Villafuerte, F.C.; Corante, N. Chronic Mountain Sickness: Clinical Aspects, Etiology, Management, and Treat-Ment. High Alt. Med. Biol. 2016, 17, 61–69. [Google Scholar] [CrossRef] [PubMed]
- Boos, C.J.; Holdsworth, D.A.; Woods, D.R.; O’Hara, J.; Brooks, N.; Macconnachie, L.; Bakker-Dyos, J.; Paisey, J.; Mellor, A. Assessment of Cardiac Arrhythmias at Extreme High Altitude Using an Implantable Cardiac Monitor. Circ.-Tion 2017, 135, 812–814. [Google Scholar] [CrossRef] [PubMed]
- Woods, D.R.; Boos, C.; Roberts, P.R. Cardiac arrhythmias at high altitude. J. R. Army Med. Corps 2011, 157, 59–62. [Google Scholar] [CrossRef] [PubMed]
- Calbet, J.A.L.; Lundby, C. Air to Muscle O2 Delivery during Exercise at Altitude. High Alt. Med. Biol.-Ogy 2009, 10, 123–134. [Google Scholar] [CrossRef] [PubMed]
- Amann, M.; Kayser, B. Nervous System Function during Exercise in Hypoxia. High Alt. Med. Biol. 2009, 10, 149–164. [Google Scholar] [CrossRef] [PubMed]
- Fan, J.-L.; Kayser, B. Fatigue and Exhaustion in Hypoxia: The Role of Cerebral Oxygenation. High Alt. Medi-Cine. Biol. 2016, 17, 72–84. [Google Scholar] [CrossRef] [PubMed]
- Salvi, P.; Grillo, A.; Brunacci, F.; Severi, F.; Montaguti, L.; Gautier, S.; Salvi, L.; Pretolani, E.; Parati, G.; Benetos, A. Microcirculatory and Rheological Adaptive Mechanisms at High Altitude in European Lowlander Hikers and Nepalese Highlanders. J. Clin. Med. 2023, 14;12(8), 2872. [Google Scholar] [CrossRef] [PubMed]
- Adams, E.; Peel, T. Chronic Mountain Sickness: A Comprehensive Review of Current Management and Proposals for Novel Therapies. High Alt. Med. Biol. 2025, 26, 318–327. [Google Scholar] [CrossRef] [PubMed]
- Zubieta-Calleja, G. Redefining Chronic Mountain Sickness: Insights from High-Altitude Research and Clinical Experi-Ence. Med. Rev. 2024, 5, 44–65. [Google Scholar] [CrossRef] [PubMed]
- Mallet, R.T.; Burtscher, J.; Richalet, J.P.; Millet, G.P.; Burtscher, M. Impact of High Altitude on Cardiovascular Health: Current Per-Spectives. Vasc. Health Risk Manag 2021. [Google Scholar] [CrossRef] [PubMed]
- Naeije, R. Physiological adaptation of the cardiovascular system to high altitude. Prog. Cardiovasc Dis. 2010. [Google Scholar] [CrossRef] [PubMed]
- Bärtsch, P.; Gibbs, J.S. Effect of Altitude on the Heart and the Lungs. Circulation 2007, 6;116(19), 2191–202. [Google Scholar] [CrossRef]
- Gazal, S.; Jospin, B., SR; C.D. Genetic Architecture of Chronic Mountain Sickness in Peru. Front Genet 2019. [CrossRef] [PubMed]
- Beall, C.M. Two Routes to Functional Adaptation: Tibetan and Andean High-Altitude Natives. Proc. Natl. Acad. Sci. 2007, 104, 8655–8660. [Google Scholar] [CrossRef] [PubMed]
- Bernardi, L.; Roach, R.C.; Keyl, C.; Spicuzza, L.; Passino, C.; Bonfichi, M.; Gamboa, A.; Gamboa, J.; Malcovati, L.; Schneider, A.; et al. Ventilation, Autonomic Function, Sleep and Erythropoietin. In Proceedings of the Hypoxia; Roach, R.C., Wagner, P.D., Hackett, P.H., Eds.; Springer US: Boston, MA, 2003; pp. 161–175. [Google Scholar]
- Gonzales, G.F.; Tapia, V. HEMOGLOBINA, HEMATOCRITO Y ADAPTACIÓN A LA ALTURA: SU RELACIÓN CON LOS CAMBIOS HORMONALES Y EL PERIODO DE RESIDENCIA MULTIGENERACIONAL. Rev. Med. 2007, 15, 80–93. [Google Scholar]
- Cotter, K.; Hawken, M.; Temmerman, M. Low Use of Skilled Attendants’ Delivery Services in Rural Kenya. J. Health Popul. Nutr. 2006, 24, 467–471. [Google Scholar] [PubMed]
- Blount, S.G. Cyanosis: Pathophysiology and Differential Diagnosis. Prog. Cardiovasc. Dis. 1971, 13, 595–605. [Google Scholar] [CrossRef] [PubMed]
- Gonzales, G.F.; Rubio, J.; Gasco, M. Chronic Mountain Sickness Score Was Related with Health Status Score but Not with Hemoglobin Levels at High Altitudes. Respir. Physiol. Neurobiol. 2013, 188, 152–160. [Google Scholar] [CrossRef] [PubMed]
- Vásquez Vélez, I.C.; Charris Domínguez, C.M.; Fernández Sánchez, M.J.; Garavito-Aguilar, Z.V. Hypoxia and Tissue Regeneration: Adaptive Mechanisms and Therapeutic Opportunities. Int. J. Mol. Sci. 2025, 26, 9272. [Google Scholar] [CrossRef] [PubMed]
- Brutsaert, T.D.; Parra, E.J.; Shriver, M.D.; Gamboa, A.; Rivera-Ch, M.; León-Velarde, F. Ancestry Explains the Blunted Ventilatory Response to Sustained Hypoxia and Lower Exercise Ventilation of Quechua Altitude Natives. Am. J. Physiol.-Regul. Integr. Comp. Physiol. 2005, 289, R225–R234. [Google Scholar] [CrossRef] [PubMed]
- Hoiland, R.L.; Bain, A.R.; Rieger, M.G.; Bailey, D.M.; Ainslie, P.N. Hypoxemia, Oxygen Content, and the Regula-Tion of Cerebral Blood Flow. Am. J. Physiol.-Regul. Integr. Comp. Physiol. 2016, 310, 398–413. [Google Scholar] [CrossRef] [PubMed]
- Villafuerte, F.C.; Cárdenas, R.; Monge-C, C. Optimal Hemoglobin Concentration and High Altitude: A Theoretical Approach for Andean Men at Rest. J. Appl. Physiol. 2004, 96, 1581–1588. [Google Scholar] [CrossRef] [PubMed]
- Ainslie, P.N.; Subudhi, A.W. Cerebral blood flow at high altitude. High Alt. Med. Biol. 2014, 15, 133–140. [Google Scholar] [CrossRef] [PubMed]
- Willie, C.K.; Colino, F.L.; Bailey, D.M.; Tzeng, Y.C.; Binsted, G.; Jones, L.W.; Haykowsky, M.J.; Bellapart, J.; Ogoh, S.; Smith, K.J.; et al. Utility of transcranial Doppler ultrasound for the integrative assessment of cerebrovascular function. J. Neurosci. Methods 2011, 196, 221–237. [Google Scholar] [CrossRef] [PubMed]
- Milledge, J.S.; Sorensen, S.C. Cerebral Arteriovenous Oxygen Difference in Man Native to High Altitude. J. Appl. Physiol. 1972, 32, 687–689. [Google Scholar] [CrossRef] [PubMed]
- Hancco Zirena, I.; Florez Prada, A.; Rojas Bolivar, D.E.; Marengo, A.; Micha, Y.; Doutreleau, S.; Brugniaux, J.V.; Verges, S.; Champigneulle, B. High Altitude Headache in Highlanders: A Hallmark Symptom of Chronic Mountain Sickness Related to Excessive Erythrocytosis? A Preliminary Report from the World’s Highest City. Wilderness Environ. Med. 2025, 37, 64–69. [Google Scholar] [CrossRef] [PubMed]
- Arregui, A.; León-Velarde, F.; Cabrera, J.; Paredes, S.; Vizcarra, D.; Umeres, H. Migraña, policitemia y mal de mon-taña crónico. Cefalalgia Una Rev. Int. Sobre El Dolor Cabeza 1994, 14, 339–341. [Google Scholar] [CrossRef] [PubMed]
- Quispe, G.; Loza, C.; Limaco, L.; Gallegos, R.; Palomino, C.; Cruz, I. The Prevalence and Demographic Associations of Head-Ache in the Adult Population of Peru: A National Cross-Sectional Population-Based Study. J. Headache Pain 2024, 25. [Google Scholar] [CrossRef] [PubMed]
- Stovner, L.J.; Nichols, E.; Steiner, T.J.; Abd-Allah, F.; Abdelalim, A.; Al-Raddadi, R.M. Global, Regional, and National Burden of Migraine and Tension-Type Headache, 1990–2016: A Systematic Analysis for the Global Burden of Disease Study 2016. Lancet Neurol. 2018, 10. [Google Scholar] [CrossRef] [PubMed]
- Marengo, A.V.; Tejada, M.; Giles, I.C.; Natali, K.; Andia, R.; Moraes Valença, M. High-altitude headache: a narrative review. Head.-Ache Med. 2025, 31;16(4), 263–9. [Google Scholar] [CrossRef]
- Olesen, J. Headache Classification Committee of the International Headache Society (IHS) The International Classification of Headache Disorders 2018. [CrossRef] [PubMed]
- Santos-Martínez, L.E. Considerations on hypoxia and altitude. Rev. Medica Inst. Mex. Seguro Soc. 2025, 63. [Google Scholar] [CrossRef] [PubMed]
- Richalet, J.-P.; Rivera, M.; Bouchet, P.; Chirinos, E.; Onnen, I.; Petitjean, O.; Bienvenu, A.; Lasne, F.; Moutereau, S.; León-Velarde, F. Acetazolamide: A Treatment for Chronic Mountain Sickness. Am. J. Respir. Crit. Care Med. 2005, 172, 1427–1433. [Google Scholar] [CrossRef] [PubMed]
- León-Velarde, F.; McCullough, R.G.; McCullough, R.E.; Reeves, J.T.; Group, C.M.S.C.W. Proposal for Scoring Severity in Chronic Mountain Sickness (CMS). Background and Conclusions of the CMS Working Group. Adv.-Es Exp. Med. Biol. 2003, 543, 339–354. [Google Scholar] [CrossRef] [PubMed]
- Norcliffe, L.J.; Rivera-Ch, M.; Claydon, V.E.; Moore, J.P.; Leon-Velarde, F.; Appenzeller, O.; Hainsworth, R. Cer-Ebrovascular Responses to Hypoxia and Hypocapnia in High-Altitude Dwellers. J. Physiol. 2005, 566, 287–294. [Google Scholar] [CrossRef] [PubMed]
- Norcliffe, L.J.; Rivera-Ch, M.; Claydon, V.E.; Moore, J.P.; Leon-Velarde, F.; Appenzeller, O.; Hainsworth, R. Cer-Ebrovascular Responses to Hypoxia and Hypocapnia in High-Altitude Dwellers. J. Physiol. 2005, 566, 287–294. [Google Scholar] [CrossRef] [PubMed]
- Heinrich, E.C.; Djokic, M.A.; Anza-Ramirez, C.; Galindo, G.V.; Gilbertson, D.; DeYoung, P.; Orr, J.E.; Powell, F.L.; Mal-hotra, A.; Villafuerte, F.C.; et al. Excessive Erythrocytosis in High-Altitude Residents Is Associated with Modest Impairments in Short-Term Memory and Processing Speed. FASEB J. 2019, 33, 551 2–551 2. [Google Scholar] [CrossRef]
- Kong, F.-Y.; Li, Q.; Liu, S.-X. Poor Sleep Quality Predicts Decreased Cognitive Function Independently of Chronic Mountain Sickness Score in Young Soldiers with Polycythemia Stationed in Tibet. High Alt. Med. Biol. 2011, 12, 237–242. [Google Scholar] [CrossRef] [PubMed]
- Wolters, F.J.; Zonneveld, H.I.; Licher, S.; Cremers, L.G.M.; Ikram, K.; Koudstaal, P.J.; Vernooij, M.W.; Ikram, A. Hemoglobin and Anemia in Relation to Dementia Risk and Accompanying Changes on Brain MRI. Neurology 2019, 93, 917–926. [Google Scholar] [CrossRef] [PubMed]
- Beydoun, M.A.; Hossain, S.; Beydoun, H.A.; Shaked, D.; Weiss, J.; Evans, M.K.; Zonderman, A.B. Red Cell Distri-Bution Width Is Directly Associated with Poor Cognitive Performance among Nonanemic, Middle-Aged, Urban Adults. J. Nutr. 2020, 150, 128–139. [Google Scholar] [CrossRef] [PubMed]
- Douglas, C.G.; Haldane, J.S. The Causes of Periodic or Cheyne-Stokes Breathing. J. Physiol. 1909, 38, 401–419. [Google Scholar] [CrossRef] [PubMed]
- Zhang, X.; Fan, C.; Liu, Y.; Zhao, C.; Zhao, Y.; Yin, W.; Lin, J.; Zhang, J. Gender Differences of the Brain Structures in Young High-Altitude Tibetans. Cereb. Cortex 2025, 35, bhaf012. [Google Scholar] [CrossRef] [PubMed]
- Effects of Periodic Breathing on Sleep at High Altitude: A Randomized, Placebo-controlled, Crossover Study Using Inspiratory CO2 - Ibrahim - 2024 - The Journal of Physiology - Wiley Online Library. Available online: https://physoc.onlinelibrary.wiley.com/doi/10.1113/JP285397 (accessed on 13 July 2026).
- Coronel-Oliveros, C.; Medel, V.; Whitaker, G.A.; Astudillo, A.; Gallagher, D.; Z-Rivera, L.; Prado, P.; El-Deredy, W.; Orio, P.; Weinstein, A. Elevating Understanding: Linking High-Altitude Hypoxia to Brain Aging through EEG Functional Connectivity and Spectral Analyses. Netw. Neurosci. 2024, 8, 275–292. [Google Scholar] [CrossRef] [PubMed]
- San, T.; Polat, S.; Cingi, C.; Eskiizmir, G.; Oghan, F.; Cakir, B. Effects of High Altitude on Sleep and Respiratory System and Theirs Adaptations. Sci. World J. 2013, 241569. [Google Scholar] [CrossRef] [PubMed]
- Champigneulle, B.; Brugniaux, J.V.; Stauffer, E.; Doutreleau, S.; Furian, M.; Perger, E.; Pina, A.; Baillieul, S.; Deschamps, B.; Hancco, I.; et al. Expedition 5300: Limits of Human Adaptations in the Highest City in the World. J. Physiol. 2024, 602, 5449–5462. [Google Scholar] [CrossRef] [PubMed]
Figure 1.
Hb concentrations stratified by chest pain presentation. Data are presented as points to illustrate the full distribution of Hb levels across three chest pain categories: absent, oppressive, and sharp. The central thick blue horizontal lines indicate the median, while the upper and lower borders of the boxes represent the interquartile range (IQR; 25th to 75th percentiles). The whiskers extend to the minimum and maximum observed values. Individual patient measurements are superimposed as colored circles to show the underlying data density. Annotated white boxes display the exact median Hb values (g/dL) for each subgroup. A dashed red trend line connects the medians to highlight the trajectory of Hb concentrations across the clinical presentations. Hb, hemoglobin..
Figure 1.
Hb concentrations stratified by chest pain presentation. Data are presented as points to illustrate the full distribution of Hb levels across three chest pain categories: absent, oppressive, and sharp. The central thick blue horizontal lines indicate the median, while the upper and lower borders of the boxes represent the interquartile range (IQR; 25th to 75th percentiles). The whiskers extend to the minimum and maximum observed values. Individual patient measurements are superimposed as colored circles to show the underlying data density. Annotated white boxes display the exact median Hb values (g/dL) for each subgroup. A dashed red trend line connects the medians to highlight the trajectory of Hb concentrations across the clinical presentations. Hb, hemoglobin..
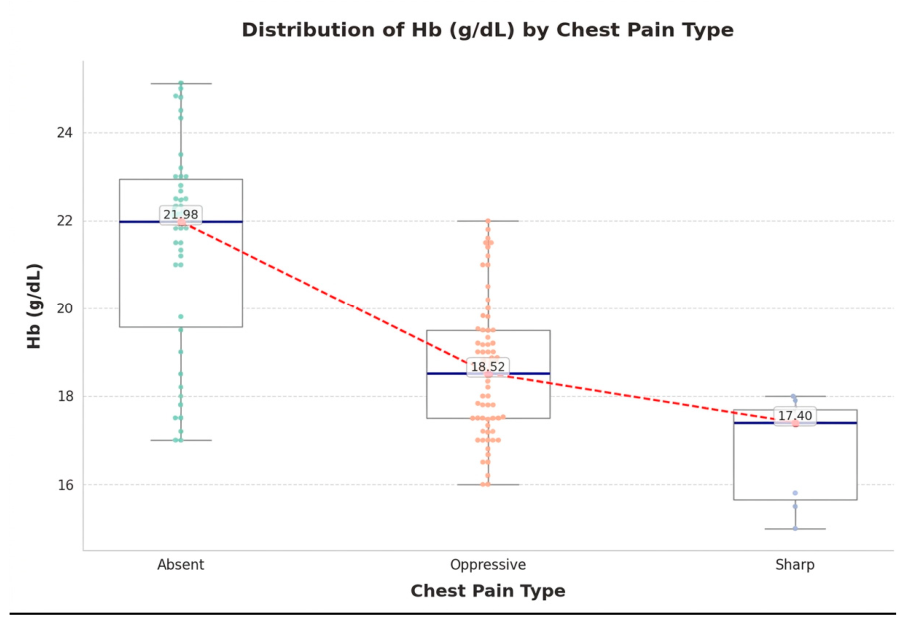
Figure 2.
Correlation between Hb concentrations and chest pain intensity. Individual patient measurements are represented by grey circles. The dashed red line indicates the line of best fit, surrounded by a light red shaded band representing the 95% confidence interval. The strength and direction of the monotonic association were evaluated using the Spearman rank correlation coefficient (⍴ = -0.537; p < 0.001). Hb, hemoglobin.
Figure 2.
Correlation between Hb concentrations and chest pain intensity. Individual patient measurements are represented by grey circles. The dashed red line indicates the line of best fit, surrounded by a light red shaded band representing the 95% confidence interval. The strength and direction of the monotonic association were evaluated using the Spearman rank correlation coefficient (⍴ = -0.537; p < 0.001). Hb, hemoglobin.
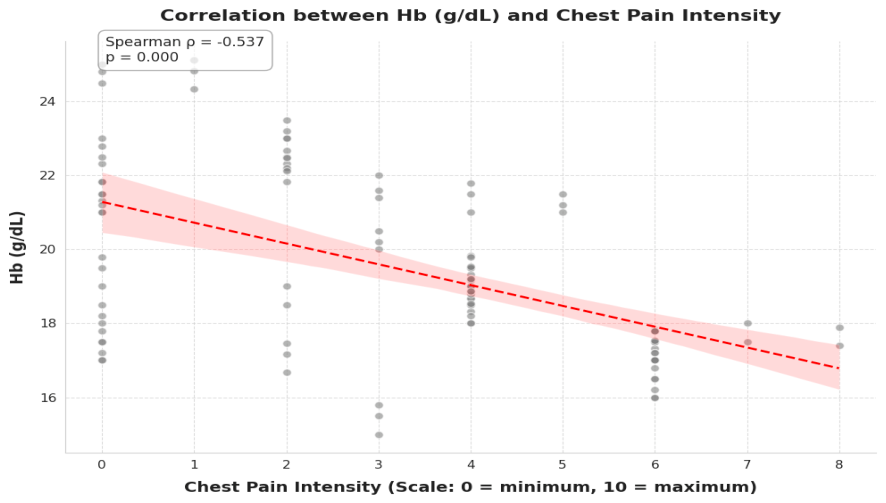
Figure 3.
Hb concentrations stratified by time of edema presentation. Central thick blue horizontal lines represent the median Hb values for each group, while the vertical grey lines with caps indicate the overall data range (minimum to maximum observed values). Individual patient measurements are superimposed as colored circles (orange for morning, green for night) to demonstrate the underlying data density and full distribution. White annotated boxes specify the exact median Hb values (g/dL) for each subgroup. A dashed red trend line connects the medians to highlight the variation in Hb concentrations between the two time points. Hb, hemoglobin.
Figure 3.
Hb concentrations stratified by time of edema presentation. Central thick blue horizontal lines represent the median Hb values for each group, while the vertical grey lines with caps indicate the overall data range (minimum to maximum observed values). Individual patient measurements are superimposed as colored circles (orange for morning, green for night) to demonstrate the underlying data density and full distribution. White annotated boxes specify the exact median Hb values (g/dL) for each subgroup. A dashed red trend line connects the medians to highlight the variation in Hb concentrations between the two time points. Hb, hemoglobin.
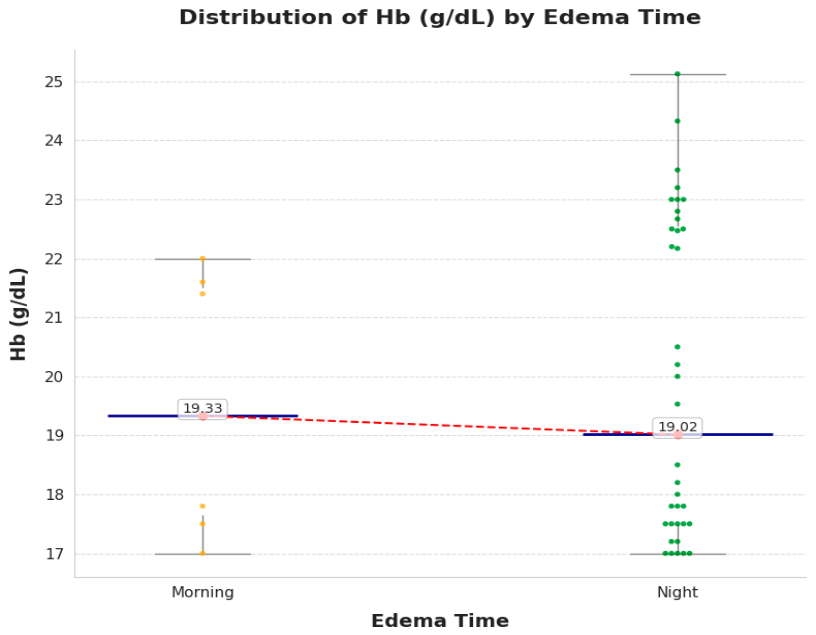
Figure 4.
Linear regression analysis between Hb levels and Harvard Fitness Index. The regression line demonstrates that an increase in Hb levels is linearly associated with a decrease in index scores. The shaded area represents the 95% confidence interval, underscoring the robust inverse relationship observed between these physiological parameters.
Figure 4.
Linear regression analysis between Hb levels and Harvard Fitness Index. The regression line demonstrates that an increase in Hb levels is linearly associated with a decrease in index scores. The shaded area represents the 95% confidence interval, underscoring the robust inverse relationship observed between these physiological parameters.
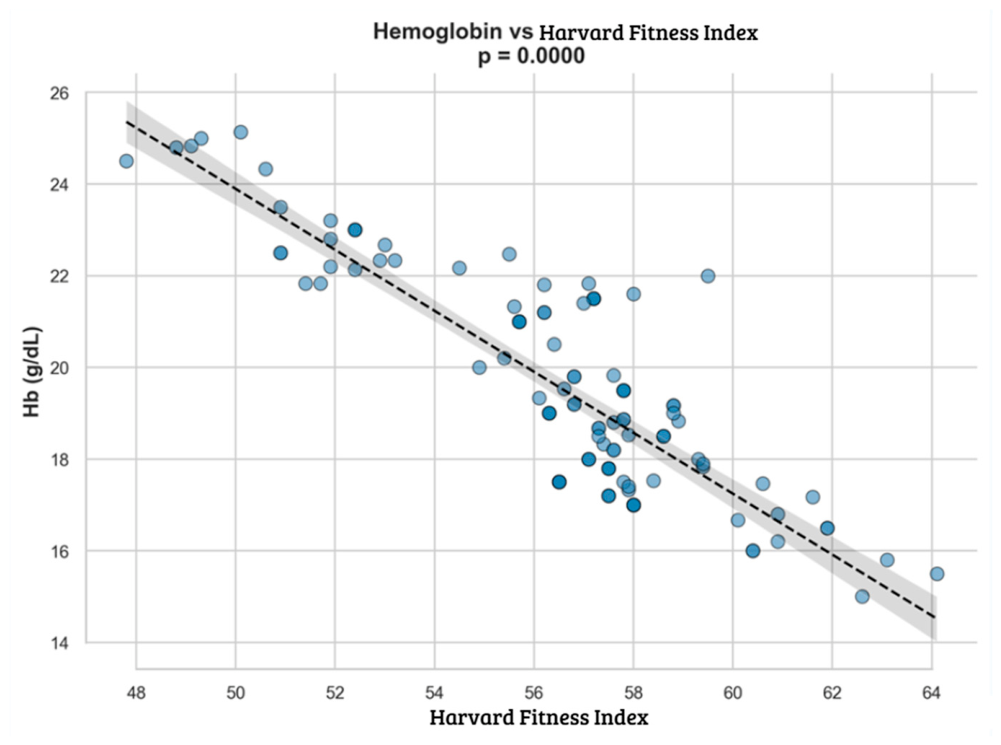
Figure 5.
Relationship Between Clinical Dyspnea and SpO2. Data are presented as box-and-whisker plots with overlaid individual data points to illustrate the full distribution of SpO2 levels across three dyspnea grades: Grade 1, Grade 2, and Grade 3. The central thick red horizontal lines indicate the median, while the upper and lower borders of the boxes represent the interquartile range (IQR; 25th to 75th percentiles). The whiskers extend to the minimum and maximum observed values. Individual patient measurements are superimposed as colored circles to show the underlying data density. A dashed red trend line with a shaded confidence interval band illustrates the overall trajectory of SpO2 levels across the clinical presentations. SpO2, peripheral oxygen saturation..
Figure 5.
Relationship Between Clinical Dyspnea and SpO2. Data are presented as box-and-whisker plots with overlaid individual data points to illustrate the full distribution of SpO2 levels across three dyspnea grades: Grade 1, Grade 2, and Grade 3. The central thick red horizontal lines indicate the median, while the upper and lower borders of the boxes represent the interquartile range (IQR; 25th to 75th percentiles). The whiskers extend to the minimum and maximum observed values. Individual patient measurements are superimposed as colored circles to show the underlying data density. A dashed red trend line with a shaded confidence interval band illustrates the overall trajectory of SpO2 levels across the clinical presentations. SpO2, peripheral oxygen saturation..
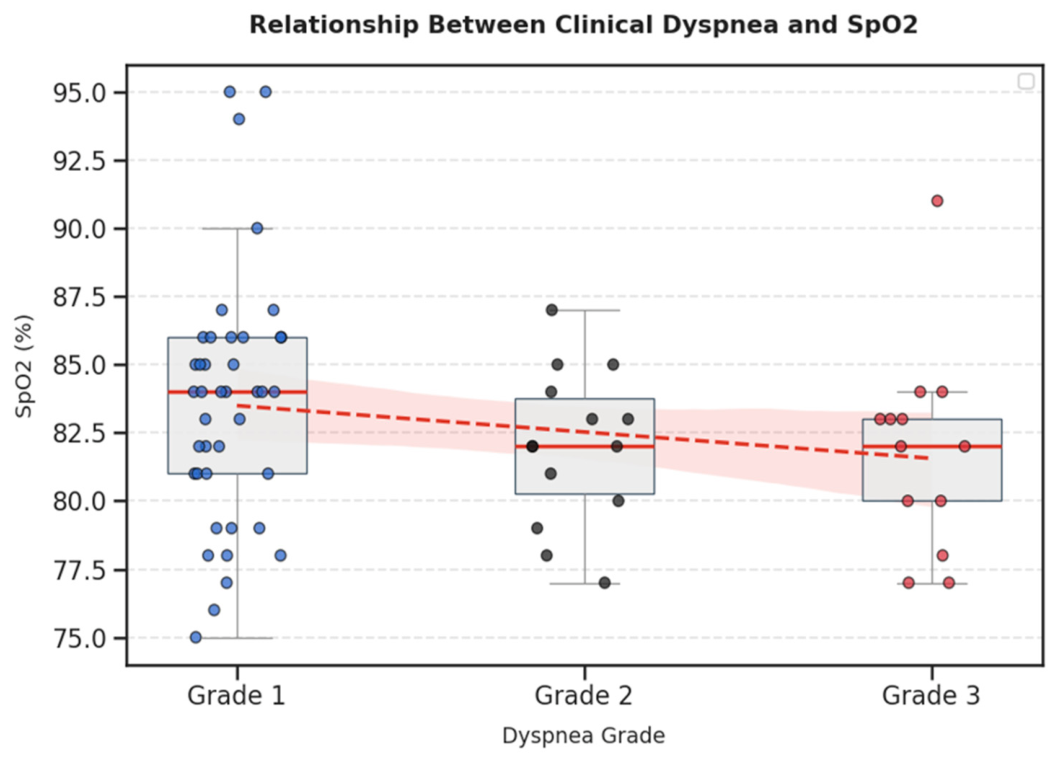
Figure 6.
Relationship between Hb levels and headache impact (HIT-6). This box plot illustrates the distribution of Hb concentrations categorized across the four impact levels of the HIT-6. Statistical analysis using the Kruskal-Wallis test demonstrated a significant difference between the groups (H = 17.72, p = 0.005). The chart layout displays median values as horizontal white lines inside each colored box, interquartile ranges as shaded boxes, and individual sample dispersion as overlaid circular data points.
Figure 6.
Relationship between Hb levels and headache impact (HIT-6). This box plot illustrates the distribution of Hb concentrations categorized across the four impact levels of the HIT-6. Statistical analysis using the Kruskal-Wallis test demonstrated a significant difference between the groups (H = 17.72, p = 0.005). The chart layout displays median values as horizontal white lines inside each colored box, interquartile ranges as shaded boxes, and individual sample dispersion as overlaid circular data points.
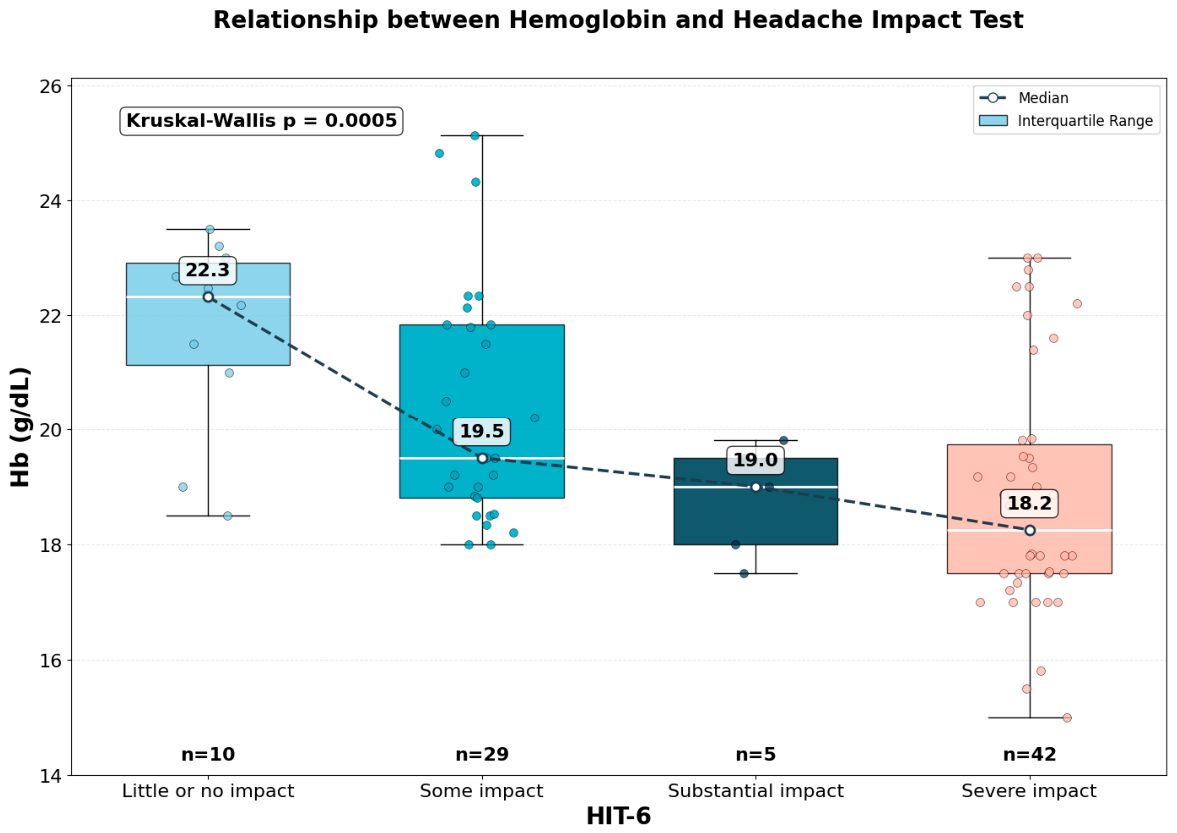
Figure 7.
Distribution of Hb concentrations according to the presence of dizziness. Within each shaded contour, the central solid white line denotes the median, and the adjacent dotted horizontal lines indicate the interquartile range (IQR; 25th to 75th percentiles). Individual patient measurements are superimposed as scattered data points to visualize the exact underlying distribution. Annotated white boxes provide the precise median and IQR values (g/dL) for each clinical subgroup. A dashed red trend line connects the medians to emphasize the central shift between groups. Hb,hemoglobin; IQR, interquartile range.
Figure 7.
Distribution of Hb concentrations according to the presence of dizziness. Within each shaded contour, the central solid white line denotes the median, and the adjacent dotted horizontal lines indicate the interquartile range (IQR; 25th to 75th percentiles). Individual patient measurements are superimposed as scattered data points to visualize the exact underlying distribution. Annotated white boxes provide the precise median and IQR values (g/dL) for each clinical subgroup. A dashed red trend line connects the medians to emphasize the central shift between groups. Hb,hemoglobin; IQR, interquartile range.
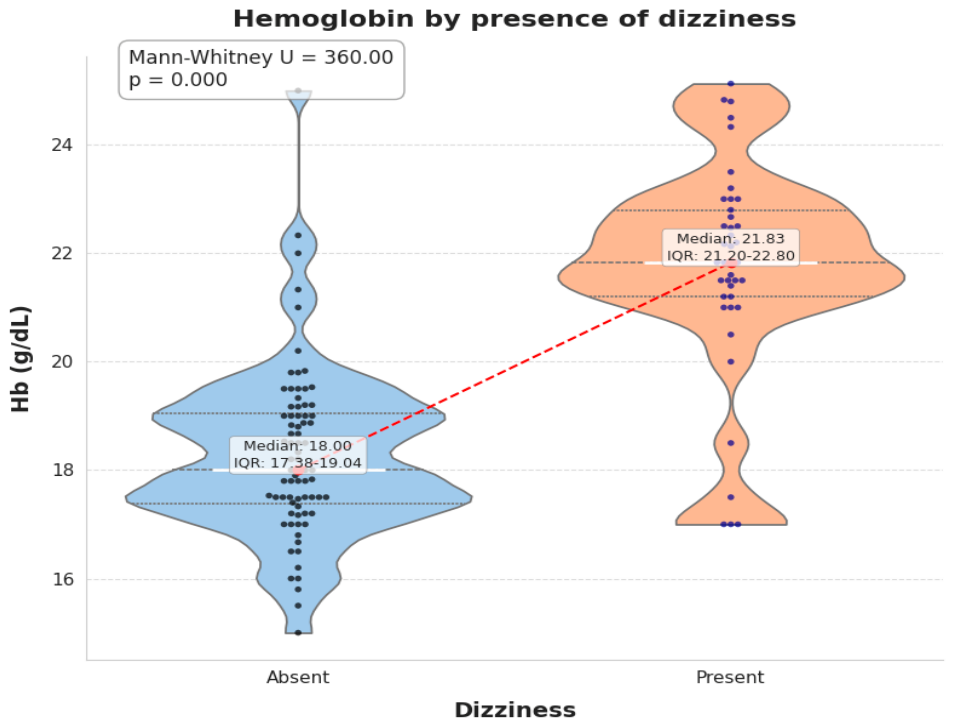

Table 1.
Baseline Clinical and Demographic Characteristics of the Study Population Stratified by Sex. BMI, body mass index; bpm, beats per minute; IQR, interquartile range. Data are presented as median (IQR). p values represent the statistical comparison between men and women, calculated using the Mann-Whitney U test; *, Statistically significant (p < 0.05).
Table 1.
Baseline Clinical and Demographic Characteristics of the Study Population Stratified by Sex. BMI, body mass index; bpm, beats per minute; IQR, interquartile range. Data are presented as median (IQR). p values represent the statistical comparison between men and women, calculated using the Mann-Whitney U test; *, Statistically significant (p < 0.05).
| Variable | Median | IQR | p-Value | |
|---|---|---|---|---|
| Residence time (years) |
Total | 18.00 | 12.0–25.0 | 0.158 |
| Men | 20.00 | 14.0–27.0 | ||
| Women | 17.00 | 10.0–22.2 | ||
| Hemoglobin (g/dL) |
Total | 19.00 | 17.5–21.5 | <0.001* |
| Men | 20.00 | 18.0–22.2 | ||
| Women | 18.10 | 17.3–19.2 | ||
| Systolic blood pressure (mmHg) |
Total | 114.00 | 103.0–121.0 | 0.270 |
| Men | 115.00 | 105.0–120.0 | ||
| Women | 109.00 | 97.0–129.2 | ||
| Diastolic blood pressure (mmHg) |
Total | 73.00 | 69.0–79.0 | 0.260 |
| Men | 74.00 | 68.0–78.0 | ||
| Women | 72.00 | 70.0–80.0 | ||
| Mean arterial pressure (mmHg) |
Total | 86.67 | 80.0–93.3 | 0.813 |
| Men | 86.67 | 80.3–93.3 | ||
| Women | 86.50 | 79.2–92.7 | ||
| Oxygen saturation (%) |
Total | 83.00 | 81.0–85.0 | 0.134 |
| Men | 84.00 | 81.0–86.0 | ||
| Women | 83.00 | 79.0–84.0 | ||
| Heart rate (bpm) |
Total | 83.00 | 80.0–89.0 | 0.432 |
| Men | 84.00 | 80.0–91.0 | ||
| Women | 82.00 | 81.0–87.0 | ||
| Body mass index (kg/m²) |
Total | 27.18 | 24.8–28.4 | 0.077 |
| Men | 27.55 | 25.5–28.4 | ||
| Women | 25.36 | 23.9–28.3 | ||
Table 2.
Clinical Symptoms and Signs Cardiovascular of the Study Population Stratified by Sex. Data are presented as number (percentage), n values represent the total number of patients exhibiting the specific clinical finding. p values reflect the statistical comparison between men and women, calculated using the Fisher exact test. *, Statistical significant (p < 0.05).
Table 2.
Clinical Symptoms and Signs Cardiovascular of the Study Population Stratified by Sex. Data are presented as number (percentage), n values represent the total number of patients exhibiting the specific clinical finding. p values reflect the statistical comparison between men and women, calculated using the Fisher exact test. *, Statistical significant (p < 0.05).
| Variable |
Men (n=73) |
Women (n=44) |
p-Value | |
|---|---|---|---|---|
| Chest pain | ||||
| Absent N = 42 |
37 (50.7) | 5 (11.4) | <0.001* | |
| Present N = 75 |
Oppressive | 32 (43.8) | 36 (81.8) | |
| Sharp | 4 (5.5) | 3 (6.8) | ||
| Palpitations | ||||
| Absent N = 12 |
7 (9.6) | 5 (11.4) | 0.083 | |
| Present N = 105 |
Physical exertion | 14 (19.2) | 2 (4.5) | |
| Spontaneous | 52 (71.2) | 37 (84.1) | ||
| Fatigue | ||||
| Absent N= 4 |
3 (4.1) | 1 (2.3) | 0.643 | |
| Present N = 113 |
Exertional | 8 (11.0) | 3 (6.8) | |
| Unprovoked | 62 (84.9) | 40 (90.9) | ||
| Dizziness | ||||
| Absent N =76 |
38 (52.8) | 38 (86.4) | <0.001* | |
| Present N = 40 |
34 (47.2) | 6 (13.6) | ||
| Edema | ||||
| Absent N = 78 |
46 (63.0) | 32 (72.7) | 0.380 | |
| Present N = 39 |
27 (37.0) | 12 (27.3) | ||
| Cyanosis | ||||
| Absent N = 5 |
2 (2.7) | 3 (6.8) | 0.025* | |
| Present N = 112 |
Central | 9 (12.3) | 14 (31.8) | |
| Generalized | 28 (38.4) | 9 (20.5) | ||
| Peripheral | 34 (46.6) | 18 (40.9) | ||
| Respiratory pattern | ||||
| Eupnea N = 67 |
42 (57.5) | 25 (56.8) | 1.000 | |
| Tachypnea N = 50 |
31 (42.5) | 19 (43.2) | ||
| Dyspnea | ||||
| Grade 0 | 29 (39.7) | 20 (45.4) |
0.5455 |
|
| Grade 1 | 24 (32.8) | 17 (38.6) | ||
| Grade 2 | 10 (13.7) | 4 (9.0) | ||
| Grade 3 | 10 (13.7) | 3 (6.8) | ||
Table 3.
Analysis of clinical symptoms and specific subtypes stratified by sex. Frequencies are presented as absolute values (n) and group-specific proportions (%). ᵃ Statistical significance evaluated using Pearson's Chi-square test. ᵇ Statistical significance evaluated using Fisher’s exact test.
Table 3.
Analysis of clinical symptoms and specific subtypes stratified by sex. Frequencies are presented as absolute values (n) and group-specific proportions (%). ᵃ Statistical significance evaluated using Pearson's Chi-square test. ᵇ Statistical significance evaluated using Fisher’s exact test.
| Clinical Feature | Women n (%) | Men n (%) | Total n (%) | P-value |
|---|---|---|---|---|
| HEADACHE | ||||
| Present | 35 (79.5) | 51 (69.9) | 86 (73.5) | 0.351 ᵃ |
| Absent | 9 (20.5) | 22 (30.1) | 31 (26.5) | |
| Subtypes among symptomatic (n=86) | ||||
| Hypoxia-related | 29 (82.9) | 36 (70.6) | 65 (75.6) | 0.015 ᵇ |
| Tension-type headache | 3 (8.6) | 6 (11.8) | 9 (10.5) | |
| Migraine | 0 (0.0) | 6 (11.8) | 6 (7.0) | |
| Migraine with aura | 0 (0.0) | 3 (5.9) | 3 (3.5) | |
| Cluster headache | 3 (8.6) | 0 (0.0) | 3 (3.5) | |
| PARESTHESIA | ||||
| Present | 33 (75.0) | 52 (71.2) | 85 (72.6) | 0.819 ᵃ |
| Absent | 11 (25.0) | 21 (28.8) | 32 (27.4) | |
| Severity (DN4) among symptomatic (n=85) - Paresthesia | ||||
| Significant prob. of neuropathic pain | 27 (81.8) | 49 (94.2) | 76 (89.4) | 0.147 ᵃ |
| Neuropathic pain not confirmed | 6 (18.2) | 3 (5.8) | 9 (10.6) | |
| TINNITUS | ||||
| Present | 23 (52.3) | 33 (45.2) | 56 (47.9) | 0.582 ᵃ |
| Absent | 21 (47.7) | 40 (54.8) | 61 (52.1) | |
| Severity (MTHI) among symptomatic (n=56) - Tinnitus | ||||
| Mild | 11 (47.8) | 13 (39.4) | 24 (42.9) | 0.017 ᵇ |
| Moderate | 9 (39.1) | 5 (15.2) | 14 (25.0) | |
| Severe | 0 (0.0) | 9 (27.3) | 9 (16.1) | |
| Very severe | 3 (13.0) | 6 (18.2) | 9 (16.1) | |
| Cognitive impairment | ||||
| Without impairment | 9 (20.5) | 9 (12.3) | 18 (15.4) | 0.138 ᵇ |
| Mild impairment | 21 (47.7) | 46 (63.0) | 67 (57.3) | |
| Moderate impairment | 14 (31.8) | 15 (20.5) | 29 (24.8) | |
| Severe impairment | 0 (0.0) | 3 (4.1) | 3 (2.6) | |
| Sleep quality | ||||
| Good sleep quality | 12 (27.3) | 20 (27.4) | 32 (27.4) | 1.000 ᵇ |
| Poor sleep quality | 32 (72.7) | 53 (72.6) | 85 (72.6) | |
Disclaimer/Publisher’s Note: The statements, opinions and data contained in all publications are solely those of the individual author(s) and contributor(s) and not of MDPI and/or the editor(s). MDPI and/or the editor(s) disclaim responsibility for any injury to people or property resulting from any ideas, methods, instructions or products referred to in the content. |
© 2026 by the authors. Licensee MDPI, Basel, Switzerland. This article is an open access article distributed under the terms and conditions of the Creative Commons Attribution (CC BY) license.
Copyright: This open access article is published under a Creative Commons CC BY 4.0 license, which permit the free download, distribution, and reuse, provided that the author and preprint are cited in any reuse.