

Submitted:
06 August 2026
Posted:
07 August 2026
You are already at the latest version
Abstract
Accurate calculation of nucleic acid melting temperature (Tm) underpins many molecular biology applications. Beyond single sequences, genome-wide Tm profiles capture intrinsic thermodynamic properties that can be leveraged to study biological processes at genomic scale. However, most existing Tm tools operate only at the sequence level and are incompatible with standardized Bioconductor data structures, such as GRanges, or with downstream multi-omics workflows. We developed TmCalculator, a Bioconductor-compatible R package that extends Tm analysis from individual sequences to genome-wide thermodynamic profiling. It accepts plain nucleotide sequences, FASTA files, genomic coordinates, and GRanges objects. TmCalculator implements a comprehensive set of nearest-neighbor thermodynamic models, the current standard for accurate Tm prediction, alongside widely used empirical GC-content models, both supporting salt and chemical corrections. Results are returned as GRanges objects, allowing Tm to integrate directly with multi-omics data such as ATAC-seq, RNA-seq, and ChIP-seq, supported by native utilities for multi-layer integration, statistical comparison, and visualization. We demonstrate TmCalculator on the Escherichia coli genome by revisiting a published map of MutL-associated replication error hotspots, reproducing and extending the reported link between reduced Tm and error-prone regions, and providing a reproducible route to investigate the physical properties underlying genome function and disease.
Keywords:
melting temperature calculation
; genome-wide thermodynamic profiling
; Bioconductor
; R package
; multi-omics integration
1. Introduction
The melting temperature (Tm) of a nucleic acid duplex is defined as the temperature at which half of the double-stranded molecules dissociate into single strands [1]. As a fundamental thermodynamic parameter, Tm reflects the stability of the DNA or RNA helices and is governed by a complex interplay of intrinsic sequence features and extrinsic environmental factors, including nucleotide composition, sequence length, mismatches, ionic strength, and chemical additives [2,3,4,5,6]. Three primary methodologies are commonly used for Tm estimation. The Wallace rule provides rapid approximation based on weighted nucleotide counts and is optimized for short oligonucleotides of 14-20 bp [7]. Empirical GC content-based models extend this approach to longer sequences by incorporating correction terms for sequence length and ionic strength [1,3]. The nearest-neighbor (NN) thermodynamics model, currently regarded as the gold standard for high-precision Tm prediction, captures sequence-context dependence by summing the stacking energies of adjacent base-pair doublets using experimentally derived thermodynamic parameters [8,9]. Accurate Tm prediction further requires correction for monovalent and divalent cation concentrations [2,10,11] as well as helix-destabilizing agents such as formamide or dimethyl sulfoxide (DMSO) [5].
Historically, Tm calculation has been used primarily as a key consideration in molecular biology workflows. In PCR and qPCR, accurate Tm calculations ensure specific primer annealing to intended targets [12]. In DNA microarrays, harmonizing probe Tm values is critical for reproducible hybridization signals [13,14]. In CRISPR-based genome editing, the thermodynamic stability of the guide RNA-DNA heteroduplex influences both on-target cleavage and off-target activity [15,16]. Moreover, the same thermodynamic constraints that govern primer annealing in vitro also affect how DNA is accessed and processed within living cells. Consequently, Tm is increasingly recognized not merely as a sequence design parameter, but as a locus-specific biophysical property of the genome that varies systematically and carries functional consequences [17,18]. For example, promoters and replication origins are often enriched in AT-rich, thermodynamically unstable sequences that facilitate transcription initiation and replication [19,20]. Similarly, open chromatin regions identified by ATAC-seq are enriched in sequences of lower thermodynamic stability, suggesting that local Tm contributes to the physical accessibility of regulatory DNA [21,22]. Moreover, replication error hotspots are significantly enriched in regions of reduced thermodynamic stability, where weakened duplex strength coincides with a higher density of microsatellites, cruciform-forming inverted repeats, and GATC mismatch repair sites [23]. Together, these observations suggest that local thermodynamic stability may be informative beyond individual oligonucleotide design and merits investigation at the genome scale, including integration with other genomic datasets.
Existing tools for Tm estimation can be broadly categorized by their primary design objectives. Web-based calculators such as the NEB Tm Calculator [24] and the ThermoFisher Tm Calculator [25] are tailored for individual primer optimization, often in conjunction with specific commercial polymerase systems. OligoCalc [26] focuses on single-oligonucleotide characterization. Programmable frameworks, including MELTING 5 [27,28] and its R interfaces rmelting [29] and melting5jars [30], as well as the Bio.SeqUtils.MeltingTemp module in BioPython [31], provide scriptable Tm computation. While each of these tools effectively serves its intended purpose, systematic genome-wide Tm computation with Bioconductor-compatible outputs still requires substantial custom data engineering.
To address these challenges, we developed TmCalculator, a Bioconductor-compatible R package that extends nucleic acid melting temperature analysis from sequence-level computation to genome-wide thermodynamic profiling. TmCalculator supports multiple input formats, including plain nucleotide sequences, FASTA files, genomic coordinates, and GRanges objects, and integrates directly with Bioconductor reference genome resources via BSgenome [32]. The package implements three widely used Tm calculation methods with support for salt concentration and chemical condition correction, and returns results as GRanges objects [33], the standard genomic interval data structure within the Bioconductor ecosystem. Integrating Tm with functional genomic data poses a coordinate-resolution challenge, because Tm is computed on a regular fixed-width tiling whereas peak-based and coverage datasets occupy dataset-specific coordinates whose boundaries rarely align with the Tm windows. The integrate_granges() function reconciles them by projecting each dataset onto the shared Tm reference and assigning every window a representative value. The function returns a unified GRanges object ready for comparison and visualization.
We illustrate the utility of this framework through application to the Escherichia coli K-12 MG1655 genome, using a previously characterized system to demonstrate a unified and reproducible approach to genome-wide thermodynamic profiling. Hasenauer et al. [23] performed a genome-wide analysis of spontaneous DNA replication error hotspots in rapidly proliferating E. coli, identifying MutL-associated regions (MutL-ARs) as sites of elevated replication error frequency using ChIP-seq of the mismatch repair protein MutL. That study showed that MutL-ARs are significantly enriched in regions of reduced thermodynamic stability and co-localize with microsatellite sequences, cruciform-prone inverted repeats, and GATC Dam methylation sites, providing a multi-layered, sequence-intrinsic explanation for the spatial distribution of replication errors. Notably, melting temperatures in that analysis were computed using TmCalculator, establishing this system as a published, genome-scale application of the package. Here, we build on this published application to present a complete, end-to-end TmCalculator workflow spanning Tm computation, multi-omics integration, statistical analysis, and visualization within a single Bioconductor-native framework.
2. Materials and Methods
2.1. Package Architecture and Dependencies
TmCalculator is implemented using the R programming language [34] and is fully compatible with the Bioconductor ecosystem. The package is structured around three integrated components: Tm calculation, genomic data representation, and multi-omics integration. This modular design enables seamless extension from single-sequence thermodynamic calculations to genome-wide thermodynamic profiling and downstream integrative analyses within a unified framework.
TmCalculator supports four input formats to accommodate diverse analytical scenarios: plain nucleotide sequences, FASTA files, genomic coordinate strings, and GRanges objects. FASTA files are parsed using seqinr::read.fasta() [35], while coordinate-based inputs retrieve nucleotide sequences directly from reference genomes using BSgenome [32] and Biostrings::getSeq() [36]. For organisms or assemblies not available as pre-built BSgenome packages, custom genome packages can be constructed using BSgenomeForge [37], ensuring compatibility with any reference assembly. Across all input modes, sequences are internally represented and processed using the GenomicRanges, IRanges, and GenomeInfoDb packages [33], thereby ensuring that intermediate and output data structures conform to Bioconductor standards. Computed Tm values are returned as GRanges objects, facilitating direct integration into existing R workflows or export to external analytical environments. Multi-omics integration is implemented through the integrate_granges() function, which builds on GenomicRanges [33], using its overlap and nearest-feature utilities for discrete features and binnedAverage() to summarize continuous signals. TmCalculator leverages karyoploteR [38] for genome-scale visualization of Tm profiles integrated with multi-omics features, and ggplot2 [39], ggridges [40] and ggforce [41] for comparative plots such as box plots, violin plots, and ridgeline distributions.
2.2. Application: Genome-Wide Tm Profiling and Multi-layer Integration in E. coli K-12 MG1655
We illustrate the utility of TmCalculator by revisiting the genome-wide analysis of spontaneous DNA replication error hotspots in rapidly proliferating Escherichia coli K-12 MG1655 introduced above [23], in which MutL-associated regions (MutL-ARs) were defined by ChIP-seq of the mismatch repair protein MutL. We formalize and extend that analysis into a unified, fully reproducible workflow for genome-wide thermodynamic profiling and multi-omics integration. Specifically, we used six datasets derived from the same study [23]: (1) the complete E. coli K-12 MG1655 reference genome (NCBI accession GCF_000005845.2, chromosome U00096.3, 4,641,652 bp), packaged as a local BSgenome resource; (2) MutL-AR ChIP-seq peak coordinates defining replication error hotspots; (3) microsatellite density (mononucleotide repeats of four or more consecutive nucleotides) per 200 bp window; (4) cruciform-prone palindromic sequence density per 200 bp window; (5) GATC Dam methylation site density per 200 bp window; and (6) single-stranded DNA sequencing (ssDNA-seq) signal. All six feature layers are distributed as the ecoli_rep_hotspots dataset within TmCalculator, enabling complete reproducibility of genome-wide Tm computation, feature integration, statistical comparison, and multi-layer visualization within a single Bioconductor-native framework.
The analysis was performed in five steps using TmCalculator, with the complete annotated workflow available in the package vignette (vignette(“genome_wide_tm_ecoli”, package = “TmCalculator”)). First, the E. coli K-12 MG1655 reference genome (NCBI accession GCF_000005845.2) was packaged as a local BSgenome resource using forgeBSgenomeDataPkgFromNCBI() from BSgenomeForge [37] and distributed as a companion GitHub package. Second, make_genomiccoord() partitioned the chromosome (U00096.3, 4,641,652 bp) into non-overlapping 200 bp windows, and to_genomic_ranges_fast() resolved each coordinate against the BSgenome object and returned a GRanges object containing the corresponding sequences. Third, tm_calculate() computed Tm values for each window using the nearest-neighbor model with the DNA_NN_SantaLucia_2004 parameter set at 50 mM Na+, returning a GRanges object with Tm and GC content stored as metadata columns. Fourth, integrate_granges() integrated MutL-AR peak coordinates using an overlap-based strategy, producing a unified GRanges object with a binary grouping variable distinguishing MutL-AR hotspot windows from the genomic background. Fifth, multi-layer circular genome visualization was generated using plot_circos_genome() via a track_list interface, in which each feature dataset retained its native coordinates and was rendered as an independent concentric track. Statistical comparisons of Tm and GC content between MutL-AR hotspot windows and the background regions were performed using the Wilcoxon rank-sum test implemented in compare_groups().
3. Results
This section may be divided by subheadings. It should provide a concise and precise description of the experimental results, their interpretation, and the experimental conclusions that can be drawn.
3.1. TmCalculator: An Integrated Framework for Genome-Wide Thermodynamic Profiling
TmCalculator is organized into three functional layers: computation, data structure, and integration (Figure 1). The computation layer accepts four input formats: plain nucleotide sequences, FASTA files, genomic coordinate ranges, and GRanges objects. These inputs are processed by the core tm_calculate() function, which applies one of three melting temperature calculation methods with optional salt and chemical corrections. The data structure layer returns all results as GRanges objects, providing a standardized genomic interval representation that is fully compatible with the Bioconductor ecosystem. The integration layer supports integration of multi-omics features at both the data and visualization levels: data-level integration is achieved through integrate_granges(), which reconciles coordinate differences between Tm windows and external datasets using four strategies (overlap, nearest, window, and bin), while visualization-level integration employs a track_list interface to render each dataset as an independent parallel track. Supported multi-layer visualizations include circular genome plots, karyotype overviews, and regional track views.
3.1.1. Computation Layer: Input Flexibility and Tm Calculation Methods
TmCalculator provides a unified computational interface that supports four distinct input formats, all processed through the core tm_calculate() function. These include: (i) plain nucleotide sequences supplied as character vectors; (ii) FASTA files parsed with seqinr::read.fasta() [35]; (iii) Genomic coordinate ranges, specified in the form chr:start-end:strand:BSgenome:sequence_name format [32,37] and (iv) GRanges objects containing sequence metadata. For genomic coordinate range input, the function coor_to_genomic_ranges() is implemented to automatically retrieve sequences from reference BSgenome package or custom BSgenome packages compiled with BSgenomeForge. For genome-wide profiling, the make_genomiccoord() function partitions a reference genome into fixed-size bins and returns a genomic coordinate range object, which can be converted to a GRanges format and passed directly to tm_calculate().
TmCalculator implements three Tm calculation methods that differ in resolution and intended use: the Wallace rule, empirical GC-content models, and nearest-neighbor thermodynamic models. The Wallace rule estimates Tm from base composition alone and is intended for short oligonucleotides (typically 14-20 bp) under standard conditions [7,42]. Because it assigns a fixed contribution per base and ignores sequence context and reaction conditions, its accuracy degrades for longer sequences, and it is therefore not appropriate for the fixed-width windows used in genome-wide profiling. Empirical GC content models compute Tm as a function of GC percentage with corrections for sequence length and ionic strength, extending applicability to longer sequences at low computational cost, although they cannot distinguish sequences of identical GC content but different base arrangement. Eight formula variants are implemented for DNA, RNA, and RNA/DNA hybrids (Table 1) [1,2,3,5,43].
Nearest-neighbor thermodynamic models compute Tm by summing the stacking free energies of adjacent dinucleotide pairs using experimentally derived enthalpy and entropy parameters, thereby capturing sequence-dependent duplex stability. These models support calculations for perfectly matched duplexes as well as sequences containing mismatches and dangling ends (Table 2).
Both the empirical GC content and nearest-neighbor methods support salt and chemical corrections [2,3,5,9,10,11,55,56]. The nearest-neighbor approach is the most widely used and is generally regarded as the most accurate, and we adopt it as the default for genome-wide profiling, where sequence-resolved estimates are essential and the Wallace rule is not applicable.
3.1.2. Data Structure Layer: GRanges Output for Bioconductor Ecosystem Integration
Calculated Tm results are returned as GRanges objects [33] encoding chromosomal coordinates, strand information, and computed Tm and GC content as metadata columns. This design enables direct integration with Bioconductor pipelines, allowing genome-wide Tm profiles to be intersected with external genomic interval datasets, such as ATAC-seq peaks, ChIP-seq sites, gene annotations, and GWAS loci, using GenomicRanges::findOverlaps() [33]. Transcript structures and gene models can be incorporated using GenomicFeatures [33], while Tm values can be integrated as quantitative assay layers within multi-omics container classes, including SummarizedExperiment [57] and MultiAssayExperiment [58], or intersected with genetic variant datasets using VariantAnnotation [59]). By adopting GRanges as the native output format, TmCalculator enables Tm to function as a standardized genomic annotation that is fully interoperable with the broader Bioconductor ecosystem.
3.1.3. Integration Layer: Multi-Omics Data Integration and Visualization
The integration layer reconciles genome-wide Tm profiles with external datasets spanning various resolutions and feature types. The integrate_granges() function combines a Tm GRanges object with one or more external GRanges objects and returns a unified GRanges object with integrated features stored as metadata columns for downstream analysis and visualization. Four integration strategies are supported: overlap, which annotates Tm windows through direct intersection with discrete genomic features such as ATAC-seq; nearest, which assigns the closest genomic feature to each window for gene-level analyses like promoter Tm profiling; window, which aggregates features within a user-defined neighborhood; and bin, which summarizes external signals, such as RNA-seq coverage, into fixed-size genomic bins. Additional parameters allow control over strand specificity, aggregation functions, column naming conventions, minimum overlap thresholds, and the handling of unmatched windows. This granularity enables flexible and reproducible integration of thermodynamic profiles with heterogeneous multi-omics datasets.
Statistical comparisons between region classes (e.g., peak versus background regions) are implemented via compare_groups(), which supports the Wilcoxon rank-sum test and Student’s t-test. To account for multiple comparisons, the function incorporates standard family-wise error rate (FWER) and false discovery rate (FDR) correction methods, including Bonferroni and Benjamini-Hochberg.
In addition to data-level integration, TmCalculator supports visualization-level integration through a track_list interface, allowing each dataset to retain its native coordinates while being rendered as an independent track along a shared genomic axis. This design mirrors genome browser platforms such as Integrative Genomics Viewer (IGV) and the UCSC Genome Browser. TmCalculator provides six visualization functions suited to different genomic resolutions and plot types. The plot_circos_genome() function generates genome-wide circular multi-track plots, while plot_karyotype_genome() renders Tm values on chromosomal ideograms. For regional, browser-style track views, plot_linear_genome() and plot_tm_genome_tracks() are available. The plot_tm_heatmap() function produces heatmaps across sets of genomic regions, and plot_tm_linear() enables distribution-level comparisons between genomic region classes.
3.2. Application: Genome-Wide Thermodynamic Profiling and Multi-Layer Integration in E. coli K-12 MG1655
To illustrate the genome-wide thermodynamic profiling capabilities of TmCalculator, we applied the framework to the complete E. coli K-12 MG1655 chromosome (U00096.3, 4,641,652 bp). Sliding-window analysis using non-overlapping 200 bp windows yielded 23,208 genomic intervals with Tm values ranging from 64.86 to 91.23 °C and a genome-wide mean of 79.21 ± 3.07 °C (median 79.67 °C). GC content across windows ranged from 0.21 to 0.75, with a mean of 0.51. On a standard desktop computer running R 4.3 on a single core (2.6 GHz Intel Core i7, 16 GB RAM), complete profiling of the 4.6 Mb chromosome ran in approximately 9.0 s. Coordinate generation with make_genomiccoord() and coor_to_genomic_ranges() took about 0.47 s, and nearest-neighbor Tm computation across all 23,208 windows with tm_calculate() took about 8.53 s. These results show that genome-scale thermodynamic profiling is computationally inexpensive at the bacterial scale and runs on commodity hardware without parallelization.
To demonstrate TmCalculator’s native support for multi-layer genomic integration and visualization, the genome-wide Tm profile was analyzed alongside five additional genomic feature layers derived from the ecoli_rep_hotspots dataset distributed with the package: MutL-AR ChIP-seq peak coordinates defining replication error hotspots, microsatellite density, cruciform-prone sequence density, single-stranded DNA (ssDNA-seq) signal, and GATC methylation site density. All feature datasets were assembled into a track_list object and visualized using plot_circos_genome(), generating a seven-track circular genome representation (Figure 2A). From outermost to innermost, the tracks display MutL-AR ChIP-seq peaks, GC content, Tm, microsatellite density, cruciform-prone sequence density, ssDNA signal, and GATC site density, with the replication origin (ori, position 3,925,804) and terminus (dif, position 1,590,777) annotated. A zoomed view of two hotspot enriched regions (Figure 2B) highlights local co-localization patterns at individual loci.
Consistent with the previously reported thermodynamic landscape [23], visual inspection shows that MutL-AR hotspots align with regions of reduced Tm and GC content and are associated with higher microsatellite density and cruciform-prone sequence density. This visualization illustrates how multiple sequence-intrinsic and functional features can be examined simultaneously within a single, integrated representation.
To quantitatively illustrate TmCalculator’s GRanges-native integration and comparison utilities, we annotated each of the 23,208 Tm windows for MutL-AR overlap using integrate_granges(). This classified 806 windows as MutL-AR-associated and 22,402 windows as background. Statistical analysis using compare_groups() showed that MutL-AR windows exhibit significantly lower Tm values than background (Wilcoxon rank-sum test, p = 6.7 × 10⁻²⁰; median Tm 78.79 °C versus 79.68 °C), along with significantly lower GC content (Wilcoxon rank-sum test, p = 8.5 × 10⁻²²; median GC 0.50 vs. 0.52). These results successfully reproduce the established thermodynamic signatures of replication error hotspots within a standardized analytical framework.
Taken together, this application illustrates three core capabilities of TmCalculator: (i) genome-wide thermodynamic profiling of a complete bacterial chromosome within a standard R session, operating directly on any BSgenome package, including genomes packaged with BSgenomeForge, through sliding-window Tm computation to GRanges-native output; (ii) seamless integration of thermodynamic profiles with heterogeneous published genomic feature datasets at differing resolutions, enabling direct statistical comparison without ad hoc data transformation; and (iii) generation of quantitative summaries and publication-quality multi-layer genomic visualizations within a single, fully reproducible Bioconductor-native workflow. In short, we demonstrate how TmCalculator unifies previously disparate analytical steps into a coherent framework for reproducible genome-wide thermodynamic analysis and multi-omics data integration.
4. Discussion
TmCalculator addresses a longstanding gap in computational genomics by providing a unified framework for treating nucleic acid melting temperature as a standardized genomic interval feature compatible with genome-scale, multi-omics analysis. While existing tools focus on individual sequences or specific primer design workflows, none were designed for genome-scale Tm profiling within the Bioconductor ecosystem. TmCalculator achieves this integration through three core design choices: accepting four standard Bioconductor input formats, returning all output as GRanges objects, and employing explicit strategies to resolve coordinate discrepancies across heterogeneous genomic datasets. Rather than replacing single-sequence Tm calculators, TmCalculator complements them by enabling genome-scale analysis that integrates sliding-window thermodynamic profiling, multi-omics data integration, and multi-layer visualization within a single R package. By treating Tm as a quantitative genomic annotation, the framework allows thermodynamic information to be analyzed alongside other sequence-intrinsic and functional features using standard Bioconductor workflows. Application to the E. coli K-12 MG1655 genome illustrates how this unified approach reproduces established thermodynamic landscapes, specifically, the enrichment of MutL-associated replication error hotspots in regions of reduced thermodynamic stability, while formalizing the full analytical process within a reproducible, genome-scale framework.
Several limitations should be considered when interpreting genome-wide Tm profiles generated by TmCalculator, regardless of the specific calculation method used. First, all Tm estimates, whether based on the Wallace rule, empirical GC-content models, or nearest-neighbor thermodynamic models, are derived from solution-phase approximations and do not account for the in vivo chromatin environment, including nucleosome occupancy, DNA supercoiling, or protein-DNA interactions. Genome-wide Tm profiles should therefore be interpreted as sequence-intrinsic thermodynamic baselines rather than direct measurements of duplex stability in vivo. Second, for both empirical GC-content methods and nearest-neighbor thermodynamic models, the underlying parameters were primarily derived from melting experiments on short oligonucleotides, and genome-scale application assumes additivity and transferability of these parameters to longer genomic windows. This assumption may reduce accuracy for long genomic windows, particularly those with extreme nucleotide compositions. Third, although TmCalculator supports thermodynamic parameters for internal mismatches, terminal mismatches, and dangling ends within the nearest-neighbor framework, parameters for other chemically modified nucleotides, including 5-methylcytosine, and 5-hydroxymethylcytosine are not currently supported.
Some directions could extend the utility of TmCalculator beyond its current scope. First, the RNA_DNA_NN_Sugimoto_1995 parameter set currently implemented provides a foundation for extending RNA-DNA hybrid Tm calculation to applications such as CRISPR guide RNA design and R-loop biology. Fully supporting CRISPR-related analyses would require additional parameter sets and correction models tailored to guide RNA thermodynamics, off-target interactions, variable buffer, and cellular conditions. Second, while multi-omics integration is demonstrated here, systematic application of the TmCalculator framework at genome scale across the human genome, spanning diverse modalities such as chromatin accessibility, transcriptional activity, transcription factor binding, DNA secondary structure, repetitive elements, and disease-associated variation, represents a broader direction that will be enabled by the continued expansion and harmonization of public datasets. Third, integration with single-cell multi-omics data represents a promising longer-term direction enabled by our GRanges-native design. This architecture allows genome-wide Tm annotations to be directly aligned with cell-resolved chromatin and transcriptional intervals as cell-type-specific datasets become increasingly available.
5. Conclusions
TmCalculator is a Bioconductor-compatible R package that extends nucleic acid melting temperature analysis from sequence-level computation to genome-wide thermodynamic profiling within standard genomic and multi-omics workflows. By supporting diverse input formats, leveraging the BSgenome infrastructure, and implementing widely used Tm estimation methods, TmCalculator enables Tm to be treated as a quantitative genomic feature interoperable with the Bioconductor ecosystem. Through GRanges-native output and built-in utilities for data integration, statistical comparison, and visualization, the framework supports reproducible analysis of thermodynamic profiles alongside functional genomic data. In summary, by treating Tm as a continuous genome-wide track rather than a property of individual sequences, TmCalculator provides a standardized and extensible foundation for incorporating thermodynamic information into computational genomics and multi-omics studies. The package is freely available from CRAN at https://cran.r-project.org/web/packages/TmCalculator/index.html.
Author Contributions
J.L. conceived and developed the TmCalculator package, designed and implemented all functions, performed all analyses, and drafted the manuscript. L.J.Z. supervised the project, contributed to the study design, and critically and substantially revised the manuscript. All authors contributed to editorial changes in the manuscript. All authors read and approved the final manuscript. All authors have participated sufficiently in the work and agreed to be accountable for all aspects of the work.
Funding
This research received no external funding.
Institutional Review Board Statement
Not applicable.
Informed Consent Statement
Not applicable.
Data Availability Statement
The TmCalculator R package is available from CRAN at https://cran.r-project.org/web/packages/TmCalculator/index.html. The ecoli_rep_hotspots dataset bundled with TmCalculator includes all feature layers required to reproduce the application results. A fully annotated R vignette demonstrating the case study is available at https://cran.r-project.org/web/packages/TmCalculator/vignettes/genome_wide_tm_ecoli.html.
Acknowledgments
The authors thank Kai Hu, Haibo Liu, and Yaroslav Markov for helpful discussions and valuable suggestions.
Conflicts of Interest
The authors declare no conflicts of interest.
Abbreviations
The following abbreviations are used in this manuscript:
| ATAC-seq | Assay for transposase-accessible chromatin with sequencing |
| ChIP-seq | Chromatin immunoprecipitation sequencing |
| CRISPR | Clustered regularly interspaced short palindromic repeats |
| DMSO | Dimethyl sulfoxide |
| FASTA | Text-based sequence format |
| FDR | False discovery rate |
| FWER | Family-wise error rate |
| GC | Guanine-cytosine |
| GWAS | Genome-wide association study |
| IGV | Integrative Genomics Viewer |
| MutL-AR | MutL-associated region |
| NN | Nearest-neighbor |
| PCR | Polymerase chain reaction |
| RNA-seq | RNA sequencing |
| ssDNA-seq | Single-stranded DNA sequencing |
| Tm | Melting Temperature |
References
- Marmur, J. and P. Doty, Determination of the base composition of deoxyribonucleic acid from its thermal denaturation temperature. J Mol Biol, 1962. 5: p. 109-18. [CrossRef]
- Schildkraut, C., Dependence of the melting temperature of DNA on salt concentration. Biopolymers, 1965. 3(2): p. 195-208. [CrossRef]
- Wetmur, J.G., DNA probes: applications of the principles of nucleic acid hybridization. Crit Rev Biochem Mol Biol, 1991. 26(3-4): p. 227-59. [CrossRef]
- Allawi, H.T. and J. SantaLucia, Jr., Thermodynamics and NMR of internal G.T mismatches in DNA. Biochemistry, 1997. 36(34): p. 10581-94. [CrossRef]
- von Ahsen, N., C.T. Wittwer, and E. Schutz, Oligonucleotide melting temperatures under PCR conditions: nearest-neighbor corrections for Mg(2+), deoxynucleotide triphosphate, and dimethyl sulfoxide concentrations with comparison to alternative empirical formulas. Clin Chem, 2001. 47(11): p. 1956-61. [CrossRef]
- SantaLucia, J., Jr. and D. Hicks, The thermodynamics of DNA structural motifs. Annu Rev Biophys Biomol Struct, 2004. 33: p. 415-40. [CrossRef]
- Wallace, R.B., J. Shaffer, R.F. Murphy, J. Bonner, T. Hirose, and K. Itakura, Hybridization of synthetic oligodeoxyribonucleotides to phi chi 174 DNA: the effect of single base pair mismatch. Nucleic Acids Res, 1979. 6(11): p. 3543-57. [CrossRef]
- Breslauer, K.J., R. Frank, H. Blocker, and L.A. Marky, Predicting DNA duplex stability from the base sequence. Proc Natl Acad Sci U S A, 1986. 83(11): p. 3746-50. [CrossRef]
- SantaLucia, J., Jr., A unified view of polymer, dumbbell, and oligonucleotide DNA nearest-neighbor thermodynamics. Proc Natl Acad Sci U S A, 1998. 95(4): p. 1460-5. [CrossRef]
- Owczarzy, R., Y. You, B.G. Moreira, J.A. Manthey, L. Huang, M.A. Behlke, and J.A. Walder, Effects of sodium ions on DNA duplex oligomers: improved predictions of melting temperatures. Biochemistry, 2004. 43(12): p. 3537-54. [CrossRef]
- Owczarzy, R., B.G. Moreira, Y. You, M.A. Behlke, and J.A. Walder, Predicting stability of DNA duplexes in solutions containing magnesium and monovalent cations. Biochemistry, 2008. 47(19): p. 5336-53. [CrossRef]
- Rychlik, W., W.J. Spencer, and R.E. Rhoads, Optimization of the annealing temperature for DNA amplification in vitro. Nucleic Acids Res, 1990. 18(21): p. 6409-12. [CrossRef]
- Burden, C.J., Y.E. Pittelkow, and S.R. Wilson, Statistical analysis of adsorption models for oligonucleotide microarrays. Stat Appl Genet Mol Biol, 2004. 3: p. Article35.
- Pozhitkov, A.E., D. Tautz, and P.A. Noble, Oligonucleotide microarrays: widely applied--poorly understood. Brief Funct Genomic Proteomic, 2007. 6(2): p. 141-8. [CrossRef]
- Kuscu, C., S. Arslan, R. Singh, J. Thorpe, and M. Adli, Genome-wide analysis reveals characteristics of off-target sites bound by the Cas9 endonuclease. Nat Biotechnol, 2014. 32(7): p. 677-83. [CrossRef]
- Alkan, F., A. Wenzel, C. Anthon, J.H. Havgaard, and J. Gorodkin, CRISPR-Cas9 off-targeting assessment with nucleic acid duplex energy parameters. Genome Biol, 2018. 19(1): p. 177. [CrossRef]
- Bernardi, G., Isochores and the evolutionary genomics of vertebrates. Gene, 2000. 241(1): p. 3-17. [CrossRef]
- Liu, F., E. Tostesen, J.K. Sundet, T.K. Jenssen, C. Bock, G.I. Jerstad, et al., The human genomic melting map. PLoS Comput Biol, 2007. 3(5): p. e93. [CrossRef]
- Choi, C.H., G. Kalosakas, K.O. Rasmussen, M. Hiromura, A.R. Bishop, and A. Usheva, DNA dynamically directs its own transcription initiation. Nucleic Acids Res, 2004. 32(4): p. 1584-90. [CrossRef]
- Kanhere, A. and M. Bansal, Structural properties of promoters: similarities and differences between prokaryotes and eukaryotes. Nucleic Acids Res, 2005. 33(10): p. 3165-75. [CrossRef]
- Buenrostro, J.D., P.G. Giresi, L.C. Zaba, H.Y. Chang, and W.J. Greenleaf, Transposition of native chromatin for fast and sensitive epigenomic profiling of open chromatin, DNA-binding proteins and nucleosome position. Nat Methods, 2013. 10(12): p. 1213-8. [CrossRef]
- Klemm, S.L., Z. Shipony, and W.J. Greenleaf, Chromatin accessibility and the regulatory epigenome. Nat Rev Genet, 2019. 20(4): p. 207-220. [CrossRef]
- Hasenauer, F.C.B., H. C; Lotton, C; Matic, I., Genome-wide mapping of spontaneous DNA replication error-hotspots using mismatch repair proteins in rapidly proliferating Escherichia coli. Nucleic Acids Res, 2025. 53(2). [CrossRef]
- Biolabs, N.E. NEB Tm Calculator. 2026 [cited 2026; Available from: https://tmcalculator.neb.com/#!/main.
- Scientific, T. Tm Calculator for Primers. 2026 [cited 2026; Available from: https://www.thermofisher.com/us/en/home/brands/thermo-scientific/molecular-biology/molecular-biology-learning-center/molecular-biology-resource-library/thermo-scientific-web-tools/tm-calculator.html.
- Kibbe, W.A., OligoCalc: an online oligonucleotide properties calculator. Nucleic Acids Res, 2007. 35(Web Server issue): p. W43-6. [CrossRef]
- Le Novere, N., MELTING, computing the melting temperature of nucleic acid duplex. Bioinformatics, 2001. 17(12): p. 1226-7. [CrossRef]
- Dumousseau, M., N. Rodriguez, N. Juty, and N. Le Novere, MELTING, a flexible platform to predict the melting temperatures of nucleic acids. BMC Bioinformatics, 2012. 13: p. 101. [CrossRef]
- Aravind J, K.G. rmelting: R Interface to MELTING 5. R package version 1.28.0. 2026; Available from: https://aravind-j.github.io/rmelting/.
- Rudis, B., melting5jars: An R package wrapper for MELTING 5 jars. 2017.
- Cock, P.J., T. Antao, J.T. Chang, B.A. Chapman, C.J. Cox, A. Dalke, et al., Biopython: freely available Python tools for computational molecular biology and bioinformatics. Bioinformatics, 2009. 25(11): p. 1422-3. [CrossRef]
- Pagès, H., BSgenome: Software infrastructure for efficient representation of full genomes and their SNPs. 2026.
- Lawrence, M., W. Huber, H. Pages, P. Aboyoun, M. Carlson, R. Gentleman, et al., Software for computing and annotating genomic ranges. PLoS Comput Biol, 2013. 9(8): p. e1003118. [CrossRef]
- Team, R.C., R: A Language and Environment for Statistical Computing. 2026: Vienna, Austria.
- Charif, D.L., J. R., SeqinR 1.0-2: A Contributed Package to the R Project for Statistical Computing Devoted to Biological Sequences Retrieval and Analysis, in Structural Approaches to Sequence Evolution, U.P. Bastolla, M.; Roman, H. E.; Vendruscolo, M., Editor. 2007, Springer: Berlin, Heidelberg.
- Pagès, H.A., Patrick; Gentleman, Robert; DebRoy, Saikat, Biostrings: Efficient manipulation of biological strings. 2026.
- Pagès, H.K., Atuhurira Kirabo, BSgenomeForge: Forge your own BSgenome data package. 2026.
- Gel, B. and E. Serra, karyoploteR: an R/Bioconductor package to plot customizable genomes displaying arbitrary data. Bioinformatics, 2017. 33(19): p. 3088-3090. [CrossRef]
- Wickham, H., ggplot2: Elegant Graphics for Data Analysis. 2016, New York: Springer-Verlag.
- Wilke, C.O., ggridges: Ridgeline Plots in ‘ggplot2’. 2025.
- Pedersen, T.L., ggforce: Accelerating ‘ggplot2’. 2025.
- Wallace, R.B., M.J. Johnson, T. Hirose, T. Miyake, E.H. Kawashima, and K. Itakura, The use of synthetic oligonucleotides as hybridization probes. II. Hybridization of oligonucleotides of mixed sequence to rabbit beta-globin DNA. Nucleic Acids Res, 1981. 9(4): p. 879-94. [CrossRef]
- Untergasser, A., I. Cutcutache, T. Koressaar, J. Ye, B.C. Faircloth, M. Remm, and S.G. Rozen, Primer3--new capabilities and interfaces. Nucleic Acids Res, 2012. 40(15): p. e115. [CrossRef]
- Chester, N. and D.R. Marshak, Dimethyl sulfoxide-mediated primer Tm reduction: a method for analyzing the role of renaturation temperature in the polymerase chain reaction. Anal Biochem, 1993. 209(2): p. 284-90. [CrossRef]
- Heydenreich, F.M., T. Miljus, R. Jaussi, R. Benoit, D. Milic, and D.B. Veprintsev, High-throughput mutagenesis using a two-fragment PCR approach. Sci Rep, 2017. 7(1): p. 6787. [CrossRef]
- Sugimoto, N., S. Nakano, M. Yoneyama, and K. Honda, Improved thermodynamic parameters and helix initiation factor to predict stability of DNA duplexes. Nucleic Acids Res, 1996. 24(22): p. 4501-5. [CrossRef]
- Allawi, H.T. and J. SantaLucia, Jr., Nearest-neighbor thermodynamics of internal A.C mismatches in DNA: sequence dependence and pH effects. Biochemistry, 1998. 37(26): p. 9435-44. [CrossRef]
- Freier, S.M., R. Kierzek, J.A. Jaeger, N. Sugimoto, M.H. Caruthers, T. Neilson, and D.H. Turner, Improved free-energy parameters for predictions of RNA duplex stability. Proc Natl Acad Sci U S A, 1986. 83(24): p. 9373-7. [CrossRef]
- Xia, T., J. SantaLucia, Jr., M.E. Burkard, R. Kierzek, S.J. Schroeder, X. Jiao, et al., Thermodynamic parameters for an expanded nearest-neighbor model for formation of RNA duplexes with Watson-Crick base pairs. Biochemistry, 1998. 37(42): p. 14719-35. [CrossRef]
- Chen, J.L., A.L. Dishler, S.D. Kennedy, I. Yildirim, B. Liu, D.H. Turner, and M.J. Serra, Testing the nearest neighbor model for canonical RNA base pairs: revision of GU parameters. Biochemistry, 2012. 51(16): p. 3508-22. [CrossRef]
- Sugimoto, N., S. Nakano, M. Katoh, A. Matsumura, H. Nakamuta, T. Ohmichi, et al., Thermodynamic parameters to predict stability of RNA/DNA hybrid duplexes. Biochemistry, 1995. 34(35): p. 11211-6. [CrossRef]
- Bommarito, S., N. Peyret, and J. SantaLucia, Jr., Thermodynamic parameters for DNA sequences with dangling ends. Nucleic Acids Res, 2000. 28(9): p. 1929-34. [CrossRef]
- Peyret, N., P.A. Seneviratne, H.T. Allawi, and J. SantaLucia, Jr., Nearest-neighbor thermodynamics and NMR of DNA sequences with internal A.A, C.C, G.G, and T.T mismatches. Biochemistry, 1999. 38(12): p. 3468-77.
- Turner, D.H. and D.H. Mathews, NNDB: the nearest neighbor parameter database for predicting stability of nucleic acid secondary structure. Nucleic Acids Res, 2010. 38(Database issue): p. D280-2. [CrossRef]
- SantaLucia, J., Jr., H.T. Allawi, and P.A. Seneviratne, Improved nearest-neighbor parameters for predicting DNA duplex stability. Biochemistry, 1996. 35(11): p. 3555-62. [CrossRef]
- Blake, R.D. and S.G. Delcourt, Thermodynamic effects of formamide on DNA stability. Nucleic Acids Res, 1996. 24(11): p. 2095-103. [CrossRef]
- Morgan, M.O., Valerie; Hester, Jim; Pagès, Hervé SummarizedExperiment: A container (S4 class) for matrix-like assays. 2026.
- Ramos, M., L. Schiffer, A. Re, R. Azhar, A. Basunia, C. Rodriguez, et al., Software for the Integration of Multiomics Experiments in Bioconductor. Cancer Res, 2017. 77(21): p. e39-e42. [CrossRef]
- Obenchain, V., M. Lawrence, V. Carey, S. Gogarten, P. Shannon, and M. Morgan, VariantAnnotation: a Bioconductor package for exploration and annotation of genetic variants. Bioinformatics, 2014. 30(14): p. 2076-8. [CrossRef]
Figure 1.
Three functional layers and workflow of TmCalculator.
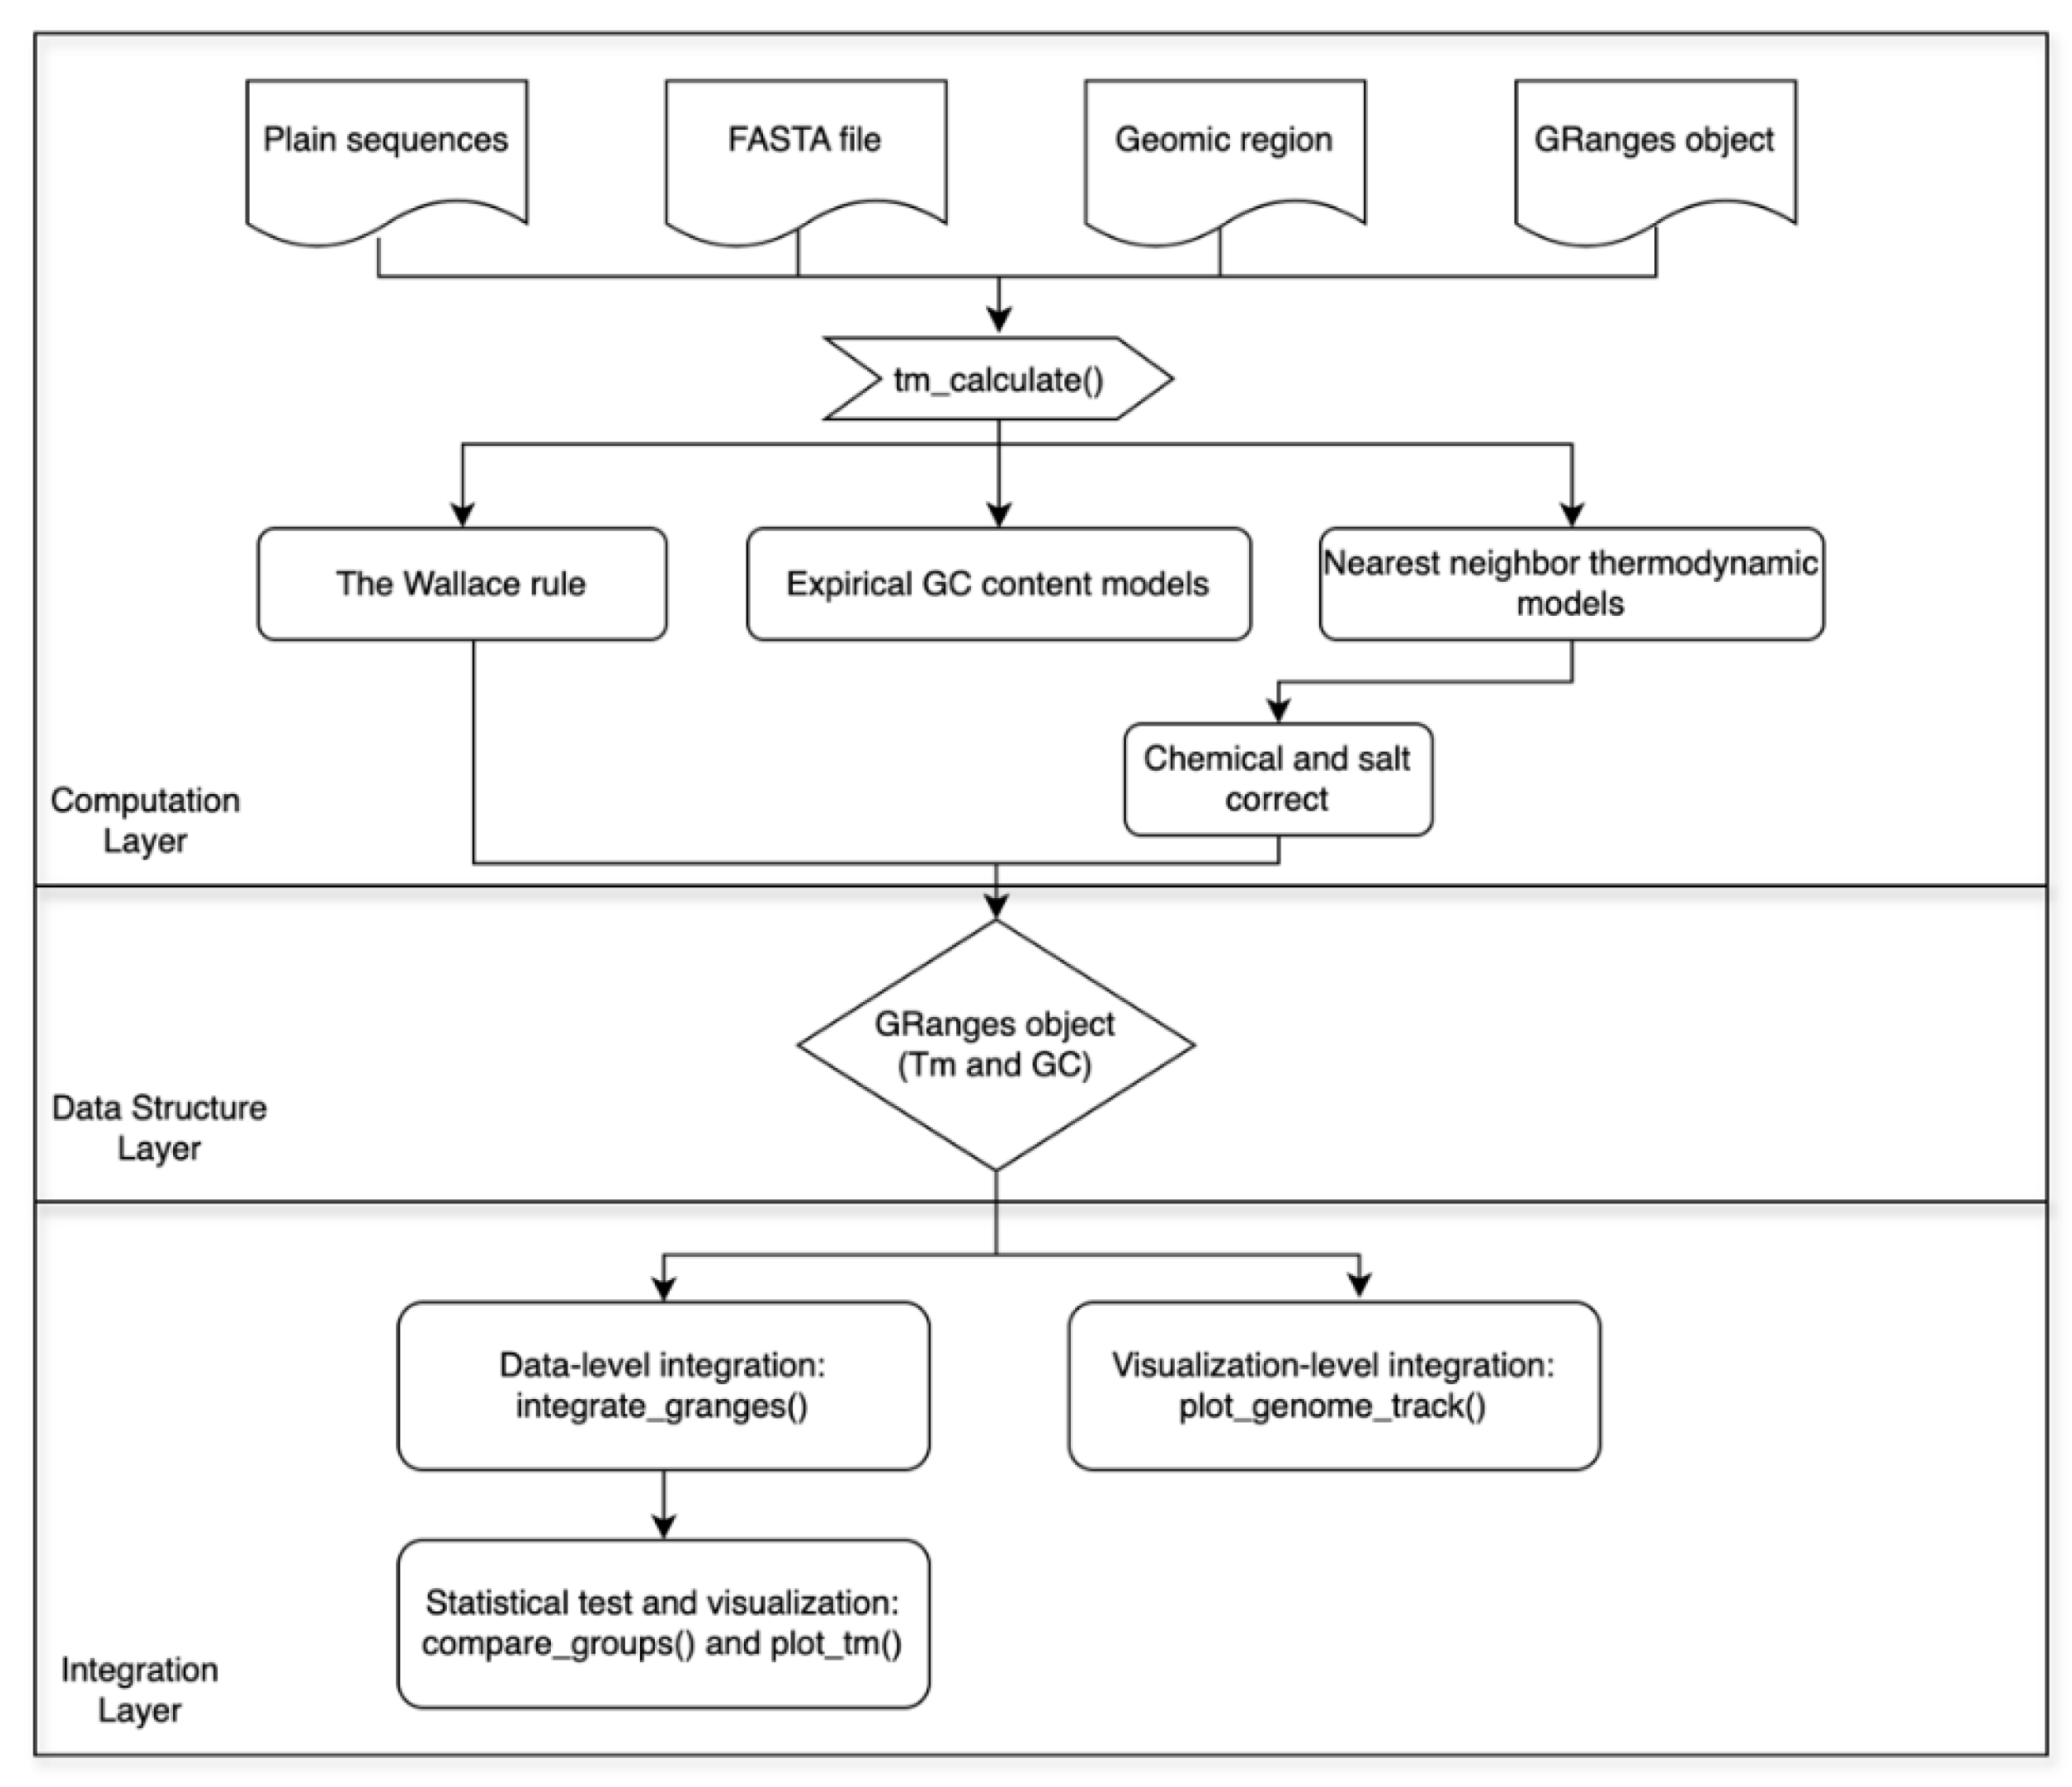
Figure 2.
Genome-wide Tm profile of E. coli K-12 MG1655 (ASM584v2) generated by TmCalculator. (A) Full seven-track circular genome map. Concentric rings from outermost to innermost: MutL-AR ChIP-seq peaks (grey rectangles), GC content per 200 bp window (%), Tm per 200 bp window (°C), microsatellite density, cruciform-prone sequence density, single-stranded DNA regions, and GATC methylation site density. Replication origin (ori, position 3,925,804) and terminus (dif, position 1,590,777) are annotated on the outermost ring. (B) Zoomed circular view of two selected regions (0.1–0.5 Mb and 3.6–4.5 Mb), highlighting spatial co-localization of MutL-AR hotspots with regions of lower Tm, higher microsatellite density, and elevated cruciform-prone sequence density.
Figure 2.
Genome-wide Tm profile of E. coli K-12 MG1655 (ASM584v2) generated by TmCalculator. (A) Full seven-track circular genome map. Concentric rings from outermost to innermost: MutL-AR ChIP-seq peaks (grey rectangles), GC content per 200 bp window (%), Tm per 200 bp window (°C), microsatellite density, cruciform-prone sequence density, single-stranded DNA regions, and GATC methylation site density. Replication origin (ori, position 3,925,804) and terminus (dif, position 1,590,777) are annotated on the outermost ring. (B) Zoomed circular view of two selected regions (0.1–0.5 Mb and 3.6–4.5 Mb), highlighting spatial co-localization of MutL-AR hotspots with regions of lower Tm, higher microsatellite density, and elevated cruciform-prone sequence density.
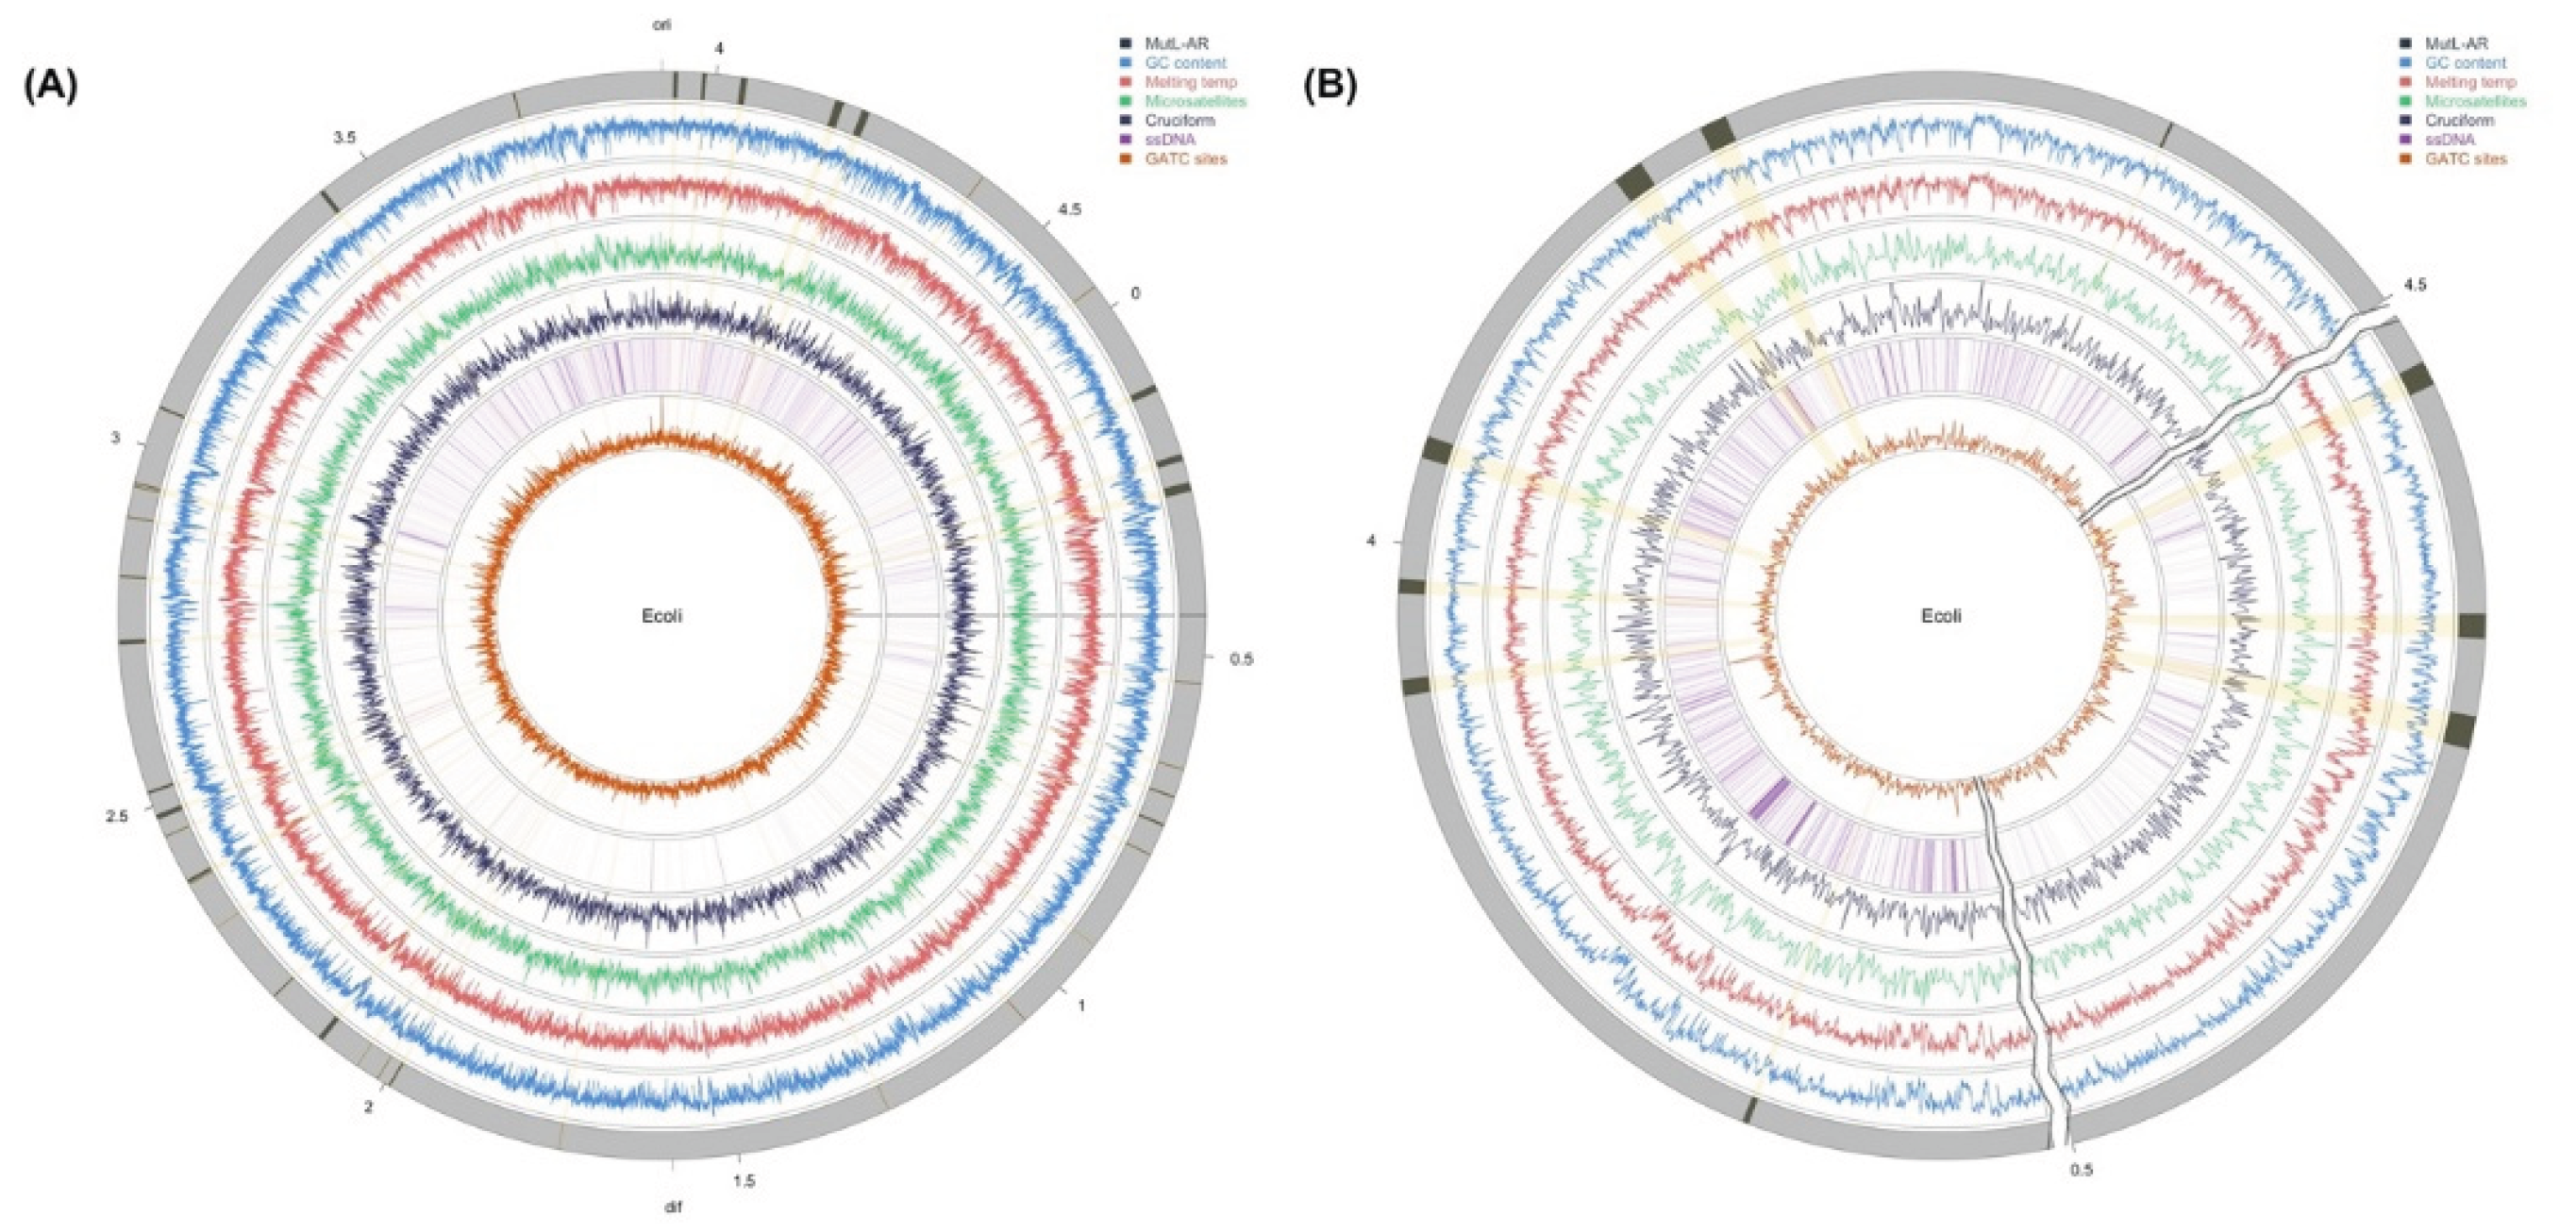

Table 1.
GC content models implemented in TmCalculator.
| Method | Type | Formula |
|---|---|---|
| Primer3Plus [43] | DNA | Tm = 81.5 + 0.41(%GC) − 600/N + 16.6log10[Mon] |
| Chester1993 [44] | DNA | Tm = 69.3 + 0.41(%GC) − 650/N |
| QuikChange [45] | DNA | Tm = 81.5 + 0.41(%GC) − 675/N − %mismatch |
| Schildkraut1965 [2] | DNA | Tm = 81.5 + 0.41(%GC) − 675/N + 16.6log10[Mon] |
| Wetmur1991_MELTING [3] | DNA | Tm = 81.5 + 0.41(%GC) − 500/N + 16.6log([Mon]/(1.0 + 0.7[Mon])) − %mismatch |
| Wetmur1991_RNA [3] | RNA | Tm = 78 + 0.7(%GC) − 500/N + 16.6log10([Mon]/(1 + 0.7[Mon])) − %mismatch |
| Wetmur1991_RNA/DNA [3] | RNA/DNA | Tm = 67 + 0.8(%GC) − 500/N + 16.6log10([Mon]/(1 + 0.7 [Mon])) − %mismatch |
| vonAhsen2001 [5] | DNA | Tm = 77.1 + 0.41(%GC) − 528/N + 11.7log10[Mon] |
Note: %GC is the percentage of GC, N is the nucleotide sequence length, [Mon] is the millimolar concentration of monovalent ion, %mismatch is the percentage of mismatch.
Table 2.
Nearest-neighbor thermodynamic parameter sets implemented in TmCalculator.
| Sequence context | Parameter | Type |
|---|---|---|
| Perfect matching sequence | DNA_NN_SantaLucia_2004 [6] | DNA/DNA |
| DNA_NN_Breslauer_1986 [8] | DNA/DNA | |
| DNA_NN_Sugimoto_1996 [46] | DNA/DNA | |
| DNA_NN_Allawi_1998 [47] | DNA/DNA | |
| RNA_NN_Freier_1986 [48] | RNA/RNA | |
| RNA_NN_Xia_1998 [49] | RNA/RNA | |
| RNA_NN_Chen_2012 [50] | RNA/RNA | |
| RNA_DNA_NN_Sugimoto_1995 [51] | RNA/DNA | |
| Terminal mismatch sequence | DNA_TMM_Bommarito_2000 [52] | DNA/DNA |
| Internal mismatch sequence | DNA_IMM_Peyret_1999 [53] | DNA/DNA |
| Dangling end sequence | DNA_DE_Bommarito_2000 [52] | DNA/DNA |
| RNA_DE_Turner_2010 [54] | RNA/RNA |
Disclaimer/Publisher’s Note: The statements, opinions and data contained in all publications are solely those of the individual author(s) and contributor(s) and not of MDPI and/or the editor(s). MDPI and/or the editor(s) disclaim responsibility for any injury to people or property resulting from any ideas, methods, instructions or products referred to in the content. |
© 2026 by the authors. Licensee MDPI, Basel, Switzerland. This article is an open access article distributed under the terms and conditions of the Creative Commons Attribution (CC BY) license.
Copyright: This open access article is published under a Creative Commons CC BY 4.0 license, which permit the free download, distribution, and reuse, provided that the author and preprint are cited in any reuse.