
Submitted:
06 August 2026
Posted:
07 August 2026
You are already at the latest version
Abstract
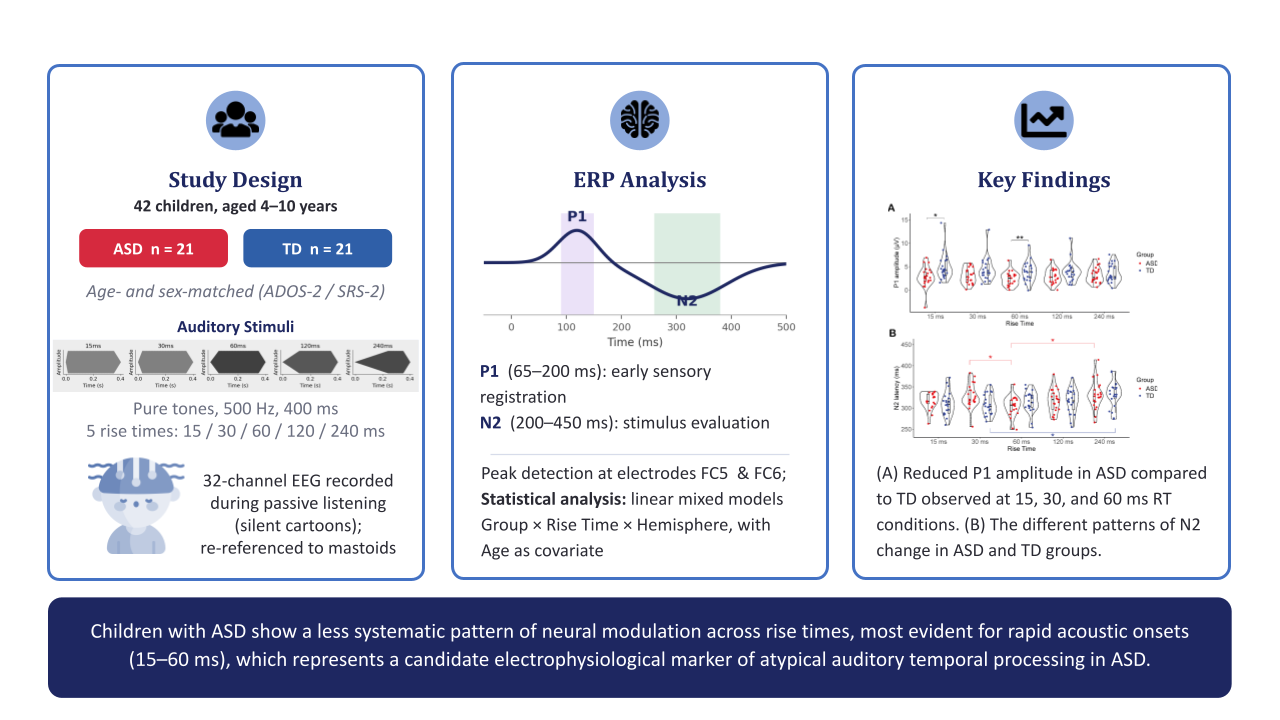
Objectives: Amplitude rise time (RT) is a critical acoustic cue for speech perception, playing an important role in auditory processing of both speech and non-speech sounds. This study examined neurophysiological processing of RT in children with autism spectrum disorder (ASD) compared to typically developing (TD) peers. Methods: EEG was recorded during passive presentation of pure tones with five RT values (15, 30, 60, 120, 240 ms) in 42 children (ASD: n = 21, TD: n = 21, aged 4–10 years). Linear mixed models were used to analyze latencies and amplitudes of P1 and N2 components of event-related potential. Results: Children with ASD and TD peers showed distinct patterns of neural modulation across RTs. TD children show general increase in latency and decrease in amplitude of ERP components with increase in RT. While this pattern holds for P1 latency also for children with ASD, P1 amplitude was reduced in ASD compared to TD peers specifically at shorter rise times (15–60 ms), indicating weaker encoding of rapid acoustic onsets. For N2 latency children with ASD showed an atypical drop at 60 ms compared to 30 ms RT. P1N2 amplitude reached its minimum at 60 ms RT in ASD contrasting systematic decrease from 15 to 240 ms RT in TD. Conclusions: Together, these findings suggest that children with ASD show a less systematic pattern of neural modulation across the rise time continuum, particularly in the range of rapid acoustic onsets (15–60 ms), while processing of more gradual onsets remains relatively intact.
Keywords:
autism spectrum disorder
; rise time
; auditory processing
; event-related potentials
; EEG
; P1
; N2
; children
1. Introduction
Rise time (RT) is one of the most important acoustic characteristics of auditory stimuli, playing a critical role in the perception of speech and non-speech sounds. From a physical standpoint, amplitude rise time refers to the duration over which a sound’s amplitude increases from its onset to its maximum value. This temporal cue defines the onset abruptness of a sound, directly influencing its perceptual quality: shorter RTs create more percussive onsets, while longer RTs produce smoother, more gradual onsets [1,2].
The perceptual relevance of RT spans multiple levels of speech hierarchy. Very short RTs (approx. 10 ms) are critical for cueing stop consonants (e.g., /b/), while protracted rise times (e.g., 70-150 ms) signal glides (e.g., /w/) [3]. RT is a key distinguishing cue for voiceless affricate/fricative contrast (/tʃ/ vs. /ʃ/) with affricates having significantly shorter rise times (e.g., 30-60 ms in running speech, 40-60 ms in nonsense syllables) compared to fricatives (e.g., 70-120 ms in running speech, 90-140 ms in nonsense syllables) [4]. At the syllabic level, RT is a key correlate of metrical structure: stressed syllables have longer RTs, and individual differences in RT perception are linked to detection of syllable stress [5]. Furthermore, the modulation of RTs is inherent to the amplitude envelope fluctuations (2-50 Hz) that carry rhythmic information in speech, with periodicities around 3-5 Hz (200-300 ms) reflecting syllable-rate cues critical for rhythm perception [6]. On the prosodic level, articulatory gestures adjacent to phrase boundaries show temporal lengthening, which can be modeled as a reduction in gestural stiffness and a modulation of the activation RT, contributing to boundary signaling [7]. Noteworthy, these perceptual boundaries are not fixed but context-dependent, varying with speech styles [4], and language-specific phonetic implementation [8].
At the neurophysiological level, RT processing is robustly reflected in auditory event-related potential (ERP). A recent systematic review of electroencephalographic (EEG) studies confirms that increasing RT systematically modulates key ERP components, generally reducing their amplitude and prolonging their latency [9]. Neural sensitivity to RTvaries across processing stages: brainstem responses encode microsecond differences, while cortical long-latency components like N1-P2 optimally discriminate changes in the tens-to-hundreds of milliseconds range. These cortical responses are predominantly generated in the auditory cortex and adjacent supratemporal areas, with a well-documented right-hemisphere bias for processing of temporal features such as RT, voice onset time and duration changes, for both speech and non-speech sounds [10,11]. Thus, examining laterality effects may provide additional insight into the neural organization of RT processing, particularly in populations where auditory temporal processing is atypical.
Several ERP studies have investigated RT processing in populations with speech and language disorders, most notably developmental dyslexia. In particular, altered ERP morphologies, such as attenuated P1 amplitude modulation by RT [12], and specific patterns of mismatch negativity (MMN) in response to RT deviants [13,14] have been reported in children with dyslexia. In contrast, the neurophysiological mechanisms underlying RT processing in Autism Spectrum Disorder (ASD) remain unexplored. This is a critical oversight, as converging evidence indicates fundamental disruptions in early auditory processing in ASD, including deficits in temporal envelope resolution [15] and delayed development of phonological categories [16]. Given the central role of RT sensitivity across the speech hierarchy and the established auditory processing anomalies in ASD, investigating the neurophysiological correlates of RT processing in this population is a logical next step. Such research could determine whether atypical RT encoding represents a shared or disorder-specific mechanism underlying language and communication difficulties associated with ASD.
Therefore, the present study aims to investigate the electrophysiological markers of amplitude RT processing (using a set of RTs: 15, 30, 60, 120, 240 ms) in children with ASD compared to typically developing (TD) peers, focusing on both the response magnitude (amplitude) and temporal dynamics (latency) of auditory ERPs. We hypothesized that group differences could potentially emerge at both shorter RTs, relevant for segmental phonology (e.g., stop-glide contrasts), and longer RTs, relevant for prosodic processing.
2. Materials and Methods
2.1. Participants
The study involved two groups of participants: children with autism spectrum disorder (ASD) (n=21, aged from 52 to 119 months, average age 83.5 (±18.2), 6 females) and their sex- and age-matched typical developing (TD) peers (n=21, aged from 52 to 122 months, average age 83.8 (±19.1), 6 females). A total of 42 children (12 females), aged from 52 to 122 months, with an average age of 83.6 (±18.2), were included in the sample.
The ASD diagnosis was confirmed using the Autism Diagnostic Observation Schedule, Second Edition (ADOS-2) [17] administered by a certified specialist. In cases where the ADOS-2 results were inconclusive (n=2), the Autism Diagnostic Interview-Revised (ADI-R) [18] was additionally employed to provide supplementary diagnostic information. These instruments together constitute the internationally recognized gold standard for autism diagnostic assessment [19]. All children in both groups were screened using the SRS-2 [20], a quantitative parent-report measure designed to assess autistic traits and social impairment across the general population. The ASD group showed elevated raw scores (mean = 82.5, SD = 24.0, range 31–137) and T-scores (mean = 67.9, SD = 10.1, range 46–90), consistent with clinically significant levels of autistic traits. While most children with ASD showed elevated SRS-2 scores in the clinical range (T ≥ 60), a subset (n = 3; ages 52–94 months, mean = 72.67 months) fell below this threshold. This is consistent with previous reports that some children with confirmed ASD may not show elevated SRS scores, particularly those with higher verbal abilities or less severe social-communication difficulties [21]. Thus, the SRS-2 was used as a quantitative measure of autistic traits rather than a diagnostic tool. In contrast, the TD group showed raw scores (mean = 34.7, SD = 13.8, range 21–65) and T-scores (mean = 48.9, SD = 5.1, range 42–59) within the typical range, confirming no signs of neurodivergence. SRS-2 scores for all participants are reported in Supplementary Table D1.
2.2. Data Collection and Ethics
This research was carried out with the approval of the Sirius University Bioethics Committee (Bioethics Committee Opinion dated 13 July 2022) and in line with the principles of the Declaration of Helsinki. Prior to data collection, written informed consent was provided by the participants’ parents or guardians, and verbal assent was obtained from each child participant. All procedures for the collection and management of EEG and behavioral data followed the approved study protocols.
2.3. Stimuli and Procedure of EEG Experiment
Stimuli were presented through headphones, binaurally. While listening, participants watched cartoons of their choice without sound. Pure tones with five different RTs (15 ms, 30 ms, 60 ms, 120 ms, 240 ms) were used as stimuli. The tone frequency was 500 Hz, the duration was 400 ms, and the fall time was 50 ms. The order of stimulus presentation was quasi-random, with three constraints: 1) the total number of presentations of each stimulus type was equal to each other (150 presentations per stimulus); 2) the same stimulus was not repeated several times in a row; 3) two consecutive presentations of the same stimulus were separated by no more than 8 other stimuli. A total of three blocks with different sequences were presented. Each block included 250 trials, with 50 quasi-random presentations of each individual stimulus. The inter-stimulus interval was 450 or 550 ms, in random order.
2.4. EEG-Recording
Electroencephalographic (EEG) data were acquired in an electromagnetically shielded chamber. Recordings were obtained using a 32-channel (31 – active, 1 – referent) Brain Products actiCHamp system (Brain Products GmbH, Gilching, Germany) at a sampling rate of 50 kHz, in parallel with auditory stimulation. The signal was recorded without applying online filters (bandwidth range: DC to 10.3 kHz). The reference electrode was placed at the FCz site, and electrode impedances were maintained below 50 kΩ.
2.5. EEG Data Preprocessing
The preprocessing pipeline consisted of several steps implemented using the MNE-Python library v.1.9.0. First, a zero-phase bandpass FIR filter (0.5-40 Hz) was applied to all continuous EEG recordings to remove slow drifts and high-frequency noise. Next, visual inspection was performed to identify and mark bad channels; these channels were subsequently interpolated using spherical spline interpolation. To remove ocular artifacts, Independent Component Analysis (ICA) with 20 components was applied to each dataset. Components corresponding to eye blinks and saccades were identified based on their topographic distribution and time-course and were excluded from the signal. The data were then segmented into epochs from –100 ms to 500 ms relative to stimulus onset, with a baseline correction applied over the pre-stimulus interval (-100 to 0 ms). Epochs containing amplitude excursions exceeding ±250 µV were automatically rejected. The average number of epochs included in the analysis of each participant for each RT condition was 146.4 (±3.3, range 136-150) for the TD group and 139.0 (±10.1, range 109-150) for the ASD group. Finally, for each condition, evoked responses were computed by averaging epochs according to stimulus type per participant, and the EEG data were re-referenced to the average of the TP9 and TP10 mastoid electrodes to assess the maximum of brain activity of the auditory cortex and frontocentral channels [22,23].
2.6. ERP Data Analysis
For the analysis of event-related potentials, we performed a semi-automatic peak detection of the P1 and N2 components for each participant. These components were considered because they are predominant in the ERP configuration in this age group. The analysis was guided by the topographical distribution of activity, which was the most prominent over fronto-central regions (Supplementary 1), consistent with the maximal activation of the auditory cortex and adjacent supra-temporal areas. This fronto-central scalp distribution is characteristic of auditory processing and reflects the summation of activity from bilateral auditory cortices, aligning with the established generators of the P1 and N2 components [24,25]. To assess potential hemispheric differences (lateralisation), we focused our analysis on the lateral frontal electrodes FC5 (left hemisphere) and FC6 (right hemisphere) for each of the five RT conditions (15, 30, 60, 120, and 240 ms).
The time windows for peak detection were defined based on the grand-average waveforms across all conditions to ensure consistency. The target window for the P1 component was set to 65-200 ms, and for the N2 component to 200-450 ms post-stimulus onset [24,25]
Peak detection was implemented in a custom Python function. For each participant, electrode and condition, the signal was first inverted in polarity for the N2 component (extrema = -1) so that both P1 (positive) and N2 (after inversion) could be treated as positive deflections, allowing a unified peak-search procedure. The search was restricted to the predefined time window. Within this window, local maxima were identified using scipy.signal.find_peaks with a minimum distance of 20 ms between peaks to avoid spurious high-frequency fluctuations. The highest peak within the window was selected as the component peak; its latency was recorded as the 50% fractional area latency.
For amplitude extraction, we computed the mean voltage within a ±10 ms window centred on the detected peak to reduce the influence of residual high-frequency noise [22]. For the N2 component, the amplitude was taken as the mean value after polarity inversion, resulting in negative values.
The peak latency was estimated as the 50% fractional area latency for each component, defined as the time point at which 50% of the total absolute area under the curve within the search window was reached [23]. This measure is more robust for broad, slow components such as the N2 in children. When the signal in the window lacked a positive deflection, the absolute (rectified) signal was used instead, and a fallback flag was recorded. Finally, a peak-to-peak amplitude P1N2 was calculated as the difference between the P1 amplitude at its peak and the N2 amplitude at its peak (P1_amp_peak – N2_amp_peak). The final latency and amplitude values for the P1 and N2 components at electrodes FC5 and FC6 were extracted and stored for each participant and each RT condition. All detected components were visually verified on individual plots where the search windows were highlighted and the selected peaks were marked.
2.7. Statistical Analysis
Statistical analysis was carried out using R version 4.5.2 (R Core Team, 2025). To examine the effects on the neurophysiological parameters, we employed linear mixed models (LMM) fitted using the lme4 and lmerTest packages [26,27]. The models included Group (2 levels: ASD, TD), RT (5 levels: 15, 30, 60, 120, 240 ms), Hemisphere (2 levels: FC5, FC6), and all interactions as fixed effects, with Age as a continuous covariate. A random intercept for each participant ((1 | ID)) was included to account for the nested structure of repeated measurements. Separate models were run for each dependent variable: P1 latency, P1 amplitude, N2 latency, N2 amplitude, and P1N2 peak-to-peak amplitude. Denominator degrees of freedom were estimated using the Satterthwaite approximation [26].
Sensitivity analysis using Monte Carlo simulations with the simr package in R [28] indicated that with N = 42, α = .05, and 80% power, the minimum detectable effect for the Group × RT interaction corresponded to Cohen’s f = 0.17 (partial η2 = 0.027). When significant main effects or interactions were observed in the primary analysis, follow-up post-hoc tests were conducted. To control for multiple comparisons, the Benjamini-Hochberg False Discovery Rate (FDR) procedure was applied separately to each family of post-hoc tests (e.g., comparisons between RT levels and between groups).
3. Results
The grand-averaged ERPs in response to auditory stimuli with different RTs showed the expected pattern for this age, with predominant P1 and N2 components for both the ASD and TD groups. Figure 1 illustrates the morphology and waveform patterns across different RT conditions.
3.1. P1 Amplitude
The linear mixed model (LMM) revealed a significant main effect of Group (F(1, 42) = 6.63, p = .014, η2p = .136) with ASD demonstrated significantly lower P1 amplitude compared to TD, a significant main effect of Hemisphere (F(1, 378) = 7.28, p = .007, η2p = .019) with larger P1 amplitude over the right hemisphere (mean = 3.74 µV) compared to the left (mean = 3.34 µV), and a significant main effect of RT (F(4, 378) = 2.42, p = .048, η2p = .025).
A significant Group × RT interaction was also observed (F(4, 378) = 3.29, p = .011, η2p = .034). Post hoc independent samples t tests across RT levels revealed lower P1 amplitude in ASD compared to TD at 15 ms (t(40) = –2.68, p(FDR) = .026) and at 60 ms (t(40) = –2.73, p(FDR) = .026), with a trend at 30 ms (t(40) = –2.09, p(raw) = .043, p(FDR) = .072). No significant group differences were observed at 120 ms (t(40) = –1.74, p(FDR) = .111) or 240 ms (t(40) = –0.85, p(FDR) = .400) (Table 1). Such a pattern of differences can be accounted for by an expected gradual decrease in TD children (e.g., 15 ms vs 60 ms (t(20) = 2.26, p(raw) = .035), 15 vs 120 ms (t(20) = 2.3, p(raw) = .032), 15 vs 240 ms (t(20) = 2.26, p(raw) = .035), which, however, did not survive our strict FDR-correction rule (see Supplementary). No such pattern was observed in children with ASD, whose P1 were stable and low across RT conditions (Figure 2 (A)).
3.2. P1 Latency
The LMM revealed significant main effects of RT (F(4, 378) = 24.79, p < .001, η2p = .208) and Hemisphere (F(1, 378) = 6.30, p = .013, η2p = .016) with longer P1 latency over the right hemisphere (mean = 117.1 ms) compared to the left (mean = 113.7 ms).
Pairwise comparisons of RT levels across the whole sample (paired t tests, FDR corrected for 10 comparisons) showed that P1 latency at 120 ms was longer than at 15 ms (t(41) = –3.72, p(FDR) = .001), at 30 ms (t(41) = –4.71, p(FDR) < .001), and at 60 ms (t(41) = –2.73, p(FDR) = .013). P1 latency at 240 ms was longer than at 15 ms (t(41) = –5.93, p(FDR) < .001), at 30 ms (t(41) = –7.81, p(FDR) < .001), at 60 ms (t(41) = –6.01, p(FDR) < .001), and at 120 ms (t(41) = –3.06, p(FDR) = .006). No other comparisons were significant (all p(FDR) > .05).
3.3. N2 Amplitude
The LMM revealed a significant main effect of Hemisphere (F(1, 378) = 5.26, p = .022, η2p = .014) with larger N2 amplitude over the right hemisphere (mean = –5.96 µV) compared to the left (mean = –5.53 µV) and a significant main effect of Age (F(1, 42) = 6.52, p = .014, η2p = .134).
Pearson correlation confirmed a significant negative relationship between age and mean N2 amplitude averaged across all RTs and electrodes (r = –0.366, p = .017), indicating increase in N2 amplitude with age.
3.4. N2 Latency
The LMM revealed a significant main effect of RT (F(4, 378) = 7.26, p < .001, η2p = .071) and a significant Group × RT interaction (F(4, 378) = 3.14, p = .015, η2p = .032).
Post hoc paired t-tests across the whole sample showed that N2 latency at 240 ms was longer than at 15 ms (t(41) = –3.16, p(FDR) = .015), at 60 ms (t(41) = –3.81, p(FDR) = .005), and at 120 ms (t(41) = –2.73, p(FDR) = .031). Post hoc independent samples t tests across RT levels showed a trend to longer N2 latencies in ASD at 30 ms (t(40) = 2.40, p(raw) = .021, p(FDR) = .106). No other comparisons were significant (Table 2). Within group paired comparisons (paired t tests, FDR corrected for 10 comparisons per group) revealed distinct patterns. In the TD group, N2 latency at 240 ms was longer than for all other shorter RT, with the most pronounced difference that reached FDR-correction being with 30 ms (t(20) = –3.40, p(FDR) = .029). In the ASD group, N2 latency at 240 ms was also longer but only for one shorter RT of 30 ms (t(20) = –3.21, p(FDR) = .022). In addition to these previously reported latency increases for longer RT in TD, ASD children demonstrated shorter N2 latency at 60 ms than at 30 ms (t(20) = 3.26, p(FDR) = .022), clearly contrasted with TD data.
3.5. P1N2
The LMM revealed significant main effects of RT (F(4, 378) = 4.23, p = .002, η2p = .043), Hemisphere (F(1, 378) = 23.31, p < .001, η2p = .058) with larger P1N2 amplitude over the right hemisphere (mean = 10.65 µV) compared to the left (mean = 9.72 µV), and Age (F(1, 42) = 4.67, p = .036, η2p = .100), with P1N2 increasing with age, as well as a significant Group × RT interaction (F(4, 378) = 2.74, p = .029, η2p = .028).
Post hoc pairwise comparisons of RT levels across the whole sample (paired t tests) revealed that P1N2 amplitude at 60 ms (t(41) = 3.62, p(FDR) = .008), at 120 ms (t(41) = 3.41, p(FDR) = .008), and at 240 ms (t(41) = 2.91, p(FDR) = .019) were significantly higher than at 15 ms. Within group paired comparisons (paired t tests, FDR corrected for 10 comparisons per group) for the Group × RT interaction revealed that in the TD group, P1N2 amplitude at 15 ms was higher than at 240 ms (t(20) = 3.81, p(FDR) = .011) and at 120 ms (t(20) = 3.49, p(FDR) = .012). In the ASD group, P1N2 amplitude at 60 ms was lower than at 15 ms (t(20) = 3.87, p(FDR) = .009) and at 30 ms (t(20) = 3.59, p(FDR) = .009). Post hoc group comparisons across RT levels revealed no significant differences (Table 3). No other comparisons were significant (all p > .05).
4. Discussion
This study is the first to investigate the neurophysiological correlates of auditory RT processing in children with ASD compared to their TD peers. For this purpose, ERPs to pure tones with varying RTs (15, 30, 60, 120, 240 ms) were recorded.
The main findings point to differences in how the auditory system responds across the RT continuum and processing stages in ASD compared to TD peers. While P1 latency modulation by RT, e.i. latency increases with increase in RT, was preserved in ASD, P1 amplitude did not show any sign of RT modulation, contrary to TD. Thus, the ASD atypicalities were observed starting from the earliest ERP component studied. In particular, ASD showed lower P1 responses specifically for shorter RTs (15–60 ms) compared to the TD group that might be triggered by the absence of P1 amplitude modulation in ASD, but not TD, who showed expected P1 amplitude decrease with increase in RT. For the N2 component - the RT modulated its latency, but differently for TD and ASD. In TD children, N2 latencies increased progressively with RT, while in ASD there was an atypical drop in latency for 30 vs 60 ms RT. The P1N2 amplitude also showed a slightly atypical pattern of RT modulation compared to TD. Together, these findings suggest that the deficit in ASD is not limited to a specific RT but reflects a more general difference in how neural responses are modulated across the RT range, most evident for rapid acoustic onsets (15–60 ms). We discuss these findings in detail below.
4.1. RT Processing in Early Childhood
Based on previous studies, investigating the neurophysiological processing of RT in children aged 4-10 years remains an underexplored area. Existing research in this age group has predominantly examined adult-like ERP components such as N1 and P2, as well as mismatch responses (MMN/MMR) in oddball paradigms (e.g., [12,14,29]). However, auditory cortex maturation in childhood is characterized by gradual changes in ERP morphology. In early and preschool years, the P1 and N2 components are more pronounced, while the N1 amplitude becomes clearly differentiated only by approximately 10-12 years of age [30]. This creates a methodological gap, as relying on “adult” markers (N1/P2) to assess RT processing in younger children may be suboptimal because these components are still immature and often poorly defined. Consequently, any investigation of auditory processing in this age range must consider both the developmental trajectory of ERP components and the potential modulating role of chronological age itself.
As expected, N1 and P2 components, which are the primary markers of RT effects in adults, were not yet well expressed in our pediatric sample, consistent with the known developmental trajectory of these components [30]. Other general age-related ERP changes were also confirmed in our study: N2 amplitude increased with age, consistent with reports that N2 amplitude grows during early and middle childhood, reaching a peak around 10–12 years of age [25,31]. The P1N2 measure also increased with age, consistent with the maturational trajectory of the underlying components. In contrast, no significant age-related changes were observed for P1 amplitude or latency, suggesting that early sensory registration (P1) undergoes its most pronounced changes earlier in childhood [32,33], whereas later integrative processes (N2) continue to develop through middle childhood [31]. Notably, all these developmental changes were not related to RT.
Another property of auditory processing that was observed in the present sample, irrespective of the diagnostic group, was the hemispheric asymmetry evident across multiple auditory responses: P1 amplitude, N2 amplitude, and the P1N2 measure were larger over the right hemisphere (FC6) compared to the left (FC5), and P1 latency was longer over the right hemisphere. Crucially, these hemispheric differences were not modulated by RT; they were present across all RTs and did not differ between groups. This pattern aligns with evidence that right-hemisphere auditory evoked responses discriminate temporal features of both speech and non-speech sounds [10], supporting the role of the right hemisphere in processing temporal sound characteristics. The absence of RT-dependent modulation of laterality suggests that hemispheric specialization in this context operates independently of the specific temporal structure of the stimulus, at least within the range of RTs tested.
Most important are patterns of RT modulation. In the present sample, the early cortical response (P1), reflecting basic sensory registration and sound detection [34,35,36], reliably encoded the temporal characteristics of stimulus onset. Consistent with previous findings in children [12], P1 latency increased with RT prolongation, with the longest latencies at 120 and 240 ms and shorter latencies at 15, 30, and 60 ms. P1 amplitude, in contrast, showed general amplitude decrease with RT prolongation, though within-group comparisons did not survive FDR correction, consistent with previous findings in block designs [12,37]. In contrast to P1, where both amplitude and latency were modulated by RT, the N2 component, associated with higher-order auditory processes, including stimulus evaluation, discrimination, and categorization [38,39], showed RT sensitivity primarily in its latency. N2 latencies were longer at the longest RT (240 ms) compared to shorter RTs, which is consistent with the general sensitivity of N2 to RT variation reported in children of age 7-11 [12]. N2 amplitude did not vary systematically across RTs, indicating that the magnitude of the later-stage neural response was not modulated by RT in a simple manner, while the peak-to-peak P1N2 amplitude was lower at longer RTs (120 and 240 ms) compared to the shorter RTs (15, 30 ms), pointing to expected increase with more gradual sound onsets (e.g., consistent with the earlier finding by Skinner and Jones (1968), who reported a reduction in the P1N2 complex with RT increase in adults). This suggests that the sensitivity of the P1N2 measure to RT duration is preserved across development, despite differences in age and experimental design.
4.2. Altered RT Processing of Shorter RTs in ASD
While the general properties of auditory processing described above were largely preserved across the whole sample, the two groups diverged in how neural responses were modulated across RTs. In TD children, the pattern of modulation followed the expected direction with longer RTs resulting in longer latencies and smaller amplitudes of ERP components [9,12,37]. In ASD the pattern of modulation was different which we compared with that of TD and seen in other neurodevelopmental disorders below.
As our study is the first to investigate RT processing in ASD using auditory ERP components, it is impossible to compare it with previous neurophysiological reports on this population. Previous research on RT processing in clinical pediatric populations has primarily focused on dyslexia and implicated oddball design, where rare deviant stimuli interspersed with frequent standard. The results of these studies regarding mismatch response are highly inconsistent [13,29,40]. Regarding the main ERP components in children with dyslexia, Stefanics et al. (2011) reported that P1 amplitude decreased with RT prolongation, and both P1 and N2 showed prolonged latencies with longer RTs (90 ms) in this clinical group but only in the oddball condition [12]. At the same time, these ERP components in the block design did not differ between children with dyslexia and their TD peers for the RT considered (15 and 90 ms). This pattern clearly diverges from what is seen in our ASD sample. In particular, P1 amplitude was reduced at shorter RTs (15–60 ms) compared to TD peers, indicating weaker encoding of rapid acoustic onsets in ASD. However, we should note that in our design stimuli with different RTs were presented within the same block with equal probability and quasirandomized order while in the study of Stefanics and colleagues, stimuli with different RTs were presented in different blocks. Our design might be more sensitive to the RT difference. At the same time, it is unlikely that children with dyslexia will show reduction in P1 when stimuli is intermixed as they showed increase in P1 for the deviant stimuli in oddball block. Comparisons of other components to previous data obtained in clinical groups are limited by differences in RT and study design. Thus, it remains a direction for future research to examine, for example, whether the atypical N2 latency drop from 30 to 60 ms RT is specific to ASD or reflects broader aspects of the study design. Nonetheless, these findings suggest that the neural mechanisms underlying RT processing deficits in ASD are distinct from those observed in dyslexia, where deficits have been primarily associated with phonological processing and reading difficulties. In ASD, the observed atypicalities in amplitude modulation across RTs, particularly the non-monotonic trajectory of P1N2 and the atypical N2 latency pattern, point to more generalized disruptions in temporal envelope processing that may affect the encoding of dynamic acoustic features, potentially contributing to the broader language and communication difficulties characteristic of ASD.
The convergence of these atypical patterns at the 30–60 ms window suggests a broader difficulty in processing the acoustic boundary between rapid and gradual onsets, rather than a deficit limited to a single component. In speech perception, RTs in this range are critical for distinguishing phonetic contrasts such as stops versus glides (e.g., /ba/ vs. /wa/) and affricates versus fricatives (e.g., /tʃ/ vs. /ʃ/) [3,4]. In TD children, the progressive increase in N2 latency and the gradual decrease in P1N2 amplitude across RTs suggest a smooth neural differentiation between these categories. In ASD, however, this differentiation appears disrupted across multiple components.
One possibility is that the observed pattern of difficulties in the phonetically relevant window in ASD is related to the heterogeneity of the autism spectrum disorder, in which auditory processing profiles likely vary across individuals. In the present sample, children with ASD ranged from minimally verbal to fluent speech. Prosodic processing, which is associated with longer rise times, typically requires more developed language skills and can be most evident in verbally fluent individuals. Thus, the absence of group differences at longer RTs (120–240 ms) may reflect the wide range of language abilities in the ASD group, where subgroup-specific effects could be masked at the group level. Future studies with language-matched designs are needed to clarify whether longer RT processing is differentially affected in verbally fluent versus minimally verbal children with ASD.
Another mechanism that may contribute to the atypical pattern at shorter RTs is the rate of acoustic energy accumulation. Shorter RTs correspond to abrupt increases in sound intensity, placing high demands on early sensory registration. In ASD, such rapid energy onsets may overwhelm the system, leading to reduced early cortical responses (P1). This aligns with evidence from studies showing reduced P1 amplitude in response to simple sounds in ASD, as well as impaired modulation of P1 with changing stimulation rate and reduced habituation in ASD [41,42]. By 60 ms, the energy accumulation is already slower, and processing should become less demanding. However, this is where children with ASD showed the most pronounced deviation in N2 latency and P1N2 amplitude that might suggest a compensatory nature of the effect. Thus, the difficulty in ASD is not simply a matter of handling high-energy onsets, but rather a problem in adjusting processing dynamics when the acoustic input changes. The atypical P1N2 trajectory in ASD – decreasing at 60 ms but then tendency to rise at longer RTs, unlike the continued decrease in TD – further points to a disruption in the expected pattern of modulation across the RT continuum. This interpretation aligns with the hypothesis of atypical temporal envelope processing in ASD [15] and with reports that such difficulties are already detectable at the level of simple tone perception [41,43]. Importantly, auditory abilities in ASD are characterised by considerable individual variability [43,44], and different auditory parameters may be processed by distinct neural mechanisms, with their disruption in ASD not being uniform across domains [43]. The present findings extend this view by showing that within a single temporal parameter – RT – the pattern of modulation across RT durations is also disrupted in a non-uniform manner, with the pronounced deviation occurring at the transition between rapid and gradual onsets.
5. Conclusions
This study provides the first evidence of atypical auditory RT processing in children with autism spectrum disorder compared to typically developing peers using a passive block design with a range of RTs from 15 to 240 ms.
The ASD group showed a qualitatively different profile of neural modulation: early sensory responses (P1) lacked the typical amplitude decrease with RT, and later processes (N2 latency, P1N2 amplitude) deviated from the typical progression specifically between 15 and 60 ms. This disruption was most pronounced at the transition from abrupt to gradual onsets (60 ms), where the expected differentiation of acoustic cues appeared altered. Notably, cortical responses to the most gradual onsets did not differ between groups, suggesting that the temporal envelope processing deficit in ASD is selective rather than global.
These findings provide electrophysiological evidence for atypical processing of auditory temporal-envelope cues in ASD, demonstrating that such differences can be detected at the level of cortical responses to simple non-speech sounds. More broadly, the results highlight the importance of considering the entire temporal range when investigating auditory processing in ASD, as atypicalities may not be uniform across RTs. Future research should adopt longitudinal designs to examine whether early delays in neural evaluation predict later outcomes in ASD.
6. Limitations
Several limitations of the present study should be acknowledged. First, the sample size (N = 42, with 21 children per group) is comparable to many studies in developmental neurophysiology, but it remains relatively modest. Thus, replication in larger cohorts is necessary to confirm the reliability of the findings, particularly for effects that did not survive FDR correction. Second, despite careful artifact rejection and adaptive peak detection procedures, the analysis of ERP components in pediatric populations is inherently challenging due to increased noise levels and inter-individual variability in waveform morphology. This should be considered when interpreting null findings. Third, the cross-sectional design precludes any conclusions about causality or developmental trajectories. While we observed age-related changes in N2 amplitude and specific differences in the ASD group, longitudinal studies are needed to determine whether early auditory processing differences predict later developmental outcomes and to characterize the maturational trajectories of these neural markers, which can be specific in groups with neurodevelopmental disorders. Forth, the age range of 4–10 years represents a period of rapid auditory cortical development [30], and the relatively small sample per group may have reduced sensitivity to detecting age-related interactions or more subtle group differences. Although we included age as a covariate in our statistical models, future studies with larger samples and more narrowly defined age bands would be valuable to characterize the developmental trajectory of RT processing in ASD. Fifth, we acknowledge that the heterogeneity of the ASD sample, with children ranging from minimally verbal to fluent speech and with varying SRS-2 scores (including some below the clinical threshold), may have masked subgroup-specific effects. While all participants had confirmed ADOS-2 diagnoses, future studies with larger samples and language-matched designs are needed to clarify whether the observed electrophysiological patterns correlate with specific clinical features such as language ability or social-communication severity, and whether longer RT processing is differentially affected in verbally fluent versus minimally verbal children with ASD.
Supplementary Materials
The following supporting information can be downloaded at the website of this paper posted on Preprints.org, Figure S1: P1 topography for all rise times in ASD and TD groups; Figure S2: N2 topography for all rise times in ASD and TD groups; Table D1: Demographic characteristics and SRS-2 scores for age- and sex-matched pairs of children with ASD and TD peers; Table L1: Linear mixed model results for P1 amplitude; Table L2: Linear mixed model results for P1 latency; Table L3: Linear mixed model results for N2 latency; Table L4: Linear mixed model results for N2 amplitude; Table L5: Linear mixed model results for P1N2 amplitude; Table S1: Pairwise comparisons of P1 amplitude across rise time levels (whole sample); Table S2: Pairwise comparisons of P1 amplitude across rise time levels within ASD group; Table S3: Pairwise comparisons of P1 amplitude across rise time levels within TD group; Table S4: Pairwise comparisons of P1 latency across rise time levels (whole sample); Table S5: Pairwise comparisons of N2 latency across rise time levels (whole sample); Table S6: Pairwise comparisons of N2 latency across rise time levels within ASD group; Table S7: Pairwise comparisons of N2 latency across rise time levels within TD group; Table S8: Pairwise comparisons of P1N2 amplitude across rise time levels (whole sample); Table S9: Pairwise comparisons of P1N2 amplitude across rise time levels within ASD group; Table S10: Pairwise comparisons of P1N2 amplitude across rise time levels within TD group.
Author Contributions
V.M.: Conceptualisation, data collection, data analysis, writing of original draft, editing; D.K.: Conceptualisation, design, data collection, visualisation, review, editing; O.S.:Funding, conceptualisation, design, management, review and editing. All authors read and approved the final version of the manuscript.
Funding
Supported by the Ministry of Science and Higher Education of the Russian Federation, (Agreement 075-10-2025-017 from 27.02.2025).
Institutional Review Board Statement
This research was carried out with the approval of the Sirius University Bioethics Committee (Bioethics Committee Opinion dated 13 July 2022) and in line with the principles of the Declaration of Helsinki.
Informed Consent Statement
Prior to data collection, written informed consent was provided by the participants’ parents or guardians, and verbal assent was obtained from each child participant.
Data Availability Statement
The EEG data supporting the findings of this study are available in the Open Science Framework (OSF) repository at https://osf.io/ycfvr/overview. The data are publicly accessible under a Creative Commons Attribution 4.0 International (CC-BY 4.0) license.
Acknowledgments
The authors thank Anton Rogachev, Vladimir Lipatov, Anna Vasilieva, Polina Pavlova, Vladilena Machneva, and Valeria Matyusha for their assistance with data collection. Special thanks to Ekaterina Kochetkova for statistical consultation. We are also grateful to all children and their parents who participated in the study.
Conflicts of Interest
The authors declare no conflicts of interest. The funders had no role in the design of the study; in the collection, analyses, or interpretation of data; in the writing of the manuscript; or in the decision to publish the results.
Abbreviations
The following abbreviations are used in this manuscript:
| RT | Rise time |
| ERP | Event-related potential |
| EEG | Electroencephalography |
| ASD | Autism spectrum disorder |
| TD | Typically developing |
| MMN | Mismatch negativity |
References
- Kalashnikova, M.; Goswami, U.; Burnham, D. Sensitivity to Amplitude Envelope Rise Time in Infancy and Vocabulary Development at 3 Years: A Significant Relationship. Dev. Sci. 2019, 22, e12836. [Google Scholar] [CrossRef] [PubMed]
- Phillips, D.P.; Hall, S.E.; Boehnke, S.E. Central Auditory Onset Responses, and Temporal Asymmetries in Auditory Perception. Hear. Res. 2002, 167, 192–205. [Google Scholar] [CrossRef] [PubMed]
- Walsh, M.A.; Diehl, R.L. Formant Transition Duration and Amplitude Rise Time as Cues to the Stop/Glide Distinction. Q. J. Exp. Psychol. Sect. A 1991, 43, 603–620. [Google Scholar] [CrossRef] [PubMed]
- Howell, P.; Rosen, S. Production and Perception of Rise Time in the Voiceless Affricate/Fricative Distinction. J. Acoust. Soc. Am. 1983, 73, 976–984. [Google Scholar] [CrossRef] [PubMed]
- Leong, V.; Hämäläinen, J.; Soltész, F.; Goswami, U. Rise Time Perception and Detection of Syllable Stress in Adults with Developmental Dyslexia. J. Mem. Lang. 2011, 64, 59–73. [Google Scholar] [CrossRef]
- Leong, V.; Goswami, U. Assessment of Rhythmic Entrainment at Multiple Timescales in Dyslexia: Evidence for Disruption to Syllable Timing. Hear. Res. 2014, 308, 141–161. [Google Scholar] [CrossRef] [PubMed]
- Byrd, D.; Saltzman, E. Intragestural Dynamics of Multiple Prosodic Boundaries. J. Phon. 1998, 26, 173–199. [Google Scholar] [CrossRef]
- Cho, T.; Ladefoged, P. Variation and Universals in VOT: Evidence from 18 Languages. J. Phon. 1999, 27, 207–229. [Google Scholar] [CrossRef]
- Manasevich, V.; Kostanian, D.; Rogachev, A.; Sysoeva, O. EEG Correlates of Auditory Rise Time Processing: A Systematic Review. 2026. [Google Scholar] [CrossRef]
- Molfese, D.L.; Molfese, V.J. Right-Hemisphere Responses from Preschool Children to Temporal Cues to Speech and Nonspeech Materials: Electrophysiological Correlates. Brain Lang. 1988, 33, 245–259. [Google Scholar] [CrossRef] [PubMed]
- De Sanctis, P. Right Hemispheric Contributions to Fine Auditory Temporal Discriminations: High-Density Electrical Mapping of the Duration Mismatch Negativity (MMN). Front. Integr. Neurosci. 2009, 3. [Google Scholar] [CrossRef] [PubMed]
- Stefanics, G.; Fosker, T.; Huss, M.; Mead, N.; Szucs, D.; Goswami, U. Auditory Sensory Deficits in Developmental Dyslexia: A Longitudinal ERP Study. NEUROIMAGE 2011, 57, 723–732. [Google Scholar] [CrossRef] [PubMed]
- Hämäläinen, J.A.; Leppänen, P.H.T.; Guttorm, T.K.; Lyytinen, H. Event-Related Potentials to Pitch and Rise Time Change in Children with Reading Disabilities and Typically Reading Children. Clin. Neurophysiol. 2008, 119, 100–115. [Google Scholar] [CrossRef] [PubMed]
- Peter, V.; Kalashnikova, M.; Burnhammarcs, D. Neural Processing of Amplitude and Formant Rise Time in Dyslexia. Dev. Cogn. Neurosci. 2016, 19, 152–163. [Google Scholar] [CrossRef] [PubMed]
- Alcántara, J.I.; Cope, T.E.; Cope, W.; Weisblatt, E.J. Auditory Temporal-Envelope Processing in High-Functioning Children with Autism Spectrum Disorder. Neuropsychologia 2012, 50, 1235–1251. [Google Scholar] [CrossRef] [PubMed]
- Dynia, J.M.; Bean, A.; Justice, L.M.; Kaderavek, J.N. Phonological Awareness Emergence in Preschool Children with Autism Spectrum Disorder. Autism Dev. Lang. Impair. 2019, 4, 2396941518822453. [Google Scholar] [CrossRef]
- Lord, Catherine; Rutter, Michael; DiLavore, Pamela C; Risi, Susan; Gotham, Katherine; Bishop, Somer L. Autism Diagnostic Observation Schedule, Second Edition (ADOS-2); Western Psychological Services, 2012. [Google Scholar]
- Rutter, Michael; Le Couteur, Ann; Lord, Catherine. Autism Diagnostic Interview-Revised (ADI-R); Western Psychological Services: Los Angeles, CA, 2003. [Google Scholar]
- Falkmer, T.; Anderson, K.; Falkmer, M.; Horlin, C. Diagnostic Procedures in Autism Spectrum Disorders: A Systematic Literature Review. Eur. Child Adolesc. Psychiatry 2013, 22, 329–340. [Google Scholar] [CrossRef] [PubMed]
- Constantino, John N.; Gruber, Christian P. Social Responsiveness Scale, Second Edition (SRS-2); Western Psychological Services: Torrance, CA, 2012. [Google Scholar]
- Constantino, J.N.; Davis, S.A.; Todd, R.D.; Schindler, M.K.; Gross, M.M.; Brophy, S.L.; Metzger, L.M.; Shoushtari, C.S.; Splinter, R.; Reich, W. Validation of a brief quantitative measure of autistic traits: comparison of the social responsiveness scale with the autism diagnostic interview-revised. J. Autism Dev. Disord. 2003, 33, 427–433. [Google Scholar] [CrossRef] [PubMed]
- Picton, T.W.; Bentin, S.; Berg, P.; Donchin, E.; Hillyard, S.A.; Johnson, R.; Miller, G.A.; Ritter, W.; Ruchkin, D.S.; Rugg, M.D.; et al. Guidelines for Using Human Event-related Potentials to Study Cognition: Recording Standards and Publication Criteria. Psychophysiology 2000, 37, 127–152. [Google Scholar] [CrossRef]
- Luck, S.J. An Introduction to the Event-Related Potential Technique; A Bradford book; 2. edition.; MIT Press: Cambridge, Mass, 2014; ISBN 978-0-262-52585-5. [Google Scholar]
- Čeponiene, R.; Rinne, T.; Näätänen, R. Maturation of Cortical Sound Processing as Indexed by Event-Related Potentials. Clin. Neurophysiol. 2002, 113, 870–882. [Google Scholar] [CrossRef] [PubMed]
- Ponton, C.W.; Eggermont, J.J.; Kwong, B.; Don, M. Maturation of Human Central Auditory System Activity: Evidence from Multi-Channel Evoked Potentials. Clin. Neurophysiol. 2000, 111, 220–236. [Google Scholar] [CrossRef] [PubMed]
- Bates, D.; Mächler, M.; Bolker, B.; Walker, S. Fitting Linear Mixed-Effects Models Using Lme4. J. Stat. Soft. 2015, 67. [Google Scholar] [CrossRef]
- Kuznetsova, A.; Brockhoff, P.B.; Christensen, R.H.B. lmerTest Package: Tests in Linear Mixed Effects Models. J. Stat. Soft. 2017, 82. [Google Scholar] [CrossRef]
- Green, P.; MacLeod, C.J. SIMR: An R Package for Power Analysis of Generalized Linear Mixed Models by Simulation. Methods Ecol. Evol. 2016, 7, 493–498. [Google Scholar] [CrossRef]
- Plakas, A.; van Zuijen, T.; van Leeuwen, T.; Thomson, J.; van der Leij, A. Impaired Non-Speech Auditory Processing at a Pre-Reading Age Is a Risk-Factor for Dyslexia but Not a Predictor: An ERP Study. CORTEX 2013, 49, 1034–1045. [Google Scholar] [CrossRef] [PubMed]
- Bishop, D.V.M.; Anderson, M.; Reid, C.; Fox, A.M. Auditory Development between 7 and 11 Years: An Event-Related Potential (ERP) Study. PLoS ONE 2011, 6, e18993. [Google Scholar] [CrossRef] [PubMed]
- Wunderlich, J.L.; Cone-Wesson, B.K. Maturation of CAEP in Infants and Children: A Review. Hear. Res. 2006, 212, 212–223. [Google Scholar] [CrossRef] [PubMed]
- Navarrete-Arroyo, S.; Putkinen, V.; Kujala, T.; Virtala, P. Maturation of Speech-Elicited Event-Related Potentials from Birth to 28 Months: Typical Development with Minor Effects of Dyslexia Risk. Biol. Psychol. 2025, 198, 109050. [Google Scholar] [CrossRef] [PubMed]
- Sharma, A.; Glick, H.; Campbell, J.; Biever, A. Central Auditory Development in Children with Hearing Impairment: Clinical Relevance of the P1 CAEP Biomarker in Children with Multiple Disabilities. Hear. Balance Commun. 2013, 11, 110–120. [Google Scholar] [CrossRef] [PubMed]
- Godey, B.; Schwartz, D.; De Graaf, J.B.; Chauvel, P.; Liégeois-Chauvel, C. Neuromagnetic Source Localization of Auditory Evoked Fields and Intracerebral Evoked Potentials: A Comparison of Data in the Same Patients. Clin. Neurophysiol. 2001, 112, 1850–1859. [Google Scholar] [CrossRef] [PubMed]
- Butler, B.E.; Trainor, L.J. Sequencing the Cortical Processing of Pitch-Evoking Stimuli Using EEG Analysis and Source Estimation. Front. Psychol. 2012, 3. [Google Scholar] [CrossRef] [PubMed]
- Zoellner, S.; Benner, J.; Zeidler, B.; Seither-Preisler, A.; Christiner, M.; Seitz, A.; Goebel, R.; Heinecke, A.; Wengenroth, M.; Blatow, M.; et al. Reduced Cortical Thickness in Heschl’s Gyrus as an in Vivo Marker for Human Primary Auditory Cortex. Hum. Brain Mapp. 2019, 40, 1139–1154. [Google Scholar] [CrossRef] [PubMed]
- Skinner, P.H.; Jones, H.C. Effects of Signal Duration and Rise Time on the Auditory Evoked Potential. J. Speech Hearing Res.> 1968, 11, 301–306. [Google Scholar] [CrossRef] [PubMed]
- Näätänen, R.; Paavilainen, P.; Rinne, T.; Alho, K. The Mismatch Negativity (MMN) in Basic Research of Central Auditory Processing: A Review. Clin. Neurophysiol. 2007, 118, 2544–2590. [Google Scholar] [CrossRef] [PubMed]
- Folstein, J.R.; Van Petten, C. Influence of Cognitive Control and Mismatch on the N2 Component of the ERP: A Review. Psychophysiology 2008, 45, 152–170. [Google Scholar] [CrossRef] [PubMed]
- Hakvoort, B.; Van Der Leij, A.; Maurits, N.; Maassen, B.; Van Zuijen, T.L. Basic Auditory Processing Is Related to Familial Risk, Not to Reading Fluency: An ERP Study. Cortex 2015, 63, 90–103. [Google Scholar] [CrossRef] [PubMed]
- Rotschafer, S.E. Auditory Discrimination in Autism Spectrum Disorder. Front. Neurosci. 2021, 15, 651209. [Google Scholar] [CrossRef] [PubMed]
- Gonçalves, A.M.; Monteiro, P. Autism Spectrum Disorder and Auditory Sensory Alterations: A Systematic Review on the Integrity of Cognitive and Neuronal Functions Related to Auditory Processing. J. Neural Transm. 2023, 130, 325–408. [Google Scholar] [CrossRef] [PubMed]
- Kargas, N.; López, B.; Reddy, V.; Morris, P. The Relationship Between Auditory Processing and Restricted, Repetitive Behaviors in Adults with Autism Spectrum Disorders. J. Autism Dev. Disord. 2015, 45, 658–668. [Google Scholar] [CrossRef] [PubMed]
- O’Connor, K. Auditory Processing in Autism Spectrum Disorder: A Review. Neurosci. Biobehav. Rev. 2012, 36, 836–854. [Google Scholar] [CrossRef] [PubMed]
Figure 1.
Event-related potentials (ERPs) on averaged FC5 and FC6 channels of Typical development (TD, blue line), and Autism Spectrum Disorder (ASD, red line) groups in different rise time (RT) conditions: A) 15 ms, B) 30 ms, C) 60 ms, D) 120 ms, E) 240 ms. Shading corresponds to 95% confidence level. Bars over x-axis indicate time windows, in which peaks were detected (Violet - P1, Green - N2).
Figure 1.
Event-related potentials (ERPs) on averaged FC5 and FC6 channels of Typical development (TD, blue line), and Autism Spectrum Disorder (ASD, red line) groups in different rise time (RT) conditions: A) 15 ms, B) 30 ms, C) 60 ms, D) 120 ms, E) 240 ms. Shading corresponds to 95% confidence level. Bars over x-axis indicate time windows, in which peaks were detected (Violet - P1, Green - N2).
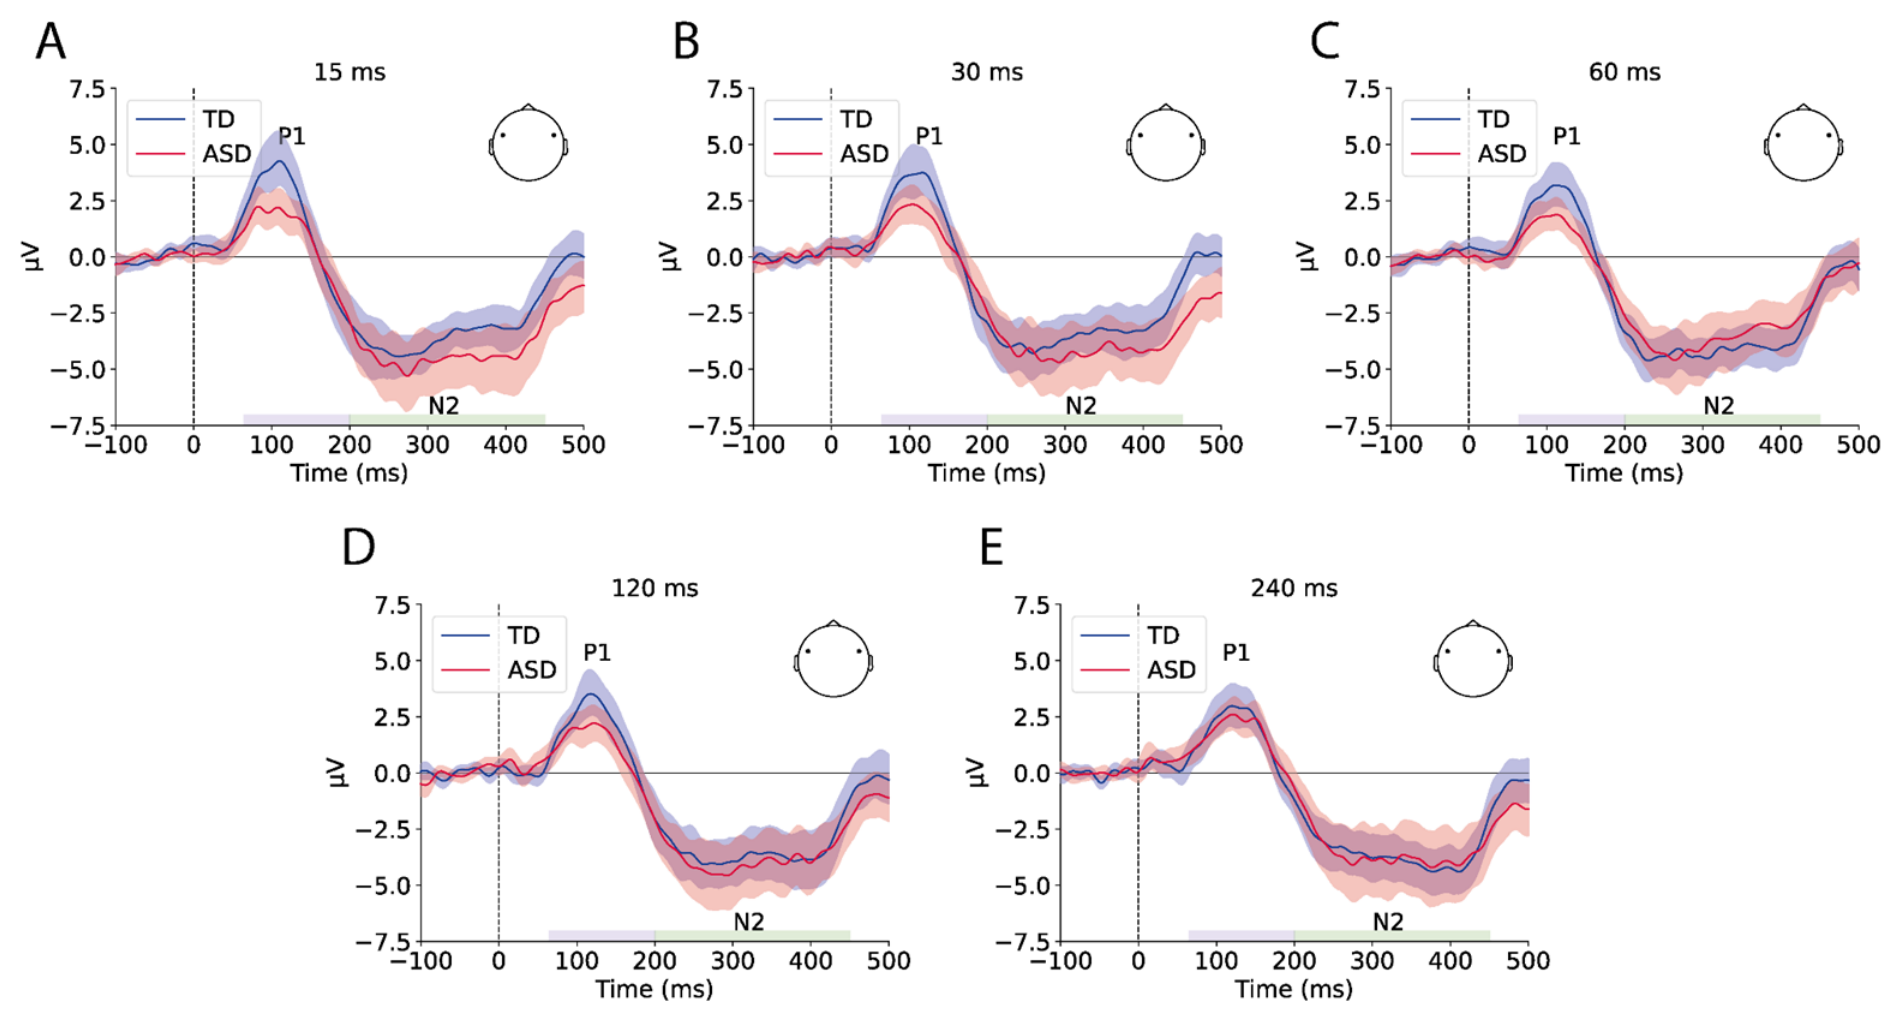
Figure 2.
Group differences in P1 amplitude, N2 latency, and P1N2 amplitude across RTs (15–240 ms). (A) Reduced P1 amplitude in ASD compared to TD observed at 15, 30, and 60 ms RT conditions. (B) The different patterns of N2 change in ASD and TD groups. (C) The different patterns of P1N2 change in ASD and TD groups. Asterisks denote the level of statistical significance (*p* < .05, **p* < .01, ***p* < .001 with FDR-correction).
Figure 2.
Group differences in P1 amplitude, N2 latency, and P1N2 amplitude across RTs (15–240 ms). (A) Reduced P1 amplitude in ASD compared to TD observed at 15, 30, and 60 ms RT conditions. (B) The different patterns of N2 change in ASD and TD groups. (C) The different patterns of P1N2 change in ASD and TD groups. Asterisks denote the level of statistical significance (*p* < .05, **p* < .01, ***p* < .001 with FDR-correction).
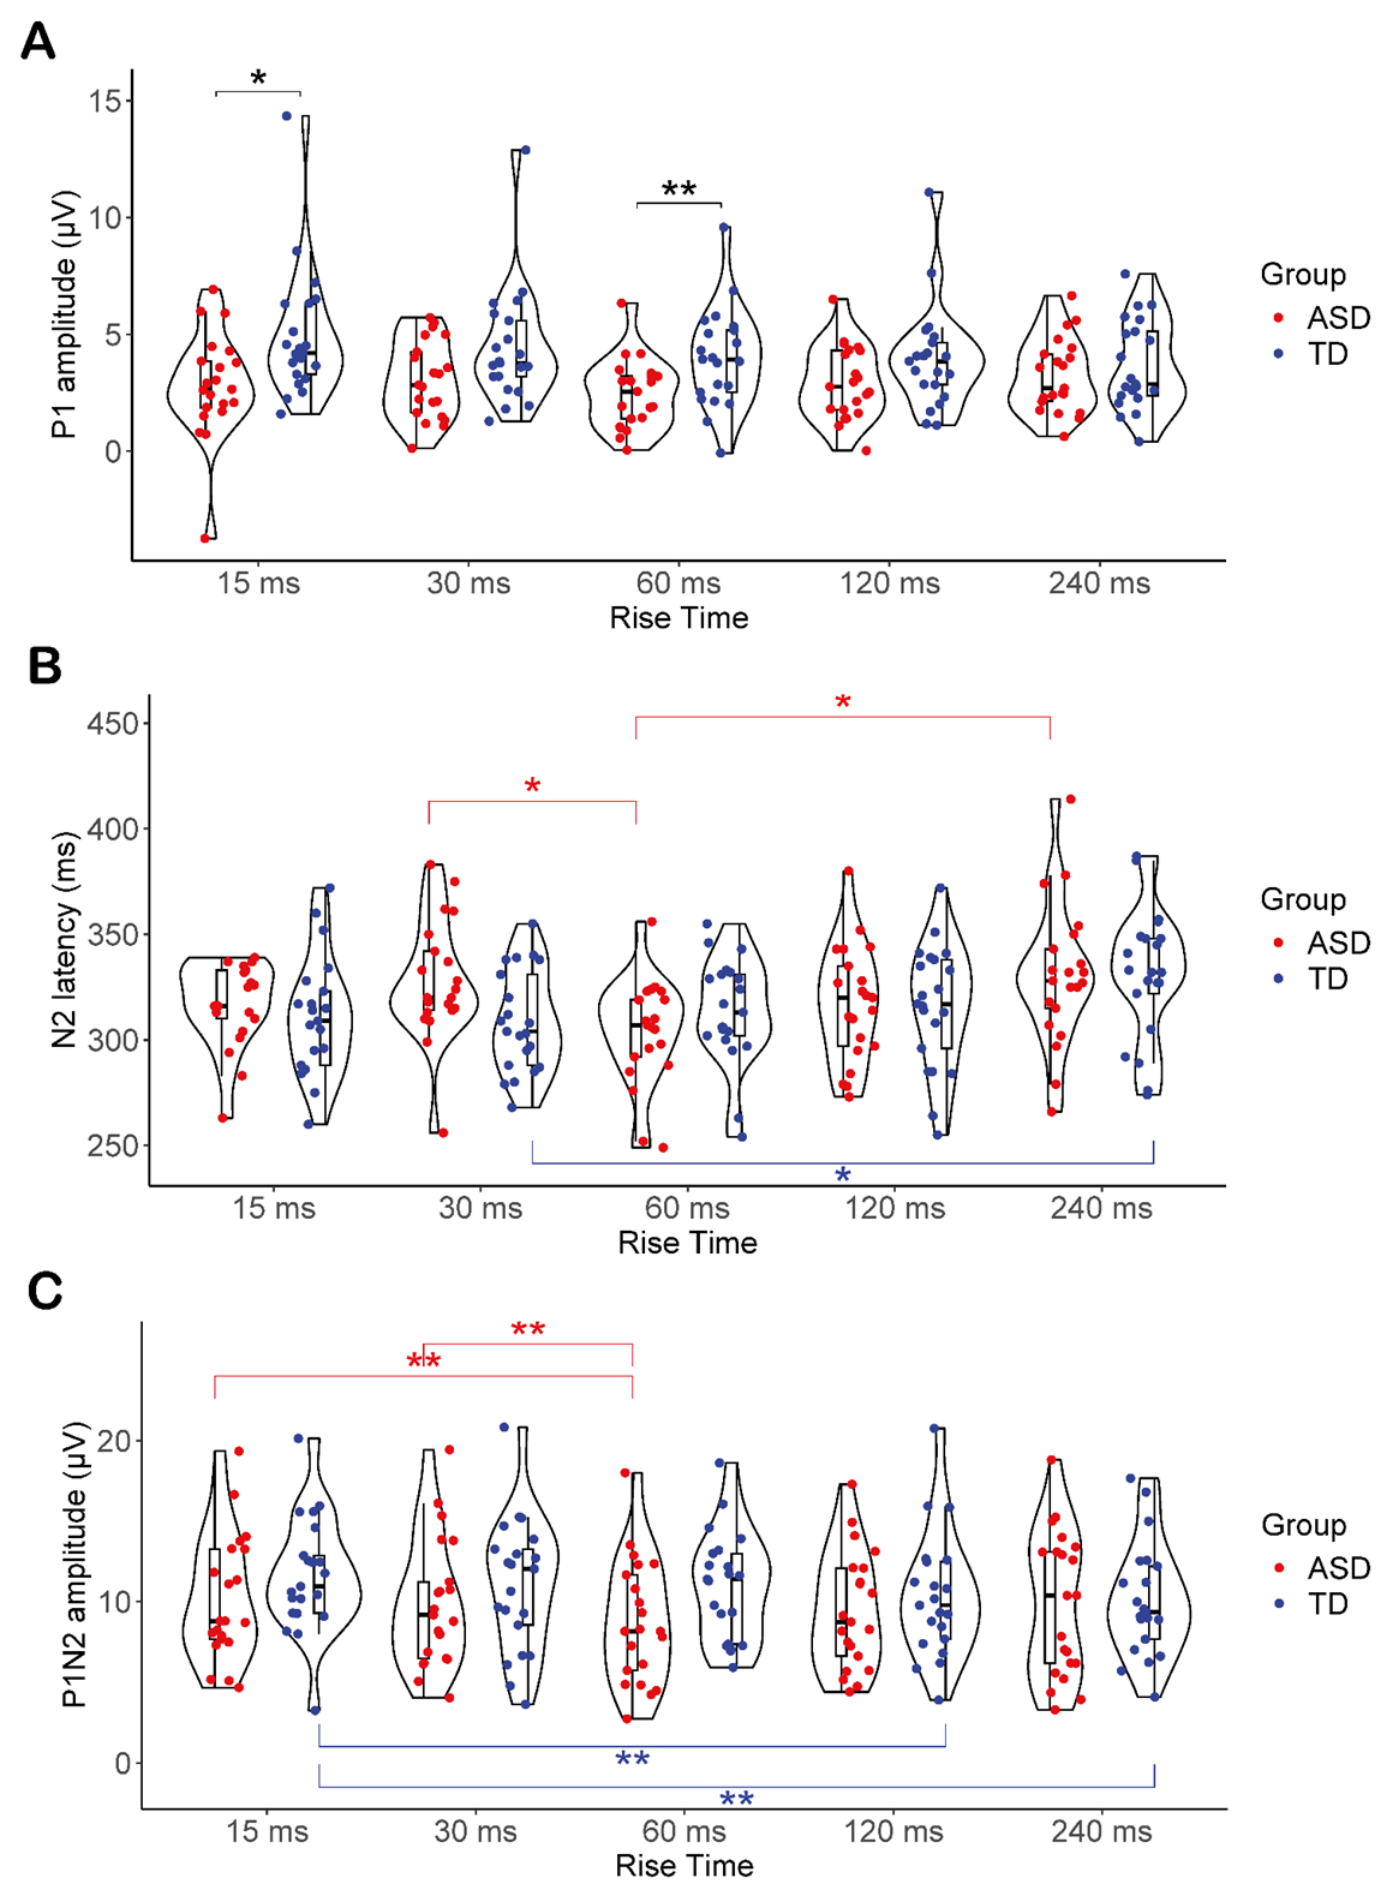

Table 1.
Group comparisons (ASD vs TD) for P1 amplitude.
| RT (ms) | ASD Mean (µV) | TD Mean (µV) | t | df | p(raw) | p(FDR) |
|---|---|---|---|---|---|---|
| 15 | 2.83 | 4.92 | -2.68 | 40 | .011 | .026 |
| 30 | 3.04 | 4.40 | -2.09 | 40 | .043 | .072 |
| 60 | 2.45 | 3.98 | -2.73 | 40 | .010 | 0.026 |
| 120 | 2.92 | 3.96 | -1.74 | 40 | .089 | .111 |
| 240 | 3.22 | 3.68 | -0.85 | 40 | .400 | .400 |
Table 2.
Group comparisons (ASD vs TD) for N2 latency.
| RT (ms) | ASD Mean (ms) | TD Mean (ms) | t | df | p(raw) | p(FDR) |
|---|---|---|---|---|---|---|
| 15 | 317.10 | 311.00 | 0.86 | 40 | .394 | .657 |
| 30 | 327.90 | 308.00 | 2.40 | 40 | .021 | .106 |
| 60 | 303.86 | 313.95 | -1.25 | 40 | .217 | .543 |
| 120 | 317.05 | 315.90 | 0.14 | 40 | .889 | .931 |
| 240 | 330.24 | 330.95 | -0.09 | 40 | .931 | .931 |
Table 3.
Group comparisons (ASD vs TD) for P1N2 amplitude.
| RT | ASD Mean (µV) | TD Mean (µV) | t | df | p(raw) | p(FDR) |
|---|---|---|---|---|---|---|
| 15 | 10.12 | 11.60 | -1.28 | 40 | .208 | .521 |
| 30 | 9.84 | 11.00 | -0.93 | 40 | .359 | .551 |
| 60 | 8.74 | 11.00 | -2.00 | 40 | .052 | .262 |
| 120 | 9.43 | 10.30 | -0.78 | 40 | .441 | .551 |
| 240 | 9.78 | 10.10 | -0.22 | 40 | .824 | .824 |
Disclaimer/Publisher’s Note: The statements, opinions and data contained in all publications are solely those of the individual author(s) and contributor(s) and not of MDPI and/or the editor(s). MDPI and/or the editor(s) disclaim responsibility for any injury to people or property resulting from any ideas, methods, instructions or products referred to in the content. |
© 2026 by the authors. Licensee MDPI, Basel, Switzerland. This article is an open access article distributed under the terms and conditions of the Creative Commons Attribution (CC BY) license (http://creativecommons.org/licenses/by/4.0/).
Copyright: This open access article is published under a Creative Commons CC BY 4.0 license, which permit the free download, distribution, and reuse, provided that the author and preprint are cited in any reuse.


