

Submitted:
06 August 2026
Posted:
07 August 2026
You are already at the latest version
Abstract
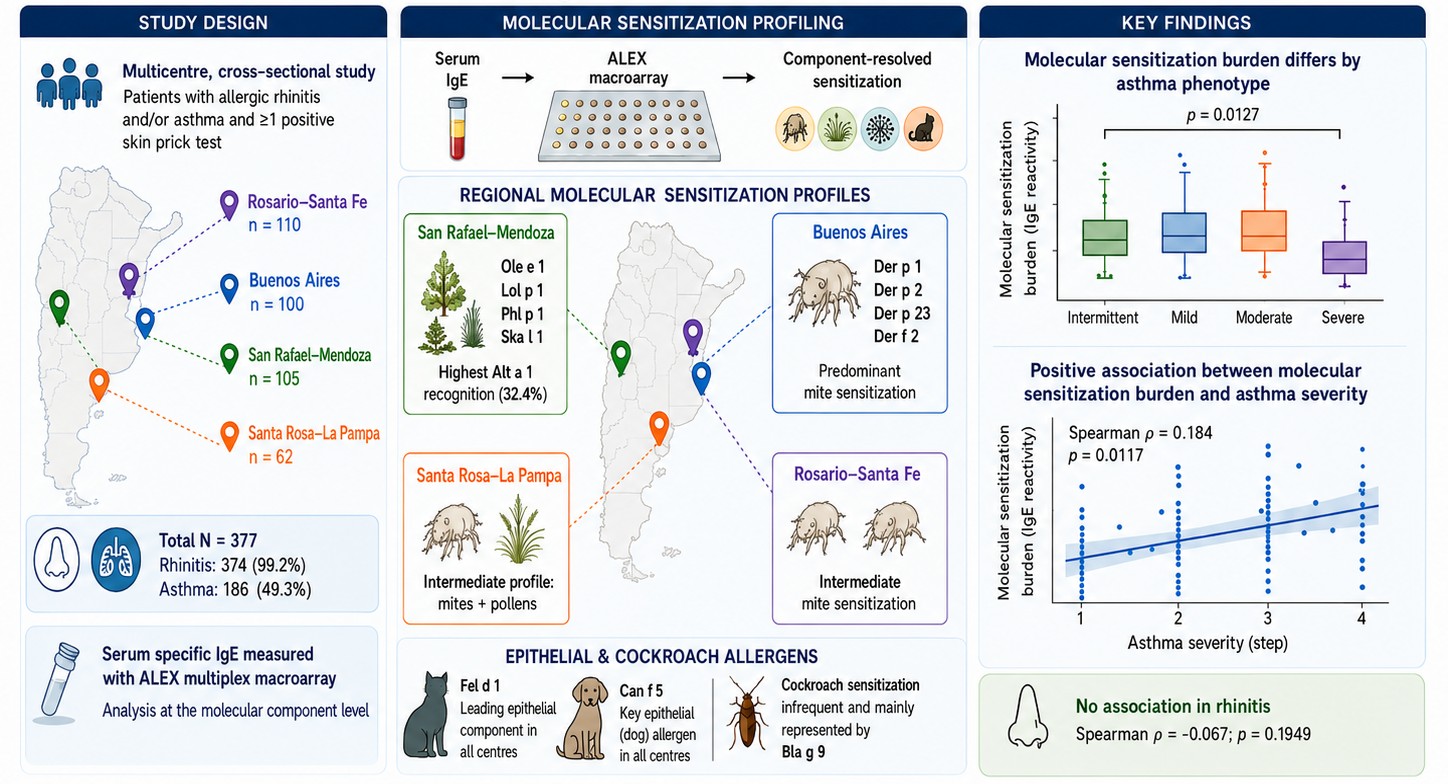
Background: The distribution of airborne allergens varies across climatic and ecological settings and may shape region-specific molecular sensitization profiles. Objective: To characterize component-level IgE sensitization in patients with allergic rhinitis and/or asthma recruited in four Argentine locations and to explore its relationship with clinical phenotype. Methods: This multicentre cross-sectional study included 377 patients with respiratory allergy and at least one positive skin prick test. Serum specific IgE was measured using an ALEX multiplex. Regional profiles were summarized by allergen source and molec-ular component. The molecular sensitization burden across clinical phenotypes was assessed using Kruskal-Wallis tests and Spearman rank correlation. Results: The cohort comprised 100 patients from Buenos Aires, 105 from San Ra-fael-Mendoza, 62 from Santa Rosa-La Pampa, and 110 from Rosario-Santa Fe; 374 had allergic rhinitis and 186 had asthma. Mite components predominated in Buenos Aires, where Der p 1, Der p 2, Der p 23, and Der f 2. Rosario-Santa Fe and Santa Rosa-La Pampa showed intermediate mite sensitization. San Rafael-Mendoza displayed a pol-len-dominant pattern, led by Ole e 1, Lol p 1, Phl p 1, and Sal k 1, together with the highest frequency of Alt a 1 recognition (32.4%). Fel d 1 was the leading epithelial component in all centres, whereas cockroach sensitization was infrequent and mainly represented by Bla g 9. Molecular sensitization burden differed across asthma pheno-types (p=0.0127) and showed a weak positive monotonic association with asthma se-verity (Spearman ρ=0.184, p=0.0117). No corresponding association was observed for rhinitis (ρ=-0.067, p=0.1949). Conclusions: Molecular profiling identified marked regional heterogeneity in aeroal-lergen sensitization across Argentina. These findings support geographically informed diagnostic assessment while emphasizing that molecular sensitization represents only one component of the broader allergen exposome.
Keywords:
aeroallergens
; allergen exposome
; component-resolved diagnosis
; allergic rhinitis
; asthma
; molecular sensitization
; Argentina
1. Introduction
Allergic rhinitis and asthma are common chronic respiratory disorders whose expression reflects interactions between host susceptibility and environmental exposure. In Argentina, a national cross-sectional survey reported self-reported allergic rhinitis symptoms in 20.5% of participants aged 5-44 years, while paediatric studies have shown substantial geographical variability in rhinoconjunctivitis and asthma symptoms [1,2,3]. Local clinical series also indicate that aeroallergen sensitization is frequent among symptomatic children, although the relative contribution of mites, pollens, molds, and animal allergens differs between populations [4].
Environmental determinants are particularly relevant for airborne allergies. Temperature, precipitation, humidity, vegetation, land use, urbanization, and air pollution influence the abundance, seasonality, dispersion, and allergenic properties of pollen, fungal spores, and indoor allergens [5,6,7]. Argentina encompasses humid subtropical, temperate, semiarid, and arid environments over a large latitudinal and altitudinal range. Aerobiological observations have documented substantial regional and seasonal diversity but coordinated clinical-molecular data remain limited [5].
The exposome was introduced to describe the totality of non-genetic exposures across the life course [8]. In allergy, the external exposome includes aeroallergens, pollutants, climate, biodiversity, microbial environments, and lifestyle-related factors, whereas the internal exposome includes biological responses such as inflammation, oxidative stress, and immune regulation [9,10]. The present study does not measure the complete exposome. Rather, the serum IgE repertoire is interpreted as a biological imprint of one specific component of the external exposome: exposure and sensitization to airborne allergens.
Multiplex molecular diagnostics can simultaneously characterize IgE recognition of allergen extracts and individual components, helping distinguish genuine source sensitization from cross-reactivity and improving the resolution of geographical comparisons [11,12,13]. Previous studies used molecular mapping to examine the allergen exposome across atopic phenotypes and climate-matched populations, identifying marked differences in the contribution of major, mid-tier, and cross-reactive allergen molecules [11,12]. A subsequent multicentre study across four Peruvian cities further demonstrated that molecular sensitization patterns may vary according to regional climate classification [13].
Against this background, the objective of the present multicentre study was to characterize molecular IgE sensitization profiles in patients with allergic rhinitis and/or asthma recruited in Buenos Aires, San Rafael-Mendoza, Santa Rosa-La Pampa, and Rosario-Santa Fe. Secondary objectives were to compare the contribution of major aeroallergen sources between locations and to explore whether the number and distribution of recognized molecular components differed across age groups and ARIA- or GINA-defined clinical phenotypes.
2. Materials and Methods
2.1. Subjects
The study was conducted in four different Argentinian cities: Buenos Aires, Mendoza, Santa Fe-Rosario, and Santa Rosa-La Pampa. Patients aged 5 to 69 years, attending the participating medical services between April 2024 and September 2025, with symptoms of allergic rhinitis (AR) and/or asthma (A), were included in the study. Participants were recruited at each study site according to a common study protocol by the corresponding site investigators: J-F.M., E.G., M.d.G., M-I.A. and C.F. (Buenos Aires), M.I. (Mendoza), S.G. (Santa Rosa), and L.A. (Santa Fe). Written informed consent was obtained from all adult participants and from the parents or legal guardians of minors.
A total of 377 allergic patients were recruited according to predefined selection criteria. Eligibility required a confirmed diagnosis of allergy, determined through a positive skin prick test (SPT) to one or more relevant aeroallergens (pollen, mites, moulds and/or pet dander). To meet the inclusion criteria, patients were required to have experienced clinical symptoms for at least three years after establishing local residency. The severity and stage of allergic diseases were assessed through clinical evaluation following specific guidelines to ensure standardized and accurate classification [25,26,27]. Clinical data collected from patients' medical records included clinical history and details about their medications. Patients who had undergone past or current allergen immunotherapy or treatment with monoclonal antibodies (biologics) were excluded, as well as pregnant and breastfeeding women. This investigation was reviewed and approved by the local Ethical Committee (code number 12685).
2.2. Skin Prick Test
Percutaneous testing was conducted according to European standards using a diagnostic panel (Inmunotek, Madrid, Spain) with standardized extracts, including mite extracts, mold extracts, cockroach extract, a mixture of six grass pollen extracts, and other pollen extracts such as olive, Artemisia, and Ambrosia, as well as cat and dog dander extracts. Histamine (10 mg/ml) and saline were used as positive and negative controls, respectively. As per standard procedure, antihistamines were discontinued one week before the SPT. Wheal diameters were measured 20 minutes after testing, considering positive results diameters greater than 3 mm.
2.3. Serological Analysis
Serum samples were collected from all the patients recruited, labelled with a unique code, stored at -40°C, and thawed immediately before in vitro testing. Total IgE and specific IgE (sIgE) levels were measured using the ALEX MacroArray platform (MacroArray Diagnostics, Vienna, Austria) according to the manufacturer’s protocol. Total IgE levels were reported in international units per millilitre (IU/mL), and sIgE levels were expressed in kUA/L, with values ≥0.30 kUA/L considered positive.
The ALEX multiplex array contains 282 reagents, including 157 whole allergens and 125 molecular components.
2.4. Statistical Analysis
Statistical analyses and graphical representations were performed using GraphPad Prism version 10.4.1 (627) and R version 4.5.2, implemented in RStudio version 2025.05.1+513. Data processing and visualization in R were conducted using the dplyr, pheatmap, and ggplot2 packages.
Categorical variables were summarized as frequencies and percentages, whereas continuous variables were reported as median and range or mean ± standard deviation (SD), as appropriate. Regional sIgE profiles were represented in GraphPad Prism using heatmaps and bar plots showing mean sIgE concentrations ± SD, with individual patient values superimposed.
Molecular sensitization burden was defined as the number of components with recorded sIgE values >0.30 for each patient. Differences among clinical phenotypes were assessed using the Kruskal–Wallis test, followed by pairwise Wilcoxon rank-sum tests with Bonferroni correction. Associations between ordered clinical phenotypes and molecular sensitization burden were evaluated using Spearman’s rank correlation coefficient. A two-sided p value <0.05 was considered statistically significant.
Boxplots with superimposed individual observations were generated using ggplot2. For phenotype-specific heatmaps, sIgE values were transformed as log10(sIgE + 1), without additional scaling. Patients were grouped according to their predefined clinical phenotype and hierarchically ordered within each group using Euclidean distance and complete-linkage clustering. Molecular components were hierarchically clustered across patients, and heatmaps were generated using pheatmap.
3. Results
3.1. Demographic Features of Investigated Patients
The study included 377 participants: 100 from Buenos Aires, 105 from San Rafael-Mendoza, 62 from Santa Rosa-La Pampa, and 110 from Rosario-Santa Fe. Allergic rhinitis was recorded in 374 participants and asthma in 186; the two diagnoses were not mutually exclusive. All participants had at least one positive skin prick test to an aeroallergen and none had previously received or was receiving allergen immunotherapy or biologic therapy at enrolment. Demographic and clinical characteristics are summarized in Table 1.
3.2. Regional Molecular Sensitization Overview
Among the 377 participants, 336 (88.9%) showed sIgE levels ≥0.30 kUA/L to at least one of the 56 molecular components included in the analysis, whereas 42 (11.1%) did not recognize any of these components. Molecular positivity was observed in 92/100 participants from Buenos Aires (92.0%), 98/105 from San Rafael-Mendoza (93.3%), 59/62 from Santa Rosa-La Pampa (93.7%), and 87/110 from Rosario-Santa Fe (79.1%).
Mites were identified as the most prevalent source of sensitizing airborne allergens in the Buenos Aires population, regardless of the subjects' underlying atopic condition. In contrast, in Mendoza the main sensitizing allergens were pollens (Figure 1).
3.3. Mites
Among mite allergens, Dermatophagoides spp. were the predominant sensitizing airborne agents, distinct geographic differences in sensitization patterns were observed. The highest prevalence of sensitization was observed in Buenos Aires (87% Dermatophagoides pteronyssinus and 82% Dermatophagoides farinae), followed by intermediate prevalences in Santa Rosa and Rosario, whereas the lowest prevalence was found in San Rafael. Furthermore, Buenos Aires had the highest prevalence of sensitization to Lepidoglyphus destructor, with 51% of participants showing a positive skin prick test, whereas the other three cities showed considerably lower sensitization rates.
In Santa Rosa, La Pampa, the prevalence of sensitization to both Dermatophagoides species was identical, with 61.3% of the population showing a positive skin prick test. Furthermore, Santa Rosa showed the highest prevalence of sensitization to Blomia tropicalis, as determined by the skin prick test, with 51.6% of the population testing positive among the four cities.

Table 2.
Prevalence of sensitization to four mite species, as determined by skin prick testing, in four Argentine cities. Values are expressed as percentages; values in parentheses indicate the number of participants with a positive skin prick test for each mite (n/N).
Table 2.
Prevalence of sensitization to four mite species, as determined by skin prick testing, in four Argentine cities. Values are expressed as percentages; values in parentheses indicate the number of participants with a positive skin prick test for each mite (n/N).
| Frequency (%) | Buenos Aires | Rosario Santa Fe |
Santa Rosa La Pampa |
San Rafel Mendoza |
| Dermatophagoides pteronyssinus | 87.0 (87/100) | 53.6 (59/110) | 61.3 (38/62) | 15.2 (16/105) |
| Dermatophagoides farinae | 82.0 (82/100) | 55.5 (61/110) | 61.3 (38/62) | 13.3 (14/105) |
| Lepidoglyphus destructor | 51.0 (51/100) | 9.19 (10/110) | 32.3 (20/62) | 9.5 (10/105) |
| Blomia tropicalis | 48.0 (48/100) | 28.2 (31/110) | 51.6 (32/62) | 9.5 (10/105) |
Comparison of the number of patients sensitized to mites by skin prick testing across the four cities with the specific IgE results revealed that two patients who had positive skin prick test results were negative for all allergens included in the macroarray.
Across all study regions, Dermatophagoides group 1 and group 2 allergens were the dominant molecular sensitizers, with Der p 2 showing the highest IgE levels, followed by Der p 1, Der f 2, and Der p 23. As shown in Table 3, these allergens also exhibited the highest frequencies of specific IgE recognition. In Buenos Aires, Der p 1 (62%), Der p 2 (61%), Der p 23 (59%), and Der f 2 (59%) were the most frequently recognized allergens, followed by Der f 1 (47%). A similar pattern was observed in Rosario, where Der p 23 (53.64%), Der p 2 (46.36%), Der f 2 (46.36%), and Der p 1 (44.54%) predominated. In Santa Rosa, Der p 2 and Der f 2 (39.68% respectly), Der p 1 (37.09%), and Der p 23 (25.80%) remained the most frequently recognized allergens, whereas San Rafael exhibited an overall low frequency of molecular sensitization, with Der p 20 (7.62%), Der p 2 and Der f 2 (4.76% both) being the most frequently recognized components. Both the magnitude of the IgE response and the proportion of sensitized individuals declined progressively from Buenos Aires to Rosario and Santa Rosa, reaching the lowest values in San Rafael.
Sensitization to minor Dermatophagoides allergens was generally infrequent and of low intensity across all regions. Recognition of Der p 5, Der p 7, and Der p 21 was consistently lower than that observed for groups 1 and 2, although these components were more frequently detected in Buenos Aires and Rosario than in Santa Rosa and San Rafael. Sensitization to Der p 10 was uncommon in all four cities, while no patients showed specific IgE to Der p 11.
Recognition of Blomia tropicalis molecular allergens was also infrequent. Blo t 5 was the most commonly recognized Blomia component in Buenos Aires (19%) and Rosario (15.45%), whereas only one patient from Santa Rosa and none from San Rafael recognized this allergen (Table 3). Likewise, Blo t 10 and Blo t 21 showed low frequencies across all study sites. These findings contrast with the skin prick test results, particularly in Santa Rosa, where sensitization to B. tropicalis extract was the highest among the four cities. This observation is plausible considering that the allergens responsible for sensitization are not included in the ALEX platform. Sensitization to Gly d 2 and Lep d 2 was predominantly observed in Buenos Aires and Rosario, whereas recognition of Tyr p 2 was less frequent overall.
Monosensitization to mite molecular allergens was uncommon in the study population. Among the 377 patients analyzed, only 32 (8.5%) were monosensitized to a single mite allergen. Der p 23 was the most frequent monosensitizing component, detected in 9 patients (2.39% of the total study population), followed by Der p 20 in 8 patients (2.12%) and Der p 1 in 5 patients (1.33%). Monosensitization to Der p 2 and Der f 1 was observed in 3 patients each (0.80%), whereas Der p 7 was recognized as the sole allergen in 2 patients (0.53%). Monosensitization to Lep d 2 and Tyr p 2 was rare, with only one patient each (0.27%). In contrast, extensive polysensitization was observed in a substantial proportion of the cohort, with 44 of the 377 patients (11.7%) showing specific IgE reactivity to nine or more mite molecular allergens.
3.4. Pollens
Sensitization to pollen molecular allergens was detected across all four study regions. The highest prevalence of positive responses by skin prick test (Table 4) was observed in San Rafael, particularly for the grass pollen mixture (65.7%) and Olea europaea (60.9%). Buenos Aires showed intermediate sensitization frequencies, with the grass pollen mixture (32.0%) representing the most frequently recognized extract, followed by Ambrosia elatior (24.0%), Olea europaea (19.0%) and Artemisia vulgaris (16.0%). In contrast, Rosario displayed generally low sensitization rates for all pollen extracts tested, with olive pollen showing the highest prevalence (10.0%). In Santa Rosa, skin prick testing was not performed with the grass pollen mixture; however, high frequencies of sensitization were observed for Olea europaea (53.2%), Ambrosia elatior (40.3%) and Artemisia vulgaris (25.8%).
Grass pollen allergens accounted for the highest sIgE levels across the Argentine cohort (Table 5). Although no individual molecular allergen met the definition of a major allergen (≥50% prevalence among pollen-sensitized individuals), Phl p 1 and Lol p 1 were the most frequently recognized components, each detected in 25.9% of patients.
The predominant molecular sensitization profile comprised reactivity to one to four pollen allergens, which was observed in 152 of the 377 study participants (40.3%). Within this group, 50 individuals (13.3%) were monosensitized, with Cup a 1 representing the most common sole sensitizing allergen (n = 10), followed by Art v 1 (n = 6).
Considerable geographical variability was observed in both the frequency of sensitization and the magnitude of the sIgE response. San Rafael showed the highest proportion of sensitized individuals, with 81.8% of the study population recognizing at least one pollen molecular allergen, confirming the high burden of pollen sensitization previously identified by skin prick testing. This region also exhibited the broadest molecular sensitization profile, characterized by the highest mean sIgE levels across most pollen components. Besides the predominant recognition of the major grass pollen allergens Phl p 1 and Lol p 1 (38.1% and 39.0%, respectively), sensitization to olive (Ole e 1, 42.3%), Salsola kali (Sal k 1, 39.0%) and cypress (Cup a 1, 25.7%) was substantially more frequent than in the other study regions. Notably, Sal k 1 elicited the highest mean sIgE level among all pollen molecular allergens, indicating that it induced the strongest IgE response despite not being the most frequently recognized allergen.
Santa Rosa-La Pampa exhibited an intermediate sensitization profile, with 61.9% of individuals sensitized to at least one pollen molecular allergen. As in the other regions, grass pollen allergens predominated, with Phl p 1 and Lol p 1 recognized by 40.3% and 38.7% of the study population, respectively, with moderate sensitization to Cup a 1 (27.4%). Interestingly, despite the high prevalence of positive skin prick tests to Ambrosia elatior, sensitization to Amb a 1 and Amb a 4 was virtually absent, suggesting the involvement of other ragweed allergens.
Buenos Aires and Rosario-Santa Fe displayed the lowest frequencies of sensitization (40.0% and 32.0%, respectively) and shared a broadly similar molecular profile. In both locations, sensitization was mainly directed against the major grass pollen allergens Phl p 1 and Lol p 1, recognized by 19.0% and 18.0% of individuals in Buenos Aires, whereas in Rosario-Santa Fe the corresponding frequencies were 12.7% and 13.6%.
Sensitization to Ole e 1 was detected not only in San Rafael but also in Buenos Aires, Rosario and Santa Rosa. In these three regions, the frequencies of sensitization and mean sIgE levels for Ole e 1 and Fra e 1 were remarkably similar.
3.5. Molds
Skin prick test results showed that Alternaria alternata was the predominant mold allergen in all study centres (Table 6), with the highest prevalence in San Rafael-Mendoza (33.3%) and Santa Rosa-La Pampa (32.3%), followed by Rosario-Santa Fe (21.8%) and Buenos Aires (12.0%). Sensitization to Aspergillus fumigatus, Cladosporium herbarum, and Penicillium notatum was considerably less frequent, with prevalence below 10% in most centres.
Regarding molecular sensitization, Alt a 1 was the dominant mould component in every location. It was recognized by 34/105 participants in San Rafael-Mendoza (32.4%), 29/110 in Rosario-Santa Fe (26.4%), 17/62 in Santa Rosa-La Pampa (27.42%), and 10/100 in Buenos Aires (10.0%). Alt a 6 was infrequently recognized.
Table 7.
Serum sIgE to the displayed mold allergen molecules by recruitment centre. Data are mean ± standard deviation (kUA/L); values in parentheses indicate the number of participants with positive sIgE for each component.
Table 7.
Serum sIgE to the displayed mold allergen molecules by recruitment centre. Data are mean ± standard deviation (kUA/L); values in parentheses indicate the number of participants with positive sIgE for each component.
| Allergen | Buenos Aires | Rosario Santa Fe |
Santa Rosa La Pampa |
San Rafael Mendoza |
| Alt a 1 | 2.8±9.5(10) | 5.6±12.9(29) | 7.1±14.2(17) | 8.0±14.0(34) |
| Alt a 6 | 0.1±0.7(2) | 0.3±2.3(3) | 0.6±3.5(4) | 0.1±0.4(8) |
3.6. Cat and dog dander
Skin prick testing showed similar sensitization patterns to cat and dog dander across centres. Dog dander sensitization ranged from 17.3% to 38.7%, while cat dander ranged from 7.3% to 37.1%, with the highest prevalence observed in Santa Rosa-La Pampa and San Rafael-Mendoza (Table 8).
Although skin prick testing showed slightly higher sensitization rates to dog than cat dander, molecular analysis revealed a different pattern, with Fel d 1 being the most frequently recognized epithelial allergen in all centres (Table 9): 32 patients from Buenos Aires, 32 from Rosario-Santa Fe, 24 from Santa Rosa-La Pampa, and 35 from San Rafael-Mendoza. Mean sIgE levels for Fel d 1 were also the highest among epithelial components, ranging from 3.0±7.9 to 4.6±11.0 kUA/L across centres. In contrast, sensitization to the remaining cat components was considerably less frequent. Fel d 7 was detected in 5 to 7 patients per centre, whereas Fel d 4 and Fel d 2 showed low recognition rates. Fel d 2 was almost absent, with no positive patients in Buenos Aires and only 2 to 4 positive patients in the other centres.
Among dog allergens, Can f 5 was the most frequently recognized component, with 22 positive patients in Buenos Aires, 20 in Rosario-Santa Fe, 10 in Santa Rosa-La Pampa, and 11 in San Rafael-Mendoza. Can f 1 was the second most frequent dog component, particularly in Buenos Aires, where 16 patients showed positive sIgE. The remaining dog allergens, including Can f 2, Can f 3, Can f 4, and Can f 6, showed lower and more heterogeneous recognition frequencies across centres. When considering sensitization to at least one dog molecular allergen (Can f 1–6), the overall prevalence of molecular dog sensitization was 29.7% (113/377). By centre, the prevalence was 32.0% (32/100) in Buenos Aires, 30.9% (34/110) in Rosario -Santa Fe, 27.4% (17/62) in Santa Rosa-La Pampa, and 28.6% (30/105) in San Rafael-Mendoza. Compared with skin prick testing, molecular sensitization was higher in Buenos Aires (32.0% vs. 23.0%) and Rosario-Santa Fe (30.9% vs. 17.3%), whereas lower prevalence was observed in Santa Rosa-La Pampa (27.4% vs. 38.7%) and San Rafael-Mendoza (28.6% vs. 33.3%).
3.7. Cockroaches
Skin prick testing showed highly variable sensitization to cockroach (Periplaneta americana) across centres. Sensitization ranged from 4.8% to 98.2%, with the highest prevalence observed in Santa Fe-Rosario and Santa Rosa-La Pampa (Table 10).
Although skin prick testing showed extremely high sensitization rates in these locations, molecular analysis revealed a starkly different pattern. Cockroach sensitization was infrequent and was mainly represented by Bla g 9, detected in 13/100 participants in Buenos Aires (13.0%), 7/110 in Rosario-Santa Fe (6.4%), 6/62 in Santa Rosa-La Pampa (9.7%), and 8/105 in San Rafael-Mendoza (7.6%) (Table 11). Mean sIgE levels for Bla g 9 ranged from 0.4±3.2 to 1.3±5.5 kUA/L across centres. Bla g 1 and Bla g 5 were not detected, and Bla g 2 and Bla g 4 were only sporadically recognized.
3.8. Clinical Phenotypes and Molecular Sensitization Burden
Allergic rhinitis was present in nearly the entire cohort: 99 participants in Buenos Aires, 103 in San Rafael-Mendoza, 62 in Santa Rosa-La Pampa, and 110 in Rosario-Santa Fe. Asthma was recorded in 41, 51, 51, and 43 participants, respectively (Table 12). Asthma therefore represented a larger proportion of the local cohort in Santa Rosa-La Pampa than in the other locations.
When analyzed by age group, allergic rhinitis was more frequent in the younger and middle age ranges in Buenos Aires and Mendoza, whereas Santa Fe-Rosario showed a notable number of rhinitis cases also among older adults aged 46–68 years (n=33). Allergic asthma was particularly frequent among young patients from Mendoza (n=27) and Santa Rosa-La Pampa (n=24). In contrast, the lowest numbers of asthma cases in older adults were observed in Mendoza and Santa Rosa-La Pampa, with 6 cases each.
In the rhinitis cohort (Figure 2), the distribution showed a polarisation defined by the duration of the clinical condition. The persistent stages, specifically moderate persistent allergic rhinitis (MPR_Mod) and severe persistent allergic rhinitis (SPR), formed a dense, homogeneous cluster of maximum signal intensity (>1.5). This main cluster was dominated by co-sensitisation to the major and minor components of house dust mites and storage mites (Der p 1, Der p 2, Der p 5, Der p 7, Der p 21, Der p 23, Der f 1, Tyr p 2, Lep d 2 and Gly d 2), together with the fungal allergen Alt a 1 and the cat uteroglobulin Fel d 1. Furthermore, other cluster was found, which characterised by a strong sensitisation to Alt a 1. However, the phenotype with the greatest clinical severity, severe persistent rhinitis (SPR), showed a selective signal confined to discrete clusters of pollen allergens (Salk 1, Cup a 1, Ole e 1, Phl p 1, Phl p 5, Lol p 1) and Alt a 1. This same cluster could be found in individual with MPR_Mod.
In contrast, the asthma cohort (Figure 3) exhibited molecular heterogeneity amongst its phenotypes. The moderate persistent asthma group (MAP_Mod) was the cluster with the highest immunological density, showing polysensitisation to multiple major and minor house dust mites allergens. Also, there were another two small clusteres characterised by grass pollens (Lol p 1, Phl p 1, Phl p 5) and Alt 1, respectively. In contrast, the intermittent asthma (IA) exhibited fainter and more dispersed signals.
Figure 3.
Heatmap of molecular sensitization profiles in the asthma cohort (n=186). Rows represent individual participants grouped by asthma phenotype; columns represent allergen molecules ordered by hierarchical clustering. The colour scale represents log-transformed sIgE [log(sIgE+1)]. IA, intermittent asthma; MAP, mild persistent asthma; MAP_Mod, moderate persistent asthma; SPA, severe persistent asthma.
Figure 3.
Heatmap of molecular sensitization profiles in the asthma cohort (n=186). Rows represent individual participants grouped by asthma phenotype; columns represent allergen molecules ordered by hierarchical clustering. The colour scale represents log-transformed sIgE [log(sIgE+1)]. IA, intermittent asthma; MAP, mild persistent asthma; MAP_Mod, moderate persistent asthma; SPA, severe persistent asthma.
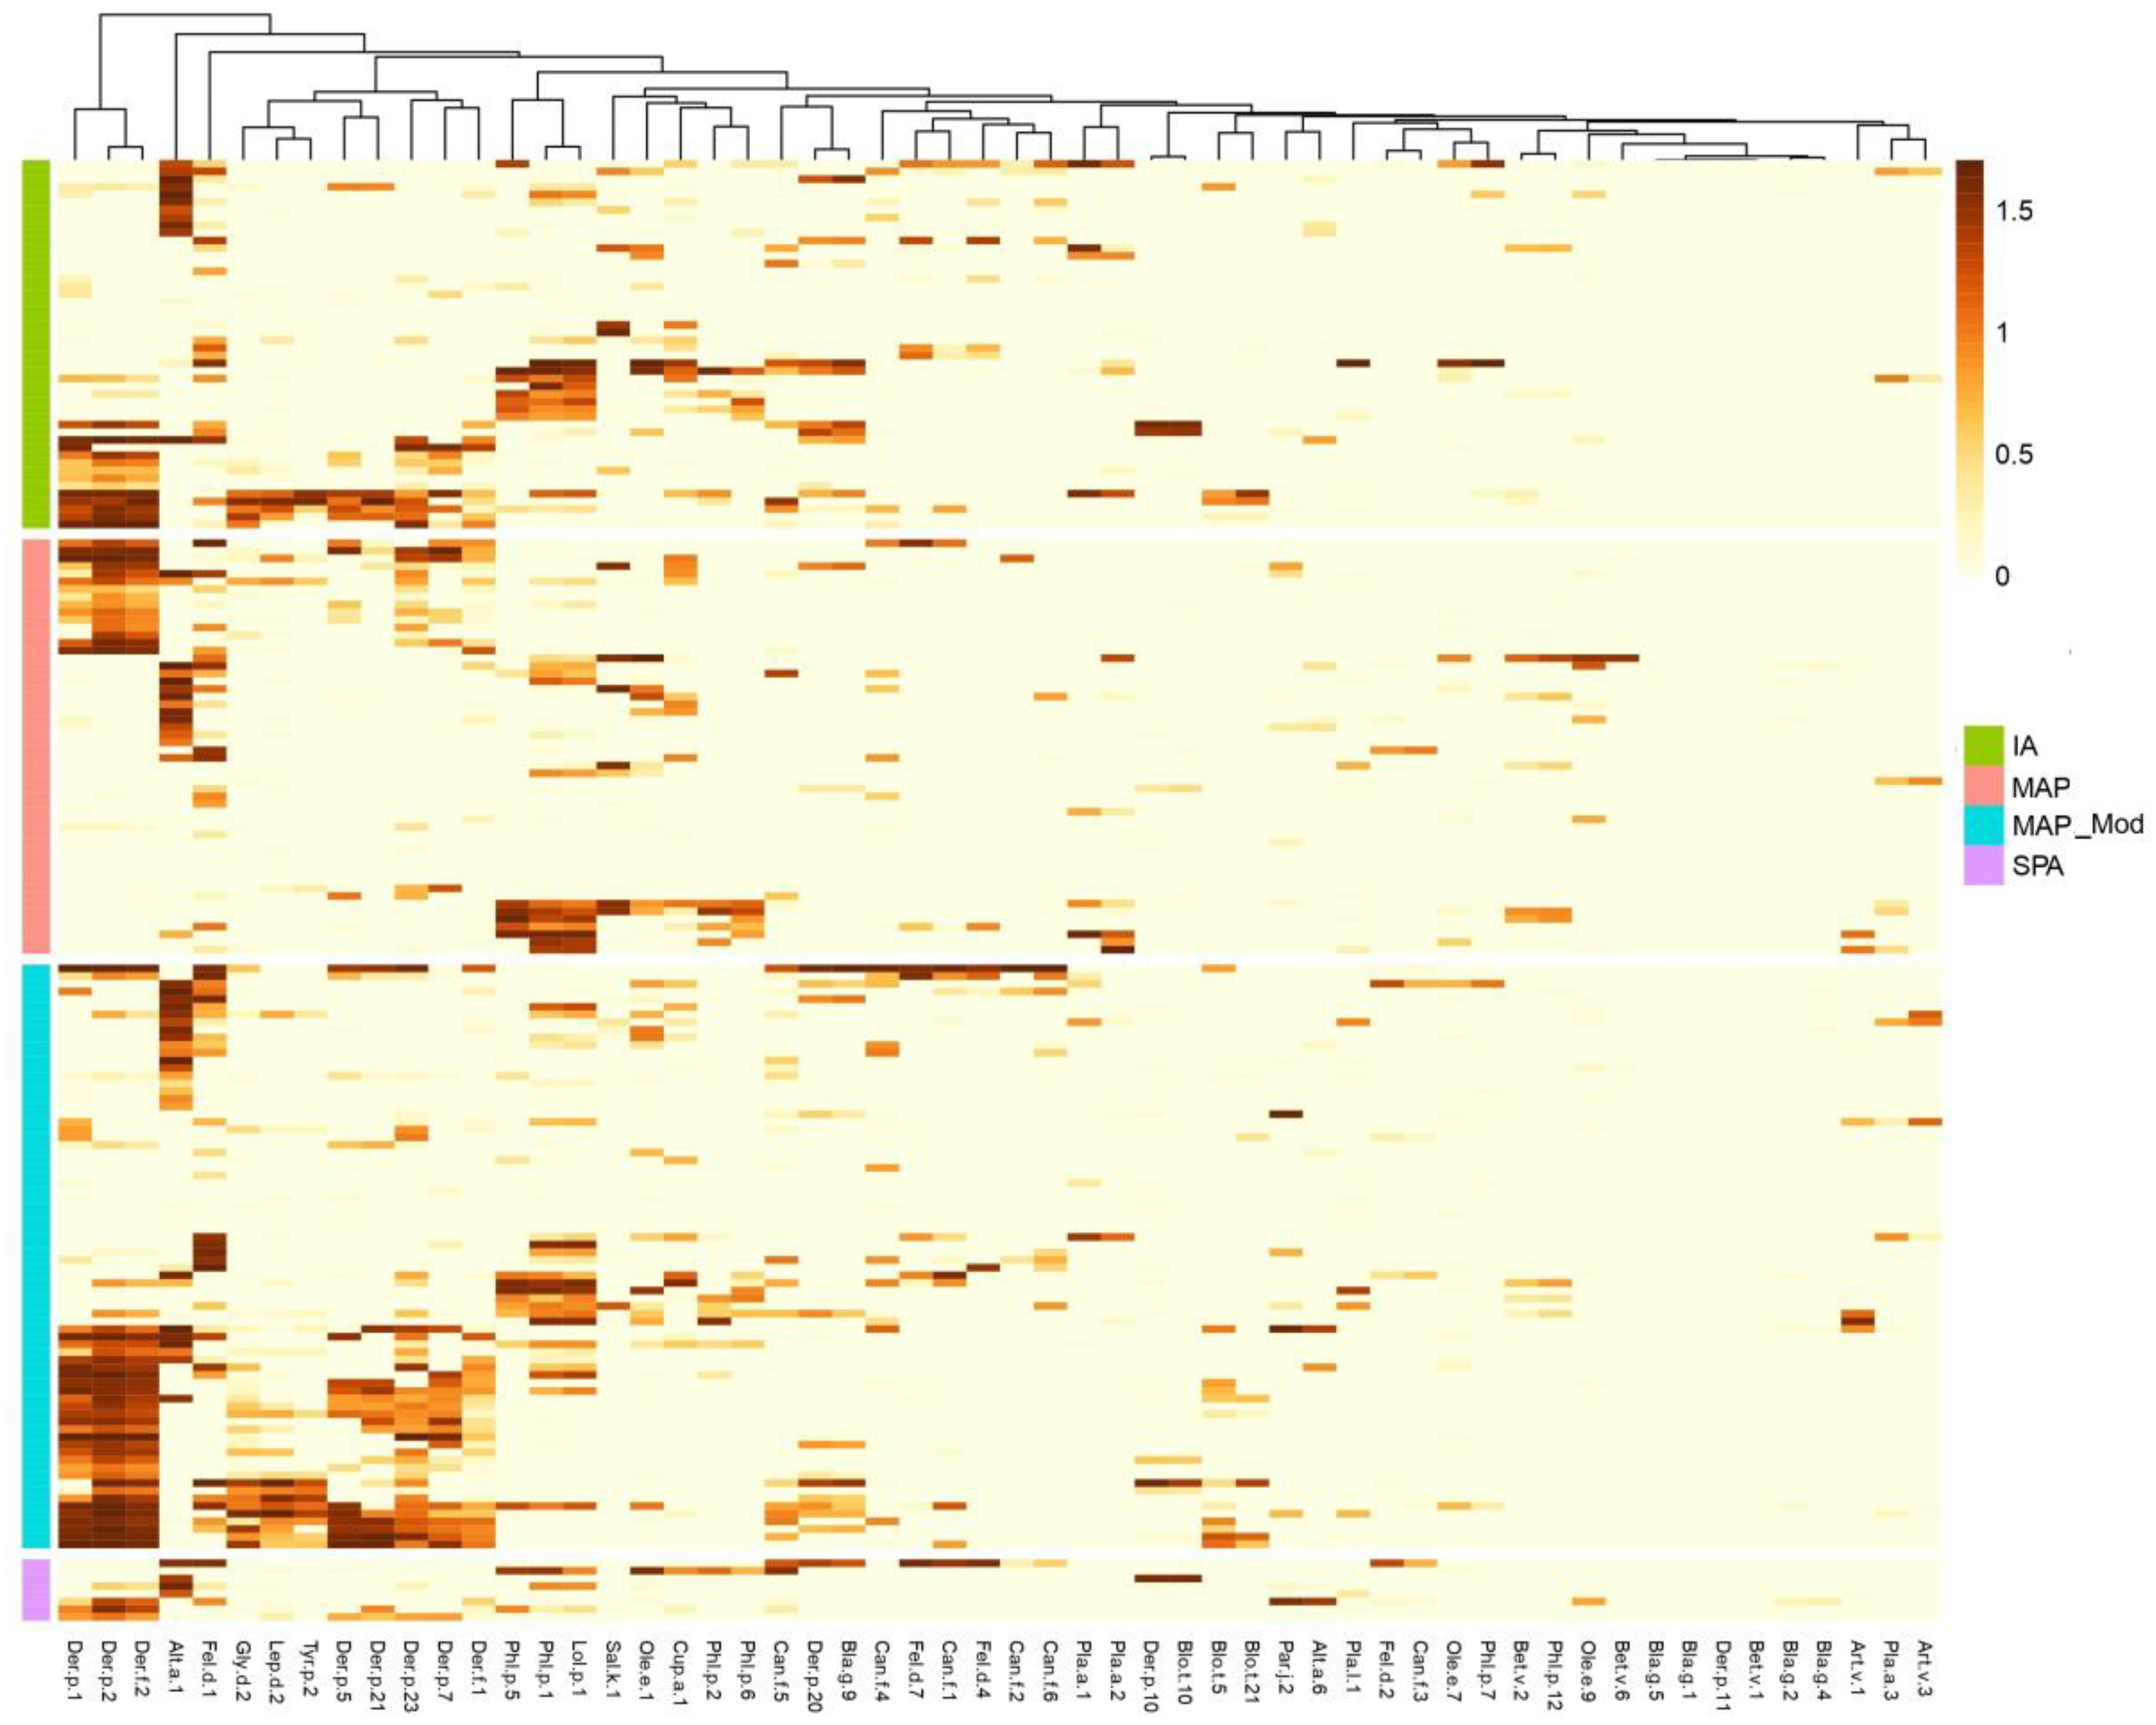
Figure 4.
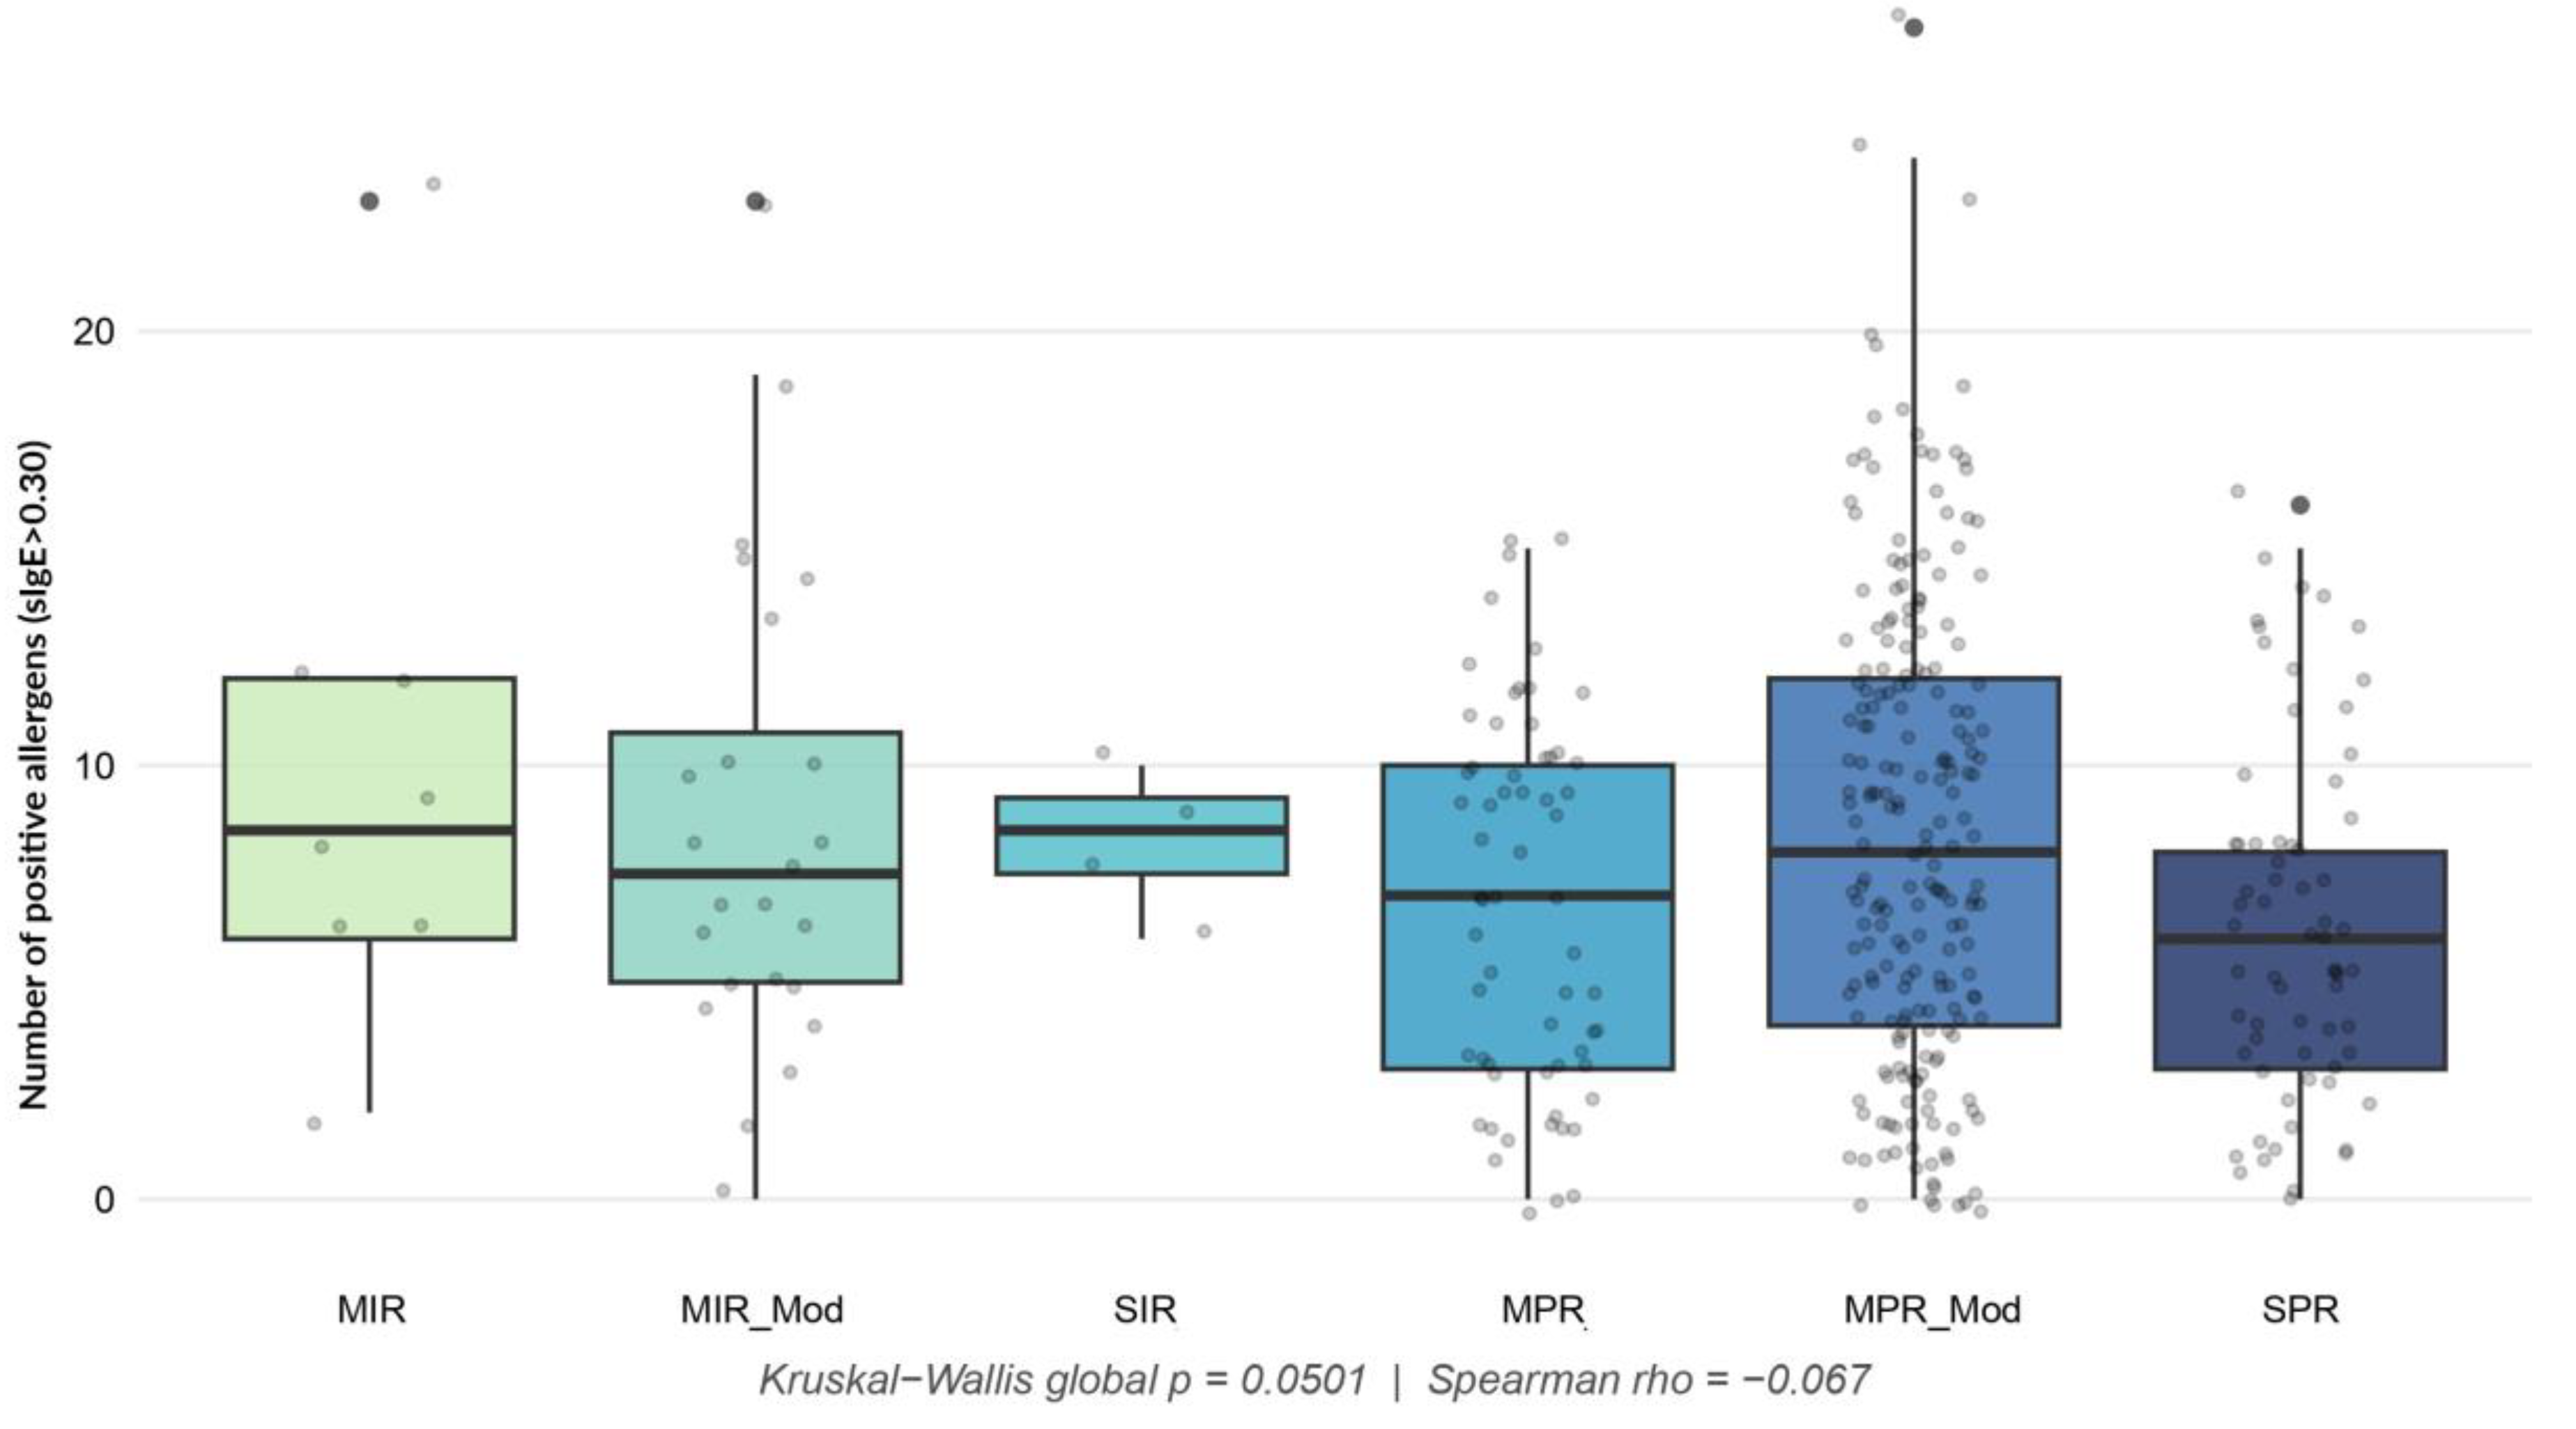
Number of positive allergen molecules (sIgE≥0.30 kUA/L) across ARIA rhinitis phenotypes (n=374). Boxes show the median and interquartile range; whisker and point definitions should be specified. Kruskal-Wallis p=0.0501; Spearman ρ=-0.067, p=0.1949.
Figure 4.
Number of positive allergen molecules (sIgE≥0.30 kUA/L) across ARIA rhinitis phenotypes (n=374). Boxes show the median and interquartile range; whisker and point definitions should be specified. Kruskal-Wallis p=0.0501; Spearman ρ=-0.067, p=0.1949.
To assess whether the complexity of the molecular sensitisation profile was associated with the severity of asthma, the total number of positive allergenic components per patient was quantified (Figure 5). The Kruskal-Wallis test confirmed the existence of statistically significant differences in the degree of polysensitisation between the four clinical phenotypes (χ² = 10.82, df = 3, p = 0.0127). Furthermore, Spearman’s rank correlation analysis demonstrated a significant positive linear trend between the clinical severity level and the number of recognised allergens (ρ = 0.184, p = 0.0117). Bonferroni-corrected post-hoc paired comparisons revealed that the main statistical contrast was between the MAP and MAP_Mod phenotypes, with a significant increase in the molecular burden of the latter (p = 0.016). Although the SPA phenotype had the highest median polysensitisation in the study (median = 12.0), paired comparisons with the other groups did not reach statistical significance (p > 0.05), a phenomenon attributable to the limited statistical power resulting from the small sample size of this critical subgroup (n = 8).
Unlike the findings in the asthma cohort, analysis of the molecular sensitisation burden in patients with rhinitis (n = 374) did not show a linear association with the severity of nasal symptoms according to the ARIA classification (Figure 4). The overall Kruskal-Wallis test was at the threshold of statistical significance (χ² = 11.07, df = 5, p = 0.0501), suggesting generalised homogeneity in the number of allergens recognised across the different clinical stages. This lack of progression was confirmed by Spearman’s trend test, which revealed no significant correlation between the severity of rhinitis and the number of positive molecular components (ρ = -0.067, p = 0.1949). Post-hoc paired comparisons with Bonferroni correction showed no significant differences between any pair of phenotypes (p = 1.000 in most tests). Only a marginal, non-significant trend was observed when comparing the MPR_Mod group with the SPR group (p = 0.076).
4. Discussion
4.1. Interpretation of the Principal Findings
This multicentre molecular study demonstrates geographical heterogeneity in aeroallergen sensitisation among patients with allergic rhinitis and/or asthma recruited from four Argentine regions. The principal contrast was between the mite-dominant profile in Buenos Aires, also evident in Rosario-Santa Fe and Santa Rosa-La Pampa, and the pollen-dominant profile in San Rafael-Mendoza. Alt a 1 and Fel d 1 were relevant across all centres. Notably, this study provides the first molecular assessment of Can f 5 sensitisation in Argentina, identifying this component as a major contributor to dog sensitisation across the evaluated regions. These findings extend previous molecular mapping studies conducted in different atopic phenotypes under subtropical exposure [11], climate-matched populations [12], four Peruvian cities [13], and multiple Spanish bioclimatic regions [14].
Molecular IgE repertoires should be interpreted as biological signatures of cumulative interactions between environmental exposure and host susceptibility rather than as direct measurements of allergen concentrations. Detectable sIgE demonstrates immune recognition but does not quantify current exposure or establish clinical relevance [15]. Within an exposome framework, the repertoire reflects exposure history together with epithelial integrity, immune regulation, previous residence, and individual susceptibility [16,17]. The geographical profiles are environmentally coherent but cannot establish causality.
Asthma severity showed a statistically significant but weak positive association with the number of recognised molecules, whereas no comparable relationship was observed for allergic rhinitis. Molecular polysensitisation may contribute to asthma complexity but explains only limited clinical heterogeneity. In rhinitis, severity may depend more on the relevance and seasonality of the dominant allergen. Molecular burden should therefore not be used as an isolated marker of disease severity.
4.2. Regional Molecular Signatures and Environmental Context
The four recruitment centres were situated within the 1991–2020 Köppen–Geiger classification to represent the long-term climatic context preceding recruitment, which occurred between April 2024 and September 2025 (Figure 6) [18]. The classification does not capture short-term anomalies and excludes irrigation, cultivated vegetation, housing microclimates, pollution, wildfire smoke, and occupational exposure. It should therefore be regarded as a contextual layer rather than an individual exposure metric or a sufficient explanation for the molecular profiles.
4.2.1. Mite Sensitisation and the Indoor Exposome
Buenos Aires displayed the strongest mite-dominant profile, characterised by Der p 1, Der p 2, Der p 23, and Der f 2. Rosario-Santa Fe and Santa Rosa-La Pampa showed intermediate profiles, whereas mite components were uncommon in San Rafael-Mendoza. The prominence of group 1, group 2, and Der p 23 allergens is consistent with their relevance in respiratory mite allergy [19,20]. Der p 23 may be particularly important in Argentina because greater recognition has been reported in Latin American than in Spanish mite-allergic populations [19].
Recognition of Der p 5, Der p 7, and Der p 21 indicates that the repertoire extended beyond the conventional major components. Broad profiles involving major and mid-tier allergens have also been described in subtropical populations, multicentre molecular studies, and longitudinal investigations [11,13,14,20]. Such molecular spreading may reflect sustained, intense, or early exposure, although the cross-sectional design cannot determine timing or dose. Testing restricted to Der p 1 and Der p 2 could incompletely characterise some patients, although multiple positive molecules do not each necessarily contribute to symptoms.
Storage-mite molecules, including Gly d 2, Lep d 2, and Tyr p 2, were also recognised. These findings may represent genuine co-sensitisation, cross-reactivity among homologous group 2 allergens, or both. Interpretation would benefit from information on storage, animal feed, occupation, and domestic conditions.
Der p 11 was not detected in any population. Although initially proposed as a major allergen in selected mite-allergic patients with atopic dermatitis [21], subsequent evidence showed low and population-dependent recognition [22]. Its absence is therefore more likely to reflect limited and geographically variable sensitisation than a specific association with respiratory phenotypes.
The Buenos Aires profile is plausible in a dense urban setting where outdoor climate interacts with indoor microenvironments. Mite proliferation is influenced more directly by humidity and temperature within bedding, mattresses, furniture, and poorly ventilated rooms than by city-level climatic averages, this explanation could also account for the high prevalence of mite sensitization observed in Santa Rosa. Pollution may act as a modifying coexposure rather than as the cause of mite-specific IgE. PM2.5 in Buenos Aires includes biomass burning, traffic, soil and road dust, construction, agricultural emissions, and industrial sources [23]. Rosario combines urban, industrial, port, and agro-industrial activities with episodic smoke from fires in the Paraná Delta [24]. These exposures cannot explain Der p-specific recognition but may amplify airway inflammation. Finally, the dry climate of Mendoza could explain the low prevalence of mite sensitization observed in our study.
4.2.2. Pollen Sensitisation and Regional Vegetation
San Rafael-Mendoza exhibited the most extensive pollen-dominant profile, with frequent recognition of Ole e 1, Fra e 1, Phl p 1, Lol p 1, Sal k 1, Cup a 1, and plane-tree components. This pattern likely reflects the greater abundance of these pollen-producing plant species in San Rafael than in the other study regions. It is also plausible in an irrigated semi-arid environment where agriculture, urban planting, and ruderal vegetation generate pollen sources. Low regional precipitation should not be equated with low pollen exposure: irrigation sustains vegetation, whereas dry and windy conditions may facilitate pollen release and dispersion.
Parallel recognition of Phl p 1 and Lol p 1 supports genuine grass-pollen sensitisation rather than a profile explained exclusively by profilins or polcalcins. Comparable dominance of grass group 1 molecules has been reported in geographically heterogeneous populations [12,13,14].
Environmental pollen counts and airborne allergen concentrations are related but not equivalent. Atmospheric Phl p 1 and Phl p 5 concentrations do not always parallel total Poaceae pollen counts and may be influenced by meteorological conditions and pollutants [25]. Molecular sensitisation therefore cannot be inferred directly from botanical inventories or pollen counts.
The high frequency of Ole e 1 and Fra e 1 in San Rafael is compatible with substantial Oleaceae exposure, although the assay cannot identify the predominant species. Lower recognition of Ole e 7 and Ole e 9 suggests a profile mainly driven by Ole e 1-like proteins. Broader profiles involving these components have been associated with intense exposure and more severe respiratory disease [26]. Sal k 1 is consistent with exposure to Salsola or related Amaranthaceae-Chenopodiaceae, whereas Cup a 1 and plane-tree molecules may reflect planted urban or peri-urban vegetation.
Santa Rosa-La Pampa showed an intermediate profile combining mites with Phl p 1, Lol p 1, and Cup a 1. A local two-year survey identified 73 airborne pollen types, including Cupressaceae, Oleaceae, Platanus, Poaceae, and Amaranthaceae-Chenopodiaceae [27]. This agreement supports the interpretation that the IgE repertoire partly reflects regional vegetation.
Buenos Aires and Rosario-Santa Fe displayed the lowest frequencies of pollen sensitization and shared a broadly similar molecular profile, characterized by predominant sensitization to the major grass pollen allergens Phl p 1 and Lol p 1. This pattern is consistent with the aerobiological characteristics of both regions, where Poaceae pollen represents one of the major contributors to the atmospheric pollen load. The lower prevalence of sensitization to olive, cypress and Salsola kali allergens compared with San Rafael is also in agreement with the more humid climate and the different composition of the regional vegetation.
Interestingly, sensitization to Ole e 1 was nevertheless detected in Buenos Aires, Rosario and Santa Rosa despite the relatively limited abundance of olive trees in these regions. In contrast, ash (Fraxinus excelsior) is a common ornamental tree in all three cities. A plausible explanation is the well-established cross-reactivity between olive and ash pollens. Accordingly, Ole e 1 and Fra e 1 showed remarkably similar sensitization frequencies and mean sIgE levels across these regions, supporting the hypothesis that part of the observed Ole e 1 reactivity may reflect primary sensitization to ash pollen rather than genuine olive pollen sensitization.
4.2.3. Mould Sensitisation and the Regional Fungal Exposome
Alt a 1 was the dominant fungal molecule in every region, ranging from 10.0% in Buenos Aires to 32.4% in San Rafael-Mendoza. This distribution did not follow a simple humidity gradient. Its highest frequency in a semi-arid region indicates that fungal exposure depends on agricultural substrates, vegetation, short-term moisture, temperature, crop residues, wind, and spore-release conditions rather than annual humidity alone.
Alt a 1 is the dominant and most clinically informative molecular marker of genuine Alternaria alternata sensitisation [28]. Its concentration in fungal extracts correlates with overall IgE-binding activity [29], while environmental levels of Alt a 1 have been associated with nasal and bronchial symptoms in sensitised patients [30]. Fungal diagnosis nevertheless remains complex because allergen expression may vary among strains, growth conditions, and source materials [28].
The high Alt a 1 recognition in San Rafael is compatible with an irrigated agricultural exposome. Alternaria can colonise crops, fruit, senescent leaves, and plant debris. Moisture may support fungal growth, whereas subsequent warm, dry, and windy conditions favour aerosolisation of dry conidia. Studies in the Southern Oasis of Mendoza identified Alternaria in the fungal microbiota of wine grapes [31]. These data document a plausible regional reservoir but not individual airborne exposure. Alt a 6 was infrequently recognised, although the restricted fungal panel may underestimate sensitisation to other fungal molecules.
4.2.4. Animal Epithelia and Cockroach Components
Fel d 1 was the leading epithelial allergen in all centres and showed less regional variability than mites or pollens, consistent with widespread passive dissemination of cat allergen in homes without cats, schools, workplaces, vehicles, and public spaces. Among dog molecules, Can f 5 was most frequently recognised, followed by Can f 1, although direct exposure and dog sex were not recorded.
Cockroach sensitisation was uncommon and mainly represented by Bla g 9. Local species, housing conditions, and assay composition may influence detection. Because Bla g 9 is an arginine kinase with homologues in mites and other invertebrates, some responses may reflect cross-reactivity rather than primary cockroach sensitisation.
4.3. Comparison With Previous Molecular Mapping Studies
The findings parallel molecular mapping studies performed in subtropical regions, climate-matched populations, Peru, and Spain [11,12,13,14]. Collectively, these investigations show that mite, pollen, fungal, and epithelial sensitisation profiles differ substantially across geographical settings, even among patients sharing similar respiratory diagnoses.
Regional repertoires are likely shaped by interacting components of the external exposome—including climate, vegetation, irrigation, housing, occupation, urbanisation, and pollution—rather than climate alone [16,17]. Buenos Aires may represent a predominantly urban indoor-mite environment; Rosario combines indoor allergens with port, agricultural, industrial, and wildfire-smoke exposures; Santa Rosa occupies an urban-agricultural transition zone; and San Rafael represents an irrigated semi-arid oasis with strong pollen and agricultural fungal signals. These are interpretative models, not measurements of personal exposure. Air pollution should mainly be considered an effect modifier capable of amplifying epithelial disruption and inflammation rather than a determinant of allergen-specific IgE [16,17].
4.4. Clinical and Therapeutic Implications
The regional differences have practical implications for precision diagnosis. In mite-dominant locations, assessment restricted to Der p 1 and Der p 2 could incompletely characterise patients recognising Der p 23 [19,20] or additional mid-tier molecules such as Der p 5, Der p 7, and Der p 21 [11,14,20]. Molecular results should nevertheless be interpreted alongside exposure history, extract-based tests, and clinical symptoms.
Discrepancies between skin-prick testing and molecular IgE emphasise that molecular diagnosis should complement rather than replace conventional assessment. Possible explanations include unrepresented molecules, differences in analytical sensitivity, cross-reactive proteins, or skin-test positivity without clinical relevance.
In San Rafael-Mendoza, Ole e 1, Phl p 1, Lol p 1, Sal k 1, Cup a 1, and plane-tree molecules provide greater resolution than extract testing and may help distinguish genuine co-sensitisation from panallergen-driven cross-reactivity. However, molecular positivity does not establish clinical relevance; symptom timing, pollen seasons, exposure history, and, where appropriate, provocation testing remain necessary.
Molecular diagnosis may improve allergen-immunotherapy selection by distinguishing genuine from cross-reactive sensitisation and identifying clinically relevant sources [32]. Nevertheless, the patient’s IgE repertoire is not a direct measure of an immunotherapy product’s composition or potency. Alt a 1 recognition should prompt assessment of symptom seasonality, lower-airway involvement, agricultural exposure, and periods of fungal-spore dispersion [28,30]. The weak association between molecular burden and asthma severity further indicates that polysensitisation should be integrated with lung function, exacerbations, T2 biomarkers, adherence, smoking, occupation, dampness, mould, infections, and pollution.
4.5. Strengths, Limitations, and Future Directions
The principal strengths include the multicentre design, common eligibility framework, and standardised component-resolved assessment across four Argentine regions.
Limitations include the selected SPT-positive clinical cohort, cross-sectional design, differences in demographic and clinical composition among centres, and absence of multivariable adjustment. The high proportion of asthma in Santa Rosa-La Pampa may partly reflect referral or recruitment patterns and should not be interpreted as regional prevalence.
Environmental exposure was not measured directly. No contemporaneous pollen or fungal-spore counts, airborne allergen measurements, domestic mite sampling, pollution data, or individual geospatial information were linked to participants. The Köppen–Geiger map and regional studies provide context but cannot be assigned as personal exposures or establish causality [18,23,24,27,31]. Housing, indoor dampness, ventilation, pets, smoking, occupation, agricultural contact, and previous residence were not systematically recorded. Serum IgE was not linked to symptom seasonality, lung function, FeNO, eosinophils, exacerbations, provocation testing, or treatment response. The analysis was also restricted to components represented on the ALEX platform.
Future longitudinal studies should integrate molecular diagnosis with aerobiological monitoring, domestic mite sampling, pollution measurements, and personal exposure assessment. Residential geocoding could be combined with land use, irrigation, crops, traffic, industrial activity, and wildfire-smoke trajectories. Longitudinal symptoms, lung function, FeNO, eosinophils, and exacerbation records analysed using multilevel models would help distinguish stable sensitisation from clinically active exposure and clarify the contribution of the allergen exposome to respiratory disease.
5. Conclusions
This study identifies marked regional heterogeneity in molecular aeroallergen sensitization among patients with allergic rhinitis and/or asthma recruited in four Argentine locations. Mite components dominated in Buenos Aires and remained prominent in Rosario-Santa Fe and Santa Rosa-La Pampa, whereas San Rafael-Mendoza showed a pollen-dominant pattern with frequent recognition of Ole e 1, grass allergens (Phl p 1 and Lol p 1), Sal k 1, and Alt a 1. Fel d 1 was the leading epithelial component across centres, and cockroach sensitization was uncommon.
A broader molecular sensitization burden was weakly associated with asthma severity but not with rhinitis severity. These findings support geographically informed molecular assessment and provide a basis for future studies integrating clinical sensitization with direct environmental measurements. They should not be interpreted as population prevalence estimates or as evidence that regional climate caused the observed profiles.
Author Contributions
Conceptualization, J-F.M., R.G-P., and F.P.; methodology J-F.M. and F.P.; investigation, J-F.M., M.I., S.G., L.A., E.G., M.G., M-I.A., C.F., E-A.F., A-E.F., M-J.M., T.G-D., and F.P.; writing—original draft preparation, J-F.M., A-E.F., M-J.M., T.G-D., R.G-P., and F.P.; writing—review and editing, J-F.M., M.I., S.G., L.A., E.G., M.G., M-I.A., C.F., E-A.F., A-E.F., M-J.M., T.G-D., R.G-P., and F.P.; supervision, J-F.M., and F.P.; project administration, F.P. All authors have read and agreed to the published version of the manuscript.
Funding
This research received no external funding.
Institutional Review Board Statement
This study was reviewed and approved by the Ethics Committee of Clinical Pharmacology-CIDEA, under approval number 12685 on 12 April 2024.
Informed Consent Statement
Written informed consent was obtained from all participants prior to the collection of serum samples and their inclusion in the study.
Data Availability Statement
The data that support the findings of this study are available from CIDEA, but restrictions apply to the availability of these data, which were used under license for the current study and so are not publicly available. Data are, however, available from the authors upon reasonable request and with permission of CIDEA.
Conflicts of Interest
F.P., E-A.F., A-E.F., M-J.M., T.G-D. are employed by Inmunotek S.L. Laboratories, Madrid, Spain.
References
- Pawankar, R. Allergic diseases and asthma: a global public health concern and a call to action. World Allergy Organ J. 2014, 7, 12. [Google Scholar] [CrossRef]
- Vázquez, D.; Medina, I.; Logusso, G.; Arias, S.; Gattolin, G.; Parisi, C. Cross-sectional survey about the prevalence of allergic rhinitis in Argentina: Study PARA. Rev. Alerg. Mex. 2019, 66, 55–64. [Google Scholar] [CrossRef] [PubMed]
- Solé, D.; Mallol, J.; Camelo-Nunes, I.C.; Wandalsen, G.F. Prevalence of rhinitis-related symptoms in Latin American children: results of the International Study of Asthma and Allergies in Childhood (ISAAC) phase three. Pediatr. Allergy Immunol. 2010, 21, e127–e136. [Google Scholar] [CrossRef] [PubMed]
- Pendino, P.; Agüero, C.; Cavagnero, P.; Lopez, K.; Kriunis, I.; Molinas, J. Aeroallergen sensitization in wheezing children from Rosario, Argentina. World Allergy Organ J. 2011, 4, 159–163. [Google Scholar] [CrossRef] [PubMed]
- Ramon, G.D.; Vanegas, E.; Felix, M.; Barrionuevo, L.B.; Kahn, A.M.; Bertone, M.; et al. Year-long trends of airborne pollen in Argentina: More research is needed. World Allergy Organ J. 2020, 13, 100135. [Google Scholar] [CrossRef] [PubMed]
- D'Amato, G.; Chong-Neto, H.J.; Monge Ortega, O.P.; Vitale, C.; Ansotegui, I.; Rosario, N.; et al. The effects of climate change on respiratory allergy and asthma induced by pollen and mold allergens. Allergy 2020, 75, 2219–2228. [Google Scholar] [CrossRef] [PubMed]
- Annesi-Maesano, I.; Maesano, C.N.; Biagioni, B.; D’Amato, G.; Cecchi, L. Call to action: Air pollution, asthma, and allergy in the exposome era. J. Allergy Clin. Immunol. 2021, 148, 70–72. [Google Scholar] [CrossRef] [PubMed]
- Wild, C.P. Complementing the genome with an “exposome”: the outstanding challenge of environmental exposure measurement in molecular epidemiology. Cancer Epidemiol. Biomark. Prev. 2005, 14, 1847–1850. [Google Scholar] [CrossRef] [PubMed]
- Cecchi, L.; D'Amato, G.; Annesi-Maesano, I. External exposome and allergic respiratory and skin diseases. J. Allergy Clin. Immunol. 2018, 141, 846–857. [Google Scholar] [CrossRef] [PubMed]
- Renz, H.; Holt, P.G.; Inouye, M.; Logan, A.C.; Prescott, S.L.; Sly, P.D. An exposome perspective: Early-life events and immune development in a changing world. J. Allergy Clin. Immunol. 2017, 140, 24–40. [Google Scholar] [CrossRef] [PubMed]
- González-Pérez, R.; Poza-Guedes, P.; Pineda, F.; Galán, T.; Mederos-Luis, E.; Abel-Fernández, E.; Martínez, M.J.; Sánchez-Machín, I. Molecular mapping of allergen exposome among different atopic phenotypes. Int. J. Mol. Sci. 2023, 24(13), 10467. [Google Scholar] [CrossRef] [PubMed]
- González-Pérez, R.; Galván-Calle, C.A.; Galán, T.; Poza-Guedes, P.; Sánchez-Machín, I.; Enrique-Calderón, O.M.; Pineda, F. Molecular signatures of the allergen exposome in climate-matched populations. Int. J. Mol. Sci. 2025, 26(1), 284. [Google Scholar] [CrossRef] [PubMed]
- Galván, C.A.; Durán, R.; Galán, T.; Abel-Fernández, E.; Canal-Solis, K.; González-Pérez, R.; Pineda, F. Patterns of IgE-mediated molecular sensitisation across four Peruvian cities. Int. Arch. Allergy Immunol. 2026, 187(3), 261–272. [Google Scholar] [CrossRef] [PubMed]
- González-Pérez, R.; Poza-Guedes, P.; Igea Aznar, J.M.; et al. EXPOMOL: Precision medicine in allergic rhinitis and conjunctivitis—integrative molecular mapping of the allergic exposome in Spain. J. Investig. Allergol. Clin. Immunol. [CrossRef]
- Gevaert, P.; Wong, K.; Millette, L.A.; Carr, T.F. Role of IgE in allergic disease. Clin. Rev. Allergy Immunol. 2022, 62(1), 200–215. [Google Scholar] [CrossRef] [PubMed]
- Amini, H.; Amini, M.; Wright, R.O. Climate change, exposome change, and allergy. Immunol. Allergy Clin. North Am. 2024, 44(1), 1–13. [Google Scholar] [CrossRef] [PubMed]
- Galván, C.A.; Durán, R.; Espinoza, D.; González-Pérez, R.; Pineda, F. Exposome and respiratory allergic diseases: A structured narrative review. Allergies 2026, 6, 27. [Google Scholar] [CrossRef]
- Beck, H.E.; McVicar, T.R.; Vergopolan, N.; et al. High-resolution 1-km Köppen–Geiger maps for 1901–2099 based on constrained CMIP6 projections. Sci. Data 2023, 10, 724. [Google Scholar] [CrossRef] [PubMed]
- Calzada, D.; Bartra, J.; Serrano, C.D.; et al. Differences in molecular sensitisation profiles between Spanish and Latin American mite-allergic patients. J. Investig. Allergol. Clin. Immunol. 2025, 35(2), 114–121. [Google Scholar] [CrossRef] [PubMed]
- Posa, D.; Perna, S.; Resch, Y.; et al. Evolution and predictive value of IgE responses toward a comprehensive panel of house dust mite allergens during the first two decades of life. J. Allergy Clin. Immunol. 2017, 139(2), 541–549.e8. [Google Scholar] [CrossRef] [PubMed]
- Banerjee, S.; Resch, Y.; Chen, K.W.; et al. Der p 11 is a major allergen for house dust mite-allergic patients suffering from atopic dermatitis. J. Invest Dermatol. 2015, 135(1), 102–109. [Google Scholar] [CrossRef] [PubMed]
- González-Pérez, R.; Poza-Guedes, P.; Pineda, F.; Castillo, M.; Matheu, V.; Mederos-Luis, E.; Alava-Cruz, C.; Sánchez-Machín, I. Atopic dermatitis and frequency of Der p 11 binding as a major allergen revisited. J. Invest Dermatol. 2022, 142 3 Pt A, 721–723. [Google Scholar] [CrossRef] [PubMed]
- Lichtig, P.; Gelman Constantin, J.; Diaz Resquin, M.; et al. Chemical characterisation and source apportionment of PM2.5 in Buenos Aires. Atmos. Environ. 2025, 353, 121236. [Google Scholar] [CrossRef]
- Valle Seijo, M.F.; Micheletti, M.I.; Otero, L.A.; Piacentini, R.D. Atmospheric pollutants over Rosario assessed by remote sensing: Influence of wildfires and COVID-19 restrictions. Remote Sens. Appl. Soc. Environ. 2024, 36, 101326. [Google Scholar] [CrossRef]
- Cabrera, M.; Subiza, J.; Fernández-Caldas, E.; Garzón García, B.; Moreno-Grau, S.; Subiza, J.L. Environmental drivers of atmospheric pollen and allergen concentrations in Madrid. Env. Sci. Pollut. Res. Int. 2021, 28(38), 53614–53628. [Google Scholar] [CrossRef] [PubMed]
- Alcántara Villar, M.; Anaya Anaya, S.; López Guerrero, A.; Martínez Chamorro, A.; Garrido, C.R. Olive-pollen molecular sensitisation profiles and respiratory disease severity in Jaén. World Allergy Organ J. 2025, 18(3), 101030. [Google Scholar] [CrossRef] [PubMed]
- Caramuti, V.E.; Naab, O.A.; Murray, M.G. First report of airborne pollen in Santa Rosa, La Pampa: A two-year survey. Aerobiologia 2014, 30, 293–305. [Google Scholar] [CrossRef]
- Abel-Fernández, E.; Martínez, M.J.; Galán, T.; Pineda, F. Going over fungal allergy: Alternaria alternata and its allergens. J. Fungi 2023, 9(5), 582. [Google Scholar] [CrossRef] [PubMed]
- Asturias, J.A.; Arilla, M.C.; Ibarrola, I.; Eraso, E.; González-Rioja, R.; Martínez, A. A sensitive two-site enzyme-linked immunosorbent assay for measurement of the major Alternaria alternata allergen Alt a 1. Ann. Allergy Asthma Immunol. 2003, 90(5), 529–535. [Google Scholar] [CrossRef] [PubMed]
- Feo Brito, F.; et al. Correlation between Alt a 1 levels and clinical symptoms in Alternaria-monosensitised patients. J. Investig. Allergol. Clin. Immunol. 2012, 22(3), 154–159. [Google Scholar] [PubMed]
- Prendes, L.P.; Merín, M.G.; Zamora, F.A.; et al. Alternaria, tenuazonic acid, and spoilage yeasts associated with wine grapes in the Southern Oasis of Mendoza. Fermentation 2025, 11(9), 536. [Google Scholar] [CrossRef]
- Matricardi, P.M.; Dramburg, S.; Potapova, E.; Skevaki, C.; Renz, H. Molecular diagnosis for allergen immunotherapy. J. Allergy Clin. Immunol. 2019, 143(3), 831–843. [Google Scholar] [CrossRef] [PubMed]
Figure 1.
Heatmap of the 20 most frequently identified molecular allergens in each region, along with their serodominance. Each panel corresponds to one recruitment centre. In the heatmaps, rows represent individual patients ordered within the age strata 5-25, 26-45, and 46-69 years, columns represent allergen molecules, and colour intensity represents serum specific IgE concentration (kUA/L). The adjacent plots display the 20 most prominent components within each age group.
Figure 1.
Heatmap of the 20 most frequently identified molecular allergens in each region, along with their serodominance. Each panel corresponds to one recruitment centre. In the heatmaps, rows represent individual patients ordered within the age strata 5-25, 26-45, and 46-69 years, columns represent allergen molecules, and colour intensity represents serum specific IgE concentration (kUA/L). The adjacent plots display the 20 most prominent components within each age group.
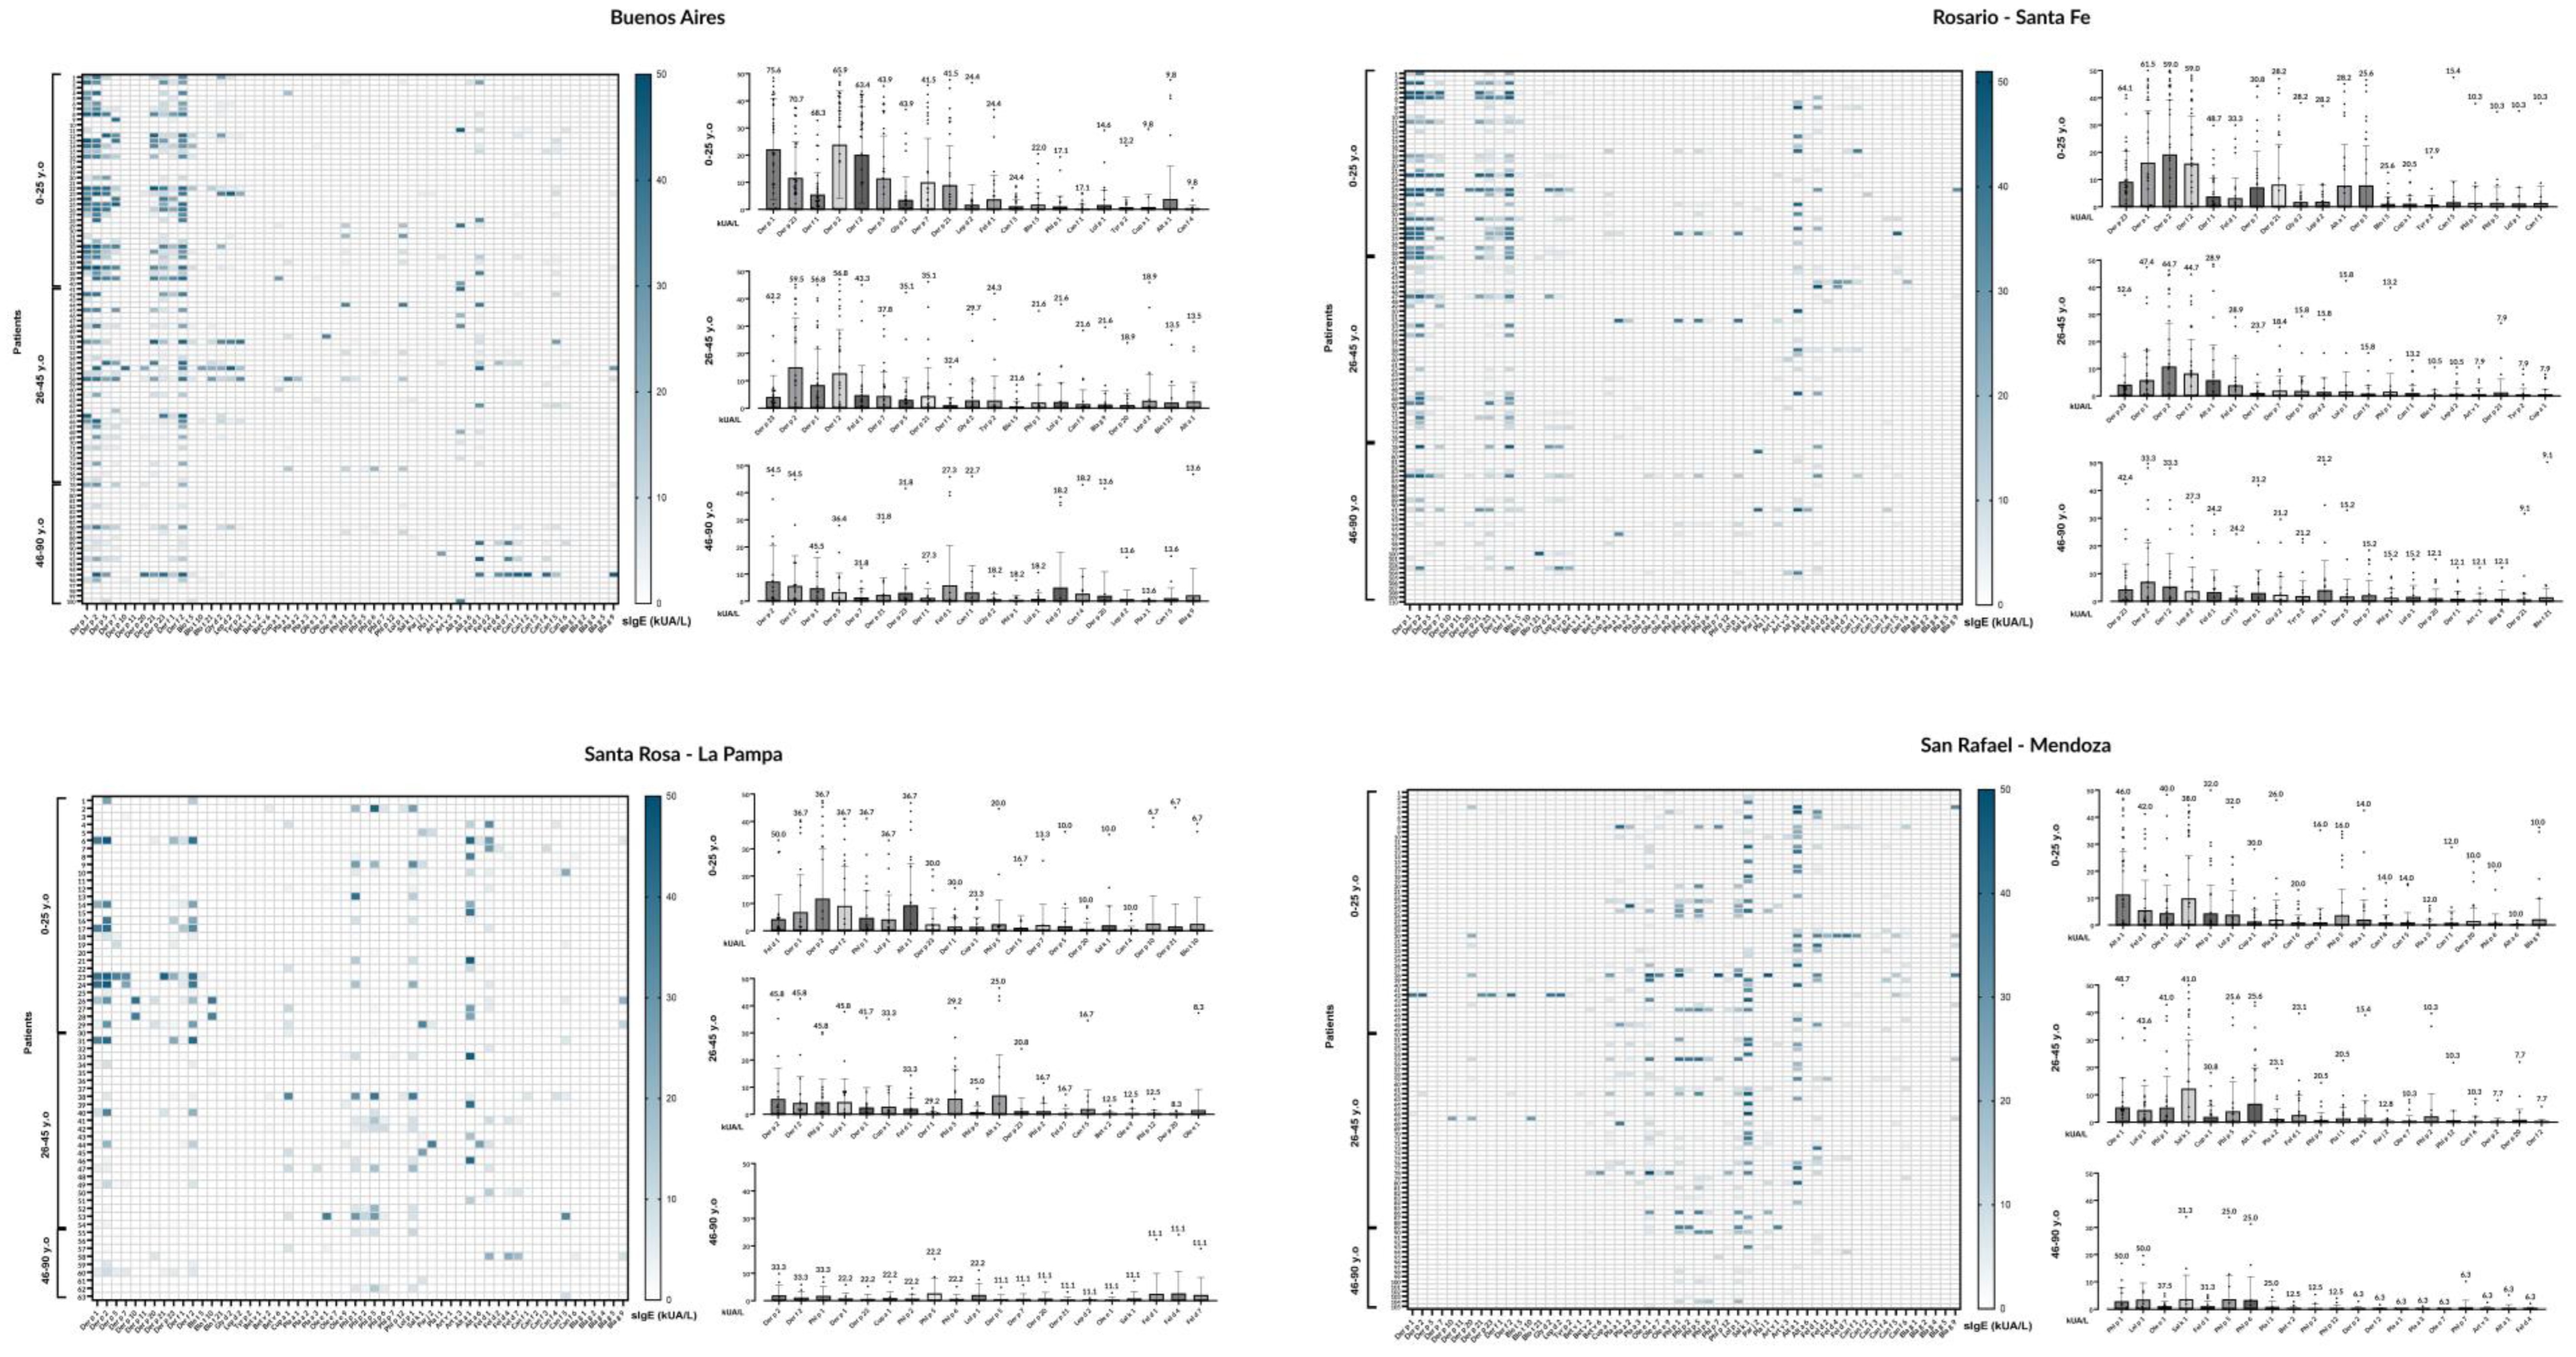
Figure 2.
Heatmap of molecular sensitization profiles in rhinitis cohort (n=374). Rows represent individual participants grouped by ARIA phenotype; columns represent allergen molecules ordered by hierarchical clustering. The colour scale represents log-transformed sIgE [log(sIgE+1)]. MIR, mild intermittent rhinitis; MIR_Mod, moderate intermittent rhinitis; SIR, severe intermittent rhinitis; MPR, mild persistent rhinitis; MPR_Mod, moderate persistent rhinitis; SPR, severe persistent rhinitis.
Figure 2.
Heatmap of molecular sensitization profiles in rhinitis cohort (n=374). Rows represent individual participants grouped by ARIA phenotype; columns represent allergen molecules ordered by hierarchical clustering. The colour scale represents log-transformed sIgE [log(sIgE+1)]. MIR, mild intermittent rhinitis; MIR_Mod, moderate intermittent rhinitis; SIR, severe intermittent rhinitis; MPR, mild persistent rhinitis; MPR_Mod, moderate persistent rhinitis; SPR, severe persistent rhinitis.
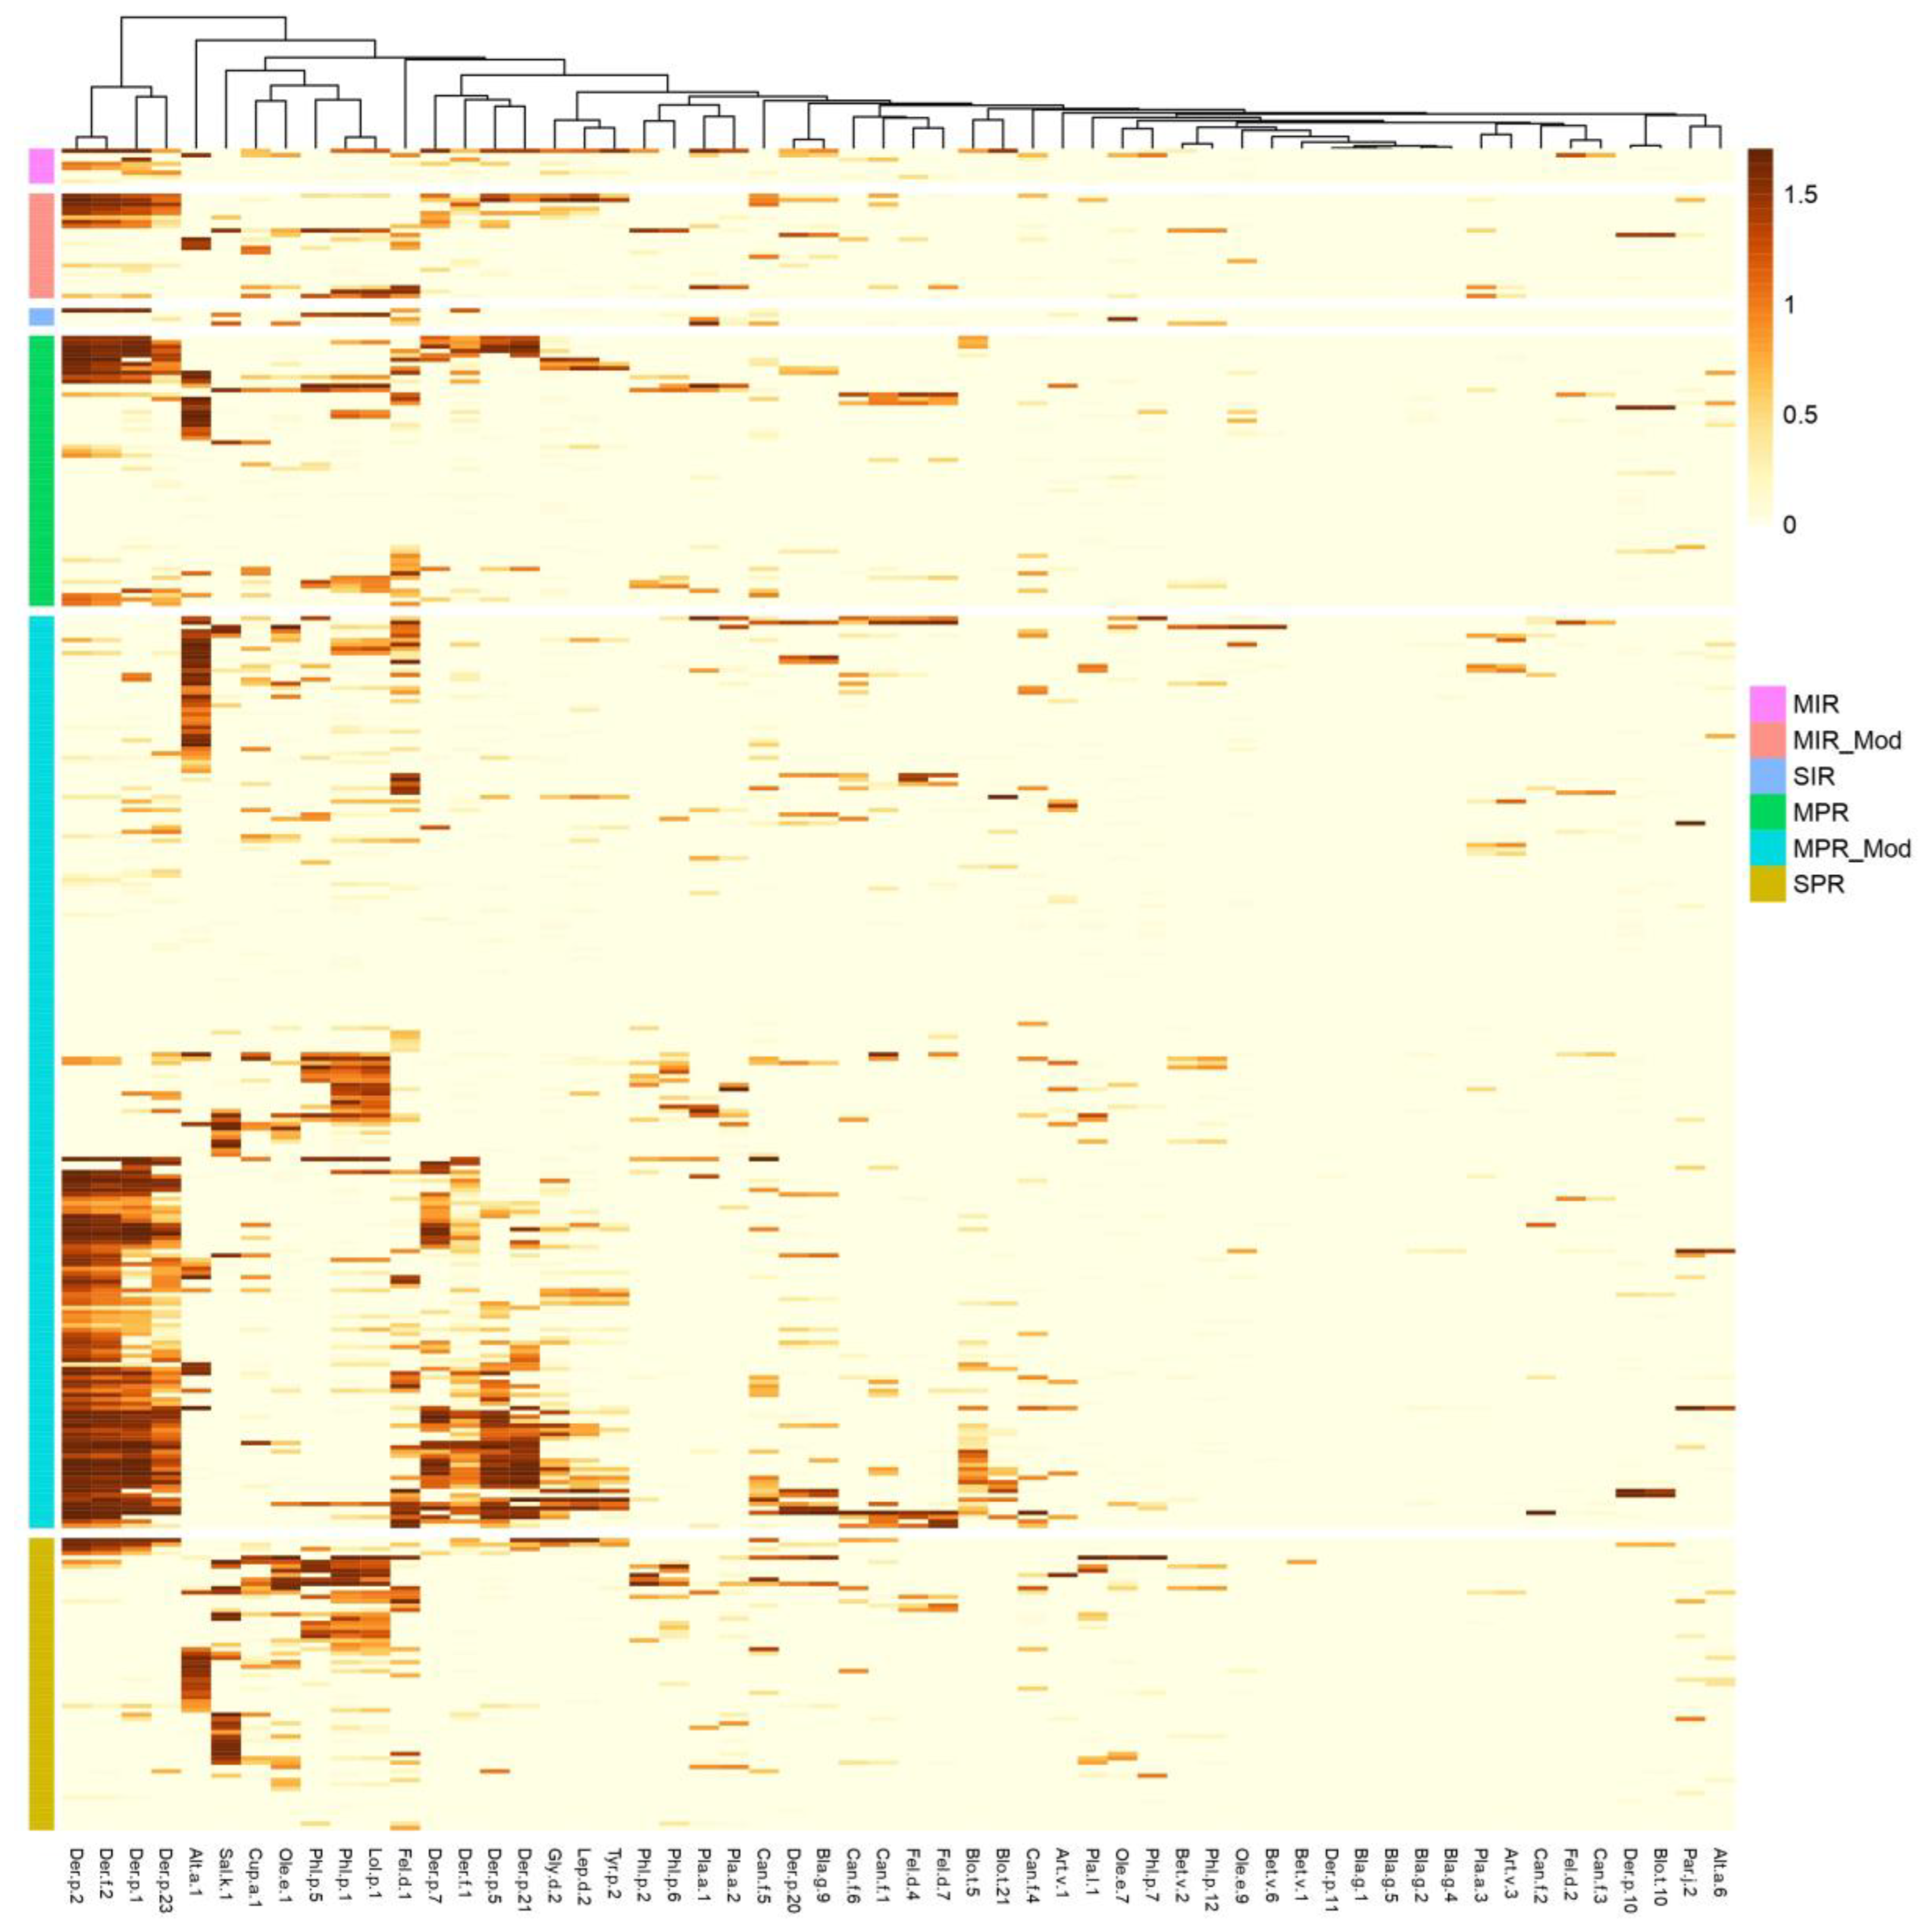
Figure 5.
Number of positive allergen molecules (sIgE≥0.30 kUA/L) across asthma phenotypes (n=186). Boxes show the median and interquartile range; whisker and point definitions should be specified. Kruskal-Wallis p=0.0127; Spearman ρ=0.184, p=0.0117.
Figure 5.
Number of positive allergen molecules (sIgE≥0.30 kUA/L) across asthma phenotypes (n=186). Boxes show the median and interquartile range; whisker and point definitions should be specified. Kruskal-Wallis p=0.0127; Spearman ρ=0.184, p=0.0117.
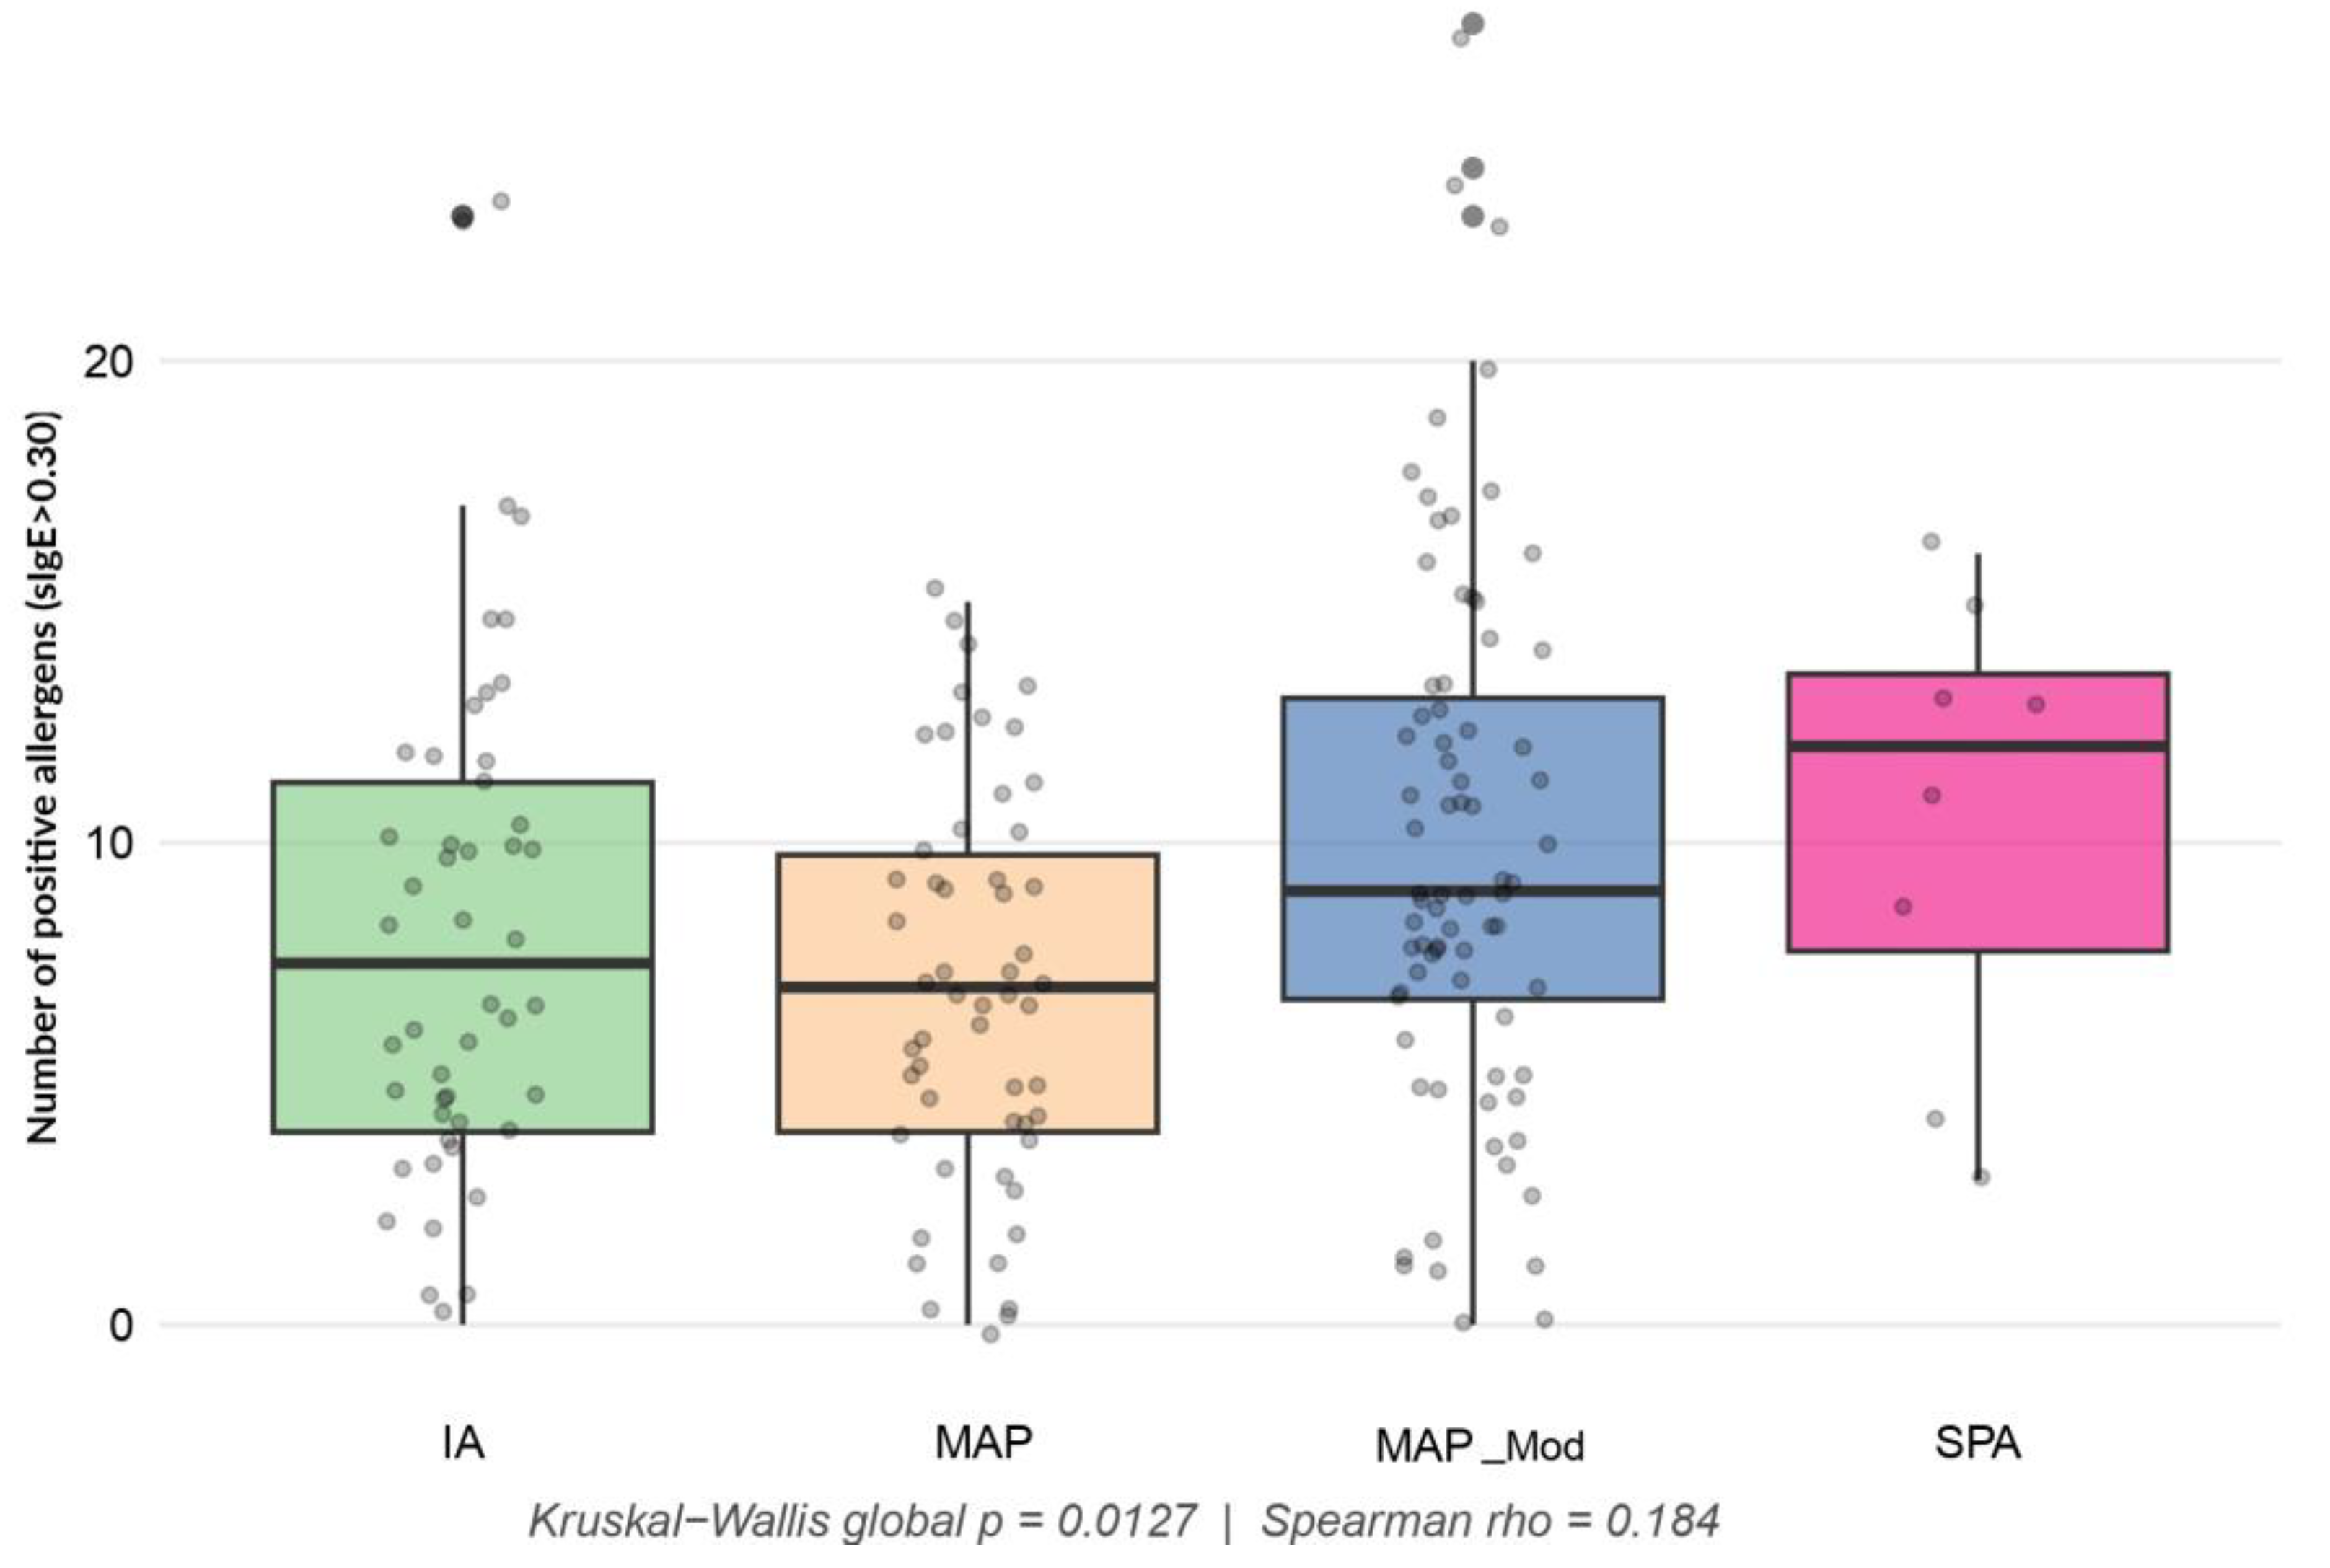
Figure 6.
Geographical location and Köppen–Geiger climate classification of the four Argentine recruitment regions. The background shows the 1991–2020 Köppen–Geiger climate classification (1-km resolution) according to Beck et al. Buenos Aires, Rosario-Santa Fe, and Santa Rosa-La Pampa are classified as Cfa, whereas San Rafael-Mendoza is classified as BWk. Insets show the local climate surrounding each recruitment centre. Adapted from Beck et al. (2023) under CC BY 4.0.
Figure 6.
Geographical location and Köppen–Geiger climate classification of the four Argentine recruitment regions. The background shows the 1991–2020 Köppen–Geiger climate classification (1-km resolution) according to Beck et al. Buenos Aires, Rosario-Santa Fe, and Santa Rosa-La Pampa are classified as Cfa, whereas San Rafael-Mendoza is classified as BWk. Insets show the local climate surrounding each recruitment centre. Adapted from Beck et al. (2023) under CC BY 4.0.
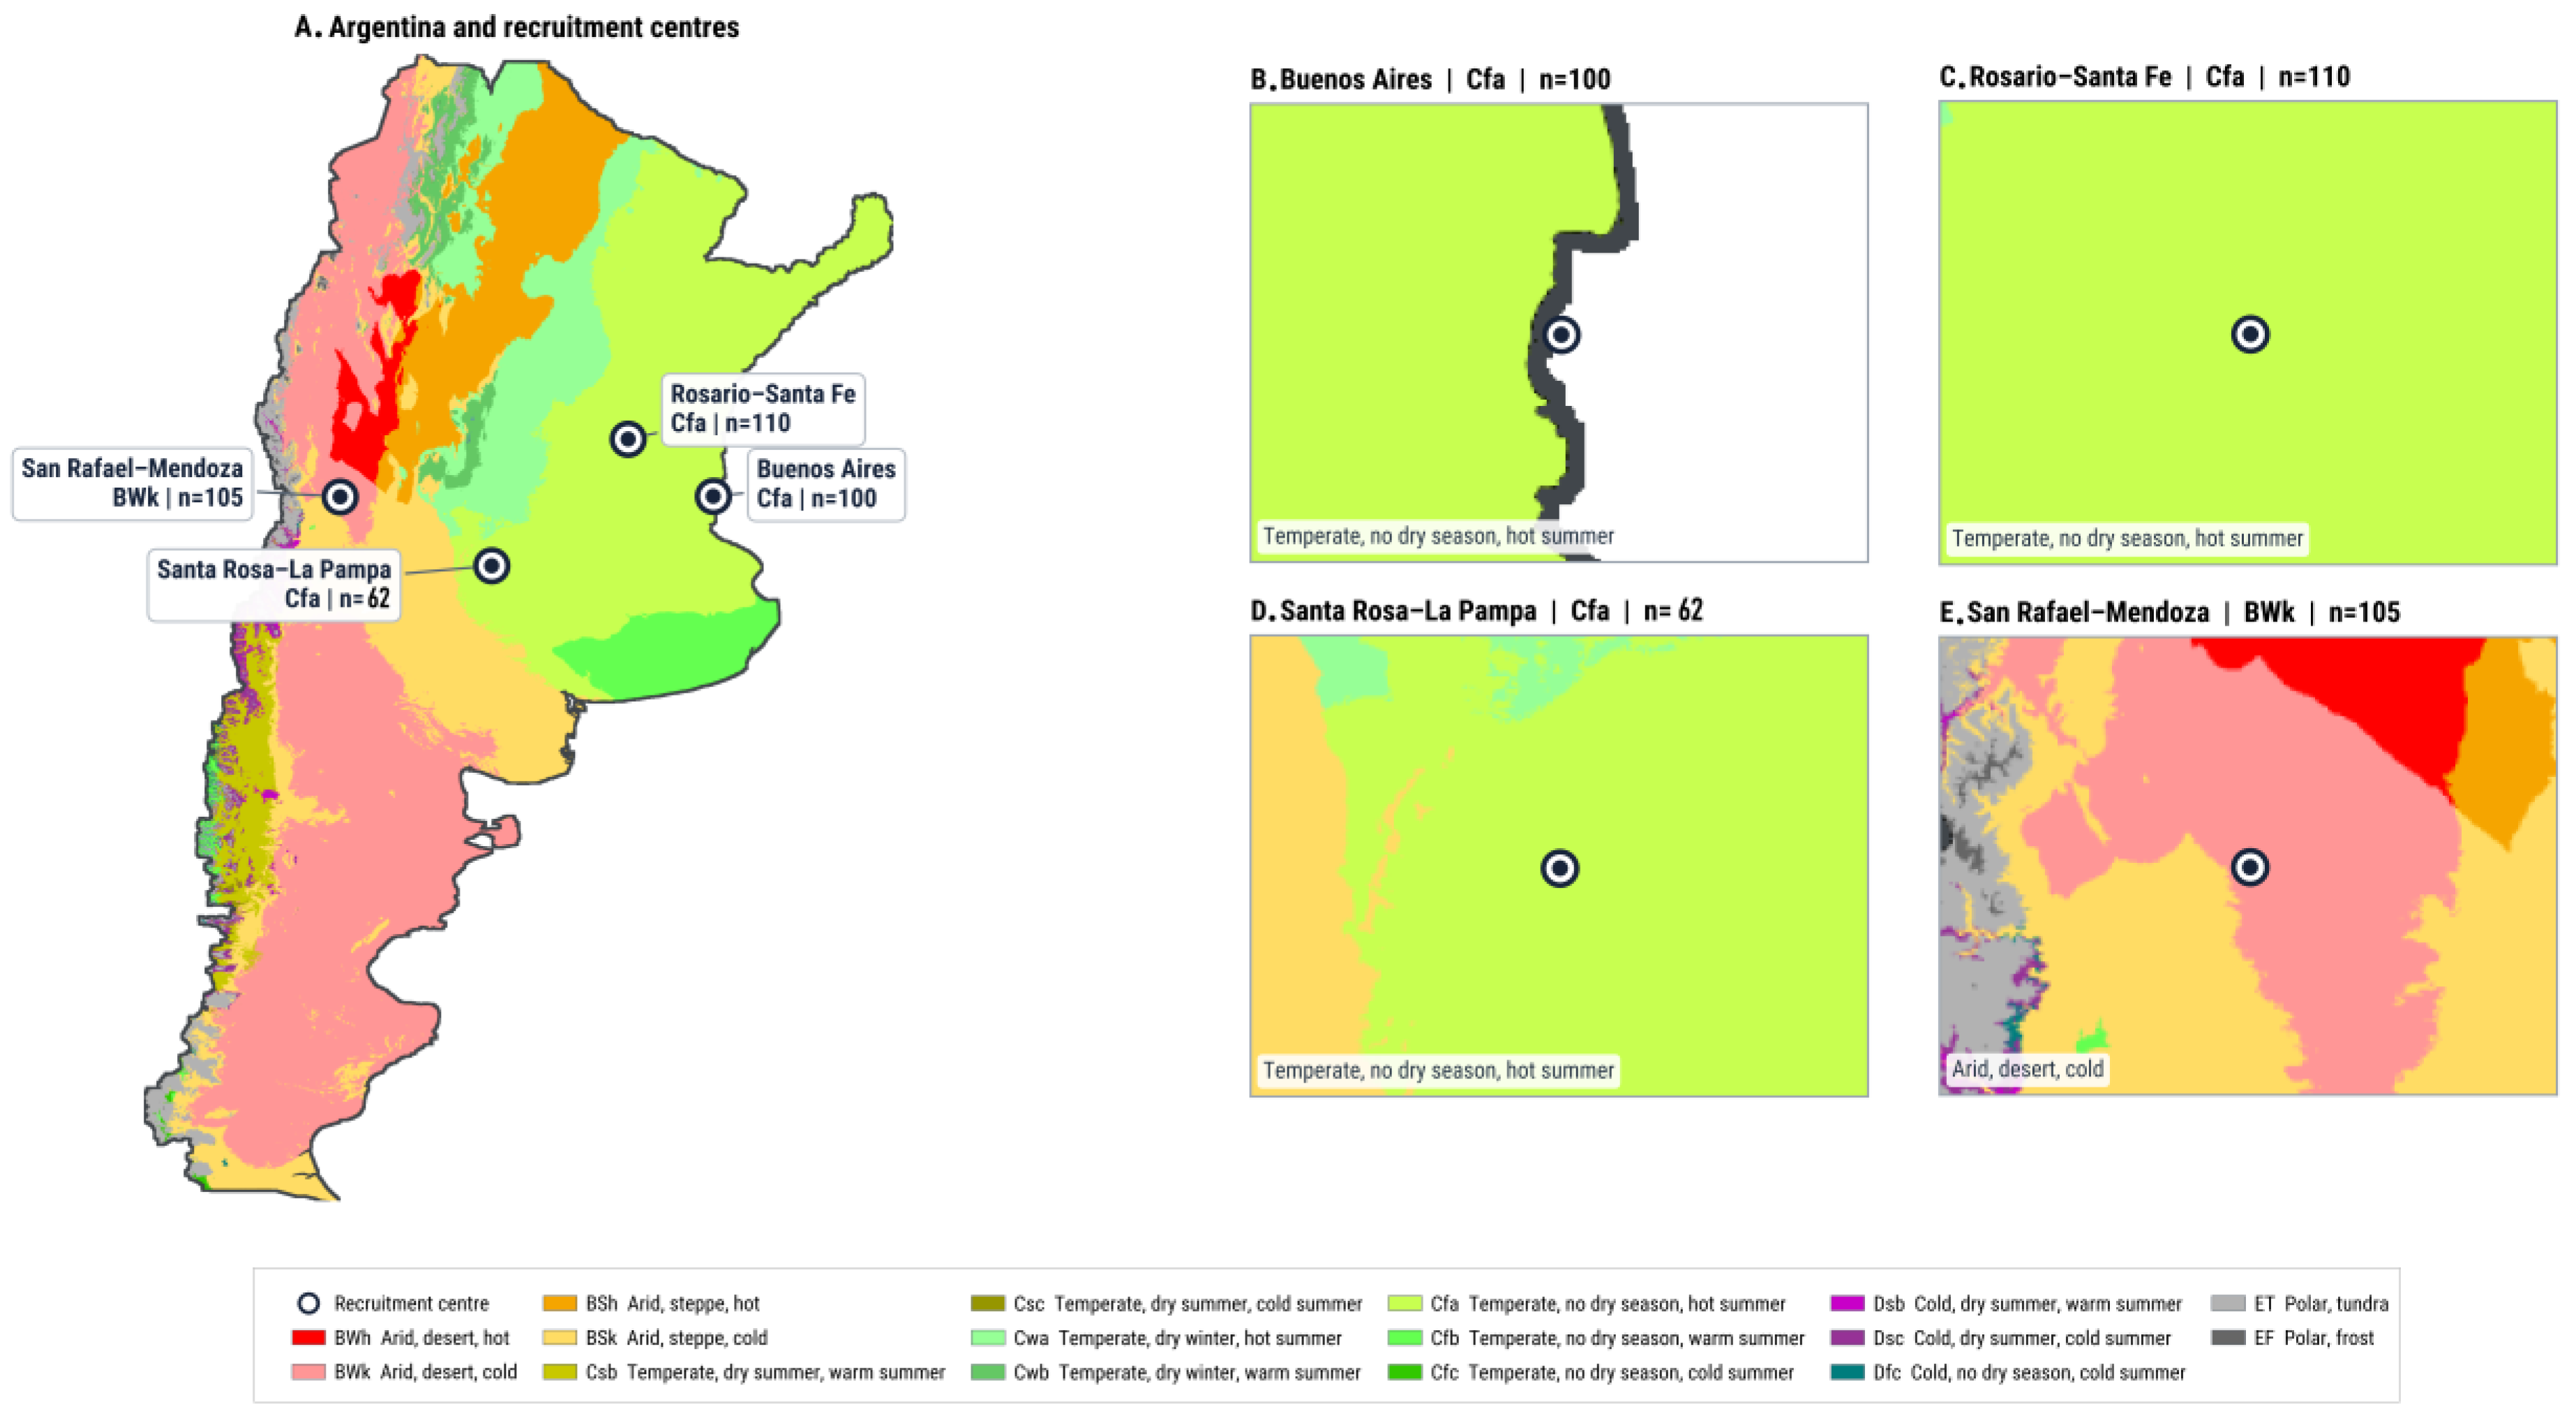
Table 1.
Demographic and clinical characteristics of the study population by geographical location (n=377).
Table 1.
Demographic and clinical characteristics of the study population by geographical location (n=377).
| Buenos Aires | Mendoza | Santa Rosa- La Pampa | Santa Fe-Rosario | |
|---|---|---|---|---|
| n=377 | 100 | 105 | 62 | 110 |
| Median range age (y.o.) | 32 (6-69) | 30 (5-69) | 28 (9-68) | 34 (8-65) |
| 5-25 y.o. (F/M) (n=162) | 41 (17/24) | 50 (27/23) | 30 (14/16) | 39 (23/16) |
| 26-45 y.o. (F/M) (n=136) | 37 (23/14) | 39 (25/14) | 23 (14/8) | 38 (27/11) |
| 46-69 y.o. (F/M) (n=79) | 22 (15/7) | 16 (13/3) | 9 (7/2) | 33 (23/10) |
| Sex (F/M) | 54/46 | 65/40 | 36/26 | 73/37 |
| Allergic Rhinitis (n=374) | 99.00% | 98.10% | 100.00% | 100.00% |
| Allergic Asthma (n=186) | 41.00% | 48.57% | 82.26% | 39.09% |
| Sensitization (SPT+) to any aeroallergen * | 100% | 66.66% | 96.83% | 74.55% |
| Median range Total IgE (IU/ml) | 699.03 (20-2,500) |
742.85 (20-2,500) |
594.40 (20-2,500) |
756.95 (20-2,500) |
* Mites, Moulds, Pollens or pet Dander. SPT: Skin Prick Test. HDM: House Dust Mites. SM: Storage Mites.
Table 3.
Serum sIgE to mite molecular allergens by recruitment centre. Data are mean±standard deviation (kUA/L); values in parentheses indicate the number of participants with positive sIgE for each component.
Table 3.
Serum sIgE to mite molecular allergens by recruitment centre. Data are mean±standard deviation (kUA/L); values in parentheses indicate the number of participants with positive sIgE for each component.
| Allergen | Buenos Aires | Rosario Santa Fe |
Santa Rosa La Pampa |
San Rafel Mendoza |
| Der p 1 | 13.2±17.0(62) | 8.1±14.3(49) | 4.3±10.6(23) | 0.4±3.9(2) |
| Der p 2 | 16.9±18.7(61) | 12.1±17.3(51) | 8.1±14.7(25) | 0.5±4.3(5) |
| Der p 5 | 6.5±12.3(39) | 3.7±10.1(21) | 0.9±4.7(5) | 0.0±0.0(0) |
| Der p 7 | 6.0±12.1(38) | 3.6±9.1(24) | 1.1±5.3(6) | 0.0±0.0(0) |
| Der p 10 | 0.5±4.3(4) | 0.0±0.2(1) | 1.3±7.0(3) | 0.3±2.6(2) |
| Der p 11 | 0.0±0.0(0) | 0.0±0.0(0) | 0.0±0.0(0) | 0.0±0.0(0) |
| Der p 20 | 0.9±4.8(12) | 0.6±3.6(7) | 0.5±1.8(6) | 1.0±4.1(8) |
| Der p 21 | 5.8±11.9(37) | 3.6±10.2(17) | 0.9±5.8(4) | 0.3±3.1(1) |
| Der p 23 | 6.9±11.2(59) | 5.2±9.0(59) | 1.7±5.1(16) | 0.3±3.3(1) |
| Der f 1 | 2.9±6.1(47) | 1.6±4.5(32) | 0.9±2.5(16) | 0.1±0.5(5) |
| Der f 2 | 14.2±16.7(59) | 9.5±14.5(51) | 6.1±12.0(25) | 0.5±4.0(5) |
| Blo t 5 | 1.1±3.2(19) | 0.5±1.8(17) | 0.1±0.7(1) | 0.0±0.0(0) |
| Blo t 10 | 0.4±2.8(4) | 0.0±0.1(1) | 1.2±6.7(3) | 0.3±2.9(2) |
| Blo t 21 | 0.9±4.1(8) | 0.6±4.7(7) | 0.0±0.0(0) | 0.0±0.0(0) |
| Gly d 2 | 2.6±7.0(34) | 1.5±5.5(24) | 0.0±0.2(2) | 0.4±3.9(1) |
| Lep d 2 | 1.9±7.7(20) | 1.7±5.8(24) | 0.1±0.2(3) | 0.4±4.0(1) |
| Tyr p 2 | 1.4±6.0(16) | 0.8±3.1(17) | 0.0±0.0(0) | 0.0±0.4(2) |
Table 4.
Prevalence of sensitization to three pollen species and a mixture of grass pollens, as determined by skin prick testing, in four Argentine cities. Values are expressed as percentages; values in parentheses indicate the number of participants with a positive skin prick test for each mite (n/N).
Table 4.
Prevalence of sensitization to three pollen species and a mixture of grass pollens, as determined by skin prick testing, in four Argentine cities. Values are expressed as percentages; values in parentheses indicate the number of participants with a positive skin prick test for each mite (n/N).
| Frequency (%) | Buenos Aires | Rosario Santa Fe |
Santa Rosa La Pampa |
San Rafel Mendoza |
| Mixture of 6 grass pollens | 32.0 (32/100) | 0.0 (0/110) | - | 65.7 (69/105) |
| Olea europaea | 19.0 (19/100) | 10.0 (11/110) | 53.2 (33/62) | 60.9 (64/105) |
| Artemisia vulgaris | 16.0 (16/100) | 0.9 (1/110) | 25.8 (16/62) | 24.8 (26/105) |
| Ambrosia elatior | 24.0 (24/100) | 5.5 (6/110) | 40.3 (25/62) | 19.1 (20/105) |
Table 5.
Serological analysis. Mean (± standard deviation) of specific IgE levels (kUA/L) to mite molecular allergens in patients from all four centres. Values in parentheses indicate the number of sensitized patients (n) for each allergen.
Table 5.
Serological analysis. Mean (± standard deviation) of specific IgE levels (kUA/L) to mite molecular allergens in patients from all four centres. Values in parentheses indicate the number of sensitized patients (n) for each allergen.
| Allergen | Buenos Aires | Rosario Santa Fe |
Santa Rosa La Pampa |
San Rafel Mendoza |
| Bet v 1 | 0.0±0.0(0) | 0.0±0.0(0) | 0.0±0.0(0) | 0.1±0.6(1) |
| Bet v 2 | 0.0±0.1(3) | 0.0±0.1(1) | 0.2±0.7(4) | 0.3±1.5(8) |
| Bet v 6 | 0.0±0.0(0) | 0.0±0.0(0) | 0.0±0.0(0) | 0.3±2.8(1) |
| Cup a 1 | 0.5±3.2(9) | 0.6±2.1(13) | 1.9±5.2(17) | 1.4±3.9(27) |
| Pla a 1 | 0.9±4.6(10) | 0.9±5.4(8) | 0.0±0.0(0) | 1.5±6.4(14) |
| Pla a 2 | 0.2±1.8(4) | 0.2±1.5(4) | 0.0±0.0(0) | 1.4±5.4(22) |
| Pla a 3 | 0.0±0.2(3) | 0.0±0.3(2) | 0.1±1.2(1) | 0.3±1.4(9) |
| Fra e 1 | 0.1±0.4(3) | 0.2±1.0(6) | 0.3±1.3(7) | 3.1±8.5(39) |
| Ole e 1 | 0.1±0.5(3) | 0.2±1.1(6) | 0.7±4.7(5) | 4.3±9.7(45) |
| Ole e 7 | 0.4±3.6(3) | 0.1±0.4(4) | 0.0±0.1(1) | 0.7±3.7(13) |
| Ole e 9 | 0.0±0.0(1) | 0.0±0.1(2) | 0.2±0.9(5) | 0.5±3.3(5) |
| Phl p 1 | 1.3±4.7(19) | 1.2±5.4(14) | 4.2±8.6(25) | 4.5±10.1(40) |
| Phl p 2 | 0.1±0.7(3) | 0.1±0.6(3) | 0.6±1.9(7) | 1.3±5.9(10) |
| Phl p 5 | 0.0±0.4(2) | 1.1±5.4(8) | 3.7±9.3(15) | 3.8±9.8(22) |
| Phl p 6 | 0.3±2.0(3) | 0.2±1.0(6) | 0.5±1.7(10) | 1.2±4.4(17) |
| Phl p 7 | 0.0±0.1(2) | 0.1±0.3(2) | 0.0±0.4(1) | 1.0±6.0(5) |
| Phl p 12 | 0.0±0.0(0) | 0.0±0.2(1) | 0.2±1.2(5) | 0.5±2.4(9) |
| Lol p 1 | 1.7±5.6(18) | 1.2±5.6(15) | 4.0±8.2(24) | 4.0±8.5(41) |
| Sal k 1 | 0.1±0.6(2) | 0.1±0.5(1) | 1.5±5.9(6) | 9.8±15.9(40) |
| Par j 2 | 0.0±0.4(1) | 0.9±5.8(7) | 0.8±4.8(4) | 0.1±0.5(8) |
| Pla l 1 | 0.0±0.4(1) | 0.0±0.0(0) | 0.0±0.0(0) | 1.4±5.8(16) |
| Bet v 1 | 0,0±0,0(0) | 0,0±0,0(0) | 0,0±0,0(0) | 0,1±0,6(1) |
| Bet v 2 | 0,0±0,1(3) | 0,0±0,1(1) | 0,2±0,7(4) | 0,3±1,5(8) |
| Bet v 6 | 0,0±0,0(0) | 0,0±0,0(0) | 0,0±0,0(0) | 0,3±2,8(1) |
| Art v 1 | 0.4±2.8(6) | 0.4±1.9(9) | 0.0±0.1(2) | 0.5±3.8(3) |
| Art v 3 | 0.0±0.1(1) | 0.3±1.9(3) | 0.0±0.2(1) | 0.2±1.0(6) |
| Amb a 1 | 0.2±1.4(2) | 0.0±0.2(1) | 0.0±0.1(1) | 0.0±0.0(0) |
| Amb a 4 | 0.2±1.2(4) | 0.2±0.8(5) | 0.0±0.0(0) | 0.0±0.3(1) |
Table 6.
Prevalence of sensitization to four mold species by skin prick test in four Argentine cities (%; positive cases shown as n/N).
Table 6.
Prevalence of sensitization to four mold species by skin prick test in four Argentine cities (%; positive cases shown as n/N).
| Frequency (%) | Buenos Aires | Santa Fe Rosario |
Santa Rosa La Pampa |
San Rafael Mendoza |
| Alternaria alternata | 12.0 (12/100) | 21.8 (24/110) | 32.3 (20/62) | 33.3 (35/105) |
| Cladosporium herbarum | 1.0 (1/100) | 9.1 (10/110) | 3.2 (2/62) | 4.8 (5/105) |
| Penicillium notatum | 1.0 (1/100) | 5.5 (6/110) | 4.8 (3/62) | 2.9 (3/105) |
| Aspergillus fumigatus | 2.0 (2/100) | 10.0 (11/110) | 6.5 (4/62) | 4.8 (5/105) |
Table 8.
Prevalence of sensitization to cat and dog dander by skin prick test in four Argentine cities (%; positive cases shown as n/N).
Table 8.
Prevalence of sensitization to cat and dog dander by skin prick test in four Argentine cities (%; positive cases shown as n/N).
| Frequency (%) | Buenos Aires | Santa Fe Rosario |
Santa Rosa La Pampa |
San Rafael Mendoza |
| Cat dander | 23.0 (23/100) | 7.3 (8/110) | 37.1 (23/62) | 26.7 (28/105) |
| Dog dander | 23.0 (23/100) | 17.3 (19/110) | 38.7 (24/62) | 33.3 (35/105) |
Table 9.
Serum sIgE to cat and dog allergen molecules by recruitment centre. Data are mean ± standard deviation (kUA/L); values in parentheses indicate the number of participants with positive sIgE for each component.
Table 9.
Serum sIgE to cat and dog allergen molecules by recruitment centre. Data are mean ± standard deviation (kUA/L); values in parentheses indicate the number of participants with positive sIgE for each component.
| Allergen | Buenos Aires | Rosario Santa Fe |
Santa Rosa La Pampa |
San Rafael Mendoza |
| Fel d 1 | 4.6±11.0(32) | 3.0±7.9(32) | 3.2±7.2(24) | 3.7±8.9(35) |
| Fel d 2 | 0.0±0.0(0) | 0.2±1.2(4) | 0.1±0.8(3) | 0.4±2.7(2) |
| Fel d 4 | 0.7±3.8(6) | 0.7±4.3(4) | 0.6±3.2(4) | 0.5±3.7(4) |
| Fel d 7 | 1.2±6.3(7) | 0.5±2.9(7) | 0.5±2.6(5) | 0.7±4.4(6) |
| Can f 1 | 1.1±4.9(16) | 0.9±4.1(11) | 0.1±0.9(3) | 0.4±2.9(9) |
| Can f 2 | 0.5±4.7(4) | 0.1±1.3(1) | 0.0±0.0(0) | 0.0±0.2(3) |
| Can f 3 | 0.0±0.0(1) | 0.1±0.3(4) | 0.2±1.2(1) | 0.1±0.6(2) |
| Can f 4 | 0.9±4.5(12) | 0.3±1.5(5) | 0.3±1.4(4) | 0.5±2.1(10) |
| Can f 5 | 1.3±3.9(22) | 0.9±4.7(20) | 1.4±5.4(10) | 0.6±2.6(11) |
| Can f 6 | 0.8±5.1(9) | 0.3±2.1(3) | 0.1±0.6(3) | 0.6±2.1(14) |
Table 10.
Prevalence of sensitization to cockroach by skin prick test in four Argentine cities (%; positive cases shown as n/N).
Table 10.
Prevalence of sensitization to cockroach by skin prick test in four Argentine cities (%; positive cases shown as n/N).
| Frequency (%) | Buenos Aires | Santa Fe Rosario |
Santa Rosa La Pampa |
San Rafael Mendoza |
| Periplaneta americana | 43.0 (43/100) | 98.2 (108/110) | 95.2 (59/62) | 4.8 (5/105) |
Table 11.
Serum sIgE to cockroach allergen molecules by recruitment centre. Data are mean ± standard deviation (kUA/L); values in parentheses indicate the number of participants with positive sIgE for each component.
Table 11.
Serum sIgE to cockroach allergen molecules by recruitment centre. Data are mean ± standard deviation (kUA/L); values in parentheses indicate the number of participants with positive sIgE for each component.
| Allergen | Buenos Aires | Rosario Santa Fe |
Santa Rosa La Pampa |
San Rafael Mendoza |
| Bla g 1 | 0.0±0.0(0) | 0.0±0.0(0) | 0.0±0.0(0) | 0.0±0.0(0) |
| Bla g 2 | 0.0±0.0(0) | 0.0±0.1(2) | 0.0±0.1(1) | 0.0±0.0(0) |
| Bla g 4 | 0.0±0.0(0) | 0.0±0.0(0) | 0.0±0.1(1) | 0.0±0.0(0) |
| Bla g 5 | 0.0±0.0(0) | 0.0±0.0(0) | 0.0±0.0(0) | 0.0±0.0(0) |
| Bla g 9 | 1.1±5.6(13) | 0.4±3.2(7) | 0.8±3.3(6) | 1.3±5.5(8) |
Table 12.
Number of patients with allergic rhinitis (AR) or allergic asthma (AA) by age group and geographical location.
Table 12.
Number of patients with allergic rhinitis (AR) or allergic asthma (AA) by age group and geographical location.
| Buenos Aires | Mendoza | Santa Rosa- La Pampa | Santa Fe-Rosario | |||||
|---|---|---|---|---|---|---|---|---|
| Age range (y. o.) | AR | AA | AR | AA | AR | AA | AR | AA |
| 5-25 | 40 | 15 | 49 | 27 | 30 | 24 | 39 | 10 |
| 26-45 | 37 | 18 | 38 | 18 | 23 | 21 | 38 | 16 |
| 46-68 | 22 | 8 | 16 | 6 | 9 | 6 | 33 | 17 |
| Total | 99 | 41 | 103 | 51 | 62 | 51 | 110 | 43 |
Disclaimer/Publisher’s Note: The statements, opinions and data contained in all publications are solely those of the individual author(s) and contributor(s) and not of MDPI and/or the editor(s). MDPI and/or the editor(s) disclaim responsibility for any injury to people or property resulting from any ideas, methods, instructions or products referred to in the content. |
© 2026 by the authors. Licensee MDPI, Basel, Switzerland. This article is an open access article distributed under the terms and conditions of the Creative Commons Attribution (CC BY) license (http://creativecommons.org/licenses/by/4.0/).
Copyright: This open access article is published under a Creative Commons CC BY 4.0 license, which permit the free download, distribution, and reuse, provided that the author and preprint are cited in any reuse.