

Submitted:
04 August 2026
Posted:
05 August 2026
You are already at the latest version
Abstract
Habitat fragmentation caused by human activities threatens plant genetic diversity, but the mechanisms shaping gene flow and spatial genetic structure in epiphytic orchids remain poorly understood. Here, we investigated the genetic structure and gene flow patterns of the epiphytic orchid Rhynchostylis gigantea in a human-modified landscape on Hainan Island, China, using genome-wide SNP markers. Based on 2005 high-quality SNPs from 275 individuals, we assessed genetic diversity, population differentiation, and fine-scale spatial genetic structure (FSGS), and further explored mating patterns through parentage analysis of 100 F1 offspring. The adult population maintained moderate genetic diversity (Ho = 0.243), whereas offspring cohorts showed stronger heterozygote deficiency (Fis = 0.198), suggesting restricted effective gene flow and non-random mating. The two subpopulations separated by agricultural fields exhibited moderate genetic differentiation (Fst = 0.079), indicating reduced genetic connectivity caused by landscape fragmentation. Significant FSGS was detected across the population and subpopulations, with three-dimensional spatial analyses revealing the influence of both spatial distance and host-tree distribution. Parentage analysis showed frequent selfing and repeated paternal contributions within maternal plants, suggesting that pollinator behavior promoted localized mating. Our results demonstrate that the genetic structure of R. gigantea is shaped by the combined effects of mixed mating systems, limited seed dispersal, host-tree dependence, and habitat fragmentation. Conservation of epiphytic orchids should therefore integrate the protection of orchid populations, host trees, and landscape connectivity to maintain long-term genetic diversity.
Keywords:
Rhynchostylis gigantea
; epiphytic orchid
; fine-scale spatial genetic structure
; gene flow
; parentage analysis
; habitat fragmentation
1. Introduction
Tropical rainforests represent one of the most biodiversity-rich ecosystems on Earth. However, driven by socioeconomic development, extensive forest clearing and land-use conversion continue to occur worldwide. These processes inevitably result in the reduction and fragmentation of forest habitats, transforming formerly continuous forest landscapes into isolated patches [1]. Such spatial isolation not only alters the distribution patterns of plant communities but also directly affects gene exchange among plant populations and their spatial genetic structure [2,3]. For plant species that rely on pollen and seed dispersal to maintain genetic connectivity, reduced gene flow may increase the risks of inbreeding depression and genetic drift, ultimately compromising population adaptive potential [4,5]. Therefore, under the accelerating pressures of forest loss and habitat fragmentation, understanding the role of gene flow in maintaining plant population dynamics and genetic diversity has become a central issue in conservation biology and evolutionary ecology.
As one of the largest families of angiosperms worldwide, Orchidaceae exhibits unique characteristics of gene flow that differ from those of many other plant groups [6]. Orchid seeds are characterized as “dust-like” seeds, which theoretically enable long-distance dispersal by wind [7]. However, increasing evidence indicates that seed dispersal in orchids is constrained by multiple ecological and biological factors [6,8]. Moreover, orchid seeds lack endosperm, and their germination is entirely dependent on the establishment of symbiotic associations with mycorrhizal fungi, which provide essential nutrients required for germination and early seedling development. Therefore, mycorrhizal fungi play a critical role in orchid mineral nutrition, particularly during the seedling stage, when they are key determinants of orchid establishment and survival [9,10,11]. Because the enrichment and availability of suitable mycorrhizal fungi are often associated with adult orchid individuals, which function as localized fungal reservoirs or “nurse sites”, orchid seed germination frequently occurs in close proximity to maternal plants [6,8]. This spatially restricted recruitment pattern can facilitate the formation of fine-scale spatial genetic structure (FSGS) within orchid populations [12].
Pollen flow represents a critical component of plant gene flow, not only determining the extent of genetic exchange among populations but also profoundly influencing plant genetic structure and adaptive potential [13]. Although some orchid species are capable of reproducing through self-pollination [14], the majority of orchids rely on pollinators for sexual reproduction, and their reproductive success and patterns of gene flow are largely determined by pollinator behavior and ecological interactions [15]. Based on their pollination mechanisms, orchids can be broadly categorized into two major groups: deceptive pollination and reward-based pollination [16]. Deceptive pollination is a prominent characteristic of Orchidaceae, with approximately one-third of orchid species providing no floral rewards such as nectar or pollen. Instead, these species attract pollinators through deceptive strategies, including floral mimicry, sexual deception, and the manipulation of floral traits such as shape and coloration [6,17]. Such strategies often result in shorter residence times of pollinators on individual plants and increase movement distances among plants, thereby facilitating long-distance pollen-mediated gene flow. In contrast, reward-based pollination attracts pollinators by providing resources such as nectar, increasing visitation frequency within local areas. Although this strategy can enhance reproductive success, it may also promote geitonogamous pollination and localized genetic exchange, thereby increasing the potential risk of inbreeding depression [5]. Therefore, before investigating gene flow patterns in orchids, it is essential to first clarify the strategies by which they attract and interact with pollinators.
Nearly 70% of orchid species are epiphytes [18], and this life form is considered one of the most important evolutionary innovations in Orchidaceae, with profound impacts on their survival, speciation, dispersal, and diversification [19]. However, current studies on gene flow in orchids have largely focused on terrestrial orchids, particularly species inhabiting forest floors or herbaceous layers [2,15,20,21]. In contrast, gene flow patterns in epiphytic orchids remain comparatively poorly understood. Because epiphytic orchids inhabit three-dimensional environments, including tree trunks, branches, and canopies, their gene flow processes are jointly influenced by host tree distribution patterns, forest structure, and microenvironmental conditions within the canopy [12,22]. Consequently, epiphytic orchids may exhibit gene flow patterns distinct from those of terrestrial orchids, and their population genetic structures are likely to be more difficult to predict.
First, spatial positioning may generate differences between horizontal and vertical genetic structures [23]. Horizontal structure may arise when individuals growing on the same branch exhibit higher genetic relatedness, whereas vertical structure may occur when individuals occupying different branches but located within the same vertical plane show closer genetic relationships [22,23]. Second, the height at which seeds are released may influence their dispersal distance and colonization range. Finally, founder number and colonization origin may also play important roles in shaping genetic structure. If each host tree is colonized by only one or a few founder individuals, genetic structure may emerge at the tree level (tree-scale SGS), while genetic relatedness among individuals inhabiting different host trees may remain relatively low [22]. In addition, epiphytic orchids often exhibit sequential colonization patterns, whereby offspring gradually establish on neighboring host trees over time [22]. Therefore, within a population, epiphytic orchids occupying adjacent host trees may exhibit closer genetic relationships and are more likely to form spatial genetic structures.
Understanding gene flow in epiphytic orchid populations therefore requires consideration not only of horizontal dispersal but also of potential vertical dispersal processes. Moreover, within epiphytic habitats, mycorrhizal fungi are not only essential for seed germination and seedling establishment but may also connect orchid individuals occupying different spatial locations through shared mycorrhizal networks extending across host tree surfaces [24]. Consequently, even when seeds do not land near maternal plants, they may still have a relatively high probability of successful germination through access to shared fungal networks. This suggests that seeds derived from fruits produced through short-distance pollination may, after dispersal, successfully establish away from maternal plants via mycorrhizal networks, thereby partially weakening the spatial clustering effect caused by restricted pollen flow. However, this mechanism is highly dependent on the availability and continuity of suitable host trees.
For epiphytic orchids, the presence of host trees is fundamental to population establishment and long-term persistence due to the inherent constraints imposed by their growth habit. Epiphytic orchid species associated with different host trees often exhibit significant differences in survival, growth rates, and reproductive performance, which directly contribute to variation in population growth rates [25]. Research has demonstrated that Bombax ceiba is a true umbrella tree species, providing shelter and habitat resources for a wide range of animals and plants [26]. Owing to its tall trunk, sparse canopy foliage, and other structural characteristics, the bark of B. ceiba is relatively dry, making it an important host for drought-tolerant epiphytic orchid communities. For example, in regions such as India and Nepal, orchids represent one of the dominant groups of epiphytic plants inhabiting B. ceiba trees [27,28].
B. ceiba flowers in early spring, producing abundant flowers before leaf emergence. Its nectar and fleshy petals provide important seasonal food resources for a variety of mammals, birds, and insects. In southern India, B. ceiba has been observed to provide food resources or habitat for more than 40 animal species [26]. Animal activities on host trees may deposit excreta onto the bark surface, which not only supplies additional nutrients but, more importantly, may introduce symbiotic fungi required by orchids. Mangan and Adler (2002) detected spores of arbuscular mycorrhizal fungi in the feces of major arboreal rodents, suggesting that although orchids are sessile organisms, they may have access to diverse sources of symbiotic fungi through animal-mediated dispersal. This process may facilitate plant growth and expand opportunities for seedling establishment and colonization of new habitats [29].
Human activities and associated land-use changes have inevitably contributed to the continuous reduction and degradation of orchid habitats. However, within the Hainan Tropical Rainforest National Park, several traditional villages inhabited by Li and Miao ethnic communities have preserved unique forest patches due to traditional customs and cultural beliefs, particularly through totem worship. These patches, commonly known as “fengshui forests”, are dominated by tree species such as Moraceae members (e.g., Antiaris toxicaria, Ficus altissima, and Ficus virens), B. ceiba, coconut (Cocos nucifera), and mango (Mangifera indica). They represent a traditional lifestyle characterized by long-term human–nature coexistence and provide a typical example of island tropical indigenous settlements adapted to local ecosystems.
Among these regions, Changjiang County in Hainan Province is renowned as the “hometown of kapok”. The preservation of numerous ancient Bombax ceiba trees in this region is largely attributed to the cultural reverence of the Li and Miao communities toward kapok trees, as well as their historical value as a fiber resource for traditional Li brocade production. These preserved kapok trees provide relatively safe and stable refuges for epiphytic orchids, including Rhynchostylis gigantea, Acampe papillosa, and Luisia morsei, allowing their populations to persist and reproduce within human-dominated landscapes [30].
R. gigantea is a typical drought-tolerant epiphytic orchid that commonly grows on the trunks and lateral branches of large trees, including B. ceiba, M. indica, and Bischofia javanica. Previous studies have shown that R. gigantea is a reward-based orchid that primarily relies on insects for outcrossing, while also possessing self-compatibility. Its reproductive success is therefore highly dependent on effective pollinator visitation and behavior [31].
In this study, we investigated gene flow patterns in R. gigantea, a representative tropical epiphytic orchid, within a human-modified landscape. Our study site was located in Jiangbian Township, Dongfang City, Hainan Province, China (108°56.671432′E, 18°54.061295′N), at an elevation of 136 m. The region is primarily characterized by agricultural land use, and R. gigantea individuals were mainly found growing on B. ceiba trees. The local population was spatially divided into two patches by a 60 × 120 m agricultural field (Figure 1). Specifically, we addressed the following questions: (1) What is the pattern of gene flow in R. gigantea, and does the human-modified landscape influence its gene flow dynamics? (2) Does R. gigantea exhibit tree-level fine-scale spatial genetic structure? (3) What is the level of genetic diversity of R. gigantea populations within human-dominated habitats, and do different populations exhibit significant genetic differentiation? The results of this study will provide important insights for population restoration and conservation management of R. gigantea.
2. Results
2.1. Dna Extraction and SNP Calling
Genomic DNA was extracted from 275 R. gigantea individuals using a modified CTAB method. Agarose gel electrophoresis (1.2%) revealed moderate variation in DNA quality among samples; however, the majority of samples exhibited clear major bands and met the requirements for subsequent library construction. Following sequencing, quality control, and molecular marker development, a total of 2,005 high-quality single nucleotide polymorphisms (SNPs) were retained for subsequent analyses.
2.2. Genetic Diversity
Genetic diversity indices were assessed in two adult populations (TTC-A and TTC-B) and a separate offspring population of R. gigantea (Table 1). Across the total adult sample (N = 175), the average Shannon’s information index (I), observed heterozygosity (Ho), and expected heterozygosity (He) were0.407、0.243 and 0.265, respectively, with a fixation index (Fi) of 0.082, indicating slight heterozygote excess at the population level. Within the TTC-A population (N = 153), genetic diversity was relatively higher (I = 0.410), with Ho (0.245) marginally exceeding He (0.265), resulting in a negative Fi (0.088), suggestive of low inbreeding or random mating. In contrast, TTC-B (N = 22) exhibited lower diversity (I = 0.377), though it also showed a small heterozygote excess (Fi = 0.107). The separate offspring population (n = 100) showed I = 0.391 and He = 0.257, but a lower Ho = 0.198, resulting in a positive F = 0.198, which suggests a moderate deficiency of heterozygotes.
The analysis of molecular variance (AMOVA) revealed that 92% of the genetic variation was attributed to within-population differences, whereas only 8% was explained by variation among populations (Table 2). The genetic differentiation among populations was significant, with an Fst value of 0.079 (P < 0.001), indicating a moderate level of genetic differentiation between populations.
2.3. Fine-Scale Spatial Genetic Structure
As shown in Figure 2, R. gigantea exhibited FSGS both across the entire area (TTC) and within subpopulations TTC-A and TTC-B. In TTC-A, significant FSGS was detected within approximately 5 m (Sp = 0.0059), where individuals displayed relatively high genetic similarity; beyond this distance, the distribution became random, and at distances of around 30 m, a tendency toward uniform distribution was observed. In TTC-B, strong FSGS occurred within about 1 m (Sp = 0.0208), followed by a trend toward uniform distribution as geographic distance increased. Across the entire area (TTC), significant FSGS was observed within 6 m (Sp = 0.0087), with an additional signal of FSGS detected at d = 50 m. The ternary linear regression analysis of f(d) against log-transformed distance ln(d) further revealed curvature (k) values from the second derivative of the fitted curves: -0.01689 (TTC-A), 0.0908 (TTC-B), and 0.0364 (TTC). These results indicate that in population TTC-A, pollen dispersal was more restricted than seed dispersal (k < 0), whereas in TTC-B and in the entire TTC population, seed dispersal was more limited than pollen dispersal (Figure 2).
2.4. Mating System and Pollen Flow
The paternity analysis of R. gigantea using COLONY showed that the offspring of each capsule were assigned to a single full-sib family, indicating that seeds within a capsule were primarily sired by a single male parent (Table 3). Notably, both capsules of maternal plant TTC-7-6 (T7-6-1 and T7-6-2) were pollinated by TTC-7-6, suggesting repeated pollination by the same male parent, whereas the two capsules of maternal plant TTC-6-8 (T6-8-2 and T6-8-5) were sired by different fathers (TTC-6-11 and TTC-6-7, respectively). Most paternal assignments had a probability of 1.00, indicating high confidence in paternity identification; however, the father of capsule T4-50-2 had a lower assignment probability (0.41), implying some uncertainty and excluding TTC-3-16 as the true father. Among the ten capsules analyzed, four were selfed (T4-85-1, T6-9-6, T7-6-1, and T7-6-2), and six were outcrossed. Estimated pollen dispersal distances ranged from 0.300 m to 5.840 m, with a mean of 1.020 m, indicating predominantly short-distance pollen movement, although occasional longer-distance dispersal was observed.
3. Discussion
3.1. Genetic Diversity of Adult Plants and Progeny Populations
Understanding differences in genetic diversity between adult individuals and their offspring cohorts is critical for elucidating population regeneration dynamics and assessing potential genetic risks. Our results showed that the adult population of R. gigantea exhibited moderate levels of genetic diversity overall (Ho = 0.243), accompanied by a slight deficiency of heterozygotes (Fis = 0.082). In contrast, the offspring cohort displayed a more pronounced heterozygote deficiency (Fis = 0.198) (Table 1). Such differences in genetic structure between adults and offspring are commonly observed in perennial plants and fragmented populations, and may reflect processes such as reduced numbers of effective pollen donors, increased mating among neighboring individuals, or restricted intergenerational gene flow. These processes may result in offspring genetic structures deviating from expectations under random mating [32].
Long-lived adult individuals often retain genetic signatures shaped by historically higher levels of gene flow and larger effective population sizes, resulting in a phenomenon known as a “genetic time lag.” In contrast, offspring cohorts more directly reflect contemporary mating patterns and localized dispersal processes during recent reproductive events, and are therefore more susceptible to the effects of inbreeding, selfing, or limited pollen availability [33]. When population size declines or spatial isolation increases, heterozygosity often decreases first in newly recruited generations, whereas adult individuals may not immediately exhibit detectable losses of genetic diversity [5].
In orchids, mating systems play a significant role in shaping differences in genetic structure between generations. Many epiphytic orchids exhibit mixed mating systems characterized by predominant outcrossing combined with a certain degree of selfing ability [20]. When pollinator movement is restricted or floral architecture promotes geitonogamous pollination, the proportion of selfing may increase, resulting in reduced heterozygosity in offspring cohorts [34]. Previous studies have demonstrated that selfing not only increases homozygosity in progeny but may also reduce seedling survival through inbreeding depression, thereby further altering the genetic composition of offspring populations [35]. Therefore, the occurrence of heterozygote deficiency in offspring despite the maintenance of moderate genetic diversity in adults may indicate recent shifts in mating patterns.
Furthermore, seed dispersal and establishment processes may amplify these intergenerational differences. Although orchid seeds possess the potential for long-distance wind dispersal, successful establishment depends on suitable mycorrhizal fungal associations, and the effective dispersal distance is often considerably shorter than the theoretical dispersal potential [8,36]. If seeds predominantly germinate near maternal plants, offspring individuals are likely to exhibit higher genetic relatedness, resulting in reduced heterozygosity or elevated inbreeding coefficients at the population level. Such localized recruitment processes are considered important drivers of fine-scale spatial genetic structure formation in epiphytic orchids [12].
In this study, the two subpopulations of R. gigantea were separated by agricultural fields and exhibited a moderate level of genetic differentiation (Fst = 0.079). This result suggests that, although both seeds and pollen possess certain dispersal capabilities, agricultural land as a non-habitat landscape matrix may restrict gene flow between subpopulations [37]. The moderate Fst value indicates that a certain degree of genetic connectivity is still maintained; however, persistent habitat fragmentation may further reduce gene flow and increase the risk of local inbreeding over the long term [5].
3.2. Fine-Scale Spatial Genetic Structure
FSGS reflects the relationship between genetic similarity among individuals and spatial distance, and serves as an important tool for understanding seed dispersal, pollen-mediated gene flow, and population regeneration dynamics [38]. In this study, significant FSGS was detected in R. gigantea at both the overall population level and within the two subpopulations. The estimated Sp values fell within the range commonly reported for perennial woody plants and epiphytic species, indicating pronounced short-distance genetic clustering among individuals.
Although orchid seeds possess the potential for long-distance dispersal, most empirical studies have demonstrated that the spatial scale of seed-mediated gene flow in orchids is considerably restricted [6,8]. One possible explanation is that orchid seeds lack endosperm and require fungal symbionts for germination and seedling establishment [9]. This dependency may constrain successful recruitment to areas near maternal plants where compatible fungi are available, thereby promoting the formation of fine-scale spatial genetic structure [21]. In the present study, significant FSGS was observed across the entire study area (TTC) and in both subpopulations, consistent with the aggregated spatial distribution commonly reported in epiphytic orchids, which often experience limited pollen and seed dispersal [22].
At the overall population level (TTC), R. gigantea exhibited significant FSGS within a spatial scale of 6 m (Sp = 0.0087) (Figure 2). In addition, genetic clustering was detected at approximately 50 m, suggesting that genetic associations may persist at broader spatial scales due to ongoing gene flow or the spatial distribution pattern of host trees [21,22]. Notably, strong FSGS was observed within 1 m in the TTC-B subpopulation (Sp = 0.0208). Trivariate linear regression analyses further revealed differences in the relative constraints imposed by pollen and seed dispersal among populations. In the TTC-A subpopulation, pollen dispersal appeared to be more restricted than seed dispersal (k < 0), whereas seed dispersal was relatively more limited in the TTC-B subpopulation and the overall population (k > 0). These findings indicate that even populations within the same landscape may exhibit substantially different reproductive dispersal patterns and spatial genetic structures [39,40].
Such variation may result from subtle differences in habitat conditions between the two subpopulations. Within the study area, TTC-A is located along a roadside and close to human settlements, experiencing stronger anthropogenic disturbance and relatively sparse vegetation. In contrast, TTC-B is located farther from roads and settlements, with lower disturbance intensity, higher vegetation density, and greater canopy cover. These habitat differences may substantially influence gene flow patterns in orchids. In TTC-A, intensive human disturbance and sparse vegetation may disrupt pollinator activities, whereas the relatively open environment may facilitate seed dispersal by reducing physical barriers. Conversely, in TTC-B, higher vegetation density may constrain wind-mediated seed dispersal, while a relatively stable pollination environment may provide more favorable conditions for pollinator visitation and effective pollen transfer [41].
3.3. Paternity Analysis and Mating Systems
Selfing has been shown to significantly reduce seed developmental quality and germination potential in orchids [34,40,42]. Selfing increases offspring homozygosity (i.e., reduces heterozygosity), and when selfed or inbred offspring survive and accumulate near maternal plants or neighboring individuals, they can enhance genetic similarity among spatially adjacent individuals. Even when pollen dispersal occurs over moderate distances, the reduced viability of selfed seeds may prevent these offspring from successfully establishing stable populations at greater distances. Consequently, potential genetic inputs mediated by pollen flow may not be translated into long-term genetic mixing, thereby maintaining or even reinforcing fine-scale spatial genetic structure primarily driven by limited seed dispersal [12].
Seed viability and embryo development assessments in R. gigantea further support this interpretation, showing that outcrossed seeds possess significantly higher quality than selfed seeds, while selfed progeny exhibit pronounced developmental disadvantages during early life stages [31]. Evidence from both parentage analysis and seed viability assessments indicates that selfing not only compromises offspring survival and development but also shapes their spatial genetic composition, thereby directly contributing to the formation of fine-scale spatial genetic structure in R. gigantea.
According to Chen et al. (2025), R. gigantea exhibits a mixed mating system characterized by predominant outcrossing and partial self-compatibility [31]. In the present study, parentage analysis revealed that four out of ten sampled capsules were produced through selfing, indicating that self-fertilization is not uncommon under natural conditions, consistent with previous findings [31] (Table 3). Furthermore, full-sib family assignment demonstrated that all offspring within each capsule belonged to a single full-sib family, confirming that each capsule was fertilized by a single pollen donor. Notably, two capsules from the same maternal plant (T7-6-1 and T7-6-2) were assigned to the same family and shared an identical paternal origin, suggesting repeated pollination events by the same male donor (full-sib family = 9). In contrast, other capsules from the same maternal individuals, such as T4-50-2 (full-sib family = 2) and T4-50-6 (full-sib family = 3), or T6-8-2 (full-sib family = 6) and T6-8-5 (full-sib family = 7), were assigned to different families, indicating contributions from different paternal donors (Table 3). These findings suggest that multiple flowers within the same maternal plant can be repeatedly pollinated by the same male donor, reflecting pollinator foraging behavior among different flowers within an individual plant. Although selfing may provide reproductive assurance under conditions of limited pollinator availability, the pronounced fine-scale spatial genetic structure observed in R. gigantea indicates that neighboring individuals are often genetically more similar. Elevated selfing rates may further increase mating among related individuals, resulting in greater local genetic homogenization and reinforcing genetic isolation. This self-reinforcing process may accelerate the erosion of local gene pools and reduce effective population size, ultimately threatening long-term population persistence.
The high selfing rate observed in R. gigantea may be associated with its biological characteristics and pollinator behavior. Previous studies have shown that R. gigantea is a reward-based orchid that produces multiple inflorescences during the flowering season, with each inflorescence bearing dozens of flowers and providing substantial nectar rewards to pollinators [31]. Compared with deceptive orchids, reward-based orchids offer reliable food resources (e.g., nectar), which generally encourage pollinators to make repeated short-distance visits among multiple flowers within the same individual or among neighboring plants. Such foraging behavior reduces overall pollen dispersal distances and increases the frequency of geitonogamous pollination and localized mating [6,34].
Experimental evidence supports this mechanism. In the deceptive orchid A. morio, nectar supplementation significantly increased the number of visited flowers, pollinator residence time, and the frequency of geitonogamous pollination events [34]. Moreover, studies on reward-based orchids, such as species of Habenaria, have shown that although nectar rewards enhance pollination efficiency, pollen dispersal distances remain relatively short, suggesting that reward systems primarily promote local genetic exchange [43]. In R. gigantea, the presence of large inflorescences may similarly increase pollinator visitation frequency while simultaneously increasing the probability of pollen transfer among flowers within the same inflorescence or between adjacent inflorescences, thereby elevating the likelihood of selfing.
Within the study area, R. gigantea relies on B. ceiba as its primary host tree. Due to their cultural and landscape values, these trees have often been preserved within traditional villages. These “legacy trees” provide essential habitat substrates for R. gigantea and function as critical “ecological islands” within fragmented landscapes. However, with agricultural expansion and landscape modernization, non-traditional host trees have been increasingly removed, leaving only scattered B. ceiba individuals within villages or agricultural fields. This process has resulted in a substantial reduction in suitable habitats and intensified spatial isolation.
The scarcity of host trees not only directly limits the spatial distribution of R. gigantea populations but also indirectly reduces gene flow by weakening population connectivity, thereby increasing the risk of genetic differentiation among populations. Therefore, under ongoing agricultural expansion, maintaining ecological connectivity among forest fragments and conserving host tree resources are essential for preserving genetic diversity and ensuring the long-term persistence of epiphytic orchid populations.
4. Material and Methods
4.1. Study Species
During the summer of 2024, we conducted a comprehensive survey of all R. gigantea individuals in the study area, mapped their spatial distribution, and collected biological samples. The entire area was repeatedly surveyed to ensure comprehensive sampling coverage. Fresh leaf tissues were collected from 175 individuals considered potentially reproductive and immediately preserved in silica gel as parental materials for subsequent analyses.
In December of the same year, 24 naturally pollinated capsules were collected from reproductive adult individuals, representing 22 different maternal plants. Following asymbiotic seed germination, only 10 capsules successfully germinated. Ten seedlings were randomly selected from each successfully germinated capsule, resulting in a total of 100 F1 offspring individuals used for subsequent analyses (Figure 3).
The parental individuals of R. gigantea used in this study were collected from wild natural populations in Jiangbian Township, Dongfang City, Hainan Province, China. The F1 offspring used for parentage analysis were obtained from naturally pollinated capsules collected from wild maternal plants and subsequently propagated through asymbiotic seed germination and tissue culture. No commercial or externally sourced plant materials were used in this study.
4.2. Spatial Coordinate Measurement of Plants
To accurately characterize the three-dimensional spatial positions of R. gigantea individuals, we conducted systematic spatial measurements of all host trees and orchid individuals within the study plot [22]. All host trees with a diameter at breast height (DBH) ≥ 1 cm were included in the survey and served as the spatial reference framework for individual positioning.
The spatial coordinates of host trees were measured using a total station theodolite. The base of each tree trunk was used as the reference point, and the electronic distance measurement (EDM) and angular measurement functions of the total station were used to obtain the x, y, and z coordinates of each host tree. Multiple base points were established throughout the study plot to ensure measurement accuracy and spatial coverage. The total station automatically calculated the relative spatial coordinates of each measurement point based on triangulation principles and three-dimensional spatial surveying algorithms.
Because R. gigantea individuals grow on tree trunks or branches and cannot be directly targeted for spatial measurement, their coordinates were determined using a plumb-line projection method. Specifically, a vertical plumb line was placed from the attachment position of each epiphytic orchid individual to the ground surface. The ground projection point of the plumb line was recorded, and its x and y coordinates were measured using the total station. Meanwhile, the vertical height of each orchid individual above the ground was measured. This height value was then added to the z-coordinate of the corresponding ground projection point to obtain the final three-dimensional coordinates (x, y, z) of each orchid individual.
The resulting three-dimensional coordinate dataset was used to calculate Euclidean distances among individuals and subsequently conduct FSGS analyses. This approach allowed the effects of both horizontal distance and vertical height differences to be incorporated into the assessment of spatial genetic structure formation.
4.3. DNA Extraction , SNP Calling and Genotyping
Total genomic DNA was extracted from all samples using a modified CTAB method [44]. DNA integrity was assessed via 1.2% agarose gel electrophoresis, and concentration was quantified using a Qubit 3.0 fluorometer. Severely degraded samples were quantified based on the brightness of the main DNA band. Qualified samples were normalized to a final volume of 10 μL at 200 ng total DNA per sample. A double-digest RADseq (ddRAD) protocol was applied. Each DNA sample was digested with EcoR I and Msp I (NEB), followed by incubation at 37 ℃ for 8 h and 65 ℃ for 20 min, then held at 12 ℃. Digestion efficiency was verified via agarose gel electrophoresis. Barcoded EcoR I adapters and common Msp I adapters were ligated using T4 DNA ligase (NEB) at 16 ℃ for 8 h. After ligation, all samples were pooled in equimolar volumes and subjected to size selection (400–600 bp) using agarose gel extraction (Omega Gel Extraction Kit). The resulting library was PCR-amplified and sequenced on the BGI T7 platform using PE150.
To ensure the quality of downstream analyses, raw sequencing data were quality-filtered using the process_radtags module in Stacks v2.68 [45]. Based on the sequencing depth statistics of each sample after demultiplexing, the R1 reads of individual samples were processed using the ustacks module for clustering and deduplication to form loci. Key parameters were set as follows: M = 5 (the maximum number of mismatches allowed between alleles in a heterozygous individual) and m = 2 (the minimum depth of coverage required to create a stack). All individual loci were then used to construct a catalog file using the cstacks module, with the parameter n = 5. The sstacks module was subsequently used to match SNPs, alleles, and tag information from each sample against the catalog file, generating the corresponding matches file. Next, the tsv2bam and gstacks modules were used for format conversion and preparation prior to SNP calling. The populations module was then run to call shared SNP loci across populations. The parameters are set as follows: SNPs are filtered to retain those present in at least 80 per cent of the population, with a minimum allele frequency of ≥ 0.05 and a minimum sequencing depth of ≥ 3 for individual genotyping; the first SNP at each locus is selected for subsequent analysis.
4.4. Genetic Diversity and Genetic Differentiation
To assess the genetic diversity of R. gigantea within the region, SNP site information was first extracted from the VCF file using Plink v2.0, and then analyzed using GenAlEx v6.5 [46,47]. The statistical analyses of genetic diversity included indicators such as observed heterozygosity (Ho), expected heterozygosity (He), and the inbreeding coefficient (Fi). In addition, an Analysis of Molecular Variance (AMOVA) was performed on the two subpopulations (TTC-A and TTC-B) in the region to investigate the degree of genetic differentiation and the sources of genetic variation.
4.5. Spatial Genetic Structure
To investigate whether the spatial genetic structure exists in the R. gigantea population, we employed the spatial autocorrelation method implemented in SPAGeDI v1.4 [48]. The kinship coefficient between individuals (Fij) was regressed against the natural logarithm of their spatial distance ln(rij), yielding the regression slope bF [49]. In order to ensure a relatively uniform distance gradient and a balanced number of pairwise samples within each distance class, 9 distance classes were defined based on the spatial distribution range of R. gigantea in the study area: 1, 3, 6, 7, 8, 10, 50, 90, 120 (m). In addition, TTC-A population was divided into 6 distance classes: 1, 3, 5, 7, 10, 30, 60 (m), and TTC-B population was divided into 5 distance classes: 1, 5, 10, 20, 30 (m). The kinship coefficient Fij and its 95% confidence interval for each distance class were obtained through 9,999 permutation simulations. If the mean Fij lies above the upper limit of the 95% confidence interval, it indicates that genetically similar individuals are spatially clustered, suggesting the presence of a significant spatial genetic structure. If the mean Fij falls within the 95% confidence interval, it suggests a random spatial distribution of individuals, indicating no spatial genetic structure. If the mean Fij is below the lower limit of the 95% confidence interval, it indicates a uniform spatial distribution of individuals with more distant genetic relationships. The Sp statistic reflects the intensity of fine-scale spatial genetic structure and is defined as Sp = – bLF(r) F(1)], where bF is the regression slope, and F(1) is the mean kinship coefficient within the first distance class.
To predict the relative contributions of pollen flow and seed flow to gene flow among different populations (Jacquemyn et al. 2006), a ternary polynomial regression analysis was applied. In this model, the residual values f(d) [Fij(d) – Fij(d)exp] were used as the dependent variable, while the logarithm of distance ln(d) served as the independent variable. The regression equation was defined as:
where Fij(d)exp represents the theoretical dependent variable values obtained from the linear regression of Fij(d) against ln(d).
Taking the second derivative of the function f(d), we obtain the curvature of the equation as
here d1 presents the mean inter-individual distance within a given distance class. When k > 0, it indicates that seed dispersal is more restricted than pollen dispersal; whereas when k < 0, it suggests that pollen dispersal is more constrained, or seed dispersal is relatively unconstrained.
4.6. Paternity Analysis
We imported the selected SNPs into COLONY v2.0 to perform sire analysis on the F1 generation population [50,51]. The COLONY implements a full-likelihood approach to parentage analysis. In our analyses, the following parameters were adopted: monoecious species, allowing inbreeding, diploid, polygamy for males and females, full-likelihood method, medium length run, medium precision and no updating allele frequencies. We accepted the assignment for both paternity and maternity if results met one of the following criteria: (1) all three runs were assigned to the same parent with a probability of 95% or more; (2) assigned to the same parent three times, and two of runs assigned above 95%; (3) two runs assigned the same parent, both above 95%, but another one runs failed to assign any candidate parent. Assignments were regarded as failed when the most likely male parents were in conflict among results of three replicate runs.
Author Contributions
Conceptualization, Z.Z. and X.-Q.S.; methodology, W.-C.L., Z.-H.C., and H.-T.Z.; investigation and field sampling, W.-C.L., Z.-H.C., and H.-T.Z.; molecular experiments, W.-C.L. and Z.-H.C.; data curation, H.-T.Z.; bioinformatics analysis and genetic data analysis, H.-T.Z.; spatial genetic structure analysis, H.-T.Z.; interpretation of results, W.-C.L., Z.-H.C., H.-T.Z., X.-Q.S., and Z.Z.; visualization, H.-T.Z.; writing—original draft preparation, W.-C.L., Z.-H.C., and H.-T.Z.; writing—review and editing, X.-Q.S. and Z.Z.; supervision, X.-Q.S. and Z.Z.; project administration, Z.Z. and X.-Q.S.; funding acquisition, Z.Z. All authors have read and agreed to the published version of the manuscript.
Funding
National Natural Science Foundation (No.32201347), Hainan Natural Science Foundation (No.322RC569 & No.321QN188) and Project of Hainan Tropical Rainforest National Park Administration Bureau.
Data Availability Statement
The datasets generated and analyzed during the current study are available from the corresponding author upon reasonable request. The raw sequencing data will be deposited in a public database after further organization and quality control.
Acknowledgments
We thank Sen Yan and Yi-Heng Wang for field assistance; and Liang Xi for his help in cultivating F1 offspring.
References
- Fahrig, L. Effects of Habitat Fragmentation on Biodiversity. Annu. Rev. Ecol. Evol. Syst. 2003, 34, 487–515. [Google Scholar] [CrossRef]
- Minasiewicz, J.; Znaniecka, J.M.; Górniak, M.; Kawiński, A. Spatial Genetic Structure of an Endangered Orchid Cypripedium Calceolus (Orchidaceae) at a Regional Scale: Limited Gene Flow in a Fragmented Landscape. Conserv. Genet. 2018, 19, 1449–1460. [Google Scholar] [CrossRef]
- Riofrío, M.; Naranjo, C.; Mendoza, A.; Draper, D.; Marques, I. Genetic Diversity and Structure in Two Epiphytic Orchids from the Montane Forests of Southern Ecuador: The Role of Overcollection on Masdevallia Rosea in Comparison with the Widespread Pleurothallis Lilijae. PLoS ONE 2023, 18, e0290604. [Google Scholar] [CrossRef] [PubMed]
- Lowe, A.J.; Boshier, D.; Ward, M.; Bacles, C.F.E.; Navarro, C. Genetic Resource Impacts of Habitat Loss and Degradation; Reconciling Empirical Evidence and Predicted Theory for Neotropical Trees. Heredity 2005, 95, 255–273. [Google Scholar] [CrossRef] [PubMed]
- Aguilar, R.; Quesada, M.; Ashworth, L.; Herrerias-Diego, Y.; Lobo, J. Genetic Consequences of Habitat Fragmentation in Plant Populations: Susceptible Signals in Plant Traits and Methodological Approaches. Mol. Ecol. 2008, 17, 5177–5188. [Google Scholar] [CrossRef] [PubMed]
- Jersáková, J.; Johnson, S.D.; Kindlmann, P. Mechanisms and Evolution of Deceptive Pollination in Orchids. Biol. Rev. 2006, 81, 219–235. [Google Scholar] [CrossRef] [PubMed]
- Arditti, J.; Ghani, A.K.A. Tansley Review No. 110.: Numerical and Physical Properties of Orchid Seeds and Their Biological Implications. New Phytol. 2000, 145, 367–421. [Google Scholar] [CrossRef] [PubMed]
- McCormick, M.K.; Jacquemyn, H. What Constrains the Distribution of Orchid Populations? New Phytol. 2014, 202, 392–400. [Google Scholar] [CrossRef]
- Rasmussen, H.N.; Dixon, K.W.; Jersáková, J.; Těšitelová, T. Germination and Seedling Establishment in Orchids: A Complex of Requirements. Ann. Bot. 2015, 116, 391–402. [Google Scholar] [CrossRef] [PubMed]
- Shamsudin, N.A.; Sathiya Seelan, J.S.; Gansau, J.A.; Rusdi, N.A. A Review: Molecular Identification of Orchid Mycorrhiza. Adv. Hortic. Sci. 2024, 38, 97–116. [Google Scholar] [CrossRef]
- Read, D.J.; Haggar, J.; Magkourilou, E.; Durant, E.; Johnson, D.; Leake, J.R.; Field, K.J. Photosynthate Transfer from an Autotrophic Orchid to Conspecific Heterotrophic Protocorms through a Common Mycorrhizal Network. New Phytol. 2024, 243, 398–406. [Google Scholar] [CrossRef] [PubMed]
- Trapnell, D.W.; Hamrick, J.L. Mating Patterns and Gene Flow in the Neotropical Epiphytic Orchid, Laelia Rubescens. Mol. Ecol. 2005, 14, 75–84. [Google Scholar] [CrossRef] [PubMed]
- Ellstrand, N.C. Is Gene Flow the Most Important Evolutionary Force in Plants? Am. J. Bot. 2014, 101, 737–753. [Google Scholar] [CrossRef] [PubMed]
- Wang, Q.; Shao, S.; Su, Y.; Hu, X.; Shen, Y.; Zhao, D. A Novel Case of Autogamy and Cleistogamy in Dendrobium Wangliangii: A Rare Orchid Distributed in the Dry-hot Valley. Ecol. Evol. 2019, 9, 12906–12914. [Google Scholar] [CrossRef] [PubMed]
- Tremblay, R.L.; Ackerman, J.D.; Zimmerman, J.K.; Calvo, R.N. Variation in Sexual Reproduction in Orchids and Its Evolutionary Consequences: A Spasmodic Journey to Diversification: EVOLUTIONARY PROCESSES IN ORCHIDS. Biol. J. Linn. Soc. 2004, 84, 1–54. [Google Scholar] [CrossRef]
- Cozzolino, S.; Widmer, A. Orchid Diversity: An Evolutionary Consequence of Deception? Trends Ecol. Evol. 2005, 20, 487–494. [Google Scholar] [CrossRef] [PubMed]
- Schiestl, F.P. On the Success of a Swindle: Pollination by Deception in Orchids. Naturwissenschaften 2005, 92, 255–264. [Google Scholar] [CrossRef] [PubMed]
- Zotz, G. The Systematic Distribution of Vascular Epiphytes - a Critical Update: Vascular Epiphytes. Bot. J. Linn. Soc. 2013, 171, 453–481. [Google Scholar] [CrossRef]
- Givnish, T.J.; Spalink, D.; Ames, M.; Lyon, S.P.; Hunter, S.J.; Zuluaga, A.; Doucette, A.; Caro, G.G.; McDaniel, J.; Clements, M.A.; et al. Orchid Historical Biogeography, Diversification, Antarctica and the Paradox of Orchid Dispersal. J. Biogeogr. 2016, 43, 1905–1916. [Google Scholar] [CrossRef]
- Chung, M.Y.; Nason, J.D.; López-Pujol, J.; Yamashiro, T.; Yang, B.-Y.; Luo, Y.-B.; Chung, M.G. Genetic Consequences of Fragmentation on Populations of the Terrestrial Orchid Cymbidium Goeringii. Biol. Conserv. 2014, 170, 222–231. [Google Scholar] [CrossRef]
- Zhang, Z.; Gale, S.W.; Li, J.-H.; Fischer, G.A.; Ren, M.-X.; Song, X.-Q. Pollen-Mediated Gene Flow Ensures Connectivity among Spatially Discrete Sub-Populations of Phalaenopsis Pulcherrima, a Tropical Food-Deceptive Orchid. BMC Plant Biol. 2019, 19, 597. [Google Scholar] [CrossRef] [PubMed]
- Torres, E.; Riofrío, M.-L.; Iriondo, J.M. Complex Fine-Scale Spatial Genetic Structure in Epidendrum Rhopalostele: An Epiphytic Orchid. Heredity 2019, 122, 458–467. [Google Scholar] [CrossRef] [PubMed]
- Trapnell, D.W.; Hamrick, J.L.; Nason, J.D. Three-dimensional Fine-scale Genetic Structure of the Neotropical Epiphytic Orchid, Laelia Rubescens. Mol. Ecol. 2004, 13, 1111–1118. [Google Scholar] [CrossRef] [PubMed]
- Petrolli, R.; Zinger, L.; Perez-Lamarque, B.; Collobert, G.; Griveau, C.; Pailler, T.; Selosse, M.; Martos, F. Spatial Turnover of Fungi and Partner Choice Shape Mycorrhizal Networks in Epiphytic Orchids. J. Ecol. 2022, 110, 2568–2584. [Google Scholar] [CrossRef]
- Ramírez-Martínez, A.; Ticktin, T.; Mondragon, D. Host Tree Species Effects on Long-Term Persistence of Epiphytic Orchid Populations. Front. Ecol. Evol. 2022, 10, 1059136. [Google Scholar] [CrossRef]
- Jain, V.; Verma, S.K.; Sharma, S.K.; Katewa, S.S. Bombax Ceiba Linn.: As an Umbrella Tree Species in Forests of Southern Rajasthan, India. Res. J. Environ. Sci. 2011, 5, 722–729. [Google Scholar] [CrossRef]
- Traxmandlová, I.; Bhattarai, B.P.; Kindlmann, P. Orchid Diversity in the Chitwan District. In Himalayan Biodiversity in the Changing World; Kindlmann, P., Ed.; Springer Netherlands: Dordrecht, 2012; pp. 71–95. ISBN 978-94-007-1801-2. [Google Scholar]
- Rajput, D.; Saikia, L.R.; Gogoi, K.; Nasrin, T. Orchid Diversity of Mesaki Reserve Forest, Assam, India. [CrossRef]
- Mangan, S.A.; Adler, G.H. Seasonal Dispersal of Arbuscular Mycorrhizal Fungi by Spiny Rats in a Neotropical Forest. Oecologia 2002, 131, 587–597. [Google Scholar] [CrossRef] [PubMed]
- Xiang, W.; Wang, W.; Ren, M. 1 Ministry of Education Key Laboratory of Genetics and Germplasm Innovation of Tropical Special Forest Trees and Ornamental Plants, Hainan University, Haikou 5702282 Center for Terrestrial Biodiversity of the South China Sea, Hainan University, Haikou 570228 Traditional biodiversity knowledge in Bombax ceiba cultures: Inheritance and utilization. Biodivers. Sci. 2023, 31, 22524. [Google Scholar] [CrossRef]
- Chen, P.Z.; Zhao, Y.; Zhang, Z.; Song, X.Q. Primary studies on flowering phenology and breeding system of R. gigantea (Orchidaceae) in Hainan island. Plant Sci. J. 2025, 43(4), 444–453. [Google Scholar]
- Hamrick, J.L.; Godt, M.J.W. Effects of Life History Traits on Genetic Diversity in Plant Species. Philos. Trans. Biol. Sci. 1996, 351, 1291–1298. [Google Scholar] [CrossRef]
- Ellstrand, N.C.; Elam, D.R. Population Genetic Consequences of Small Population Size: Implications for Plant Conservation. Annu. Rev. Ecol. Syst. 1993, 2, 217–242. [Google Scholar] [CrossRef]
- Johnson, S.D.; Peter, C.I.; Ågren, J. The Effects of Nectar Addition on Pollen Removal and Geitonogamy in the Non-Rewarding Orchid Anacamptis Morio. Proc. R. Soc. Lond. B Biol. Sci. 2004, 271, 803–809. [Google Scholar] [CrossRef] [PubMed]
- Keller, L. Inbreeding Effects in Wild Populations. Trends Ecol. Evol. 2002, 17, 230–241. [Google Scholar] [CrossRef]
- Jersáková, J.; Malinová, T. Spatial Aspects of Seed Dispersal and Seedling Recruitment in Orchids. New Phytol. 2007, 176, 237–241. [Google Scholar] [CrossRef] [PubMed]
- Yoon Chung, M.; Chung, M.G. Conservation Genetics of the Endangered Terrestrial Orchid Pogonia Minor in South Korea. Ann. Bot. Fenn. 2008, 45, 455–464. [Google Scholar] [CrossRef]
- X, V.; Oj, H. New Insights from Fine-Scale Spatial Genetic Structure Analyses in Plant Populations. Mol. Ecol. 2004, 13. [Google Scholar] [CrossRef] [PubMed]
- Sujii, P.S.; Cozzolino, S.; Pinheiro, F. Hybridization and Geographic Distribution Shapes the Spatial Genetic Structure of Two Co-Occurring Orchid Species. Heredity 2019, 123, 458–469. [Google Scholar] [CrossRef] [PubMed]
- Wróblewska, A.; Ostrowiecka, B.; Brzosko, E.; Jermakowicz, E.; Tałałaj, I.; Mirski, P. The Patterns of Inbreeding Depression in Food-Deceptive Dactylorhiza Orchids. Front. Plant Sci. 2024, 15, 1244393. [Google Scholar] [CrossRef] [PubMed]
- Vereecken, N.J.; Cozzolino, S.; Schiestl, F.P. Hybrid Floral Scent Novelty Drives Pollinator Shift in Sexually Deceptive Orchids. BMC Evol. Biol. 2010, 10, 103. [Google Scholar] [CrossRef] [PubMed]
- Smithson, A. Pollinator Limitation and Inbreeding Depression in Orchid Species with and without Nectar Rewards. New Phytol. 2006, 169, 419–430. [Google Scholar] [CrossRef] [PubMed]
- Zhang, W.; Gao, J. A Comparative Study on the Reproductive Success of Two Rewarding Habenaria Species (Orchidaceae) Occurring in Roadside Verge Habitats. BMC Plant Biol. 2021, 21, 187. [Google Scholar] [CrossRef] [PubMed]
- Zhang, Z.; Gale, S.W.; Li, J.-H.; Fischer, G.A.; Ren, M.-X.; Song, X.-Q. Pollen-Mediated Gene Flow Ensures Connectivity among Spatially Discrete Sub-Populations of Phalaenopsis Pulcherrima, a Tropical Food-Deceptive Orchid. BMC Plant Biol. 2019, 19, 597. [Google Scholar] [CrossRef] [PubMed]
- Rochette, N.C.; Rivera-Colón, A.G.; Catchen, J.M. Stacks 2: Analytical Methods for Paired-end Sequencing Improve RADseq-based Population Genomics. Mol. Ecol. 2019, 28, 4737–4754. [Google Scholar] [CrossRef] [PubMed]
- Peakall, R.; Smouse, P.E. GenAlEx 6.5: Genetic Analysis in Excel. Population Genetic Software for Teaching and Research—an Update. Bioinformatics 2012, 28, 2537–2539. [Google Scholar] [CrossRef] [PubMed]
- Purcell, S.; Neale, B.; Todd-Brown, K.; Thomas, L.; Ferreira, M.A.R.; Bender, D.; Maller, J.; Sklar, P.; de Bakker, P.I.W.; Daly, M.J.; et al. PLINK: A Tool Set for Whole-Genome Association and Population-Based Linkage Analyses. Am. J. Hum. Genet. 2007, 81, 559–575. [Google Scholar] [CrossRef] [PubMed]
- Hardy, O.J.; Vekemans, X. spagedi: A Versatile Computer Program to Analyse Spatial Genetic Structure at the Individual or Population Levels. Mol. Ecol. Notes 2002, 2, 618–620. [Google Scholar] [CrossRef]
- Loiselle, B.A.; Sork, V.L.; Nason, J.; Graham, C. Spatial Genetic Structure of a Tropical Understory Shrub, PSYCHOTRIA OFFICINALIS (RuBIACEAE). Am. J. Bot. 1995, 82, 1420–1425. [Google Scholar] [CrossRef]
- Kalinowski, S.T.; Taper, M.L.; Marshall, T.C. Revising How the Computer Program cervus Accommodates Genotyping Error Increases Success in Paternity Assignment. Mol. Ecol. 2007, 16, 1099–1106. [Google Scholar] [CrossRef] [PubMed]
- Jones, O.R.; Wang, J. COLONY: A Program for Parentage and Sibship Inference from Multilocus Genotype Data. Mol. Ecol. Resour. 2010, 10, 551–555. [Google Scholar] [CrossRef] [PubMed]
Figure 1.
The research area for R. gigantea can be divided into two populations, TTC-A and TTC-B. All R. gigantea are epiphytic on eight Bombax ceiba.
Figure 1.
The research area for R. gigantea can be divided into two populations, TTC-A and TTC-B. All R. gigantea are epiphytic on eight Bombax ceiba.
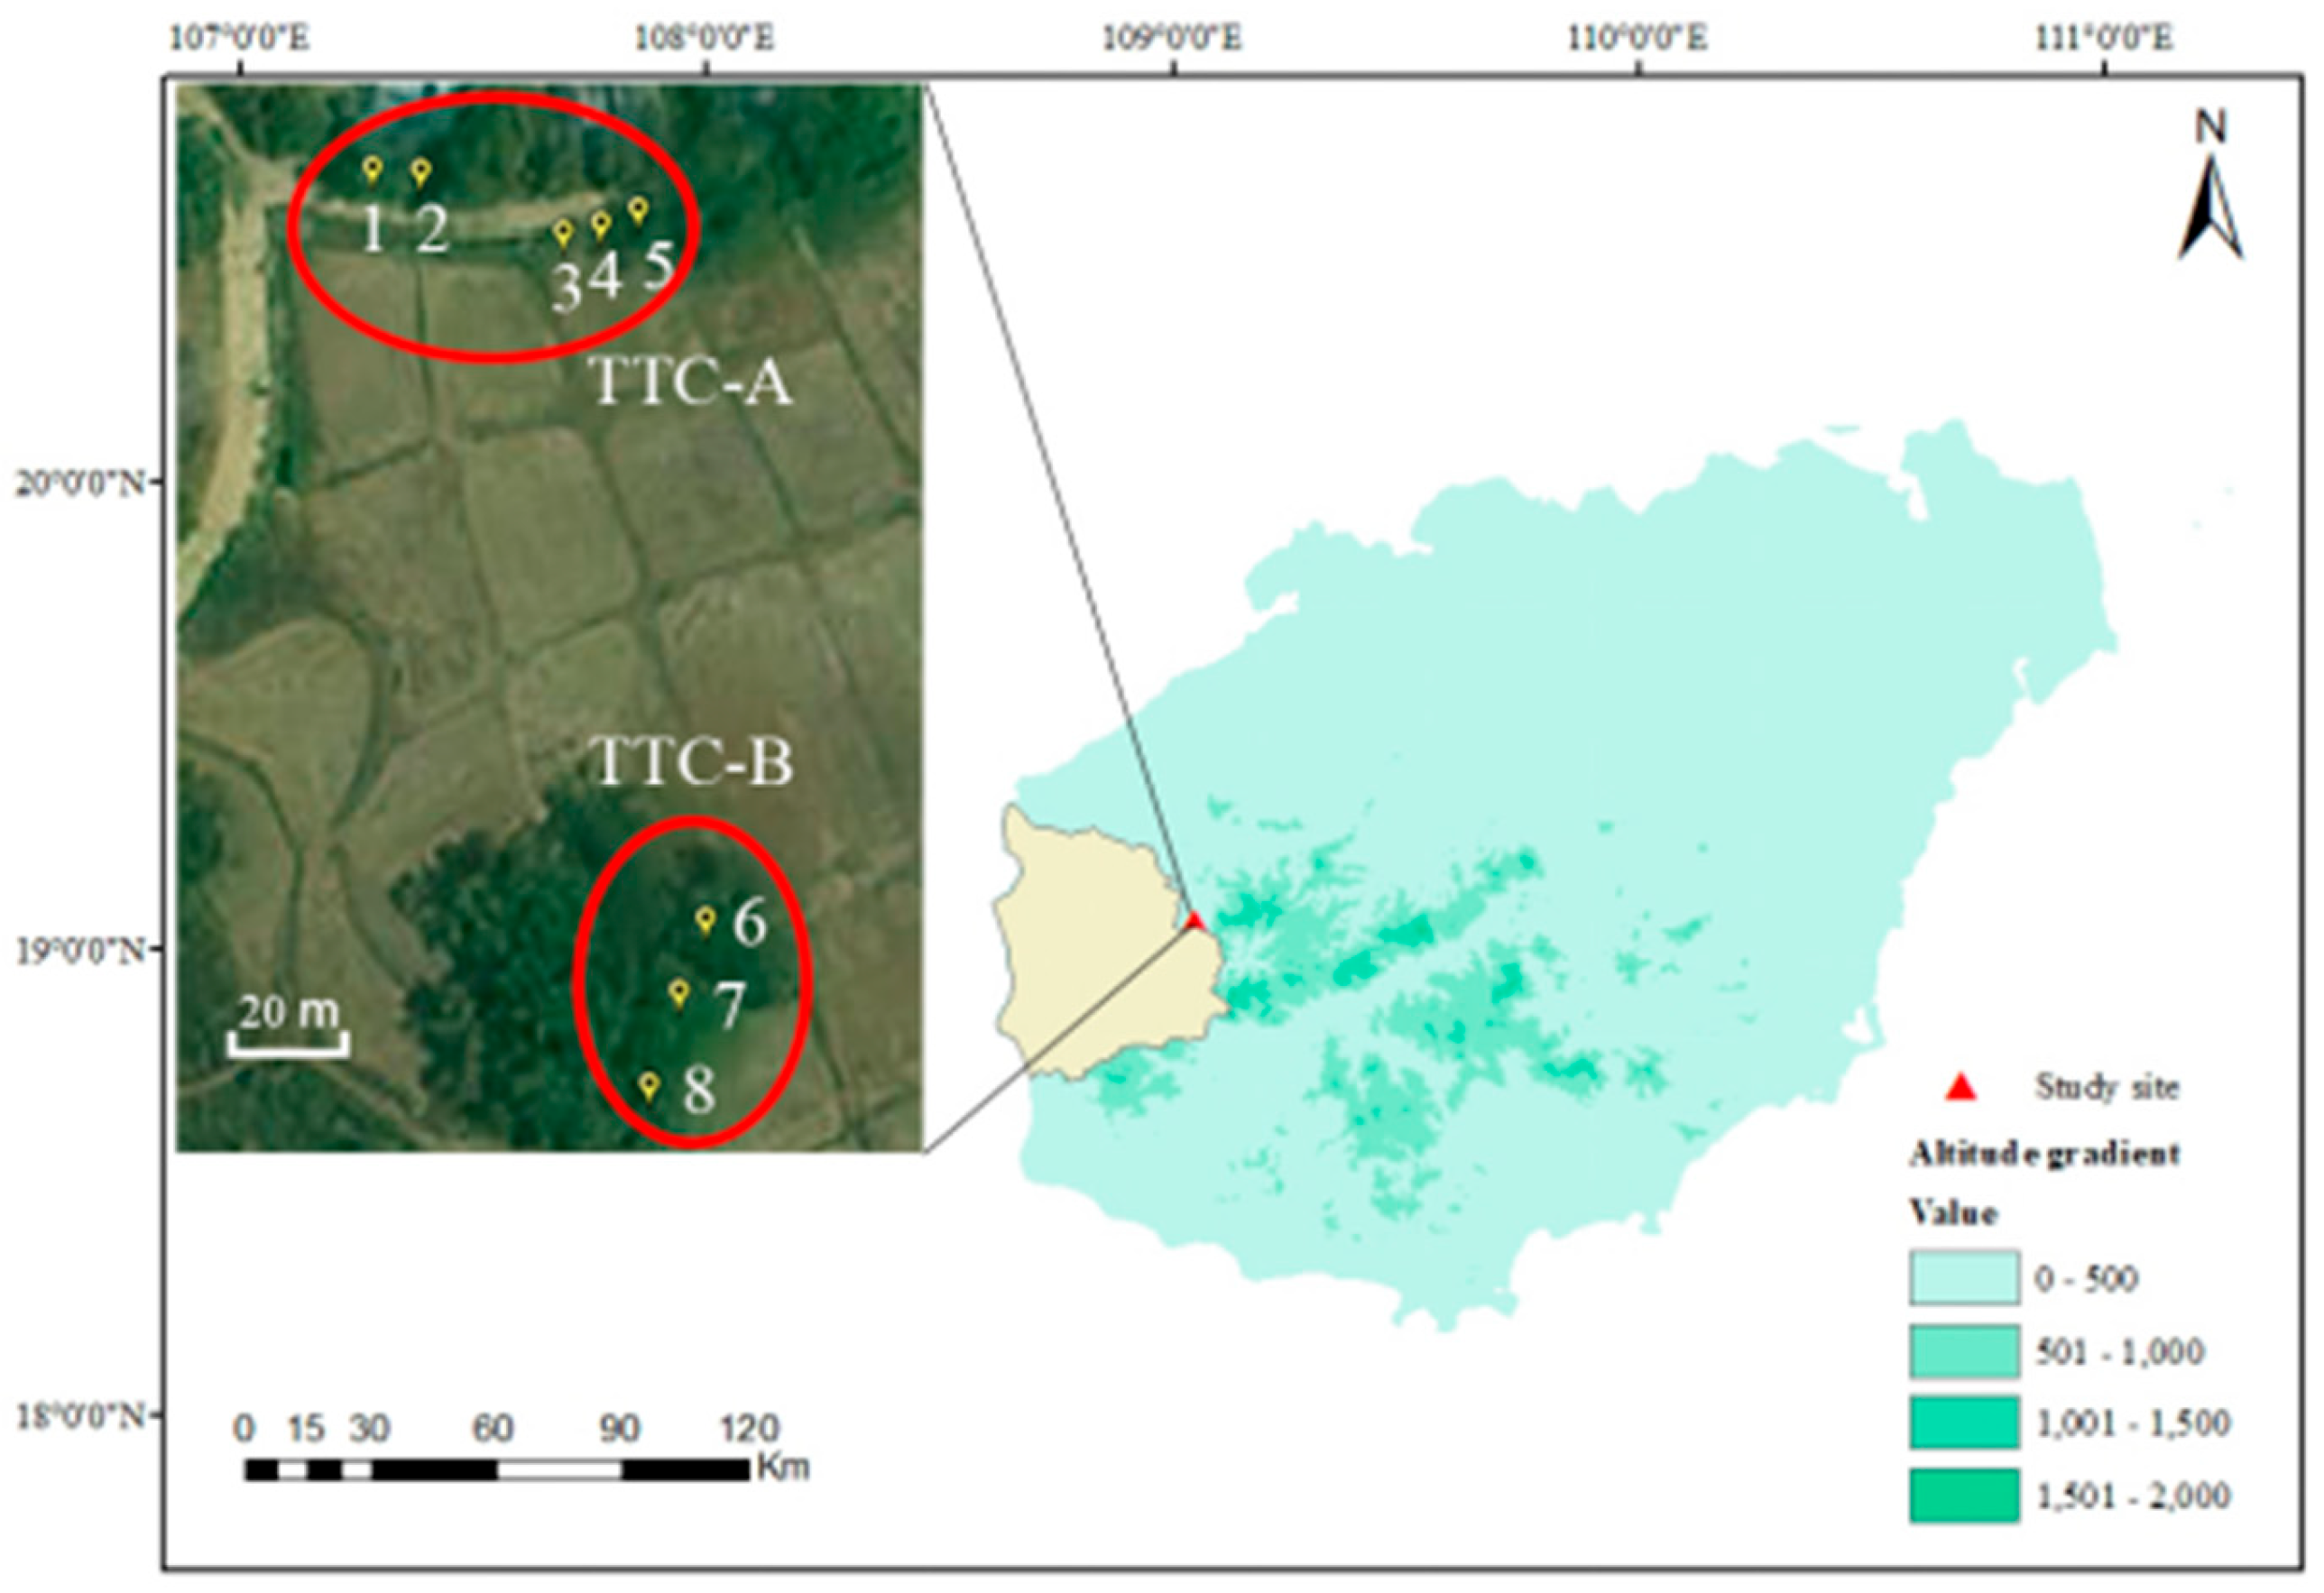
Figure 2.
The left side shows Fine-scale genetic structure of R. gigantea. Note: The red line represent the average kinship coefficient Fij(d) between individuals within each distance class; grey dashed lines indicate the upper and lower bounds of the 95% confidence interval; bLF(r) represents the regression slope of the kinship coefficient Fij (d) against the natural logarithm of distance ln(d). Significance levels: **P < 0.01, ***P < 0.001. The right side shows the three-variable linear regression analysis graph.
Figure 2.
The left side shows Fine-scale genetic structure of R. gigantea. Note: The red line represent the average kinship coefficient Fij(d) between individuals within each distance class; grey dashed lines indicate the upper and lower bounds of the 95% confidence interval; bLF(r) represents the regression slope of the kinship coefficient Fij (d) against the natural logarithm of distance ln(d). Significance levels: **P < 0.01, ***P < 0.001. The right side shows the three-variable linear regression analysis graph.
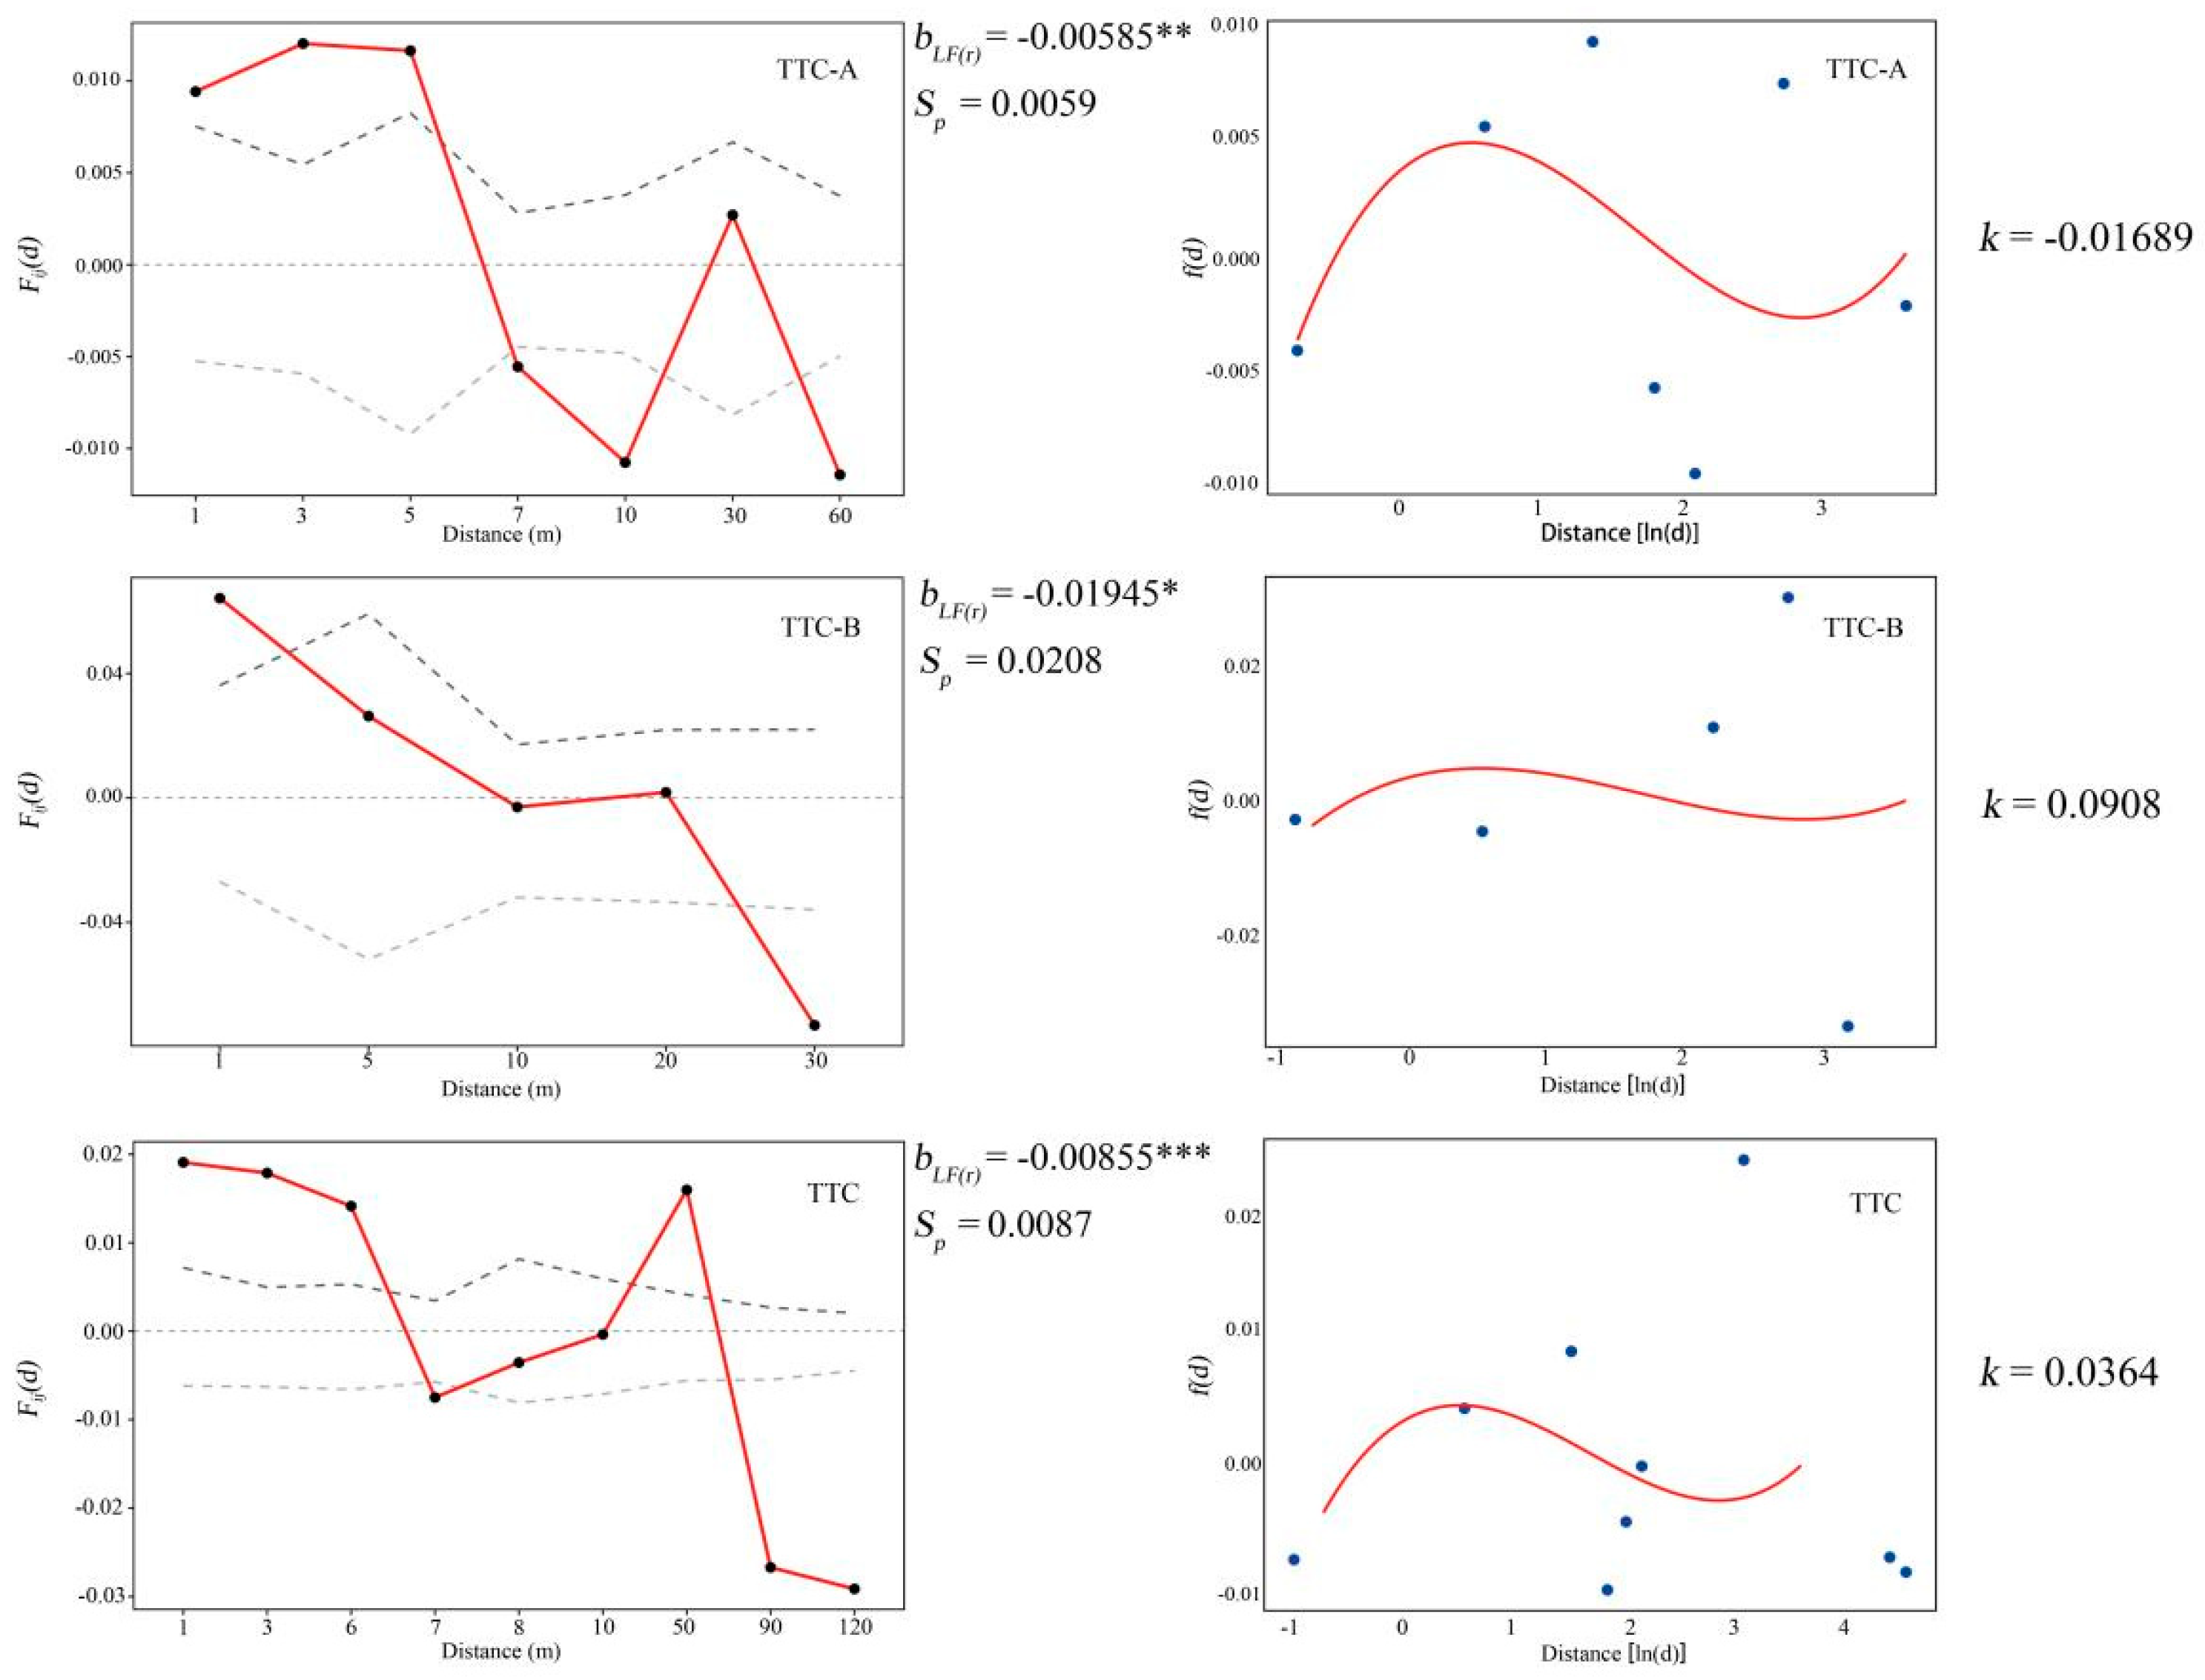
Figure 3.
Spatial distribution of R. gigantea individuals and F1 offspring. Notes: (A) The host tree Bombax ceiba of R. gigantea; (B) R. gigantea individuals growing epiphytically on B. ceiba; (C) Fruiting individuals of R. gigantea; (D) Tissue culture seedlings of R. gigantea; (E) F1 offspring of R. gigantea.
Figure 3.
Spatial distribution of R. gigantea individuals and F1 offspring. Notes: (A) The host tree Bombax ceiba of R. gigantea; (B) R. gigantea individuals growing epiphytically on B. ceiba; (C) Fruiting individuals of R. gigantea; (D) Tissue culture seedlings of R. gigantea; (E) F1 offspring of R. gigantea.
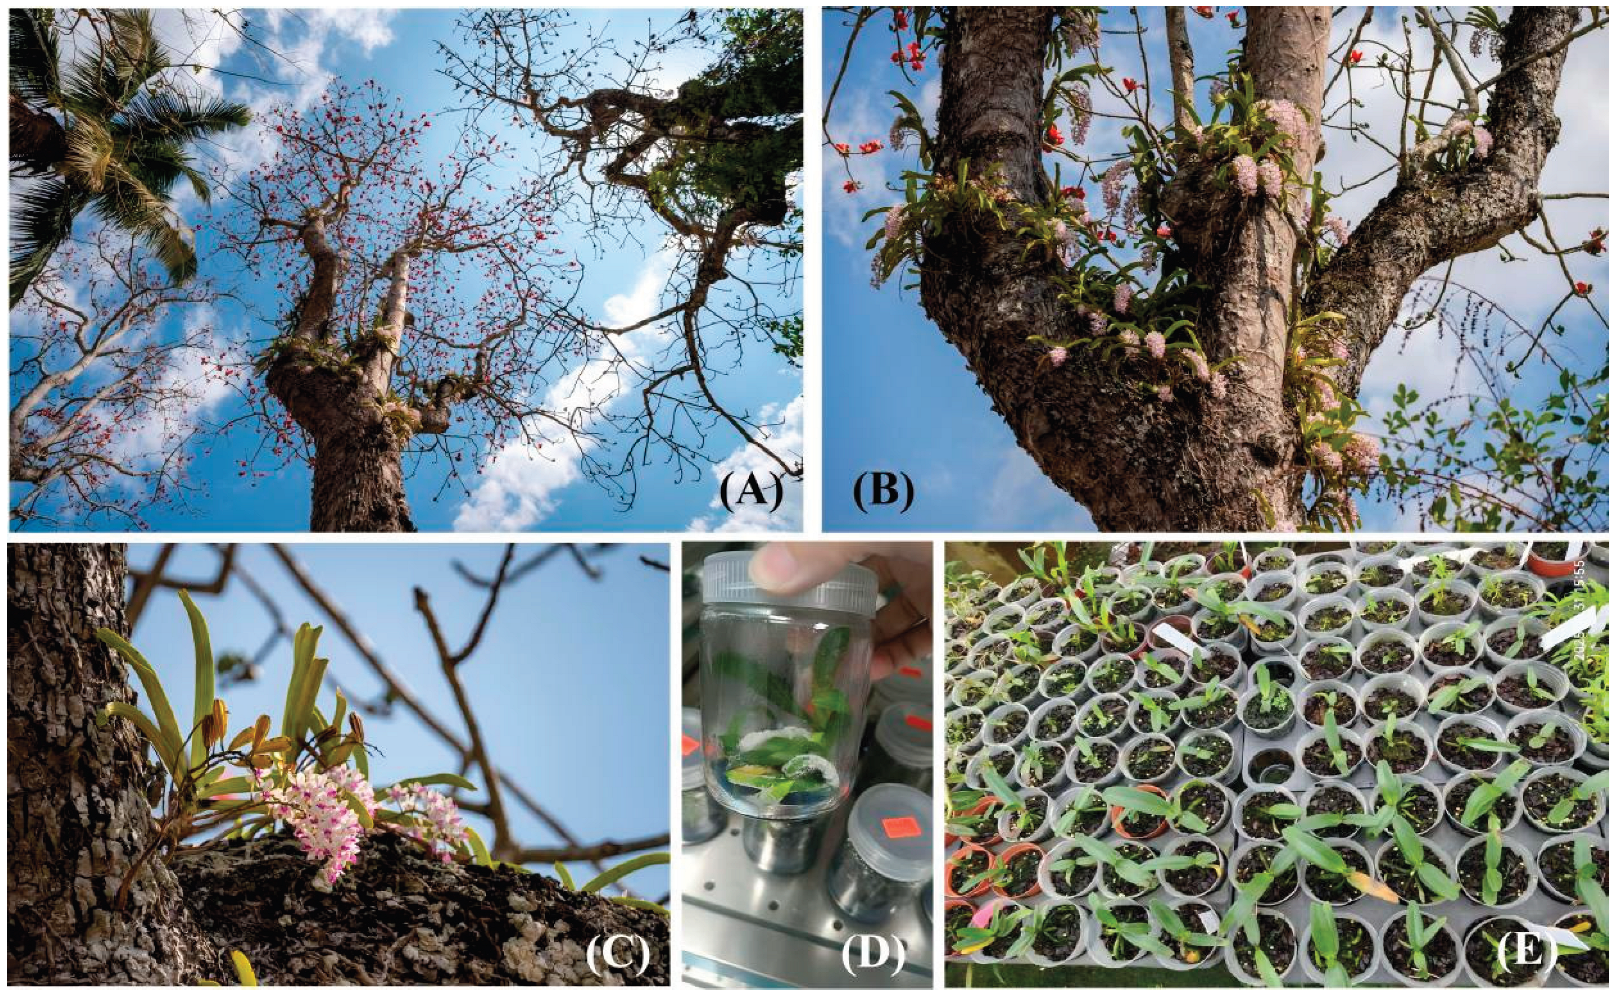

Table 1.
Genetic diversity of 2 Adult populations and F1 populations of R. gigantea.
| Adults | N | I | Ho | He | Fi | Offspring | N | I | Ho | He | Fi | |
| TTC-A | 153 | 0.410 | 0.245 | 0.265 | 0.088 | TTC-A | 40 | 0.377 | 0.217 | 0.247 | 0.107 | |
| TTC-B | 22 | 0.404 | 0.240 | 0.264 | 0.076 | TTC-B | 60 | 0.404 | 0.179 | 0.266 | 0.288 | |
| Total | 175 | 0.407 | 0.243 | 0.265 | 0.082 | 100 | 0.391 | 0.198 | 0.257 | 0.198 |
Note: (N) sample size; (Ho) observed heterozygosity; (He) expected heterozygosity; (Fi) inbreeding coefficient.
Table 2.
AMOVA for the two sub-populations of R. gigantea.
| Source | df | SS | Est. Var. (%) | Fst |
| Among Pops | 1 | 1174.223 | 13.35(8%) | 0.079 ** |
| Within Pops | 348 | 51199.874 | 147.126(92%) | |
| Total | 349 | 52374.097 | 160.476(100%) |
Note: Sum of squares (SS), degree of freedom (df), Estimated Variance (Est. Var.), F-statistics (Fst). Significant difference is indicated with asterisk (**p < 0.001).
Table 3.
Paternity analysis of 100 Fl seedlings form 7 maternal plants with known maternal genotypes at 95% confidence level.
Table 3.
Paternity analysis of 100 Fl seedlings form 7 maternal plants with known maternal genotypes at 95% confidence level.
| Maternal plants | Capsules | No. of F1 | Fullsib family (Prob.) |
Paternal plants (Prob.) |
No. of F1 seedlings assigned | Pollen dispersal distance (m) |
| TTC-3-33 | T3-34-1 | 10 | 1 (0.99) | TTC-3-31 (1.00) | 10 | 0.800 |
| TTC-4-50 | T4-50-2 | 10 | 2 (1.00) | TTC-3-16 (0.41) | 0 | / |
| TTC-4-50 | T4-50-6 | 10 | 3 (1.00) | TTC-4-40 (1.00) | 10 | 0.300 |
| TTC-4-84 | T4-85-1 | 10 | 4 (1.00) | TTC-4-84 (1.00) | 10 | 0.000 |
| TTC-6-3 | T6-3-1 | 10 | 5 (0.99) | TTC-6-10 (1.00) | 10 | 5.840 |
| TTC-6-8 | T6-8-2 | 10 | 6 (0.99) | TTC-6-11 (1.00) | 10 | 0.540 |
| TTC-6-8 | T6-8-5 | 10 | 8 (0.99) | TTC-6-7 (1.00) | 10 | 1.703 |
| TTC-6-9 | T6-9-3 | 10 | 9 (1.00) | TTC-6-9 (1.00) | 10 | 0.000 |
| TTC-7-6 | T7-6-1 | 10 | 11 (1.00) | TTC-7-6 (1.00) | 10 | 0.000 |
| TTC-7-6 | T7-6-2 | 10 | 11(1.00) | TTC-7-6 (1.00) | 10 | 0.000 |
| Means | 1.020 |
Disclaimer/Publisher’s Note: The statements, opinions and data contained in all publications are solely those of the individual author(s) and contributor(s) and not of MDPI and/or the editor(s). MDPI and/or the editor(s) disclaim responsibility for any injury to people or property resulting from any ideas, methods, instructions or products referred to in the content. |
© 2026 by the authors. Licensee MDPI, Basel, Switzerland. This article is an open access article distributed under the terms and conditions of the Creative Commons Attribution (CC BY) license (http://creativecommons.org/licenses/by/4.0/).
Copyright: This open access article is published under a Creative Commons CC BY 4.0 license, which permit the free download, distribution, and reuse, provided that the author and preprint are cited in any reuse.