

Submitted:
04 August 2026
Posted:
05 August 2026
You are already at the latest version
Abstract
Sex-specific adjustments of bird migration phenology to climate change are understudied. We analysed blackcap migration timing using spring (26 March–16 May) ringing data from Bukowo-Kopań (N Poland) in 1982–2025. We assessed the influence of large-scale climate indices in winter (December–February) and spring (March–May) on the beginning (p10), median (p50), and end (p90) of passage of each sex, using multiple regression. Protandry (earlier arrival of males) at the beginning of passage averaged 2.2 days and remained stable over 44 years, because p10 dates advanced by 9 days in both sexes. This aligns with 22-year studies from northern Europe, and with the mating opportunity hypothesis. The median (p50) of passage advanced by 7–9 days, but p90 showed no trends during 1982–2025. Positive winter and spring North Atlantic Oscillation (NAO) and spring Scandinavian Pattern (SCI) were associated with early p10 and p50, and positive winter Indian Ocean Dipole (IOD) with delayed p90, in both sexes alike. These similar responses likely occur because these climate patterns affect broad non-breeding areas of both sexes. We suggest that female blackcaps are as adaptive as males, and advanced migration maximises reproductive success and the chance for second broods of both sexes.
Keywords:
spring phenology
; protandry
; sex-specific migration
; climate change
; bird migration
1. Introduction
Spring migration of passerine birds within the Palearctic-African migration system is an evolutionary adaptation that enables them to take advantage of the seasonal abundance of food and breeding sites in spring and summer at northern latitudes, where harsh winter limits birds’ residence year-round [1,2,3,4,5]. To maximise individual fitness, migrants time their migration to match local food resources availability, such as spring vegetation growth and the peak of insects, at their spring destination [3,6]. However, the optimal timing of spring migration might differ between the sexes, because of different sexual selection pressures on males and females [1,7,8,9,10,11,12]. Climate change in the Northern Hemisphere affects the timing of bird migrations [13,14,15,16,17,18]. However, most studies have focused on the interspecific differences in these phenological shifts, while intraspecific variation, including possible sex differences, in responses to climate change, remains poorly understood [19].
In many bird species, males usually arrive at breeding grounds earlier than females, a phenomenon known as protandry [8,9,10,12,20,21]. Changing environmental conditions might influence the degree of protandry, modifying the costs and benefits of early arrival for each sex [2,10,22,23,24]. Although protandry is common among migrants, the difference in arrival times between the sexes is shaped by the selective pressures of a species’ mating system [6,11]. The main mechanism explaining protandry is the mating opportunity hypothesis, where earlier arrival allows males to occupy high-quality territories, which increases their chances of attracting females and thus improves their reproductive success [7,10,25,26]. Evolutionary models support this hypothesis, suggesting that selection for the timing of male and female arrivals is the main driver of asynchronous sex-specific arrival times [6,21,27]. Differences in arrival timing can also be explained by different energy management, as females in spring should maintain sufficient reserves to meet the high nutritional demands of egg production, which often cannot be met only through local foraging [5]. Arriving too early under harsh spring conditions could deplete these reserves, leading to smaller clutches or lower-quality eggs [5,10]. In contrast, sperm production is far less energetically demanding, allowing males to take the risk of arriving early [5,11]. The evolutionary advantages of securing the best territories and mates outweigh the potential costs of adverse weather, especially during warmer springs [7,8,10]. This leads to sex-specific migration strategies, in which males prioritize speed of arrival, while females optimize energy costs to maintain sufficient body condition [5,11].
The earlier arrival of males at stopover sites and breeding grounds may also result from spatial sex segregation during the non-breeding season, when males and females occupy separate wintering grounds or use different migration routes [6,11,12,28,29,30,31,32]. However, studies using geolocators show that even when the sexes overwinter in the same regions, protandry is driven by behavioral differences [11,33]. In particular, males often depart from their wintering grounds earlier and stay ahead of females throughout the migration [6,33]. Furthermore, migration speed may be sex-specific, as in some species males migrate faster due to a higher rate of energy replenishment or morphological adaptations, such as more pointed wings [5,11].
Over the past few decades, the effects of climate change have become increasingly evident in the northern hemisphere, leading to long-term shifts in temperatures and weather patterns [13,15,34]. These climatic changes can directly influence the timing of spring migration [35] and potentially alter the degree of protandry by modifying the costs and benefits of early arrival for each sex [2,22,23,24]. The timing of migration is influenced by environmental factors, such as food abundance or weather conditions, including temperature and precipitation at subsequent locations visited by migrants [17,18,22,36,37]. Large-scale climate indices, such as the North Atlantic Oscillation (NAO), Indian Ocean Dipole (IOD), Mediterranean Oscillation Index (MOI), and Scandinavian Index (SCAND, hereafter referred to as SCI), which shape temperatures, precipitation and circulation patterns over vast regions of Europe and Africa, have been shown to influence the spring migration timing in many species of small passerines [17,18,38,39,40,41].
Among studies on shifts in avian migration phenology, the possibility of different responses of males and females to changes in climatic conditions has attracted some attention. Earlier analyses of species exhibiting sexual dimorphism—including the goldcrest (Regulus regulus), blackbird (Turdus merula), reed bunting (Emberiza schoeniclus), redstart (Phoenicurus phoenicurus), whinchat (Saxicola rubetra), the red-backed shrike (Lanius collurio), the pied flycatcher (Ficedula hypoleuca), and the Eurasian blackcap (Sylvia atricapilla)—showed that between 1976 and 1997, spring migration advanced in both sexes at a similar rate, thus their degree of protandry remained unchanged [10]. However, more recent studies show that, with progressively warmer winters and springs, males begin their migration much earlier than females, leading to an increasing difference in arrival dates, as shown in the pied flycatcher [42,43], the barn swallow (Hirundo rustica) [44], the song thrush (Turdus philomelos) [45], the willow warbler (Phylloscopus trochilus) [46], and the chiffchaff (Phylloscopus collybita) [47]. Uneven shifts in migration timing might result from different responsiveness of the sexes to the same conditions, or from slightly different environmental conditions they experience at non-breeding grounds due to spatial or temporal segregation, or from both mechanisms. The consequent carry-over effects can modify reproductive success, with long-term effects on local population dynamics [12,48].
The Eurasian blackcap (thereafter: blackcap), a common migrant passerine with a prominent sexual dimorphism, shows remarkable flexibility in adjusting its migrations to climate change. This plasticity manifests in reducing the distance of migration and establishing new wintering grounds in the British Isles over recent decades [49,50,51,52], as well as in major changes to their historical ranges, such as the suggested recent shift of migration of the eastern European populations from their traditional wintering grounds in the Eastern Mediterranean region to more western parts of their wintering range [53]. Spring migration phenology of blackcaps has been related to variation in several large-scale climate indices (SCI, NAO, IOD) that operate across their wide wintering grounds and migration routes, but the sexes were treated jointly, so the potential sex differences have not been considered [17,41]. For these reasons, we selected the blackcap to investigate hypotheses regarding a potential increase in protandry and sex-specific responses to climate change, analogous to those in other migratory passerines.
Earlier studies based on about 20 years of data from the late 20th century found no evidence of increasing protandry in the blackcap [10]. Using a dataset twice as long on spring migration of blackcap, we set out to reassess this pattern, expecting an increase in protandry over a longer period, considering more rapid climate change and temperature increase across Europe in recent decades. Thus, our first aim is to identify any long-term trends in the spring migration phenology of male and female blackcaps, using a 44-year data series (1982–2025) from the southern Baltic coast, and to determine if the degree of protandry has changed over this period. Secondly, we aim to determine if any relationships of the spring migration timing to large-scale climate indices differ between male and female blackcaps, which we would expect considering blackcaps’ protandry.
2. Materials and Methods
2.1. Study Species
The Eurasian blackcap (Sylvia atricapilla) is a small passerine easily sexed by plumage and size: females have a brown crown, and males are slightly larger with a characteristic black cap [54]. Blackcaps are commonly breeding across Europe (Figure 1a) in habitats with dense undergrowth, such as parks, gardens, and deciduous or mixed woodlands [55].
They are mainly insectivorous, but their pre-migratory fattening is supported by a highly flexible diet including fruits; during periods of invertebrate scarcity they can switch to pollen, nectar, and fruit [55,57]. Blackcaps exhibit considerable variation in migration habits, ranging from completely resident populations breeding in the south of Europe, to obligatory long-distance, trans-Saharan migrants in the north and east of the breeding range [55,58]. Central Europe features a migratory divide separating southwest-bound and southeast-bound autumn migration routes, with intermediate populations moving south [59,60]. Additionally, a recent evolutionary shift has led some central and northwestern breeding birds to winter in the British Isles rather than in their traditional southern wintering grounds [49,50,51,59,61], and the eastern European populations to change their historical wintering grounds in the Eastern Mediterranean region to more western areas, closer to the breeding grounds [53]. Populations breeding in western Europe are only partially migratory [55,61].
Blackcaps passing through the southern Baltic coast, which are the focus of this study, originate primarily from populations breeding in Scandinavia and the Baltic region, including local birds breeding near the study site (Figure 1a) [60,62]. These populations overwinter across the Iberian Peninsula, northwest Africa, and the eastern Mediterranean region (particularly the Levant), with some individuals migrating as far as West Africa [59,60,62,63,64]. The annual phenology of these populations (Figure 2) includes the spring passage from these wintering quarters to the northern breeding grounds during March – mid-May, the breeding season (May to August, with one or two broods), the autumn migration (mid-August to November), and the wintering period (December–February) [55].
2.2. Study Site and Methods of Catching Birds
Fieldwork was conducted at the Bukowo-Kopań ringing station, situated on the Polish Baltic Sea coast (Figure 1a), as part of the long-term Operation Baltic research project. This coastal area, overgrown by mixed forests with fruit bushes, serves as a stopover site for blackcaps heading in spring to northern and northeastern breeding territories and also supports a local breeding population [59,62]. Following the Operation Baltic standard [65], birds were caught in mist nets daily from dawn until dusk. The number of mist nets remained constant within each spring season, but inter-annual variation ranged from 35 to 61 nets (Supplement, Table S1). Upon capture, each bird received a ring, and birds’ sex and age were recorded before release. The station's habitats and procedures are described in detail by Remisiewicz and Underhill [17].
Our analysis covers spring migration data collected between 26 March and 16 May 1982–2025. Fieldwork was suspended during springs 2011 and 2020 due to logistical constraints and the COVID-19 pandemic, resulting in 42 active seasons. Blackcaps caught after 16 May were mostly local breeding individuals, confirmed by their high recapture rates and the presence of brood patches. We used only the data from the initial capture for each bird within a season, and excluded any unsexed individuals from analyses. We combined all age classes (adults and second-calendar-year birds), working under the assumption that all blackcaps caught during spring were migrating to their breeding grounds.
To identify geographical regions used by the studied blackcap populations at their different life-stages, we analysed a supplementary dataset of 105 ringing recoveries. This dataset includes birds ringed at three Operation Baltic stations (Figure 1a) and subsequently found elsewhere, as well as foreign-ringed individuals controlled at these stations, between September 1960 and June 2025. We mapped these ringing recoveries (Figure 1a) against the species' geographical distribution [56] using QGIS v. 3.44.5 [66].
2.3. Large-Scale Climate Indices
We analysed seven large-scale climate indices that represent climatic conditions across the non-breeding areas and spring migration routes of the studied blackcap populations. The monthly values of these indices were downloaded from online databases listed in Table 1.
To match these indices with the species' annual cycle, we calculated seasonal means from these monthly values for two periods: the wintering period (December–February) and spring migration (March–May) (Figure 2; Table 1). These indices serve as proxies for ecological conditions experienced by blackcaps during these life stages. We provide their brief descriptions below, focused on their positive phases; the negative phase usually brings opposite regional climate effects, but we specify when this pattern occasionally differs.
2.3.1. Mediterranean Oscillation Index (MOI)
The Mediterranean Oscillation Index is the pressure gradient between the western and eastern Mediterranean regions, reflecting opposing changes in pressure, temperature, and precipitation in these areas [67,68]. We used the MOI1, calculated as the normalized sea-level pressure difference between Algiers and Cairo [68,69]. The positive MOI represents high pressure over the southwestern Mediterranean, which in winter leads to stable, dry, and warm weather across the western and central basin [70,71], extending to the Balkan Peninsula [72,73] (Figure 1a). Opposite conditions, with increased storms, higher rainfall, and lower-than-average temperatures occur in the easternmost Mediterranean [70,74]. In spring, the positive MOI maintains dry conditions in the central Mediterranean [75], but with regional exceptions, such as increased precipitation in April and May in Morocco, because moist Atlantic air is forced over the Atlas Mountains [71]. Similarly, in the Balkan Peninsula, a positive MOI in April brings cooler or humid conditions, correlated with fewer forest fires than during negative MOI [72]. The negative MOI in winter and spring allows moist Atlantic air to increase precipitation across the western and central Mediterranean [70,73].
2.3.2. North Atlantic Oscillation (NAO)
The North Atlantic Oscillation is the surface sea-level pressure difference between the Azores High and the Icelandic Low pressure centres [76], which behave oppositely: when pressure rises in one, it decreases in the other [76]. This mechanism shapes the intensity and direction of westerly winds, controlling the transport of heat and moisture across the North Atlantic into Europe [77]. The positive winter NAO (Figure 1b) produces strong westerly winds across the middle latitudes [76], which steer warm and moist maritime air toward Europe [78,79,80]. Consequently, Northern, Central, and Eastern Europe experience warm winters, while Southern Europe, the Mediterranean, and North Africa undergo colder conditions due to the airflow from the north [76,81,82]. During the positive phase, winter precipitation is increased in Northern Europe and the central coast of North Africa, while Western and Southern Europe, the Balkans, and western North Africa remain drier [76,77,82,83]. In northwestern Africa, this drought is further driven by the reinforced Azores High, which frequently brings dry eastward winds [83]. In early spring, the positive NAO maintains these weather patterns [78,84].
2.3.3. Scandinavian Pattern Index (SCI)
The Scandinavian Pattern Index is shaped by a pressure dipole between Scandinavia and Southern Europe, with the main circulation centre over Scandinavia and weaker centres of opposite sign over Western Europe and Eastern Russia or Western Mongolia [85,86,87]. The positive phase is often associated with height centres and blocking anticyclones over Scandinavia and Western Russia (Figure 1c) [85,88]. The positive SCI phase in winter leads to low temperatures across Scandinavia and Western, Central, and Eastern Europe, while Southeastern Europe and the eastern Mediterranean basin experience warm conditions [85,86]. Considering precipitation, Northern, Central, and Eastern Europe are drier than usual [86,87]. At the same time, a low-pressure centre forms over the Mediterranean, which brings rainfall to Southern and Western Europe, particularly over the Iberian and Apennine Peninsulas [85,86,89]. The positive SCI in spring continues its cooling effect on European weather [90], and maintains drier-than-usual conditions in the eastern Baltic Sea basin, affecting the Baltic countries and northwestern Russia [87]. During the negative SCI phase, the spatial extent of the climate conditions remains identical to the positive phase, but the temperature and precipitation effects are reversed [86,87,89,90].
2.3.4. Indian Ocean Dipole (IOD)
The Indian Ocean Dipole reflects the difference in ocean surface temperatures between the western and southeastern tropical Indian Ocean, which directly affects the regional climate and exerts indirect long-distance atmospheric influences (Figure 1d) [91]. The positive IOD occurs when the western Indian Ocean is warmer than usual, and the eastern part is cooler, which influences local weather systems, causing extreme flooding in the Horn of Africa and droughts in Southern Africa [91,92,93]. Indirectly, these massive shifts in tropical heat and moisture generate large-scale atmospheric waves that affect pressure systems thousands of kilometers away. This remote influence brings warm winters to most of Europe and North Africa [94,95]. Precipitation patterns related to positive winter IOD differ regionally. Winter rainfall increases mostly in southern and western Europe, particularly on the Iberian Peninsula and at the western Mediterranean coast of North Africa, while drier conditions occur across parts of North Africa and the eastern Mediterranean basin (Figure 1d) [95]. During spring, IOD usually remains neutral in March and April, but its new cycle begins in May, triggering weather patterns similar to winter [91,96,97]. These patterns stabilise high-pressure systems in Europe and Eurasia, leading to unusually warm temperatures in spring [96]. The warming of the western Indian Ocean also brings increased rainfall in the Horn of Africa [98,99]. The negative winter IOD is directly related to reduced rainfall and drought in this region [91]. Its remote effect includes colder-than-average winters across the western and central Mediterranean basin and North Africa, but warmer conditions in northern and eastern Europe, and drier conditions in southwestern and eastern Europe, the Balkans, and the eastern Mediterranean basin (Figure 1d) [94,95].
2.3.5. Long-Term Trends of Large-Scale Climate Indices and Their Correlations
We checked for multi-year trends in all used large-scale climate indices (Table 1) over the study period using simple linear regression models. The only statistically significant trend occurred for the spring SCI, which showed a significant decrease over 1982–2025 (Figure S1). We also checked if these large-scale climate indices were correlated using Pearson’s correlation coefficient, applying Benjamini and Hochberg's [100] correction for multiple comparisons. Only three correlations were statistically significant (Table S2), and the strongest correlation between the winter NAO and winter MOI was r = 0.68, thus we avoided using these two variables in one multiple regression model. All correlation coefficients were lower than the recommended threshold of |r| = 0.7, indicating that the effects of multicollinearity on the results of models including these climate variables would be negligible [101].
2.4. Methods of Data Analysis
2.4.1. Analysis of Long-Term Trends in Spring Migration Phenology and Protandry
First, we used individual capture data to calculate the dates of percentiles of passage of males and females in each year: the 10th (p10) (beginning), 50th (p50) (median), and 90th (p90) (end of passage), expressed as the day number in the year (1 January = Day 1). We used these dates as parameters reflecting the timing of these three phases of migration of each sex in each year, as in many other studies [10,102,103,104,105]. We excluded four years from the analyses when fewer than 5 females were captured, as females were fewer than males among captures (Table S1). Thus, we finally analysed data from 38 springs during 1982–2025, including 2912 females and 4345 males, in total 7257 blackcaps (Table S1).
To estimate multi-year trends in migration timing for each sex, we used linear regression of the dates of p10, p50 and p90 for each sex against the year number from 1982 (YearN) as the continuous explanatory variable. We considered the degree of protandry as the difference in the dates of these percentiles between males and females, as in Tøttrup and Thorup [10]. To check for protandry and to test whether its degree had changed over the years, we ran three multiple linear regression models, one for each of the time-series of these percentiles’ dates, including the standardised year (YearSt) and sex (SexN, coded as 0=males, 1=females), and their interaction as explanatory variables. We applied the “all subsets” approach using the “dredge” function in the “MuMIn” package [106], and we ranked the models using the Akaike Information Criterion corrected for small sample sizes (AICc). The model with the lowest AICc was considered the best model, which we then interpreted.
2.4.2. Estimating the Effects of Large-Scale Climate Indices on Different Phases of Blackcap Spring Migration
To test the effects of large-scale climate indices on the timing of these three phases of passage, we ran multiple linear regression models where the time series of the dates of p10, p50 and p90 in 1982–2025 were response variables, and the explanatory variables included the year, the four large-scale climate indices (NAO, MOI, SCI, IOD) in winter and spring (Table 1), and the interactions of these climate variables with sex. All explanatory variables were standardised before being included in the models, as they were at different scales. Because these variables were too many to be included in one model, we first ran the models separately for these indices in winter months (December–February) in the "winter models", and indices for spring months (March–May) in separate "spring models". Because winter MOI and winter NAO were correlated at r = 0.68 (Table S2), to avoid multicollinearity, we ran the partial winter models for two sets of variables: one excluding winter MOI, and the other excluding winter NAO. Thus, we ran nine models: two “winter” models and one “spring” model for each of three migration phases. We conducted the model selection using the “all subsets” approach and model ranking according to AICc, using the “MuMIn” package [106], as previously.
Comparing these partial “winter” models, we found that models including winter NAO consistently explained a higher proportion of the variation in the migration timing, as they had higher Adjusted R² (Adj R²) values than the models including winter MOI. Therefore, in the second step, we used the variables selected in the best “winter” models including winter NAO (not winter MOI), and in the best “spring” models.
Next, for each migration phase (p10, p50, and p90), we ran “winter and spring” models, combining the winter and spring climate indices selected by these best models. In these multiple regression models, we included those interactions of these indices with Sex that were retained by the respective “winter” or “spring” best models in the first step. We applied the same “all subsets” approach and AICc model ranking as earlier, to identify the final best “winter and spring” models. To determine the percentage of explained variation in the response variable, we extracted Adj R² for each final model using the “broom” package [107].
We evaluated multicollinearity among predictors in these models using the Variance Inflation Factor (VIF) from the “car” package [108]. To test for potential overfitting, we cross-validated the final best models using a three-step approach recommended by [109]: (1) visual inspection of diagnostic plots to identify outliers and highly influential data points based on Cook’s distance; (2) evaluation of the ratio of Adj R² to the multiple coefficient of determination (R²), where a ratio approaching 1 indicates an optimal model fit; and (3) comparison of Adj R² with the Predictive R² (predR²). The predR² was calculated from the Predicted Residual Error Sum of Squares (PRESS) using a Leave-One-Out Cross-Validation procedure using custom R functions [110]. In this approach, each data point is sequentially removed, the model is refitted, and its ability to predict the omitted observation is evaluated. A minimal difference between Adj R² and predR² indicates that the model is stable and not overfitted [110]. This application of multiple regression, evaluation of multicollinearity and stability of final models followed earlier studies [18,40,41]. The final “winter and spring” models provided estimates of the effect of each selected climate variable on the dates of p10, p50, and p90 of the spring passage. We visualized these effects as scatter plots showing relationships of these variables to the dates of these phases of passage and fitted linear regression lines, using the “ggplot2” package [111]. All statistical analyses were conducted in R 4.4.2 [112].
3. Results
3.1. Protandry and Sex-Specific Long-Term Trends in the Timing of Spring Migration of Blackcaps
During 1982–2025, the dates of the beginning (p10) of spring passage for both sexes shifted earlier by 9 days (Figure 3; Table S3).
The protandry in blackcaps at Bukowo-Kopań occurred at the beginning of spring passage, because p10 was on average 2.2 days earlier for males than for females (Figure 3; Tables S4 and S5). This degree of protandry remained stable over 1982–2025 (Figure 3, Tables S4 and S5), as indicated by the parallel regression lines (Figure 3), and a lack of the YearSt:SexN interaction in the best model for p10 (Table S5). The median dates (p50) of passage did not differ between the sexes (Figure 3), as confirmed by the absence of the sex effect (SexN) in the best model (Table S5). The p50 dates for males shifted earlier by 9 days and for females by 7 days, over 1982–2025 (Figure 3; Table S3), but these advancing trends were similar, as shown by no YearSt:SexN interaction in the best model (Table S5). The dates of the end of migration (p90) showed no trends over time and did not differ between the sexes (Figure 3; Table S3), as confirmed by a lack of the effect of sex (SexN) in the best model (Table S5).
3.2. Effects of Large-Scale Climate Indices on Spring Migration Timing
The “winter” models including NAO (but not MOI) explained 7% – 27% of the variation in the timing of different phases of spring migration (Table S7), while the models including MOI (but not NAO) explained 7% – 25% of this variation (Table S9). Because the “winter” models including winter NAO consistently explained a higher proportion of the variation than those including MOI (Tables S7 and S9), we used the outcome from the first approach in the combined “winter and spring” models. The best “spring” models explained from 0% to 44% of the variation in the timing of p90 and p10, respectively (Table S11).
The best “winter and spring” model (Table S12) explained 48% of the variation in the date of beginning of passage (p10) at Bukowo-Kopań during 1982–2025 (Table S13). We found no differences between the sexes in the relationships of p10 to the climate indices. For both sexes, p10 was early with high winter NAO (Figure 4a, Table S14) and high spring SCI (Figure 4b, Tables S13 and S14), or late with low values of these indices, as these relationships work both ways.
For the median date of migration (p50), the best model explained 39% of its variation in 1982–2025 (Table S13). No sex-specific differences occurred in the effects of large-scale climate indices. The median for both sexes was early with high winter NAO (Figure 4a, Table S14), high spring NAO (Figure 4c, Table S14), and high spring SCI (Figure 4b, Table S14). The best model for the end of passage (p90) explained 7% of its variation over the 44 years (Table S13). The sexes did not differ in their relationships to any of the climate indices. The date of p90 for both sexes was late with high winter IOD, or early with low values of this index (Figure 4d; Tables S13 and S14).
Diagnostic tests confirmed the stability of the final “winter and spring” models (Table S15, Figure S2). Minimum discrepancies between the Adj R² and pred R² and high ratios of Adj R² to R² (range: 0.84–0.94) indicated that the models were not overfitted (Table S15). Visual inspection of diagnostic plots confirmed that the assumptions of the regression models were met, with no highly influential outliers (Figure S2).
4. Discussion
Our study shows that both male and female blackcaps advanced their spring passage through the Baltic coast at a similar rate, hence the degree of protandry remained stable over the last 44 years, opposite to what we expected, considering the pattern in other passerines. Protandry was the most apparent at the very beginning of passage, but decreased as the spring progressed. Annual variation in migration timing was related to large-scale climate indices in both sexes similarly, contrary to our expectations. However, we found that the timing of subsequent migration phases in both sexes was shaped by different climate indices, suggesting that successive cohorts of males and females arrived along different spring migration routes. We discuss these findings in the context of the mating opportunity hypothesis and changing climate conditions across blackcap wintering grounds and migration routes.
4.1. Long-Term Phenological Trends in Both Sexes and Drivers of Spring Protandry
Protandry is common among migratory birds, driven mainly by the selective pressures of the mating system [6,11]. The mating opportunity hypothesis explains that earlier arrival enables males to occupy high-quality territories to improve reproductive success [10,26]. These phenological differences are related to energy management. Females must maintain sufficient fat and protein reserves for egg production, so they optimise energy costs and avoid harsh conditions early in spring that could deplete these essential reserves [5]. In contrast, males prioritise migration speed over energy saving [11]. Thus, blackcap males exhibit a time-minimising strategy and females an energy-maximising strategy during spring migration [113]. Furthermore, the earlier passage of males may result from spatial sex segregation at the non-breeding grounds. In blackcaps, males might winter in greater proportion at more northern latitudes than females, having a shorter migration distance to cross [30,114,115].
We suggest that both mechanisms contribute to the spring protandry we found at the beginning (p10) of passage at Bukowo-Kopań over 1982–2025, in line with earlier studies [10,116]. The protandry among the first migrants supports the mating opportunity hypothesis. Competition for breeding opportunities creates evolutionary pressure on males [7,117], as the first-arriving individuals secure the best territories and attract the earliest females [118,119,120]. In contrast, the timing of the median (p50) and the end (p90) of passage at our station was similar for both sexes, suggesting that the pressure for early male arrival fades as the season progresses. The lack of protandry in the median dates of passage contrasts with results from Helgoland (North Sea, Germany) and Christiansø (Baltic Sea, Denmark), where this phase of passage was significantly earlier in male than in female blackcaps [116]. This discrepancy might result from differences in the composition of populations passing through these stations compared to Bukowo-Kopań, or the different time periods analysed (1982–2025 in our study vs. 1976–1997 in Rainio et al. [116]).
The degree of protandry at the start of passage did not change over our 44-year study period, as males and females advanced their migration timing at a similar rate. Furthermore, the median date of passage advanced similarly for both sexes, despite no clear protandry at that phase of migration. This uniform phenological shift aligns with earlier studies, which also reported no changes in the degree of protandry over 1976–1997, both for the combined data from Helgoland and Christiansø [116] and for Christiansø alone [10]. The similar advancement suggests that earlier spring passage benefits both sexes equally. Mild springs might enable males to reach breeding grounds early to maximise mating opportunities, and allow females to lay eggs earlier, extending the breeding season and increasing chances of raising two clutches for both sexes [20,26].
The advancement of the start of migration by 9 days (for both sexes) and of the median by 7–9 days at Bukowo-Kopań is consistent with the shift to earlier median migration dates reported during 1976–1997 for combined data from Helgoland and Christiansø [116]. Our results also correspond with the negative trends observed at Christiansø alone [10] that indicated an advance in arrival at all migration phases (5%, 50%, and 95%), although these trends were not statistically significant, likely because of a shorter, 22-year time series. More recent data from the Blåvand bird observatory in Denmark also showed significant advancement of the first and last 5% of the passage of blackcaps during 1984–2022; however, unlike our study, this analysis combined males and females [105]. The lack of any multi-year trend in the timing of p90 in our study differs from the significant trend at Blåvand [105], probably because at Bukowo–Kopań the locally breeding blackcaps arriving at the end of spring might have masked any trends. A weaker phenological shift with the progress of the passage is a common pattern across all the mentioned stations [10,105]. This might result from a slower migration of birds in the “tail” of passage, which often includes weaker individuals, which likely were “outcompeted” by the preceding fitter individuals, but might still be able to raise some chicks [121], hence smaller time pressure. The overall shift to earlier passage for the first half of the population suggests that blackcaps respond to increasingly mild conditions on their wintering grounds and along spring migration routes [2,10,22], which increases their chances to raise two clutches during extended breeding season [26]. Similar advancement suggests that earlier spring passage benefits both sexes equally. Mild springs might enable males to reach breeding grounds early to maximise mating opportunities, and allow females to lay eggs earlier, extending the breeding season and increasing chances of raising two clutches for both sexes [20,26].
4.2. Similar Responses of Both Sexes to Large-Scale Climate Indices
Our key finding is a lack of differences in male and female blackcap relationships to any of the large-scale climate indices. This differs from our initial expectations that males should respond stronger to some climate patterns, especially those that shape winter and spring conditions in Europe, as male blackcaps generally winter closer to their breeding grounds than females [6,11,12,28,29,30,31,32]. Unlike the song thrush, in which after warm winters and springs the males arrived in the Baltic region much earlier than the females [45], in the blackcap the relationships of both sexes to climatic conditions were similar, despite the protandry at the beginning of passage (p10) at Bukowo-Kopań. This difference might reflect species-specific phenological plasticity, with the song thrush and both sexes of the blackcap showing the same level of flexibility in response to changing conditions. Both species share part of their wintering grounds in the Mediterranean region, but Redlisiak et al. (2021) analysed regional mean temperatures from southern and south-western Europe. If male and female song thrushes are partly segregated across the wintering grounds, as other passerines, they might be exposed to different local temperatures, which could affect their migration differently. This contrasts with the large-scale climate factors we analysed for blackcaps, which have a climatic footprint over much larger areas of the wintering range of the blackcap, from northern Africa through the Mediterranean, up to central Europe [76,122]. Even though females winter farther south than males due to spatial segregation [11,30], both sexes likely experience the same broad weather conditions dictated by these large-scale oscillations, and adjust their migration timing accordingly. Additionally, female blackcaps appear to be as phenologically adaptive as males, likely because the benefits of advancing spring migration and increasing a chance for second broods balance the risks posed by cold spells in spring in females similarly to the males [20,26]. This uniform response of both sexes is consistent with findings from Helgoland and Christiansø, where the winter NAO did not affect the degree of protandry in blackcaps [116], and with the conclusion that both sexes respond similarly to changing climatic conditions [10]. Protandry in blackcaps appears to be maintained by the selective pressures described by the mating opportunity hypothesis [7,10,20], regardless of the weather conditions in a given season.
4.3. Effect of the North Atlantic Oscillation (NAO) on Spring Migration Timing
Positive winter NAO was related in both sexes to an advanced beginning (p10), and, with a weaker effect, to the median (p50) of passage, but not to its end (p90), a pattern similar to the responses to winter NAO in blackcaps migrating through other locations [10,102,105,116]. Our results for the beginning of passage contrast with a lack of significant relationship between the first arrival dates of blackcaps and winter NAO shown by long-term (1881–2007) observations from the Czech Republic [123]. This suggests that first blackcaps arrive there from areas under a weaker climatic influence of NAO, like the Eastern Mediterranean or southeast of Europe, indicated by ringing recoveries [60], than the first migrants at the more northern and coastal locations in Europe , including Bukowo-Kopań. The relationship between NAO and the beginning of passage at our station suggests that the first migrants winter close to the breeding grounds, in areas where positive NAO brings mild winters, such as western and central Europe [76,82]. Warm winters reduce energy expense for thermoregulation and lead to an earlier availability of insect prey, allowing these short-distance migrants to reach migration condition faster and depart early. The relationship we found between winter NAO and advancement of p50 contrasts with earlier records from Helgoland and Christiansø, where no analogous effect was found [116], possibly because they analysed a shorter time series. The relationship we revealed might also reflect a more recent shift in wintering patterns of the eastern population of blackcap, from eastern to more western wintering grounds [53], which are under climatic influence of NAO. Positive spring NAO was related to the advanced median of passage (p50) for both sexes, in line with earlier results showing analogous shifts for both sexes jointly [17]. Positive NAO brings warm spring and south-westerly winds across central and western Europe, and this effect of NAO is most pronounced in March, about the time that migrant blackcaps moving northward enter this region [76,78,79,84]. Winds from the south-west can assist migrants in their movement to the north-east across Europe. Warm conditions might benefit migrants more indirectly, accelerating development of spring vegetation and increasing insect abundance at stopover sites [22,124].
4.4. Effect of the Scandinavian Pattern Index (SCI) on Spring Migration Timing
Positive spring SCI, which brings warm weather and thus likely favorable food conditions to the central and western Mediterranean [85,86,89] was related to an advanced start (p10) and median (p50) of migration of both sexes at Bukowo-Kopań. This suggests the first half of migrants benefit from these conditions, which allow for quick fuel accumulation and thus shorter stopovers on spring migration. Following the mating opportunity hypothesis [7,10,20], we suggest that the migrants that form the first phase of passage (p10) winter close to the breeding grounds, probably at the northern edges of the central and western Mediterranean region. With positive SCI, they might experience the spring peak in food availability in these areas, which enables an early departure for migration. Birds that form the middle phase (p50) of passage, arriving from more southern wintering areas, might experience such conditions during their stopovers in these areas, which results in an analogous phenological shift. These phase-specific responses align with previously found relationship between the positive spring SCI and advancement of the overall spring passage of the blackcap at Bukowo-Kopań [17]. By dividing the migration into phases, our study reveals that this overall relationship has been primarily driven by a response of the first half of migrants to environmental conditions shaped by SCI.
4.5. Effect of the Indian Ocean Dipole (IOD) on Spring Migration Timing
Positive winter IOD, which brings dry spells to the eastern Mediterranean [95,125], was related to the delayed end of migration (p90) in both sexes, which suggests that blackcaps that form the end of spring passage at Bukowo-Kopań stopover in this region, as indicated by ringing recoveries (Figure 1a)[60]. A lack of rain in the Mediterranean region limits vegetation growth and food availability [126,127], which might extend the time the birds need to build fuel reserves, delay their departure, and ultimately their arrival at the Baltic coast. An earlier study did not find an effect of winter IOD on the overall spring migration of the blackcap at Bukowo-Kopań [17], but analysing the Annual Anomaly of the overall migration might mask the climatic influences on the last migrants (p90). However, multi-species studies showed relationships to the winter IOD in the spring migration timing at Bukowo-Kopań of the common redstart [17] and the chiffchaff [41], which share wintering areas affected by IOD with the blackcap. In the chiffchaff, positive winter IOD delayed the last fraction of passage [41], similarly as we found in blackcaps of both sexes. These analogies indicate that IOD influences similarly several species of long-distance migrants, suggesting they arrive at the southern Baltic coast from the south-east, along similar spring migration routes.
5. Conclusions
We revealed that both male and female blackcaps advanced the first half of their spring migration at the Baltic coast at a similar rate; thus the two-day protandry, manifested especially at the beginning of the passage, remained stable during the 44 years of our study. This stable protandry can be explained by the mating opportunity hypothesis, which suggests that selective pressures preserve the difference in spring timing between the sexes, regardless of the weather conditions varying between seasons. Despite this protandry, both sexes responded uniformly to atmospheric patterns in winter and spring, which suggests they affect similarly broad non-breeding grounds of both sexes. We suggest that females are as phenologically adaptive as males, to maximise common reproductive outcome for both sexes. Such phenological response to climate change apparently benefits the species, considering its almost three-fold increase in numbers across whole Europe, including the Baltic region, since the 1980s [128].
Supplementary Materials
The following supporting information can be downloaded at the website of this paper posted on Preprints.org, Figure S1: Long-term trends in large scale climate indices used in the analysis; Figure S2: Diagnostic plots for the final best “winter and spring” linear regression models for the dates of the beginning (p10), median (p50), and end (p90) of spring migration; Table S1: Numbers of captured males, females, and all Eurasian blackcaps (Sylvia atricapilla) caught, and of the nets used during each spring migration season (26 March–16 May) at Bukowo-Kopań in subsequent years of the period 1982–2025; Table S2: Pearson’s correlation coefficients between the winter and spring temperature variables in 1982–2025; Table S3: Linear regression parameters for the long-term trends in the dates for the beginning (p10), median (p50), and end (p90) of spring migration of the Eurasian blackcaps at Bukowo-Kopań in 1982–2025 (Figure 3); Table S4: Model selection for the linear regression models for the dates of the beginning (p10), median (p50), and end (p90) of spring passage, used as response variables; Table S5: Parameters of the best linear regression models for the dates of the beginning (p10), median (p50), and end (p90) of spring migration used as response variables, and the explanatory variables: standardized year (YearSt), sex (SexN), and their interaction (YearSt:SexN); Table S6: Model selection for the “winter” models including NAO (without MOI) of relationships between dates of the beginning (p10), median (p50), and end (p90) of spring migration of the Eurasian blackcap at Bukowo-Kopań and winter large scale climate indices, excluding the winter MOI variable, in 1982–2025; Table S7: Parameters of the best “winter” linear regression models including NAO (without MOI), for the dates of the beginning (p10), median (p50), and end (p90) of spring migration and winter variables in 1982–2025; Table S8: Model selection for the “winter” models of relationships including MOI (without NAO) between dates of the beginning (p10), median (p50), and end (p90) of spring migration of the Eurasian blackcap at Bukowo-Kopań and winter large scale climate indices, excluding the winter NAO variable, in 1982–2025; Table S9: Parameters of the best “winter” linear regression models including MOI (without NAO), for the dates of the beginning (p10), median (p50), and end (p90) of spring migration at Bukowo-Kopań in 1982–2025; Table S10: Model selection for the “spring models” of relationships between dates of the beginning (p10), median (p50), and end (p90) of spring migration of the Eurasian blackcap at Bukowo-Kopań and spring large scale climate indices in 1982–2025; Table S11: Parameters of the best “spring” linear regression models for the dates of the beginning (p10), median (p50), and end (p90) of spring migration at Bukowo-Kopań and spring variables, in 1982–2025; Table S12: Model selection for the “winter and spring” models of relationships between dates of the beginning (p10), median (p50), and end (p90) of spring migration of the Eurasian blackcap at Bukowo-Kopań and for combined winter and spring temperature variables, in 1982–2025; Table S13: Parameters of the best “winter and spring” linear regression models for the dates of the beginning (p10), median (p50), and end (p90) of spring migration of the Eurasian blackcap at Bukowo-Kopań and winter and spring large scale climate indices selected in the best “winter” and “spring” models, in 1982–2025; Table S14: Linear regression parameters for the relationships between the dates of the beginning (p10), median (p50), and end (p90) of spring migration of the Eurasian blackcaps at Bukowo-Kopań in 1982–2025 and the selected large-scale climate indices (Figure 4); Table S15: Diagnostic tests for the final best “winter and spring” linear regression models for the dates of the beginning (p10), median (p50), and end (p90) of spring migration.
Supplementary Materials
The supporting information can be downloaded at Preprints.org.
Author Contributions
Conceptualisation – AP and MR. Data collection – both authors. Methodology and software development – AP and MR. Formal analysis and visualisation of the results – AP. Supervision and funding acquisition – MR. The original draft of the manuscript was prepared by AP, and both authors contributed to subsequent editing and responses to the reviews. Both authors have reviewed and approved the final version of the manuscript.
Funding
This research was supported by the Bird Migration Research Station, University of Gdańsk, through Special Research Facility grants (SPUB) provided by the Polish Ministry of Science and Higher Education (including SPUB No. 203733/E-335/SPUB/2016/4 for 2016–2018, SPUB No. 38/E-335/SPUB/2019 for 2019–2021 and SPUB No. 74/566668/SPUB/SP/2023 for 2023–2025).
Institutional Review Board Statement
All birds were trapped and ringed under the official permits issued by the Polish Ringing Centre. Field studies at all Operation Baltic stations were conducted in accordance with national ethical guidelines and environmental regulations and relevant permits from land managers.
Data Availability Statement
Long-term ringing data are accessible via the Global Biodiversity Information Facility (GBIF) under "Ringing Data from the Bird Migration Research Station, University of Gdańsk" (Nowakowski J. 2017, Occurrence dataset https://doi.org/10.15468/q5o88l accessed via GBIF.org on 22 May 2023).
Acknowledgments
We are grateful to the thousands of citizen scientists who participated in Operation Baltic over the past four decades; their dedicated fieldwork made this study possible. We thank the staff of the Bird Migration Research Station, especially Jarosław K. Nowakowski, Krzysztof Stępniewski, Wioletta Wójcik, Justyna Szulc and Anna Woźnicka, for their extensive work in compiling and maintaining the databases. Climate data were provided by the following institutions: • NOAA Climate Prediction Center (indices for IOD, SCI and NAO): http://www.cpc.ncep.noaa.gov/ (accessed on January 2026). • Climatic Research Unit, University of East Anglia (MOI data): https://crudata.uea.ac.uk/cru/data/moi/ (accessed on January 2026).
Conflicts of Interest
The authors declare no conflicts of interest.
References
- Alerstam, T.; Hedenström, A.; Ǻkesson S. Long-Distance Migration : Evolution and Determinants. 2003, 2, 247–260. [CrossRef]
- Newton, I. The Migration Ecology of Birds; 2008; ISBN 978-0-12-517367-4.
- Emmenegger, T.; Hahn, S.; Bauer, S. Individual Migration Timing of Common Nightingales Is Tuned with Vegetation and Prey Phenology at Breeding Sites. BMC Ecology 2014, 14, 1–8. [CrossRef]
- Stutchbury, B.J.M.; Siddiqui, R.; Applegate, K.; Hvenegaard, G.T.; Mammenga, P.; Mickle, N.; Pearman, M.; Ray, J.D.; Savage, A.; Shaheen, T.; et al. Ecological Causes and Consequences of Intratropical Migration in Temperate-Breeding Migratory Birds. American Naturalist 2016, 188, S28–S40. [CrossRef]
- Péczely, P. The Eco-Physiology of Avian Reproduction; 2017; ISBN 978-615-5666-11-7.
- Briedis, M.; Bauer, S.; Adamík, P.; Alves, J.A.; Costa, J.S.; Emmenegger, T.; Gustafsson, L.; Koleček, J.; Liechti, F.; Meier, C.M.; et al. A Full Annual Perspective on Sex-Biased Migration Timing in Long-Distance Migratory Birds. Proceedings of the Royal Society B: Biological Sciences 2019, 286. [CrossRef]
- Kokko, H. Competition for Early Arrival in Migratory Birds. Journal of Animal Ecology 1999, 68, 940–950. [CrossRef]
- Morbey, Y.E.; Ydenberg, R.C. Protandrous Arrival Timing to Breeding Areas. Ecology Letters 2001, 4, 663–673.
- Rubolini, D.; Spina, F.; Saino, N. Protandry and Sexual Dimorphism in Trans-Saharan Migratory Birds. Behavioral Ecology 2004, 15, 592–601. [CrossRef]
- Tøttrup, A.P.; Thorup, K. Sex-Differentiated Migration Patterns, Protandry and Phenology in North European Songbird Populations. 2008, 161–167. [CrossRef]
- Schmaljohann, H.; Meier, C.; Bairlein, D.A.F.; Van Oosten, H.; Morbey, Y.E.; Åkesson, S.; Buchmann, M.; Chernetsov, N.; Desaever, R. Proximate Causes of Avian Protandry Differ between Subspecies with Contrasting Migration Challenges. Behavioral Ecology 2016, 27, 321–331. [CrossRef]
- Briedis, M.; Bauer, S. Migratory Connectivity in the Context of Differential Migration. Biology Letters 2018, 14. [CrossRef]
- Hansen, J.; Sato, M.; Ruedy, R.; Lo, K.; Lea, D.W.; Medina-Elizade, M. Global Temperature Change. Proceedings of the National Academy of Sciences of the United States of America 2006, 103, 14288–14293. [CrossRef]
- Sepp, M.; Palm, V.; Leito, A.; Päädam, K.; Truu, J. Tsirkulatsioonitüüpide Mõju Rändlindude Kevadisele Saabumisele Eestis Ja Pikaajalised Trendid Lindude Saabumiskuupäevas. Estonian Journal of Ecology 2011, 60, 111–131. [CrossRef]
- Santer, B.D.; Po-Chedley, S.; Zelinka, M.D.; Cvijanovic, I.; Bonfils, C.; Durack, P.J.; Fu, Q.; Kiehl, J.; Mears, C.; Painter, J.; et al. Human Influence on the Seasonal Cycle of Tropospheric Temperature. Science 2018, 361, eaas8806. [CrossRef]
- Lehikoinen, A.; Lindén, A.; Karlsson, M.; Andersson, A.; Crewe, T.L.; Dunn, E.H.; Gregory, G.; Karlsson, L.; Kristiansen, V.; Mackenzie, S.; et al. Phenology of the Avian Spring Migratory Passage in Europe and North America : Asymmetric Advancement in Time and Increase in Duration. Ecological Indicators 2019, 101, 985–991. [CrossRef]
- Remisiewicz, M.; Underhill, L.G. Large-Scale Climatic Patterns Have Stronger Carry-Over Effects than Local Temperatures on Spring Phenology of Long-Distance Passerine Migrants Between Europe and Africa. Animals 2022, 12. [CrossRef]
- Gołębiewski, I.; Remisiewicz, M. Carry-Over Effects of Climate Variability at Breeding and Non-Breeding Grounds on Spring Migration in the European Wren Troglodytes troglodytes at the Baltic Coast. Animals 2023, 13, 2015. [CrossRef]
- Nakazawa, T.; Hsu, Y.H.; Chen, I.C. Why Sex Matters in Phenological Research. Oikos 2023, 2023, 1–14. [CrossRef]
- Møoller, A.P. Protandry, Sexual Selection and Climate Change. Global Change Biology 2004, 10, 2028–2035. [CrossRef]
- Kokko, H.; Gunnarsson, T.G.; Morrell, L.J.; Gill, J.A. Why Do Female Migratory Birds Arrive Later than Males? Journal of Animal Ecology 2006, 75, 1293–1303. [CrossRef]
- Gordo, O. Why Are Bird Migration Dates Shifting? A Review of Weather and Climate Effects on Avian Migratory Phenology. Climate Research 2007, 35, 37–58. [CrossRef]
- Johansson, J.; Jonzén, N. Effects of Territory Competition and Climate Change on Timing of Arrival to Breeding Grounds: A Game-Theory Approach. American Naturalist 2012, 179, 463–474. [CrossRef]
- Messmer, D.J.; Alisauskas, R.T.; Pöysä, H.; Runko, P.; Clark, R.G. Plasticity in Timing of Avian Breeding in Response to Spring Temperature Differs between Early and Late Nesting Species. Scientific Reports 2021, 11, 5410. [CrossRef]
- Møller, A.P. Phenotype-Dependent Arrival Time and Its Consequences in a Migratory Bird. Behavioral Ecology and Sociobiology 1994, 35, 115–122. [CrossRef]
- Fontaine, J.J.; Martin, T.E. Parent Birds Assess Nest Predation Risk and Adjust Their Reproductive Strategies. Ecology Letters 2006, 9, 428–434. [CrossRef]
- Miranda, O.G.; Rodrigues, P.; Székely, T.; Szarvas, R.; Valdebenito, J.O. Migratory Protogyny and Condition-Dependent Arrival in Icelandic Red-Necked Phalaropes. Ornis Fennica 2025, 102, 43–49. [CrossRef]
- Cristol, D.A.; Baker, M.B.; Carbone, C. Differential Migration Revisited: Latitudinal Segregation by Age and Sex Class. In Current Ornithology; Nolan, V., Ketterson, E.D., Thompson, C.F., Eds.; Springer US: Boston, MA, 1999; pp. 33–88 ISBN 978-1-4419-3323-2.
- Marra, P.P.; Holmes, R.T. Consequences of Dominance-Mediated Habitat Segregation in American Redstarts during the Nonbreeding Season. Auk 2001, 118, 92–104. [CrossRef]
- Catry, P.; Phillips, R.A.; Croxall, J.P. Sexual Segregation in Birds: Patterns, Processes and Implications for Conservation. Sexual Segregation in Vertebrates: Ecology of the Two Sexes 2006, 351–378. [CrossRef]
- Komar, O.; O’Shea, B.J.; Townsend Peterson, A.; Navarro-Sigüenza, A.G. Evidence of Latitudinal Sexual Segregation among Migratory Birds Wintering in Mexico. Auk 2005, 122, 938–948. [CrossRef]
- Bayly, N.J.; Rosenberg, K.V.; Gómez, C.; Hobson, K.A. Habitat Choice Shapes the Spring Stopover Behaviour of a Nearctic-Neotropical Migratory Songbird. Journal of Ornithology 2019, 160, 377–388. [CrossRef]
- Pedersen, L.; Jakobsen, N.M.; Strandberg, R.; Thorup, K.; Tøttrup, A.P. Sex-Specific Difference in Migration Schedule as a Precursor of Protandry in a Long-Distance Migratory Bird. Science of Nature 2019, 106. [CrossRef]
- Intergovernmental Panel On Climate Change (IPCC) Climate Change 2021 – The Physical Science Basis: Working Group I Contribution to the Sixth Assessment Report of the Intergovernmental Panel on Climate Change; 1st ed.; Cambridge University Press, 2023; ISBN 978-1-009-15789-6.
- Gienapp, P.; Bregnballe, T. Fitness Consequences of Timing of Migration and Breeding in Cormorants. PLoS ONE 2012, 7. [CrossRef]
- Haest, B.; Hüppop, O.; van de Pol, M.; Bairlein, F. Autumn Bird Migration Phenology: A Potpourri of Wind, Precipitation and Temperature Effects. Global Change Biology 2019, 25, 4064–4080. [CrossRef]
- Haest, B.; Hüppop, O.; Bairlein, F. Weather at the Winter and Stopover Areas Determines Spring Migration Onset, Progress, and Advancements in Afro-Palearctic Migrant Birds. 2020, 117. [CrossRef]
- Hüppop, O.; Hüppop, K. North Atlantic Oscillation and Timing of Spring Migration in Birds. Proceedings of the Royal Society B: Biological Sciences 2003, 270, 233–240. [CrossRef]
- Tryjanowski, P.; Stenseth, N.C.; Matysioková, B. The Indian Ocean Dipole as an Indicator of Climatic Conditions Affecting European Birds. Climate Research 2013, 57, 45–49. [CrossRef]
- Remisiewicz, M.; Underhill, L.G. Climatic Variation in Africa and Europe Has Combined Effects on Timing of Spring Migration in a Long-Distance Migrant Willow Warbler Phylloscopus trochilus. PeerJ 2020, 8. [CrossRef]
- Remisiewicz, M.; Underhill, L.G. Climate in Europe and Africa Sequentially Shapes the Spring Passage of Long-Distance Migrants at the Baltic Coast in Europe. Diversity 2025, 17, 528. [CrossRef]
- Visser, M.E.; Perdeck, A.C.; van Balen, J.H.; Both, C. Climate Change Leads to Decreasing Bird Migration Distances. Global Change Biology 2009, 15, 1859–1865. [CrossRef]
- Harnos, A.; Nóra; Kovács, S.; Lang, Z.; Csörgő, T. Zunehmende Protandrie Beim Frühjahrszug Des Trauerschnäppers (Ficedula hypoleuca) in Mitteleuropa. Journal of Ornithology 2014, 156, 543–546. [CrossRef]
- Møller, A.P. Tardy Females, Impatient Males: Protandry and Divergent Selection on Arrival Date in the Two Sexes of the Barn Swallow. Behavioral Ecology and Sociobiology 2007, 61, 1311–1319. [CrossRef]
- Redlisiak, M.; Remisiewicz, M.; Mazur, A. Sex-Specific Differences in Spring Migration Timing of Song Thrush Turdus philomelos at the Baltic Coast in Relation to Temperatures on the Wintering Grounds. European Zoological Journal 2021, 88, 191–203. [CrossRef]
- Hedlund, J.; Fransson, T.; Kullberg, C.; Persson, J.O.; Jakobsson, S. Increase in Protandry over Time in a Long-Distance Migratory Bird. Ecology and Evolution 2022, 12, 1–13. [CrossRef]
- Lehikoinen, E.; Sparks, T.H. Changes in Migration. In Effects of Climate Change on Birds; Møller, A.P., Fiedler, W., Berthold, P., Eds.; Oxford University Press, 2010; pp. 89–112.
- Saino, N.; Ambrosini, R.; Caprioli, M.; Romano, A.; Romano, M.; Rubolini, D.; Scandolara, C.; Liechti, F. Sex-Dependent Carry-over Effects on Timing of Reproduction and Fecundity of a Migratory Bird. Journal of Animal Ecology 2017, 86, 239–249. [CrossRef]
- Berthold, P.; Terrill, S.B. Migratory Behaviour and Population Growth of Blackcaps Wintering in Britain and Ireland: Some Hypotheses. Ringing and Migration 1988, 9, 153–159. [CrossRef]
- Pulido, F.; Berthold, P. Microevolutionary Response to Climatic Change. 2004, 35. [CrossRef]
- Kopiec, K.; Ozarowska, A. The Origin of Blackcaps Sylvia atricapilla Wintering on the British Isles. Ornis Fennica 2012, 89, 254–263. [CrossRef]
- Ożarowska, A.; Meissner, W. Increasing Body Condition of Autumn Migrating Eurasian Blackcaps Sylvia atricapilla over Four Decades. European Zoological Journal 2024, 91, 151–161. [CrossRef]
- Wynn, J.; Broniszewska, M.; Edney, A.; Garrido Garduno, T.; Moford, J.; Polakowski, M.; Rollins, R.E.; Salmon, P.; Vedder, O.; Liedvogel, M. Rapid and Divergent Changes in the Continental-Scale Organisation of a Short-Lived Songbird’s Migratory Strategy. bioRxiv preprint 2026. [CrossRef]
- Svensson, L.; Mullarney, K.; Zetterström, D. Collins Bird Guide; 3rd ed.; HarperCollins: London, 2019;
- The Birds of the Western Palearctic; Cramp, S., Brooks, D.J., Eds.; Warblers. Oxford University Press: Oxford, 1992; Vol. VI;
- BirdLife International, Handbook of the Birds of the World Bird Species Distribution Maps of the World. 2025.
- Berthold P. Control of Bird Migration; Chapman & Hall: London, 1996;
- del Hoyo, J.; Elliott, A.; Christie, D. Handbook of the Birds of the World; Old World Flycatchers to Old World Warblers. Lynx Edicions: Barcelona, 2006; Vol. 11;
- Delmore, K.E.; Van Doren, B.M.; Conway, G.J.; Curk, T.; Garrido-Garduño, T.; Germain, R.R.; Hasselmann, T.; Hiemer, D.; Van Der Jeugd, H.P.; Justen, H.; et al. Individual Variability and Versatility in an Eco-Evolutionary Model of Avian Migration: Migratory Strategies of Blackcaps. Proceedings of the Royal Society B: Biological Sciences 2020, 287. [CrossRef]
- Spina, F.; Baillie, S.; Bairlein, F.; Fiedler, W.; Thorup, K. The EURING Atlas of Bird Migration. Available online: https://migrationatlas.org/. (accessed on 31 July 2026).
- Shirihai, H.; Svensson, L. Handbook of Western Palearctic Birds; Larks to Warblers. Bloomsbury Publishing: Passerines, 2018; Vol. 1.
- Maciąg, T.; Nowakowski, J.K.; Redlisiak, M.; Rosińska, K.; Stępniewski, K.; Stępniewska, K.; Szulc, J. Website of the Bird Migration Research Station. Maps of Ringing Recoveries Available online: https://en–sbwp.ug.edu.pl/badania/monitoringwyniki/maps–of–ringing–recoveries/.(accessed on 31 July 2026).
- Bakken, V.; Runde, O.; Tjørve, E. Norsk Ringmerkingsatlas 2006, 2.
- Fransson, T.; Österblom, H.; Hall-Karlsson, S. Svensk Ringmärkningsatlas; Stockholm Natural History Museum: Stockholm, 2008; Vol. 3.
- Busse, P.; Meissner, W. Bird Ringing Station Manual; De Gruyter Open, Warsaw/Berlin, 2015;
- QGIS Development Team QGIS Geographic Information System 2025.
- Conte, M.; Giuffrida, A.; Tedesco, S. The Mediterranean Oscillation: Impact on Precipitation and Hydrology in Italy. In Proceedings of the Conference on Climate and Water; Helsinki, Finland, 1989; pp. 121–137.
- Palutikof, J.P.; Conte, M.; Casimiro Mendes, J.; Goodess, C.M.; Espirito Santo, F. Climate and Climatic Change. In Mediterranean Desertification and Land Use; W, C.J.B., Thornes, J.B., Eds.; John Wiley and Sons: London, 1996; pp. 43–86.
- Palutikof, J. Analysis of Mediterranean Climate Data: Measured and Modelled. Mediterranean Climate 2003, 125–132. [CrossRef]
- Kutiel, H.; Maheras, P. Variations in the Temperature Regime Across the Mediterranean During the Last Century and Their Relationship with Circulation Indices. Theoretical and Applied Climatology 1998, 61, 39–53. [CrossRef]
- Treguer, D.; Verner, D.; Redwood, J.; Christensen, J.; McDonnell, R.; Elbert, C.; Konishi, Y.; Belghazi, S. Climate Variability, Drought, and Drought Management in Morocco’s Agricultural Sector; World Bank, Washington, DC, 2018;
- Milenković, M.; Ducić, V.; Babić, V. The Mediterranean Oscillation (MOI) and the Forest Fires in Romania in the Period 1986–2014. Forum geografic 2016, XV, 126–132. [CrossRef]
- Miletić, M.; Ducić, V.; Mihajlović, J. Impact of the Mediterranean Oscillation on Climate Elements and Streamflow in the South Morava River Basin. Zbornik radova - Geografski fakultet Univerziteta u Beogradu 2025, 23–41. [CrossRef]
- Kutiel, H.; Paz, S. Sea Level Pressure Departures in the Mediterranean and Their Relationship with Monthly Rainfall Conditions in Israel. Theoretical and Applied Climatology 1998, 60, 93–109. [CrossRef]
- Treguer, D.; Verner, D.; Redwood, J.; Christensen, J.; McDonnell, R.; Elbert, C.; Konishi, Y. Climate Variability, Drought, and Drought Management in Tunisia’s Agricultural Sector. Climate Variability, Drought, and Drought Management in Tunisia’s Agricultural Sector 2018. [CrossRef]
- Hurrell, J.W.; Kushnir, Y.; Ottersen, G.; Visbeck, M. An Overview of the North Atlantic Oscillation. Geophysical Monograph Series 2003, 134, 1–35. [CrossRef]
- Visbeck, M.H.; Hurrell, J.W.; Polvani, L.; Cullen, H.M. The North Atlantic Oscillation: Past, Present, and Future. Proceedings of the National Academy of Sciences of the United States of America 2001, 98, 12876–12877. [CrossRef]
- Angulo-Martínez, M. Evaluation of the Relationship between the NAO and Rainfall Erosivity in NE Spain during the Period 1955-2006. 2009.
- Wanner, H.; Brönnimann, S.; Casty, C.; Gyalistras, D.; Luterbacher, J.; Schmutz, C.; Stephenson, D.B.; Xoplaki, E. North Atlantic Oscillation – Concepts and Studies. Surveys in Geophysics 2001, 22, 321–381. [CrossRef]
- Trigo, R.M.; Pozo-Vázquez, D.; Osborn, T.J.; Castro-Díez, Y.; Gámiz-Fortis, S.; Esteban-Parra, M.J. North Atlantic Oscillation Influence on Precipitation, River Flow and Water Resources in the Iberian Peninsula. International Journal of Climatology 2004, 24, 925–944. [CrossRef]
- Castro-Díez, Y.; Pozo-Vázquez, D.; Rodrigo, F.S.; Esteban-Parra, M.J. NAO and Winter Temperature Variability in Southern Europe. Geophysical Research Letters 2002, 29, 2–5. [CrossRef]
- Dutton, S. North Atlantic Oscillation. Available online: https://www.worldclimateservice.com/2021/08/26/north-atlantic-oscillation/. (accessed on 31 July 2026).
- Kessabi, R.; Hanchane, M.; Krakauer, N.Y.; Aboubi, I.; Kassioui, J.E.; Khazzan, B.E. Annual, Seasonal, and Monthly Rainfall Trend Analysis Through Non-parametric Tests in the Sebou River Basin (SRB), Northern Morocco. Climate 2022 , 10 (11): 170. [CrossRef]
- Luppichini, M.; Barsanti, M.; Giannecchini, R.; Bini, M. Statistical Relationships between Large-Scale Circulation Patterns and Local-Scale Effects: NAO and Rainfall Regime in a Key Area of the Mediterranean Basin. Atmospheric Research 2021, 248, 105270. [CrossRef]
- NOAA National Oceanic and Atmospheric Administration US Department of Commerce, National Weather Service. Climate Prediction Centre. Northern Hemisphere Teleconnection Patterns. Scandinavia (SCAND). Available online: https://www.cpc.ncep.noaa.gov/data/teledoc/scand.shtml. (accessed on 31 July 2026).
- Dutton, J. Scandinavian Pattern Climate Index. World Climate Service website. 2021. Available online: https://www.worldclimateservice.com/2021/09/06/scandinavian-pattern/ (accessed on 31 July 2026).
- Jaagus, J. Regionalisation of the Precipitation Pattern in the Baltic Sea Drainage Basin and Its Dependence on Large-Scale Atmospheric Circulation. Boreal Environment Research 2009, 14, 31–44.
- Bednorz, E. Snow Cover Occurrence in Central European Lowlands under Northern Hemisphere Circulation Patterns. Acta Climatologica et Chorologica 2009, 42–43, 17–28.
- Coscarelli, R.; Caloiero, T.; Feudo, T.L. Relationship between Winter Rainfall Amount and Teleconnection Patterns in Southern Italy. European Water 2013, 43, 13–21.
- Ptak, M.; Tomczyk, A.M.; Wrzesinski, D. Effect of Teleconnection Patterns on Changes in Water Temperature in Polish Lakes. Atmosphere 2018, 9. [CrossRef]
- Saji, N.H.; Vinayachandran, P.N. A dipole mode in the tropical Indian Ocean. Nature 1999, 401, 360–364. [CrossRef]
- Nicholson, S.E.; Fink, A.H.; Funk, C.; Klotter, D.A.; Satheesh, A.R. Meteorological Causes of the Catastrophic Rains of October/November 2019 in Equatorial Africa. Global and Planetary Change 2022, 208, 103687. [CrossRef]
- International Research Institute for Climate and Society Seasonal Climate Forecasts. Available online: https://iri.columbia.edu/our-expertise/climate/forecasts/seasonal-climate-forecasts/ (accessed on 31 July 2026).
- Met Office Seasonal Forecasts and Climate Drivers Resources. Available online: https://www.metoffice.gov.uk/services/government/contingency-planners/seasonal-forecasts-and-climate-drivers-resources. (accessed on 31 July 2026).
- Dutton, J. What Is the Indian Ocean Dipole (IOD)? Index, Forecast, and Climate Impacts. Available online: https://www.worldclimateservice.com/2021/09/02/indian-ocean-dipole/ (accessed on 31 July 2026).
- Takemura, K.; Shimpo, A. Influence of Positive IOD Events on the Northeastward Extension of the Tibetan High and East Asian Climate Condition in Boreal Summer to Early Autumn. Scientific Online Letters on the Atmosphere 2019, 15, 75–79. [CrossRef]
- Bureau of Meteorology. About the Indian Ocean Dipole (IOD) Available online: https://www.bom.gov.au/climate/influences/graphs/about-graphs.html (accessed on 31 July 2026).
- Cai, W.; Yang, K.; Wu, L.; Huang, G.; Santoso, A.; Ng, B.; Wang, G.; Yamagata, T. Opposite Response of Strong and Moderate Positive Indian Ocean Dipole to Global Warming. Nature Climate Change 2021, 11, 27–32. [CrossRef]
- Behera, S.K.; Luo, J.J.; Masson, S.; Delecluse, P.; Gualdi, S.; Navarra, A.; Yamagata, T. Paramount Impact of the Indian Ocean Dipole on the East African Short Rains: A CGCM Study. Journal of Climate 2005, 18, 4514–4530. [CrossRef]
- Benjamini, Y.; Hochberg, Y. Controlling the False Discovery Rate: A Practical and Powerful Approach to Multiple Testing. Journal of the Royal Statistical Society Series B: Statistical Methodology 1995, 57, 289–300. [CrossRef]
- Dormann, C.F.; Elith, J.; Bacher, S.; Buchmann, C.; Carl, G.; Carré, G.; Marquéz, J.R.G.; Gruber, B.; Lafourcade, B.; Leitão, P.J.; et al. Collinearity: A Review of Methods to Deal with It and a Simulation Study Evaluating Their Performance. Ecography 2013, 36, 27–46. [CrossRef]
- Vähätalo, A.V.; Rainio, K.; Lehikoinen, A.; Lehikoinen, E. Spring Arrival of Birds Depends on the North Atlantic Oscillation. Journal of Avian Biology 2004, 35, 210–216. [CrossRef]
- Tøttrup, A.P.; Thorup, K.; Rahbek, C. Patterns of Change in Timing of Spring Migration in North European Songbird Populations. Journal of Avian Biology 2006, 37, 84–92. [CrossRef]
- Miles, W.T.S.; Bolton, M.; Davis, P.; Dennis, R.; Broad, R.; Robertson, I.; Riddiford, N.J.; Harvey, P.V.; Riddington, R.; Shaw, D.N.; et al. Quantifying Full Phenological Event Distributions Reveals Simultaneous Advances, Temporal Stability and Delays in Spring and Autumn Migration Timing in Long-Distance Migratory Birds. Global Change Biology 2017, 23, 1400–1414. [CrossRef]
- den Uijl, M. Changes in the phenology of spring migrating passerines at Blåvand Bird Observatory Denmark, 1984-2021. Dansk Orn. Foren. Tidsskr., 2024, 118: 142-148.
- Bartoń, K. MuMIn: Multi-Model Inference. R Package Version 1.48.11: 2025. Available online: https://CRAN.R-project.org/package=MuMIn (accessed on 1 July 2025).
- Robinson, D.; Hayes, A.; Couch, S. Broom: Convert Statistical Objects into Tidy Tibbles Available online: https://CRAN.R-project.org/package=broom.
- Fox, J.; Weisberg, S.; Price, B. Car: Companion to Applied Regression Available online: https://CRAN.R-project.org/package=car.
- 8Frost, J. Regression Analysis. An Intuitive Guide for Using and Interpreting Linear Models, 1st ed.; 2019. Available online: https://www.amazon.com/dp/1735431184?asin=1735431184&revisionId=&format=4&depth=1 (accessed on 24 July 2025).
- Pareto, A. R Script Available online: https://rpubs.com/ratherbit/102428. ( accessed on 30 June 2025).
- Wickham, H. ggplot2: Elegant Graphics for Data Analysis; Springer-Verlag: New York, 2016; ISBN 978-3-319-24277-4.
- R Core Team. R: A Language and Environment for Statistical Computing; R Core Team: Vienna, Austria, 2025.
- Yosef, R.; Wineman, A. Differential Stopover of Blackcap (Sylvia atricapilla) by Sex and Age at Eilat, Israel. Journal of Arid Environments 2010, 74, 360–367. [CrossRef]
- Leal, A.; Monrós, J.S.; Barba, E. Migration and Wintering of Blackcaps Sylvia atricapilla in Eastern Spain. Ardeola 2004, 51, 345–355.
- Izhaki, I.; Maitav, A. Blackcaps Sylvia atricapilla Stopping over at the Desert Edge; Inter- and Intra-Sexual Differences in Spring and Autumn Migration. Ibis 1998, 140, 234–243. [CrossRef]
- Rainio, K.; Tøttrup, A.P.; Lehikoinen, E.; Coppack, T. Effects of Climate Change on the Degree of Protandry in Migratory Songbirds. Climate Research 2007, 35, 107–114. [CrossRef]
- Ninni, P.; De Lope, F.; Saino, N.; Haussy, C.; Møller, A.P. Antioxidants and Condition-Dependence of Arrival Date in a Migratory Passerine. Oikos 2004, 105, 55–64. [CrossRef]
- Bensch, S.; Hasselquist, D. Evidence for Active Female Choice in a Polygynous Warbler. Animal Behaviour 1992, 44, 301–311. [CrossRef]
- Smith, R.J.; Moore, F.R. Arrival Timing and Seasonal Reproductive Performance in a Long-Distance Migratory Landbird. Behavioral Ecology and Sociobiology 2005, 57, 231–239. [CrossRef]
- Cooper, N.W.; Murphy, M.T.; Redmond, L.J.; Dolan, A.C. Reproductive Correlates of Spring Arrival Date in the Eastern Kingbird Tyrannus Tyrannus. Journal of Ornithology 2011, 152, 143–152. [CrossRef]
- Węgrzyn, E. In the Blackcap Sylvia atricapilla Last-Hatched Nestlings Can Catch up with Older Siblings. Ardea 2012, 100, 179–186. [CrossRef]
- Stenseth, N.C.; Mysterud, A.; Ottersen, G.; Hurrell, J.W.; Chan, K.-S.; Lima, M. Ecological Effects of Climate Fluctuations. Science 2002, 297, 1292–1296. [CrossRef]
- Hubálek, Z.; Čapek, M. Migration Distance and the Effect of North Atlantic Oscillation on the Spring Arrival of Birds in Central Europe. Folia Zoologica 2008, 57, 212–220.
- Studds, C.E.; Marra, P.P. Rainfall-Induced Changes in Food Availability Modify the Spring Departure Programme of a Migratory Bird. Proceedings of the Royal Society B: Biological Sciences 2011, 278, 3437–3443. [CrossRef]
- Berkovic, S.; Murphy, V.; Hochman, A. Unraveling the Variability of Winter Persistent Dry Spells in the Levant via the Indian Ocean Dipole. Atmospheric Research 2026, 342, 109198. [CrossRef]
- Ali, E.; Cramer, W.; Carnicer, J.; Georgopoulou, E.; Hilmi, N.; Le Cozannet, G.; Lionello, P.; Spagnuolo, F.; Tirado, C. Mediterranean Region. In Climate Change 2022: Impacts, Adaptation and Vulnerability. Contribution of Working Group II to the Sixth Assessment Report of the Intergovernmental Panel on Climate Change; Cambridge University Press, 2022; pp. 2233–2272.
- Food and Agriculture Organization of the United Nations. The Status of Mediterranean Forests 2025; 2025; ISBN 978-92-5-140114-9.
- PECBMS. Pan-European Common Bird Monitoring Scheme Species Trends. Available online: https://pecbms.info/trends-and-indicators/species-trends/. (accessed on 30 July 2026).
Figure 1.
Spatio-temporal context of the study and the spatial influence of typical weather conditions associated with the positive phase of the analysed large-scale climate indices in winter and spring (December–May). (a) The location of the Bukowo-Kopań ringing station (54°19ʹ38″–54°27ʹ54″N, 16°13ʹ33″–16°25ʹ15″E), and two other stations of the Operation Baltic Project: Mierzeja Wiślana (54°21ʹ57″N, 19°23ʹ30″E) and Hel (54°44ʹ29″N, 18°33ʹ40″E), ringing recoveries of Eurasian blackcaps ringed or recovered at these stations during September 1960–June 2025, against the species' range [56], and the typical weather conditions associated with the positive phase of the Mediterranean Oscillation (MOI); (b) Typical weather conditions associated with the positive winter and spring North Atlantic Oscillation (NAO); (c) Typical weather conditions associated with the positive winter and spring Scandinavia pattern (SCI); (d) Typical weather conditions associated with the positive winter and spring Indian Ocean Dipole (IOD).
Figure 1.
Spatio-temporal context of the study and the spatial influence of typical weather conditions associated with the positive phase of the analysed large-scale climate indices in winter and spring (December–May). (a) The location of the Bukowo-Kopań ringing station (54°19ʹ38″–54°27ʹ54″N, 16°13ʹ33″–16°25ʹ15″E), and two other stations of the Operation Baltic Project: Mierzeja Wiślana (54°21ʹ57″N, 19°23ʹ30″E) and Hel (54°44ʹ29″N, 18°33ʹ40″E), ringing recoveries of Eurasian blackcaps ringed or recovered at these stations during September 1960–June 2025, against the species' range [56], and the typical weather conditions associated with the positive phase of the Mediterranean Oscillation (MOI); (b) Typical weather conditions associated with the positive winter and spring North Atlantic Oscillation (NAO); (c) Typical weather conditions associated with the positive winter and spring Scandinavia pattern (SCI); (d) Typical weather conditions associated with the positive winter and spring Indian Ocean Dipole (IOD).
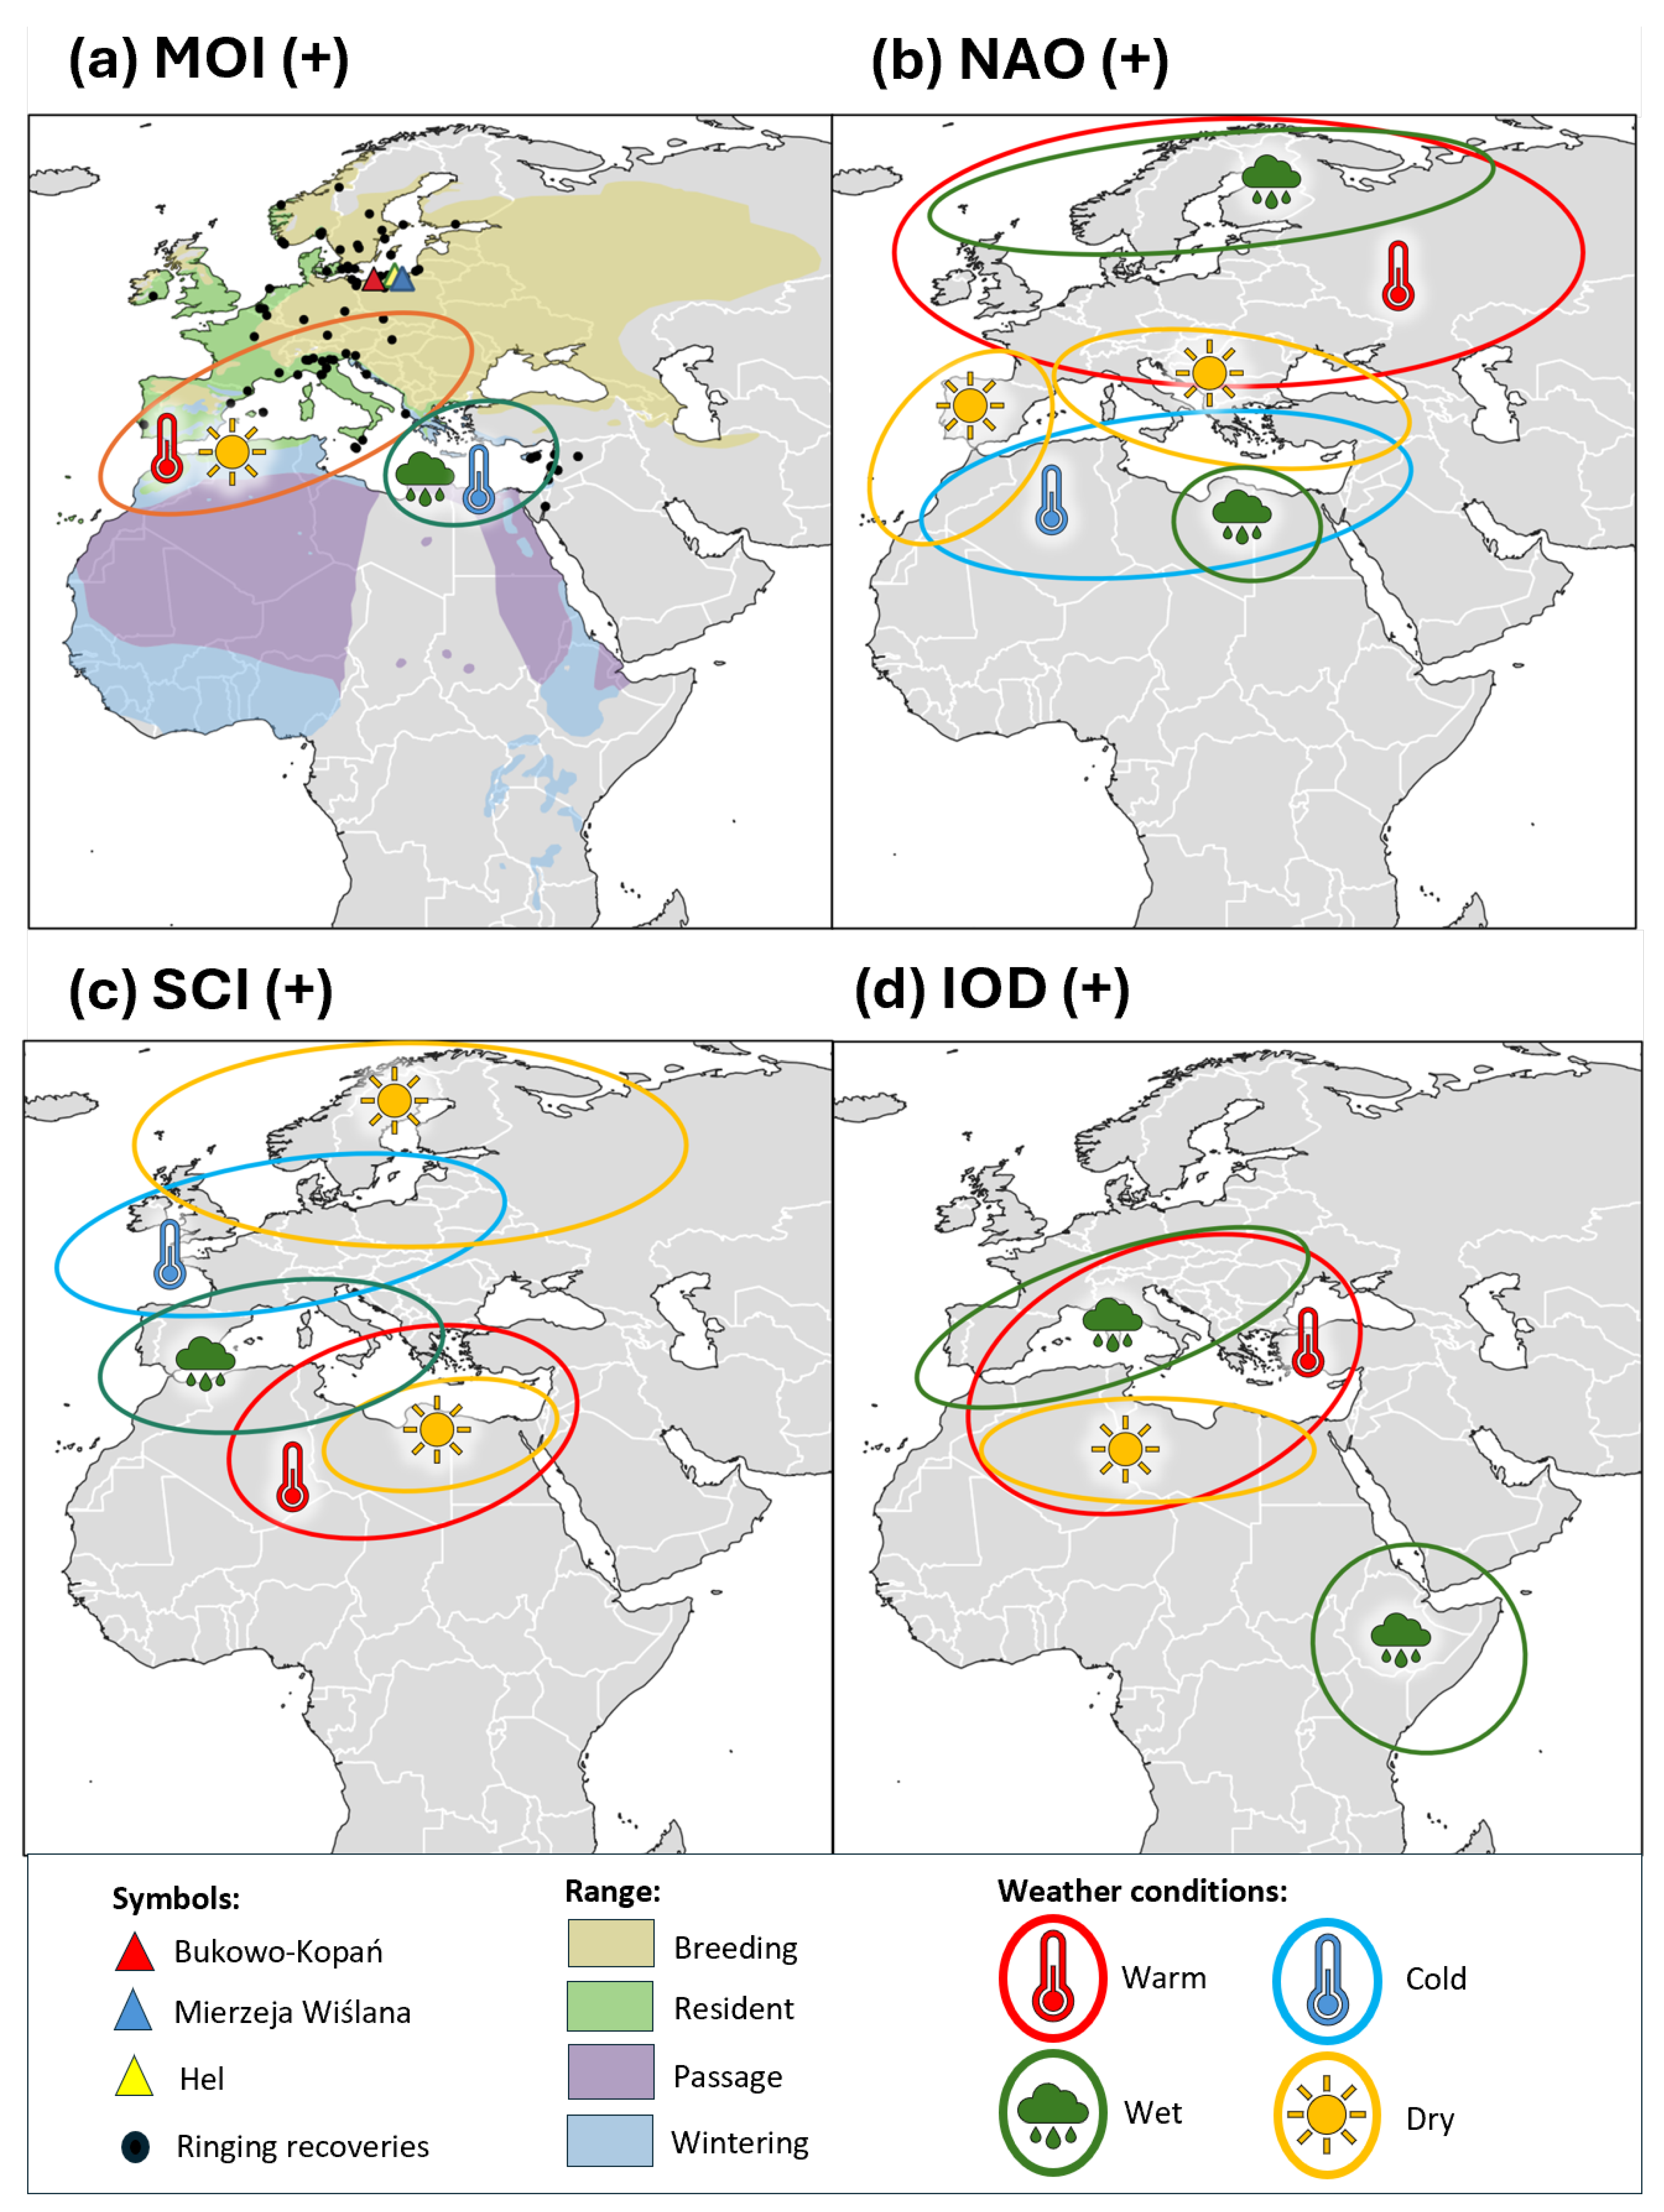
Figure 2.
The annual cycle of the northern populations of the Eurasian blackcap. The figure illustrates the four main life-stages distinguished in the study and their approximate months, used as the time periods for the analysed climate variables.
Figure 2.
The annual cycle of the northern populations of the Eurasian blackcap. The figure illustrates the four main life-stages distinguished in the study and their approximate months, used as the time periods for the analysed climate variables.
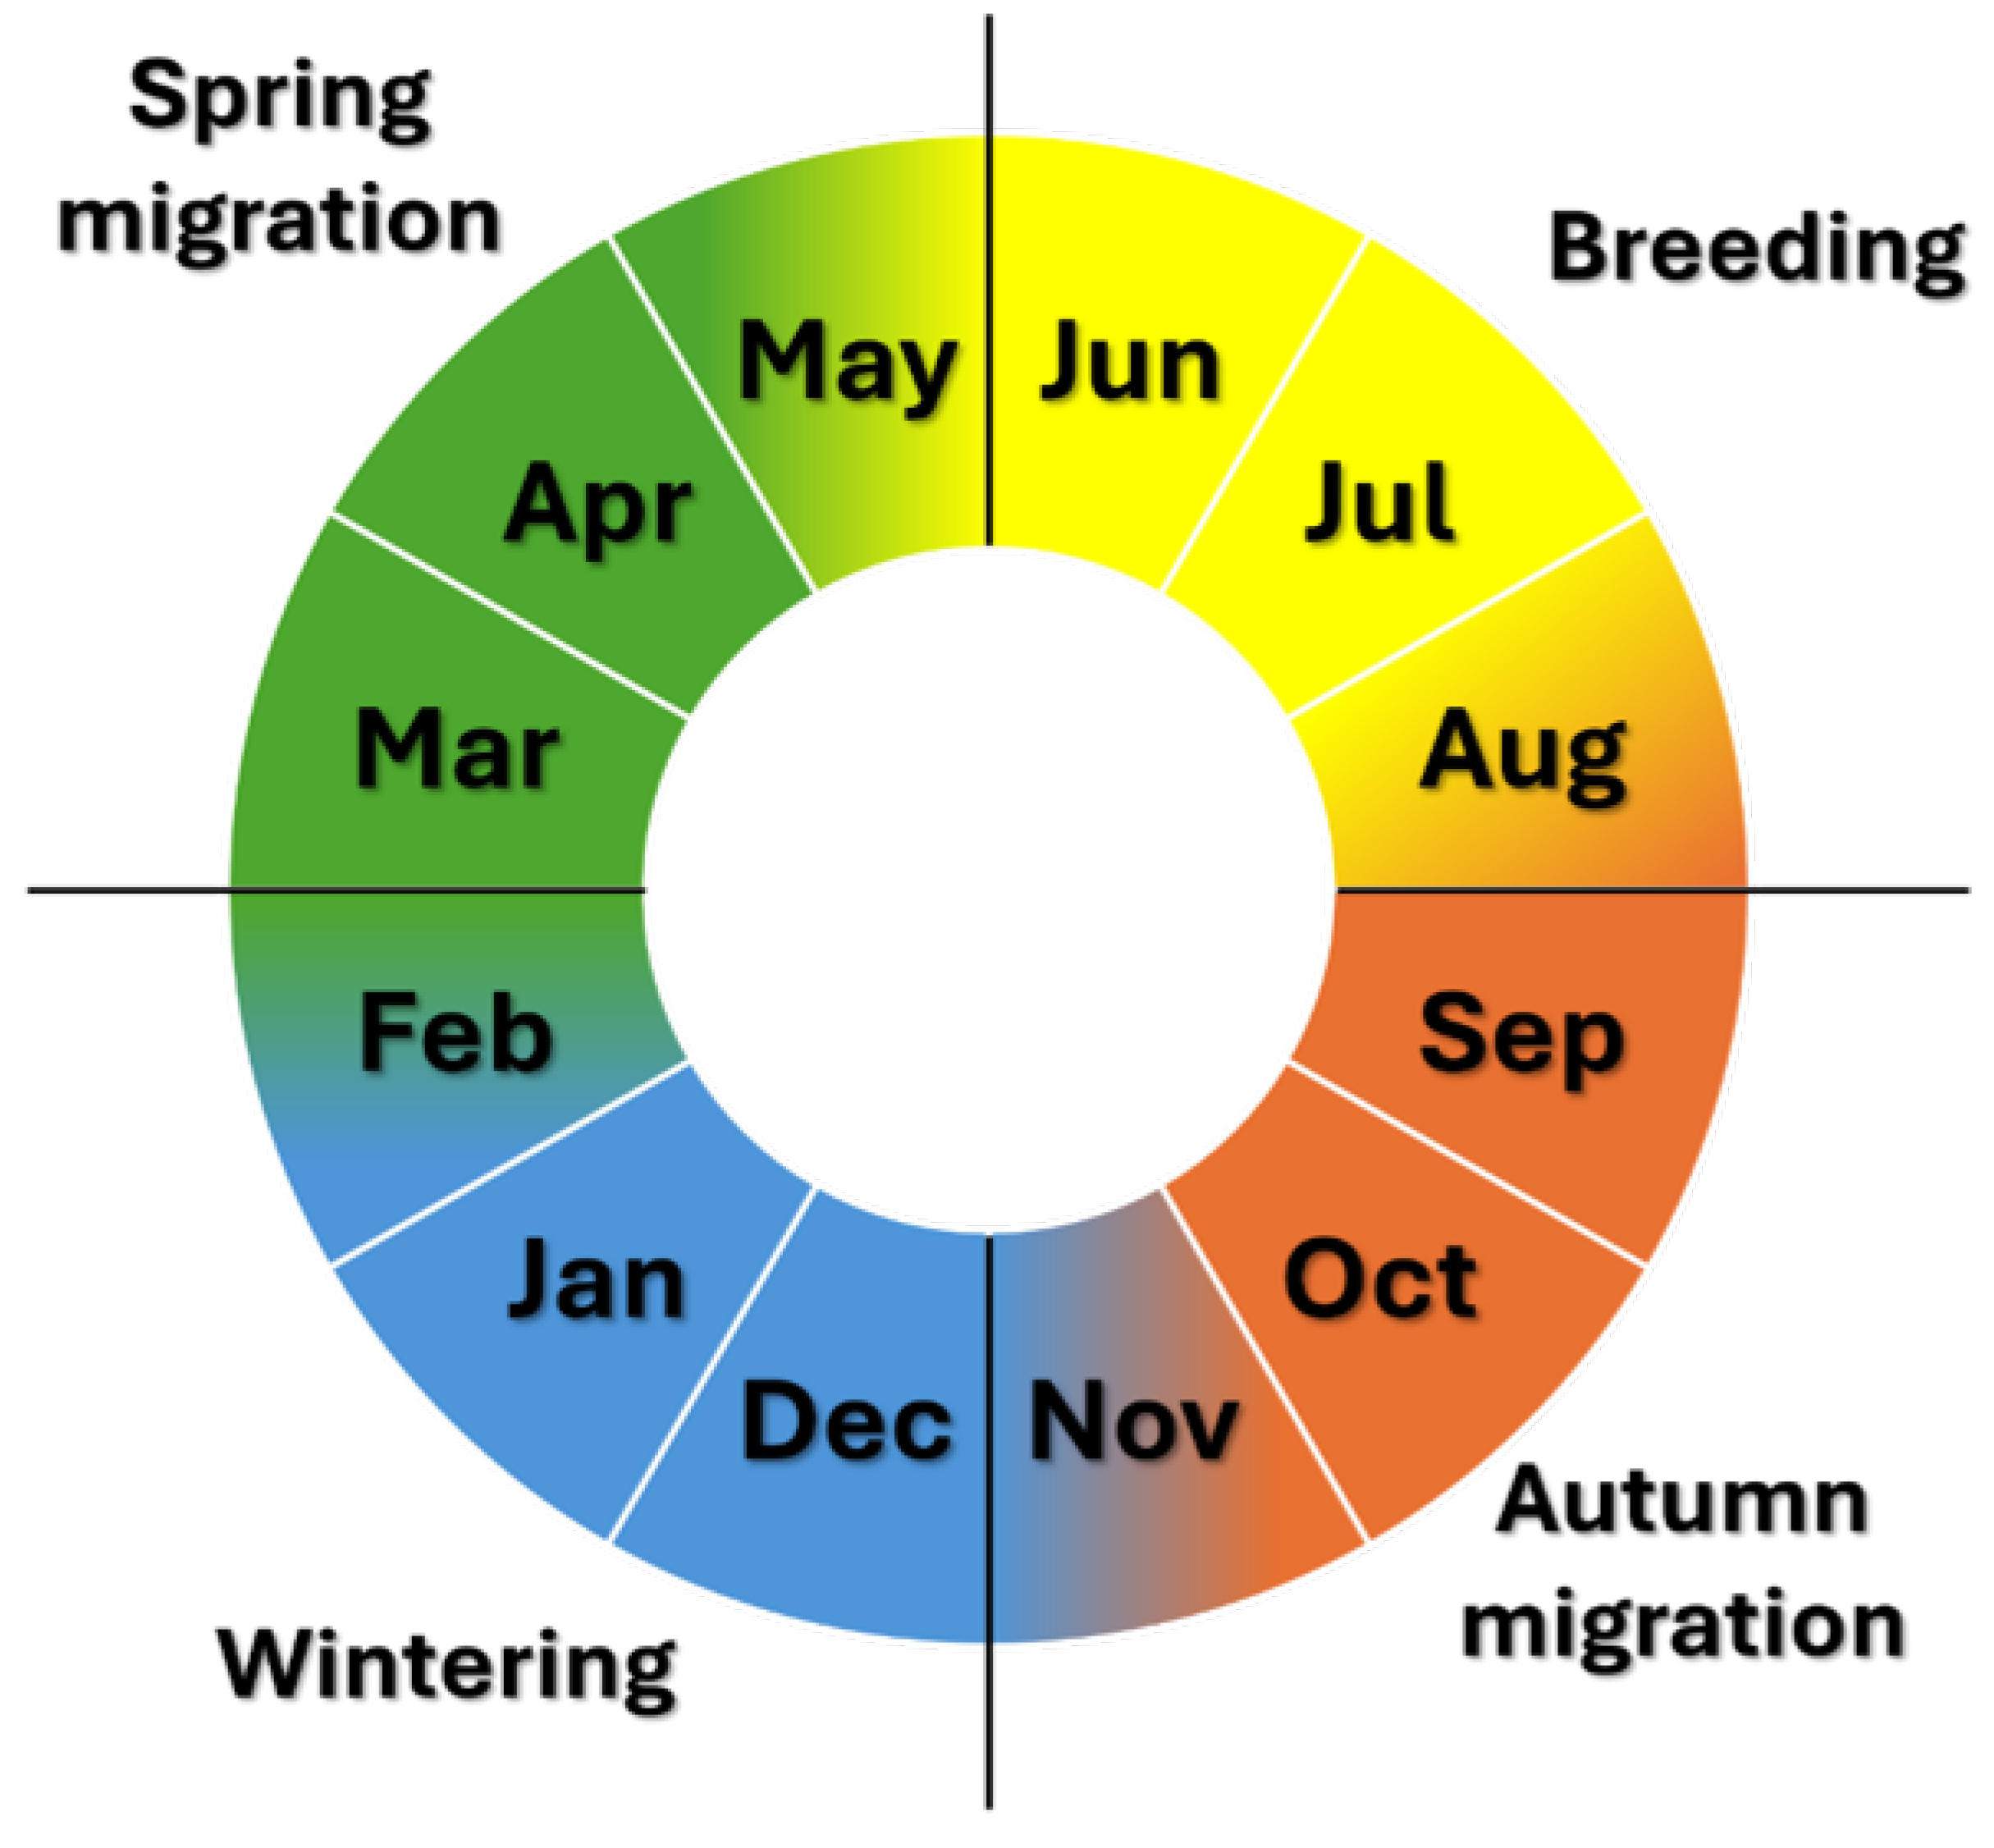
Figure 3.
Multi-year trends in the timing of the beginning (p10), median (p50), and end (p90) of spring migration for male and female Eurasian blackcaps at Bukowo-Kopań in 1982–2025. Circles represent the observed capture dates of individual birds plotted against the corresponding year. Lines show fitted linear regression trends; asterisks (*) indicate statistically significant trends. The details of the regression are in Table S3.
Figure 3.
Multi-year trends in the timing of the beginning (p10), median (p50), and end (p90) of spring migration for male and female Eurasian blackcaps at Bukowo-Kopań in 1982–2025. Circles represent the observed capture dates of individual birds plotted against the corresponding year. Lines show fitted linear regression trends; asterisks (*) indicate statistically significant trends. The details of the regression are in Table S3.
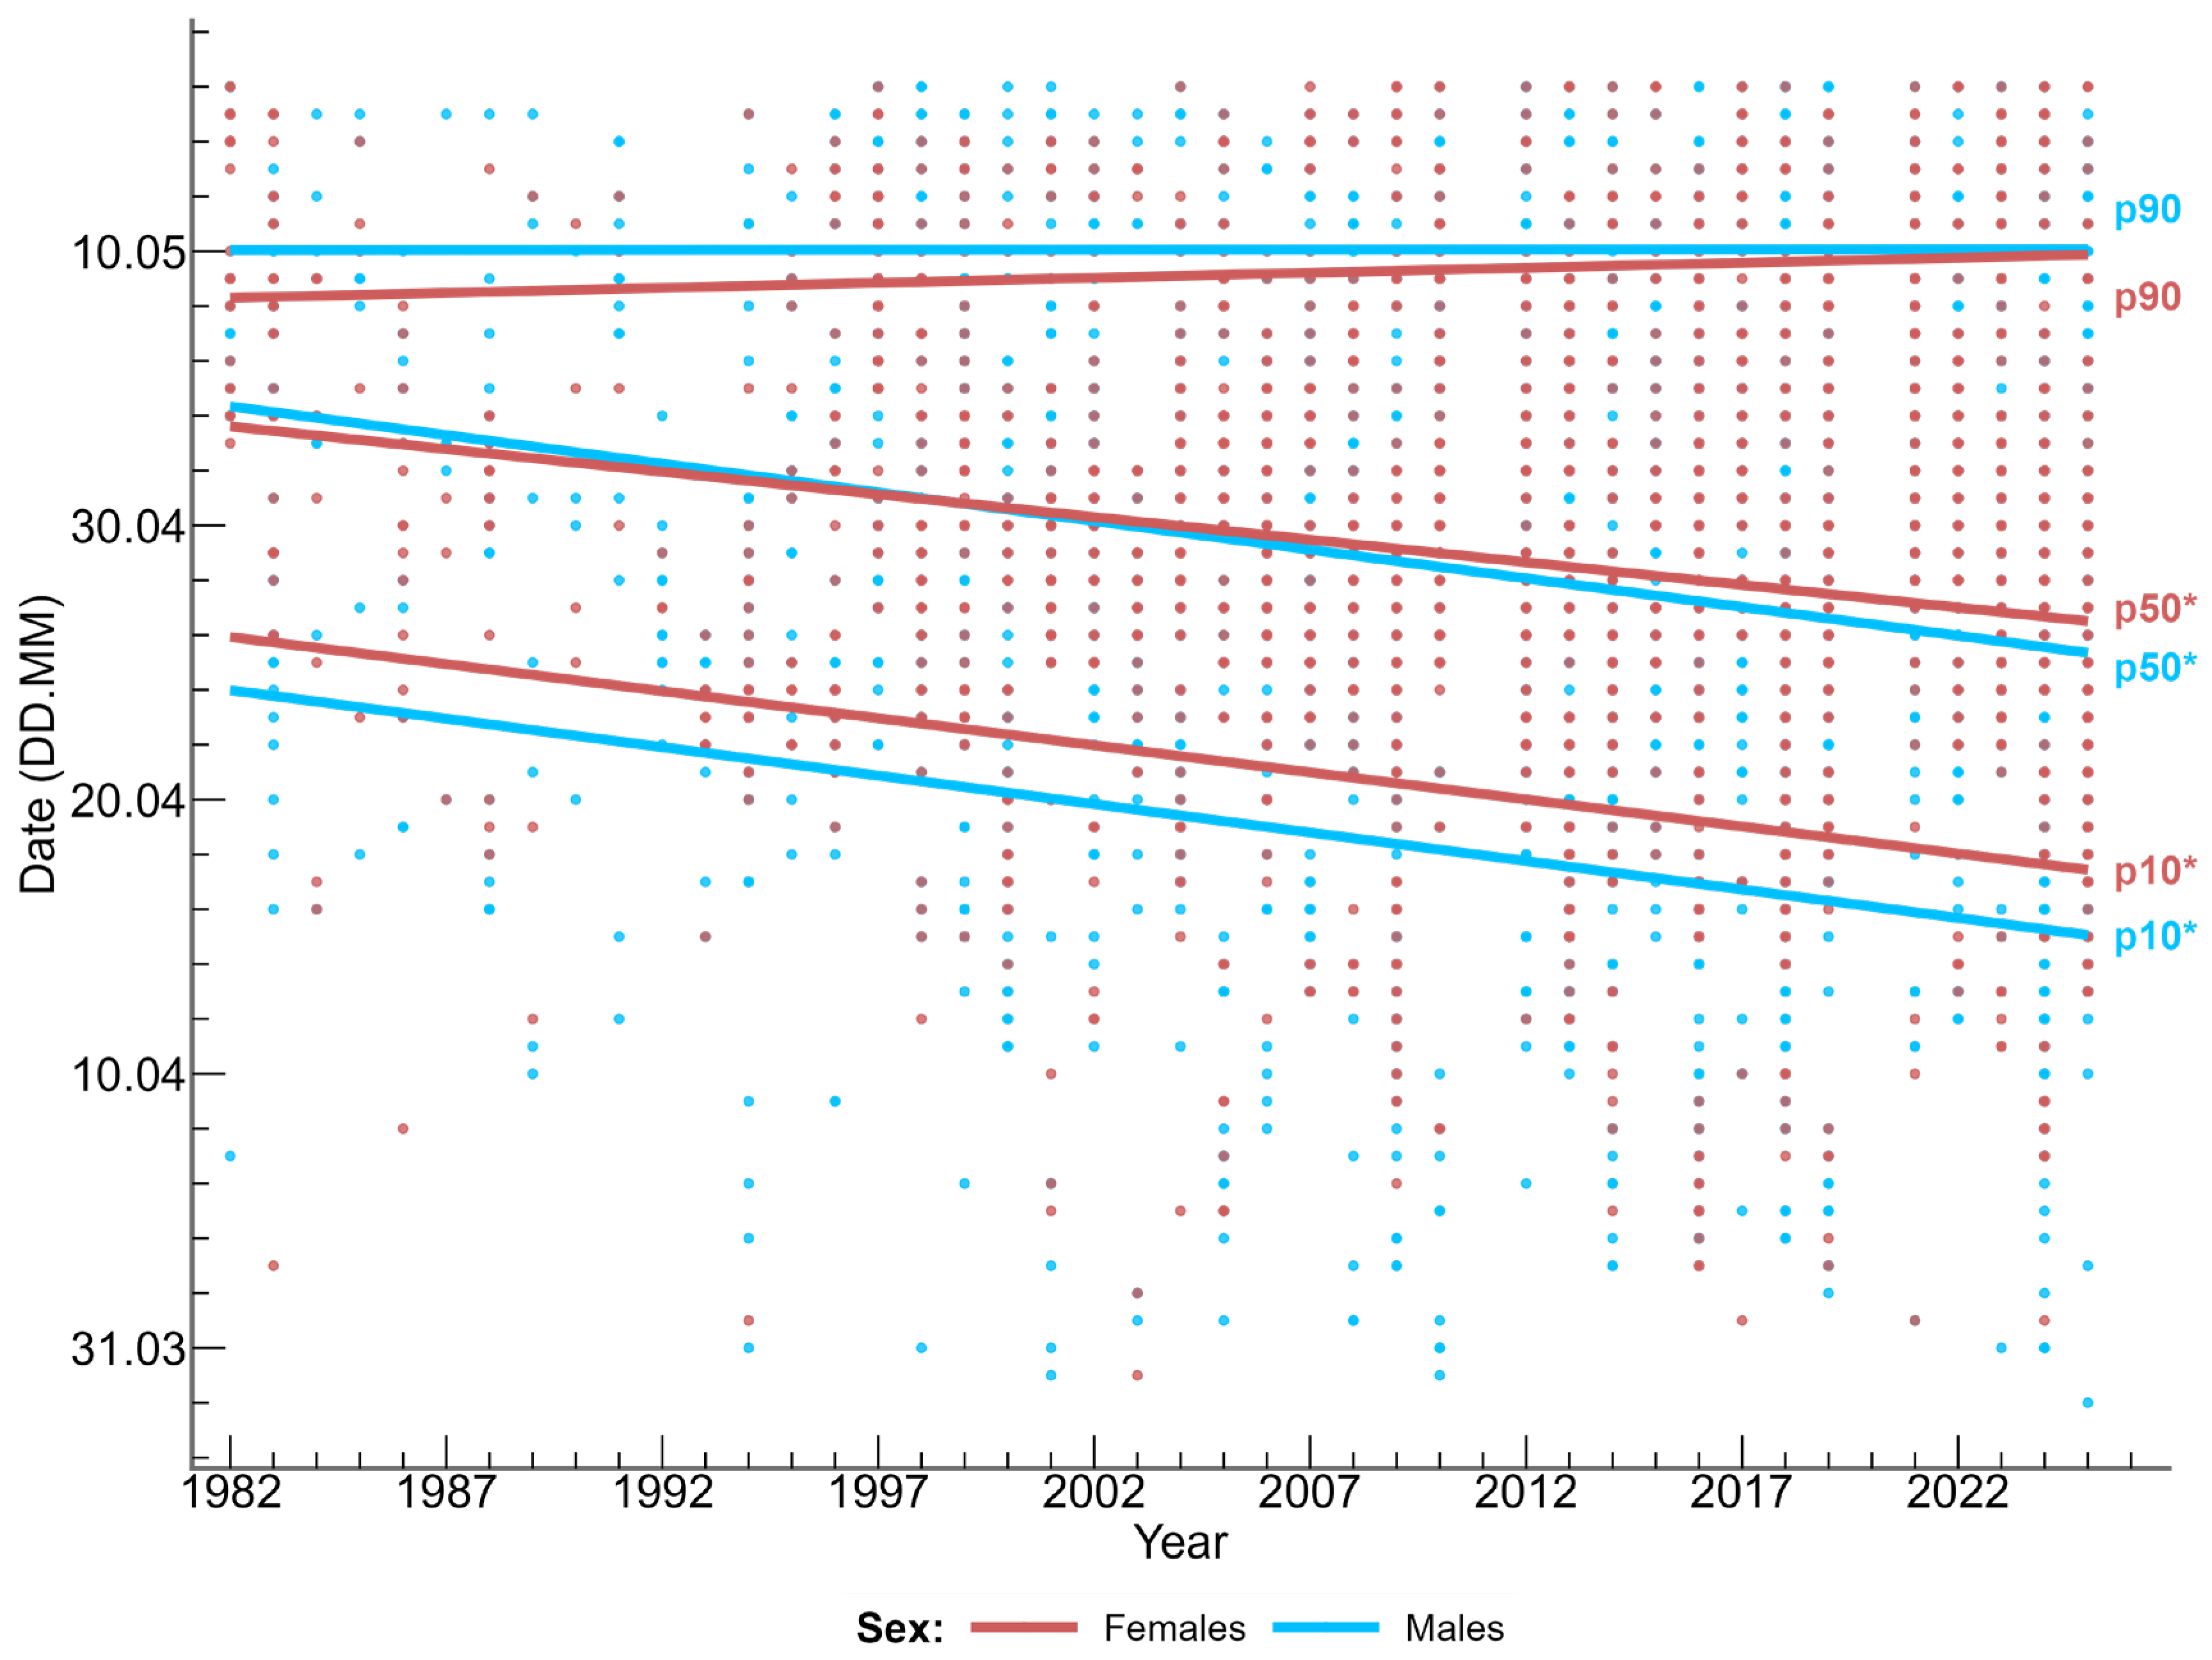
Figure 4.
Relationships between the timing of the selected percentiles (p10, p50, p90) of Eurasian blackcaps' spring migration at Bukowo-Kopań in 1982–2025 and the large-scale climate indices selected in the best “winter and spring” models (Table S13). Points represent the dates of the respective percentiles of passage plotted against the values of the climate index in a given year. Linear regression lines with 95% confidence intervals (shaded areas) show the modelled trends. (a) The effect of the winter NAO on the start (p10) and median (p50) of passage; (b) The effect of the spring SCI on the start (p10) and median (p50) of passage; (c) The effect of the spring NAO on the median (p50) of passage; (d) The effect of the winter IOD on the end (p90) of passage.
Figure 4.
Relationships between the timing of the selected percentiles (p10, p50, p90) of Eurasian blackcaps' spring migration at Bukowo-Kopań in 1982–2025 and the large-scale climate indices selected in the best “winter and spring” models (Table S13). Points represent the dates of the respective percentiles of passage plotted against the values of the climate index in a given year. Linear regression lines with 95% confidence intervals (shaded areas) show the modelled trends. (a) The effect of the winter NAO on the start (p10) and median (p50) of passage; (b) The effect of the spring SCI on the start (p10) and median (p50) of passage; (c) The effect of the spring NAO on the median (p50) of passage; (d) The effect of the winter IOD on the end (p90) of passage.
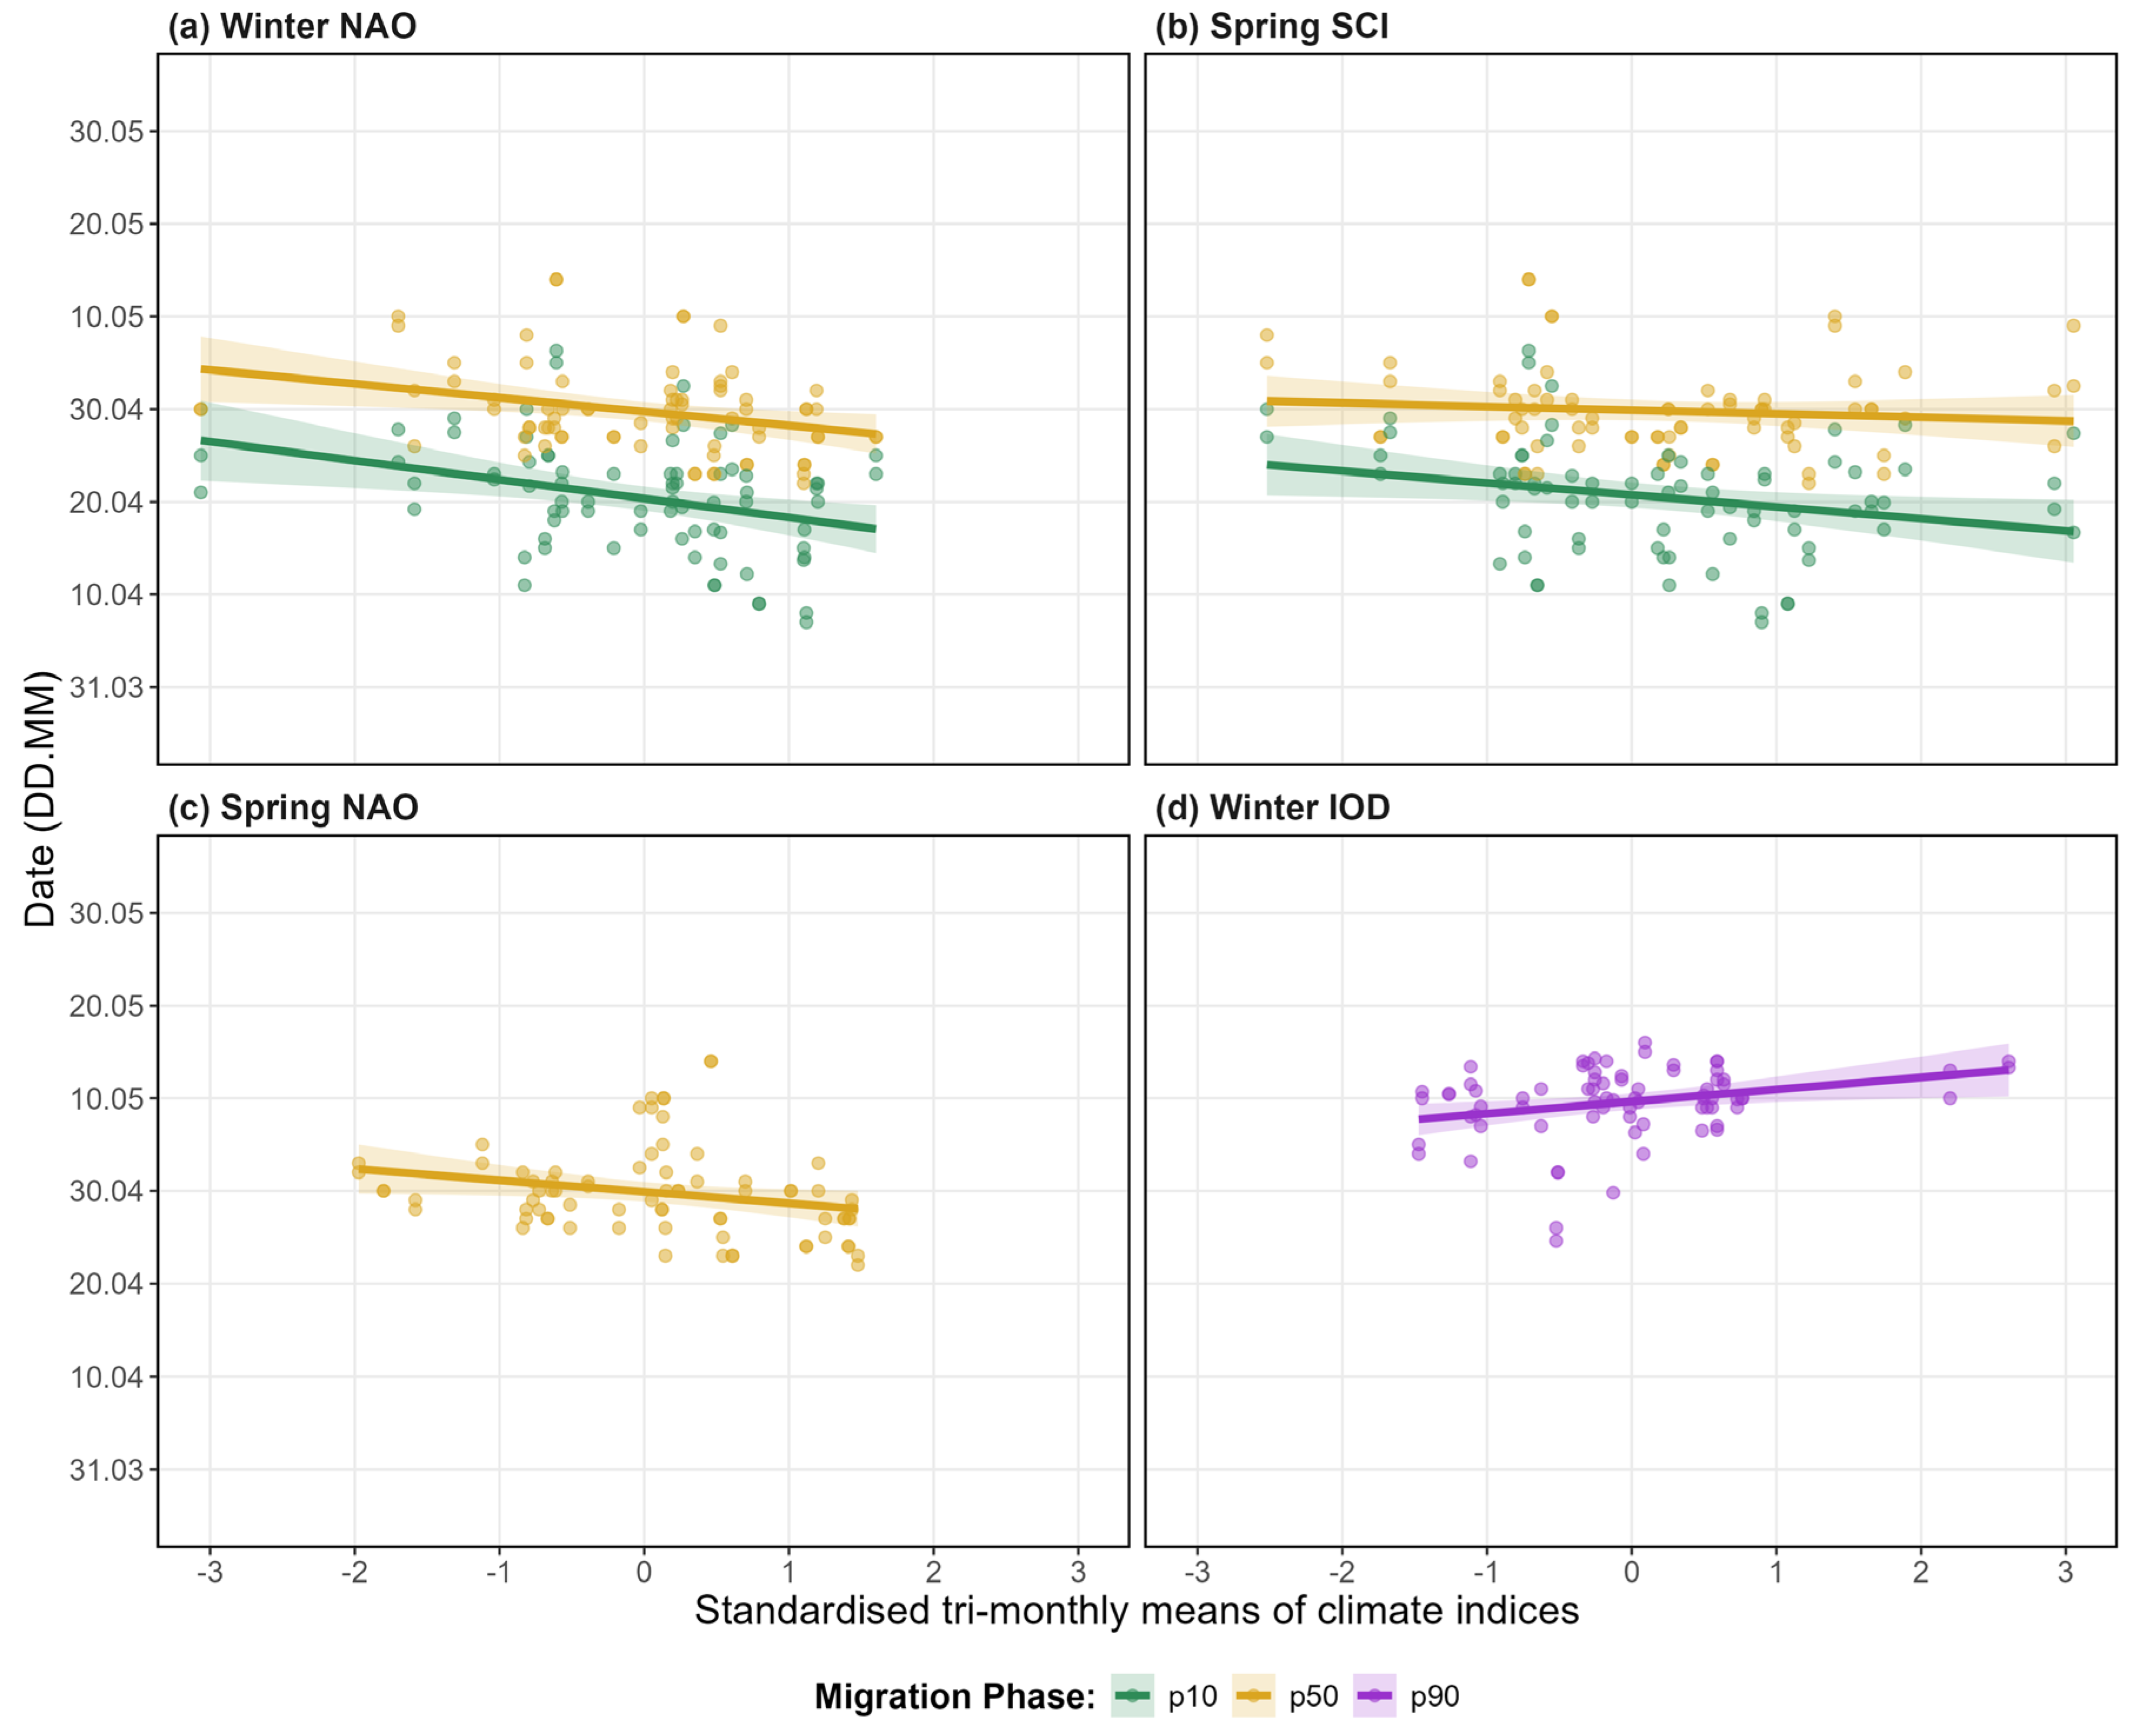

Table 1.
Large-scale climate indices averaged for winter and spring months, used as explanatory variables in modelling the timing of the Eurasian blackcaps’ spring migration at Bukowo-Kopań in 1982–2025. Climate indices for winter (WIN) were averaged for December of the previous year and January–February of the year of the analysed spring passage; for spring (SPR), they were averaged for March–May of the analysed spring migration.
Table 1.
Large-scale climate indices averaged for winter and spring months, used as explanatory variables in modelling the timing of the Eurasian blackcaps’ spring migration at Bukowo-Kopań in 1982–2025. Climate indices for winter (WIN) were averaged for December of the previous year and January–February of the year of the analysed spring passage; for spring (SPR), they were averaged for March–May of the analysed spring migration.
| Symbol | Climate index | Months | Source of data |
|---|---|---|---|
| MOI_WIN | Tri-monthly mean Mediterranean Oscillation Index | December prior year-February |
https://crudata.uea.ac.uk/cru/data/moi/ (accessed January 2026) |
| MOI_SPR | March-May | ||
| NAO_WIN | Tri-monthly mean North Atlantic Oscillation | December prior year-February |
https://www.cpc.ncep.noaa.gov/products/precip/CWlink/pna/norm.nao.monthly.b5001.current.ascii.table (accessed January 2026) |
| NAO_SPR | March-May | ||
| SCI_WIN | Tri-monthly mean Scandinavian Pattern Index | December prior year-February |
https://ftp.cpc.ncep.noaa.gov/wd52dg/data/indices/scand_index.tim (accessed January 2026) |
| SCI_SPR | March-May | ||
| IOD_WIN | Tri-monthly mean Indian Ocean Dipole | December prior year-February |
https://www.cpc.ncep.noaa.gov/products/international/ocean_monitoring/IODMI/DMI_month.html (accessed January 2026) |
| IOD_SPR | March-May |
Disclaimer/Publisher’s Note: The statements, opinions and data contained in all publications are solely those of the individual author(s) and contributor(s) and not of MDPI and/or the editor(s). MDPI and/or the editor(s) disclaim responsibility for any injury to people or property resulting from any ideas, methods, instructions or products referred to in the content. |
© 2026 by the authors. Licensee MDPI, Basel, Switzerland. This article is an open access article distributed under the terms and conditions of the Creative Commons Attribution (CC BY) license (http://creativecommons.org/licenses/by/4.0/).
Copyright: This open access article is published under a Creative Commons CC BY 4.0 license, which permit the free download, distribution, and reuse, provided that the author and preprint are cited in any reuse.