

Submitted:
04 August 2026
Posted:
05 August 2026
You are already at the latest version
Abstract
The increasing demand for SmallSats requires launch systems providing responsive, independent, and mission-specific access to orbit. This study presents the conceptual design and feasibility assessment of a Nuri-derived SmallSat-dedicated launch vehicle for delivering a 500 kg-class payload to a 500 km sun-synchronous orbit. Unlike previous planning-level studies focused on development strategies, this study quantitatively derives a vehicle configuration through staging design by incorporating geopolitical constraints on launches from the Naro Space Center, Nuri technological heritage, and emerging upper-stage engine and lightweight structural manufacturing technologies. The required velocity increment was distributed between stages, and the preliminary configuration was established through vehicle sizing. The design was evaluated using an ASTOS-based multidisciplinary design optimization framework integrating trajectory optimization, aerodynamic analysis, flight-load evaluation, and load-bearing structural mass estimation. The optimized trajectory satisfied the target-orbit and range-safety constraints and yielded a payload capability of 530 kg. The estimated dry masses of the first and second stages were 4,051 kg and 648 kg, corresponding to structural indices of 8.7% and 12.1%, respectively. These results support preliminary feasibility under the adopted modeling assumptions at the conceptual stage rather than providing detailed design verification of subsystems, while further validation is required to address structural and subsystem mass uncertainties.
Keywords:
multidisciplinary design optimization (MDO)
; SmallSat-dedicated launch vehicle
; trajectory optimization
; staging design
; space economy
1. Introduction
With the ongoing transition from government-centered space programs to the new space era, where private companies increasingly lead technological development, investment, and service creation, the global space economy has entered a phase of rapid commercial expansion. The World Economic Forum and McKinsey and Company have projected that the global space economy has the potential to grow from approximately USD 630 billion in 2023 to USD 1.8 trillion by 2035 [1]. A major driver for this growth is the commercial satellite sector, particularly the rapid increase in the number of SmallSats used for communications, Earth observation, remote sensing, Internet of Things connectivity, technology demonstrations, and national security missions. Nearly 2,800 SmallSats were launched in 2024 alone, accounting for 97% of all spacecraft launched, and 4,434 satellites were deployed into Earth’s orbit through 296 launch events in 2025 [2,3]. These trends indicate that launch services are becoming a core element of the commercial space value chain, with increasing demand in terms of not only launch volume but also launch frequency, orbit diversity, deployment accuracy, and mission-specific accessibility.
The SmallSat launch market has evolved through two representative approaches: rideshare launches using medium- and large-class launch vehicles and dedicated launches using small launch vehicles. SpaceX’s Falcon 9 has significantly expanded global launch capacity through reusable, high-cadence operations, and its Transporter Rideshare program provides low-cost launch opportunities for SmallSats [4,5]. However, rideshare missions generally provide limited control over launch schedules, target orbits, deployment sequences, mission confidentiality, and late-stage mission changes. Accordingly, dedicated SmallSat launch vehicles are necessary for missions that require direct orbit injection, rapid response, schedule control, and independent access to space. Rocket Lab’s Electron is one of the most mature examples of this class. Flight operations by Electron, Alpha, and Vega-C, together with ongoing development and, in some cases, flight testing of Spectrum, KAIROS, MIURA 5, Skyrora XL, and HANBIT-Nano, indicate that the small launch vehicle market continues to expand, although reliability, manufacturability, cost competitiveness, and operational flexibility remain key challenges [6,7,8,9,10,11,12,13,14]. Therefore, the development of a SmallSat-dedicated launch vehicle based on Nuri-derived technologies is a potential practical approach for diversifying domestic space transportation capabilities while reducing development risk through the use of accumulated propulsion, structural, manufacturing, and launch infrastructure technologies.
In South Korea, plans have been proposed to develop a SmallSat-dedicated launch vehicle based on technologies established through the Nuri development program to meet the increasing demand for SmallSats and to diversify domestic space transportation capabilities [15,16,17,18]. The target performance of the launch vehicle is defined as the capability to inject a 500 kg payload into a 500 km sun-synchronous orbit (SSO), considering the mass class and target orbits of next-generation medium-sized satellites and other domestic SmallSat missions. To secure competitiveness in the launch service market, the proposed development strategy aims to maximize the utilization of Nuri-derived structures, manufacturing technologies, engines, test facilities, and launch infrastructure. To achieve the target orbit insertion performance, previous studies have considered a high-performance upper-stage engine and structural efficiency enhancements using a common bulkhead tank configuration [18]. However, previous planning and review efforts for Nuri-derived SmallSat-dedicated launch vehicles have mainly focused on development strategies and applicable technologies, whereas the quantitative definition of vehicle specifications and configuration and the integrated feasibility assessment of the target orbit insertion performance and structural mass have not been fully addressed.
To address this gap, this study quantitatively derives the vehicle specifications and preliminary configuration of a Nuri-derived SmallSat-dedicated launch vehicle and evaluates its mission performance through a sequential design process. First, the mission requirements and design constraints were defined by considering the launch azimuth, dog-leg maneuver, and stage impact-point restrictions associated with launch operations from the Naro Space Center. Second, a staging design was performed by leveraging technologies accumulated through the Nuri development program, including the 75 tonf-class engine, manufacturing infrastructure, and structural design heritage, while considering currently investigated technologies such as a high-performance upper-stage engine and lightweight common-bulkhead tank structures. Third, the staging results were translated into a preliminary vehicle configuration by sizing the propellant tanks, fairing, interstage, aft fuselage, and overall vehicle dimensions. Finally, an ASTOS-based multidisciplinary design optimization (MDO) framework integrating trajectory optimization, aerodynamic analysis, flight-load evaluation, and load-bearing structural mass estimation was used to assess whether the resulting configuration satisfied the target orbit-insertion performance and the structural-mass assumptions adopted in the staging design.
2. Mission Requirements and Design Constraints
2.1. Geopolitical Conditions in Korea
Given the unique geopolitical environment in East Asia, the Republic of Korea has limited design freedom in the development of launch vehicles. Therefore, the constraints imposed by geopolitical and range-safety conditions must be considered from the initial design stage. In particular, with China located to the west of Korea and Japan to the east, practical launch corridors from the Naro Space Center are largely restricted to southward directions, which are suitable for injecting payloads into polar orbits, including sun-synchronous orbits (SSOs). However, because Okinawa and the Amami Islands of Japan lie along potential southward flight corridors, the launch azimuth must be selected by considering the safety of inhabited areas. Based on an analysis of the instantaneous impact point and the avoidance of inhabited islands, a launch azimuth of approximately 170° was selected. Launching at this azimuth requires a dog-leg maneuver to achieve the target SSO, resulting in an additional performance penalty that must be considered in the vehicle design.
The allowable impact locations of jettisoned launch vehicle components are also important design considerations. Japanese inhabited islands and their surrounding exclusive economic zones (EEZs) lie along potential southward flight corridors from the Naro Space Center. To avoid inhabited areas and minimize potential geopolitical concerns, the impact points of the separated first stage and payload fairing must be located in open-sea areas beyond these regions. Accordingly, a minimum ground-range distance of 1,400 km from the Naro Space Center was imposed as a design requirement for the impact point.
2.2. Determination of Delta-V Requirement
The staging design of a launch vehicle mainly involves determining the configuration of each stage of the vehicle to achieve the target performance while accounting for vehicle loss. The configuration of each stage includes the total number of stages of the launch vehicle, propulsion system performance, structural ratio, and propellant mass as variables. The SmallSat-dedicated launch vehicle designed in this study aims to reduce development cost and shorten the development schedule by adding a high-performance second stage to the first stage, based on a Nuri test launch vehicle. Accordingly, the launch vehicle was configured with two stages, and the 75-tonf kerosene-liquid oxygen engine used in Nuri was applied to the first-stage propulsion system [15].
The target performance for the staging design of a launch vehicle can be expressed in the form of velocity increments [19,20]. Because the launch vehicle must reach the altitude and orbital velocity required by the payload after the burnout of the upper stage, it must be able to attain orbital velocity when all the propellants loaded through the propulsion system are depleted. The performance of the launch vehicle can be expressed as shown in Equation (1), known as the rocket equation.
where g0 is the acceleration due to gravity, Isp is the specific impulse of the propulsion system, and mi and mf are the initial and final masses of the launch vehicle, respectively.
Most launch vehicles are launched vertically from the ground and fly toward the target altitude, and upon reaching the target altitude, they are almost parallel to the ground surface. The process of rising while overcoming Earth’s gravity and converting the velocity vector of the launch vehicle from the vertical direction to the horizontal direction is associated with losses; furthermore, the drag due to the atmosphere during the ascent process is also a loss. These are termed the gravity loss, steering loss, and drag loss, as expressed in Equations (2)–(4):
Here, tf is the total combustion time of the launch vehicle, γ is the flight path angle, T is the engine thrust, α’ is the angle between the thrust vector and velocity, m is the total mass of the launch vehicle, and D is the drag force.
When launched from the Naro Space Center, the launch azimuth of the launch vehicle is fixed at 170° owing to aforementioned geopolitical conditions. Therefore, a dog-leg maneuver is additionally required to inject the vehicle into the SSO. To perform this dog-leg maneuver, the thrust vector must also be turned in the yaw direction through the thrust vector control system of the engine. An additional loss occurs due to the sideslip angle (β’) at this time. Therefore, the steering loss expressed in Equation (3) can be rewritten as follows:
The launch vehicle target performance, expressed as Equation (1), can be written as Equation (6) to satisfy the requirements, where Equations (2), (4), and (5) are added to the orbital velocity of the payload.
Since most launch vehicles fly through a similar sequence (vertical takeoff–kick turn–gravity turn–guidance flight), the values for each loss term in Equation (6) range from approximately 1.5 to 2.5 km/s for the gravity loss, from 0.1 to 0.4 km/s for the steering loss, and from 0.1 to 0.3 km/s for the drag loss, based on flight data of launch vehicles developed so far [19,20,21,22]. As the staging design of a launch vehicle is the initial design stage, known values can be used to set the target performance. Therefore, in this study, the gravity loss was set to 2 km/s, the steering loss to 0.3 km/s (considering yaw maneuver), and the drag loss to 0.2 km/s to configure the target performance of the SmallSat-dedicated launch vehicle.
When a launch vehicle is launched at a launch azimuth of 170° and enters an SSO with an inclination of approximately 100° through a dog-leg maneuver, the resulting orbit will retrograde in the direction opposite to Earth’s rotation. In this case, the effect of the Earth’s rotation is considered a loss in terms of the launch vehicle’s performance. Therefore, a corresponding loss term should be added to ∆vreq in Equation (6). The loss term due to the retrograde orbit can be simply estimated by calculating the velocity of the launch vehicle in the direction of the velocity vector, owing to the Earth’s rotation speed at the time of orbit insertion. First, the Earth’s rotation speed at the time of the second engine cut off (SECO) of the launch vehicle can be estimated using Equation (7) [23].
Here, the latitude of SECO is 15°, which is the burnout position in Nuri’s third stage.
The direction of Nuri’s velocity vector is approximately 191° when the payload is injected into the 500 km SSO, and using this value, we can calculate the Earth’s rotational velocity component with respect to the velocity vector direction of the launch vehicle from Equation (8).
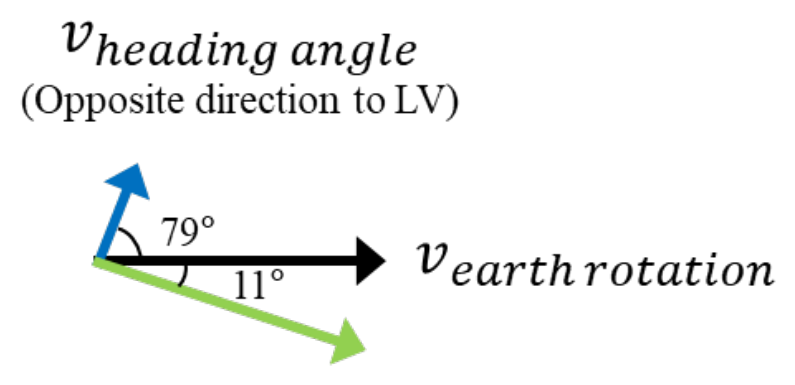
Figure 1.
Heading angle direction and Earth’s rotational velocity vector. LV: launch vehicle.
According to Equation (8), it can be considered that a velocity of approximately 85 m/s is applied in the negative (-) direction at the time of burnout in the direction of the velocity vector of the launch vehicle due to Earth’s rotational speed. From the viewpoint of the launch vehicle, this implies that the velocity must be increased to attain orbital velocity. Therefore, for SSO insertion, this value is added to the right-hand side of Equation (6), which can be finally expressed as Equation (9). Considering an additional margin of approximately 3%, including the loss of the first-stage propulsion system due to atmospheric pressure, the total ∆vreq of the launch vehicle required for insertion into a 500 km SSO is shown in Table 1.
2.3. Delta-V Distribution
The next step in the launch vehicle staging design is to allocate the determined delta-V requirements to each stage. Generally, in a two-stage configuration, if the same propellant combination and engine type are used in both the first and second stages, it is efficient to distribute the delta-V to the first and second stages at a ratio of approximately 5:5. However, if the propulsion system efficiency or structural index differs significantly, a strategy of distributing a slightly higher delta-V to the stage with higher efficiency and better structural index can also be applied. In the case of the SmallSat-dedicated launch vehicle designed in this study, the impact point of the first stage is an important constraint, which must be prioritized while distributing the delta-V. The required velocity of the launch vehicle on first-stage separation to satisfy the impact point constraint of 1,400 km or more can be derived from Nuri’s flight data. The three-stage Nuri rocket is designed such that the impact point of the first stage is at a distance of approximately 400 km; however, the fairing is designed to impact at a distance of over 1,400 km during the second-stage flight. Based on the results of Nuri’s second launch, the velocity of the launch vehicle at fairing separation is approximately 3.2 km/s [24]; therefore, if the estimated losses during the first-stage flight are added to this velocity, the delta-V required for the first stage can be calculated.
In the first-stage flight phase, maneuvering in the yaw direction is not required; therefore, the gravity, drag, and steering losses are the losses accounted for during flight, which can be calculated using Equations (2)–(4). In the case of gravity loss, which accounts for the highest proportion of the total loss, a rough estimate can be made, as in Equation (10), by referring to the cases of Nuri and other two-stage launch vehicles.
The three terms in Equation (10) represent the gravity losses during the vertical takeoff phase from 0 to 10 s, the kick-turn phase from 10 to 25 s, and the gravity-turn phase from 25 to 165 s, respectively. The 165 s duration was selected with reference to the representative first-stage flight profile of Firefly Alpha, a two-stage small launch vehicle in a comparable payload class [7]. For the preliminary staging design, the phase-dependent flight-path-angle histories, γ1(t), γ2(t), and γ3(t), were prescribed based on the Nuri flight data and a representative ascent sequence of a two-stage launch vehicle [19,24]. Numerical integration of Equation (10) using this preliminary flight-path-angle profile yielded an estimated first-stage gravity loss of approximately 1.28 km/s. This value was used only for the initial allocation of the velocity increment, whereas trajectory-dependent flight dynamics and losses were subsequently accounted for in the ASTOS-based MDO process. Since most of the drag loss occurs during the first-stage atmospheric flight phase, a drag loss of 200 m/s (Table 1) was applied. The combined steering loss and thrust loss due to atmospheric pressure were assumed to be 150 m/s. Adding these loss terms to the required velocity of 3,200 m/s for satisfying the first-stage impact-point requirement yielded a total first-stage velocity increment of approximately 4,830 m/s. The remaining 5,670 m/s was allocated to the second stage.
3. Staging Design of the Nuri-Derived SmallSat-dedicated Launch Vehicle
Staging design was performed to determine the specifications of each stage using the delta-V allocated to each stage. First, the specifications of the 75 tonf-class engine of Nuri were applied to the propulsion system performance of the first stage, and the specifications of the 3 tonf-class Metarox engine under development were applied for the propulsion system performance of the second stage [25]. The amount of propellant that satisfies the delta-V requirement allocated to each stage can be calculated using the specific impulse of the propulsion system and the structural index of each stage. The structural index is the ratio of the dry mass to the wet mass of each stage and is expressed as in Equation (11).
Using Equation (11), we can re-write the dry mass of each stage as a function of the structural index and propellant mass, as in Equation (12).
Rewriting Equation (1) for the first and second stages yields Equations (13) and (14), respectively:
In Equation (14), the mass of the fairing can be excluded because it is jettisoned at the beginning of the second-stage flight phase. Using Equation (12), we can also express Equation (14) as a function of the structural index and propellant mass, as in Equation (15).
Since mpayload = 500 kg, Isp,2 = 360 s, and ∆vstage,2 = 5,670 m/s, when these values are substituted into Equation (15), the propellant and dry masses of the second stage according to the structural index can be plotted as shown in Figure 2.
The structural index depends on the design and manufacturing technology of the fuselage, and whether manufacturing facilities are secured. These factors are directly related to the development cost and period. Since the SmallSat-dedicated launch vehicle in this study is based on the premise of utilizing Nuri’s technology and infrastructure to minimize development costs and time, values at the structural index level of Nuri were first considered during the staging design phase. However, considering that the second-stage structural index of SmallSat-dedicated launch vehicles of the same class is approximately 10%, it was deemed necessary to improve the structural index compared with Nuri through design improvements and the application of common bulkhead tanks to secure competitiveness performance. Table 2 presents the calculation results of the total mass, propellant mass, and dry mass for the second stage when its structural index is improved by 0.5% relative to Nuri (14%).
Similar to the second stage, Equation (13) for the first stage can be expressed as in Equation (16):
By substituting mpayload = 500 kg, m_fairing = 300 kg, Isp,1 = 299.8 s, ∆vstage,1 = 4,830 m/s, and mstage,2 = 5,377 kg, we can obtain the required propellant and dry masses for the first stage, as shown in Figure 3.
Although the structural index for Nuri’s first stage is 10.1%, considering that the structural index for the first stage of comparable SmallSat launch vehicles is between 6% and 9%, it was determined that, similar to the second stage, the structural index for the first stage requires enhancements relative to Nuri’s technology. Table 3 lists the total, propellant, and dry masses of the first stage when the structural index for the first stage is improved in increments of 0.5%, starting from 10%.
For a launch vehicle to have reasonable take-off performance, the ratio of the ground thrust to takeoff weight (T/W) of the first-stage engine must be in the range of 1.3–1.5 [19]. Because this study is based on the premise that the Nuri rocket engine is used as the first-stage engine, the maximum possible takeoff weight is 53,240 kg for the T/W value to be 1.3 or higher, based on the ground thrust value of the first-stage engine of this rocket. Accordingly, combinations of second-stage structural ratios satisfying a T/W of 1.3 or higher among the first-stage structural ratios listed in Table 3 were derived, as shown in Table 4. Here, a payload mass of 500 kg and a fairing mass of 300 kg were added to the takeoff weight.
For first-stage structural indices of 9% and 9.5%, the take-off mass exceeded 53,240 kg, even at the minimum second-stage structural index of 11.5% (Table 2), whereas for a first-stage structural index of 8.5%, values below the standard take-off mass were obtained under all second-stage structural indices. The results in Table 4 indicate that, for the development of a SmallSat-dedicated launch vehicle based on Nuri’s technology, the first-stage structural index must be designed and manufactured at the 8.5% level. Based on this value, the first-stage structural index was set to 8.6%, with the dry mass rounded up to 4,000 kg. The second-stage structural index was set to 12.6%, with the propellant mass rounded up to 4,700 kg based on a structural ratio of 12.5% by applying a performance margin. Table 5 presents the staging design results for the SmallSat-dedicated launch vehicle.
4. Preliminary Configuration
Based on the staging results summarized in Table 5, a preliminary configuration was defined to provide the baseline geometry for the aerodynamic analysis and MDO-based structural mass estimation. The required oxidizer and fuel volumes were estimated from the propellant masses at each stage using the mixture ratio and propellant density. The residual propellant was incorporated by applying 2% of the total propellant mass for the first stage and 3% for the second stage, based on Nuri-derived design and operational considerations. Additional tank volume margins of 6% and 10% were applied to the first and second stages, respectively, to account for the ullage volume, manufacturing tolerance, and preliminary design uncertainty.
The fuselage diameter was selected by considering compatibility with the Nuri-derived manufacturing infrastructure. The 2.6 m tank diameter of Nuri’s second-stage and the 2.0 m tank diameter of Nuri’s third-stage fuel tank were considered candidate diameters. Although a diameter of 2.6 m offers direct design heritage from Nuri, it was considered excessive for the required upper-stage propellant volume and unsuitable for implementing a compact common bulkhead configuration. Therefore, a 2.0 m fuselage diameter was selected for both stages. The tanks were modeled using ellipsoidal domes with an aspect ratio of 2, following Nuri’s tank geometry heritage. Table 6 presents the tank dimensions.
The payload fairing was designed as a hammerhead-type configuration to accommodate a 500 kg-class satellite envelope of approximately 1.5 m × 1.5 m × 3.0 m. An ogive nose was used for the fairing. The interstage length was determined by considering the nozzle length of the second-stage engine, whereas the forward and aft skirt lengths were defined based on the tank dome geometry and component arrangement. For the first-stage aft fuselage, a 2.6 m-diameter configuration derived from Nuri’s second-stage aft fuselage was adopted, because partial protrusion of the turbopump occurred when the 75 tonf-class engine was installed within the 2.0 m-diameter fuselage. The 2.0 m fuel tank and 2.6 m aft fuselage were connected using a conical transition section.
The resulting launch vehicle had an overall length of 27.87 m and an approximate slenderness ratio of 14. This slenderness value lies within the typical range of slender launch vehicles and indicates that the proposed configuration is reasonable for the conceptual design and MDO analysis. However, detailed controllability, aeroelastic stability, and structural interface analyses should be conducted in subsequent design phases. Figure 5 shows the layout of the launch vehicle configuration, and Table 7 shows the results of the station indicating the length of each component of the launch vehicle.
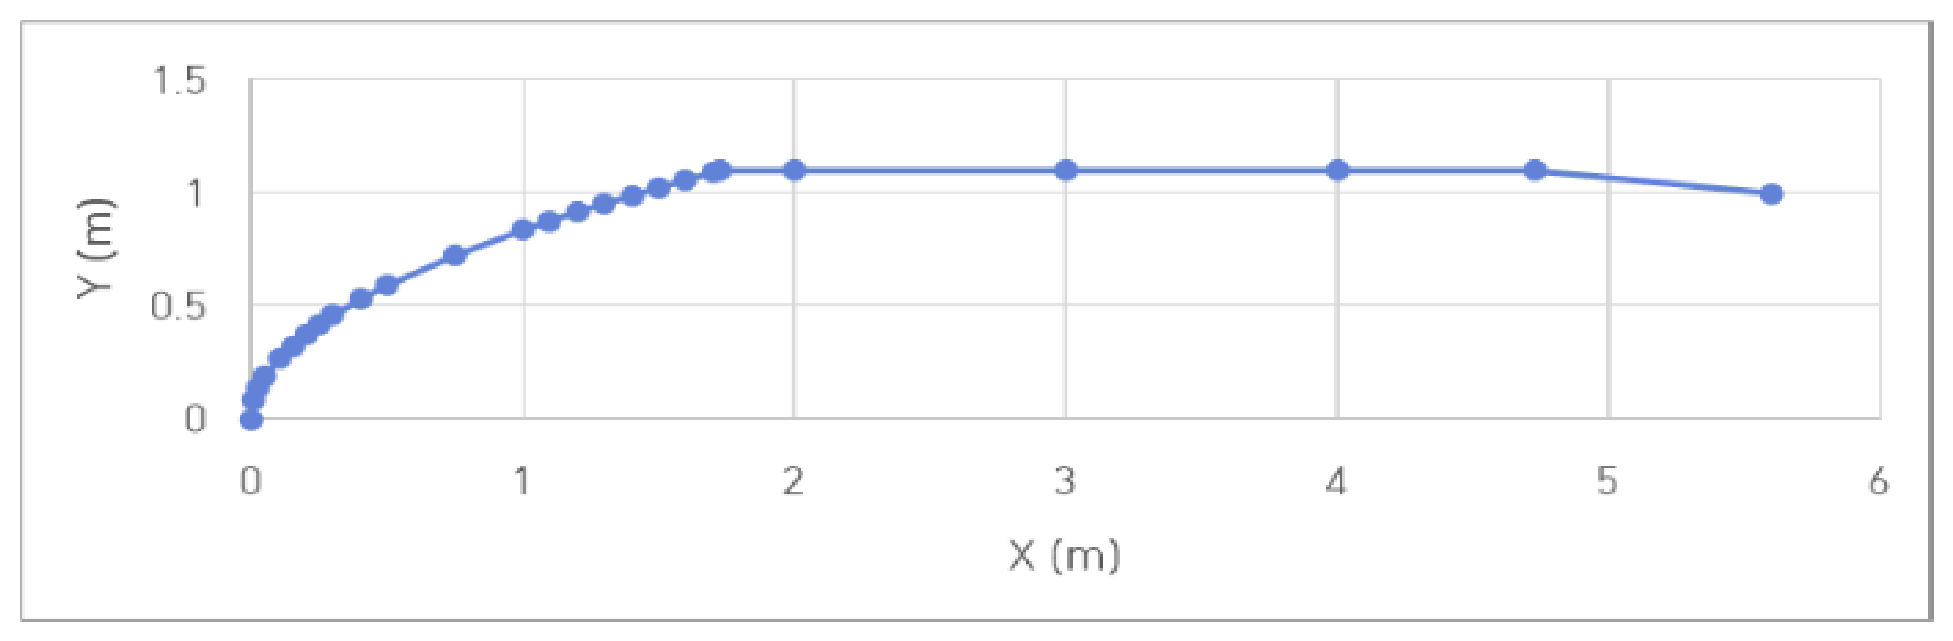
Figure 4.
Designed fairing shape.
5. MDO-based Trajectory Optimization and Structural Mass Estimation
In the launch vehicle design process, various design domains, such as trajectory, aerodynamics, launch vehicle mass, launch vehicle shape, propulsion system performance, and load analysis, mutually affect each other, and multiple iteration processes are required to design a launch vehicle that satisfies the target performance and constraints. The process of combining these domains to derive an optimized design that satisfies requirements and constraints is called the MDO. If this function is utilized during the initial design process of a launch vehicle to perform conceptual design, the feasibility of the design can be assessed rapidly during the early stages of development.
ASTOS, developed by Astos Solutions GmbH, is a graphical environment for simulation and optimization (GESOP)-based software tool for the analysis and optimization of space systems with support for trajectory optimization and MDO in launch vehicle designs [26]. In this study, by utilizing ASTOS’s MDO feature while maintaining the performance of the already-determined propulsion system and the shape of the launch vehicle, we performed the initial conceptual design of the launch vehicle. The design was optimized to satisfy the target performance, constraints, and safety factors. This analysis examined whether a first-stage structural index of 8.6% could be maintained and provided a basis for assessing the launch vehicle at the conceptual design level. Figure 6 shows a schematic of the MDO process in ASTOS [27].
5.1. Vehicle Modeling
The first step of the MDO process involves creating a launch vehicle model in ASTOS using the configuration defined in the preceding sections, including the staging design and station data, together with MERs for the load-bearing structural masses, estimates of the nonload-bearing masses, and wind conditions. In the MDO process, the load-bearing structure mass is estimated using the MER. ASTOS provides the function to generate the MER by pre-calculating the mass of each load-bearing structure based on the shape, material, stiffening type, size, safety factors, and loads using the Optimal Design Investigation Mass Estimation Regression (ODINMER) tool developed by MT Aerospace [28]. The shape information (common bulkhead tank) and size information, such as the diameter and cylinder length, were entered using the results shown in Figure 5 and Table 7. The safety factors required to generate the MER included four safety factors for the yield/ultimate strength and local/global buckling, as well as a mass correction factor. The yield/ultimate strength safety factors were determined to be 1.1 and 1.25, respectively, based on ECSS-E-ST-32-10C, while the safety factors for buckling were determined to be 1.5 and 1.31 based on values from Nuri’s development process [29]. The mass correction factor reflected errors in the manufacturing process and was inputted as 1.03 based on the standard value presented in the manual.
In the case of the propellant tank, which is among the load-bearing structures, the basic technology for developing a common bulkhead propellant tank with an orthogrid reinforcement type using an aluminum-lithium alloy (AL2195) is currently underway in Korea. To apply this technology to the development of SmallSat-dedicated launch vehicles, AL2195 was selected as the tank material, and orthogrid was selected as the structural reinforcement type [30]. For the forward and aft skirts, the same material (AL2024) and reinforcement type (orthogrid) applied to Nuri were adopted to maximize the use of Nuri’s technology. Following the same concept, we applied the fairing, interstage, and engine support frames using the same material and reinforcement type as those used in Nuri. Table 8 shows the material and reinforcement type for each load-bearing component. MERs for the load-bearing components were generated using the ODINMER tool, based on the vehicle geometry information and values listed in Table 7 and Figure 5.
The nonload-bearing mass of a launch vehicle refers to the mass of all structures other than the load-bearing structures, such as the engine, propellant piping, valves, avionics, high-pressure gas tanks, and reaction control system (RCS). Generally, in the initial design stage of a launch vehicle, the design is carried out through the estimation of the approximate value by referring to the data of existing launch vehicles, and the exact weight is determined through the preliminary design and detailed design stages. In this study, the nonload-bearing masses, including the engine mass, were estimated by applying the concept of component sharing based on the design results of Nuri. Table 9 lists the estimated load-bearing and nonload-bearing masses at each stage.
5.2. Calculation of Aerodynamic Coefficients
Using the designed launch vehicle shape information, we calculated the aerodynamic coefficient values applied during the ascending flight phase using DrNUM, which is a GPU-based computational fluid dynamics (CFD) program developed by enGits GmbH [31]. DrNUM is linked to ASTOS; it provides a function for reading the shape information of the launch vehicle on the ASTOS GUI and directly calculates the aerodynamic coefficient. This facilitates the calculation of aerodynamic coefficients during the launch vehicle design process using ASTOS and the application of the results to the design.
5.3. Initial Process
The initial process of the MDO involves the generation of the initial trajectory of the launch vehicle and estimation of the initial mass of the load-bearing structure by calculating the loads applied to the body during ground operations and atmospheric flight. The initial trajectory was designed in the order of takeoff–kick turn–gravity turn–guidance flight phases according to the sequence of a typical two-stage launch vehicle, and an L-coordinate system was used in the trajectory design [19]. The time and pitch angle change information for the take-off and kick-turn phases in the initial trajectory were obtained by referring to Nuri’s flight data [24]. The duration for the gravity turn and subsequent phases was set by referring to the burn times of each stage engine, listed in Table 5, and the pitch and yaw angle change information was set such that at the end of the second-stage engine burn, the altitude was 500 km, the flight path angle was 0°, and the speed was 7.62 km/s. The upper wind conditions above the Naro Space Center were inputted to reflect the load due to the wind conditions during flight. After the initial trajectory was designed, the load applied to the load-bearing structure during flight in the initial trajectory was calculated using the load analysis function supported by ASTOS. The mass of the load-bearing structure was estimated using the MER based on the load value.
As the mass of the launch vehicle changed, the initial trajectory was updated to regenerate a trajectory that met the target performance. Because the flight load also changed owing to the trajectory variation, a load analysis was performed again to update the mass of the launch vehicle. This process was repeated one more time to determine the reference trajectory and launch vehicle mass for optimization. Figure 11 shows the shape of the launch vehicle in the ASTOS platform generated through the initial process. The sequence of the generated reference trajectory and the input maneuver inform.tion for each phase are described in Table 10 below.
5.4. Design Optimization Results
The optimization process in ASTOS’s MDO can be summarized as the process of finding design parameters that satisfy the constraints using an optimization solver based on the initial trajectory and vehicle mass information generated through the initial process. This process was performed based on the GESOP and is represented conceptually in Figure 12 [32].
The optimization method used was CAMTOS supported by ASTOS [33], and WORHP was used as the optimization solver [34]. With the velocity-increment distribution, propellant masses, vehicle geometry, aerodynamic database, propulsion performance, and nonload-bearing masses fixed from the preceding design steps, the MDO problem was formulated as a coupled trajectory-optimization and structural-mass update problem rather than a full vehicle-sizing optimization problem. During the iterative MDO process, the flight loads were recalculated for the updated ascent trajectory and used with the ODINMER-generated MER tables to update the masses of the load-bearing components. Accordingly, the design variables were limited to the payload mass, key flight event times, and pitch and yaw guidance parameters, whereas the objective function was defined to maximize the payload mass delivered to the target orbit. Table 10 presents the design variables used in the trajectory optimization.
Optimization was performed under the mission, trajectory, thermal, and range-safety constraints listed in Table 11. Constraints 3 and 4 were imposed by the launch site and geopolitical conditions discussed in Section 2.1, whereas Constraint 6 defined the end of the gravity-turn phase based on a low dynamic pressure threshold of 2 kPa [35]. Constraint 7 was applied to ensure that fairing jettison occurred only after the heat flux density decreased below the allowable limit of 1.135 kW/m² [7].
Figure 13 shows the optimized trajectory of the SmallSat-dedicated launch vehicle; Figure 14, Figure 15, Figure 16, Figure 17, Figure 18, Figure 19 and Figure 20 show the plots of altitude, velocity, pitch and yaw angles, dynamic pressure and angle of attack, Delta-V, and vehicle mass versus time, respectively. Table 12 lists the optimized flight sequences of the launch vehicle and key values for each event. Figure 21 shows the calculated bending moment and axial force applied to the load-bearing structures at the launch pad before liftoff, at maximum dynamic pressure (MaxQ), and at main engine cutoff (MECO). Table 13 lists the final dry masses of the launch vehicle calculated during the optimization process.
The optimized trajectory satisfied the target orbit insertion condition and the imposed trajectory, thermal, and range-safety constraints. The final payload capability was estimated to be 530 kg for a 500 km SSO mission. The corresponding dry masses of the first and second stages were estimated to be 4,051 kg and 648 kg, respectively, as summarized in Table 13. The implications of these results for the feasibility of the proposed Nuri-derived SmallSat-dedicated launch vehicle are discussed in Section 6.
6. Discussion
The main contribution of this study is the translation of a planning-level concept for a Nuri-derived SmallSat-dedicated launch vehicle into a quantitative vehicle configuration through staging design and preliminary configuration sizing. The design was established by jointly considering the geopolitical constraints associated with launch operations from the Naro Space Center, the technologies accumulated through the Nuri development program, and emerging technologies such as a high-performance upper-stage engine and lightweight common-bulkhead tank structures. The staging design quantified the propulsion performance, velocity-increment distribution, stage masses, and structural indices, while the configuration sizing established the geometric baseline for aerodynamic analysis and MDO-based feasibility assessment.
The optimized trajectory satisfied the target 500 km SSO insertion condition and the imposed trajectory, thermal, and range-safety constraints. In particular, the first-stage impact point was located approximately 1,441 km from the launch site, exceeding the required minimum distance of 1,400 km. As shown in Figure 19, the cumulative ΔV values at first- and second-stage burnout were 4,750 and 10,344 m/s, respectively, which were 80 m/s (1.7%) and 156 m/s (1.5%) lower than the corresponding staging-design estimates of 4,830 and 10,500 m/s. This close agreement, together with satisfaction of the impact-point and final-orbit constraints, indicates that the preliminary ΔV distribution was reasonably consistent with the optimized trajectory and included a small degree of conservatism.
The optimized payload capability was estimated to be 530 kg, approximately 6% higher than the target payload mass of 500 kg. The first-stage dry mass increased slightly from the staging-design value of 4,000 kg to 4,051 kg, whereas the second-stage dry mass decreased from 677 kg to 648 kg. The corresponding structural indices were 8.7% and 12.1%, respectively, compared with the initial values of 8.6% and 12.6%.

Table 14.
Comparison between staging design assumptions and MDO results.
| Parameter | Staging design | MDO result | Difference |
|---|---|---|---|
| Payload mass | 500 kg | 530 kg | +6.0% |
| First-stage dry mass | 4,000 kg | 4,051 kg | +1.3% |
| Second-stage dry mass | 677 kg | 648 kg | −4.3% |
| First-stage structural index | 8.6% | 8.7% | +0.1% pp |
| Second-stage structural index | 12.6% | 12.1% | −0.5% pp |
| Total dry mass, including fairing | 4,977 kg | 4,999 kg | +0.4% |
The close agreement between the staging assumptions and MDO results indicates internal consistency within the initial design approach. In particular, the required first-stage structural index was maintained after the load-bearing structural masses were updated using trajectory-dependent flight loads. This suggests that the proposed combination of Nuri-derived propulsion and manufacturing heritage with emerging upper-stage and lightweight structural technologies may be feasible at the conceptual design level under the adopted modeling and mass-estimation assumptions.
However, the results represent an initial feasibility assessment rather than detailed design verification. The load-bearing masses were estimated using regression models generated by ODINMER, while the nonload-bearing masses were based on preliminary assumptions and Nuri-derived component estimates. Further studies should therefore incorporate detailed structural and propulsion system design, integrated guidance and control analysis, aeroelastic stability, manufacturability, reliability, and cost and schedule assessment.
7. Conclusions
In this study, a Nuri-derived SmallSat-dedicated launch vehicle was conceptually designed and evaluated for delivering a 500 kg-class payload to a 500 km SSO. The delta-V requirement and its stage-wise distribution were determined by considering the launch azimuth, dog-leg maneuver, retrograde SSO insertion, and first-stage impact-point constraint. Based on the staging results, the preliminary vehicle configuration was sized, including the propellant tanks, fairing, interstage, aft fuselage, and overall vehicle length. The proposed configuration was then evaluated using an ASTOS-based MDO framework that coupled trajectory optimization, aerodynamic analysis, flight-load evaluation, and load-bearing structural mass estimation.
Within the adopted numerical framework, the optimized solution satisfied the target 500 km SSO insertion condition and the imposed trajectory, thermal, and range-safety constraints, including the first-stage impact-point requirement, and yielded a predicted payload capability of 530 kg. The close agreement between the staging-design assumptions and MDO results in terms of the ΔV distribution and structural-mass estimates indicates internal consistency within the proposed design approach. These results support the preliminary conceptual feasibility of the proposed configuration under the adopted modeling and mass-estimation assumptions; however, they do not constitute detailed design verification.
Future work should include detailed structural design, propulsion system development, guidance and control analysis, aeroelastic stability assessment, manufacturability evaluation, reliability assessment, and cost and schedule analysis.
Author Contributions
Conceptualization, D.S. and H.K.; methodology, D.S.; software, D.S. and H.K.; validation, D.S. and H.K.; investigation, D.S. and H.K.; writing—original draft preparation, D.S.; writing—review and editing. All authors have read and agreed to the published version of the manuscript.
Funding
This research was supported by Changwon National University in 2025~2026 and by Korea Aerospace Research Institute (Project No. FR26E00).
Data Availability Statement
All data used during the study appear in the submitted article.
Conflicts of Interest
The authors declare no conflicts of interest.
Abbreviations
The following abbreviations are used in this manuscript:
| SSO | Sun-synchronous orbit |
| MDO | Multidisciplinary design optimization |
| EEZ | Exclusive economic zone |
| SECO | Second engine cutoff |
| ASTOS | Analysis, Simulation and Trajectory Optimization Software for Space Applications |
| GESOP | Graphical Environment for Simulation and Optimization |
| ODINMER | Optimal Design Investigation Mass Estimation Regression |
| MER | Mass estimation regression |
| MECO | Main engine cutoff |
| CFRP | Carbon-fiber-reinforced polymer |
| MaxQ | Maximum dynamic pressure |
References
- World Economic Forum; McKinsey & Company. Space: The $1.8 Trillion Opportunity for Global Economic Growth; World Economic Forum: Geneva, Switzerland, 2024; Available online: https://www.weforum.org/publications/space-the-1-8-trillion-opportunity-for-global-economic-growth/ (accessed on 23 July 2026).
- Satellite Industry Association. Affordability and Productivity Drive Historic Satellite Industry Growth: Satellite Industry Association Releases the 29th Annual State of the Satellite Industry Report. 2026. Available online: https://sia.org/affordability-productivity-drive-historic-satellite-industry-growth-satellite-industry-association-releases-29th-annual-state-of-the-satellite-industry-report/ (accessed on 23 July 2026).
- BryceTech. Smallsats by the Numbers 2025; BryceTech: Alexandria, VA, USA, 2025; Available online: https://brycetech.com/reports/report-documents/smallsats-2025/ (accessed on 23 July 2026).
- Wall, M. SpaceX Shatters Its Rocket Launch Record Yet Again—165 Orbital Flights in 2025. Space.com. 31 December 2025. Available online: https://www.space.com/space-exploration/private-spaceflight/spacex-shatters-its-rocket-launch-record-yet-again-167-orbital-flights-in-2025 (accessed on 23 July 2026).
- National Aeronautics and Space Administration. 10.0 Integration, Launch, and Deployment. In State-of-the-Art of Small Spacecraft Technology; NASA Small Spacecraft Systems Virtual Institute: Moffett Field, CA, USA, 2026; Available online: https://www.nasa.gov/smallsat-institute/sst-soa/integration-launch-and-deployment/ (accessed on 23 July 2026).
- Rocket Lab USA. Rocket Lab Successfully Launches for iQPS, Ends 2025 with 21 Launches and 100% Mission Success. 2025. Available online: https://rocketlabcorp.com/updates/rocket-lab-successfully-launches-for-iqps-ends-2025-with-21-launches-and-100-mission-succes/ (accessed on 23 July 2026).
- Firefly Aerospace; Inc. Alpha Payload User’s Guide; Version 5.2; Firefly Aerospace, Inc.: Cedar Park, TX, USA, 2025; Available online: https://fireflyspace.com/wp-content/uploads/2025/07/Alpha-PUG-5.2.pdf (accessed on 23 July 2026).
- Firefly Aerospace. Alpha FLTA007. 2026. Available online: https://fireflyspace.com/missions/alpha-flta007/ (accessed on 23 July 2026).
- European Space Agency. Vega-C. Available online: https://www.esa.int/Enabling_Support/Space_Transportation/Vega/Vega-C (accessed on 23 July 2026).
- Aerospace, Isar. Isar Aerospace Lifts Off Successfully during First Test Flight of Orbital Launch Vehicle. 2025. Available online: https://www.isaraerospace.com/press/isar-aerospace-lifts-off-successfully-during-first-test-flight-of-orbital-launch-vehicle (accessed on 23 July 2026).
- Space One. Launch Your Space Business. Available online: https://www.space-one.co.jp/index_e.html (accessed on 23 July 2026).
- Space, P.L.D. Discover MIURA 5 Rocket. Available online: https://www.pldspace.com/en/miura-5.html (accessed on 23 July 2026).
- Skyrora. Skyrora—NewSpace Rocket Company from the UK. Available online: https://skyrora.com/ (accessed on 23 July 2026).
- INNOSPACE. INNOSPACE Secures Key Space Launch Vehicle Technologies for Commercial Launch Services with Space Center Expansion and Fairing Separation Test. 2024. Available online: https://www.innospc.com/myboard/sub04_02/751436 (accessed on 23 July 2026).
- Korea Aerospace Research Institute. Korean Launch Vehicle NURI. Available online: https://www.kari.re.kr/eng/contents/178 (accessed on 23 July 2026).
- An, H.J. South Korea’s Space Program: Activities and Ambitions. Asia Policy 2020, 15, 34–42. [Google Scholar] [CrossRef]
- Choi, Y.I.; Park, J.S.; Lee, K.J.; Ko, J.Y.; Jung, D.H.; Cho, H.S. Small Satellite Launch-Vehicle Public-International Cooperation Development Strategy Based on MBSE and Ensuring Methodology for Low-Cost Manufacturing Technology. In Proceedings of the 53rd Korean Society of Propulsion Engineers Fall Conference, Republic of Korea, (In Korean) November 2019; pp. 404–406. [Google Scholar]
- Lee, K.J.; Park, J.S.; Park, S.Y.; Choi, Y.I.; Lim, S.H.; Park, J.H.; Ko, J.Y. SmallSat Launch Vehicle (SSaL) for the NewSpace Age. In Proceedings of the 53rd Korean Society of Propulsion Engineers Fall Conference, Republic of Korea, (In Korean) November 2019; pp. 310–314. [Google Scholar]
- Edberg, D.L.; Costa, W.D. Design of Rockets and Space Launch Vehicles; AIAA Education Series; American Institute of Aeronautics and Astronautics: Reston, VA, USA, 2020. [Google Scholar]
- Humble, R.W.; Henry, G.N.; Larson, W.J. Space Propulsion Analysis and Design; McGraw-Hill: New York, NY, USA, 1995. [Google Scholar]
- Sutton, G.P.; Biblarz, O. Rocket Propulsion Elements, 9th ed.; Wiley: Hoboken, NJ, USA, 2017. [Google Scholar]
- Pisacane, V.L. Spacecraft Systems Design and Engineering. In Encyclopedia of Physical Science and Technology, 3rd ed.; Meyers, R.A., Ed.; Academic Press: San Diego, CA, USA, 2003. [Google Scholar]
- Sellers, J.J. Understanding Space: An Introduction to Astronautics, 3rd ed.; McGraw-Hill: New York, NY, USA, 2005. [Google Scholar]
- Lee, S.-I.; Cho, S.-B.; Sun, B.-C. Analysis of Flight Trajectory and Environment of Nuri-2 Launch Vehicle. In Proceedings of the Korean Society for Aeronautical and Space Sciences 2022 Fall Conference, Republic of Korea, (In Korean) November 2022; pp. 728–729. [Google Scholar]
- Kim, C.; Lim, B.; Lee, J.; Seo, D.; Lim, S.; Lee, K.-O.; Lee, K.; Park, J. Conceptual Design of a LOX/Methane Rocket Engine for a Small Launcher Upper Stage. J. Korean Soc. Propuls. Eng. 2022, 26, 54–63. [Google Scholar] [CrossRef]
- Möllmann, C.; Wiegand, A.; Dalheimer, M.; Martinez Barrio, A.; Kauffmann, J. Multidisciplinary Design Optimisation of Expandable Launchers in ASTOS. In Proceedings of the 4th International Conference on Astrodynamics Tools and Techniques (ICATT), ESAC, Madrid, Spain, 3–6 May 2010. [Google Scholar]
- Lee, K.J.; Choi, J.Y.; Cho, S.B.; Sun, B.C. Rapid Feasibility Study on a Miniature-Class Launcher Using a Multidisciplinary Design Approach. In Proceedings of the Asia-Pacific International Symposium on Aerospace Technology, Seoul, Republic of Korea, 2017. [Google Scholar]
- Wiegand, A.; Cremaschi, F.; Winter, S.; Weikert, S.; Link, T.; Zell, D.; Albinger, J. Design Optimization and Performance Analysis of Launch Vehicles with ASTOS. In Proceedings of the 63rd Deutscher Luft- und Raumfahrtkongress (DLRK 2014), Augsburg, Germany, 2014. [Google Scholar]
- European Cooperation for Space Standardization. Space Engineering—Structural Factors of Safety for Spaceflight Hardware; ECSS Secretariat, ESA-ESTEC Requirements & Standards Division: Noordwijk, The Netherlands, 2009; Available online: https://ecss.nl/wp-content/uploads/standards/ecss-e/ECSS-E-ST-32-10C_Rev.16March2009.pdf (accessed on 23 July 2026).
- Lee, C.-M.; Sim, C.-H.; Kim, G.-S.; Park, J.-S.; Lee, J.-S. Derivation of Knockdown Factors for Common Bulkhead Structures of Launch Vehicle Propellant Tank Using Liquid Methane. J. Korean Soc. Propuls. Eng. (In Korean) 2024, 28, 23–36. [Google Scholar] [CrossRef]
- Astos Solutions GmbH. DrNUM: Launch Vehicle Aerodynamics Package; Astos Solutions GmbH: Stuttgart, Germany, 2023; Available online: https://www.astos.de/flyer/DrNUM_Flyer.pdf (accessed on 23 July 2026).
- Schäff, S.; Jürgens, M.; Wiegand, A. POINT—A Tool to Optimize Interplanetary Trajectories. In Proceedings of the 4th International Conference on Astrodynamics Tools and Techniques (ICATT), ESAC, Madrid, Spain, 3–6 May 2010. [Google Scholar]
- Gath, P.F. CAMTOS—A Software Suite Combining Direct and Indirect Trajectory Optimization Methods. Ph.D. Thesis, University of Stuttgart, Stuttgart, Germany, 2002. [Google Scholar]
- WORHP. WORHP: Large-Scale Sparse Nonlinear Optimisation. Available online: https://worhp.de/ (accessed on 23 July 2026).
- Vidya, G.; Manokaran, K.; Ganesan, V.R.; Prasath, M.; Epuri, S.; Balasubramanian, P.; Babu, C.; Venkatasubrahmanyam, B.; Bandyopadhyay, P. Aerodynamic Design, Characterization and Flight Performance of RLV-TD. Curr. Sci. 2018, 114, 48–63. [Google Scholar] [CrossRef]
Figure 2.
Propellant and dry masses according to the structural index (Isp = 360 s).
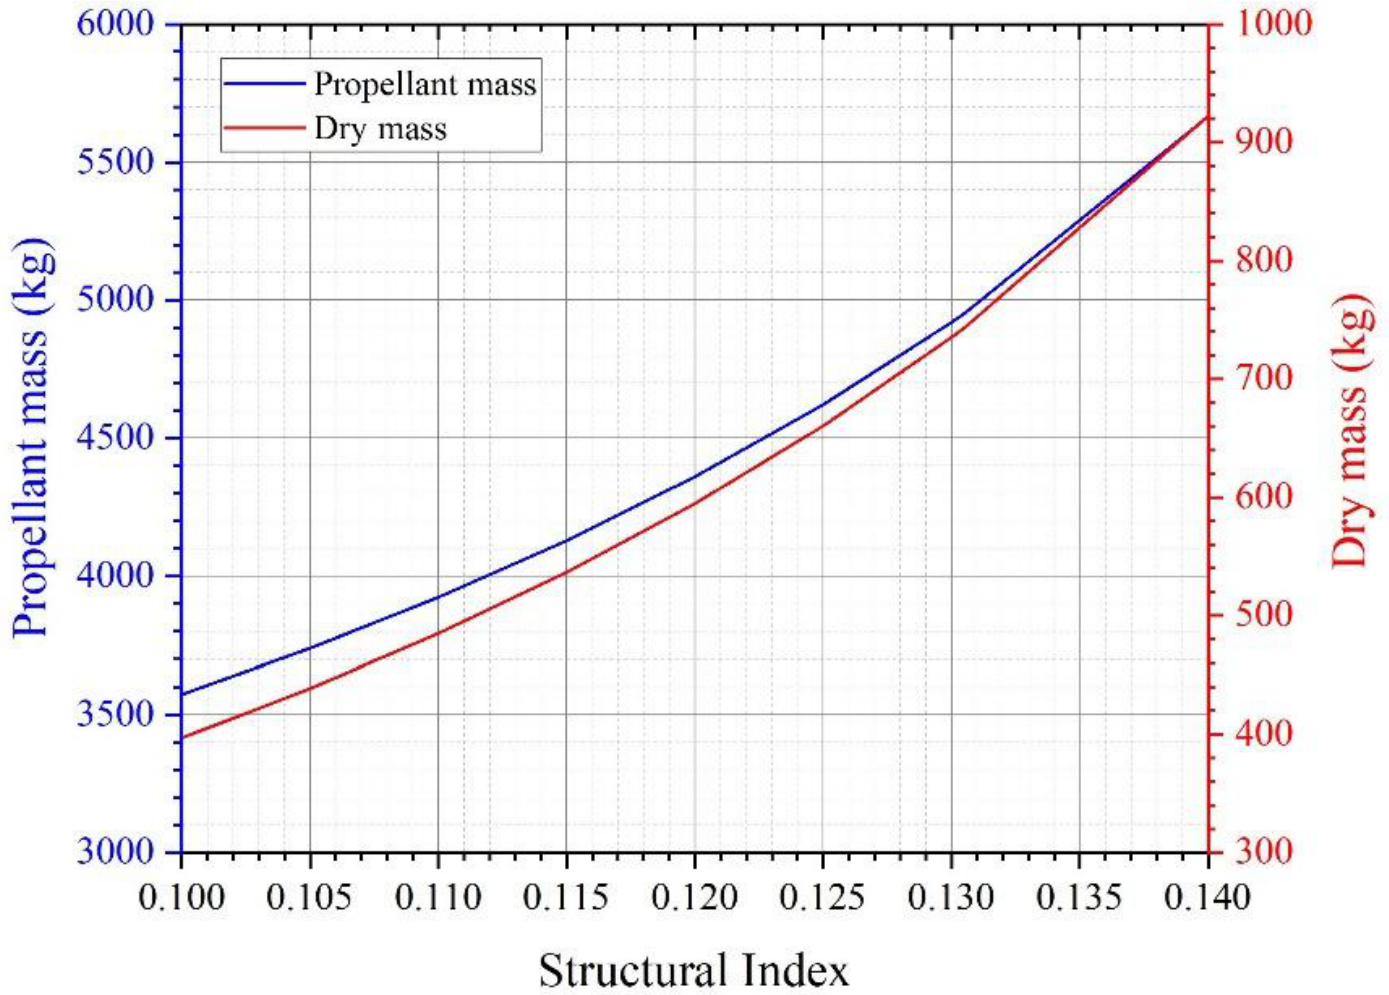
Figure 3.
Propellant and dry masses with respect to the structural index (Isp = 299.8 s).
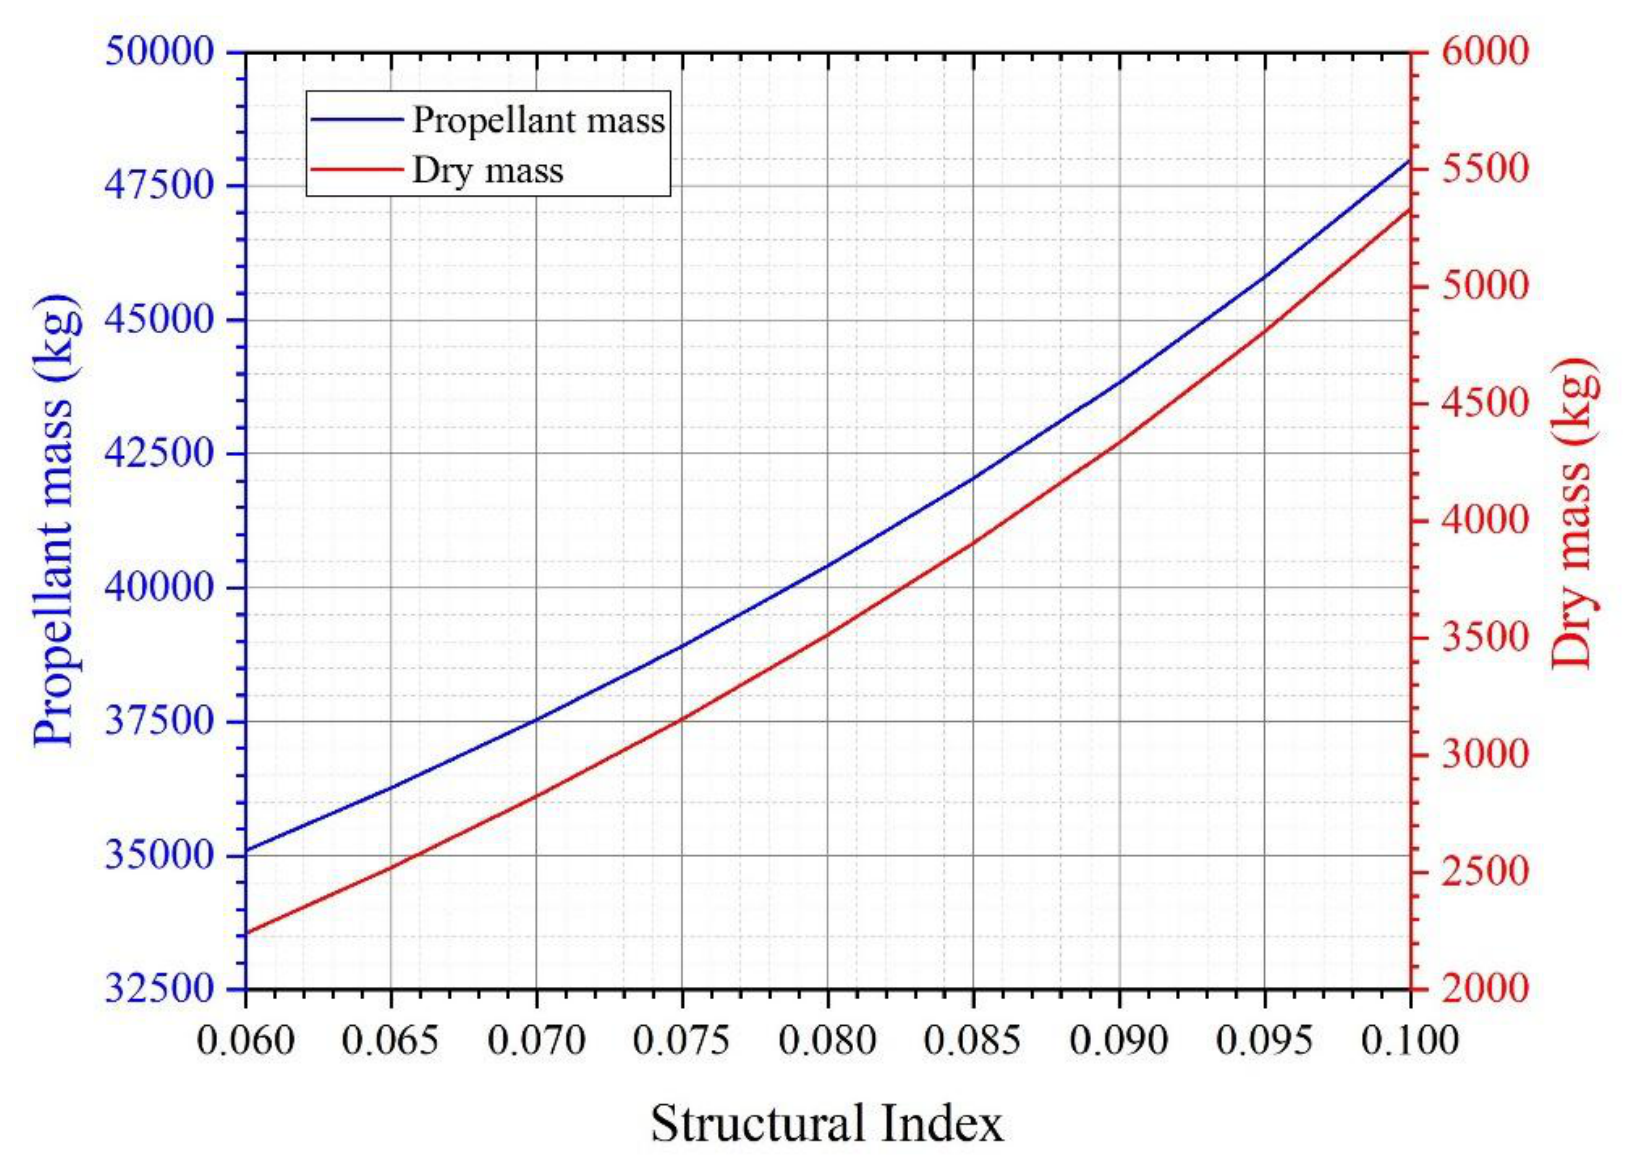
Figure 5.
Layout of SmallSat-dedicated launch vehicle.
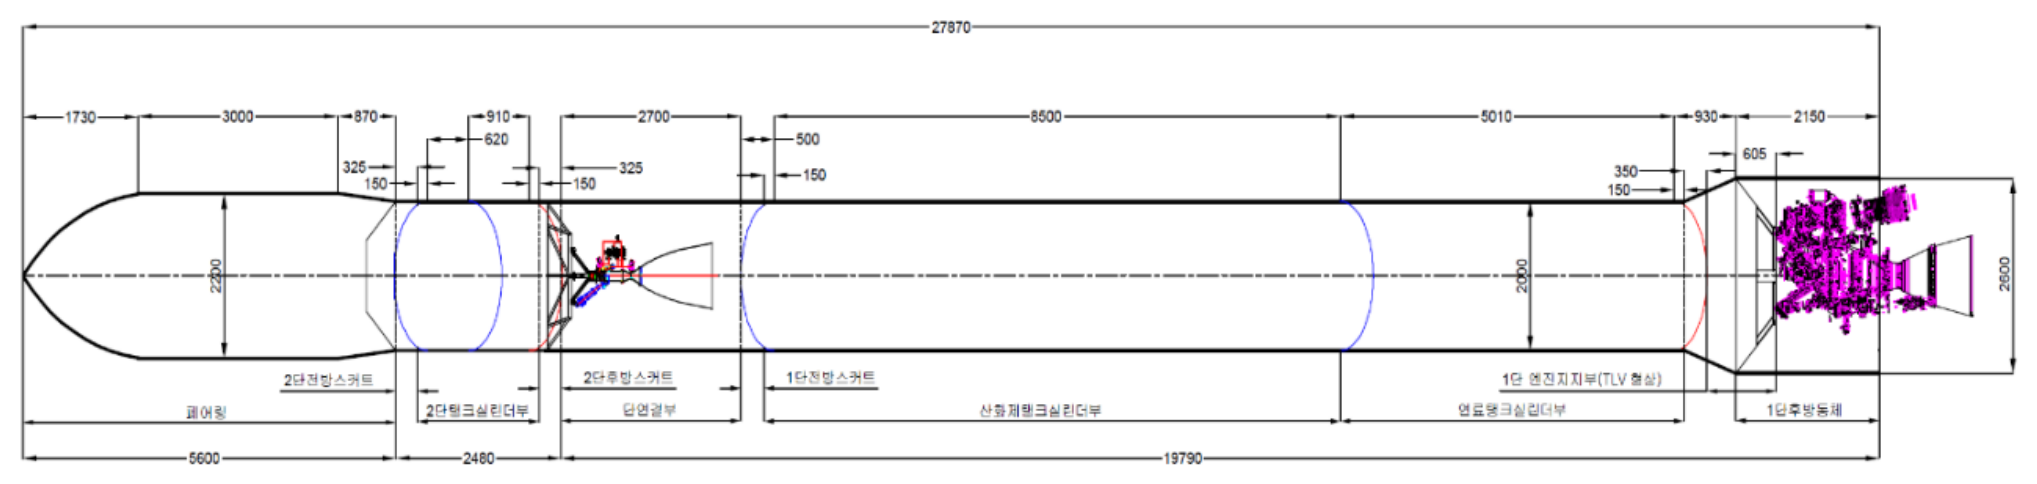
Figure 6.
Process diagram of multidisciplinary design optimization (MDO) in ASTOS (Analysis, Simulation and Trajectory Optimization software for Space applications).
Figure 6.
Process diagram of multidisciplinary design optimization (MDO) in ASTOS (Analysis, Simulation and Trajectory Optimization software for Space applications).
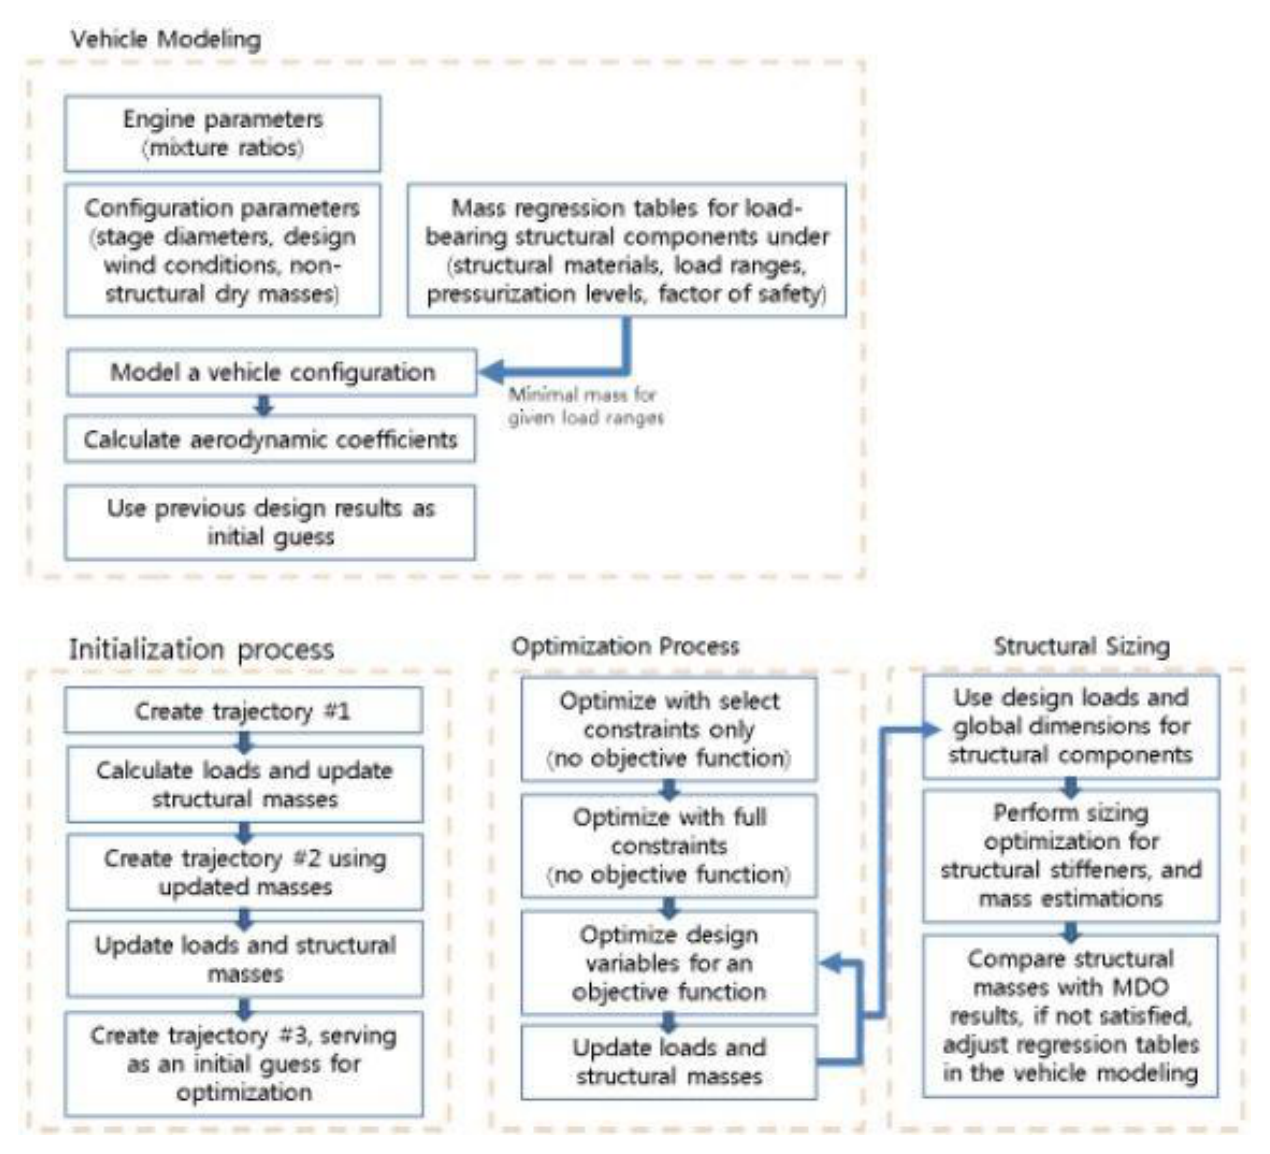
Figure 7.
Mach contour at Ma = 1.1 and angle of attack of 5°.
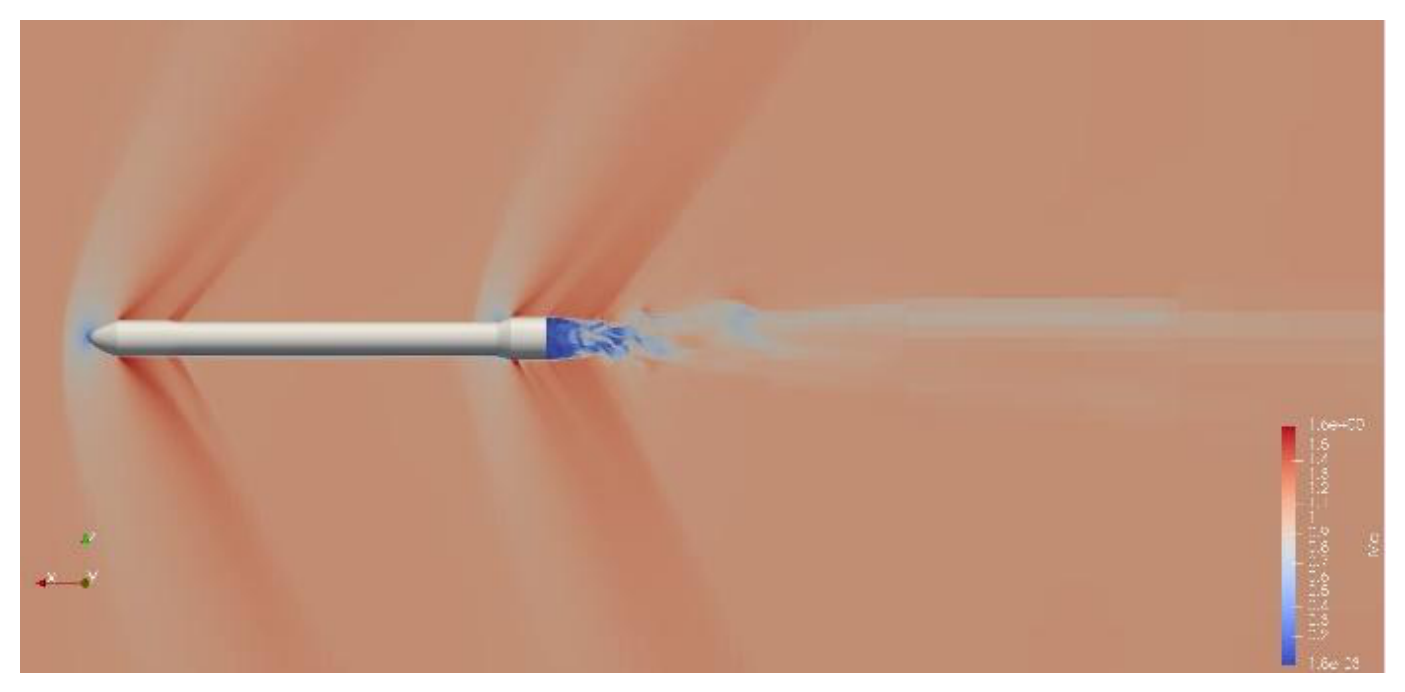
Figure 8.
Mach contour at Ma = 3.0 and an angle of attack of 5°.
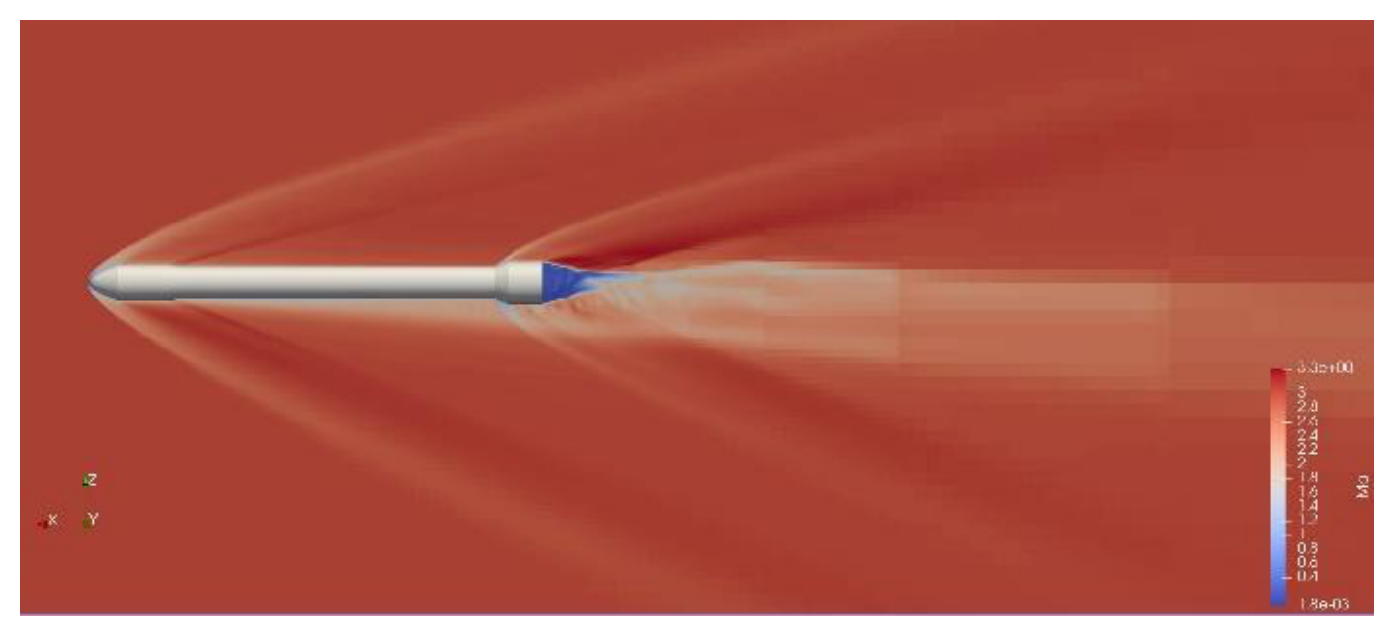
Figure 9.
Calculated axial force coefficient (CA) as a function of the Mach number.
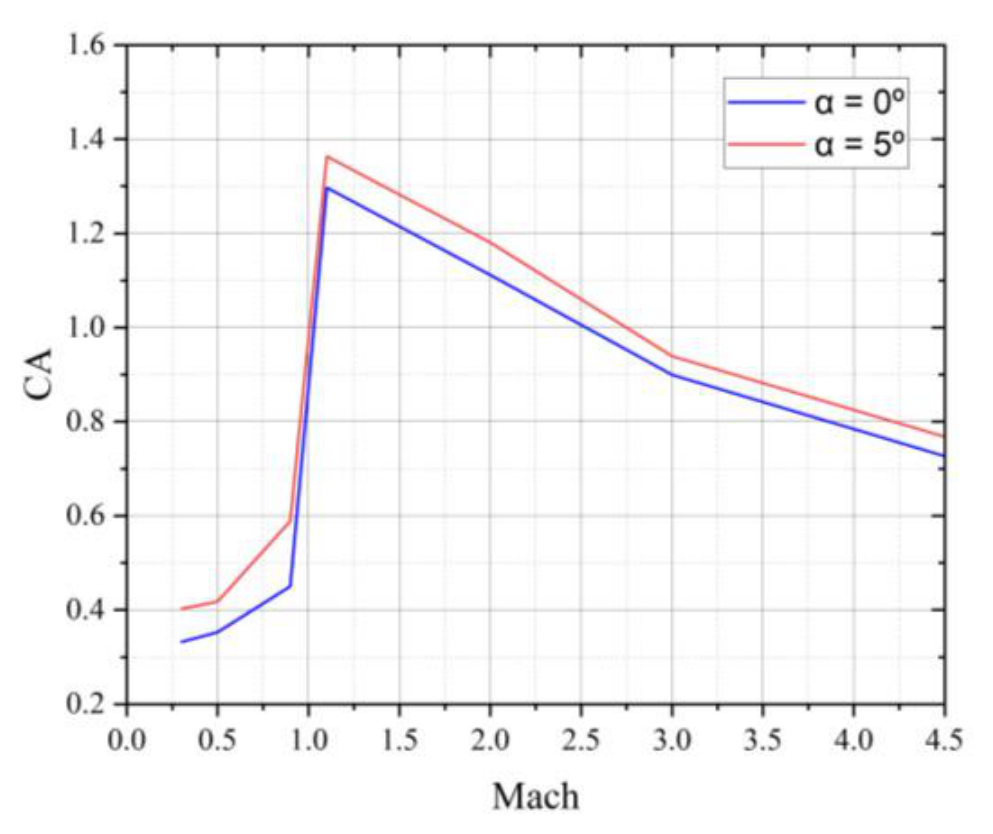
Figure 10.
Calculated normal force coefficient (CN) as a function of the Mach number at α = 5°.
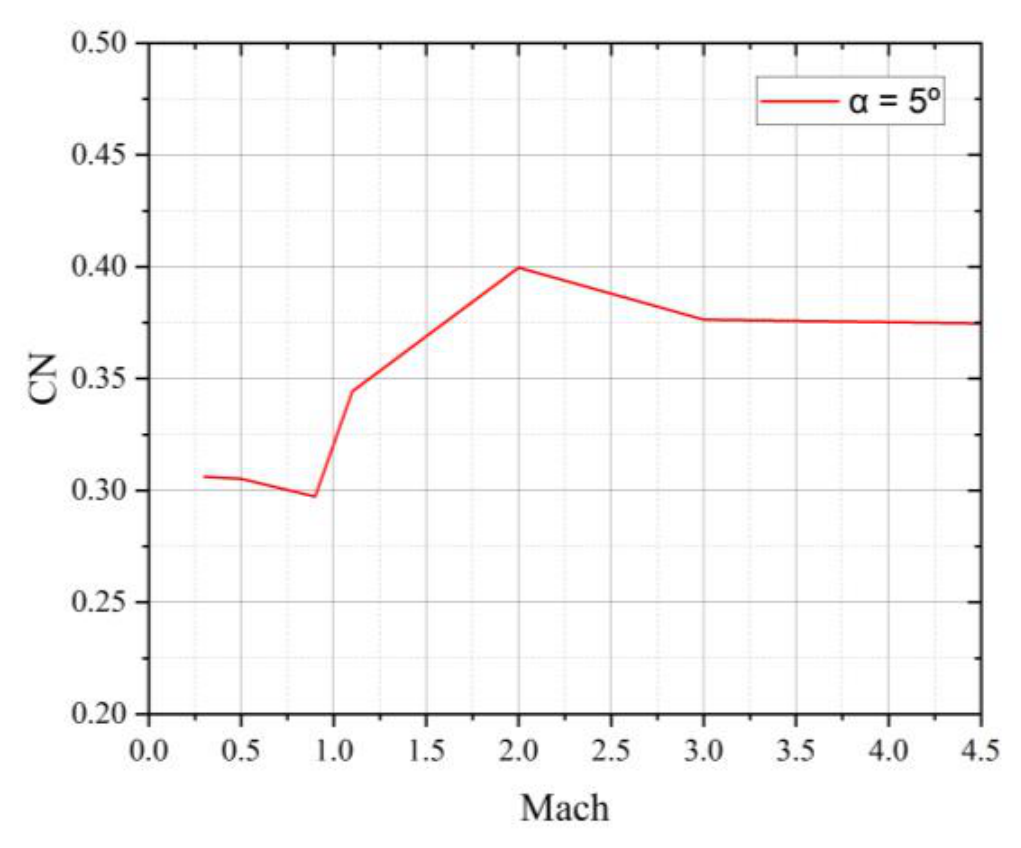
Figure 11.
Shape of the launch vehicle generated through the initial process in ASTOS (Analysis, Simulation and Trajectory Optimization software for Space applications).
Figure 11.
Shape of the launch vehicle generated through the initial process in ASTOS (Analysis, Simulation and Trajectory Optimization software for Space applications).
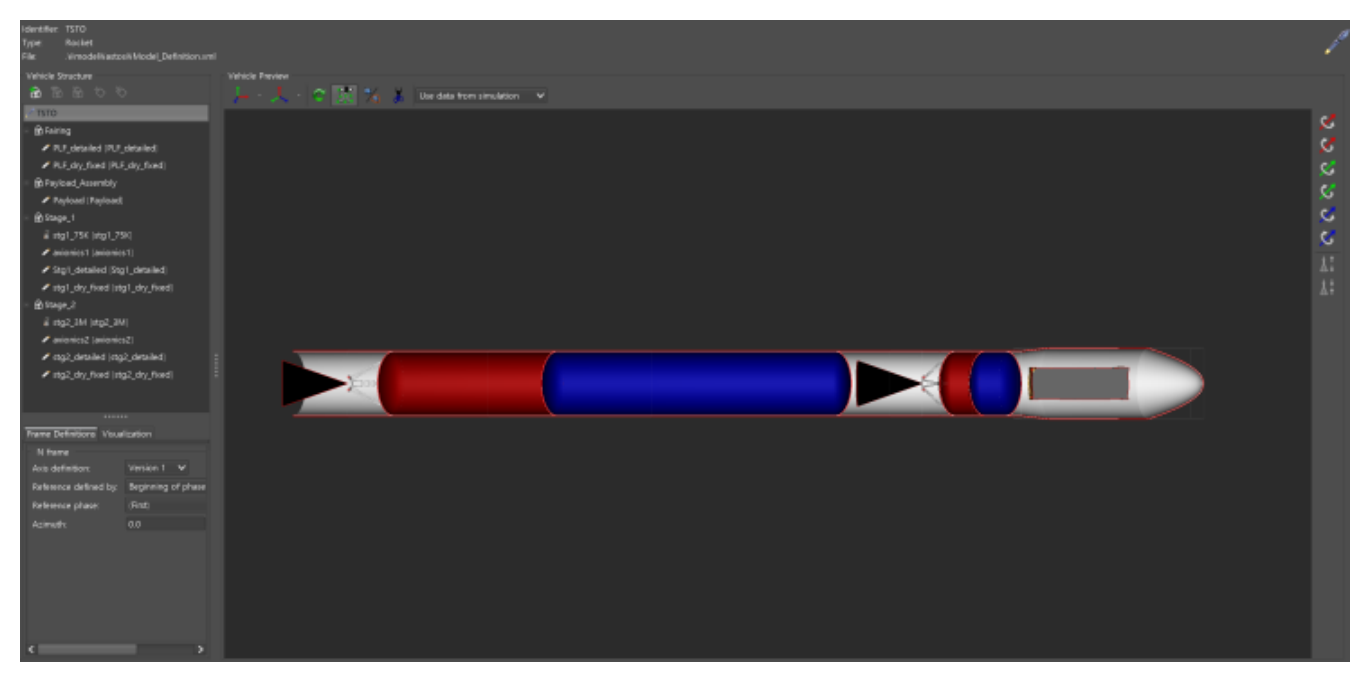
Figure 12.
Schematic of the Graphical Environment for Simulation and Optimization (GESOP) framework used in ASTOS.
Figure 12.
Schematic of the Graphical Environment for Simulation and Optimization (GESOP) framework used in ASTOS.
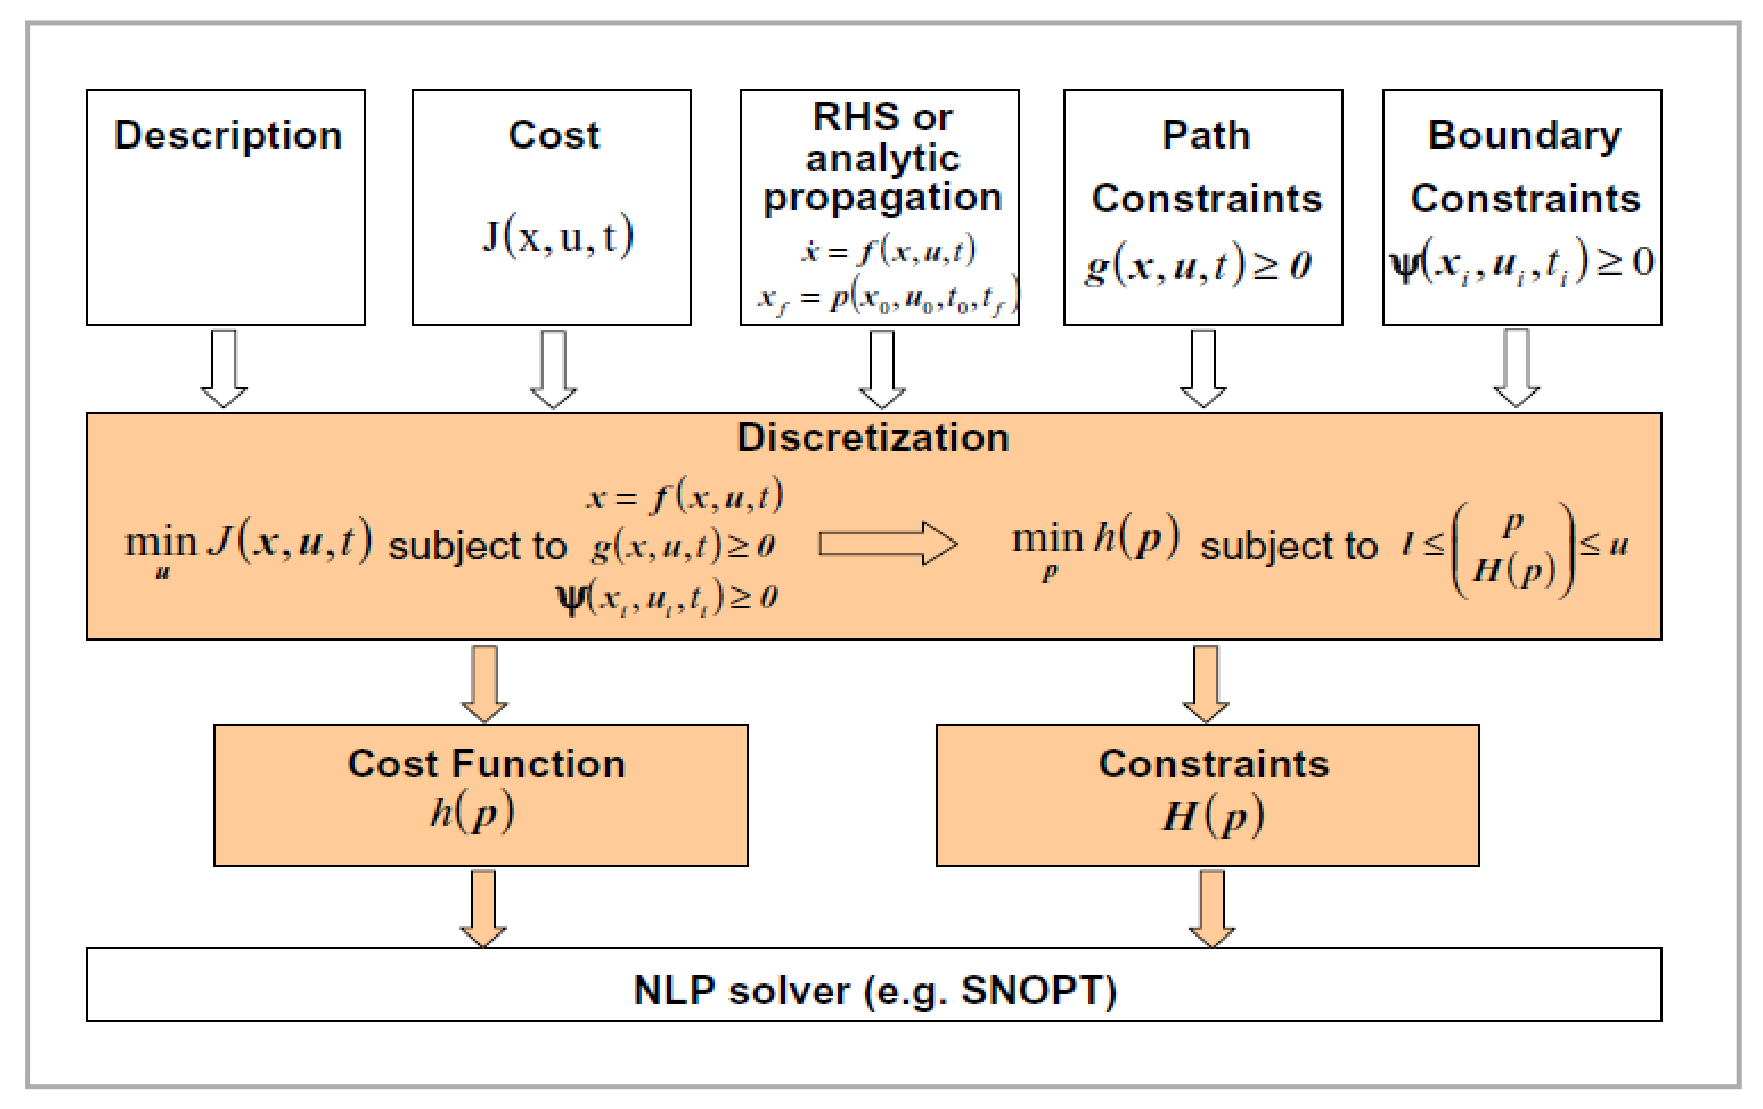
Figure 13.
Optimized trajectory of the launch vehicle.
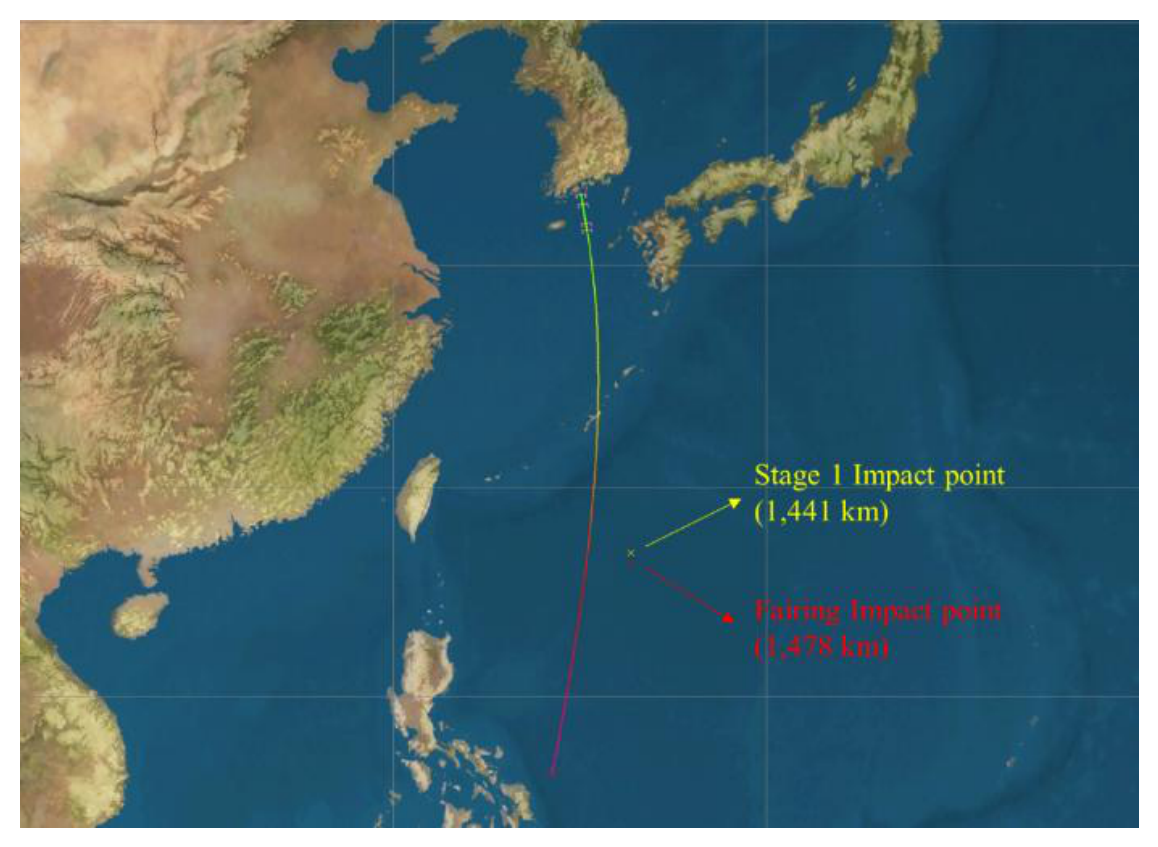
Figure 14.
Altitude versus flight time.
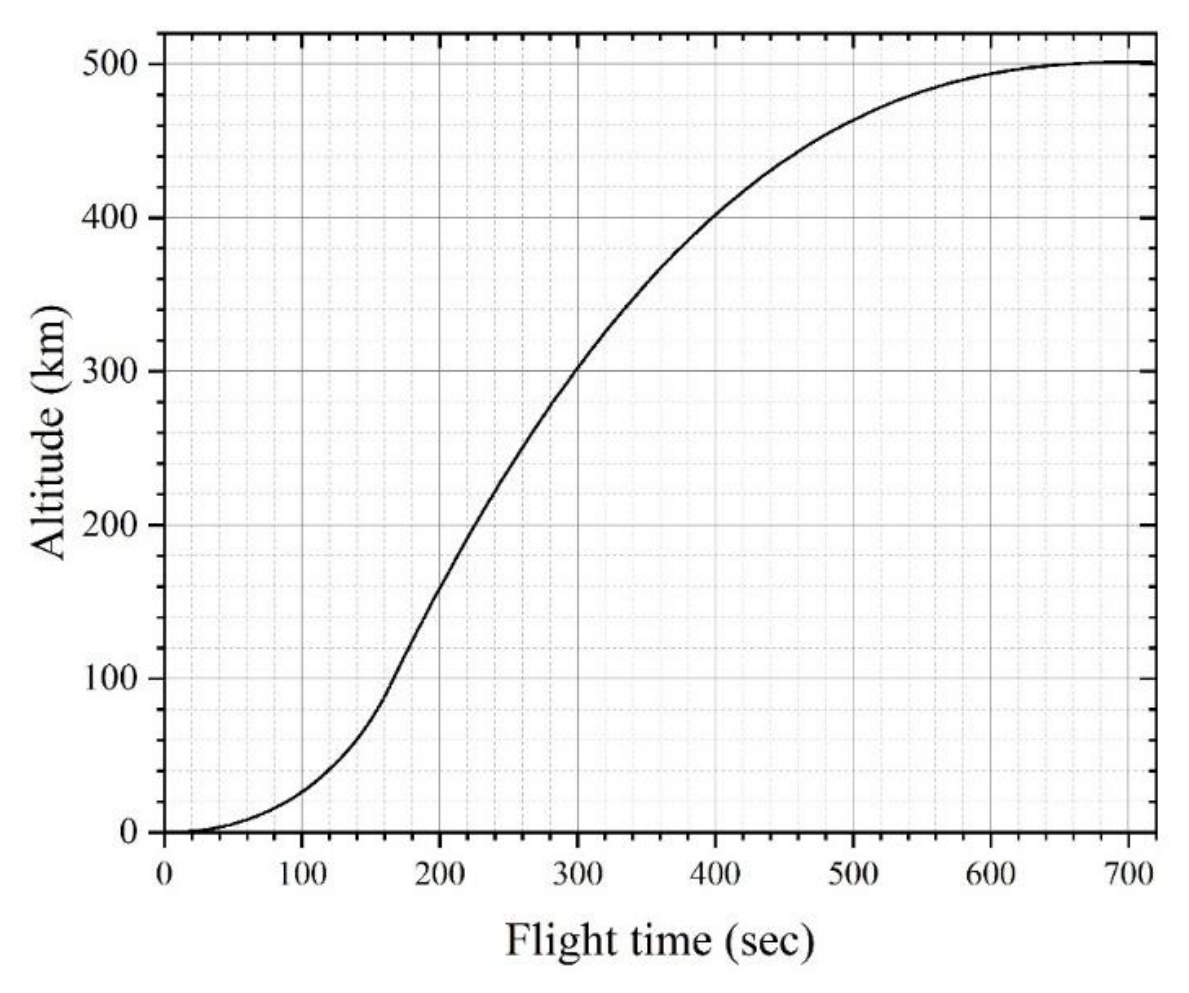
Figure 15.
Velocity versus flight time.
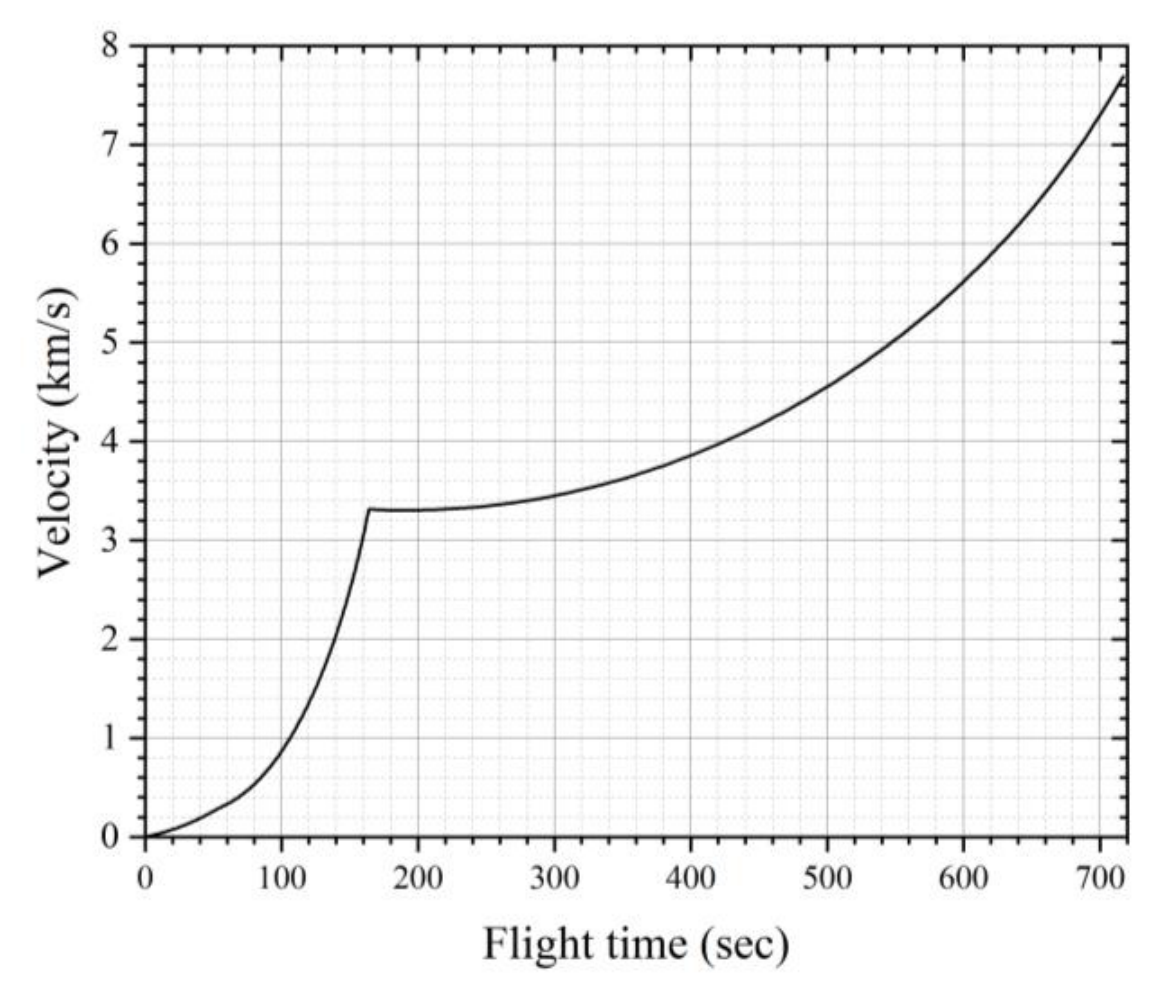
Figure 16.
Pitch and yaw angle versus flight time.
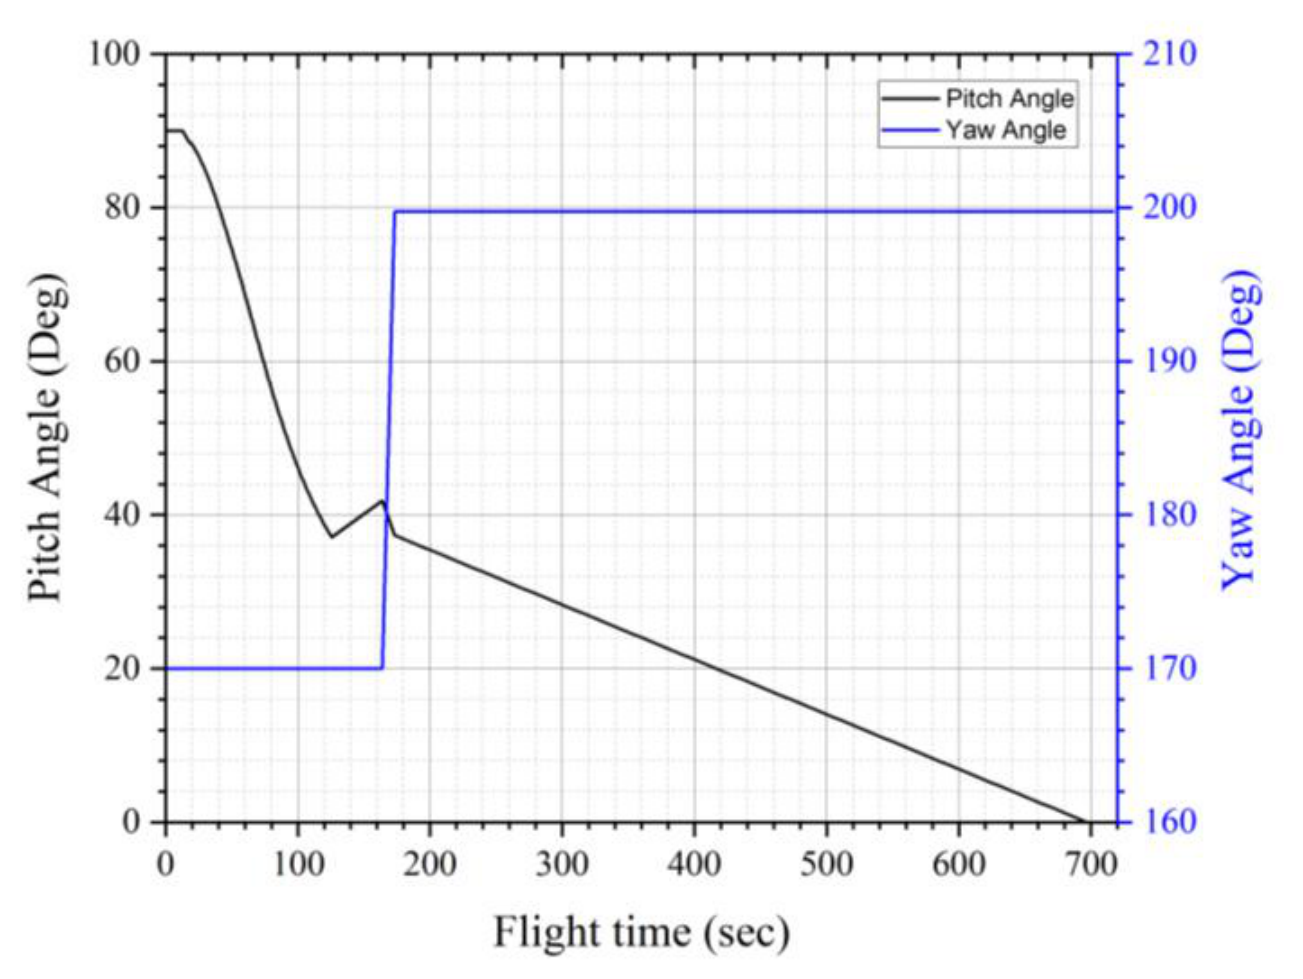
Figure 17.
Dynamic pressure and angle of attack versus flight time.
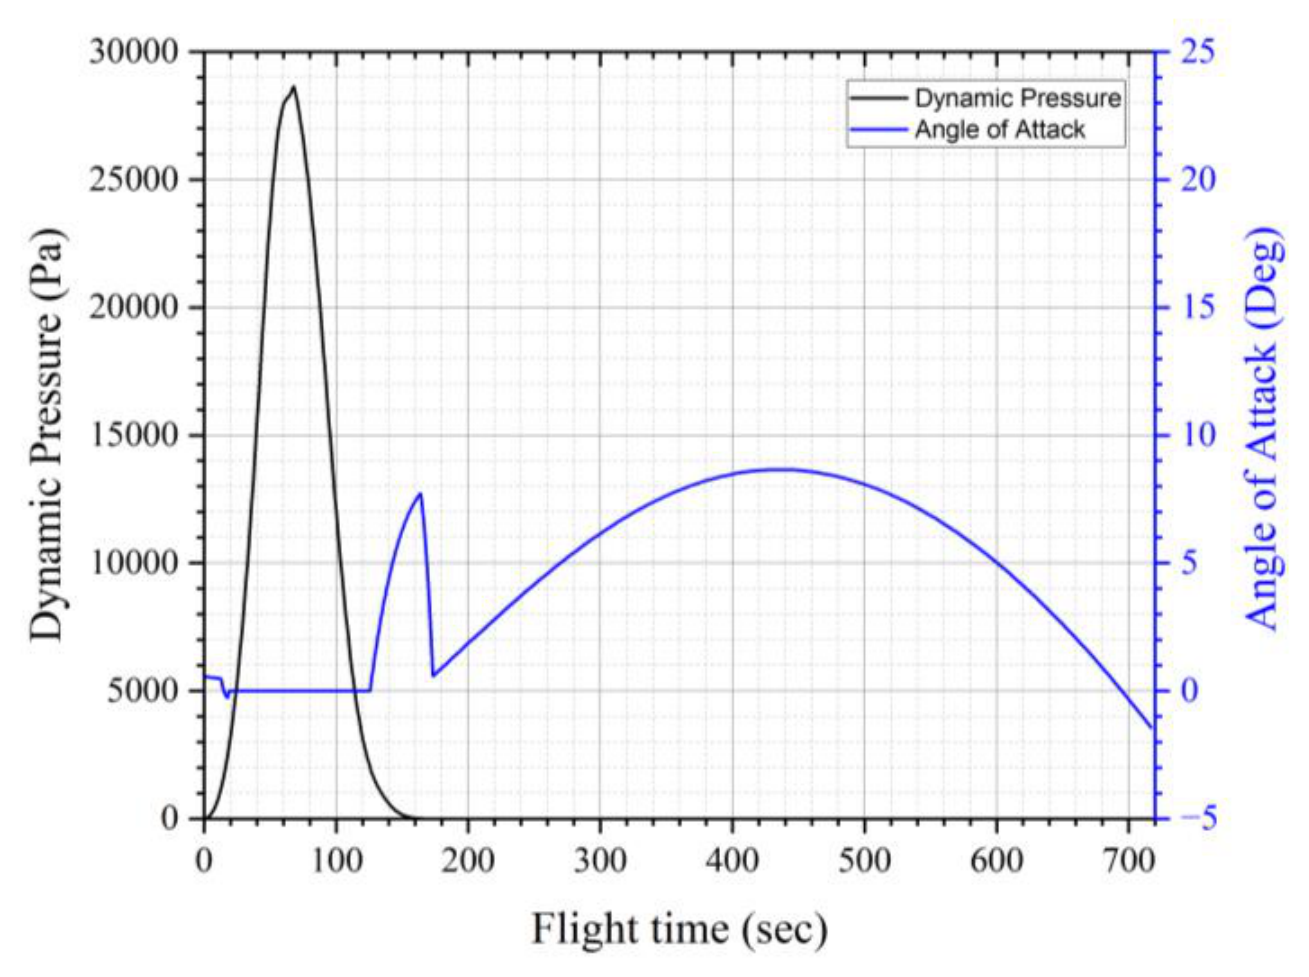
Figure 18.
Heat flux density and flight path angle versus flight time.
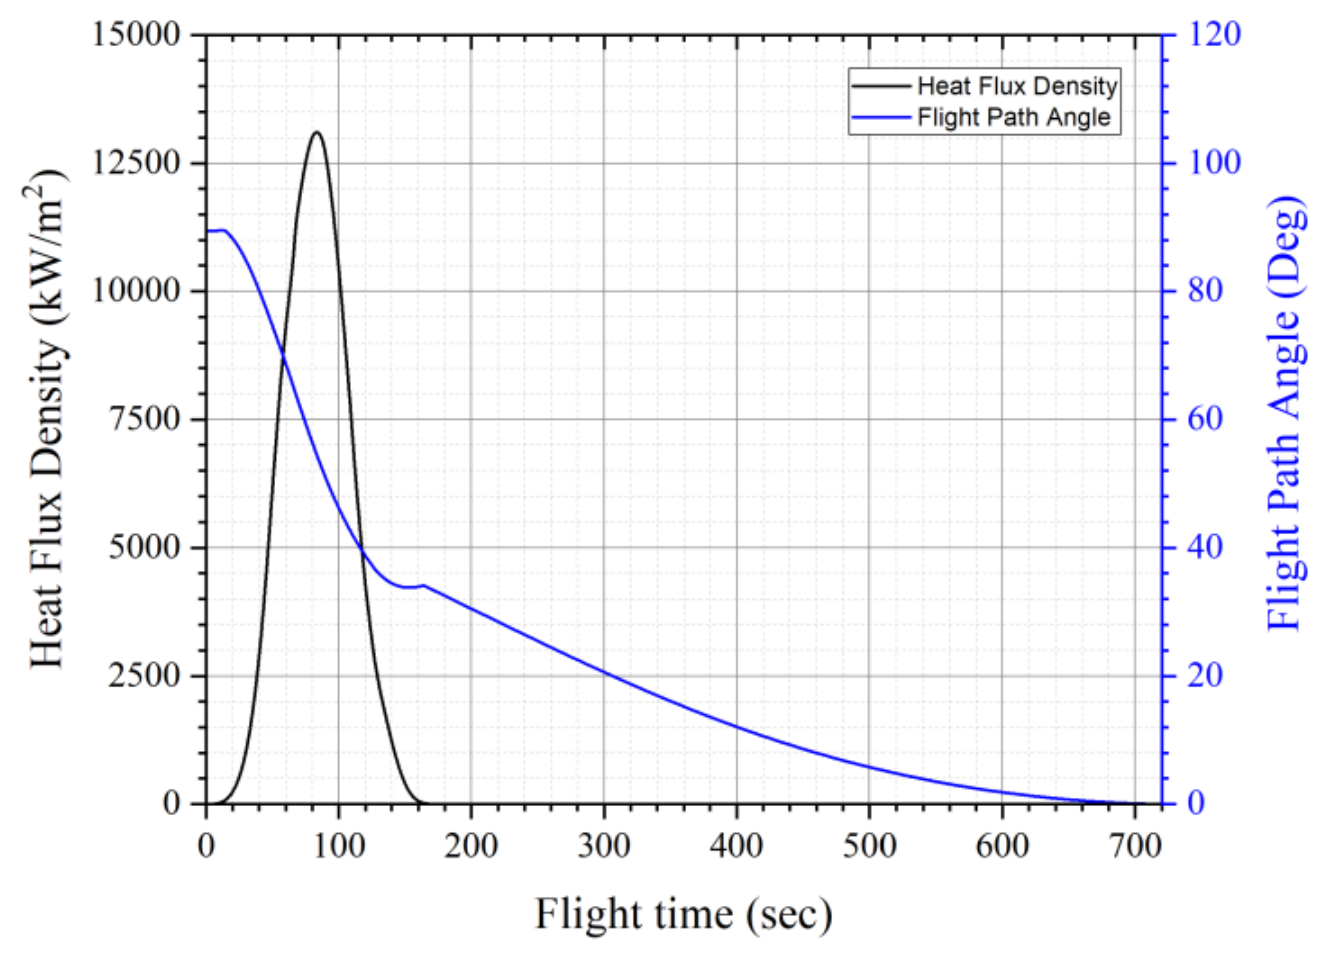
Figure 19.
Calculated Delta-V versus flight time.
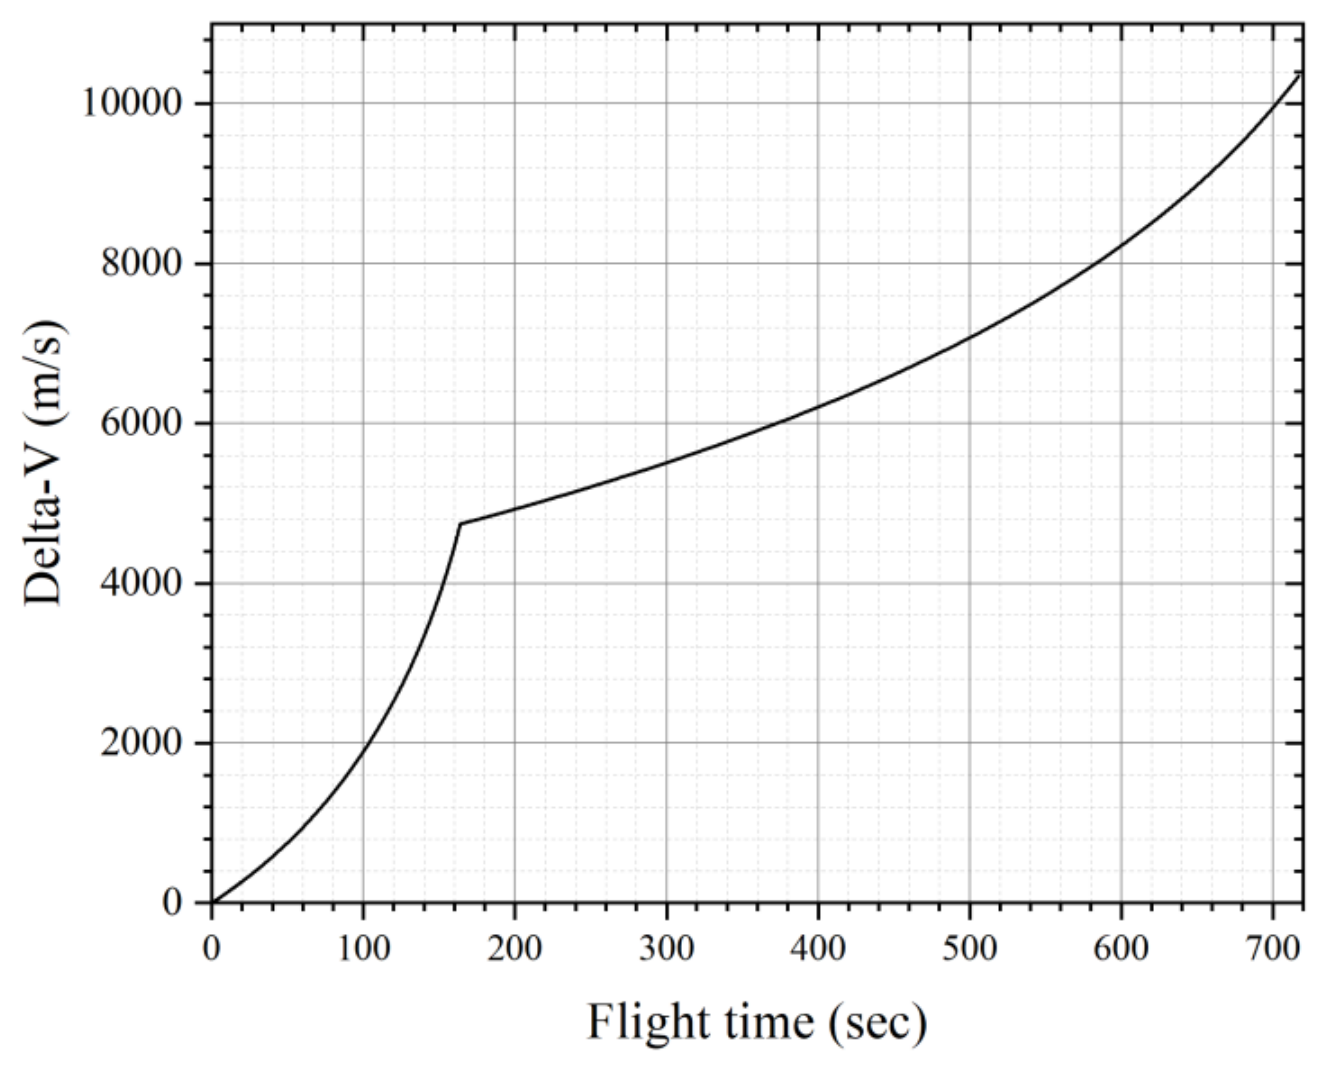
Figure 20.
Vehicle mass versus flight time.
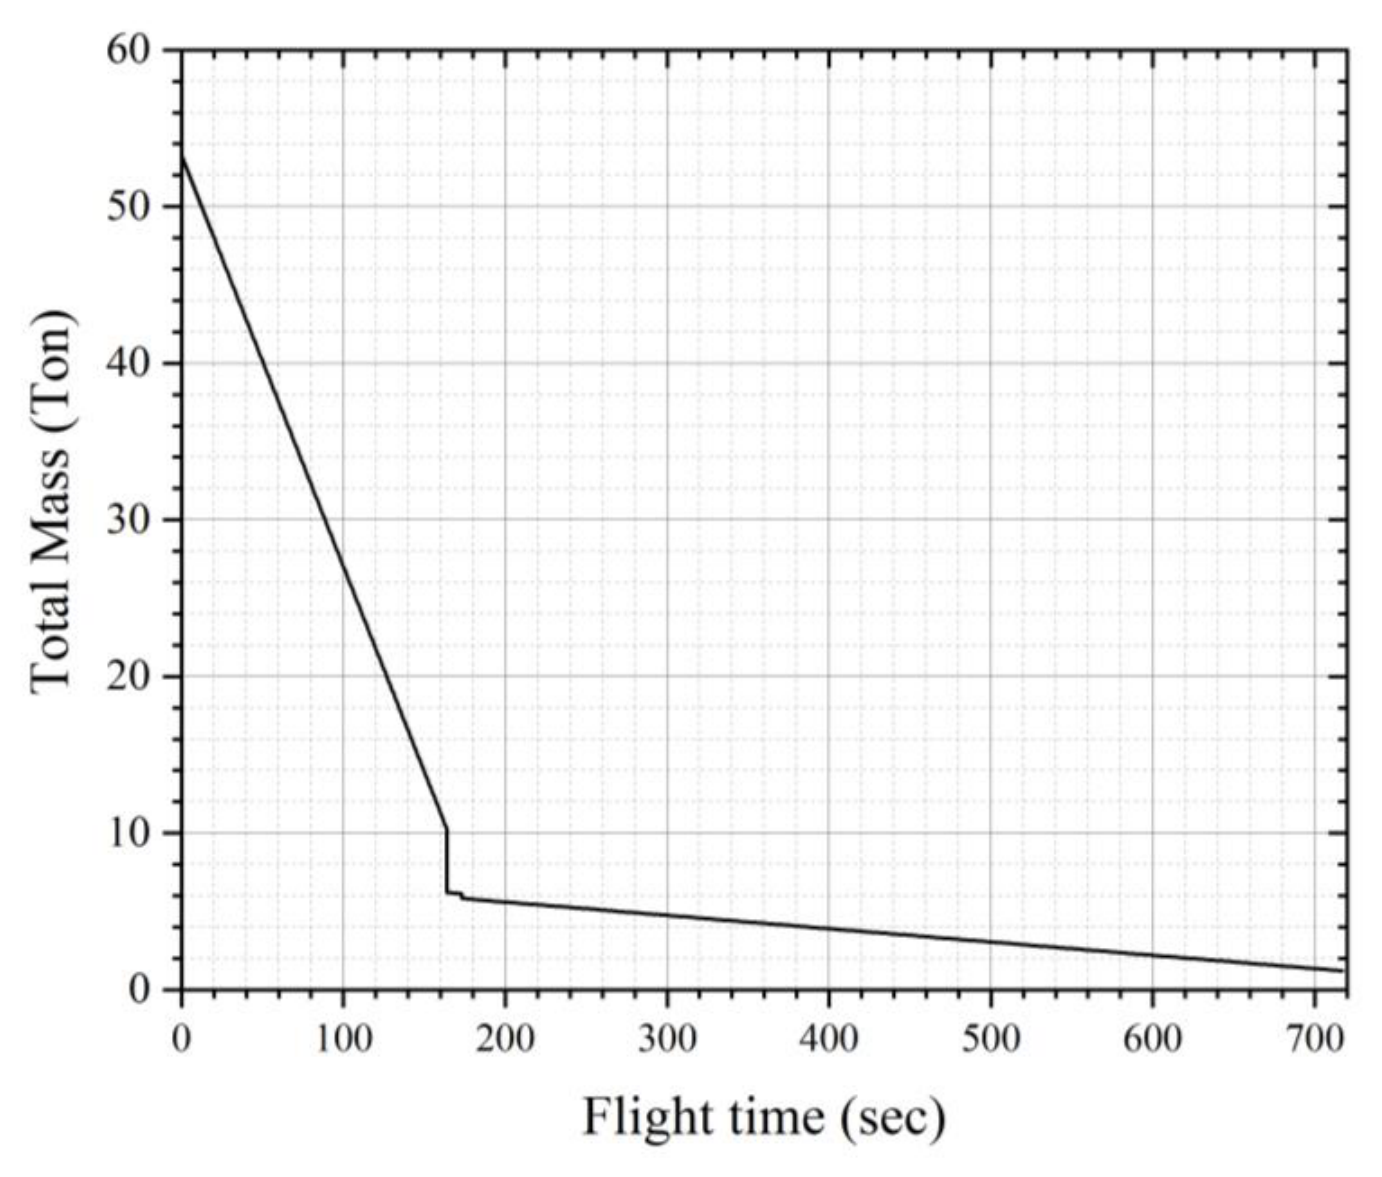
Figure 21.
Load analysis results at (a) launch pad, (b) MaxQ, and (c) MECO.
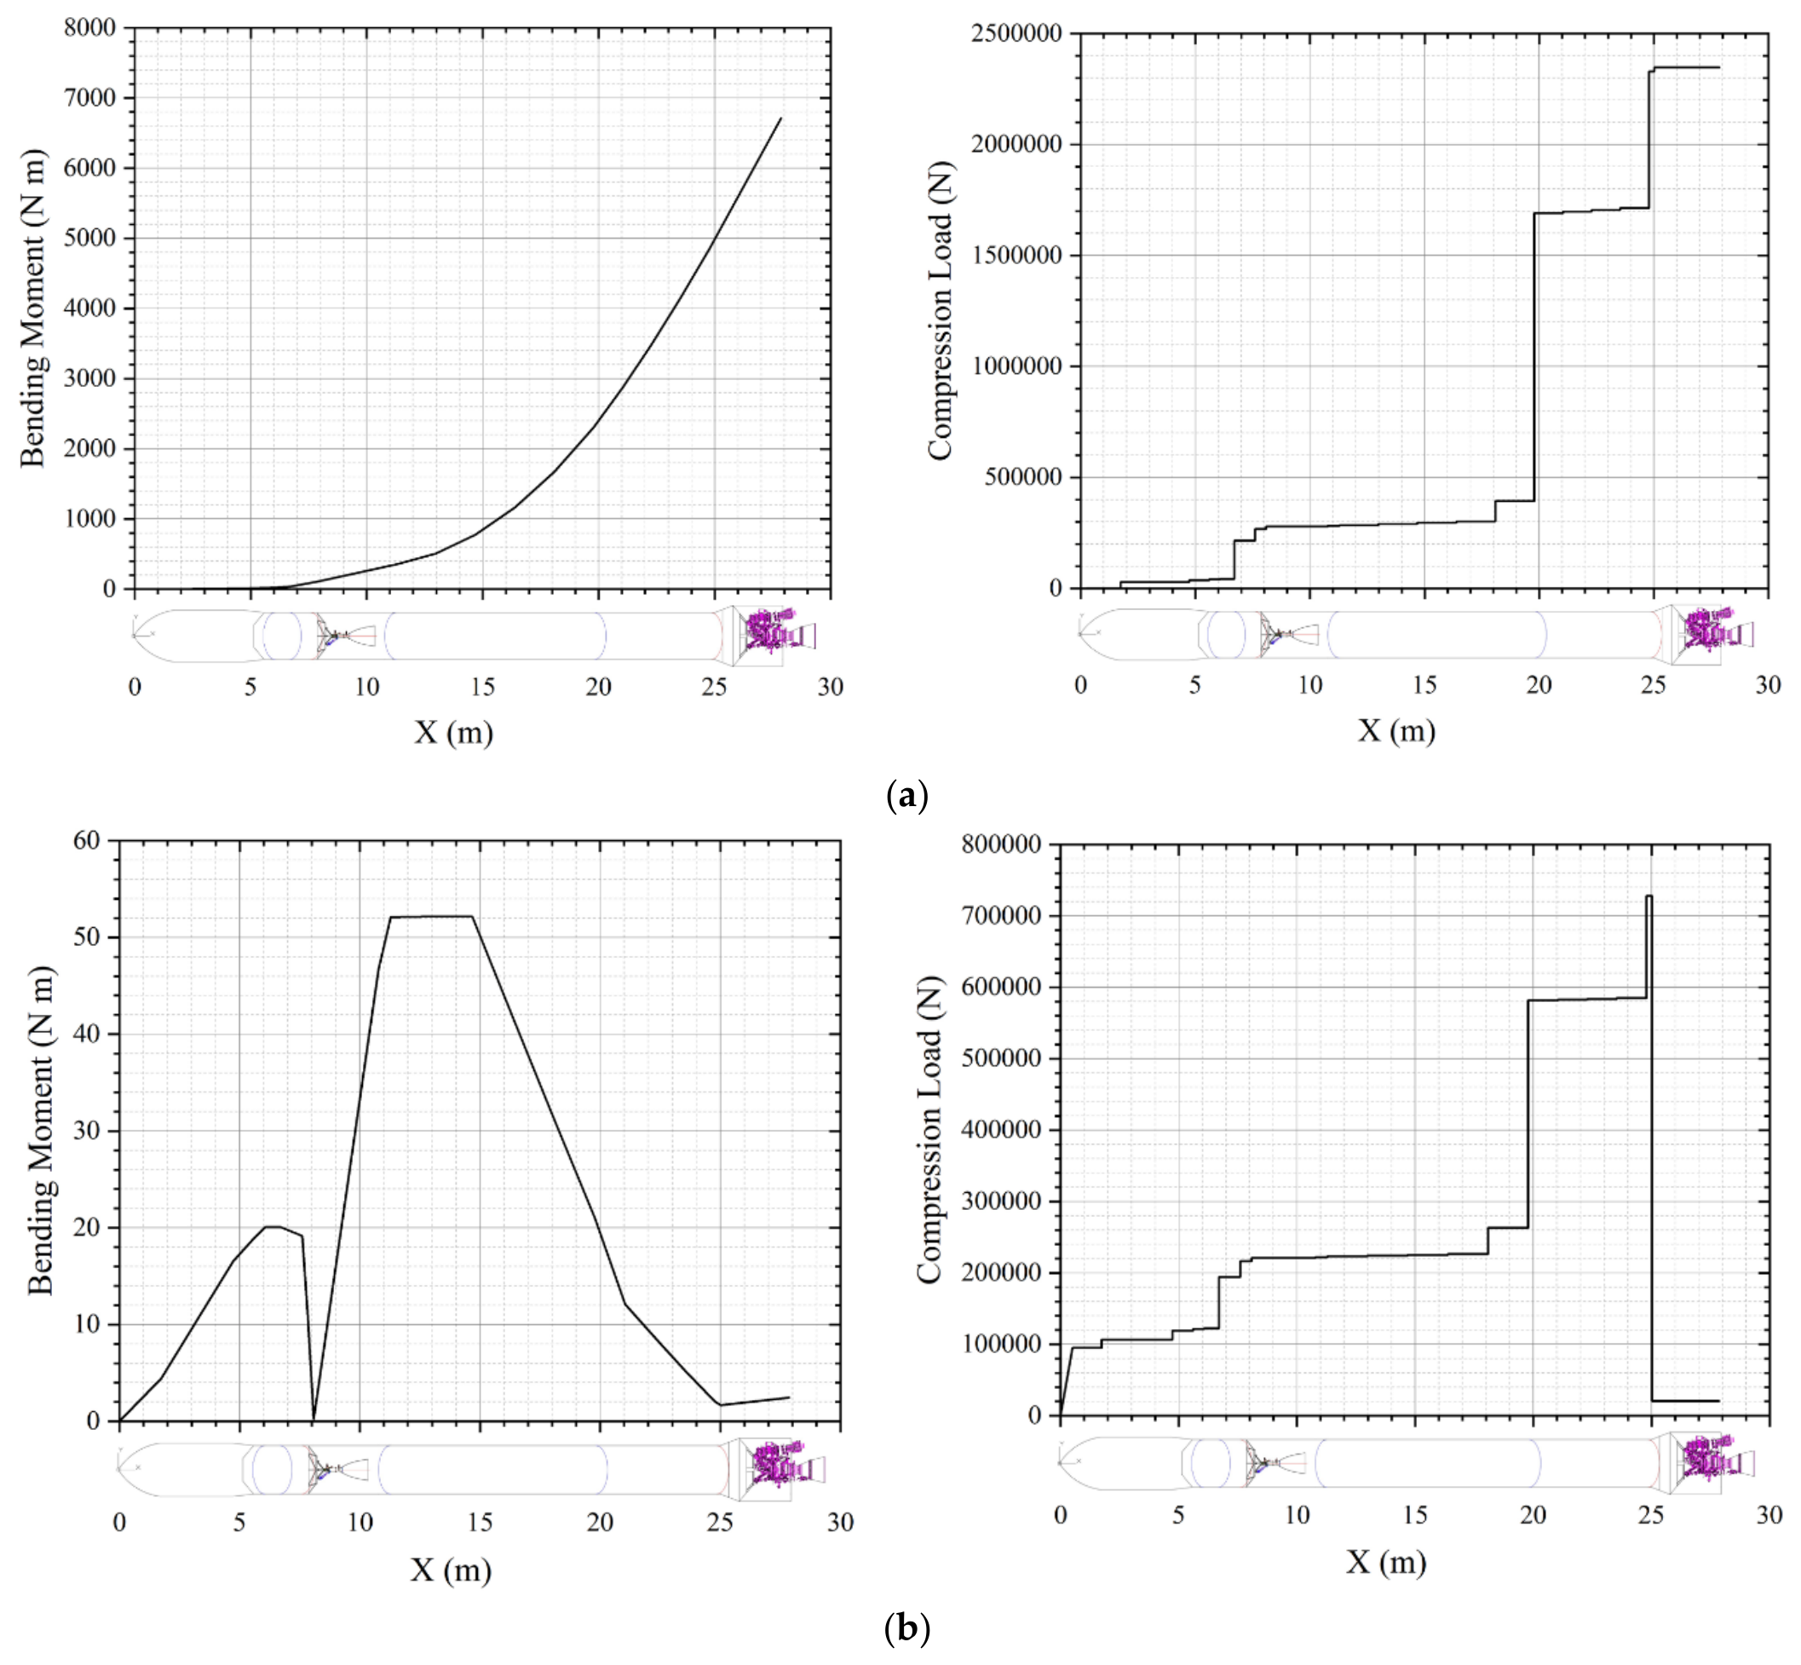
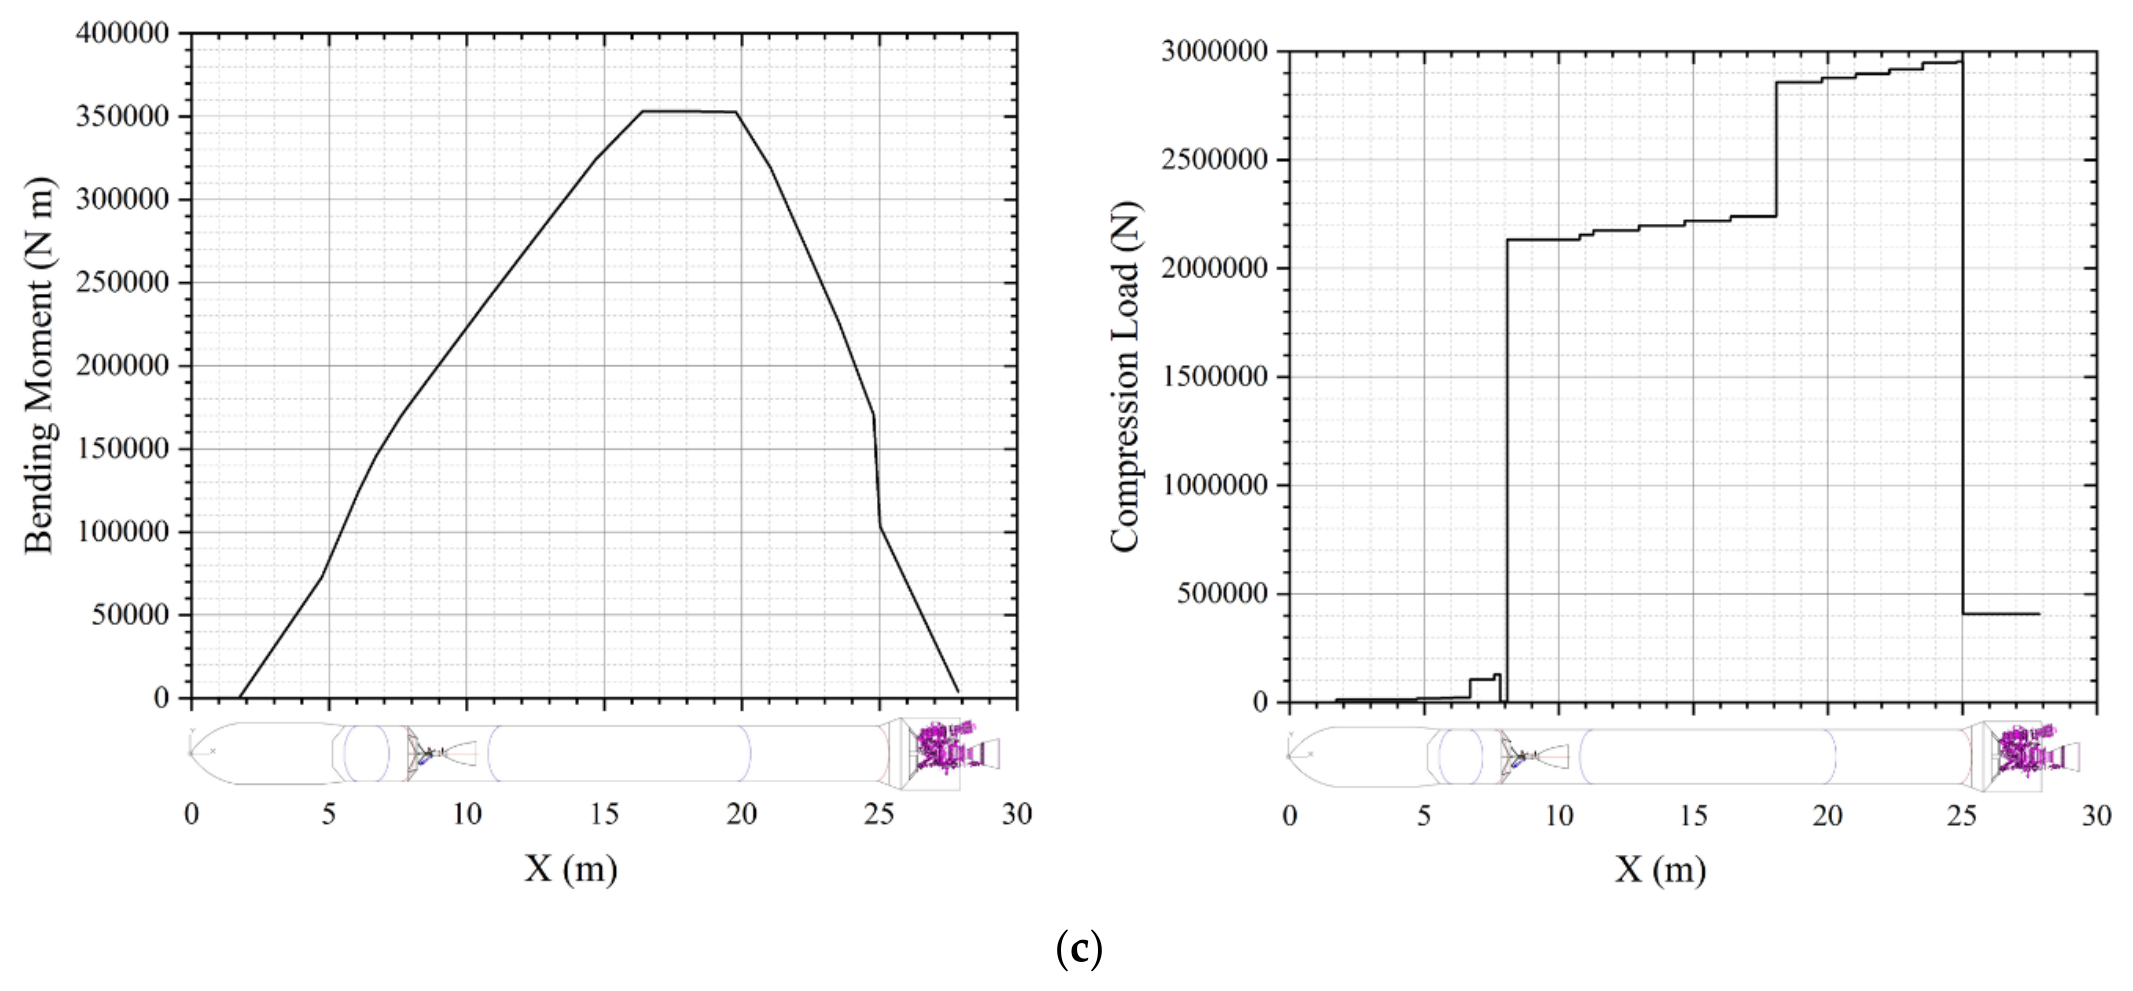
Table 1.
Delta-V requirement for SmallSat-dedicated launch vehicle.
| Parameter | Value | Remarks |
|---|---|---|
| VSSO [m/s] | 7,612 | 500 km altitude |
| △Vgravity loss [m/s] | 2,000 | |
| △Vsteering loss [m/s] | 300 | Yaw maneuver |
| △Vdrag loss [m/s] | 200 | |
| △Vretrograde loss [m/s] | 85 | |
| △Vmargin [m/s] | 303 | 3% of Equation (9) |
| △Vreq_Total | 10,500 |
Table 2.
Masses of the second stage in terms of structural indices.
| Structural index (%) | 13.5 | 13 | 12.5 | 12 | 11.5 |
| Total mass (kg) | 6085.3 | 5654.8 | 5281 | 4953.9 | 4664.8 |
| Propellant mass (kg) | 5263.8 | 4919.7 | 4621 | 4359.4 | 4128.3 |
| Dry mass (kg) | 821.5 | 735.1 | 660 | 594.5 | 536.5 |
Table 3.
Masses of the first stage in terms of structural indices.
| Structural index (%) | 9.5 | 9 | 8.5 | 8 | 7.5 |
| Total mass (kg) | 50617.3 | 48170.3 | 45949 | 43923.6 | 42069.1 |
| Propellant mass (kg) | 45808.7 | 43835 | 42043.3 | 40409.7 | 38913.9 |
| Dry mass (kg) | 4808.6 | 4335.3 | 3905.7 | 3513.9 | 3155.2 |
Table 4.
Combination of structural indices for each stage satisfying a ground thrust to takeoff weight (T/W) of 1.3 or higher.
Table 4.
Combination of structural indices for each stage satisfying a ground thrust to takeoff weight (T/W) of 1.3 or higher.
| Structural index for Stage 1 | Structural index for Stage 2 | Lift-off mass (kg) |
Remarks |
|---|---|---|---|
| 9.5% | 11.5% | 56,082 | T/W < 1.3 No available structural index for second stage |
| 9% | 11.5% | 53,635 |
T/W < 1.3 No available structural index for second stage |
| 8.5% | 13.5% | 52,834 | Available |
| 13% | 52,404 | Available | |
| 12.5% | 52,030 | Available | |
| 12% | 51,703 | Available | |
| 11.5% | 51,414 | Available | |
| 8% | 13.5% | 50,809 | All structural indices presented in Table 2 are applicable |
| 7.5% | 13.5% | 48,954 | All structural indices presented in Table 2 are applicable |
Table 5.
Staging design results.
| Parameter | Stage 1 | Stage 2 | Fairing | Payload |
|---|---|---|---|---|
| Total mass (kg) | 46,500 | 5,377 | 300 | 500 |
| Propellant mass (kg) | 42,500 | 4,700 | ||
| Structural mass (kg) | 4,000 | 677 | ||
| Structural index | 8.6% | 12.6% | ||
| Thrust (Vac., tonf) | 78.65 | 3.06 | ||
| Isp (Vac., s) | 299.8 | 360 | ||
| Combustion time (s) | 163.9 | 553.1 | ||
| Velocity increment (m/s) | 4,830 | 5,670 |
Table 6.
Summary of preliminary tank dimensions.
| Parameter | Stage 1 Ox | Stage 1 Fuel | Stage 2 Ox | Stage 2 Fuel |
|---|---|---|---|---|
| Tank volume, m³ | 28.3 | 17.2 | 3.6 | 2.9 |
| Diameter, m | 2.0 | 2.0 | 2.0 | 2.0 |
| Dome height, m | 0.5 | 0.5 | 0.5 | 0.5 |
| Cylinder length, m | 8.46 | 4.98 | 0.62 | 0.91 |
Table 7.
SmallSat-dedicated launch vehicle station.
| Stages | Component* | Station (m) | Length (m) | |
|---|---|---|---|---|
| Start | End | |||
| Fairing | PLF-cone | 0.0 | 1.73 | 1.73 |
| PLF-cylinder | 1.73 | 4.73 | 3.00 | |
| PLF-frustum | 4.73 | 5.60 | 0.87 | |
| Stage 2 | OT FWD skirt | 5.60 | 6.08 | 0.475 |
| OT cylinder | 6.08 | 6.70 | 0.62 | |
| FT cylinder | 6.70 | 7.61 | 0.91 | |
| FT AFT skirt | 7.61 | 8.08 | 0.475 | |
| Stage 1 | Interstage | 8.08 | 10.78 | 2.70 |
| OT FWD skirt | 10.78 | 11.28 | 0.5 | |
| OT cylinder | 11.28 | 19.78 | 8.5 | |
| FT cylinder | 19.78 | 24.79 | 5.01 | |
| AFT fuselage-cone | 24.79 | 25.72 | 0.93 | |
| AFT fuselage | 25.72 | 27.87 | 2.15 | |
*PLF: Payload Fairing, OT: Oxidizer Tank, FT: Fuel Tank, FWD: Forward, AFT: After.
Table 8.
Material and reinforcement type of each load-bearing component.
| Stage | Component | Material | Stiffening |
|---|---|---|---|
| Fairing | Fairing | CFRP | Sandwich |
| Stage 2 | OT FWD Skirt | AL2024 | Orthogrid |
| OT upper dome | AL2195 | Isotropic | |
| OT Cylinder | AL2195 | Orthogrid | |
| OT lower dome | AL2195 | Isotropic | |
| FT Cylinder | AL2195 | Orthogrid | |
| FT lower dome | AL2195 | Isotropic | |
| FT AFT skirt | AL2024 | Orthogrid | |
| Support frame | Stainless 17-4PH | Isotropic | |
| Stage 1 | Interstage | CFRP | Isotropic |
| OT FWD skirt | AL2024 | Orthogrid | |
| OT upper dome | AL2195 | Isotropic | |
| OT cylinder | AL2195 | Orthogrid | |
| OT lower dome | AL2195 | Isotropic | |
| FT cylinder | AL2195 | Orthogrid | |
| FT lower dome | AL2195 | Isotropic | |
| Aft fuselage | AL2024 | Orthogrid | |
| Support frame | Stainless 17-4PH | Isotropic |
Table 9.
Estimated mass of load- and nonload-bearing structures.
| Stage | Component | Mass [kg] | % of dry mass |
|---|---|---|---|
| Fairing | Load-bearing | 200 | 67 |
| Nonload-bearing | 100 | 33 | |
| Stage 2 | Load-bearing | 277 | 40.9 |
| Nonload-bearing | 290 | 42.8 | |
| Engine | 110 | 16.3 | |
| Stage 1 | Load-bearing | 1,057 | 26.4 |
| Nonload-bearing | 2,020 | 50.5 | |
| Engine | 923 | 23.1 |
Table 10.
Design variables, initial guidance profiles, and bounds for trajectory optimization.
| Variable/parameter | Symbol | Initial input/reference profile | Bounds [lower, upper] |
|---|---|---|---|
| Payload mass | mpl | 500 kg | [400, 600,] kg |
| Pitch-over start time | tpo | 13 s | [10, 20] s |
| Gravity-turn start time | tgt_start | 19 s | [15, 30] s |
| Gravity-turn end time | tgt_end | 109 s | [89, 129] s |
| Pitch-rate after gravity turn | gt | −0.1 °/s | [−1, 1] °/s |
| Pitch-rate before fairing separation | before_FS | −0.1 °/s | [−1, 1] °/s |
| Terminal pitch angle at SECO | θSECO | −5° | [−90, 90]° |
| Yaw angle during first-stage flight | ψ1 | 170° | Fixed |
| Target yaw angle at SECO | ψ2 | 210° | [−360, 360]° |
| Fairing separation time | tFS | 169.2 s | [165, 180] s |
Table 11.
Constraints applied for trajectory optimization.
| Number | Constraint | Value |
|---|---|---|
| 1 | Initial position | 34.43° (Latitude) 127.536° (Longitude) 0.138 km (Altitude) |
| 2 | Initial velocity | 0 km/s (all velocity components) |
| 3 | Impact point of Stage 1 and fairing | > 1,400 km from launch pad |
| 4 | Launch azimuth angle | 170° |
| 5 | Final orbit | 500 km (Altitude) 0 (Eccentricity) 7.62 km/s (Inertial velocity) 0 km/s (Radial velocity) 97.4° (Inclination, J2000) |
| 6 | End of gravity-turn phase | q < 2.0 kPa |
| 7 | Fairing separation condition | Heat flux density < 1.135 kW/m2 |
Table 12.
Optimized flight sequence and values.
| Events | Time | Key values |
|---|---|---|
| Lift-off | 0 sec | Altitude: 0.138 km |
| Pitch over start | 12.8 sec | Altitude: 0.4 km |
| Gravity turn start | 18.9 sec | Altitude: 0.77 km |
| Mach number = 1 | 56.3 sec | Altitude: 7.58 km |
| Max. dynamic pressure | 68 sec | 28.6 kPa |
| Max. heat flux density | 83 sec | 13,100 kW/m2 |
| Gravity turn end | 125.6 sec | Dynamic Pressure: 2.0 kPa |
| Main engine cut off (MECO) | 163.9 sec | Altitude: 95.6 km |
| Fairing separation | 173.1 sec | Heat Flux: 1.135 kW/m2 Altitude: 112.5 km |
| Second engine cut off (SECO) | 717 sec | Inertial velocity: 7.62 km/s Altitude: 500 km Inclination: 97.4° Eccentricity: 0 |
Table 13.
Mass estimation results.
| Stage | Component | Mass (kg) |
|---|---|---|
| Stage 1 | FWD skirt and interstage | 141.6 |
| Oxidizer tank | 459.7 | |
| Fuel tank | 274 | |
| Aft fuselage | 163.6 | |
| Engine support frame | 69 | |
| Total mass of load-bearing structure | 1,108 | |
| Nonload-bearing structure mass (incl. engine) | 2,943 | |
| Stage 1 total | 4,051 | |
| Stage 2 | FWD skirt | 19.8 |
| Oxidizer tank | 101.15 | |
| Fuel tank | 76.05 | |
| Aft fuselage | 11.57 | |
| Engine support frame | 39.4 | |
| Total mass of load-bearing structure | 248 | |
| Nonload-bearing structure mass (incl. engine) | 400 | |
| Stage 2 total | 648 | |
| Fairing | Fairing | 300 |
| Total dry mass of the small launch vehicle (SLV) | 4,999 | |
Disclaimer/Publisher’s Note: The statements, opinions and data contained in all publications are solely those of the individual author(s) and contributor(s) and not of MDPI and/or the editor(s). MDPI and/or the editor(s) disclaim responsibility for any injury to people or property resulting from any ideas, methods, instructions or products referred to in the content. |
© 2026 by the authors. Licensee MDPI, Basel, Switzerland. This article is an open access article distributed under the terms and conditions of the Creative Commons Attribution (CC BY) license (http://creativecommons.org/licenses/by/4.0/).
Copyright: This open access article is published under a Creative Commons CC BY 4.0 license, which permit the free download, distribution, and reuse, provided that the author and preprint are cited in any reuse.


