

Submitted:
03 August 2026
Posted:
04 August 2026
You are already at the latest version
Abstract
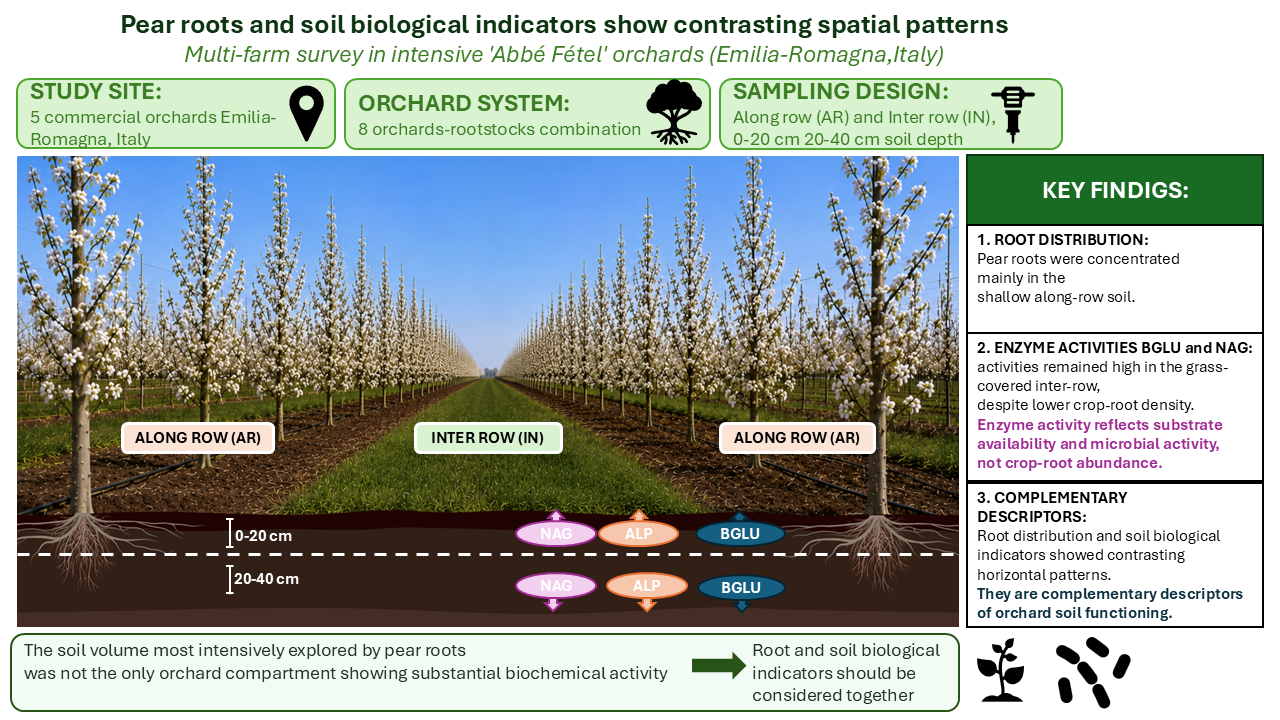
Understanding the spatial relationship between crop roots and soil biological functioning is essential for improving orchard management. This study investigated the spatial distribution of pear roots and selected soil biological indicators in five intensive ‘Abbé Fétel’ pear orchards in Emilia-Romagna, Italy, representing eight orchard–rootstock combinations. Soil cores were collected from along-row and inter-row positions at two depths (0–20 and 20–40 cm). Root length density (RLD), soil organic matter (SOM), microbial biomass carbon (MBC), soil basal respiration (SBR), and the activities of alkaline phosphatase (ALP), β-glucosidase (BGLU), and N-acetyl-β-D-glucosaminidase (NAG) were determined. Linear mixed-effects models showed that RLD was significantly higher along the tree row and in the upper soil layer, indicating that pear roots were concentrated within the shallow along-row soil. Soil depth was the main factor influencing all biological indicators. SOM was higher along-row, whereas MBC varied mainly with depth. In contrast, BGLU and NAG activities were higher in the grass-covered inter-row despite lower pear-root density, while SBR showed the highest values in the shallow along-row soil. These findings demonstrate that soil biological indicators do not necessarily mirror crop-root distribution. Instead, belowground functioning in intensive pear orchards reflects the combined influence of crop roots and inter-row vegetation, highlighting the ecological importance of both orchard compartments when assessing soil functioning.
Keywords:
Pyrus communis L.
; intensive orchard
; root spatial distribution
; soil biological indicators
; soil enzyme activities
; orchard-floor management
1. Introduction
Pear (Pyrus communis L.) is an economically important fruit crop in Italy, with production concentrated mainly in the northern regions and particularly in Emilia-Romagna [1]. Modern production systems frequently rely on high-density orchards grafted onto vigour-controlling clonal quince rootstocks, which promote early bearing and facilitate canopy management [2,3,4,5]. Intensification, however, affects not only aboveground tree architecture but also the spatial organisation of the soil environment, as the along-row strip and the inter-row may be subjected to different management practices.
In many intensive Italian orchard systems, weed control is concentrated along the tree row, whereas the inter-row is maintained under grass cover and periodically mown. Although this arrangement is not universal, such spatially differentiated management may create contrasting zones in terms of vegetation-derived organic inputs, soil disturbance, resource availability, and biological activity [6,7].
Root system distribution determines the soil volume effectively explored by the crop for water and nutrient uptake and therefore represents a key component of tree functioning. Roots can modify their spatial distribution in response to heterogeneous resource availability [8,9]. In orchards, root spatial patterns may also be shaped by irrigation regime, localised water and nutrient supply, and spatial variation in soil physical and chemical conditions [10,11].
Studies conducted in several orchards have shown that rootstock genotype can influence root abundance and spatial distribution, with dwarfing rootstocks and interstems being associated with lower root length density or fewer fine roots than more vigorous rootstocks, while a substantial proportion of tree roots may also occur in the upper soil layers under orchard conditions [12,13,14,15]. Machinery traffic can generate spatially heterogeneous soil compaction within orchard alleys [16,17], while evidence from peach orchards indicates that compacted soil conditions may alter root distribution [18].
Consequently, characterising root distribution across soil depth and between along-row and inter-row zones is essential for identifying the soil volume effectively explored by crop roots before examining its relationship with soil biological functioning.
Fine roots influence soil microbial communities through rhizodeposition, root turnover and nutrient uptake, creating biologically active zones in the rhizosphere. In turn, soil biological processes contribute to nutrient cycling, organic matter transformation and other mechanisms that may affect root growth and distribution. Consequently, root systems and soil biological functioning are closely interconnected components of belowground ecosystems. However, in orchard systems, soil biological activity may also be influenced by inter-row vegetation and management practices, potentially generating spatial patterns that do not coincide with crop-root distribution. Whether root distribution and soil biological indicators exhibit similar spatial patterns within intensive orchard systems therefore remains unclear.
Soil biological functioning is commonly assessed through indicators such as microbial biomass carbon, basal respiration, and extracellular enzyme activities, which provide complementary information on microbial biomass, soil metabolic activity, organic matter transformation, and responses to plant-derived inputs and soil management [19,20,21]. In particular, β-glucosidase, N-acetyl-β-D-glucosaminidase, and alkaline phosphatase are involved in the transformation of substrates associated with the carbon, nitrogen, and phosphorus cycles, respectively, and are widely used as indicators of soil biochemical functioning [22,23,24,25]. Microbial biomass and enzyme activities commonly vary with soil depth and tend to decline below the surface horizons, in parallel with changes in organic substrate availability, plant-derived inputs and oxygen deficiency [26,27,28]. Their horizontal distribution may also respond to orchard-floor management, vegetation cover, and spatial variation in organic substrates and soil physical conditions [27,29]. However, these responses do not necessarily imply a direct spatial correspondence with the roots of the fruit crop, because soil biological activity in the inter-row may also be shaped by herbaceous vegetation and residue-derived organic inputs [30,31].
Although previous studies have examined fruit-tree root traits, soil enzyme activities, or biological soil indicators under specific orchard management treatments [32,33], most of them have focused either on root distribution or on soil biological responses separately, or have evaluated them under controlled or treatment-based conditions. As a result, limited information is available on whether the spatial patterns of crop-root abundance and soil biological indicators coincide within the heterogeneous structure of commercial intensive orchards, where along-row and inter-row zones differ in vegetation cover, soil management, tree proximity, and localised inputs. This knowledge gap is particularly relevant for European pear orchards, where the spatial relationship between pear-root distribution and soil biological indicators has not yet been evaluated under real multi-farm conditions. The distinction between crop-root distribution and soil biological indicators is relevant because crop-root distribution is often used to identify the main soil volume explored by the tree, whereas microbial and enzymatic indicators may also respond to additional biological inputs and management-driven heterogeneity.
We therefore conducted a survey in five intensive ‘Abbé Fétel’ pear orchards in Emilia-Romagna, Italy, encompassing eight orchard-rootstock combinations, to investigate whether the spatial distribution of selected soil biological indicators corresponded to the soil volume explored by pear roots.
Specifically, our objectives were to: (i) characterise root spatial distribution between along-row and inter-row zones and across soil depth; (ii) assess the spatial distribution of soil organic matter, microbial biomass and respiration, and enzyme activities associated with carbon, nitrogen, and phosphorus cycling; and (iii) evaluate the degree of spatial correspondence between pear-root abundance and soil biological indicators across the main orchard compartments.
2. Materials and Methods
The study was conducted as a multi-farm field survey in five commercial ‘Abbé Fétel’ pear (Pyrus communis L.) orchards in Emilia-Romagna (Northern Italy) to characterise spatial gradients in root distribution and soil biological indicators. All orchards were planted with ‘Abbé Fétel’ pear trees grafted onto different rootstocks. The surveyed farms were coded as follows: AL (quince rootstocks MC, MH and MA), BE (quince rootstock SYDO and pear rootstock FAROLD40®), GA (quince rootstock BA29), PE (quince rootstock ADAMS), and TO (quince rootstock SYDO). Orchards differed in planting geometry and age (Table 1), with inter-row spacing ranging from 3.5 to 4 m, along-row spacing from 0.5 to 2 m, and orchard age from 9 to 17 years. Across all farms, the along-row strip was managed through shallow soil tillage and herbicide-based weed control, whereas the inter-row was maintained under permanent grass cover managed by mowing and/or weed-control practices.
2.1 Soil Sampling and Root Analysis
Field sampling was carried out during summer 2022 across five commercial ‘Abbé Fétel’ pear orchards. Soil cores were collected using a hand auger (20 cm length, 45 mm diameter) at two depths (0-20 and 20-40 cm) at four spatial positions per orchard-rootstock combination, including two positions along-row (AR) and two positions in the inter-row (IN), with four replicate trees per combination. Replicate trees represented the experimental units; cores collected at different depths and sampling points within the same tree were treated as repeated observations and accounted for in the statistical analysis by including plant as a random effect. In two orchards (AL and BE), multiple rootstocks were present (three in AL and two in BE) and the same sampling design was applied separately to each rootstock, resulting in a total of eight orchard-rootstock combinations and 256 soil cores. In the inter-row, sampling points were consistently located at 50 and 100 cm from the trunk across all orchard-rootstock combinations. Along-row, sampling distances varied according to the tree spacing along the row, with one sampling point located close to the trunk and the other midway between adjacent trees. For example, along-row samples were collected at 12 and 25 cm from the trunk in orchards with an along-row spacing of 0.5 m, at 25 and 50 cm with an along-row spacing of 1 m, and at 50 and 100 cm with an along-row spacing of 2 m (Figure 1). Accordingly, along-row samples were pooled as a functional tree-row compartment rather than as fixed distances from the trunk. This classification was used to compare the managed tree-row strip with the grass-covered inter-row across orchards with different planting densities.
Each soil core was divided into two subsamples: one was allocated to root analysis and the other to soil physicochemical and biological measurements. The subsample allocated to root analysis was oven-dried at 65 °C for 24-48 h to standardise residual moisture conditions across sites. After determination of soil dry weight, roots were extracted by washing and sieving through 2.0 and 0.71 mm mesh sizes.
During root sorting, pear roots were visually separated from herbaceous roots based on morphological traits. Pear roots were identified by their darker colour, lignified appearance and woody texture, whereas herbaceous roots were generally lighter, finer and non-lignified. Only pear roots were arranged on transparent plastic sheets, scanned, and analysed using WinRhizo® software (Regent Instrument Inc., Canada) to determine total root length (cm). To quantify root distribution, root length density was expressed on a soil dry-mass basis (RLD, cm g⁻¹) and calculated as the ratio between total root length and soil dry weight. A mass-based expression was used because bulk density was not measured systematically for all cores and was expected to vary among orchards, soil depths and sampling positions. This approach avoided deriving volumetric root density values from incomplete bulk-density information. Therefore, in the present study RLD was interpreted as a relative indicator of root abundance and spatial distribution within the sampled soil profile, rather than as a direct estimate of root length per unit soil volume.
The subsample allocated to soil physicochemical and biological measurements was air-dried, sieved to < 2 mm, and analysed for soil organic matter (SOM) content by wet oxidation following the Walkley-Black method [34]. Before microbial biomass carbon and basal respiration measurements, air-dried soil samples were conditioned with water, with the amount added adjusted according to soil texture. Microbial biomass carbon (MBC) was then measured by chloroform fumigation-extraction with 0.5 M K2SO4 [35]. Soil basal respiration (SBR-cum) was assessed as CO2 evolution from conditioned soils incubated in airtight glass containers in the dark for 28 days, with CO2 absorbed in 0.2 N NaOH and the remaining NaOH back-titrated with 0.1 N HCl [36]. Potential extracellular enzyme activities were measured for β-glucosidase (BGLU), alkaline phosphatase (ALP) and N-acetyl-β-D-glucosaminidase (NAG), which are involved in C, P and N cycling, respectively [23,37]. Enzyme assays followed De Bernardi et al. (2025) using the methods of Eivazi and Tabatabai (1977, 1988) and Parham and Deng (2000) for ALP, BGLU and NAG, respectively.
2.2 Statistical Analysis
Statistical analyses were designed to assess depth- and position-related spatial gradients across the surveyed commercial orchards. Because rootstocks were not distributed factorially across sites, orchard-rootstock combination was included as a system-level factor accounting for variability associated with orchard conditions, management, planting design, and rootstock identity. Prior to modelling, the distribution of each response variable was inspected. Due to its strongly right-skewed distribution and the presence of low or near-zero values, root length density (RLD) was transformed prior to statistical analysis using log(RLD + 0.01). The constant was selected as a small value relative to the observed RLD range and was introduced only to allow transformation of zero or near-zero observations, while preserving the relative ordering of samples across positions and depths. This transformation was applied to reduce skewness and improve the suitability of the data for linear mixed modelling. Linear mixed-effects models (LMMs) were fitted separately for each response variable: log-transformed RLD, SBR-cum, MBC, SOM, ALP, BGLU and NAG. Orchard-rootstock combination, sampling position (along-row or inter-row), soil depth (0-20 or 20-40 cm) and the sampling position × soil depth interaction were included as fixed effects, while plant was included as a random effect to account for repeated observations within individual trees. Accordingly, orchard-rootstock combination was used to account for system-level heterogeneity rather than to infer rootstock-specific effects. A secondary analysis restricted to inter-row samples was performed to examine lateral variation between sampling distances. For each response variable, orchard-rootstock combination, distance from the trunk (50 or 100 cm), soil depth (0-20 or 20-40 cm) and the distance × soil depth interaction were included as fixed effects, while plant was retained as a random effect. All LMMs were fitted in JMP 14.0 (SAS Institute, Cary, NC, USA) using restricted maximum likelihood (REML) estimation. Fixed effects were evaluated using F tests provided by the JMP mixed-model output, and variance components were inspected to assess the contribution of the random plant effect. Model adequacy was assessed by visual inspection of residual-versus-predicted plots, residuals by row order, residual histograms and normal quantile plots of residuals. These diagnostics were used to evaluate major deviations from normality, heteroscedasticity and influential observations. For factors with two levels, fixed-effect tests were used to assess differences directly; therefore, no multiple-comparison adjustment was required for these main effects. When significant interactions were detected, least-squares means were inspected to support interpretation of the interaction patterns. No post-hoc comparisons among orchard-rootstock combinations were interpreted, because this factor was included to account for system-level variability rather than to compare individual orchards or rootstocks. Pairwise correlations among root and soil biological variables were calculated as an exploratory measure of association. Principal component analysis (PCA) was performed on the correlation matrix including log-transformed RLD, soil basal respiration, microbial biomass carbon, soil organic matter, alkaline phosphatase, β-glucosidase and N-acetyl-β-D-glucosaminidase, to summarise multivariate relationships among root distribution and soil biological indicators. Because PCA was performed on the correlation matrix, variables were centred and scaled to unit variance before ordination.
3. Results
3.1. Root Spatial Distribution
The orchard-rootstock combination significantly affected RLD in the linear mixed model fitted to log(RLD + 0.01) (p < 0.0001), reflecting substantial system-level variability among the surveyed commercial orchards. After accounting for this variability and for repeated observations within individual trees, RLD was significantly affected by sampling position (p < 0.0001) and soil depth (p = 0.0006), whereas the position × depth interaction was not significant (p = 0.4045). On the original scale, the highest mean RLD value was observed in the shallow along-row soil, reaching 0.324 ± 0.050 cm g⁻¹ at 0-20 cm, compared with 0.162 ± 0.017 cm g⁻¹ at 20-40 cm (Figure 2A). In the inter-row, RLD averaged 0.133 ± 0.017 cm g⁻¹ at 0-20 cm and 0.097 ± 0.013 cm g⁻¹ at 20-40 cm. On the original scale, mean RLD was approximately twice as high along-row as in the inter-row at 0-20 cm and remained higher at 20-40 cm. The absence of a significant position × depth interaction indicated that this difference was broadly maintained across both soil layers. The secondary analysis restricted to the inter-row revealed an additional lateral gradient. RLD was significantly greater at 50 than at 100 cm from the trunk (p < 0.0001) and remained significantly affected by soil depth (p = 0.0113), whereas the distance × depth interaction was not significant (p = 0.6278). At 0-20 cm, RLD declined from 0.190 ± 0.028 cm g⁻¹ at 50 cm to 0.075 ± 0.016 cm g⁻¹ at 100 cm. At 20-40 cm, the corresponding values decreased from 0.138 ± 0.021 to 0.057 ± 0.012 cm g⁻¹ (Figure 2B). At both soil depths, RLD at 100 cm from the trunk was approximately 60% lower than at 50 cm. Overall, pear-root occupation was markedly concentrated within the shallow along-row portion of the sampled profile and decreased substantially with lateral distance into the inter-row.
3.2. Spatial Patterns of Soil Biological Indicators
The orchard-rootstock combination significantly affected all measured soil properties and biological indicators (p < 0.0001), confirming substantial system-level variability among the surveyed orchards. Soil depth was the most consistent spatial factor across the dataset. SOM, MBC, SBR-cum, ALP, BGLU and NAG were all higher in the 0-20 cm layer than at 20-40 cm (p < 0.0001), indicating a coherent vertical decline in soil organic, microbial and enzymatic indicators.
SOM was also significantly affected by sampling position (p = 0.0272), with higher estimated values along-row than in the inter-row, whereas the position × depth interaction was not significant (p = 0.7280). MBC did not differ significantly between sampling positions (p = 0.1395) and showed no significant position × depth interaction (p = 0.2026), indicating that its spatial pattern was mainly structured by soil depth.
SBR-cum likewise showed no significant overall effect of sampling position (p = 0.2581), but displayed a significant position × depth interaction (p = 0.0002). This interaction indicated that the spatial pattern of respiration depended on soil depth: the highest SBR-cum value occurred in the along-row × 0-20 cm combination, whereas the decline from 0-20 to 20-40 cm was more pronounced along-row than in the inter-row.
All three potential enzyme activities were significantly affected by soil depth (p < 0.0001). ALP showed no significant overall difference between along-row and inter-row positions (p = 0.7308), but the position × depth interaction was significant (p = 0.0036), reflecting a stronger decline with depth along-row.
In contrast, BGLU and NAG showed significant position effects, with higher estimated potential activities in the inter-row than along-row (p < 0.0001 and p = 0.0065, respectively). The absence of significant position × depth interactions for these enzymes (p = 0.4795 for BGLU and p = 0.8228 for NAG) indicated that their higher inter-row activities were broadly consistent across both soil depths.
The heatmap of standardised values provided an integrated visual summary of these spatial patterns (Figure 3). Most variables showed positive standardised values in the 0-20 cm layer and negative values at 20-40 cm, confirming the dominant vertical gradient. Horizontally, RLD and SOM were comparatively higher along-row, whereas BGLU and NAG were comparatively higher in the inter-row, with the strongest positive standardised values occurring in the surface layer. Thus, the standardised overview highlighted a common surface concentration across variables, together with contrasting horizontal patterns between pear-root distribution and selected enzyme activities.
3.3. Multivariate Relationships Among Roots and Soil Indicators
The PCA performed on the correlation matrix provided a descriptive summary of the joint variation among root and soil biological variables (Figure 4A-B). The first two principal components explained 62.9% of the total variance, with PC1 accounting for 48.6% and PC2 for 14.3%. PC1 had positive loadings for all variables and was visually associated with the separation between surface and deeper soil samples, with 0-20 cm samples generally tending toward higher PC1 scores. This pattern was consistent with the common vertical increase in RLD, SOM, MBC, SBR-cum and potential enzyme activities in the surface layer. PC2 described a secondary contrast among variables, separating SOM and MBC from part of the biochemical indicators and RLD. This axis did not correspond clearly to either soil depth or along-row/inter-row position, indicating that the secondary multivariate structure was not directly explained by the main spatial factors considered in the study.
Overall, the PCA identified soil depth as the clearest spatial gradient in the multivariate dataset, whereas horizontal differences were more variable and indicator-specific. RLD showed moderate positive correlations with SBR-cum (r = 0.48) and NAG (r = 0.42), whereas its correlation with MBC was very weak (r = 0.09). Moderate positive correlations were also observed among some soil biological indicators, particularly between SBR-cum and NAG (r = 0.55), BGLU and NAG (r = 0.58), and ALP and BGLU (r = 0.54).
4. Discussion
This multi-farm survey revealed a clear spatial mismatch between pear-root abundance and selected soil biological indicators in intensive ‘Abbé Fétel’ orchards. Pear roots were concentrated predominantly in the shallow along-row soil and declined both with depth and with lateral distance into the inter-row, whereas potential β-glucosidase and N-acetyl-β-D-glucosaminidase activities remained comparatively high in the inter-row despite lower pear-root density. At the same time, roots and soil biological indicators shared a strong vertical gradient, with higher values generally occurring in the 0-20 cm layer. The concentration of pear roots in the upper soil layers is consistent with observations from several intensive fruit-tree systems, particularly in high-density orchards or in systems grafted onto vigour-controlling rootstocks [12,13,14,15].
Differences among orchard-rootstock combinations reflected system-level variability, because rootstock identity was associated with site-specific soil conditions, orchard age, planting density, irrigation history, and management. This factor was therefore used to account for heterogeneity among orchards rather than to infer rootstock-specific responses.
The higher RLD observed along-row was associated with the tree-row environment, where several features typical of intensive orchard systems may coexist, including close tree spacing, localised inputs and spatially differentiated soil management. In many intensive orchards, the along-row strip is the zone most directly affected by irrigation, fertilisation, organic amendments and weed control, all of which may contribute to spatial resource gradients close to the tree row [41,42,43,44].
In this context, inter-row RLD was approximately 60% lower at 100 cm than at 50 cm from the trunk, indicating that the soil volume effectively explored by pear roots was limited relative to the overall geometry of the orchard. As already shown by the univariate and multivariate results (Figure 3, Figure 4), soil depth remained the dominant spatial structure for all biological indicators, consistent with the higher availability of organic matter, plant residues and root-derived substrates typically found in surface horizons.
The moderate correlations between RLD and SBR-cum or NAG (r = 0.48 and r = 0.42, respectively) were consistent with their shared vertical stratification. However, the contrasting along-row and inter-row patterns showed that these associations did not translate into a corresponding horizontal distribution [26,27,28,45].
These contrasting horizontal patterns indicate that crop-root abundance alone does not fully describe the spatial organisation of soil biochemical functioning within intensive orchards.
RLD was concentrated in the shallow along-row soil, whereas BGLU and NAG activities were higher in the inter-row, showing that crop-root density alone did not capture the horizontal pattern of soil biochemical functioning. SOM was also higher along-row, and SBR-cum reached its highest estimated value in the along-row × 0-20 cm combination, consistent with the influence of localised organic inputs and tree-row management on the surface soil organic pool [42,46]. Because SBR-cum showed a significant position × depth interaction rather than an overall position effect, this response was specific to the shallow along-row soil and did not represent a general increase in respiration throughout the tree row.
The inter-row therefore represented a biologically relevant orchard compartment despite its lower pear-root density. Higher potential BGLU and NAG activities in this zone were consistent with the influence of grass cover and recurrent vegetation-derived inputs reported in other orchard systems [30,31,47,48]. The respective contributions of grass cover, herbaceous roots, and vegetation-derived residues could not be separated from those of other spatially varying factors, including soil moisture, compaction, microclimatic conditions, substrate quality, and historical management, because grass-cover biomass, herbaceous root biomass, and residue inputs were not quantified in this survey.
Overall, the along-row and inter-row functioned as distinct belowground compartments. The along-row was characterised by higher pear-root abundance together with localised management inputs, whereas the grass-covered inter-row supported substantial biochemical activity despite lower crop-root density, highlighting the functional complementarity of these two orchard compartments.
The absence of a significant position effect on MBC, together with higher BGLU and NAG activities in the inter-row, indicates that the horizontal contrast involved specific enzymatic functions or substrate availability rather than a general increase in microbial biomass. This pattern is consistent with the view that extracellular enzymes respond not only to crop-root presence, but also to the quality and spatial distribution of organic substrates and to the functional composition of the microbial community [20,21,22].
Unlike BGLU and NAG, ALP did not show a simple horizontal pattern, as no overall position effect was detected while the position × depth interaction was significant. This indicates that phosphatase activity varied according to the combination of sampling zone and soil depth rather than through a consistent along-row/inter-row contrast. Phosphatase activity can be regulated by several factors, including phosphorus availability, organic matter content, pH, and microbial activity, while P dynamics may be particularly complex in subalkaline or calcareous soils [20,49,50].
Taken together, these findings indicate that pear-root distribution and soil biological indicators should be interpreted as complementary rather than interchangeable descriptors of belowground functioning. Within the sampled profile, the along-row represented the main soil volume occupied by pear roots, whereas the inter-row retained substantial biochemical activity despite lower crop-root density. Future studies should now determine whether orchard-floor management can modify this spatial relationship and promote broader lateral or vertical root exploration.
5. Conclusions
This multi-farm survey demonstrated that pear-root abundance and selected soil biological indicators were not spatially equivalent within intensive ‘Abbé Fétel’ orchards.
Pear roots were concentrated predominantly in the shallow along-row soil, whereas potential β-glucosidase and N-acetyl-β-D-glucosaminidase activities remained comparatively high in the grass-covered inter-row despite lower crop-root density. Thus, roots and soil biological indicators shared a strong vertical gradient but displayed contrasting horizontal patterns. The soil volume most intensively explored by pear roots therefore did not fully coincide with the horizontal distribution of soil biochemical activity.
Root distribution and soil biological indicators should therefore be considered complementary rather than interchangeable descriptors of orchard soil functioning, and both the along-row and the inter-row should be explicitly considered when assessing belowground spatial heterogeneity in intensive fruit systems.
Data Availability Statement
The raw data supporting the conclusions of this article will be made available by the authors on request.
Acknowledgments
We thank the technical staff of ASTRA Innovazione for assistance with soil core sampling.
Conflicts of Interest
Author Monica Guizzardiwas employed by the company Apoconerpo, Via Bruno Tosarelli 155, Bologna, Italy. The remaining authors declare that the research was conducted in the absence of any commercial or financial relationships that could be construed as a potential conflict of interest.
References
- FAOSTAT. World Food and Agriculture – Statistical Yearbook 2022; FAO, 2022. [Google Scholar]
- Webster, A.D. A Brief Review of Pear Rootstock Development. 1998. [Google Scholar] [CrossRef]
- Kurt, T.; Öztürk, A.; Faizi, Z.A.; Öztürk, B. Impact of Quince Clonal Rootstocks on Yield and Fruit Quality Characteristics of European Pear (Pyrus Communis L.) Cultivars. Erwerbs-Obstbau 2023, 65, 1321–1329. [Google Scholar] [CrossRef]
- Wertheim, S.J. Rootstocks for European Pear: A Review. Acta Hortic. 2002, 596, 299–309. [Google Scholar] [CrossRef]
- Musacchi, S.; Iglesias, I.; Neri, D. Training Systems and Sustainable Orchard Management for European Pear (Pyrus communis L.) in the Mediterranean Area: A Review. Agronomy 2021, 11. [Google Scholar] [CrossRef]
- Mia, M.J.; Massetani, F.; Murri, G.; Facchi, J.; Monaci, E.; Amadio, L.; Neri, D. Integrated Weed Management in High Density Fruit Orchards. Agronomy 2020, 10. [Google Scholar] [CrossRef]
- Lodolini, E.M.; Palmieri, N.; de Iudicibus, A.; Lucchese, P.G.; Zucchini, M.; Giorgi, V.; Crescenzi, S.; Mezrioui, K.; Neri, D.; Ciaccia, C.; et al. Differentiated In-Row Soil Management in a High-Density Olive Orchard: Effects on Weed Control, Tree Growth and Yield, and Economic and Environmental Sustainability. Agronomy 2024, 14. [Google Scholar] [CrossRef]
- Valverde-Barrantes, O.J.; Smemo, K.A.; Feinstein, L.M.; Kershner, M.W.; Blackwood, C.B. The Distribution of Below-Ground Traits Is Explained by Intrinsic Species Differences and Intraspecific Plasticity in Response to Root Neighbours. J. Ecol. 2013, 101, 933–942. [Google Scholar] [CrossRef]
- Hodge, A. The Plastic Plant: Root Responses to Heterogeneous Supplies of Nutrients. New Phytol. 2004, 162, 9–24. [Google Scholar] [CrossRef]
- Wu, Y.; Zhao, Z.; Zhao, F.; Cheng, X.; Zhao, P.; Liu, S. Response of Pear Trees’ (Pyrus Bretschneideri ‘Sinkiangensis’) Fine Roots to a Soil Water Regime of Regulated Deficit Irrigation. Agronomy 2021, 11. [Google Scholar] [CrossRef]
- Surikova, V.; Rubauskis, E.; Berlands, V.; Kārkliņš, A.; Skrivele, M. Apple-Tree Root Development and Distribution Influenced by Soil Chemical Properties, Fertigation and Mulching. Acta Hortic. 2011, 922, 319–326. [Google Scholar] [CrossRef]
- Ma, L.; Hou, C.W.; Zhang, Z.; Li, H.; De, L.; Han, G.; Wang, Y.; Han, Z.H. Seasonal Growth and Spatial Distribution of Apple Tree Roots on Different Rootstocks or Interstems. J. Am. Soc. Hortic. Sci. 2013, 138, 79–87. [Google Scholar] [CrossRef]
- Sharma, D.D.; Chauhan, J.S. Effect of Different Rootstocks on Root Distribution of Apple. Acta Hortic. 2005, 696, 167–171. [Google Scholar] [CrossRef]
- Rufato, L.; Machado, B.D.; Magro, M.; Souza, D.S.; Kretzschmar, A.A.; Sander, G.F.; Marangoni, B.; Hipólito, J.S. Root Distribution, Vigor and Productivity of European Pear Grafted on Quince Rootstocks. Acta Hortic. 2018, 1228, 279–283. [Google Scholar] [CrossRef]
- An, H.; Luo, F.; Wu, T.; Wang, Y.; Xu, X.; Zhang, X.; Han, Z. Dwarfing Effect of Apple Rootstocks Is Intimately Associated with Low Number of Fine Roots. HortScience 2017, 52, 503–512. [Google Scholar] [CrossRef]
- Tolón-Becerra, A.; Botta, G.F.; Lastra-Bravo, X.; Tourn, M.; Rivero, D. Subsoil Compaction from Tractor Traffic in an Olive (Olea Europea L.) Grove in Almería, Spain. Soil Use Manag. 2012, 28, 606–613. [Google Scholar] [CrossRef]
- Botta, G.F.; Rivero, D.; Tourn, M.; Melcon, F.B.; Pozzolo, O.; Nardon, G.; Balbuena, R.; Becerra, A.T.; Rosatto, H.; Stadler, S. Soil Compaction Produced by Tractor with Radial and Cross-Ply Tyres in Two Tillage Regimes. Soil Tillage Res. 2008, 101, 44–51. [Google Scholar] [CrossRef]
- Petry, H.B.; Mazurana, M.; Marodin, G.A.B.; Levien, R.; Anghinoni, I.; Gianello, C.; Schwarz, S.F. Root Distribution of Peach Rootstocks Affected by Soil Compaction and Acidity. Rev. Bras. Cienc. Solo 2016, 40, 0150135. [Google Scholar] [CrossRef]
- Semenov, M. V.; Zhelezova, A.D.; Ksenofontova, N.A.; Ivanova, E.A.; Nikitin, D.A.; Semenov, V.M. Microbiological Indicators for Assessing the Effects of Agricultural Practices on Soil Health: A Review. Agronomy 2025, 15, 335. [Google Scholar] [CrossRef]
- Schloter, M.; Nannipieri, P.; Sørensen, S.J.; van Elsas, J.D. Microbial Indicators for Soil Quality. Biol. Fertil. Soils 2018, 54, 1–10. [Google Scholar] [CrossRef]
- Bünemann, E.K.; Bongiorno, G.; Bai, Z.; Creamer, R.E.; De Deyn, G.; de Goede, R.; Fleskens, L.; Geissen, V.; Kuyper, T.W.; Mäder, P.; et al. Soil Quality – A Critical Review. Soil Biol. Biochem. 2018, 120, 105–125. [Google Scholar] [CrossRef]
- Allison, S.D.; Vitousek, P.M. Responses of Extracellular Enzymes to Simple and Complex Nutrient Inputs. Soil Biol. Biochem. 2005, 37, 937–944. [Google Scholar] [CrossRef]
- Ekenler, M.; Tabatabai, M.A. β-Glucosaminidase Activity of Soils: Effect of Cropping Systems and Its Relationship to Nitrogen Mineralization. Biol. Fertil. Soils 2002, 36, 367–376. [Google Scholar] [CrossRef]
- Lal, R. Soil Enzymes. In Encyclopedia of Soil Science, Third Edition; CRC Press, 2017; pp. 2100–2107. ISBN 9781000031416. [Google Scholar]
- Srinivasarao, C.; Kundu, S.; Grover, M.; Manjunath, M.; Kasbe Sudhanshu, S.; Patel, J.J.; Singh, S.R.; Singh, R.P.; Patel, M.M.; Arunachalam, A. Effect of Long Term Application of Organic and Inorganic Fertilizers on Soil Microbial Activities in Semi-Arid and Sub-Humid Rainfed Agricultural Systems. Trop. Ecol. 2018, 59, 99–108. [Google Scholar]
- Blume, E.; Bischoff, M.; Reichert, J.M.; Moorman, T.; Konopka, A.; Turco, R.F. Surface and Subsurface Microbial Biomass, Community Structure and Metabolic Activity as a Function of Soil Depth and Season; 2002; Vol. 20. [Google Scholar]
- Meyer, A.H.; Wooldridge, J.; Dames, J.F. Variation in Urease and β-Glucosidase Activities with Soil Depth and Root Density in a Cripp’s Pink/M7 Apple Orchard under Conventional and Organic Management. S. Afr. J. Plant Soil 2015, 32, 227–234. [Google Scholar] [CrossRef]
- Piotrowska-Długosz, A.; Długosz, J.; Frąc, M.; Gryta, A.; Breza-Boruta, B. Enzymatic Activity and Functional Diversity of Soil Microorganisms along the Soil Profile – A Matter of Soil Depth and Soil-Forming Processes. Geoderma 2022, 416. [Google Scholar] [CrossRef]
- De Bernardi, A.; Marini, E.; Tagliabue, F.; Brunetti, G.; Casucci, C.; Rossa, Ü.B.; Silvestroni, O.; Vischetti, C. Organic Matter Evolution and Microbial Activity in a Vineyard Soil after Four Years of Inter-Row Cover Crop Management. Appl. Soil Ecol. 2025, 206, 105868. [Google Scholar] [CrossRef]
- Wang, N.; Li, L.; Gou, M.; Jian, Z.; Hu, J.; Chen, H.; Xiao, W.; Liu, C. Living Grass Mulching Improves Soil Enzyme Activities through Enhanced Available Nutrients in Citrus Orchards in Subtropical China. Front. Plant Sci. 2022, 13. [Google Scholar] [CrossRef] [PubMed]
- Zheng, W.; Gong, Q.; Zhao, Z.; Liu, J.; Zhai, B.; Wang, Z.; Li, Z. Changes in the Soil Bacterial Community Structure and Enzyme Activities after Intercrop Mulch with Cover Crop for Eight Years in an Orchard. Eur. J. Soil Biol. 2018, 86, 34–41. [Google Scholar] [CrossRef]
- Poblete, H.; Ortega-Blu, R.; Martínez, M.M.; Fincheira, P. Integrated Nutrient Management as a Sustainable Strategy to Recover a Decayed Pear (Pyrus Communis) Orchard. Sci. Agropecu. 2021, 12, 319–327. [Google Scholar] [CrossRef]
- He, Z.; Li, J.; Yang, L.; Yan, L.; Chen, B.; Shen, X.; Chai, Z. Effects of Bacterial Fertilizer and Green Manure on Soil Enzyme Activity and Root Characteristics in Korla Fragrant Pear Orchard. Front. Microbiol. 2025, 16. [Google Scholar] [CrossRef] [PubMed]
- Walkley, A.; Black, I.A. An Examination of the Degtjareff Method for Determining Soil Organic Matter, and a Proposed Modification of the Chromic Acid Titration Method. Soil Sci. 1934, 37, 29–38. [Google Scholar] [CrossRef]
- Vance, E.D.; Brookes, P.C.; Jenkinson, D.S. An Extraction Method for Measuring Soil Microbial Biomass C. Soil Biol. Biochem. 1987, 19, 703–707. [Google Scholar] [CrossRef]
- Dumontet, S.; Mathur, S.P. Evaluation of respiration-based methods for measuring microbial biomass in metal-contaminated acidic mineral and organic soils; 1989. [Google Scholar]
- Brzezińska, M.; Lipiec, J.; Frąc, M.; Oszust, K.; Szarlip, P.; Turski, M. Quantitative Interactions between Total and Specific Enzyme Activities and C and N Contents in Earthworm-Affected Pear Orchard Soil. Land Degrad. Dev. 2018, 29, 3379–3389. [Google Scholar] [CrossRef]
- Eivazi, F.; Tabatabai, M.A. Glucosidases and Galactosidases in Soils. Soil Biol. Biochem. 1988, 20, 601–606. [Google Scholar] [CrossRef]
- Eivazi, F.; Tabatabai, M.A. Phosphatases in Soils. Soil Biol. Biochem. 1977, 9, 167–172. [Google Scholar] [CrossRef]
- Parham, J.A.; Deng, S.P. Detection, Quantification and Characterization of β-Glucosaminidase Activity in Soil. Soil Biol. Biochem. 2000, 32, 1183–1190. [Google Scholar] [CrossRef]
- Palese, A.M.; Nuzzo, V.; Dichio, B.; Celano, G.; Romano, M.; Xiloyannis, C. The Influence of Soil Water Content on Root Density in Young Olive Trees. Acta Hortic. 2000, 537, 329–336. [Google Scholar] [CrossRef]
- Baldi, E.; Toselli, M.; Eissenstat, D.M.; Marangoni, B. Organic Fertilization Leads to Increased Peach Root Production and Lifespan. Tree Physiol. 2010, 30, 1373–1382. [Google Scholar] [CrossRef] [PubMed]
- Watson, W.T.; Appel, D.N.; Arnold, M.A.; Kenerley, C.M. Spatial Distribution of Malus Root Systems in Irrigated, Trellised Orchards. J. Hortic. Sci. Biotechnol. 2006, 81, 745–753. [Google Scholar] [CrossRef]
- Neilsen, G.H.; Parchomchuk, P.; Neilsen, D.; Zebarth, B.J.; Neilsen, P. Drip-Fertigation of Apple Trees Affects Root Distribution and Development of K Deficiency. Can. J. Plant Sci. 2000, 80, 353–361. [Google Scholar] [CrossRef]
- Hicks Pries, C.E.; Sulman, B.N.; West, C.; O’Neill, C.; Poppleton, E.; Porras, R.C.; Castanha, C.; Zhu, B.; Wiedemeier, D.B.; Torn, M.S. Root Litter Decomposition Slows with Soil Depth. Soil Biol. Biochem. 2018, 125, 103–114. [Google Scholar] [CrossRef]
- Villa, Y.B.; Khalsa, S.D.S.; Ryals, R.; Duncan, R.A.; Brown, P.H.; Hart, S.C. Organic Matter Amendments Improve Soil Fertility in Almond Orchards of Contrasting Soil Texture. Nutr. Cycl. Agroecosyst. 2021, 120, 343–361. [Google Scholar] [CrossRef]
- Li, T.; Wang, Y.; Kamran, M.; Chen, X.; Tan, H.; Long, M. Effects of Grass Inter-Planting on Soil Nutrients, Enzyme Activity, and Bacterial Community Diversity in an Apple Orchard. Front. Plant Sci. 2022, 13. [Google Scholar] [CrossRef] [PubMed]
- Turner, B.L.; Hopkins, D.W.; Haygarth, P.M.; Ostle, N. β-Glucosidase Activity in Pasture Soils. Appl. Soil Ecol. 2002, 20, 157–162. [Google Scholar] [CrossRef]
- Hinsinger, P. Bioavailability of Soil Inorganic P in the Rhizosphere as Affected by Root-Induced Chemical Changes: A Review. Plant Soil 2001, 237, 173–195. [Google Scholar] [CrossRef]
- Penn, C.J.; Camberato, J.J. A Critical Review on Soil Chemical Processes That Control How Soil Ph Affects Phosphorus Availability to Plants. Agriculture 2019, 9. [Google Scholar] [CrossRef]
Figure 1.
Soil core sampling scheme adopted in the investigated pear orchards, showing sampling positions along-row and in the inter-row and the different distances from the tree trunk according to planting density.
Figure 1.
Soil core sampling scheme adopted in the investigated pear orchards, showing sampling positions along-row and in the inter-row and the different distances from the tree trunk according to planting density.
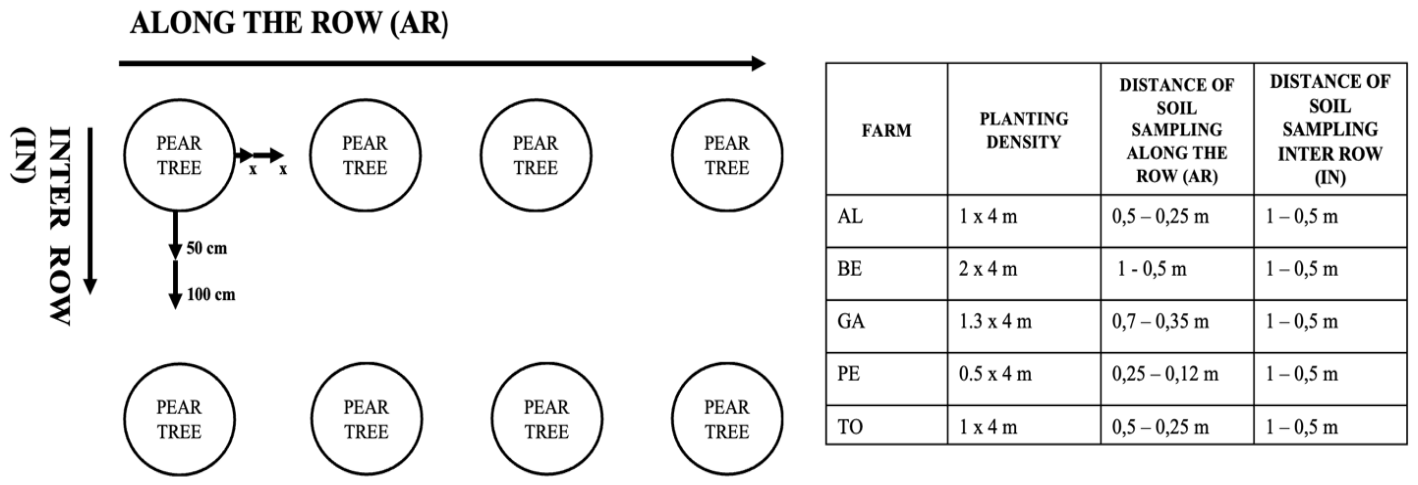
Figure 2.
Spatial distribution of pear root length density (RLD) in the surveyed intensive ‘Abbé Fétel’ orchards. (A) RLD in the along-row and inter-row positions at 0-20 and 20-40 cm soil depth. (B) RLD at 50 and 100 cm from the trunk within the inter-row at the two soil depths. Bars represent mean RLD values ± SE on the original scale (cm g⁻¹). Statistical inference was based on linear mixed-effects models fitted to log(RLD + 0.01), which indicated significant main effects of sampling position and soil depth, but no significant position × depth interaction in panel A. In panel B, the inter-row analysis indicated significant main effects of distance from the trunk and soil depth, but no significant distance × depth interaction.
Figure 2.
Spatial distribution of pear root length density (RLD) in the surveyed intensive ‘Abbé Fétel’ orchards. (A) RLD in the along-row and inter-row positions at 0-20 and 20-40 cm soil depth. (B) RLD at 50 and 100 cm from the trunk within the inter-row at the two soil depths. Bars represent mean RLD values ± SE on the original scale (cm g⁻¹). Statistical inference was based on linear mixed-effects models fitted to log(RLD + 0.01), which indicated significant main effects of sampling position and soil depth, but no significant position × depth interaction in panel A. In panel B, the inter-row analysis indicated significant main effects of distance from the trunk and soil depth, but no significant distance × depth interaction.
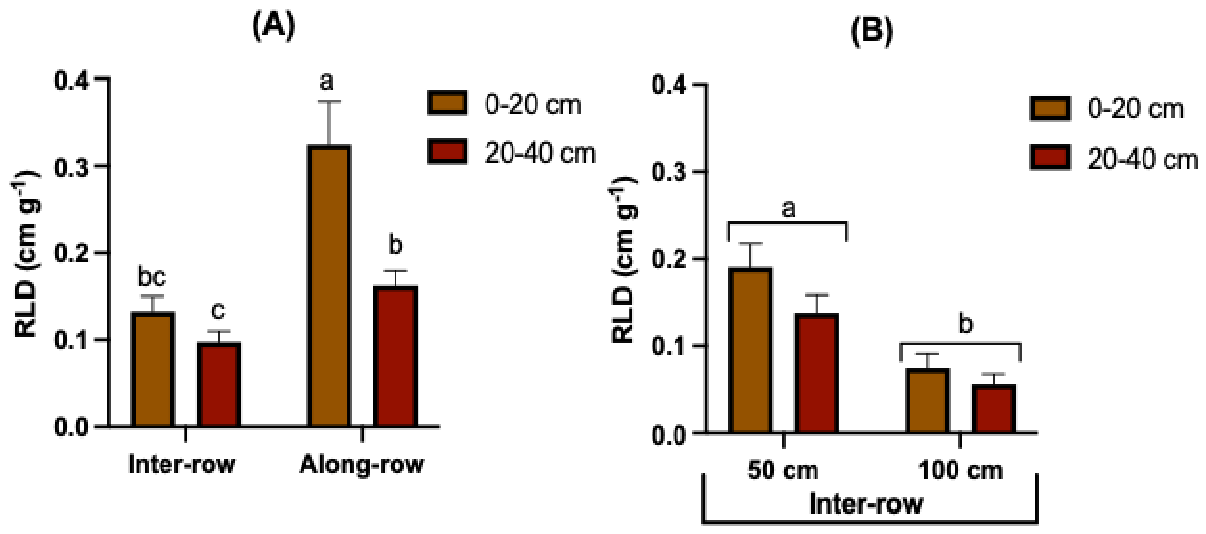
Figure 3.
Heatmap of mean standardised values for RLD, MBC, SBR-cum, SOM, ALP, BGLU and NAG across the four position × depth combinations. Values were standardised separately for each variable as z-scores, with positive and negative values indicating mean values above and below the overall mean, respectively. The heatmap provides a descriptive synthesis of spatial patterns, whereas statistical inference was based on the linear mixed-effects models.
Figure 3.
Heatmap of mean standardised values for RLD, MBC, SBR-cum, SOM, ALP, BGLU and NAG across the four position × depth combinations. Values were standardised separately for each variable as z-scores, with positive and negative values indicating mean values above and below the overall mean, respectively. The heatmap provides a descriptive synthesis of spatial patterns, whereas statistical inference was based on the linear mixed-effects models.
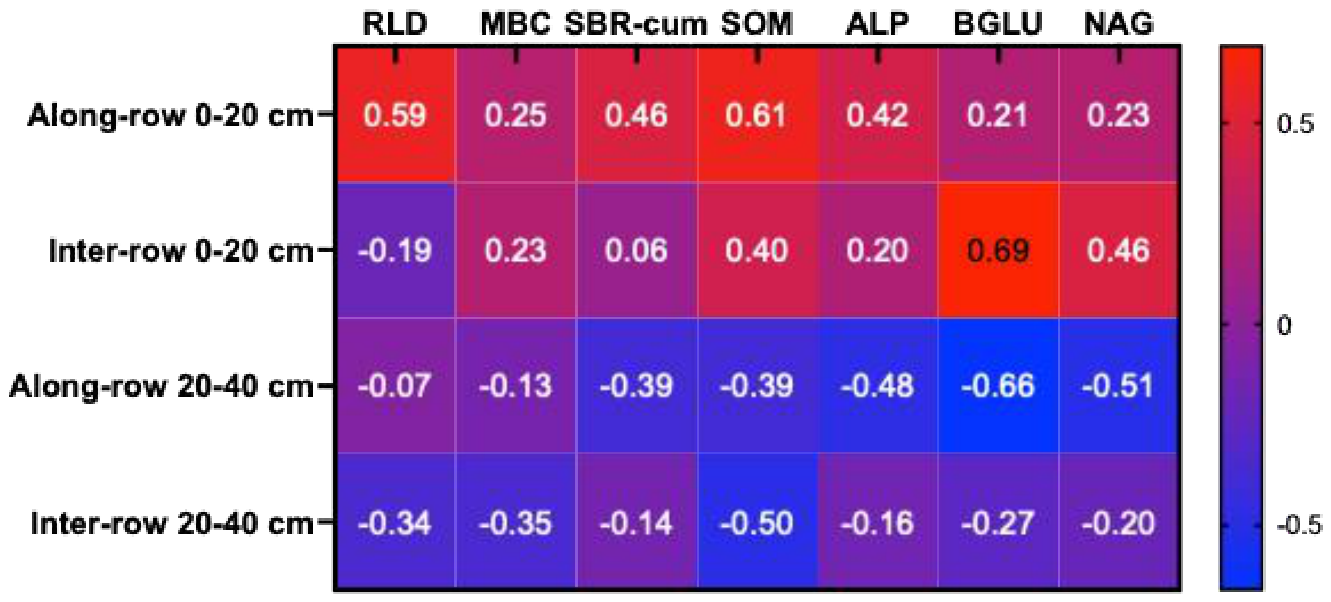
Figure 4.
Principal component analysis (PCA) of root and soil biological indicators in the surveyed intensive ‘Abbé Fétel’ pear orchards. (A) Score plot of individual soil samples on the first two principal components, coloured according to soil depth (0-20 and 20-40 cm). (B) Correlation circle showing the contribution of root length density (RLD), cumulative basal respiration (SBR-cum), microbial biomass carbon (MBC), soil organic matter (SOM), alkaline phosphatase (ALP), β-glucosidase (BGLU), and N-acetyl-β-D-glucosaminidase (NAG) to the first two principal components. PCA was performed on the correlation matrix including log(RLD + 0.01) and the soil indicators. PC1 and PC2 explained 48.6% and 14.3% of the total variance, respectively.
Figure 4.
Principal component analysis (PCA) of root and soil biological indicators in the surveyed intensive ‘Abbé Fétel’ pear orchards. (A) Score plot of individual soil samples on the first two principal components, coloured according to soil depth (0-20 and 20-40 cm). (B) Correlation circle showing the contribution of root length density (RLD), cumulative basal respiration (SBR-cum), microbial biomass carbon (MBC), soil organic matter (SOM), alkaline phosphatase (ALP), β-glucosidase (BGLU), and N-acetyl-β-D-glucosaminidase (NAG) to the first two principal components. PCA was performed on the correlation matrix including log(RLD + 0.01) and the soil indicators. PC1 and PC2 explained 48.6% and 14.3% of the total variance, respectively.
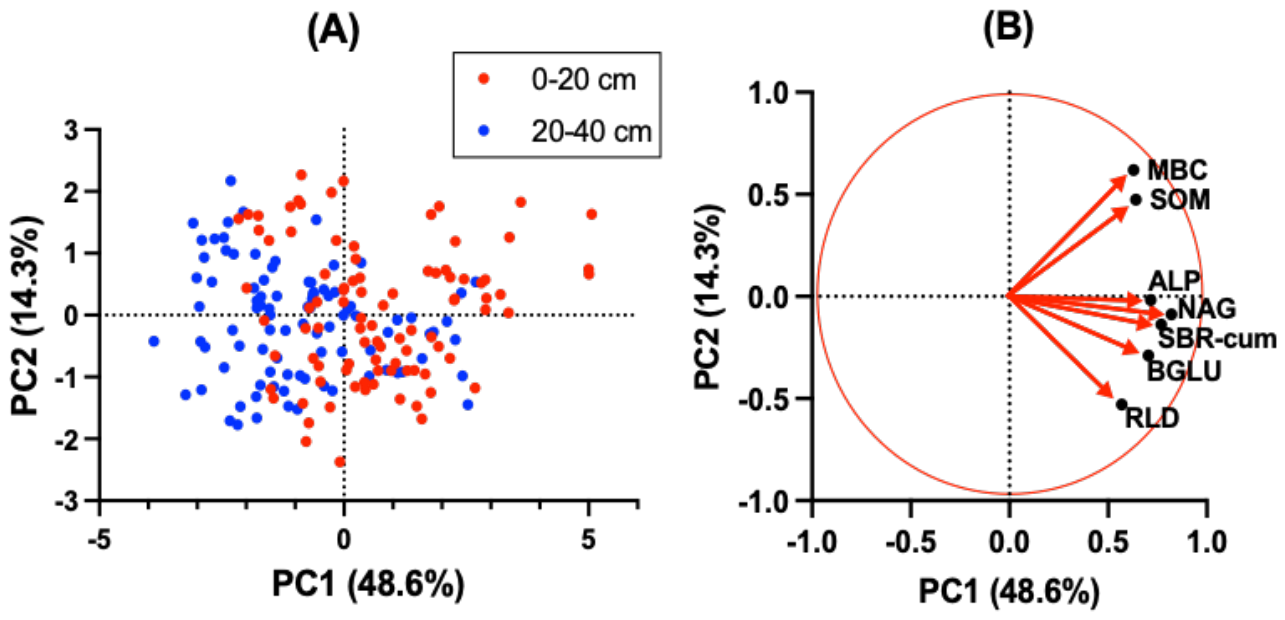

Table 1.
Main orchard characteristics and selected soil properties of the five intensive ‘Abbé Fétel’ pear orchards included in the survey.
Table 1.
Main orchard characteristics and selected soil properties of the five intensive ‘Abbé Fétel’ pear orchards included in the survey.
| Farm | Age | Planting Spacing (m) |
Rootstocks | SOM (%w/w) |
Soil Texture Sand/Silt/Clay (%) |
Soil pH |
|---|---|---|---|---|---|---|
| AL | 13 | 4 x 1 | MA/MC/MH | 2.27 | Sand 24 Silt 46 Clay 30 |
8.2 |
| BE |
13 | 4 x 2 | SYDO/FAROLD40® | 1.73 | Sand 13 Silt 52 Clay 35 |
8.2 |
| GA | 13 | 3.5 x 1.3 | BA29 | 2.05 | Sand 9 Silt 56 Clay 35 |
8.2 |
| PE | 9 | 4 x 0.5 | ADAMS | 1.51 | Sand 28 Silt 47 Clay 25 |
8.2 |
| TO | 17 | 4 x 1 | SYDO | 2.45 | Sand 4 Silt 36 Clay 60 |
7.9 |
Disclaimer/Publisher’s Note: The statements, opinions and data contained in all publications are solely those of the individual author(s) and contributor(s) and not of MDPI and/or the editor(s). MDPI and/or the editor(s) disclaim responsibility for any injury to people or property resulting from any ideas, methods, instructions or products referred to in the content. |
© 2026 by the authors. Licensee MDPI, Basel, Switzerland. This article is an open access article distributed under the terms and conditions of the Creative Commons Attribution (CC BY) license.
Copyright: This open access article is published under a Creative Commons CC BY 4.0 license, which permit the free download, distribution, and reuse, provided that the author and preprint are cited in any reuse.


