

Submitted:
03 August 2026
Posted:
04 August 2026
You are already at the latest version
Abstract
This paper presents an improved approach to measuring monetary poverty using a fuzzy methodology, specifically the recent model proposed by Belhadj and Bounani (2023). Using data from the National Household Survey for the province of Trujillo, La Libertad, Peru, the study demonstrates that this method provides a more detailed and continuous assessment of monetary poverty levels than traditional binary classifications. The fuzzy framework captures the intensity of deprivation experienced by individuals or households by assigning different degrees of membership to each poverty indicator, allowing the identification of intermediate situations that conventional methods typically ignore. The results reveal the existence of individuals or households that are not officially categorized as poor but exhibit deprivation patterns similar to those of the poor population. Identifying these vulnerable groups is essential for designing more inclusive and effective public policies, as it helps populations at risk of falling into poverty and supports a more precise targeting of social programs. Overall, the fuzzy approach offers a more sensitive and realistic representation of poverty dynamics in the study area, providing valuable information for decision-makers seeking to improve poverty-reduction strategies.
Keywords:
monetary poverty
; poverty measurement
; fuzzy sets
; public policies
1. Introduction
The standardization of multidimensional poverty measurement with the Multidimensional Poverty Index (Global MPI) in many countries around the world (OPHI, UNDP, 2021) has led to the assumption that monetary poverty measurement is already well established.
However, we believe that having sufficient income and/or assets is still a condition for people to participate in society and enjoy well-being, so the importance of monetary poverty—or monetary dimension of multidimensional poverty, if we wish to consider it that way—remains relevant. Consequently, improving methods for understanding and measuring the monetary poverty experienced by people is a necessary activity. A broader understanding of monetary poverty can contribute to the design of public policies aimed at eradicating it.
In most Latin American countries, monetary poverty is defined as the insufficiency of monetary resources to purchase a socially acceptable minimum consumption basket. To establish this insufficiency, a well-being indicator (per capita spending) and socially acceptable parameters (total poverty line, in the case of total consumption, and extreme poverty line, in the case of food) are chosen. This is considered an “indirect method” [1], also applied in Peru. However, this classic method is not free from problems. It involves a dichotomous classification of households: extremely poor households (whose income does not allow them to purchase a basic food basket) versus non-extremely poor households (whose income allows them to cover food needs, but not other types of needs).
This dichotomous classification does not adequately reflect reality of poverty and does not take into account the group of families that are on the border between the extremely poor, the non-extremely poor, and the non-poor. Hence, since the 1990s, methodologies have been applied to poverty measurement that seek to surpass classical methodologies in the sense that they make it possible to describe the variety of situations and experiences of poverty beyond the poverty line. This is the case of fuzzy methodologies, based on the work of Zadeh [2] and further developed by [3] on the set theory and fuzzy numbers.
The objective of this study is to propose an improved measurement of monetary poverty in Peru through the application of the fuzzy methodology, specifically the version developed in [4]. To this end, we apply the model in a Peruvian population—the province of Trujillo, located in the Department of La Libertad—using empirical data from the National Household Surveys (ENAHO) carried out by the National Institute of Statistics and Informatics of Peru (INEI) during the year 2022.
The application of the fuzzy model allows a better quantification of monetary poverty levels and to know the extent to which it is experienced in certain indicators (in our study, net income, food expenditure, and state transfers as social support, as we will explain); it also makes it possible to capture intermediate stages or transition situations from “poor” to “non-poor,” unlike the results of the poverty line method. This improved perception of experienced monetary poverty has the advantage of identifying individuals or families who are not in the groups of poor people, but whose level of deprivation is similar to those in poverty and, therefore, should be taken into account in public policies and/or social programs.
This paper is structured as follows: The introduction presents the subject, the objective and motivation to this study. Section 2 provides a brief review of the literature on monetary poverty measurement and the most recent fuzzy methods; section 3 explains the methodology we have followed to measure monetary poverty in Peru using the fuzzy model, based on data from national household surveys; and section 4 presents the results. Section 5 is devoted to the analysis, interpretation and discussion of the results, and finally in Section 6 we summarize the main conclusions of the work.
2. Literature Review
The traditional method used to measure poverty has consisted—within technical and, more precisely, economic terminology—of establishing a poverty threshold, generally defined in monetary terms, and identifying those who fall below it. Thus, poor people are considered to be those whose income level is insufficient to ensure a minimally adequate diet in nutritional terms, as well as to meet essential non-food requirements.
The main problem arising from the application of this method lies in establishing a minimum threshold beyond which an individual is no longer considered poor. As André Corten notes in relation to banking discourse—although the idea can be extrapolated here—speaking of a “poverty threshold” rather than “poverty” also makes it possible to refer to the “number of poor people” rather than to “the poor”. Moreover, the notion of a “poverty line” allows poverty to be considered eliminated as soon as the threshold is crossed [5]. Establishing such a poverty line or threshold results in a rigid dichotomous classification of households or individuals—poor versus non-poor (Figure 1)—which leads to the loss of information about families whose situation lies very close to the boundary separating the poor from the non-poor.
Overcoming the rigid dichotomous classification of households or individuals experiencing poverty has been the objective since the 1990s, through the application of fuzzy methodologies—that is, approaches based on fuzzy set theory—to poverty measurement and the identification of the poor, as in the pioneering work proposed in [6]. These fuzzy methodologies seek to measure degrees or levels of individual poverty (across one or several indicators) as well as degrees of poverty for an entire group (or a poverty index). They also aim to represent the situation of individuals or families according to their degree of membership in specific poverty groups or categories.
To determine the degrees or levels of individual poverty, we begin with a value x that measures the situation of the individual or household. For each indicator, two thresholds are established: a lower threshold L, which represents the upper limit of the values associated with the extremely poor group, and an upper threshold U, which represents the lower limit of the values corresponding to the non-poor group. Thus, the situation of the individual or household varies according to its position relative to these two thresholds for each indicator.
In representing (or modeling) the situation of individuals or households, the fuzzy subset of poverty within the set of real numbers x—corresponding to indicator values—is defined using a continuous, non-increasing membership function μ. This function takes the value μ(x) = 1 on the interval [0, L], μ(x) = f(x) on [L, U], and μ(x) = 0 for all x > U. The value μ(x), generally referred to as the “degree of membership in the poverty set,” is in fact the level or degree of poverty of the individual whose indicator takes the value x. The function f defined on [L, U] is continuous and decreasing (Figure 2).
Authors such as Cerioli and Zani [6], in Italy, employed a linear membership, a choice subsequently adopted by several authors applying fuzzy poverty measurement in different countries. Examples include Dagun et al. [7] and Cheli et al. [8] for Poland, Micelli [9] for Switzerland, Bazán et al. [10] for Paraguay, Vero [11] for France, Appiah-Kubi et al. [12] for Ghana, Belhadj and Matoussi [13], Belhadj [14], Kacem and Kacem [15] and Belhadj and Bouanani [4] for Tunisia, Todeschini and Bezerra-Baco [16] for Brazil, Costa and De Angelis [17] for Italy, Morales-Ramos and Morales Ramos [18] for Mexico, Chacón et al. [19] for Venezuela, Gao and Sun [20] for China, Bedoya and Galvis [21] for Colombia and García-Vélez and Núnez [22] for Ecuador, among others.
Other authors have employed more general nonlinear membership functions, such as Chakravarty [23], Zheng [24], and Belhadj and Bouanani [4], who adopt a convex nonlinear specification whose particular case reduces to the linear form.
To obtain the degree of individual poverty across multiple criteria, fuzzy methodologies aggregate the individual membership degrees using a specific rule. One common choice is the weighted average, where the smallest membership value receives the highest weight. This aggregation rule, originally proposed by Cerioli and Zani [6], has been widely in empirical studies, such as in [14,16]. Miceli [9], in turn, proposes the use of a generalized mean, which includes as special cases the arithmetic, geometric, harmonic and weighted means.
Regarding the degree of poverty at the aggregate level—or the computation of the poverty index—the individual poverty degrees are combined through the most commonly employed aggregation rule: the arithmetic mean [6,9,19]. Todeschini and Bezerra-Baco [16], use a weighted mean and [13,20] propose alternative aggregation schemes like entropy-based measures from information theory as a generalization of the Watts index [25].
These fuzzy methodologies have been applied either to measure monetary poverty exclusively, or to measure monetary poverty within broader multidimensional poverty analysis. Monetary-only fuzzy measurement is examined in [26] by using the generalized membership function [6] and the monetary poverty index similar to the population count number (or HCI short for count ratio), which is called the Foster-Greer-Thorbecke fuzzy poverty index (FGT). Other authors have measured monetary poverty as a part of their study of multidimensional poverty. The same membership function is used in [4] as in [26] with a small variation. On the other hand, [27,28] applied the generalized membership function obtained by combining the distribution function and the Lorenz curve proposed by [29], the former in Italy and the latter to the study of poverty in Vietnam.
2.1. Fuzzy Set Theory
The notion of a fuzzy set was first proposed by [2]. The concept of a fuzzy set, as used in fuzzy theory, assumes that an element’s membership in a set is not restricted to belonging or not belonging, but rather is expressed on a scale from 0 to 1. This way, unlike classical set theory—where an individual either belongs or does not belong to a set—fuzzy logic avoids the traditional dichotomous division between membership and non-membership by introducing a gradation indicating the degree to which an element belongs to a set.
Given a set X and an element x ∈ X, a fuzzy subset A of X is characterized by a membership function, μ: A → [0,1] associating each point x ∈ X to a real number μA(x) ∈ [0,1] denominated degree of membership of x in A. If A is a classical crisp set, this function is called characteristic function and only takes values 0 and 1.
From the definition, we can consider a fuzzy set A as an ordered pair (X, μA(x)), therefore, it is characterized by the set of ordered pairs A={(x, μA(x)) / x ∈ X}.
2.1.1. Representation of Fuzzy Sets
A fuzzy number à is fuzzy set defined in ℝ characterized by its membership function μÃ∶ ℝ → [0,1] such that:
- μà is upper semicontinuous
- à is a convex set, that is, μÃ(λx, (1 − λ)y) ≥ min{μà (x), μÃ(y)}, for all x, y ∈ ℝ, λ ∈ [0,1]
- à is normal, that is, ∃ x0 ∈ ℝ such that μÃ(x0) = 1
- The closure of the support of à is a compact set
Triangular fuzzy numbers are the most important, as they are especially used in solving possibilistic linear programming problems. These fuzzy numbers are denoted by à = (a1, a2, a3), where a2 is the central value (μ(a2) = 1), a1 is the value subtracted on the left and a3 is the number added on the right.
Figure 3.
Triangular fuzzy number.
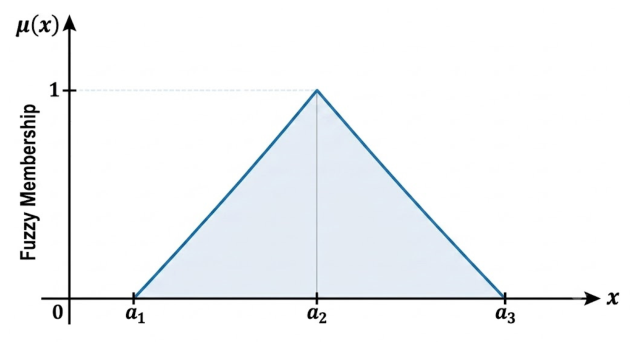
The membership function of a triangular fuzzy set is defined by:
Another important fuzzy number frequently used in fuzzy logic is the trapezoidal fuzzy number. These numbers are denoted by à = (a1, a2, a3, a4) where a2 and a3 are the central values (μ(a2) = μ(a3) = 1), a1 is the is the value subtracted on the left and a4 is the number added on the right.
Figure 4.
Trapezoidal fuzzy number.
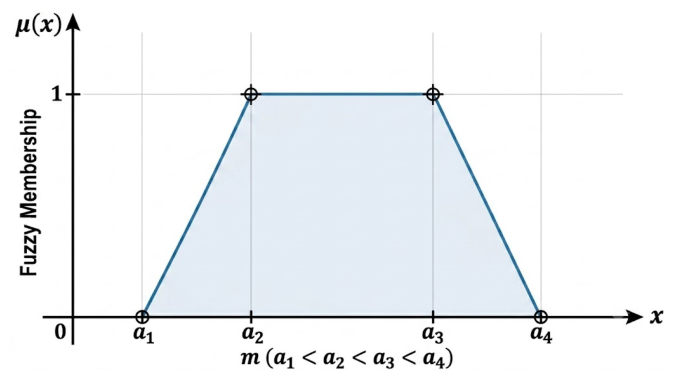
The membership function of a trapezoidal fuzzy set is defined by:
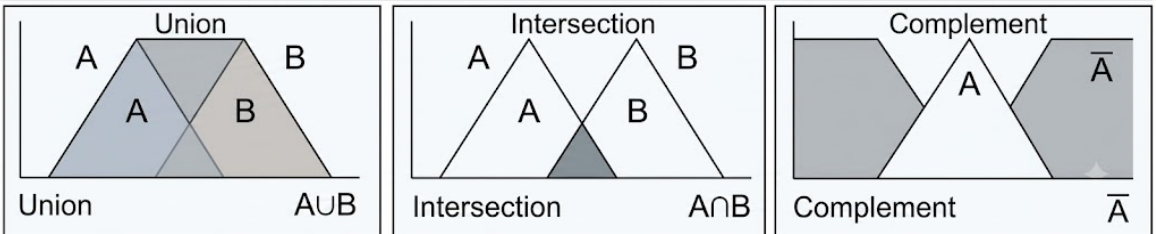
With this representation of fuzzy sets, we can represent operations of union, intersection and complement in this way:
Figure 5.
Operations among fuzzy sets.
3. Materials and Methods
In this study, to apply the fuzzy methodology to the measurement of monetary poverty, we relied on data from the 2022 National Household Survey (ENAHO), conducted by the National Institute of Statistics and Informatics (INEI) of Peru.
The 2022 ENAHO comprises 36,848 households, 24,256 located in urban areas and 12,592 in rural areas. ENAHO provides information on a wide range of dimensions, including housing and household characteristics, individual demographic attributes, education, health, employment and income, household expenditures, participation in social programs, self-employment or employer income, agricultural producers’ income, and the governance, democracy, and transparency module.
3.1. Population
The selected population was the province of Trujillo, in the Department of La Libertad (Peru). The province is made up of eleven districts (Figure 6).
Each district has its corresponding population and location. The eleven districts are presented in Table 1.
3.2. Variables and Data
Monetary poverty is, above all, an insufficiency of monetary resources and/or goods. This concept of monetary poverty is already well established in the literature and in international organizations and essentially defines monetary poverty in terms of the indicators used to measure it, which is debatable. However, we chose this concept as our starting point in order to improve its measurement, and in this sense, we have redefined the indicators used for its calculation.
Since, in measuring monetary poverty, average income (per consumption unit) has traditionally been the indicator used to measure the general standard of living, in this study we use “income” understood as income from work, as the main instrument enabling the individual to become self-reliant—provided that the work is remunerated with a decent minimum wage or provides an income to lead a decent life.
Given the importance of work as a means of earning an effective income, we have considered income as an indicator of monetary poverty independent of the transfers made by the State, especially monetary transfers, as social support to disadvantaged groups. The reason for this is that government social (monetary) support does not have the same implications in different families, i.e., cash transfers, although they are of equal value to all beneficiary families, do not have the same effect, for some families it allows them to escape poverty, while not others.
Likewise, family food expenditure varies from family to family, regardless of the number of members and income. For this reason, food expenditure must also be assessed independently.
Therefore, our study uses three variables or indicators to measure monetary poverty: net income, food expenditure, and government transfers as social support. The latter distinguishes our approach from that of the INEI, which incorporates social support directly into net income in its monetary poverty assessment.
In the 2022 ENAHO, survey code 784–Module 34 (“summary-2022”), we used net household income, total government transfers from social programs, and food expenditure. Food expenditure was computed by aggregating all survey items associated with household food consumption.
We also used the poverty line (code LINEA) and the extreme poverty line (code LINPE). The module reports the number of surveyed households and the number of surveyed individuals in each district (columns 5 and 6 of Table 1). However, in two districts—Poroto and Simbal—ENAHO does not report any surveyed households.
Since the income reported for households in ENAHO Module 34 includes government transfers from social support programs, in our study we subtracted those amounts so that the net income we considered is no longer the same as that reported in the 2022 ENAHO. Moreover, the values in the survey correspond to the entire household and are annual, while the poverty line is defined on an individual and monthly basis.
To standardize all data as individual and monthly, the amounts corresponding to food expenditures, income, and social support were divided by the number of household members living in the surveyed dwelling and then by the twelve months of the year. Thus, income, food expenditures, and government social support are expressed as average monthly values per person in each household. Our starting assumption is that all household members are equal with respect to their experience of monetary poverty; that is, poverty—expressed through specific indicators—affects the rights and dignity of every member of the household.
3.3. Thresholds
For each selected indicator, we established two thresholds -one lower and one upper- as required by the fuzzy methodology, in order to measure the condition of each family or individual.
In the case of net income, the lower threshold corresponds to the poverty line established by the National Institute of Statistics and Census, INEI (414.87 soles), while the upper threshold corresponds to the minimum living wage (1,025 soles). The choice of the latter is grounded in the original purpose of the minimum wage as conceived by the International Labour Office (ILO), which sought to protect low-income workers through the establishment of a fair and effective wage floor that would enable income redistribution toward lower-wage groups and thereby contribute to partially reducing poverty [30].
To our knowledge, no study of poverty measurement explicitly incorporates this important benchmark, but we consider it valid and widely accepted worldwide that an individual may be regarded as non-poor if their monthly income is equal to or greater than the minimum wage. The minimum wage does not constitute an amount that allows a worker to live an affluent life; it’s a moderate amount, a minimum level of income.
For the food expenditure indicator, the lower threshold corresponds to the extreme poverty line established by the National Institute of Statistics and Census (INEI) (214.74 soles), while the upper threshold is an amount proportional to the minimum wage (530.55 soles).
Consequently, by establishing these thresholds for the income and food expenditure indicators, we interpret that, for the income indicator, a family is in a situation of extreme poverty if its income is below 414.87 soles, and is considered non-poor if its income is not below 1,025 soles. Likewise, for the food expenditure indicator, a family is in a situation of extreme poverty if its per-capita average food expenditure is below 214.74 soles, and non-poor if its food expenditure is not below 530.55 soles.
Regarding social support, its effect has been considered in relation to the poverty lines in the following way: the assessment of social support is established on a scale from 1 to 5 according to its effectiveness in overcoming poverty thresholds. If social support added to income reaches or exceeds 1,025 soles, the value assigned to social support is 5 (sufficient to surpass general poverty). If social support plus income is less than 1,025 soles but the sum of social support and food expenditure is not below 530.55 soles, social support is assigned a value of 4. If the sum of social support and food expenditure is below 530.55 soles but not below 414.87 soles, social support is scored as 3. If the sum of social support and food expenditure lies between 214.74 and 414.87 soles, social support is scored as 2. Finally, if the sum of social support and food expenditure is less than or equal to 214.74 soles, social support is scored as 1. Thus, the assessment of social support is a finite set {1, 2, 3, 4, 5}, and we consider L = 1.5 as the lower threshold and U = 3.5 as the upper threshold.
This implies that it, after receiving social support, the family or individual remains at the level of extreme poverty, such support is extremely insufficient, and if the social support enables the family or individual to rise above the poverty threshold in food expenditure, the support is sufficient.
The thresholds for the three indicators in our study are presented in Table 2.
3.4. Models
To represent the fuzzy set of poverty in the indicators (i.e., those who belong to the set of poor), we adopted the model used in [6], along with it more recent generalized version [4], whose membership function is as follows:
where δ > 0, L is the lower threshold, U is the upper threshold, and x is the rating of the indicators. When δ = 1, the above function is the same as the used in [6].
To obtain the individual poverty index or degree for k indicators we use the next formula, which is the weighted mean employed in [6]:
where μj(i) is the degree or level of poverty of individual i in indicator j, ωj is given by the formula:
and , n represents the number of people or families in the study group.
To obtain the poverty index for the entire group of individuals or families consisting of n units, we use the simple average:
Finally, to consolidate the poverty index for G groups with n1, n2, …, nG members, the formula is as follows:
The indices given in equations 4 and 5 are of the same type as those addressed by [23], who demonstrates that both the unidimensional and multidimensional fuzzy indices satisfy the axioms of poverty measurement.
3.5. Application of Fuzzy Models to the Data
By applying the membership function (1) to each indicator using the corresponding thresholds, the membership function to poverty in that indicator is obtained. After evaluating this function for each family, we determine the degree to which each family belongs to poverty in the given indicator. If the membership degree is 1, the family is in a situation of extreme poverty, whereas if the value is 0, the family is non-poor; in all other cases, the family is in a situation of poverty with membership degree μ(x).
By combining the three membership degrees corresponding to each of the indicators using Equation (2), we obtain the degree of membership to monetary poverty for each family. If the membership degree is 1, the family is in extreme poverty; if it is 0, the family is non-poor. In all other cases, that is, if 0 < μ(x)< 1, families experience different levels of poverty.
By counting the families in situations of extreme poverty, poverty, and non-poverty, and comparing these with the total number of families studied, the percentages of families at each poverty level are obtained.
Up to this point, as can be seen, we rely on the same poverty categories used by INEI—extreme poverty, poverty, and non-poverty—although the methodology differs due to the fuzzy model adopted and the indicators and thresholds established to operationalize this model.
Finally, we calculate the poverty index for each district using Equation (4), combining the poverty level or degree of each surveyed family. This index allows us to compare poverty levels among districts within the same province, with the district exhibiting the highest index reflecting the greatest degree of poverty. The fuzzy total poverty index for the province of Trujillo is calculated using Equation (5) and, analogously to the individual cases, will indicate predominance of poverty if the index is close to 1, or predominance of non-poverty if its value is close to 0.
4. Results
4.1. Membership Function and Poverty Levels for Each Indicator
Using the data from Table 2 in Equation (1), the membership function for each indicator is obtained, as shown in the second column of Table 3. Additionally, the third column presents the weights obtained using Equation (3).
The membership functions illustrate the gradual transition between extreme poverty and non-poverty, avoiding abrupt classifications. This allows individuals near the poverty thresholds to be represented more realistically, capturing intermediate deprivation levels that are ignored in classical approaches.
4.2. Calculation of Individual and Group Poverty Levels by Districts
Using Equation (2) with weights shown in the third column of Table 3 and the membership degrees for each of the three indicators, we obtain the individual monetary po-verty degree. Once the individual poverty index or degree is obtained, we can determine the percentages of families in each poverty category or situation.
If we perform this calculation according to the three categories considered by INEI, -extreme poverty, poverty and non-poverty- in each district, the results appear in Table 6 and Table 7.
Table 6 presents the percentage of families in each category, allowing a comparison between the results obtained by INEI using the classical methodology and those obtained using the fuzzy methodology.
Figure 10 illustrates the poverty levels based on the results obtained for each poverty category.
Another important aspect of fuzzy measurement is the improved identification of the experience of poverty. It allows family groups to be classified according to their poverty situation, thus overcoming the sharp divisions imposed by classical methodologies between poor and non-poor, or between extreme poverty, poverty, and non-poverty—the typical categorization in monetary poverty measurement.
In this study, we defined four subgroups, which we label as ‘severe poverty’ (0.75 ≤ μ < 1), ‘medium poverty’ (0.5 ≤ μ < 0.75), ‘moderate poverty’ (0.25 ≤ μ < 0.5), and ‘mild poverty’ (0 ≤ μ < 0.25). Table 7 provides us the percentage of population in extreme poverty, along with the non-poor population, and specifically presents the population in poverty divided into the four aforementioned subgroups.
Table 8 shows the percentages of the subgroups considered part of the population in a situation of poverty, with the categories of extreme poverty and non-poverty no longer appearing in it.
In this table, attention should be drawn to the subgroups in severe poverty at risk of falling into a state of poverty, which could be understood as vulnerable population groups; and to the subgroups in mild poverty, which are in a more advantageous poverty situation compared to the others, as they are closer to the non-poor condition.
4.3. Calculation of Fuzzy Poverty Indices by District
The next map shows that the district with the highest fuzzy poverty index is Florencia de Mora, followed by the district of El Porvenir, and the one with the lowest fuzzy poverty index is the district of Víctor Larco Herrera.
The districts of Simbal and Poroto, which appear in white, do not have data because they were not selected by INEI to be part of the survey sample.
Using the fuzzy methodology, we calculated the fuzzy poverty index for each district using Equation (4). This result is reported in the fuzzy poverty map shown in Figure 11.
Finally, by applying Equation (5), the global poverty index for the province of Trujillo is obtained, which is 0.42965189.
5. Discussion
As we explained in Section 3, the three monetary poverty indicators we established are net income, food expenditure, and State social support, and for each indicator we set a lower and an upper threshold. However, in determining these indicators and thresholds, our study differs from INEI’s monetary poverty measurement approach, which, on the one hand, includes State transfers or social support as part of household income and, on the other hand, uses food expenditure as the extreme poverty line. That is, in 2022 INEI considers the extreme poverty line (214.74 soles) as the lower threshold and the poverty line (414.87 soles) as the upper threshold.
5.1. Thresholds Established in the Indicators: Interpretation and Differences from Those Established by the National Institute of Statistics and Census (INEI)
In our case, for the net income indicator we adopt the poverty line set by INEI (414.87 soles) as the lower threshold. In other words, in the ‘income’ indicator we consider as the dividing line between extreme poverty and poverty what INEI considers the dividing line between poverty and non-poverty, which we believe makes INEI’s analysis less sensitive to the experience of poverty.
For the upper threshold of the net income indicator, we adopt the minimum living wage as the dividing line between the poor and the non-poor. This choice is based on three points: (1) it represents the legally established minimum income to ensure decent living conditions under Peruvian labor regulations; (2) it is a widely accepted reference for measuring basic purchasing capacity; and (3) it allows comparability with similar studies in the region. In our view, a person is considered non-poor when their income is equal to or greater than the minimum living wage, since this amount represents the minimum compensation for eight hours of work that enables access to a dignified life. This minimum living wage marks the lowest remuneration a person may receive for an eight-hour workday, and as such, it can be considered the dividing line between poor and non-poor. A person earning less than this amount cannot be said to enjoy the right to a dignified life and therefore must be considered in a condition of poverty.
For the food expenditure indicator, we use the same lower threshold employed by INEI (214.74 soles), and we calculate the upper threshold by maintaining the same proportion used for the income thresholds. Consequently, in adopting the upper thresholds that separate the poor from the non-poor categories, there is once again a difference between the fuzzy methodology applied in our study and INEI’s methodology.
Regarding the indicator of State social support—which, as mentioned earlier, INEI incorporates into income—our assessment differs by considering the effect that such support has in enabling households to escape extreme poverty and poverty across the different categories we have established: severe, medium, moderate, and mild. Thus, the lower threshold corresponds to the level of social support received in situations of extreme poverty when such support does not allow the person to exceed the poverty line established by INEI, and the upper threshold corresponds to the level of social support that enables the beneficiary to move from poor to non-poor in the food expenditure indicator.
5.2. Comparison of Extreme Poverty, Poverty, and Non-Poverty Levels by Indicator in Families (Using INEI’s Fuzzy Methodology)
These differences in population percentages, based on income, are reasonable for two main reasons. First, income includes only the family’s own earnings and not social assistance, so what is reflected here is the poverty situation without the State’s support. Second, we consider as the dividing line between extreme poverty and poverty what INEI considers the line between poverty and non-poverty; in other words, from our perspective, the population group that INEI classifies between extreme poverty and poverty is considered to be in extreme poverty. Theoretically, the percentage of families in extreme poverty in our study should be equal to or greater than the sum of the extreme poor and poor reported by INEI; however, the results show variations explained by methodological differences in the measurement of each indicator. This is the case in the district of Trujillo, where the sum of the extreme poor and poor is 3.4%, while the corresponding percentage of extreme poverty in our report is higher, 8.51%. The opposite occurs in the district of Moche, where the sum of the extreme poor and poor is 26.47%, while in our study is 8.82%.
It is possible to compare the percentage of the population in each district classified as extremely poor, poor, or non-poor according to INEI’s measurement and according to our study using fuzzy measurement for each indicator. This comparison is presented in Table 4 and Table 5. We follow the categories commonly used in monetary poverty measurement and highlight the significant differences between our results and those of INEI.
On the other hand, the percentage of the population classified as poor by income in our study corresponds to families that INEI classifies as non-poor but whose per capita income is below the minimum wage. Using this criterion, we observe a considerable share of the non-poor population in the districts of Víctor Larco Herrera and Trujillo, in contrast with the low percentage of non-poor residents in El Porvenir, Salaverry, and Florencia de Mora.
Regarding the food-expenditure indicator, the lower threshold used in the fuzzy measurement matches the lower threshold set by INEI in its classical monetary-poverty methodology. One might therefore expect similar figures, at least in the extreme-poverty category; however, the difference is actually greater. This is because, in our study, a family is classified as being in extreme poverty in this indicator if its food expenditure is below 214.74 soles, whereas INEI classifies a family as extremely poor if its income is below 214.74 soles, without considering food expenditure. From our perspective, families whose food-consumption cost is very low are in extreme poverty, even if they have high incomes, including those above the minimum wage.
The high percentage of families in extreme poverty according to the food-expenditure indicator shows that, across all districts of Trujillo—even among the non-poor population—food-consumption habits are inadequate. Consequently, alongside social support, the population needs education on healthy eating habits. The very small percentage of families classified as ‘non-poor’ in this indicator also reveals that few households maintain adequate dietary practices.
Regarding the social-support indicator and its effect on poverty, our assessment differs from that of INEI. We evaluate social support based on its impact on income or food expenditure, as previously explained. In terms of population percentages under this indicator, there is a very high share of households in the ‘very insufficient’ support category. This is because this group includes those who receive social support but, even when combined with their food expenditure, still cannot rise above extreme poverty (poverty, according to INEI), and also those who receive no support and whose food expenditure is below INEI’s poverty line.
5.3. Comparison of Extreme Poverty, Poverty, and Non-Poverty Levels by District (Using INEI’s and Fuzzy Methodology)
A comparison can also be made of household monetary-poverty levels by district according to the INEI report and according to our study, across the three categories of extreme poverty, poverty, and non-poverty. This is shown in Table 6, where a clear difference in results is immediately evident. Such differences arise from the use of the fuzzy method and, above all, from the different ways in which the indicators and their thresholds were defined in each study.
Thus, according to INEI, in the districts of Trujillo, Florencia de Mora, La Esperanza, Laredo, Salaverry, and Víctor Larco Herrera, there are no households in extreme poverty. In contrast, our study shows a substantial percentage of the population in extreme poverty in these districts, with El Porvenir having the highest percentage (16.67%) and Víctor Larco Herrera the lowest (5.09%).
On the other hand, INEI reports very high percentages of people classified as non-poor, the highest being 96.6% in the district of Trujillo, followed by Laredo (93.33%), then Víctor Larco Herrera and Huanchaco, and the lowest in Florencia de Mora (66.67%). In contrast, according to our results, most of the population falls within the poverty level, with the districts of Laredo, La Esperanza, and Florencia de Mora exceeding 85%. The highest percentage of non-poor households in our study appears in Trujillo (20%), while in the remaining districts the percentage is below 13%, reaching the lowest point in Florencia de Mora, where no non-poor households are recorded.
In line with Table 5—where the percentage of non-poor in the food expenditure indicator is very low—combining this with the other indicators increases the overall poverty level. A household can only be classified as non-poor if it is non-poor in all indicators; therefore, in Florencia de Mora, where no household is non-poor in the food expenditure indicator, there are no households classified as non-poor across the three indicators.
In the last row of Table 6, in the column corresponding to the ‘poor’ category, INEI reports 25.95% for the entire province of Trujillo, a percentage lower than what INEI reports for the Department of La Libertad in its poverty evolution study for 2014–2023 [31]. Meanwhile, the extreme poverty rate for the province of Trujillo reported by INEI is 0.52%, much lower than the 3.3% indicated by INEI for the Department of La Libertad [31]. However, regarding extreme poverty, our study reports 8.22% for the province of Trujillo—much higher than what INEI records in Table 6 and in its 2024 report.
All these differences in population percentages across the typical poverty categories (extreme poverty, poverty, non-poverty) reported by INEI and by our study are partly due, as already noted, to the different initial research assumptions and decisions (regarding indicators and thresholds). However, we also believe that they reveal that the fuzzy methodology makes it possible to perceive—and therefore visualize—higher levels of experienced poverty among households or individuals, which is crucial for effectively addressing and eradicating poverty.
5.4. Fuzzy Poverty Categories and Transition Between Categories
With the fuzzy methodology, it is possible to distinguish the difference in the experience of poverty. It allows for a classification of families within the poverty category itself. In our study, we classified them into four subgroups: severe poverty, medium poverty, moderate poverty, and mild poverty as shown in Table 7.
The severe-poverty subgroup comprises families with a high degree of poverty whose situation is very close to that of families in extreme poverty, placing them at high risk of falling into extreme poverty. The percentage of these families ranges from 11.06% in the district of Trujillo, which has the lowest proportion of its population in this condition, to 36.11% in the district of Florencia de Mora, which has the highest proportion.
The medium-poverty subgroup includes families with a lower degree of poverty than the previous group. They face a lower risk of falling into extreme poverty but may still fall into severe poverty. The percentage of families in this subgroup ranges from 6.78% to 25.34%, with the lowest percentages in the districts of Víctor Larco Herrera, Moche, Florencia de Mora, and Trujillo, and the highest in El Porvenir, Laredo, Salaverry, and La Esperanza.
The so-called moderate-poverty group includes those in a better situation than those in median poverty. In this regard, the percentage of the population by district ranges from 3.39% in the district of Víctor Larco Herrera to 12.75%, with the districts of La Esperanza, Huanchaco, and Salaverry having the highest percentages.
The families in the best situation within the poor category make up the mild-poverty group, whose situation is similar to that of the non-poor. In this group, we find the highest percentages in several districts such as Víctor Larco Herrera, with 57.63%, and Trujillo with 45.11%, while the districts with the lowest percentages are El Porvenir, with 21.33%, and Salaverry with 29.41%.
And for the entire province of Trujillo (the last row of Table 7 shows the consolidated data), what can be observed is that the combined total of extreme poverty and severe poverty reaches 27.25%, which is slightly higher than the percentage reported by INEI [31] for the whole region for the same year, 2022 (the year considered in our study).
To examine the poverty percentages within the poor group across the different districts, Table 8 presents the percentages of the subgroups within the poverty category.
5.5. Comparison of Fuzzy Poverty Rates Across Districts (Spatial Analysis)
As an additional contribution of our study, and distinguishing it from the methodology used by INEI, we have calculated the fuzzy poverty indices for each district, as shown in Figure 11.
The calculation of these indices is important because it allows for comparisons within a geographic area—in our case, a spatial analysis of poverty across the entire province of Trujillo. It can be seen that Florencia de Mora has the highest poverty index, followed closely by El Porvenir. They are followed, in descending order, by Laredo, Salaverry, Moche, Huanchaco, and La Esperanza, all with values above the provincial poverty index. Finally, the districts of Trujillo and Víctor Larco Herrera show values well below the provincial average, with Víctor Larco Herrera having the lowest index in the entire province, including the capital district of Trujillo.
These results provided by the spatial analysis may be important for the design and implementation of policies and programs aimed at combating poverty.
6. Conclusions
In this research, we used fuzzy set theory to replace the poor-non poor dichotomy in the set of the poor to obtain the levels and degrees of membership. This allowed us to obtain a better comprehension of the experience of monetary poverty.
In fact, many households classified as non-poor according to INEI surveys have a considerable degree of membership in the set of the poor. We also show that it is possible to identify families or individuals with greater or lesser vulnerability—individuals or families who are not in the group of the poor but whose level of deprivation is similar to those who are.
This provides relevant information for the adoption of preventive measures in public policies or social programs.
Finally, the spatial analysis of poverty (the fuzzy poverty indices by district resulting from our study) can serve as a reference for a more equitable allocation of resources within the province. This is even more relevant considering that INEI does not provide disaggregated data at the district or provincial level; it only presents regional-level studies. Thus, INEI places the La Libertad Region within a group of regions and assigns it a poverty and extreme poverty rate, but there is no detailed analysis by district, even though social programs are implemented precisely at the local and district levels. Therefore, the design of social programs should also be carried out at this micro level—at the district and provincial scale.
It is also important to highlight, in line with the findings from our construction and analysis of indicators such as food expenditure and social support, that combating poverty requires not only social and economic assistance from government agencies, but also educating the population in proper eating habits.
In summary, this study shows that the fuzzy-set methodology provides a more nuanced and comprehensive measurement of monetary poverty than traditional dichotomous methods. The results reveal that 8.22% of families in the province of Trujillo are in a situation of extreme poverty according to our methodology, compared to the 0.52% reported by INEI, which demonstrates the ability of the fuzzy methodology to detect levels of vulnerability not identified by binary approaches. The findings suggest that a significant percentage of the population classified as “non-poor” by INEI exhibits considerable degrees of economic vulnerability that should be taken into account in public policy design.
The application of this methodology at the district level provides valuable information for the territorial targeting of social programs, allowing for a more efficient allocation of resources based on gradients of vulnerability rather than the use of binary categories.
Future research should extend this methodology to other regions of the country and explore its application in longitudinal analyses to capture the temporal dynamics of poverty. Likewise, it would be valuable to integrate this fuzzy approach with multidimensional poverty measurements to obtain a more holistic understanding of the phenomenon.
Author Contributions
: Conceptualization, E.V. and J.G.; Methodology, E.V.; validation, E.V., R.A., J.P. and Y.V.; Formal analysis, E. V., R.A., J.P. and Y.V.; Investigation, E.V., R.A., J.P. and Y.V.; Writing–original draft, E.V.; Writing–review and editing, J.G.; Visualization, J.G.; Supervision, E.V. and J.G.; Project administration, E.V. All authors have read and agreed to the published version of the manuscript.
Funding
This research was funded by Universidad Nacional de Trujillo, grant number PIC-2-MOD1-2023-Ext, through the Canon Project (VII Call for Science and Technology Projects).
Data Availability Statement
The data presented in this studio are openly available in [INEI] at [https:// www.inei.gob.pe] (accessed on 27 June 2026).
Conflicts of Interest
The authors declare no conflicts of interest.
Abbreviations
The following abbreviations are used in this manuscript:
| ENAHO | National Household Survey |
| INEI | National Institute of Statistics and Informatics |
| LINEA | Total poverty line |
| LINPE | Extreme poverty line |
References
- Feres, J.C.; Mancero, X. Enfoques para la medición de la pobreza: Breve revisión de la literatura; CEPAL: Santiago, Chile, 2001. Available online: http://www.derechoshumanos.unlp.edu.ar/assets/files/documentos/enfoques-para-la-medicion-de-la-pobreza-breve-revision-de-la-literatura.pdf (accessed on 27 June 2026).
- Zadeh, L.A. Fuzzy sets. Inf. Control 1965, 8, 338–353. [CrossRef]
- Dubois, D.; Prade, H. Operations on fuzzy numbers. Int. J. Syst. Sci. 1978, 9, 613–626. [CrossRef]
- Belhadj, B.; Bouanani, M. Attributes inequality in multidimensional poverty measures: Fuzzy modeling. Soft Comput. 2023, 27, 1997–2008. [CrossRef]
- Corten, A. Le discours de la pauvreté de la Banque Mondiale. Lang. Soc. 1998, 85, 5–24. Available online: https://www.persee.fr/doc/lsoc_0181-4095_1998_num_85_1_2822 (accessed on 27 June 2026).
- Cerioli, A.; Zani, S. A fuzzy approach to the measurement of poverty. In Income and Wealth Distribution, Inequality and Poverty; Dagum, C., Zenga, M., Eds.; Springer: Berlin, Germany, 1990; pp. 272–284. [CrossRef]
- Dagum, C.; Gambassi, R.; Lemmi, A. New approaches to the measurement of poverty. In Poverty Measurement for Economies in Transition; Polish Statistical Association; Central Statistical Office: Warsaw, Poland, 1992; pp. 201–225.
- Cheli, B.; Ghellini, G.; Lemmi, A.; Pannuzi, N. Measuring poverty in the countries in transition via TFR method: The case of Poland in 1990–1991. Stat. Transit. 1994, 1, 585–636.
- Miceli, D. Measuring Poverty Using Fuzzy Sets; Discussion Paper No. 38; NATSEM, University of Canberra: Canberra, Australia, 1998.
- Barán, B.; Rojas, A.; Britez, D.; Barán, L. Measurement and Analysis of Poverty and Welfare Using Fuzzy Sets; 1999. Available online: https://www.cnc.una.py/publicaciones/1_95.pdf (accessed on 27 June 2026).
- Vero, J. A comparison of poverty according to primary goods, capabilities and outcomes: Evidence from French school leavers’ surveys. In Fuzzy Set Approach to Multidimensional Poverty Measurement; Lemmi, A., Betti, G., Eds.; Springer: Boston, MA, USA, 2006; pp. 211–231. [CrossRef]
- Appiah-Kubi, K.; Amanning-Ampomah, E.; Ahortor, C. Multi-dimensional analysis of poverty in Ghana using fuzzy sets theory. SSRN Electron. J. 2007. [CrossRef]
- Belhadj, B.; Matoussi, M.S. Poverty in Tunisia: A fuzzy measurement approach. Swiss J. Econ. Stat. 2010, 146, 431–450. [CrossRef]
- Belhadj, B. A new fuzzy unidimensional poverty index from an information theory perspective. Empir. Econ. 2011, 40, 687–704. [CrossRef]
- Kacem, R.H.; Kacem, S.B.H. Measuring pro-poor growth: A comparative study and a fuzzy logic-based method. Afr. J. Econ. Manag. Stud. 2021, 12, 137–150. [CrossRef]
- Todeschini, C.; Bezerra-Baco, F.M. Multidimensional poverty in Brazil: An analysis of metropolitan areas. Informe GEPEC 2015, 19, 57–71. [CrossRef]
- Costa, M.; De Angelis, L. The multidimensional measurement of poverty: A fuzzy set approach. Statistica 2008, 68, 303–319. [CrossRef]
- Morales-Ramos, M.A.; Morales-Ramos, E. La teoría de conjuntos difusos como una opción para medir la pobreza: El caso de México. El Trimest. Econ. 2008, 75, 641–662. [CrossRef]
- Chacón, J.G.; Tinoco, A.E.; Salinas, J.F.; Portocarrero, L.; Lameda, C. Aproximación a una medición de la pobreza utilizando lógica difusa. In La Base de la Pirámide y la Innovación Frugal en América Latina; Graterol, M.E., Mendoza, M.I., Contreras, J.C., Graterol, R., Espinosa, J.F., Eds.; Astro Data S.A.: Maracaibo, Venezuela, 2016; pp. 82–97.
- Gao, S.; Sun, K. Poverty measure based on hesitant fuzzy decision algorithm under social network media. Symmetry 2020, 12, 384. [CrossRef]
- Bedoya, J.G.; Galvis, J.C. Una aplicación de la teoría fuzzy al análisis de la pobreza en Antioquia. Ens. Econ. 2015, 25, 127–150. Available online: https://ideas.repec.org/p/col/000418/014630.html (accessed on 27 June 2026).
- García-Vélez, D.; Núñez, J.J. Un enfoque alternativo para medir la pobreza multidimensional utilizando conjuntos difusos: Análisis espacial para Ecuador. Investig. Reg. 2022, 52, 37–58. [CrossRef]
- Chakravarty, S.R. An axiomatic approach to multidimensional poverty measurement via fuzzy sets. In Fuzzy Set Approach to Multidimensional Poverty Measurement; Lemmi, A., Betti, G., Eds.; Springer: Boston, MA, USA, 2006; pp. 49–72. [CrossRef]
- Zheng, B. Poverty: Fuzzy measurement and crisp ordering. Soc. Choice Welf. 2015, 45, 203–229. [CrossRef]
- Watts, H.W. The iso-prop index: An approach to the determination of differential poverty income thresholds. J. Hum. Resour. 1967, 2, 3–18. [CrossRef]
- Mveh-Abia, C.; Emvudu, Y.; Kokomo, E. Measurement of the monetary poverty in Cameroon using fuzzy measure theory. J. Stat. Econom. Methods 2018, 7, 1–3.
- Betti, G.; Verma, V. Fuzzy measures of the incidence of relative poverty and deprivation: A multi-dimensional perspective. Stat. Methods Appl. 2008, 17, 225–250. [CrossRef]
- Pham, A.T.Q.; Mukhopadhaya, P. Measurement of poverty in multiple dimensions: The case of Vietnam. Soc. Indic. Res. 2018, 138, 953–990. [CrossRef]
- Betti, G.; Cheli, B.; Lemmi, A.; Verma, V. Multidimensional and longitudinal poverty: An integrated fuzzy approach. In Fuzzy Set Approach to Multidimensional Poverty Measurement; Lemmi, A., Betti, G., Eds.; Springer: Boston, MA, USA, 2006; pp. 111–137. [CrossRef]
- Marinakis, A. Desempolvando el salario mínimo: Reflexiones a partir de la experiencia en el Cono Sur. In ¿Para qué sirve el salario mínimo? Elementos para su determinación en los países del Cono Sur; Marinakis, A., Velasco, J.J., Eds.; Oficina Internacional del Trabajo: Santiago, Chile, 2006; pp. 11–34.
- Instituto Nacional de Estadística e Informática. Perú: Evolución de la pobreza monetaria 2014–2023; Technical Report; INEI: Lima, Peru, 2024. Available online: https://cdn.www.gob.pe/uploads/document/file/6469130/5558432-peru-evolucion-de-la-pobreza-monetaria-2014-2023.pdf?v=1718204242 (accessed on 27 June 2026).
Figure 1.
Poverty line and classical measurement.
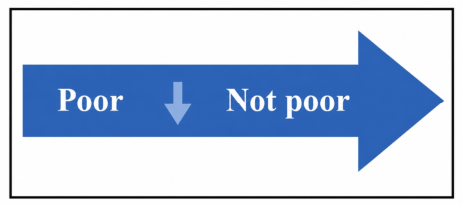
Figure 2.
Membership function of the fuzzy set poverty.
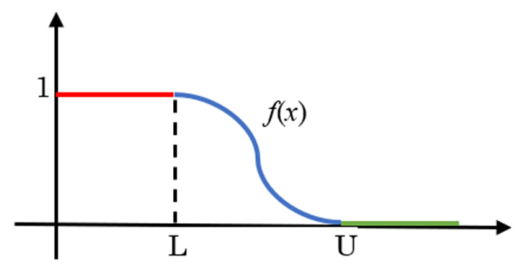
Figure 6.
Province of Trujillo with its districts.
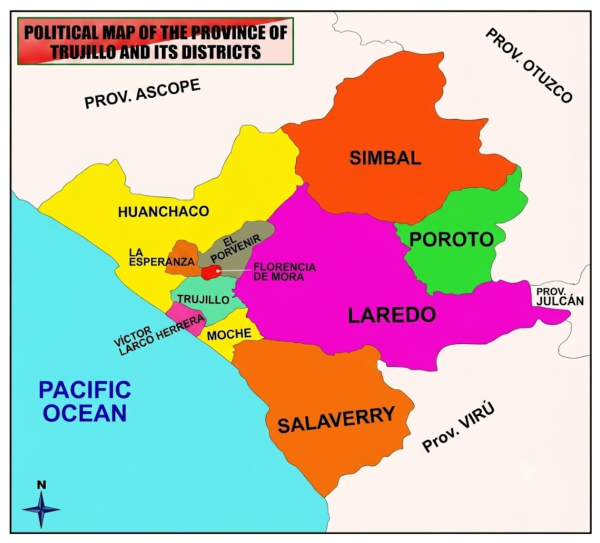
Figure 7.
Membership function of net income.
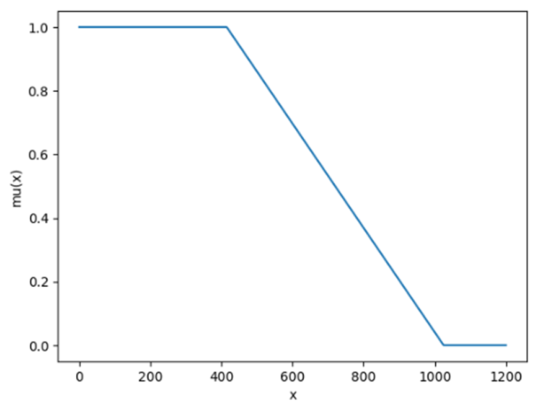
Figure 8.
Membership function of food expenses.
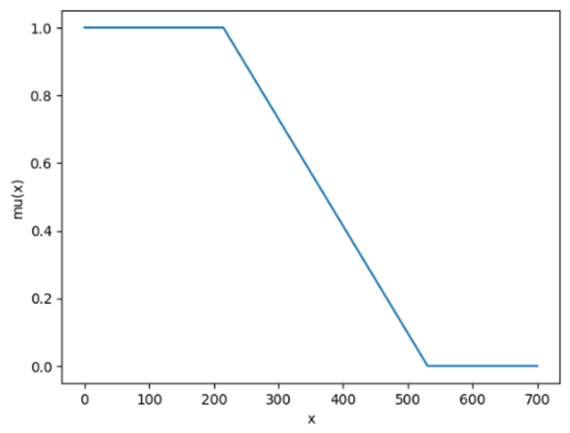
Figure 9.
Membership function of social support.
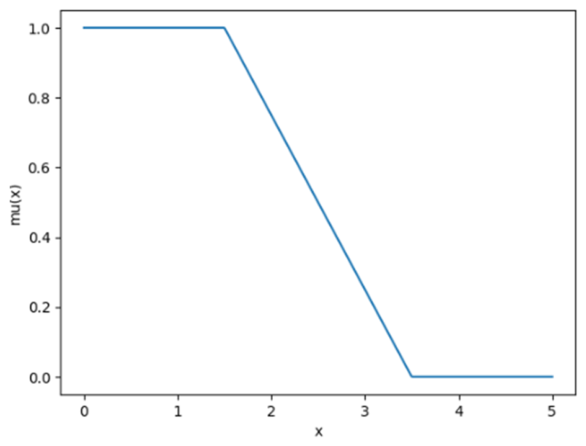
Figure 10.
Poverty levels in Trujillo according to INEI and fuzzy measurement.
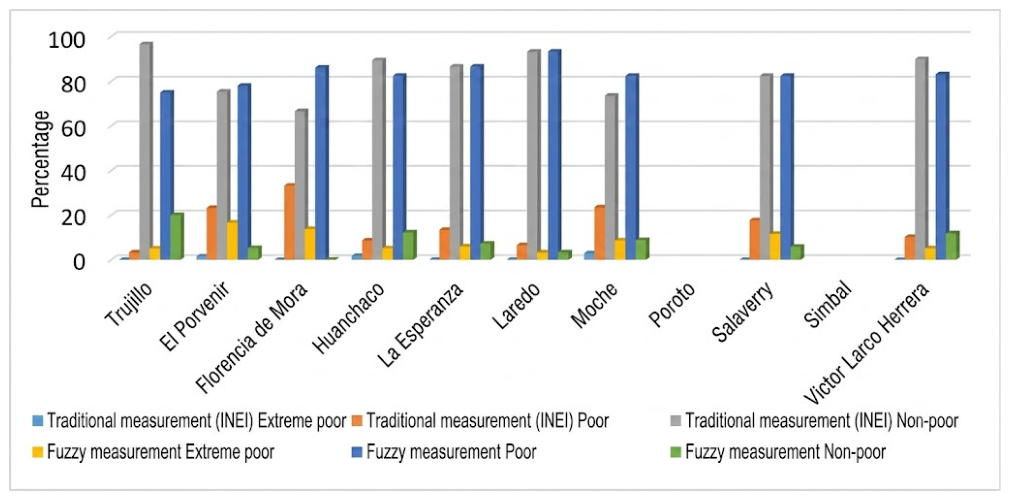
Figure 11.
Map of the province of Trujillo with the fuzzy poverty rates by district.
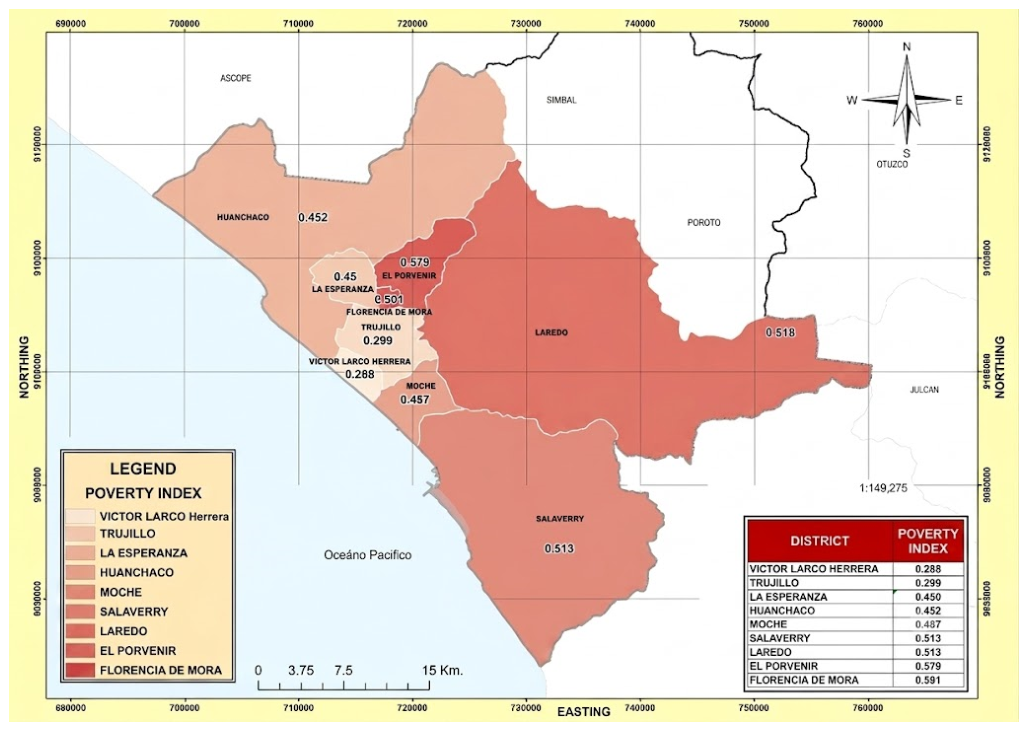

Table 1.
The districts of Trujillo with their location and population.
| Nº | District | Location Code | Population | Households surveyed | Population Surveyed |
| 1 | Trujillo | 130101 | 329,127 | 235 | 759 |
| 2 | El Porvenir | 130102 | 196,333 | 150 | 544 |
| 3 | Florencia de Mora | 130103 | 42,978 | 36 | 157 |
| 4 | Huanchaco | 130104 | 72,237 | 57 | 214 |
| 5 | La Esperanza | 130105 | 190,881 | 149 | 543 |
| 6 | Laredo | 130106 | 36,353 | 30 | 105 |
| 7 | Moche | 130107 | 35,945 | 34 | 137 |
| 8 | Poroto | 130108 | 3,127 | 0 | 0 |
| 9 | Salaverry | 130109 | 19,095 | 17 | 69 |
| 10 | Simbal | 130110 | 4,433 | 0 | 0 |
| 11 | Victor Larco Herrera | 130111 | 66,607 | 59 | 182 |
| TOTAL | 997,116 | 767 | 2,710 |
Table 2.
Thresholds for monetary poverty indicators.
| Indicators | Rating | Lower Threshold | Upper Threshold |
| Net income | In soles | 414.87 | 1,025 |
| Food expenses | In soles | 214.74 | 530.55 |
| Social support | {1, 2, 3, 4, 5} | 1.5 | 3.5 |
Table 3.
Indicators with membership functions and weights.
| Indicator | Membership Function | Weight |
| Net Income | 0.45312849 | |
| Food Expenses | 0.17792382 | |
| Social Support | 0.36894769 |
Table 4.
Family Poverty Classification in Trujillo Province According to INEI.
| Districts | Classical Measurement (INEI) | ||
| Extremely poor | Poor | Non-poor | |
| Trujillo | 0 | 3.4 | 96.6 |
| El Porvenir | 1.33 | 23.33 | 75.34 |
| Florencia de Mora | 0 | 33.33 | 66.67 |
| Huanchaco | 1.76 | 8.77 | 89.47 |
| La Esperanza | 0 | 13.42 | 86.58 |
| Laredo | 0 | 6.67 | 93.33 |
| Moche | 2.94 | 23.53 | 73.53 |
| Poroto | --- | --- | --- |
| Salaverry | 0 | 17.65 | 82.35 |
| Simbal | --- | --- | --- |
| Víctor Larco Herrera | 0 | 10.17 | 89.83 |
| In the Province | 0.52 | 12.91 | 86.57 |
Table 5.
Family Poverty Classification in Trujillo Province According Fuzzy Measurement.
| Districts | Fuzzy Measurement | ||||||||
| Net Income | Food Expenditure | Social Support | |||||||
| Extremely poor | Poor | Non-poor | Extremely poor | Poor | Non-poor | Very insufficient | insufficient | Sufficient | |
| Trujillo | 8.51 | 28.94 | 62.55 | 24.25 | 55.32 | 20.43 | 13.19 | 20 | 66.81 |
| El Porvenir | 23.33 | 51.33 | 25.34 | 41.33 | 53.33 | 5.34 | 30.66 | 42.67 | 26.67 |
| Florencia de Mora | 25 | 44.44 | 30.56 | 52.78 | 47.22 | 0 | 38.9 | 30.55 | 30.55 |
| Huanchaco | 15.78 | 42.11 | 42.11 | 31.58 | 54.38 | 14.04 | 22.81 | 31.58 | 45.61 |
| La Esperanza | 11.41 | 51.68 | 36.91 | 27.52 | 63.09 | 9.39 | 18.79 | 36.24 | 44.97 |
| Laredo | 13.33 | 50 | 36.67 | 23.33 | 73.33 | 3.34 | 16.67 | 46.66 | 36.67 |
| Moche | 8.82 | 55.88 | 35.30 | 32.35 | 55.88 | 11.77 | 26.47 | 35.29 | 38.24 |
| Poroto | --- | --- | --- | --- | --- | --- | --- | --- | --- |
| Salaverry | 11.76 | 58.82 | 29.41 | 41.18 | 52.94 | 5.88 | 35.29 | 35.29 | 29.42 |
| Simbal | --- | --- | --- | --- | --- | --- | --- | --- | --- |
| Víctor Larco Herrera | 5.09 | 28.81 | 66.10 | 20.34 | 67.8 | 11.86 | 16.95 | 13.56 | 69.49 |
| In the Province | 13.33 | 42.11 | 44.59 | 30.51 | 57.63 | 11.86 | 21.12 | 30.51 | 48.37 |
Table 6.
Percentage of Families in Poverty Categories in the Province of Trujillo.
| Districts | Classical measurement (INEI) | Fuzzy Measurement | ||||
| Extremely poor | Poor | Non-poor | Extremely poor | Poor | Non-poor | |
| Trujillo | 0 | 3.4 | 96.6 | 5.11 | 74.89 | 20 |
| El Porvenir | 1.33 | 23.33 | 75.34 | 16.67 | 78 | 5.33 |
| Florencia de Mora | 0 | 33.33 | 66.67 | 13.89 | 86.11 | 0 |
| Huanchaco | 1.76 | 8.77 | 89.47 | 5.26 | 82.46 | 12.28 |
| La Esperanza | 0 | 13.42 | 86.58 | 6.04 | 86.58 | 7.38 |
| Laredo | 0 | 6.67 | 93.33 | 3.33 | 93.34 | 3.33 |
| Moche | 2.94 | 23.53 | 73.53 | 8.82 | 82.36 | 8.82 |
| Poroto | --- | --- | --- | --- | --- | --- |
| Salaverry | 0 | 17.65 | 82.35 | 11.76 | 82.36 | 5.88 |
| Simbal | --- | --- | --- | --- | --- | --- |
| Víctor Larco Herrera | 0 | 10.17 | 89.83 | 5.09 | 83.05 | 11.86 |
| In the Province | 0.52 | 12.91 | 86.57 | 8.22 | 80.7 | 11.08 |
Table 7.
Percentage of Families by Poverty Categories and Levels.
| Districts | Extreme Poverty | Severe Poverty | Medium Poverty | Moderate Poverty |
Mild Poverty |
Non- poverty | |
| Trujillo | 5.11 | 11.06 | 12.34 | 6.38 | 45.11 | 20 | |
| El Porvenir | 16.67 | 22 | 25.34 | 9.33 | 21.33 | 5.33 | |
| Florencia de Mora | 13.89 | 36.11 | 11.11 | 8.33 | 30.56 | 0 | |
| Huanchaco | 5.26 | 24.56 | 15.79 | 10.53 | 31.58 | 12.28 | |
| La Esperanza | 6.04 | 18.79 | 21.48 | 12.75 | 33.56 | 7.38 | |
| Laredo | 3.33 | 33.34 | 23.33 | 3.33 | 33.34 | 3.33 | |
| Moche | 8.82 | 29.41 | 11.77 | 8.82 | 32.36 | 8.82 | |
| Poroto | ---- | ---- | ---- | ---- | ---- | ---- | |
| Salaverry | 11.76 | 17.65 | 23.53 | 11.77 | 29.41 | 5.88 | |
| Simbal | ---- | ---- | ---- | ---- | ---- | ---- | |
| Víctor Larco Herrera | 5.09 | 15.25 | 6.78 | 3.39 | 57.63 | 11.86 | |
| In the Province | 8.22 | 19.03 | 17.08 | 8.47 | 36.12 | 11.08 | |
Table 8.
Percentage of Poor Families by Level.
| Districts |
Severe Poverty |
Medium Poverty |
Moderate Poverty |
Mild Poverty |
| Trujillo | 14.77 | 16.48 | 8.53 | 60.22 |
| El Porvenir | 28.2 | 32.48 | 11.97 | 27.35 |
| Florencia de Mora | 41.94 | 12.9 | 9.68 | 35.48 |
| Huanchaco | 29.79 | 19.15 | 12.77 | 38.29 |
| La Esperanza | 21.7 | 24.81 | 14.73 | 38.76 |
| Laredo | 35.71 | 25 | 3.57 | 35.72 |
| Moche | 35.71 | 14.29 | 10.71 | 39.29 |
| Poroto | ---- | ---- | ---- | ---- |
| Salaverry | 21.43 | 28.57 | 14.29 | 35.71 |
| Simbal | ---- | ---- | ---- | ---- |
| Víctor Larco Herrera | 18.37 | 8.16 | 4.08 | 69.39 |
| In the province | 23.31 | 21.12 | 10.46 | 45.11 |
Disclaimer/Publisher’s Note: The statements, opinions and data contained in all publications are solely those of the individual author(s) and contributor(s) and not of MDPI and/or the editor(s). MDPI and/or the editor(s) disclaim responsibility for any injury to people or property resulting from any ideas, methods, instructions or products referred to in the content. |
© 2026 by the authors. Licensee MDPI, Basel, Switzerland. This article is an open access article distributed under the terms and conditions of the Creative Commons Attribution (CC BY) license (http://creativecommons.org/licenses/by/4.0/).
Copyright: This open access article is published under a Creative Commons CC BY 4.0 license, which permit the free download, distribution, and reuse, provided that the author and preprint are cited in any reuse.