

Submitted:
31 July 2026
Posted:
04 August 2026
You are already at the latest version
Abstract
Background: Becker’s muscular dystrophy (BMD) is a clinically heterogeneous dystrophinopathy caused by in-frame mutations in the dystrophin gene, resulting in variable disease severity. This variability limits the effectiveness of standardized functional measures for tracking progression. Circulating biomarkers, including urinary titin fragments generated during muscle injury, offer a promising noninvasive approach for assessing disease status. Methods: Mass spectrometry-based urinary proteomic profiling identified titin fragments as candidate biomarkers of muscle injury in BMD. Titin fragments were validated in urine samples from 50 BMD subjects (33 ambulatory, 17 non-ambulatory) and 11 age-matched healthy controls using targeted mass spectrometry and ELISA. Results: Urinary titin levels were significantly elevated by 4.75-fold and 2.47-fold in ambulatory and non-ambulatory BMD patients, respectively, compared with healthy controls. Titin levels also distinguished ambulatory from non-ambulatory BMD patients, demonstrating potential utility for monitoring disease progression and therapeutic response. Conclusions: Urinary titin fragments represent a promising noninvasive biomarker for BMD, with potential applicability to related neuromuscular disorders and clinical trials evaluating disease progression and treatment efficacy.
Keywords:
Becker muscular dystrophy
; biomarkers
; n-terminal titin
; urine samples
; proteomics
; non-invasive
1. Introduction
Becker Muscular Dystrophy (BMD) is an X-linked recessive inherited disease typically caused by in-frame mutations in the dystrophin gene that lead to the expression of partially functional dystrophin [1,2]. Despite its clinical significance, BMD has historically received less attention and translational research focus compared to Duchenne Muscular Dystrophy (DMD). This disparity is largely due to the longstanding perception of BMD as a “mild” form of the muscular dystrophies [3,4]. However, the BMD population is very heterogeneous with symptoms ranging from relatively mild muscle weakness allowing individuals to walk into their 50s to severe early onset weakness resulting in loss of ambulation typically before the ages of 12-15 [1]. Because of this heterogeneity, there is a lack of standardized and validated outcome measures for BMD as compared to DMD [5]. Many clinical assessment tools and trial endpoints were originally developed for DMD and may not fully capture the slower progression or distinct clinical features of BMD. As a result, subtle but clinically meaningful changes in function may go undetected in research settings.
Circulating biomarkers, on the other hand, are increasingly shedding light on assessing the severity and progression of BMD [6]. If validated, they could become useful tools for assessing disease severity, monitoring disease progression, evaluating response to therapies, and enhancing overall treatment strategies. Further biomarker studies are therefore needed to support more personalized treatment approaches and ultimately improve outcomes and quality of life for individuals with BMD.
BMD patients generally share similar circulating biomarkers as DMD patients but typically at different levels. Both disorders are characterized by elevated serum creatine kinase (CK), an enzyme that leaks out due to muscle damage, and often used as a pre-diagnostic biomarker for DMD and BMD [7]. However, it has limited utility in assessing disease severity and progression in these dystrophinopathies because it did not correlate with clinical outcome measures [6,8].
Other biomarkers measured in serum samples such as creatine to creatinine ratios, and titin have been recently shown to correlate with disease severity in BMD [6,9]. Furthermore, the N-terminal fragment of titin detected in urine, has been shown to be a key indicator of muscle injury in a number of muscular dystrophies and non-muscle disease including DMD [10,11], adult spinal muscular atrophy (SMA) [12], myotonic dystrophy (DM1) [13], Fukuyama congenital muscular dystrophy (FCMD) [14], sarcopenia in diabetes [15], acute cerebral stroke [16], amyotrophic lateral sclerosis (ALS) [17], and patients with intensive care-acquired weakness [18]. Its clinical utility has been demonstrated based on its ability to assess muscle damage across different muscle and its response to dystrophin restoring therapies such as AAV-gene therapy [19].
In this study, we performed urinary proteome profiling to identify potential non-invasive protein biomarkers for assessing muscle injury in individuals with BMD, across a broad range of disease severities and ages. Titin fragments generated through titin proteolytic cleavage during muscle degeneration were consistently detected in higher levels in the urine of individuals with BMD than in healthy controls. Specifically, urinary levels of the N-terminal titin fragment were 4.75-fold and 2.47-fold higher in ambulatory and non-ambulatory individuals with BMD, respectively, compared with healthy controls.
2. Materials and Methods
2.1. Study Participants, Demographics, and Urine Collection
This biomarker study was approved by the Institutional Review Board at Binghamton University. Information about the study was disseminated through Parent Project Muscular Dystrophy (PPMD), BMD specific support groups and forums on Facebook, physicians who treat patients with BMD, and through the Muscular Dystrophy Associations email listserv and outreach publications. Interested participants or parent guardians of the participant contacted the clinical coordinator to express interest in the study. Participants ranged in age from 6 to 73 years. After providing informed consent (or parental consent and assent, when applicable), participants were asked to provide a copy of their DNA diagnostic bloodwork to confirm a diagnosis of BMD. A mobile phlebotomist collected blood and urine samples at the participants’ homes. Urine samples were collected from 50 participants, stratified at the time of collection as ambulatory BMD (n = 33) and non-ambulatory BMD (n = 17). Immediately after collection, urine samples were filtered by the phlebotomist through a 0.22 μm Millipore Nylon filter into 15 ml FalconTM High Clarity Polypropylene Conical tubes, placed into biohazard bags, and shipped on dry ice via FedEx to Binghamton University School of Pharmacy and Pharmaceutical Sciences. To minimize repeated freeze–thaw cycles, the samples were aliquoted into 1 mL working volumes upon arrival and stored at −80 °C until subsequent processing and analysis. All samples were processed and analyzed using the same procedures to reduce variability associated with sample handling.
Heathy control urine samples were collected from local volunteers who were recruited through an advertisement in the university e-communications daily newsletter. Upon completion of informed consent, the participants visited the School of Pharmacy building, providing up to 100 ml of urine. The healthy control volunteers (age range 24 to 64) confirmed that they had not taken any glucocorticoids or other medications within the past 90 days. Urine samples were collected from 11 healthy volunteers and processed as described above.
The following patient reported outcomes were collected for BMD patient samples: age, age of onset of symptoms, age of loss of ambulation, exon mutation type, and medication regimen. For healthy controls, age and medication regimen were collected.
2.2. Study Design:- Different Methods and Sample Numbers Used for Measurement of Urinary Proteins
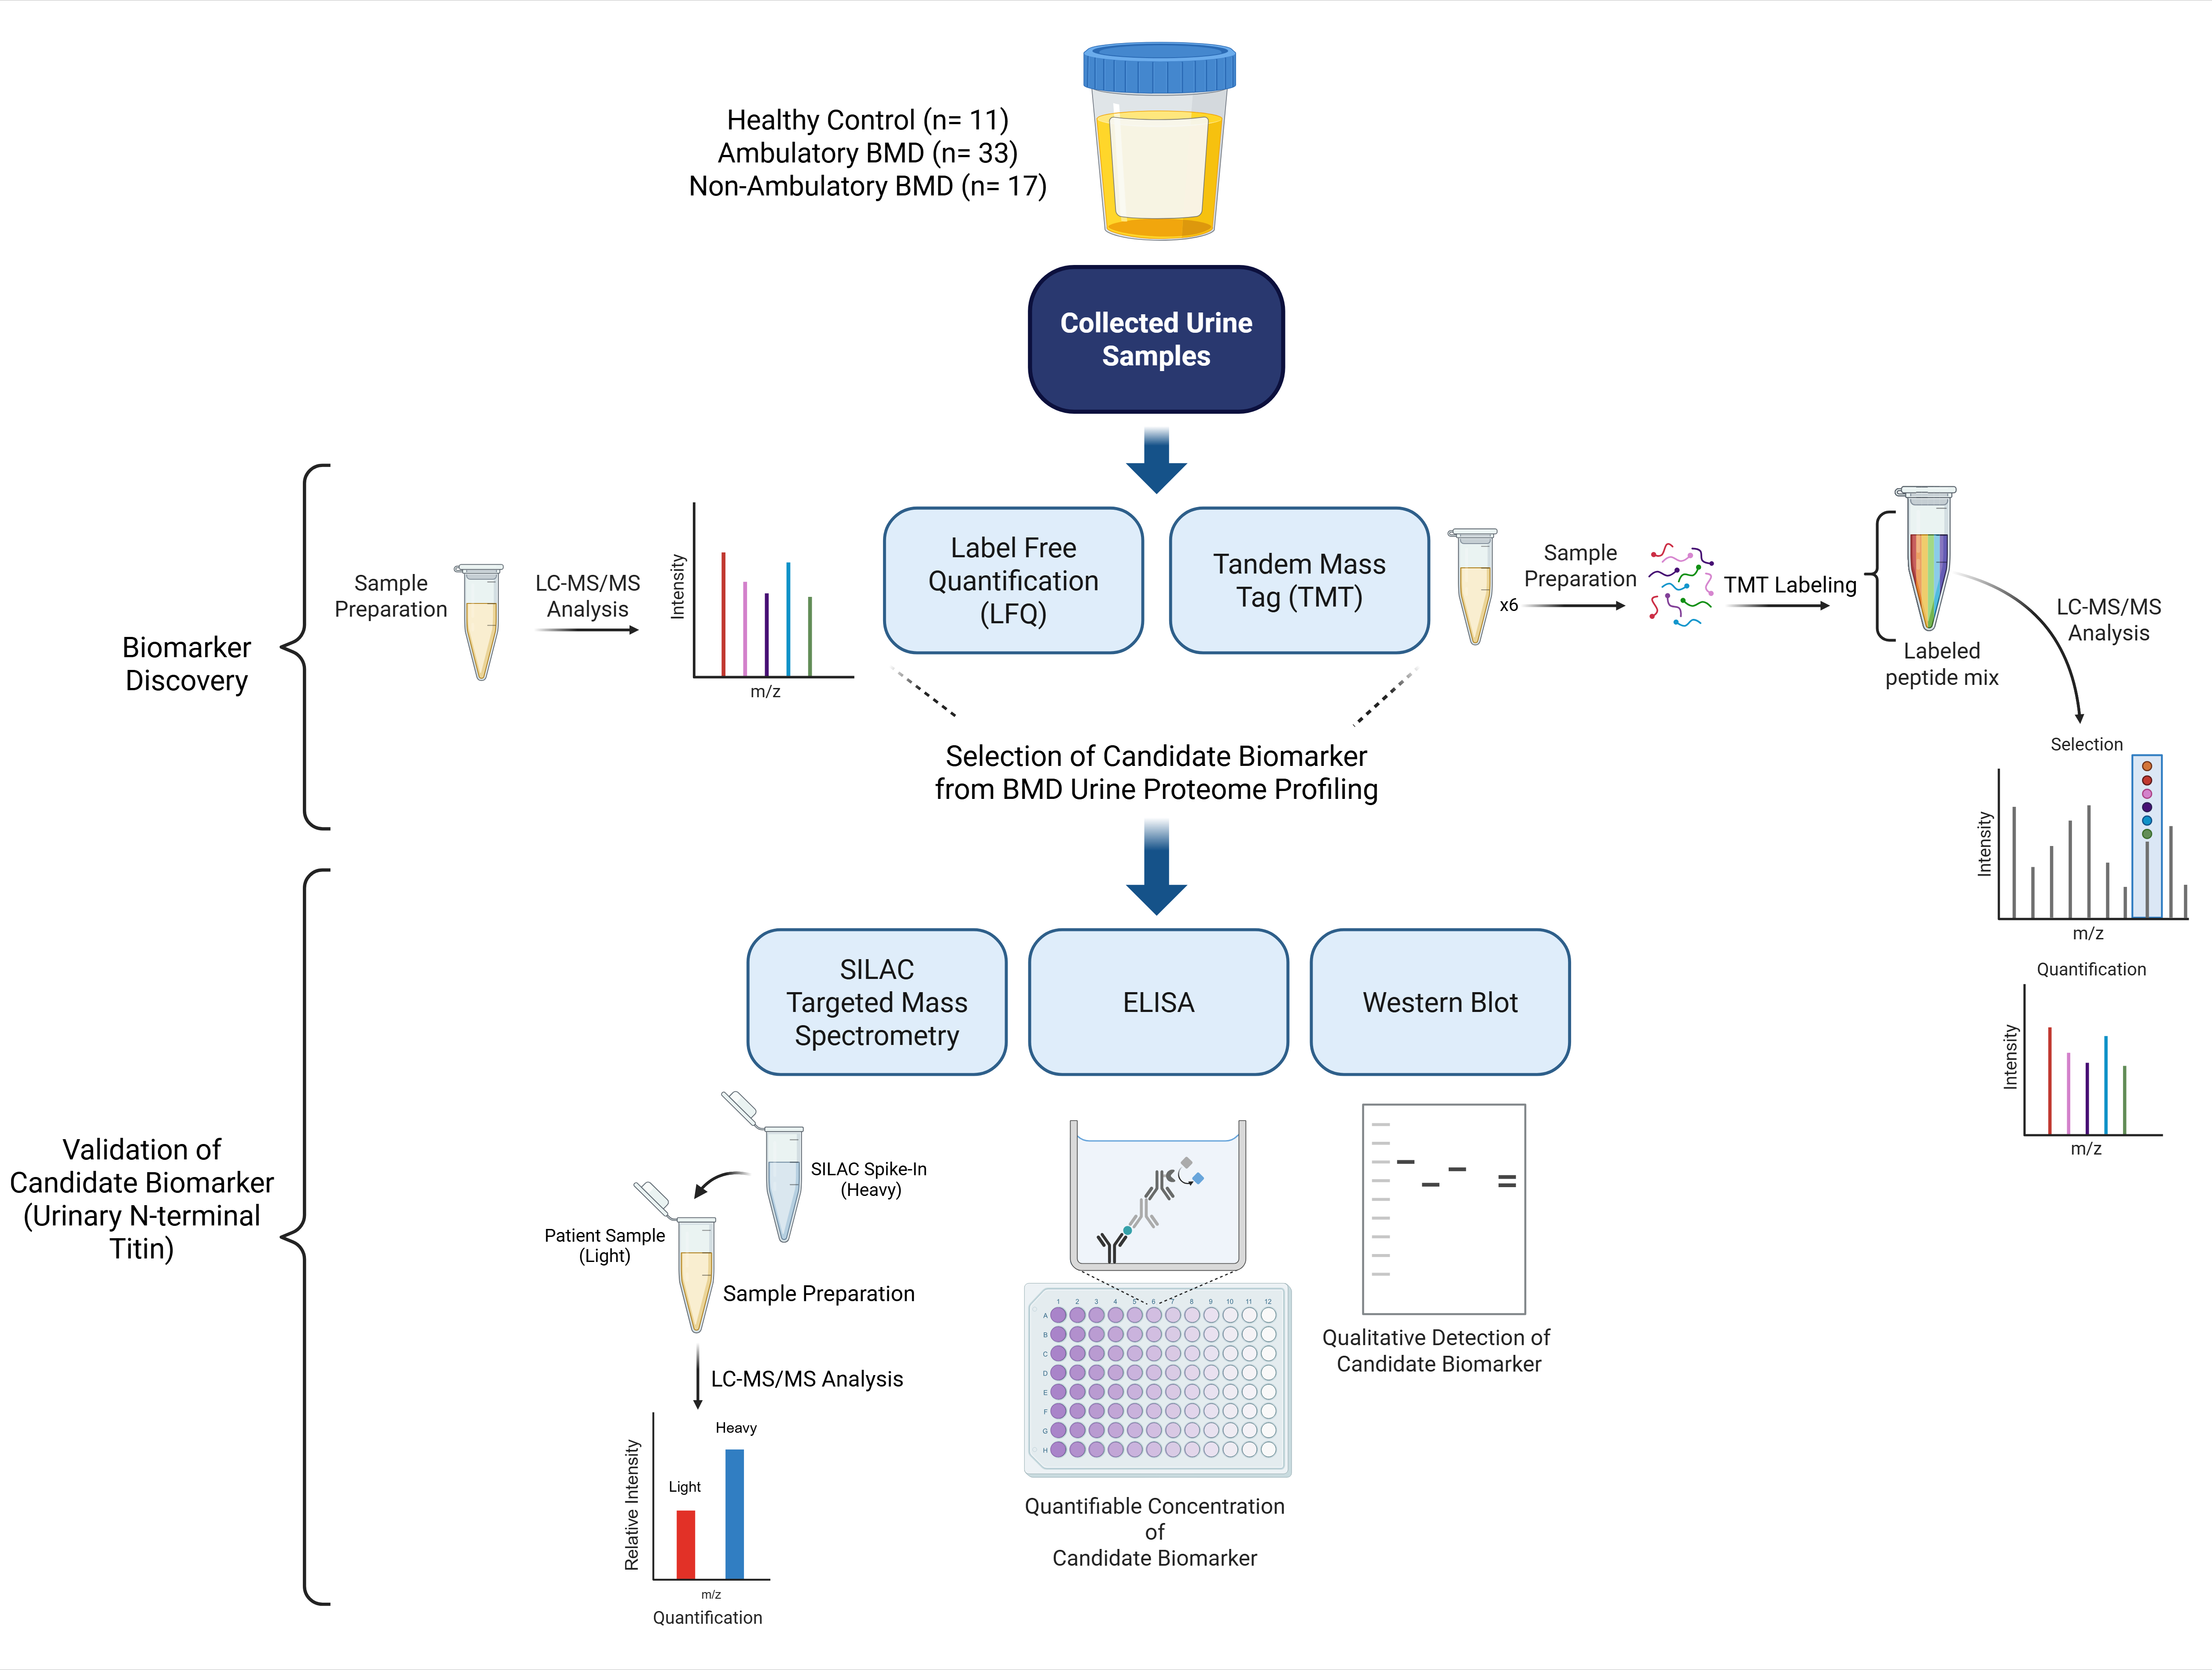
This study was structured into two phases: discovery and validation. We used two independent quantitative proteomics methods for the discovery of candidate BMD biomarkers in urine samples: the Label-Free Quantification (LFQ) and the tandem mass tag (TMT) based quantification. The LFQ methods were performed for initial preliminary assessment of the overall urine proteome by focusing on a small cohort of samples (ambulatory BMD (n=5), non-ambulatory BMD (n = 4), healthy controls (n = 5)). This was followed by TMT based quantification also performed in a small cohort (ambulatory BMD (n=3), non-ambulatory BMD samples (n=3), to age-matched healthy controls (n=3), to confirm our initial findings in an isolated method. In both methods, urinary N-terminal titin appeared to be a candidate due to its significant difference in not only disease severity to control (aBMD/Cnt or naBMD/Cnt) but also between the disease severities (aBMD/naBMD).
This prompted for further validation of urinary N-terminal titin using targeted mass spectrometry (ambulatory BMD (n=21), non-ambulatory BMD (n=6), age-matched healthy controls (n = 3)), a commercially available ELISA (ambulatory BMD (n=10), non-ambulatory BMD (n=20), age-matched healthy controls (n = 10)), and western blot analysis (ambulatory BMD (n=3), non-ambulatory BMD (n=3), age-matched healthy controls (n = 3).The differing cohort samples were attributed to limitations in sample availability and quality for analysis.
In our methods of analysis of our quantitative results using the commercially available ELISA, urinary N-terminal titin levels were normalized using total protein. Normalization in the context of this manuscript is a ratio-based parameter used to account for the variation in urinary protein biomarkers.
2.2.1. Label-Free Quantitative Proteomics
Urine aliquots containing 15 μg of total protein were vacuum-centrifuged to approximately 100 μL in Eppendorf LoBind tubes (Fisher Scientific, Waltham, MA, USA) to prevent protein loss. Subsequently, 25 μL of 0.5% SDS was added, and samples were heated at 40 °C for 15 minutes with shaking at 500 rpm. Protein disulfide bonds were reduced by adding 7 μL of 200 mM dithiothreitol (DTT) prepared in 25 mM ammonium bicarbonate, followed by incubation at 60 °C for 1 hour with shaking at 500 rpm. Reduced cysteines were alkylated by adding 44 μL of 200 mM iodoacetamide (IAA) in 25 mM ammonium bicarbonate and incubating for 30 minutes at 30 °C while shaking in the dark. Proteins were precipitated by adding 900 μL (approximately 4–5 volumes) of ice-cold 100% acetone (−20° C), followed by centrifugation at 17,000 × g for 30 minutes at 4 °C. Samples were then stored at –80 °C for 20 minutes to enhance protein precipitation and centrifuged again at 17,000 × g at 4 °C for 10 minutes. The acetone was carefully removed by decanting or pipetting without disturbing the pellet. Pellets were air-dried for 2 minutes at 37 °C. Proteins were digested by adding 100 μL of 25 mM ammonium bicarbonate and 3 μL of 0.10 μg/μL sequencing grade trypsin solution (Promega, Madison, WI, USA), followed by overnight incubation at 37 °C with shaking at 500 rpm. Digestion was stopped by adding 5 μL of 2.5% trifluoroacetic acid (TFA) and 200 μL of 0.1% TFA prior to fractionation.
Each sample was fractionated using Pierce™ High-pH Reversed-Phase Peptide Fractionation columns (Thermo Fisher Scientific, Waltham, MA, USA). Peptides were sequentially eluted with solutions containing 7.5%, 12.5%, 17.5%, and 50% acetonitrile in 0.1% triethylamine. The resulting eluates were vacuum-dried at 45 °C until completely dry and stored at –80 °C until mass spectrometry analysis.
2.2.2. Tandem Mass Tag (TMT)
All the reagents used for TMT preparation were from TMT Sixplex Isobaric Mass Tagging Kit (Thermo Fisher Scientific, Waltham, MA, USA). Aliquots of 100−350 μL containing 30 μg of total proteins from each sample were vacuum-dried to 30 μL and denatured with 20 μL of 1% sodium dodecyl sulfate (SDS) and heated at 40 °C for 15 minutes at 450 rpm. Disulfide bonds were reduced by adding 5 μL of 200 mM Tris(2-carboxyethyl) phosphine (TCEP) followed by incubation at 55 °C for 1 hour at 450 rpm. Free thiols were then alkylated by adding 5 μL of 375 mM iodoacetamide (IAA) followed by incubation at 40 °C for 1.5 hours in the dark at 450 rpm. Proteins were then precipitated by adding 360 μL of ice-cold 100% acetone (−20 °C), followed by centrifugation at 15,000 rpm for 30 minutes at 4 °C. For acetone washing, the supernatant was removed slowly, leaving 10-20 μL in tube to not disturb the pellet, 20-30 μL of HPLC H2O was added to the sample to complete a total volume of 60 μL. Samples were then stored at -20 °C for 20 minutes, followed by adding 360 μL of ice cold 100% acetone (-20 °C) before repeating the centrifugation step at 15,000 rpm for 30 minutes at 4 °C. The precipitate from each sample was kept at −20 °C overnight (~16 hours). The mixture was then centrifuged again the next day at 15,000 rpm for 20 minutes at 4 °C and the sample went through the same acetone wash for an additional two times to get rid of the remaining salt completely, after the last centrifugation step, supernatant was removed leaving behind 10-20 μL to not disturb the pellet. The remaining supernatant was then dried on a heat block with the cap open for approximately 15 minutes at 45 °C. Then, 100 μL of 50 mM triethyl ammonium bicarbonate (TEAB) was added to the protein pellet and vortexed for 1 minute. For protein digestion, an adequate amount of enzyme was added to have a 1/100 enzyme to protein amount, essentially 1 μg of trypsin for 100 μg of protein was 6 μL, specifically MS Grade Trypsin Protease (Thermo Fisher Scientific, Waltham, MA, USA), was added to each sample, incubated for 4 hours, at 37 °C at 450 rpm, vortexing gently and spun down with a table centrifuge every hour, the same amount of trypsin was added to the sample, for a final enzyme/protein ratio of 1:50 (w/w) for overnight protein digestion at 37 °C, 450 rpm. For checkpoint purposes, 10 μL of sample were dried down in Lo-Bind tubes, reconstituted in 0.1% formic acid, and loaded on mass spectrometer to test for digestion efficiency. Another 10 μL of sample, stored in Lo-Bind tubes, was processed through a Quantitative Fluorometric Peptide Assay (Thermo Scientific, Waltham, MA, USA) at a ¼ dilution (adding 30 μL HPLC H2O), to confirm equal amounts of peptide material in each sample. The remainder of the sample was frozen at -80 °C in Lo-Bind tubes for TMT mass tagging following the manufacturer protocol (Thermo Fisher Scientific, Waltham, MA, USA).
After TMT labeling samples with different mass tags were combined into one single tube, dried by vacuum centrifugation, resuspended in 300 μL of 0.1% TFA and subjected to high pH reversed phase fractionation. In total, 10 consecutive fractions were collected with elution buffers gradually increasing with ACN between 5%, 7.5%, 10%, 12.5%, 15%, 17.5%, 20%, 50%, 65%, and 80%, all in triethylamine. The flow through (FT), wash (W), and 10 collected factions were dried using a SpeedVac vacuum concentrator (Thermo Fisher Scientific, Waltham, MA, USA) the same day or stored overnight to put on the vacuum centrifuge the following morning and stored at −20 °C until nano LC−MS/MS analysis.
2.2.3. Liquid Chromatography-Based Mass Spectrometry (LC-MS/MS) and Data Processing
Each dried peptide sample was resuspended in 10–20 μL of 0.1% formic acid and transferred to an autosampler vial for mass spectrometry analysis. Samples (2 μg aliquots) were loaded onto a nano-LC system (Dionex UltiMate 3000 RS UPLC) coupled to a Q Exactive HF-X Hybrid Quadrupole-Orbitrap Mass Spectrometer and processed in order of high pH fractionation elutions, four for LFQ per sample and 12 for TMT per condition comparison. A two-hour gradient was used with mobile phase A (0.1% formic acid in water) and mobile phase B (0.1% formic acid in 80% acetonitrile). An EASY-Spray LC Column (75 μm inner diameter, 50 cm length, 100 Å pore size, 2 μm particle size (Thermo Scientific, Waltham, MA, USA) was equilibrated with 98% mobile phase A and 2% mobile phase B for 8 minutes, followed by a 5–30% B gradient over 87 minutes, 30–100% B over 5 minutes, 100% B for 5 minutes, 100–2% B over 5 minutes, and at re-equilibration at 2% B for 10 minutes. Data-dependent acquisition (DDA) was performed at a resolution of 120,000 over a scan range of 375–1600 m/z. Each cycle consisted of one full MS scan followed by 20 MS/MS scans. MS/MS spectra were acquired at 27 eV normalized collision energy, with a spray voltage of 3.0 kV and a column temperature of 35 °C.
Protein identification was performed against the human proteome database (UniProtKB/Swiss-Prot; TaxID 9606, release 2017-07-05; 25,496 entries) using the Sequest algorithm implemented in Proteome Discoverer (Thermo Fisher Scientific, Waltham, MA, USA). A precursor mass tolerance of ±10 ppm and a fragment mass tolerance of ± 0.05 Da were used. The following were set as variable modifications: carbamidomethylation of cysteine, oxidation of methionine, acetylation of peptide N-termini. Peptide-spectrum matches (PSMs) and peptides were filtered using a target–decoy strategy at a strict 1% false discovery rate (FDR). Label free quantitative proteomics were performed using PSMs as previously described [20].
TMT Quantitative Proteomics: Database searching for TMT-based quantitative proteomics was performed in the same manner as for label-free proteomics, with the exception that TMT 6-plex modifications on lysine side chains and peptide N-termini were included as static modifications. Peptide–spectrum matches were filtered using a target–decoy strategy to maintain a false discovery rate (FDR) below 1% at both the peptide and protein levels. Reporter ion–based quantification was performed in Proteome Discoverer using the TMT 6-plex workflow. Reporter ions (m/z 126, 127, 128, 129, 130, and 131) were quantified with a mass tolerance of 0.05 Da, and the most confident centroid peak was used for integration. Only unique peptides were used for quantification, and spectra containing any missing reporter ion channels were excluded. Isotopic impurity corrections provided by the manufacturer were applied to the reporter ion intensities. A minimum signal-to-noise ratio of 1.5 was required for each channel. Normalization was performed using the “total peptide amount” normalization mode in the consensus workflow. The overall peptide abundance in each sample was calculated by summing the reporter ion intensities of the corresponding protein across all fractions.
2.2.4. Validation of Titin Biomarker Candidate Using Targeted Mass Spectrometry
Stable isotope labeled proteins including titin protein were generated through culture of immortalized human myoblast cells [22] in stable isotope labeled culture media (SILAC) where Arg and Lys were replaced by 13C6–Arg and 13C6,15N2–Lys (Thermo Fisher Scientific, Waltham, MA), methods to generate these human myotubes were previously described in Canessa et al., 2020 [21]. Total protein extracts containing stable isotope titin were used as internal standard to relatively quantify levels of titin fragments in urine samples from BMD (ambulatory n=21, non-ambulatory n=6) and age-matched healthy controls (n=3). Each urine sample containing 15 µg total protein was spiked with 2.0 μg SILAC labeled myotube extract. The following titin tryptic peptide VPAPVEIPVTPPTLVSGLK (Light m/z= 957.5692++, Heavy m/z= 961.5763++; RT:105.19) was targeted for quantification using PRM method.
Due to sample complexity, absolute quantification of titin in SILAC myotubes was performed using a 2-hour data-dependent acquisition (DDA) method for peptide discovery and a 2-hour parallel reaction monitoring (PRM) method for targeted quantification, samples were processed in duplicate. Both LC-MS/MS methods used identical chromatographic conditions. Mobile phase A consisted of 0.1% formic acid in water and mobile phase B of 0.1% formic acid in 80% acetonitrile. Peptides (2 μg) were separated on an EASY-Spray™ LC column (75 μm × 500 mm, 2 μm particles, 100 Å pore size; Thermo Scientific) at 0.300 μL/min. The gradient was: 2% B for 8 minutes; 5–30% B over 87 minutes; 30–100% B for 5 minutes; 100% B for 5 minutes; 100–2% B for 5 minutes; and 2% B for 5 minutes. DDA full MS scans were acquired at 120,000 resolution (375–1600 m/z), followed by 20 MS/MS scans at 30,000 resolution and 27 eV collision energy. PRM MS2 scans were acquired at 60,000 resolution, with all other parameters unchanged (300 V ion spray, 35 °C column temperature). Retention times and precursor m/z values from DDA runs were used to generate PRM methods for selected peptides. Protein identification was performed against the human SwissProt database (TaxID 9606; v2017-07-05) using the Sequest algorithm in Proteome Discoverer 2.2 (Thermo Fisher Scientific, Waltham, MA, USA) and resulting .msf files were imported into Skyline for quantification.
2.2.5. Validation of Titin Biomarker Candidate Using Commercially Available ELISA Assay
Urinary ELISA assay, targeting the N-terminal fragment of titin protein, was purchased from Immuno-Biological Laboratories, INC (IBL, Minneapolis, MN, USA) and used to validate the mass spectrometry data. This ELISA assay was previously used in numerous articles to measure levels of titin in urine samples [11,22,23]. The standard curve provided by the manufacturer set range of 46.88 ~ 3000 pmol/L, was converted to ng/mL for analysis, using the first 200 amino acids of titin protein as the molecular weight for calculations. Aliquots of 10 µL of urine samples from BMD subjects (n = 30) and age-matched healthy controls (n = 10) were diluted at 1:10, samples and standard curve were plated in duplicate at 100 µL/well and processed for ELISA assay as described in the manufacturer protocol. Samples were measured through a standard plate reader measuring absorbance of 450 nm. Analysis was done based on manufacturer instructions using quadratic regression of double logarithm conversion.
Data were normalized to total protein concentration in urine, as creatinine levels are known to fluctuate in individuals with disease severity in DMD and BMD [24]. For total protein quantification, urine samples were prepared using a Compat-Able Assay (Thermo Fisher Scientific, Waltham, MA, USA) with 0.5% SDS resolubilization prior to BCA assay analysis. This preparation step removed particulates that could interfere with the BCA assay, as well as salts, reducing agents, detergents, and intrinsic color from the urine samples. Total protein concentrations were then determined using MicroBCA/BCA assays (Thermo Fisher Scientific, Waltham, MA, USA). Other methods for normalization (creatinine, specific gravity) are provided in the supplemental.
2.2.6. Western Blot Analysis
To verify presence of N-terminal titin in the BMD urine samples, western blotting was performed on urine samples from healthy controls (n=3), ambulatory BMD (n=3), and non-ambulatory BMD (n=3) patients. Samples were concentrated down to 15 µg at 100 µL, desalted using Zeba Spin Desalting Columns 7K MWCO (Thermo Scientific, Waltham, MA, USA), centrifuged, acetone-precipitated, resolubilized in 0.5% SDS, and separated on NuPAGETM 4–12% Bis-Tris gels (Thermo Fisher Scientific, Waltham, MA, USA). Proteins were transferred overnight to nitrocellulose membranes, blocked, and incubated with anti-Titin 6H-5 antibody (Abnova Corporation, Taipei, Taiwan) overnight at 4 °C. After washes, membranes were incubated with HRP-conjugated secondary antibody, and signals were detected using ECL reagents on an Azure Biosystems Imager (Azure Biosystems, Dublin, California, USA).
2.2.7. Statistical Analysis
The raw mass spectrometry proteomics data supporting reported results in this study have been deposited to the ProteomeXchange Consortium via the PRIDE52 partner repository. GraphPad was used for analyzing the data. Volcano plots were made using R statistical software, tidyverse package including ggplot2 for visualization and data manipulation to compare the significant proteins found between the disease severities for the label-free proteome discovery phase. Significant biomarkers were categorized based on a Fold Change (FC) cut off of ≥ 1.5, ≤ -1.5; p-value ≤ 0.05. Statistical methods include multi-linear analysis, 2-tailed t-tests, correlation analysis, one-way ANOVA, and post-hoc analysis when necessary (Tukey’s, Dunnett’s T3, and Holm-Sidak’s). Targeted PRM analysis was log2-transformed to adjust for skewness of the data.
3. Results
3.1. Quantitative Proteome Profiling of BMD and Healthy Controls Urine Samples
3.1.1. Label-Free – Quantitative (LFQ) Proteomics Data
1,748 proteins were identified in analyzed after processing 14 urine samples, which included healthy control volunteer (n = 5), ambulatory BMD (n=5), and non-ambulatory BMD (n = 4).After removing proteins with missing data across all samples and excluding keratin contaminants, 795 proteins were retained for further analysis. Of these, 106 were significantly elevated (≥ 1.5-fold, p-value ≤ 0.05) and none were significantly decreased in urine samples of ambulatory BMD compared to healthy controls (Supplemental Figure S1a, Supplemental Table S1) while 25 proteins were found significantly increased (≥ 1.5-fold, p-value ≤ 0.05) and 2 were significantly decreased (≤ -1.5-fold, p-value ≤ 0.05) in non-ambulatory BMD compared to healthy controls (Figure 1b, Supplemental Table S2). Because urine contains proteins shed from different organs, we focused on muscle enriched protein. Uniprot and Human proteome atlas tissue specificity mapping of all significantly elevated proteins found in urine samples of both ambulatory and non-ambulatory BMD identified 6 potentially muscle enriched proteins and these are listed in Table 1. along with their fold changes and p-values in both BMD groups relative to controls.
As shown in Figure 1, a one-way ANOVA revealed a significant difference in the levels of urinary titin between groups, (F = 12.04, R2= 0.6865, p-value = 0.0017). Tukey’s HSD post-hoc test indicated significantly higher urinary titin levels in aBMD versus Cnt: (mean difference = - 44.80, (95% CI -69.48 to 20.1) adj. p-value = 0.0013). A secondary post-hoc analysis using healthy controls as the reference group was conducted with Dunnett’s T3, indicated significantly higher levels aBMD versus Cnt and naBMD versus Cnt (see Supplemental Figure S2). Additionally, a significant FC and p-value was determined between aBMD and healthy controls using t-test, FC: 33, p-value = 0.0029; a significant FC: 15.54 and p-value= 2.81e-5 was also determined between non-ambulatory BMD versus healthy controls. This significant change in urinary titin with disease stage makes it good biomarker candidate for validation using orthogonal methods as described below.
3.1.2. TMT – Quantitative Proteomics Data
In addition to our discovery phase using LFQ proteomics, a 6-plex TMT methodology was used to measure levels of proteins in urine samples from ambulatory BMD samples (n=3), non-ambulatory BMD samples (n=3), to age-matched healthy controls (n=3). For maintaining cohesion in analysis, ambulatory BMD samples were kept consistent and compared to both non-BMD and non-ambulatory BMD in our experiments. In this analysis, 1,349 proteins were identified and quantified across all 6 samples. Of these, 35 were found significantly elevated (≥ 1.5-fold, p-value ≤ 0.05) and 5 significantly decreased (≤ -1.5-fold, p-value ≤ 0.05) in ambulatory BMD relative to controls (see Supplemental Table S4). This TMT analysis identified many of the same muscle injury–related proteins detected by LFQ proteomics, along with additional proteins as shown in Table 2, albeit with different fold changes and p-values due to the quantitative dynamic range limitation of the TMT method. While TMT enables multiplexed analysis, often resulting in fewer missing values than LFQ, it is typically constrained by a narrower dynamic range of quantification, a limitation primarily driven by ratio compression [25].
Since we observed a difference in the urinary levels of muscle injury biomarkers between ambulatory and non-ambulatory BMD in the LFQ proteomics analysis, we sought to confirm these findings using TMT quantitative proteomics. The data showed that the levels of muscle injury proteins, particularly titin, were approximately two-fold higher in ambulatory BMD compared with non-ambulatory BMD. This difference is most likely due to ambulatory BMD individuals being more physically active and therefore experiencing greater muscle fiber breakdown than non-ambulatory BMD individuals. However, the low throughput and moderate accuracy of label-free proteome profiling, combined with the limited sample sizes that can be processed and analyzed, make it difficult to draw definitive conclusions about the most effective urinary biomarker for assessing disease stage in BMD. Therefore, validation of the mass spectrometry findings is required. Since titin appeared to be sensitive for distinguishing between ambulatory and non-ambulatory BMD in the discovery mass spectrometry data, we sought to validate this biomarker using targeted mass spectrometry and a commercially available ELISA assay targeting the N-terminal fragment of the titin protein.
3.2. Validation of Urinary N-Terminal Titin a Biomarker for Becker Muscular Dystrophy
3.2.1. Targeted Mass Spectrometry
Specific titin tryptic peptides to quantify and assess urinary levels of titin were selected based on the frequency peptide detection during the initial label-free proteome profiling and optimization experiments (60 LC-MS/MS DDA runs). Thirteen tryptic peptides (see Table S6) derived from the titin protein were identified in urine samples analyzed using DDA mode. These peptides mapped to positions 42–34,322 of the protein sequence, with greater peptide coverage observed toward the N-terminal region. Of these, one peptide showed consistency in detection across runs, VPAPVEIPVTPPTLVSGLK (Light m/z= 957.5692++, Heavy m/z= 961.5763++; RT:105.19) and was selected for targeted mass spectrometry analysis using larger sample size.
Urine samples from ambulatory BMD (n=21), non-ambulatory BMD (n=6) and age-matched healthy volunteers (n = 3) were analyzed using our optimized targeted mass spectrometry method. Figure 2. visualizes the log2 ratios of endogenous titin peptide to SILAC standard (log2) values for the peptide VPAPVEIPVTPPTLVSGLK, demonstrating differences in urinary titin levels among ambulatory BMD and heathy controls. Using one-way ANOVA, showed a significant difference in the levels of urinary titin between groups (F = 8.397, R2= 0.3835, p-value = 0.0015). Tukey’s HSD post-hoc test showed significantly higher urinary titin levels in aBMD versus Cnt: (mean difference = -4.680, (95% CI –7.691 to –1.669), adjusted p-value = 0.0018). A secondary post-hoc analysis using healthy controls as the reference group, conducted with Dunnett’s T3, indicated significantly higher levels aBMD versus Cnt and naBMD versus Cnt (see Supplemental Figure S4). Fold change and significance were further evaluated using t-test analysis. A significant difference was observed between ambulatory BMD and healthy controls FC: -2.28, p-value = 0.0018, whereas the comparison between ambulatory BMD versus non-ambulatory BMD showed a FC of 2.30 but was not statistically significant.
3.2.2. Validation of Urinary N-Terminal Titin Using ELISA Assay
We first performed a western blot for to confirm presence on the N-terminal titin in urine samples, using antibodies recognizing the first 110 amino acids of titin protein. Samples from healthy controls (n=3), ambulatory BMD (n=3), and non-ambulatory (n=3) were compared. As expected, the N-terminal titin fragment was detected around 30 kDa in urine samples of BMD patients but in 1/3 healthy controls (Figure 3). The bands were on average 8 times more intense in urine samples of ambulatory BMD compared to non-ambulatory BMD when normalized to ponceau staining, consistent with our mass spectrometry data above. One of the healthy volunteers showed the presence of the N-terminal titin fragment in urine, which could be due to intense exercise or undiagnosed muscle condition. Unfortunately, we are unable to confirm this, as all samples were received in a de-identified manner for this study. Only age and gender information were provided, in accordance with the approved IRB protocol. Therefore, any interpretation regarding this finding remains speculative at this time. However, the analysis of urine samples from three additional healthy volunteers in this study did not reveal the presence of the N-terminal titin fragment (data not shown).
Then we used a commercially available ELISA assay targeting the N-terminal fragment of titin from Immuno-Biological Laboratories, Inc. (IBL, Minneapolis, MN, USA) to validate our mass spectrometry data using larger sample size; i.e.ambulatory BMD (n=20), non-ambulatory BMD (n=10) and age-matched healthy controls (n = 10). The results are reported with and without normalization to total protein concentration in urine and expressed in ng/mL and ng/µg total protein, respectively (Figure 4). Data was normalized to total protein concentration in urine, as creatinine levels are known to fluctuate in individuals with disease severity in DMD and BMD [24]. Since the exact size and amino acid sequence of the N-terminal titin fragments detected in BMD samples have not been fully characterized, we used an approximate number of amino acids (e.g., the first 200 amino acids), which corresponds to a calculated molecular weight of 21,358.826 g/mol for the N-terminal titin fragment used to establish the commercially available ELISA assay [23].
Figure 4a shows data without normalization to total proteins. Simple and multiple linear regression were used to examine the relationship between known standards and unknown sample values. A one-way ANOVA was performed revealing a significant difference in the levels of urinary titin between groups (F = 7.187, R2= 0.2798, p-value = 0.0023). Tukey’s HSD post-hoc test showed a significantly higher urinary titin levels in aBMD versus Cnt: (mean difference = -365.5 (95% CI –610.5 to –120.4), adj. p-value = 0.0023). A secondary post-hoc analysis using healthy controls as the reference group was conducted with Dunnett’s T3 and indicated significantly higher levels in aBMD versus Cnt (see Supplemental Figure S5a). A significant FC of 4.74 and p-value = 0.0014, between aBMD and naBMD groups was also shown on a t-test.
When levels of N-terminal titin were normalized to total protein concentration and analyzed using one-way ANOVA, we observed significant differences among the group means of (F = 11.62, R2= 0.3857, p-value = 0.0001). In Figure 4b, we found a significant difference between both ambulatory BMD versus healthy control and ambulatory BMD versus non-ambulatory BMD, this can be observed through our analysis using a Tukey’s HSD post-hoc analysis: aBMD versus Cnt: (mean difference = -4.079 (95% CI–6.25 to –1.91), adjusted p-value = 0.0001); aBMD versus naBMD: (mean difference = 2.581, (95% CI 0.414 to 4.75), adjusted p-value = 0.0165). A secondary post-hoc analysis using healthy controls as the reference group, which was conducted with Dunnett’s T3, indicated significantly higher levels in aBMD versus Cnt and naBMD versus Cnt (see Supplemental Figure S5b). Significant fold changes were identified using t-test: ambulatory BMD versus healthy controls, FC: 4.56, p-value = 0.00022; ambulatory BMD versus non-ambulatory BMD FC: 1.98, p-value = 0.015; non-ambulatory BMD versus healthy controls FC: 2.32, p-value = 0.020.
3.3. Correlation of the Levels of Urinary N-Terminal Titin with Age and Patient’s Reported Outcomes
Figure 5 shows correlation plots between levels of urinary titin and patient-reported outcomes, including age, disease duration, age of onset, and age at loss of ambulation. No significant association was observed between these outcomes and urinary N-terminal titin levels. However, when assessing the age of onset (Figure 5c), a significant difference between the disease severity groups was identified. Specifically, a significant difference was observed between the ambulatory BMD and non-ambulatory BMD in the 11-16 years age of onset group using a one-way ANOVA, (F = 2.87, R2= 0.4283, p-value = 0.0308). Holm-Sidak’s post-hoc comparisons indicated that aBMD (11-16) exceeded naBMD (11-16) by 6.34 units, with an adjusted p-value = 0.0425. Significant fold changes of titin levels were also observed in this comparison; a t-test identified a significant FC and p-value, 4.18 and 0.0016, respectively. Additionally, when assessing between a small sample size of ambulatory BMD patients grouped based on mutation type, exon 45-47 (n = 5) and 45-48 (n-4), a significant FC and p-value was obtained, FC: 2.16, p-value = 0.00145.
4. Discussion
In this study, we used global proteome profiling of urine samples collected from individuals with BMD and age-matched healthy controls to identify potential non-invasive biomarkers to assess disease stage in BMD. The BMD cohort included both ambulatory and non-ambulatory subjects. Both LFQ proteomics and TMT proteomics identified a signature of muscle injury biomarkers in urine samples of BMD subjects compared to healthy controls. This signature, consisting of TITIN, MYBPH, MYH2, MYH7, TELT, GAPDH, FLNC, CDH13 was more pronounced in ambulatory BMD patients compared to non-ambulatory patients, most likely due to the fact that ambulatory BMD individuals have more muscle mass, are more physically active and therefore experiencing greater muscle fiber breakdown than non-ambulatory BMD individuals who might have lost a lot of muscle mass and are less physically active.
Titin, also known as connectin, is the largest protein in humans and is primarily observed in skeletal and cardiac muscle. Its proteoforms like N2B and N2BA act as a molecular spring that connects the myosin thick filaments to the Z-disc, thereby providing structural integrity to the sarcomeres [26]. In BMD, the sarcolemma is fragile due to the reduced levels of truncated dystrophin protein. This fragility leads to increased calcium influx, which is believed to activate calpains that cleave titin at the N-terminal and the C-terminal side [13,27]. These fragment ends can then be filtered by the kidneys and excreted into urine, while the large middle fragment remains in the blood circulation. However, a recent study showed that N-terminal fragments of titin were also found to be highly elevated in urine samples of limb-girdle muscular dystrophy recessive 1 (LGMDR1) with mutations in the calpain-3 gene compared to age-matched healthy volunteers and in Capn3-/- mice compared to wild type mice [28]. This suggests that other mechanisms might lead to the release of the N-terminal fragment of titin into the circulation. Consistent with this possibility, our study demonstrated that titin fragments detected in urine of BMD patients mapped to titin sequences spanning amino acid positions 42 to 34,322, indicating that proteolytic enzymes other than calpains might be involved in titin degradation generating multiple pathogenesis derived titin-proteoforms. Further top-down mass spectrometry studies aimed at mapping the pathogenesis generated titin proteoforms to specific regions of the titin sequence are needed to elucidate that these are specific to BMD by comparing to other muscle diseases such as DMD and limb girdle muscular dystrophy.
BMD patients in this study were categorized based on ambulatory status. Patients who were able to walk at the time of urine collection were classified as ambulatory BMD, whereas those requiring wheelchair assistance were classified as non-ambulatory BMD. The hypothesis of this study is that ambulatory BMD patients exhibit greater active muscle contraction compared to non-ambulatory BMD patients. As a result, they are expected to retain more muscle tissue that undergoes mechanical stress during movement, leading to muscle protein breakdown and the release of muscle-derived proteins into circulation and ultimately into the urine. As the disease progresses and patients transition to the non-ambulatory phase, irreversible muscle loss occurs and muscle tissue is gradually replaced with fatty tissue. At this stage, mobility is significantly reduced due to minimal or absent muscle contraction and decreased muscle mass. Consequently, less titin is available to be degraded in muscle tissue and subsequently detected in circulation or urine. Therefore, assessing a non-invasive biomarker that directly reflects muscle wasting could provide valuable insight into a patient’s disease state, help evaluate disease severity at a given time point, and potentially allow for monitoring of disease progression as patients undergo treatment. Unfortunately, we did not have any muscle mass tests or MRI performed on these BMD patients enrolled in this biomarker study. But it is well known that non ambulatory BMD patients have less muscle mass than ambulatory patients [29].
Longitudinal follow-up studies using same patients would provide stronger insight into the hypothesis that decrease in urinary titin levels are patient-dependent and correlate with disease severity. Ideally, each patient’s N-terminal titin levels would be measured at diagnosis to establish an individual’s baseline levels and monitored over time. This could also be explored in a mouse model longitudinal study. Previous BMD mouse models have been developed specifically for the in-frame deletions of 45-47 exons (bmx), 52-55 (Dmd del52-55) exons, 45-48, and 45-49 [30,31] and these could serve as a good model to monitor disease progression and response to investigational drugs. Additional variables can be studied without concern for unethical practices using BMD mouse models by limiting medication intervention and can be customizable to the mutation type for the exploration in trends between the disease severities. Because of this study’s limitations from having a small cohort size and even smaller groups of alike exon mutation types, medication intervention,, future studies are necessary to assess those potential trends such as levels of N-terminal titin peptides unique to the mutation type, impacts of medical intervention, age of onset, and duration of disease which can be tracked by standard methods of monitoring using muscle MRI and functional tests, like the Six Minute Walk Test (6MWT) and North Star Ambulatory Assessment (NSAA) [12].
Within the realm of assessing urine biomarkers for muscular dystrophies or other muscle-related diseases, the possible urinary parameters against which a biomarker value can be normalized (by expressing the biomarker level relative to that of the urinary parameter), are unclear and not standardized, particularly for BMD. Urinary Creatinine is a parameter commonly used for normalization of levels of substances seen in urine samples, by expressing the level as relative to that of creatinine. In previous studies, creatinine has been used for titin normalization. Specifically for BMD, one study found that there were a higher number of non-ambulatory BMD patients who had higher levels of urinary titin/creatinine ratio overall when comparing groups of low versus high titin levels using the study’s median titin/creatinine ratio level as the threshold [24]. The results of this study are contradictory to our findings regarding assessing disease severity. This is due to the innate nature of creatinine as an indicator of overall muscle mass and an indirect indicator of muscle loss. Thus, normalization of the level of a muscle wasting biomarker according to the level of creatinine could result in skewing of the patient biomarker values.
Specific gravity has also been proposed as a urinary parameter, against the level of which the level of a urinary biomarker can be normalized [32]. The mean specific gravity for DMD and healthy age-matched subjects found in a previous study (also found in this study in BMD patients) is 1.0200 for human urine [32]. Although it has been used before for assessing hydration and kidney function, and useful in BMD patients in the rare case of exhibiting renal failure or medication side effects, specific gravity is not suitable on its own as a comparison ‘normalization’ parameter for assessing protein biomarker levels. Methods for normalization should account for the patient’s overall present pathogenesis, which can be unique to that individual due to many variables such as mutation type, age, age of onset, medication intervention, and ambulatory status.
Using total protein as a comparative parameter for normalization allows for an overall holistic biological system approach comparing the amount of biomarker protein found to total protein urine excretion. Urinary titin levels normalized to total protein were found to be more sensitive in distinguishing between ambulatory and non-ambulatory BMD patients, and between ambulatory BMD to healthy control. Normalization of urinary titin against total protein may better account for overall protein excretion, whereas creatinine normalization can be influenced by factors such as muscle mass which is very variable among BMD patients. Furthermore, some BMD patients may take creatine as a supplement which might slightly influence the levels of creatinine. However, normalization to total urinary protein has its own limitations, including the potential influence of non-specific proteinuria and differences in diet between subjects. Hence, overall future work requires investigation of what are the ‘denominator’ parameters for normalizing urinary protein biomarkers in a larger cohort, ideally focusing on the incorporation of in tandem analysis of multiple methods of normalization to rule out other potential symptoms or comorbidities that these patients are susceptible to (in rare cases of kidney damage) [1]. These normalization methods results are provided in the supplemental section for reference (see Supplemental Figures S6, Table S7 and Figure S7, Table S8).
In terms of other muscle diseases, N-terminal titin has been elevated in the serum of sarcopenia patients decreasing with rehab [33] and in the urine of Limb-girdle muscular dystrophies, especially LGMDR1 [34], myotonic dystrophy type 1 (DM1) [13], Fukuyama congenital muscular dystrophy (FCMD) [14], idiopathic inflammatory myopathies [35], dilated cardiomyopathies (DCM) [36], and amyotrophic lateral sclerosis (ALS) [17]. In DMD, titin is currently being used to assess efficacy of dystrophin restoring therapies, specifically shown in mdx mice, urinary N-terminal titin falls dramatically after exon-23 skipping with a peptide-conjugated PMO, indicating titin as a pharmacodynamic marker of exon-skipping efficacy [37,38]. Additional studies with AAV-directed gene transfer methods in mdx mice, golden retriever muscular dystrophy (GRMD) model, and humans, demonstrated a good correlation of circulating titin with the levels of microdystrophin protein [19]. The accumulation of evidence on urinary titin fragments as non-invasive biomarker suggests significant potential for assessing disease prognosis in BMD and other muscle diseases, and it could serve as a valuable tool to guide current and future drug development [39].
5. Conclusions
In conclusion, our study indicates that urinary N-terminal titin is a candidate in accessing disease severity and has potential in monitoring disease progression for BMD. Its non-invasive benefit and reflection of muscle-loss provides direct insight into ongoing myofibrillar damage, reflecting pronounced differences in disease status. However, the inherent heterogeneity of BMD requires a shift from a “one-size-fits-all” progression criterion to an individualized baseline assessment when it comes to analyzing muscle-damage specific biomarkers like urinary N-terminal titin. To fully validate urinary N-terminal titin’s role in monitoring disease progression, future research must incorporate a larger sample size, a collection of clinical patient outcome variables, and a long-term longitudinal design. To date, no longitudinal studies have been conducted in BMD to evaluate changes in urinary titin levels over time. However, recent studies in Duchenne muscular dystrophy (DMD), a more severe form of muscular dystrophy, have demonstrated a progressive decline in muscle injury biomarkers in longitudinal serum samples, including titin, as the disease advances. This decline correlates with the progressive loss of muscle mass. We expect that a similar pattern will be observed in BMD, with patients who experience more rapid muscle loss exhibiting a steeper decline in titin levels than those whose disease remains relatively stable over time. We also expect that therapies aiming at preserving muscle mass but not completely cure the disease will maintain stable levels of urinary titin overtime.
Supplementary Materials
The following supporting information can be downloaded the website of this paper posted on Preprints.org.
Author Contributions
Conceptualization, K.Le, K.Edwards, M.Barbieri, E.Hoffman, and Y.Hathout; methodology, K.Le, E.Canessa, C.Stahura, J.Mayers, K.Edwards, and Y.Hathout; software, K.Le and E.Canessa; validation, K.Le.; formal analysis, K.Le, E.Canessa, C.Stahura, J.Mayers; investigation, K.Le, E.Canessa, C.Stahura, and J.Mayers; resources, K.Edwards, M.Barbieri, E.Hoffman, and Y.Hathout.; data curation, K.Le, K.Edwards, and Y.Hathout; writing—original draft preparation, K.Le, K.Edwards, and Y.Hathout.; writing—review and editing, K.Le, E.Canessa, C.Stahura, J.Mayers, K.Edwards, M.Barbieri, E.Hoffman, and Y.Hathout; visualization, K.Le; supervision, K.Edwards and Y.Hathout; project administration, K.Le, K.Edwards, M.Barbieri, E.Hoffman, and Y.Hathout; funding acquisition, Y.Hathout. All authors have read and agreed to the published version of the manuscript.
Funding
This research received no external funding.
Institutional Review Board Statement
The study was conducted in accordance with the Declaration of Helsinki, and approved by the Institutional Review Board of Binghamton University (protocol code STUDY00001040 and date of approval (October 23, 2018).
Informed Consent Statement
Informed consent was obtained from all subjects involved in the study.
Data Availability Statement
The mass spectrometry proteomics data have been deposited to the ProteomeXchange Consortium via the PRIDE [1] partner repository with the dataset identifier PXD080765 and 10.6019/PXD080765.
Conflicts of Interest
The authors declare no conflicts of interest.
Abbreviations
The following abbreviations are used in this manuscript:
| BMD | Becker Muscular Dystrophy |
| DMD | Duchenne Muscular Dystrophy |
| aBMD | Ambulatory BMD |
| naBMD | Non-ambulatory BMD |
| Cnt | Healthy Control |
| CK | Creatine Kinase |
| LFQ | Label Free Quantification |
| TMT | Tandem Mass Tag |
| SILAC | Stable Isotope Labeling Amino Acids by Cell Culture |
| ELISA | Enzyme-linked immunosorbent assay |
| DDA | Data dependent acquisition |
| PRM | Parallel Reaction Monitoring |
| LC-MS/MS | Liquid chromatography tandem mass spectrometry |
| VPAP | Tryptic titin peptide: VPAPVEIPVTPPTLVSGLK |
| TITIN | Titin |
| MYH2 | Myosin heavy chain 2 |
| MYH7 | Myosin heavy chain 7 |
| MYPBH | Myosin binding protein H |
| TELT | Telethonin |
| BIN1 | Myc-box dependent interacting protein 1 |
| FLNC | Filamin C |
| GAPDH | Glyceraldehyde dehydrogenase |
| CDH13 | Cadherin 13 |
| TFA | Trifluoroacetic acid |
| ACN | Acetonitrile |
| FA | Formic acid |
| 6-MWT | 6-minute walk test |
| NSAA | NorthStar Ambulatory Assessment Score |
| MRI | Magnetic resonance imaging |
| SMA | Adult spinal muscular atrophy |
| DM1 | Myotonic dystrophy |
| FCMD | Fukuyama congenital muscular dystrophy |
| ALS | Amyotrophic lateral sclerosis |
| LGMDR1 | Limb Girdle Muscular Dystrophy (specifically R1) |
| DCM | Dilated cardiomyopathies |
| PMO | Phosphorodiamidate Morpholino Oligomers |
| bmx | BMD mouse model |
| dmx | DMD mouse model |
| GRMD | Golden retriever muscular dystrophy model |
| PSMs | Peptide spectral matches |
| FDR | False discovery rate |
References
- Thada, P.K.; Bhandari, J.; Forshaw, K.C.; Umapathi, K.K. Becker Muscular Dystrophy. Available online: https://www.ncbi.nlm.nih.gov/books/NBK556092/ (accessed March 2026).
- Beggs, A.H.; Hoffman, E.P.; Snyder, J.R.; Arahata, K.; Specht, L.; Shapiro, F.; Angelini, C.; Sugita, H.; Kunkel, L.M. Exploring the molecular basis for variability among patients with Becker muscular dystrophy: dystrophin gene and protein studies. Am. J. Hum. Genet. 1991, 49, 54–67. [Google Scholar] [PubMed]
- Straub, V.; Guglieri, M. An update on Becker muscular dystrophy. Curr. Opin. Neurol. 2023, 36, 450–454. [Google Scholar] [CrossRef] [PubMed]
- Davies, K.E.; Vogt, J. Long-term clinical follow-up of a family with Becker muscular dystrophy associated with a large deletion in the DMD gene. Neuromuscul. Disord. 2024, 39, 5–9. [Google Scholar] [CrossRef] [PubMed]
- De Wel, B.; Iterbeke, L.; Huysmans, L.; Peeters, R.; Goosens, V.; Dubuisson, N.; van den Bergh, P.; Van Parijs, V.; Remiche, G.; De Waele, L.; Maes, F.; Dupont, P.; Claeys, K.G. Lessons for future clinical trials in adults with Becker muscular dystrophy: Disease progression detected by muscle magnetic resonance imaging, clinical and patient-reported outcome measures. Eur. J. Neurol. 2024, 31, e16282. [Google Scholar] [CrossRef] [PubMed]
- van de Velde, N.M.; Koeks, Z.; Signorelli, M.; Verwey, N.; Overzier, M.; Bakker, J.A.; Sajeev, G.; Signorovitch, J.; Ricotti, V.; Verschuuren, J.; Brown, K.; Spitali, P.; Niks, E.H. Longitudinal Assessment of Creatine Kinase, Creatine/Creatinineratio, and Myostatin as Monitoring Biomarkers in Becker Muscular Dystrophy. Neurology 2023, 100, e975–e984. [Google Scholar] [CrossRef] [PubMed]
- Hiramuki, Y.; Hosokawa, M.; Osawa, K.; Shirakawa, T.; Watanabe, Y.; Hanajima, R.; Kugoh, H.; Awano, H.; Matsuo, M.; Kazuki, Y. Titin fragment is a sensitive biomarker in Duchenne muscular dystrophy model mice carrying full-length human dystrophin gene on human artificial chromosome. Sci. Rep. 2025, 15, 1778. [Google Scholar] [CrossRef] [PubMed]
- McMillan, H.J.; Lochmüller, H. Biomarkers in Duchenne and Becker muscular dystrophies. Muscle Nerve 2021, 64, 4–5. [Google Scholar] [CrossRef] [PubMed]
- Nambu, Y.; Osawa, K.; Shirakawa, T.; Sunami, A.; Sonehara, S.; Bo, R.; Nozu, K.; Matsuo, M.; Awano, H. Serum titin/creatinine ratio as a biomarker for discriminating disease severity in Duchenne and Becker muscular dystrophies. Front Neurol. 2025, 16, 1591748. [Google Scholar] [CrossRef] [PubMed]
- Rouillon, J.; Zocevic, A.; Leger, T.; Garcia, C.; Camadro, J.M.; Udd, B.; Wong, B.; Servais, L.; Voit, T.; Svinartchouk, F. Proteomics profiling of urine reveals specific titin fragments as biomarkers of Duchenne muscular dystrophy. Neuromuscul. Disord. 2014, 24, 563–573. [Google Scholar] [CrossRef] [PubMed]
- Awano, H.; Matsumoto, M.; Nagai, M.; Shirakawa, T.; Maruyama, N.; Iijima, K.; Nabeshima, Y.I.; Matsuo, M. Diagnostic and clinical significance of the titin fragment in urine of Duchenne muscular dystrophy patients. Clin. Chim. Acta 2018, 476, 111–116. [Google Scholar] [CrossRef] [PubMed]
- Sipos, A.; Ripszám, E.R.; Molnár, J.M.; Grosz, Z.; Boczán, J.; Altorjay, M.B.; Dézsi, L.; Csáti, A.; Babarczy, K.; Kovács, N.; Hajdú, N.; Pál, E. Elevated Urinary Titin in Adult Spinal Muscular Atrophy: A Multicenter, Cross-Sectional Observational Study. Neurol. Int. 2025, 17, 114. [Google Scholar] [CrossRef] [PubMed]
- Varga, D.; Perecz, B.; Fülöp, K.; Sipos, A.; Janszky, J.V.; Hajdú, N.; Pál, E. Urinary titin in myotonic dystrophy type 1. Muscle Nerve 2023, 68, 215–218. [Google Scholar] [CrossRef] [PubMed]
- Sato, T.; Awano, H.; Ishiguro, K.; Shichiji, M.; Murakami, T.; Shirakawa, T.; Matsuo, M.; Nagata, S.; Ishigaki, K. Urinary titin as a biomarker in Fukuyama congenital muscular dystrophy. Neuromuscul. Disord. 2021, 31, 194–197. [Google Scholar] [CrossRef] [PubMed]
- Takiguchi, Y.; Tsutsumi, R.; Shimabukuro, M.; Tanabe, H.; Kawakami, A.; Hyodo, M.; Shiroma, K.; Saito, H.; Matsuo, M.; Sakaue, H. Urinary titin as a biomarker of sarcopenia in diabetes: a propensity score matching analysis. J. Endocrinol. Invest. 2025, 48, 1041–1056. [Google Scholar] [CrossRef] [PubMed]
- Ishihara, M.; Nakanishi, N.; Tsutsumi, R.; Hara, K.; Machida, K.; Yamamoto, N.; Kanematsu, Y.; Sakaue, H.; Oto, J.; Takagi, Y. Elevated Urinary Titin and its Associated Clinical Outcomes after Acute Stroke. J. Stroke Cerebrovasc. Dis. 2021, 30, 105561. [Google Scholar] [CrossRef] [PubMed]
- Yamada, S.; Hashizume, A.; Hijikata, Y.; Ito, D.; Kishimoto, Y.; Iida, M.; Koike, H.; Hirakawa, A.; Katsuno, M. Ratio of urinary N-terminal titin fragment to urinary creatinine is a novel biomarker for amyotrophic lateral sclerosis. J. Neurol. Neurosurg. Psychiatry 2021, 92, 1072–1079. [Google Scholar] [CrossRef] [PubMed]
- Nakanishi, N.; Tsutsumi, R.; Hara, K.; Matsuo, M.; Sakaue, H.; Oto, J. Urinary titin N-Fragment as a biomarker of muscle atrophy, intensive care Unit-Acquired weakness, and possible application for Post-Intensive care syndrome. J. Clin. Med. 2021, 10, 614. [Google Scholar] [CrossRef] [PubMed]
- Boehler, J.F.; Brown, K.J.; Ricotti, V.; Morris, C.A. N-terminal titin fragment: a non-invasive, pharmacodynamic biomarker for microdystrophin efficacy. Skelet. Muscle 2024, 14, 2. [Google Scholar] [CrossRef] [PubMed]
- Zhu, W.; Smith, J.W.; Huang, C.M. Mass spectrometry-based label-free quantitative proteomics. J. BioMed Biotechnol. 2010, 2010, 840518. [Google Scholar] [CrossRef] [PubMed]
- Canessa, E.H.; Goswami, M.V.; Alayi, T.D.; Hoffman, E.P.; Hathout, Y. Absolute quantification of dystrophin protein in human muscle biopsies using parallel reaction monitoring (PRM). J. Mass Spectrom. 2020, 55, e4437. [Google Scholar] [CrossRef] [PubMed]
- Ref. [22].
- Maruyama, N.; Asai, T.; Abe, C.; Inada, A.; Kawauchi, T.; Miyashita, K.; Maeda, M.; Matsuo, M.; Nabeshima, Y. Establishment of a highly sensitive sandwich ELISA for the N-terminal fragment of titin in urine. Sci. Rep. 2016, 6, 39375. [Google Scholar] [CrossRef] [PubMed]
- Zhang, H.; Zhu, Y.; Sun, Y.; Liang, Y.; Li, Y.; Zhang, Y.; Deng, L.; Wen, X.; Zhang, C. Serum creatinine level: a supplemental index to distinguish Duchenne muscular dystrophy from Becker muscular dystrophy. Dis. Markers 2015, 2015, 141856. [Google Scholar] [CrossRef] [PubMed]
- Ting, L.; Rad, R.; Gygi, S.P.; Haas, W. MS3 eliminates ratio distortion in isobaric multiplexed quantitative proteomics. Nat. Methods 2011, 8, 937–940. [Google Scholar] [CrossRef] [PubMed]
- Gigli, M.; Begay, R.L.; Morea, G.; Graw, S.L.; Sinagra, G.; Taylor, M.R.; Granzier, H.; Mestroni, L. A Review of the Giant Protein Titin in Clinical Molecular Diagnostics of Cardiomyopathies. Front Cardiovasc Med. 2016, 3, 21. [Google Scholar] [CrossRef] [PubMed]
- Charton, K.; Sarparanta, J.; Vihola, A.; Milic, A.; Jonson, P.H.; Suel, L.; Luque, H.; Boumela, I.; Richard, I.; Udd, B. CAPN3-mediated processing of C-terminal titin replaced by pathological cleavage in titinopathy. Hum. Mol. Genet. 2015, 24, 3718–3731. [Google Scholar] [CrossRef] [PubMed]
- Nambu, Y.; Matsumura, T.; Machida, K.; Tsutsumi, R.; Hata, S.; Shinkai-Ouchi, F.; Ono, Y.; Osawa, K.; Shirakawa, T.; Bo, R.; Nishio, H.; Sakaue, H.; Awano, H.; Matsuo, M. The N-Terminal Fragment of Urine Titin Is Not a Product of Degradation by Calpain 3. Muscle Nerve 2025, 71, 442–445. [Google Scholar] [CrossRef] [PubMed]
- Wong, B.L.; Summer, S.; Horn, P.S.; Rutter, M.M.; Rybalsky, I.; Tian, C.; Shellenbarger, K.C.; Kalkwarf, H.J. Appendicular lean mass index changes in patients with Duchenne muscular dystrophy and Becker muscular dystrophy. J. Cachexia Sarcopenia Muscle 2023, 14, 2804–2812. [Google Scholar] [CrossRef] [PubMed]
- Heier, C.R.; McCormack, N.M.; Tully, C.B.; Novak, J.S.; Newell-Stamper, B.L.; Russell, A.J.; Fiorillo, A.A. The X-linked Becker muscular dystrophy (bmx) mouse models Becker muscular dystrophy via deletion of murine dystrophin exons 45-47. J. Cachexia Sarcopenia Muscle 2023, 14, 940–954. [Google Scholar] [CrossRef] [PubMed]
- Perillat, L.O.M.; Wong, T.W.Y.; Maino, E.; Ahmed, A.; Scott, O.; Hyatt, E.; Delgado-Olguin, P.; Visuvanathan, S.; Ivakine, E.A.; Cohn, R.D. Generation and characterization of a mouse model of Becker muscular dystrophy with a deletion of Dmd exons 52 to 55. Dis. Model Mech. 2025, 18, dmm050595. [Google Scholar] [CrossRef] [PubMed]
- Ricotti, V.; Ridout, D.; Pane, M.; Main, M.; Mayhew, A.; Mercuri, E.; Manzur, A.; Muntoni, F. The NorthStar Ambulatory Assessment in Duchenne muscular dystrophy: considerations for the design of clinical trials. J. Neurol. Neurosurg. Psychiatry 2015, jnnp-309405. [Google Scholar] [CrossRef] [PubMed]
- Mancuso, R.; Citterio, L.A.; Agostini, S.; Miglioli, R.; Nuzzi, R.; Antolini, L.; Trecate, F.; Clerici, M. Circulatory titin and miR-451a are possible sarcopenia biomarkers in elderly people. Front Aging 2025, 6, 1587438. [Google Scholar] [CrossRef] [PubMed]
- Valls, A.; Ruiz-Roldán, C.; Immanuel, J.; Camaño, P.; Poza, J.J.; Fernández-Torrón, R.; López de Munain, A.; Sáenz, A. Urinary N-terminal titin fragment ascertained as biomarker in a small cohort of limb-girdle muscular dystrophy LGMDR1-calpain 3 related. J. Neuromuscul. Dis. 2025, 12, 683–688. [Google Scholar] [CrossRef] [PubMed]
- Sun, J.; Ye, S.; Yin, G.; Xie, Q. The diagnostic value of urinary N-terminal fragment of titin for skeletal muscle damage in idiopathic inflammatory myopathy. Rheumatology 2023, 62, 3742–3748. [Google Scholar] [CrossRef] [PubMed]
- Yoshihisa, A.; Kimishima, Y.; Kiko, T.; Sato, Y.; Watanabe, S.; Kanno, Y.; Abe, S.; Miyata, M.; Sato, T.; Suzuki, S.; Oikawa, M.; Kobayashi, A.; Yamaki, T.; Kunii, H.; Nakazato, K.; Ishida, T.; Takeishi, Y. Usefulness of Urinary N-Terminal Fragment of Titin to Predict Mortality in Dilated Cardiomyopathy. Am. J. Cardiol. 2018, 121, 1260–1265. [Google Scholar] [CrossRef] [PubMed]
- Robertson, A.S.; Majchrzak, M.J.; Smith, C.M.; Gagnon, R.C.; Devidze, N.; Banks, G.B.; Little, S.C.; Nabbie, F.; Bounous, D.I.; DiPiero, J.; Jacobsen, L.K.; Bristow, L.J.; Ahlijanian, M.K.; Stimpson, S.A. Dramatic elevation in urinary amino terminal titin fragment excretion quantified by immunoassay in Duchenne muscular dystrophy patients and in dystrophin deficient rodents. Neuromuscul. Disord. 2017, 27, 635–645. [Google Scholar] [CrossRef] [PubMed]
- Ishii, M.N.; Nakashima, M.; Kamiguchi, H.; Zach, N.; Kuboki, R.; Baba, R.; Hirakawa, T.; Suzuki, K.; Quinton, M. Urine titin as a novel biomarker for Duchenne muscular dystrophy. Neuromuscul. Disord. 2023, 33, 302–308. [Google Scholar] [CrossRef] [PubMed]
- Melisi, N.; Gage, M.J. Urinary titin represents an exciting biomarker for assessment of muscle health. J. Muscle Res. Cell Motil. 2025, 46, 379–387. [Google Scholar] [CrossRef] [PubMed]
Figure 1.
Peptide Spectrum Matches (PSMs) of Titin in BMD urine samples: Box plot showing levels of Urinary titin measured using label-free proteomic method. Healthy Controls (n = 5); Ambulatory BMD (n = 5), Non-ambulatory BMD (n = 4)** indicates significant adjusted p-value of 0.0013; reported using Tukey’s HSD post-hoc analysis.
Figure 1.
Peptide Spectrum Matches (PSMs) of Titin in BMD urine samples: Box plot showing levels of Urinary titin measured using label-free proteomic method. Healthy Controls (n = 5); Ambulatory BMD (n = 5), Non-ambulatory BMD (n = 4)** indicates significant adjusted p-value of 0.0013; reported using Tukey’s HSD post-hoc analysis.
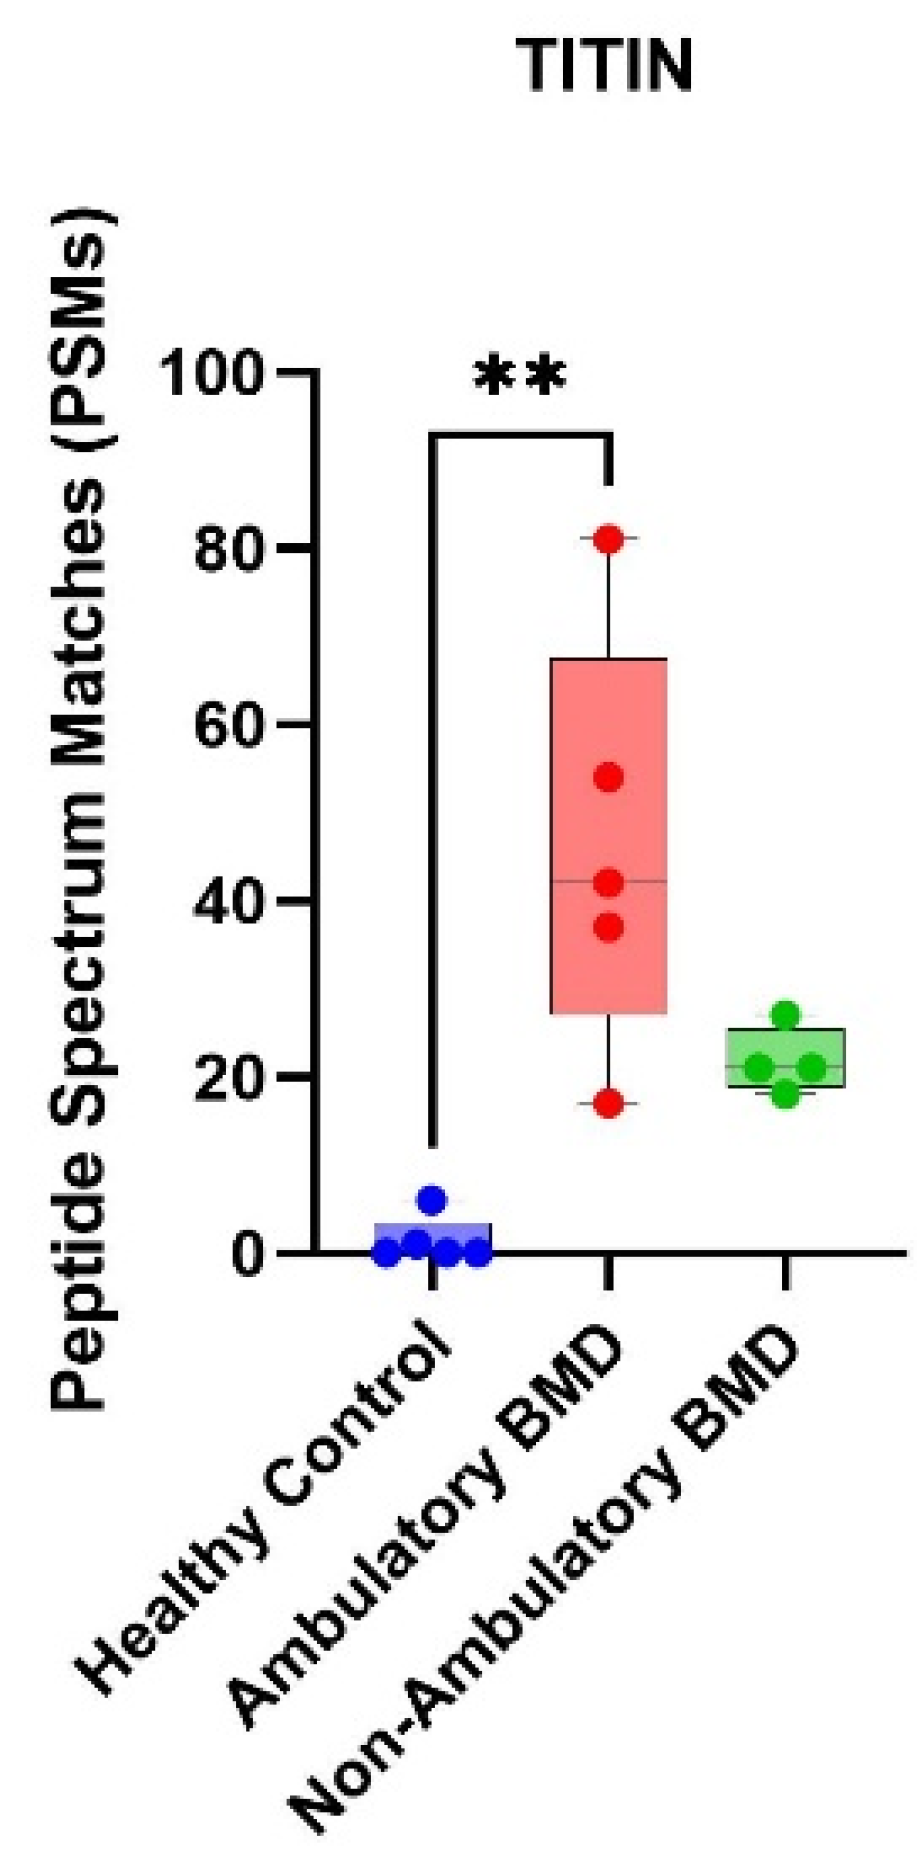
Figure 2.
Levels of titin tryptic peptide measured by targeted mass spectrometry in urine samples of BMD patients and healthy controls. Titin tryptic peptide VPAPVEIPVTPPTLVSGLK was targeted for quantification using PRM and SILAC spike-in strategy. Data is plotted as log2 ratio of endogenous peptide to SILAC labeled peptide. Healthy Controls (n = 3); Ambulatory BMD (n = 21), Non-ambulatory BMD (n = 6). ** indicates significant p-value of 0.0018; reported using Tukey’s post-hoc analysis.
Figure 2.
Levels of titin tryptic peptide measured by targeted mass spectrometry in urine samples of BMD patients and healthy controls. Titin tryptic peptide VPAPVEIPVTPPTLVSGLK was targeted for quantification using PRM and SILAC spike-in strategy. Data is plotted as log2 ratio of endogenous peptide to SILAC labeled peptide. Healthy Controls (n = 3); Ambulatory BMD (n = 21), Non-ambulatory BMD (n = 6). ** indicates significant p-value of 0.0018; reported using Tukey’s post-hoc analysis.
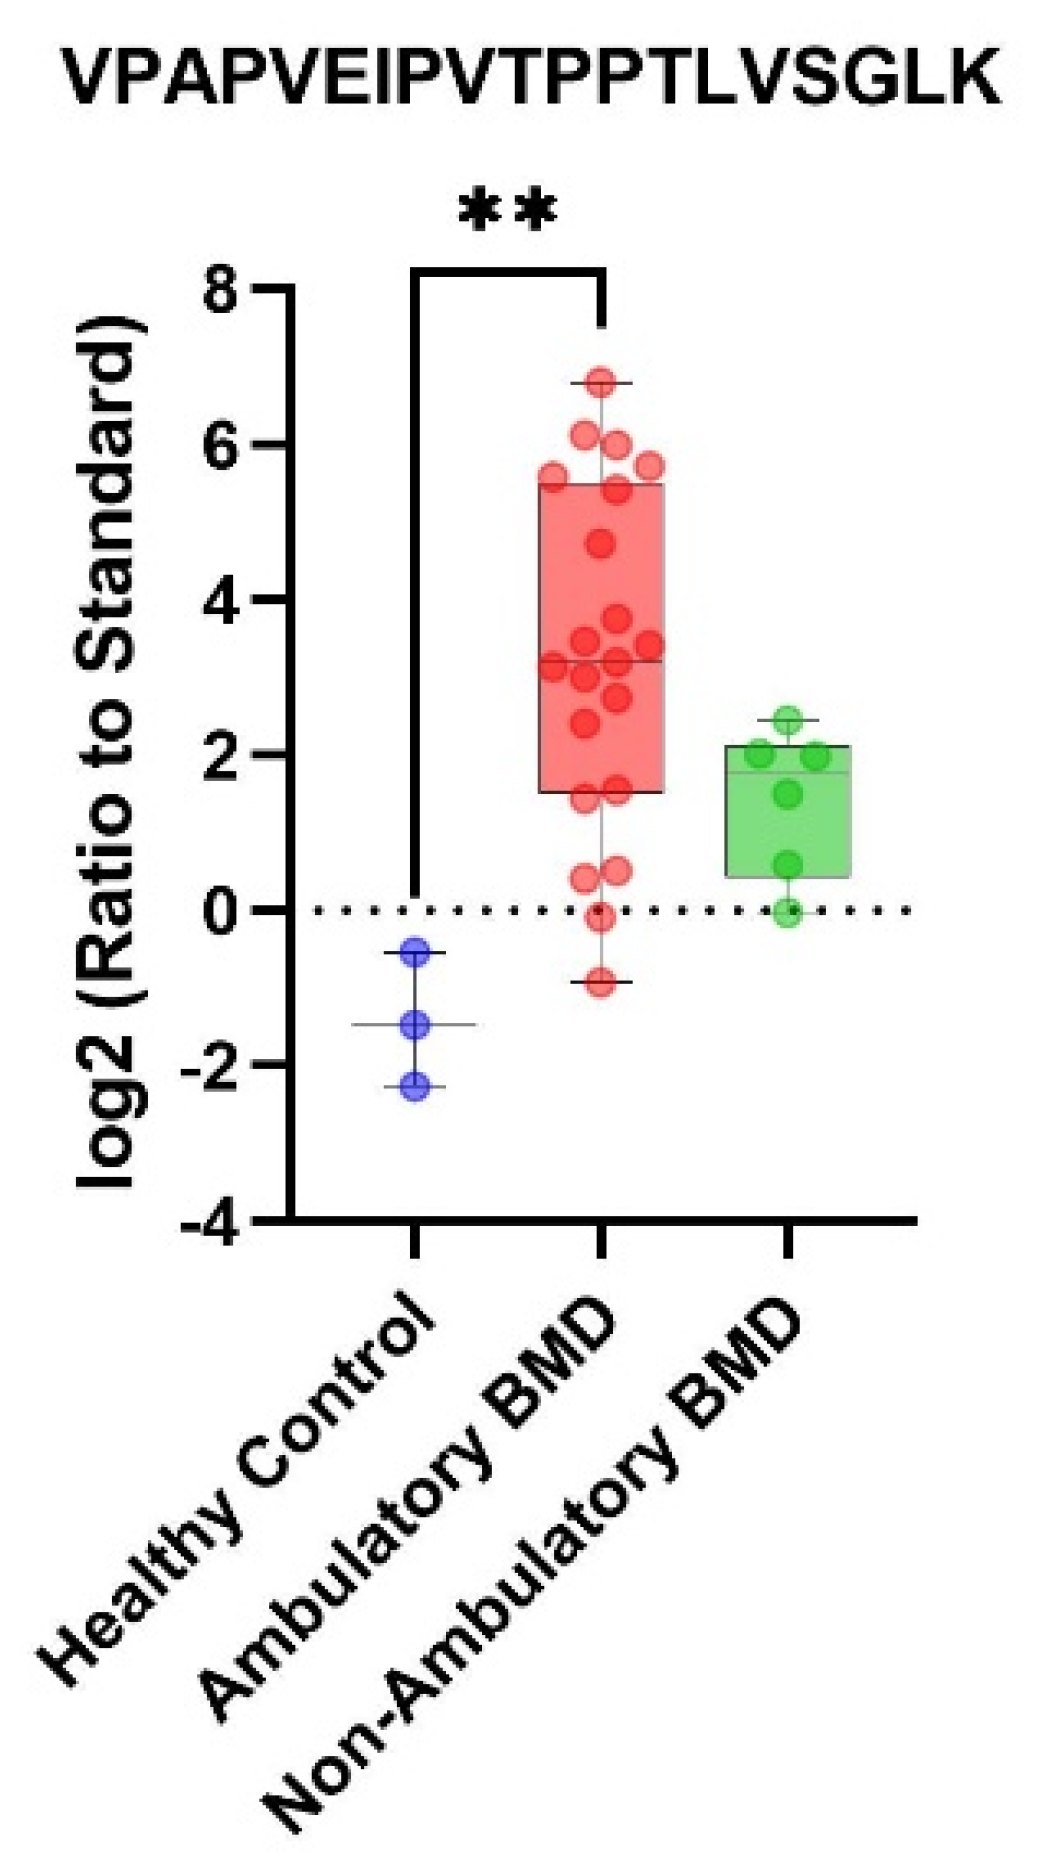
Figure 3.
Western blot detection of N-terminal Titin (~30-32.8 kDa) in urine samples of heathy controls (n = 3), ambulatory BMD (n = 3) and non-ambulatory BMD (n = 3). Urine aliquot containing 15 µg of total proteins was processed for western blot analysis as described in the method.
Figure 3.
Western blot detection of N-terminal Titin (~30-32.8 kDa) in urine samples of heathy controls (n = 3), ambulatory BMD (n = 3) and non-ambulatory BMD (n = 3). Urine aliquot containing 15 µg of total proteins was processed for western blot analysis as described in the method.
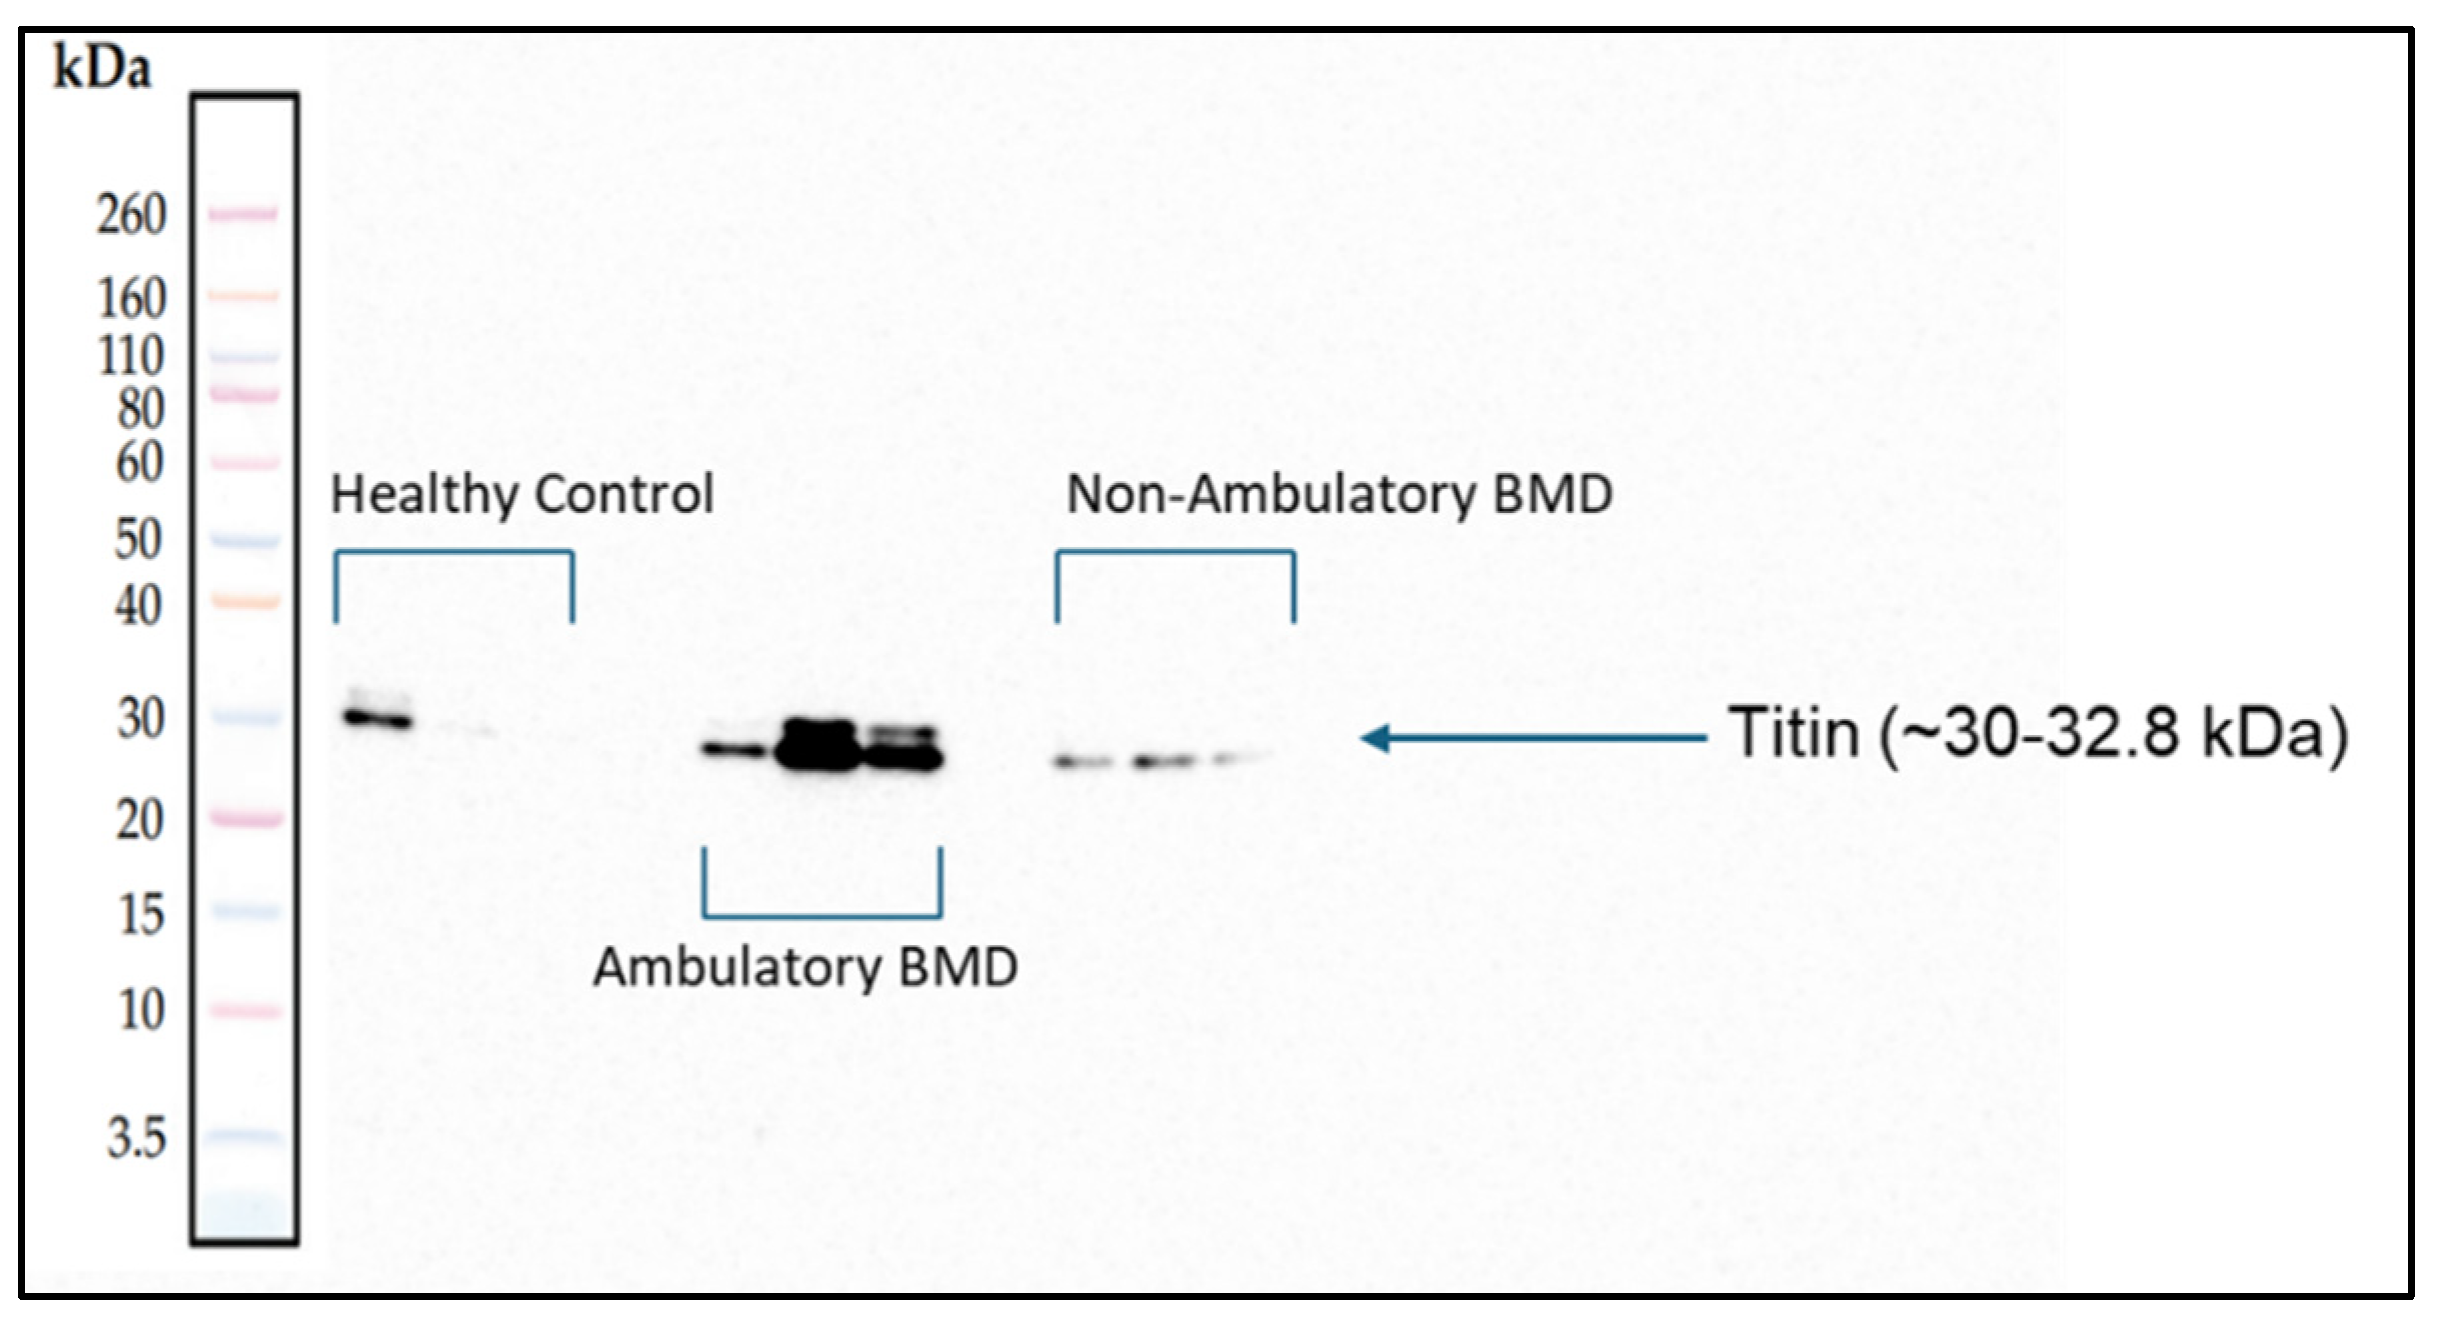
Figure 4.
Box plots representing the levels of the N-terminal titin fragment in urine samples of ambulatory BMD (n = 20), non-ambulatory BMD (n = 10) and healthy controls (n = 10). (a) non-normalized data; (b) normalized data to total protein concentration in urine samples. * p-value = 0.02; ** p-value = 0.0023; *** p-value = 0.0001; reported using Tukey’s HSD post-hoc analysis.
Figure 4.
Box plots representing the levels of the N-terminal titin fragment in urine samples of ambulatory BMD (n = 20), non-ambulatory BMD (n = 10) and healthy controls (n = 10). (a) non-normalized data; (b) normalized data to total protein concentration in urine samples. * p-value = 0.02; ** p-value = 0.0023; *** p-value = 0.0001; reported using Tukey’s HSD post-hoc analysis.
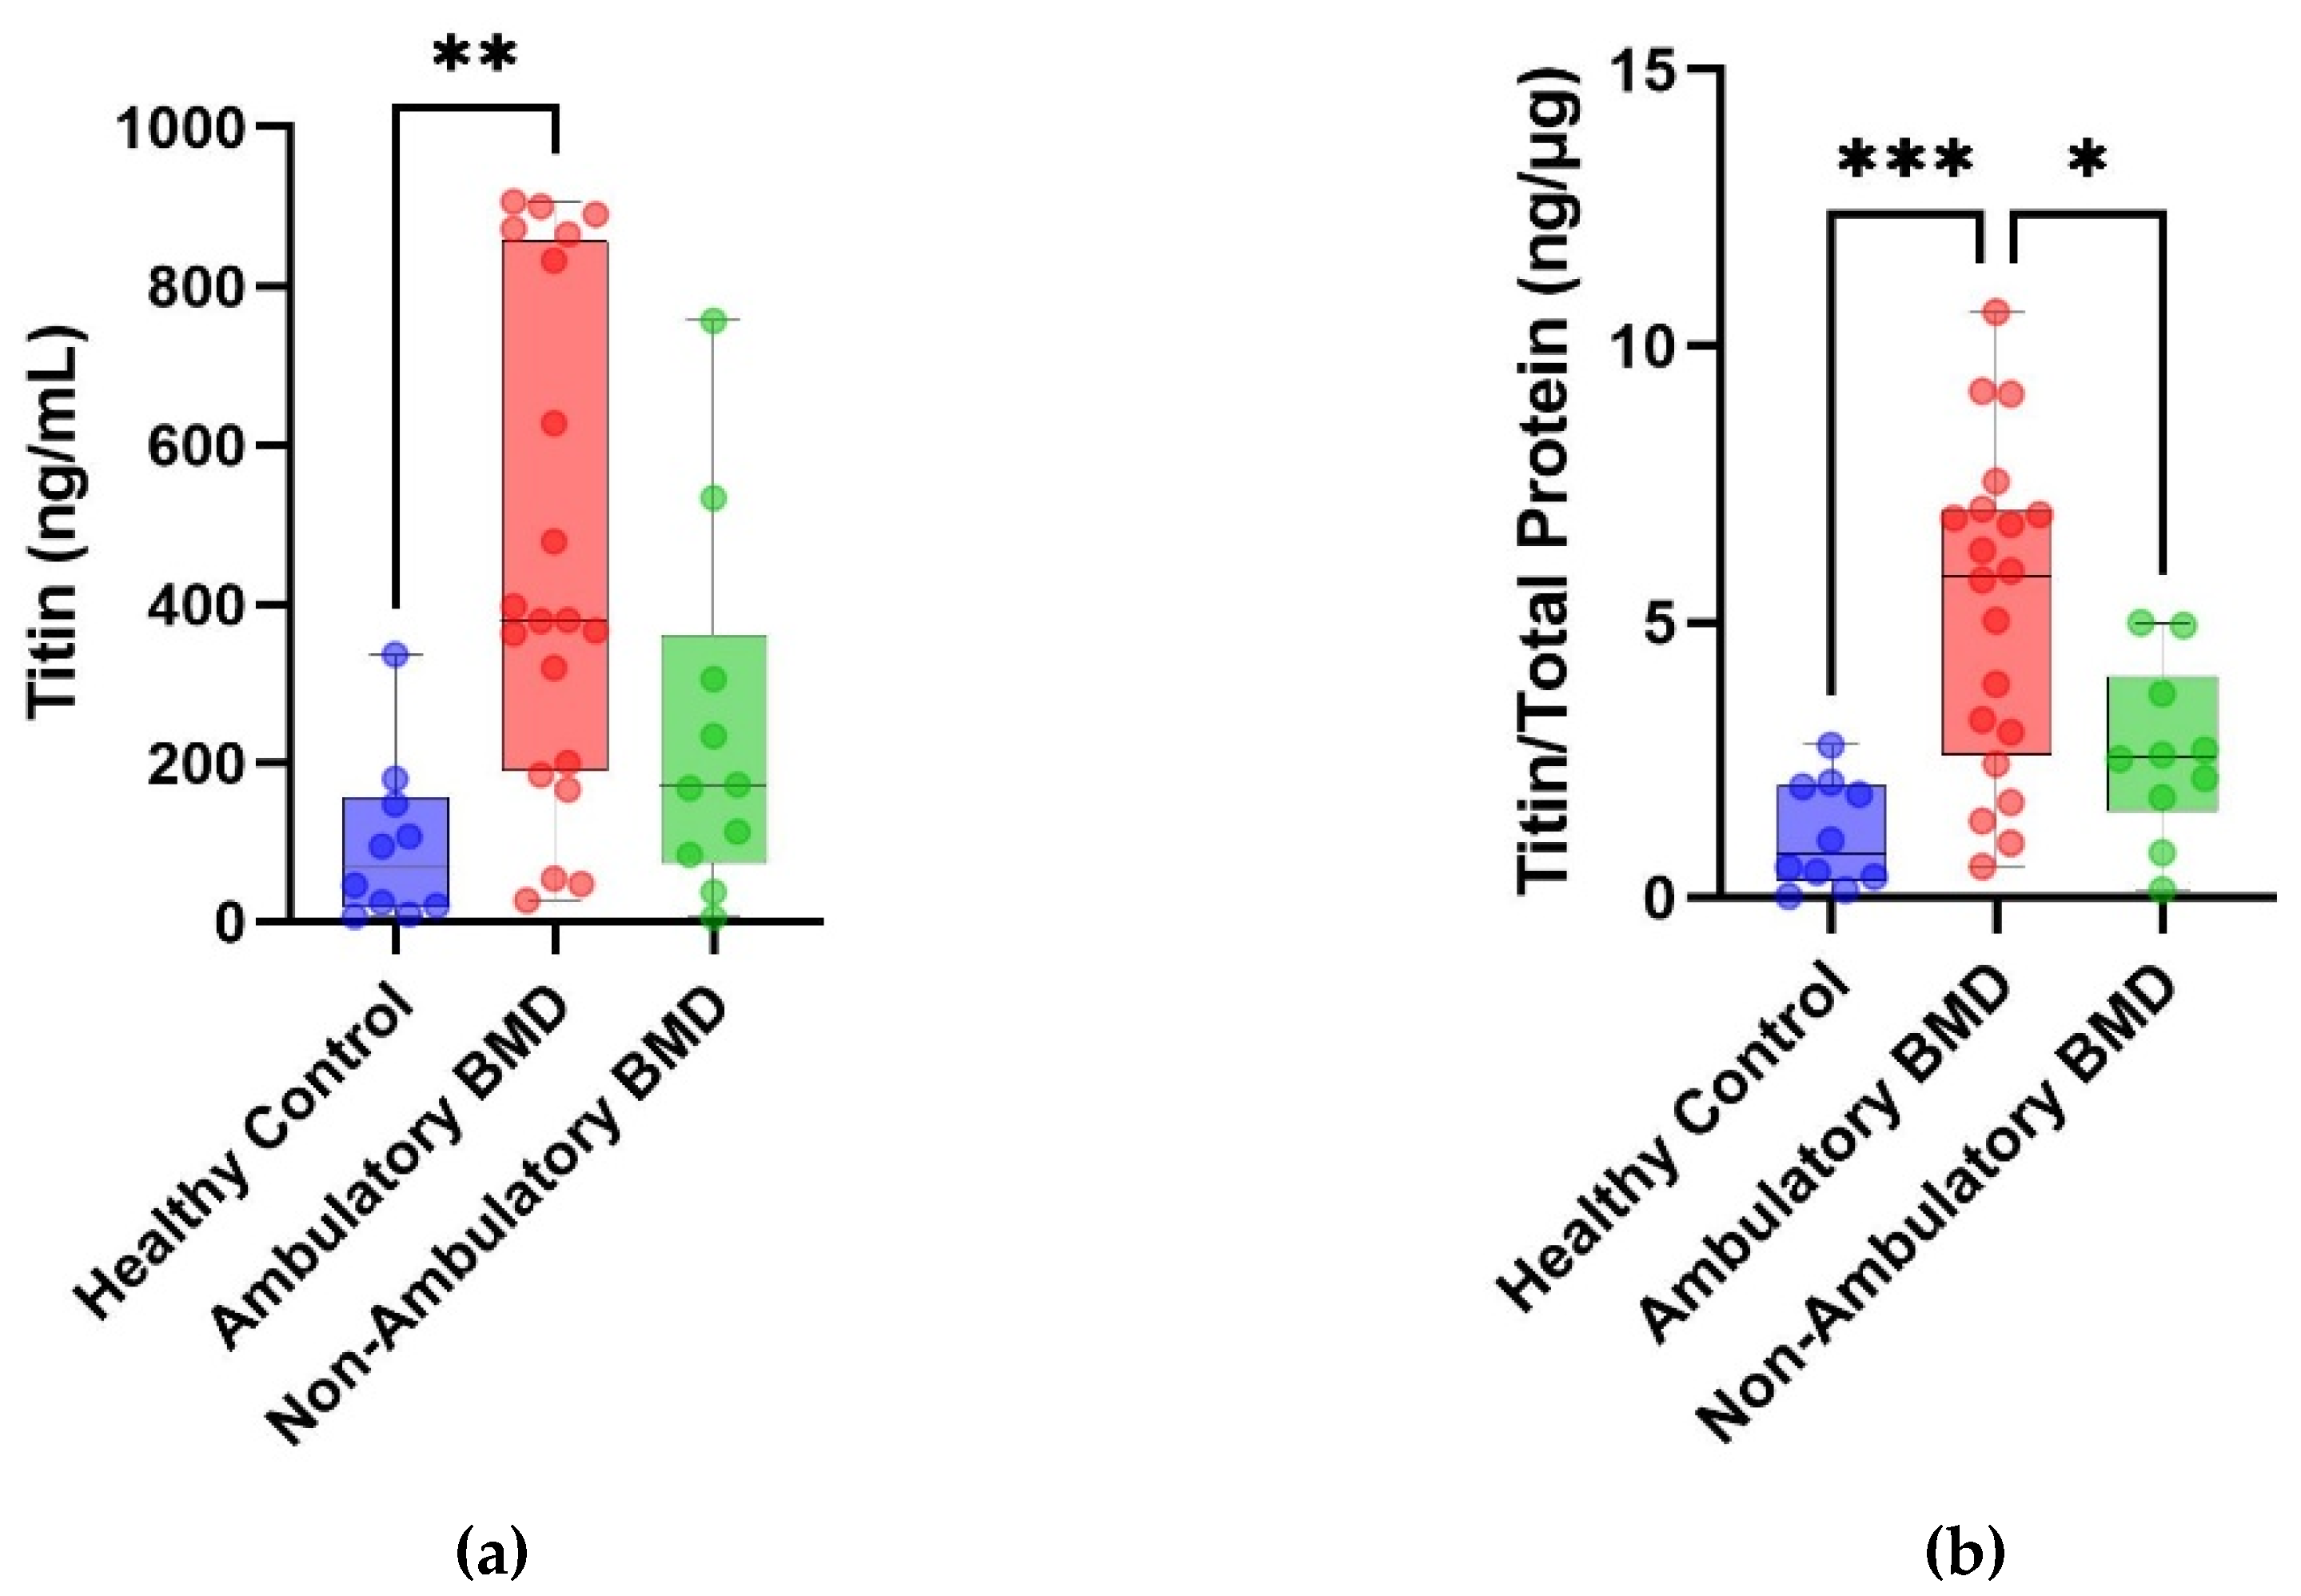
Figure 5.
(a) Titin/Total Protein adjusted for current age, Ambulatory BMD (n = 21), Non-ambulatory BMD (n = 6); (b) Titin/Total Protein adjusted for duration of disease, Ambulatory BMD (n = 21), Non-ambulatory BMD (n = 6); (c) Titin/Total Protein comparison between the disease severities based on age of onset, Ambulatory BMD (0-5) (n = 9), Non-ambulatory BMD (0-5) (n = 4); Ambulatory BMD (6-10) (n = 5), Non-ambulatory BMD (6-10) (n = 4); Ambulatory BMD (11-16) (n = 2), Non-ambulatory BMD (11-16) (n = 2); Ambulatory BMD (>21) (n=4). * indicates significant adjusted p-value of 0.0425; reported using Holm-Sidak post-hoc analysis.
Figure 5.
(a) Titin/Total Protein adjusted for current age, Ambulatory BMD (n = 21), Non-ambulatory BMD (n = 6); (b) Titin/Total Protein adjusted for duration of disease, Ambulatory BMD (n = 21), Non-ambulatory BMD (n = 6); (c) Titin/Total Protein comparison between the disease severities based on age of onset, Ambulatory BMD (0-5) (n = 9), Non-ambulatory BMD (0-5) (n = 4); Ambulatory BMD (6-10) (n = 5), Non-ambulatory BMD (6-10) (n = 4); Ambulatory BMD (11-16) (n = 2), Non-ambulatory BMD (11-16) (n = 2); Ambulatory BMD (>21) (n=4). * indicates significant adjusted p-value of 0.0425; reported using Holm-Sidak post-hoc analysis.
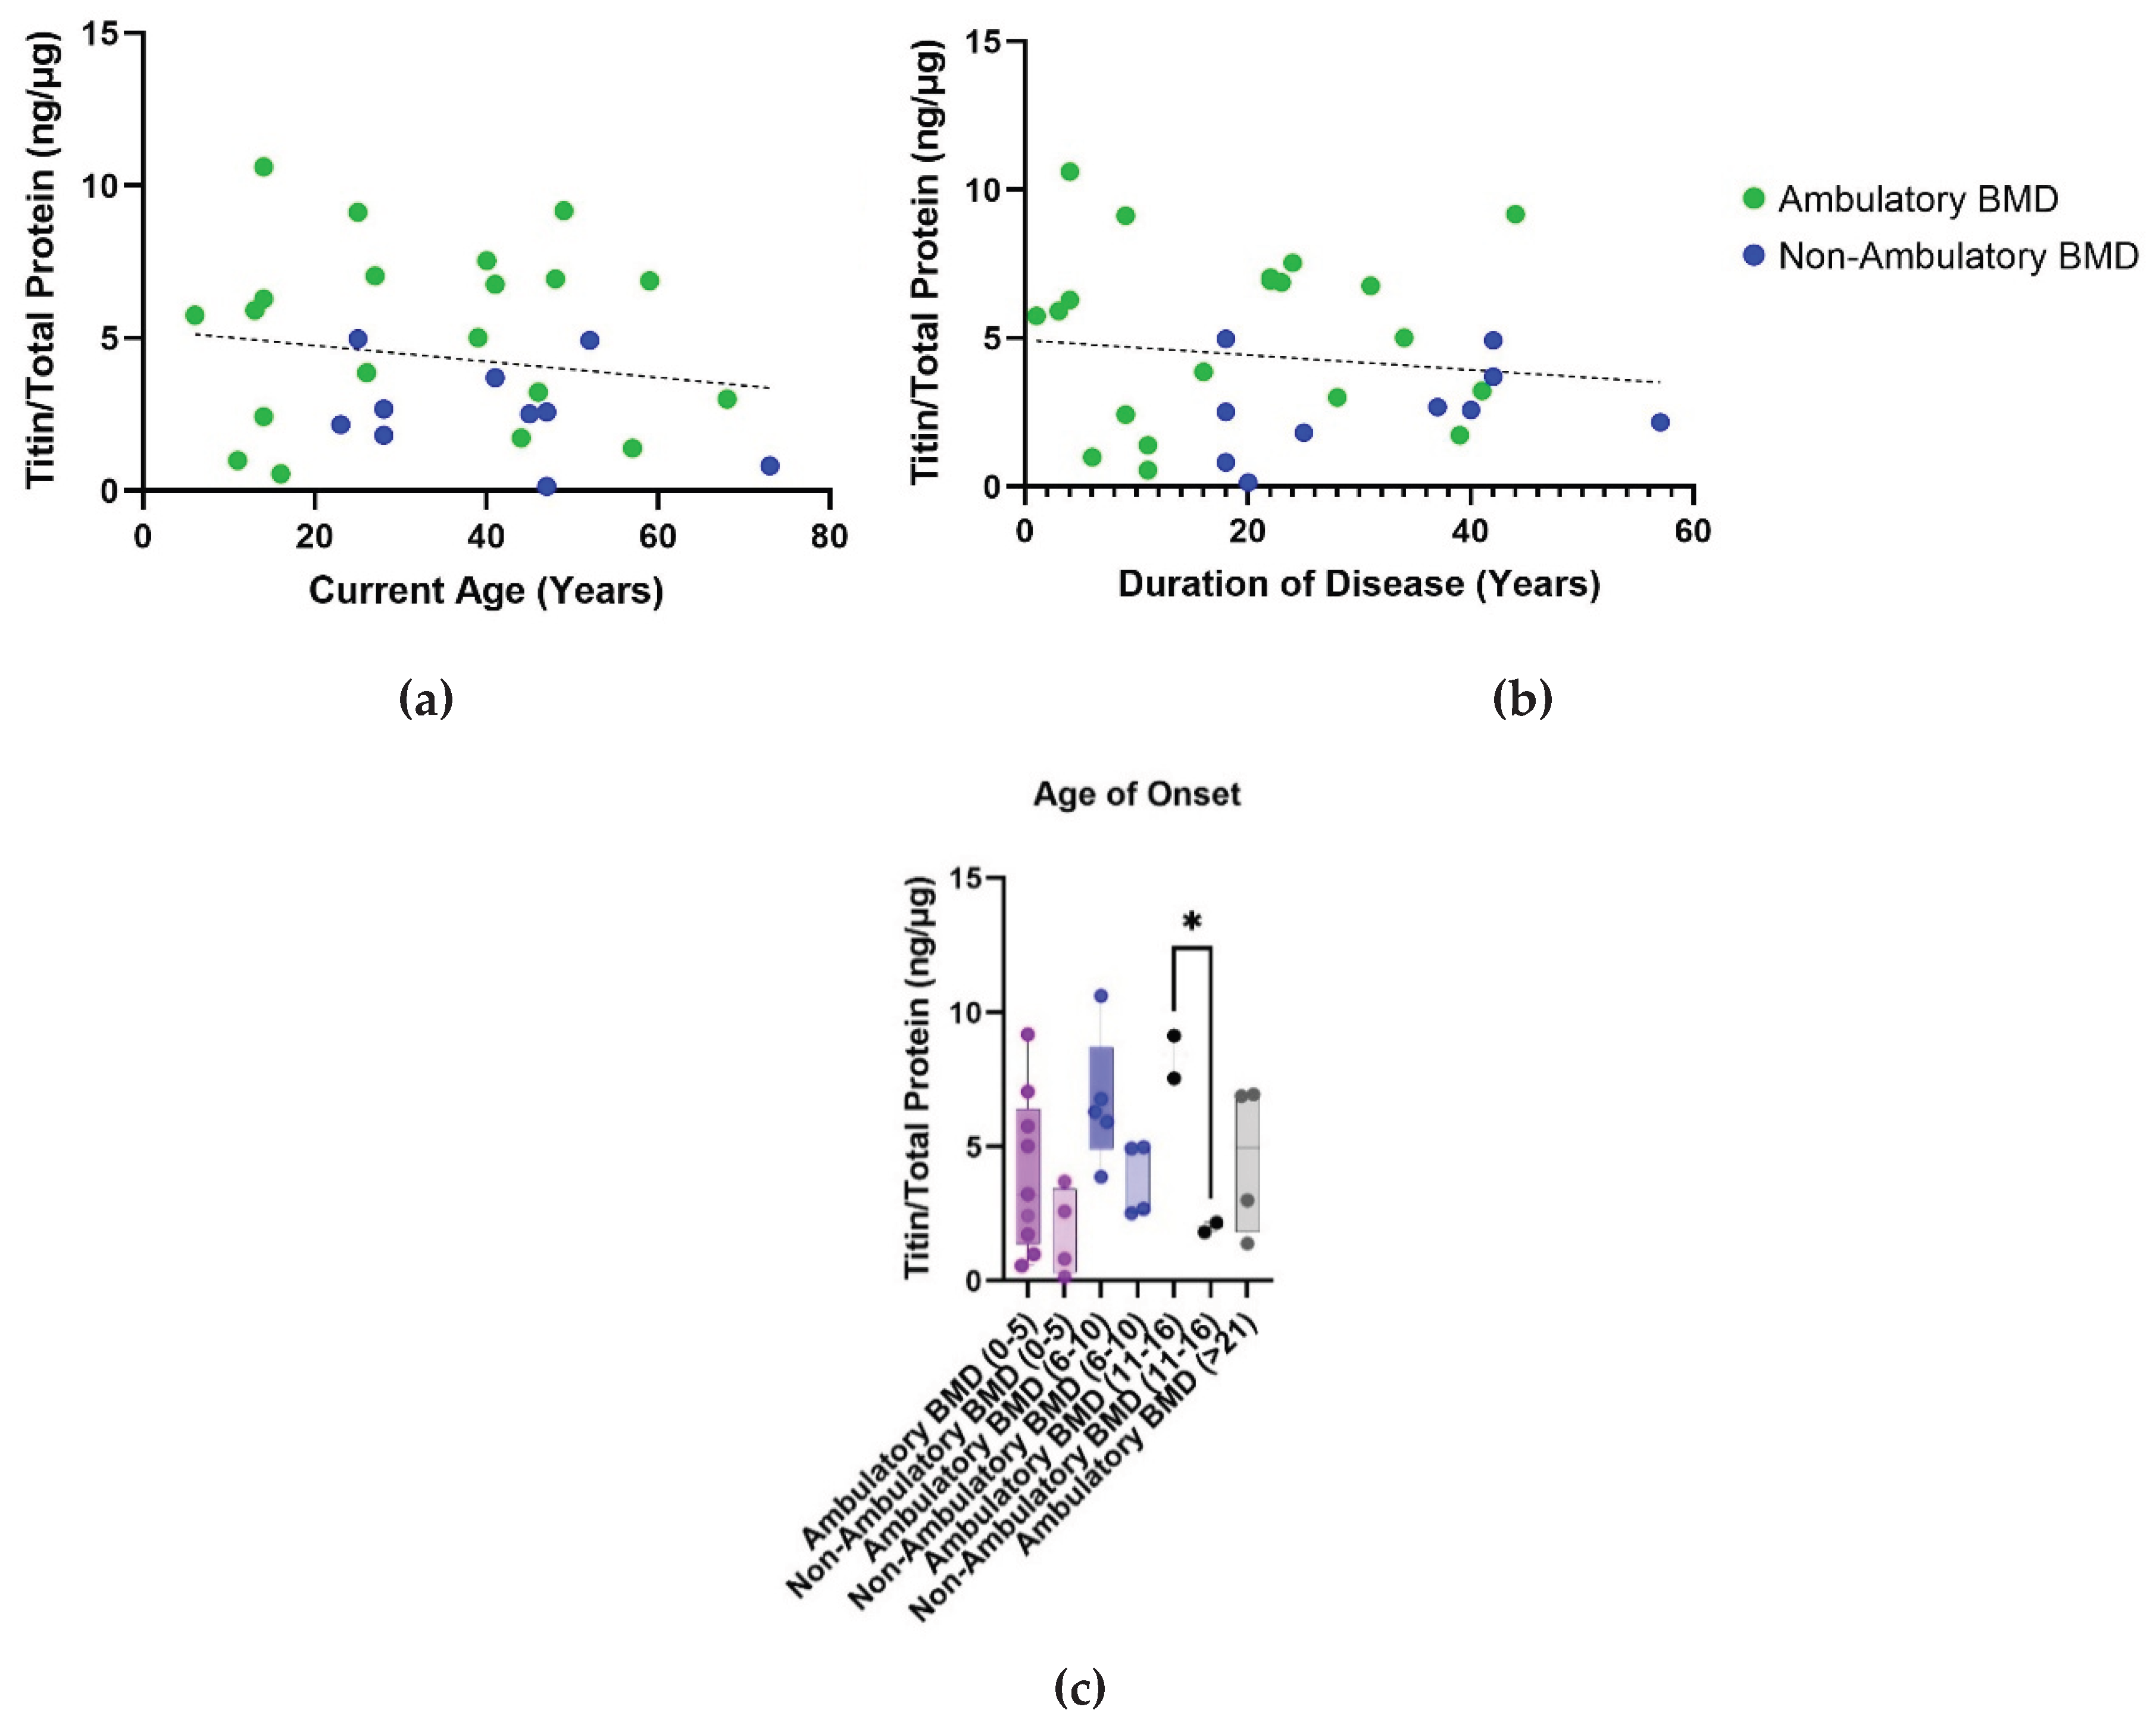

Table 1.
Muscle enriched proteins identified in urine samples of BMD subjects.
| Accession | Entry Name | aBMD/ Cnt |
p-value | naBMD/ Cnt |
p-value | Tissue specificity |
|---|---|---|---|---|---|---|
| Q8WZ42 | TITIN | 33 | 0.003 | 15 | < 0.001 | heart muscle, skeletal muscle, tongue |
| P12883 | MYH7 | 11 | 0.012 | 10 | 0.15 | heart muscle, skeletal muscle, tongue |
| Q9UKX2 | MYH2 | 14 | 0.001 | 13.75 | < 0.001 | skeletal muscle, tongue |
| O15273 | TELT | 10 | 0.027 | 8.75 | 0.09 | heart muscle, skeletal muscle, tongue |
| O00499 | BIN1 | 9 | 0.032 | 1.88 | 0.36 | skeletal muscle, tongue |
| Q14315 | FLNC | 2.47 | 0.01 | 0.88 | 0.83 | heart muscle, skeletal muscle, tongue |
Well-known muscle-related proteins that were found significantly elevated in urine samples of ambulatory BMD compared to healthy controls, included titin (TITIN), telethonin (TELT), myosin-2 (MYH2), and myosin-7 (MYH7).
Table 2.
Muscle enriched candidate protein biomarkers quantified using TMT method in urine samples of BMD patients and healthy controls.
Table 2.
Muscle enriched candidate protein biomarkers quantified using TMT method in urine samples of BMD patients and healthy controls.
| Accession | Entry Name | aBMD/Cnt | p-value | aBMD/ naBMD |
p-value | Tissue specificity |
|---|---|---|---|---|---|---|
| Q8WZ42 | TITIN | 2.21 | 0.02 | 1.93 | 0.019 | heart muscle, skeletal muscle, tongue |
| Q13203 | MYBPH | 2.62 | 0.04 | 1.84 | 0.146 | skeletal muscle, tongue |
| Q9UKX2 | MYH2 | 3 | 0.04 | -1.16 | 0.83 | skeletal muscle, tongue |
| O15273 | TELT | 2.34 | 0.06 | 1.17 | 0.55 | heart muscle, skeletal muscle, tongue |
| P04406 | GAPDH | 1.96 | 0.06 | 1.58 | 0.09 | skeletal muscle, tongue |
| P12883 | MYH7 | 4.3 | 0.09 | 1.55 | 0.022 | heart muscle, skeletal muscle, tongue |
| Q14315 | FLNC | 1.78 | 0.09 | 1.82 | 0.301 | heart muscle, skeletal muscle, tongue |
| P55290 | CDH13 | -1.91 | 0.09 | -1.26 | 0.137 | heart muscle, skeletal muscle, tongue |
Cnt: healthy controls; aBMD: ambulatory BMD; naBMD: non-ambulatory BMD; TITIN: titin; MYBH: Myosin-binding protein H; MYH2: myosin heavy chain-2; TELT: telethonin; GAPDH: glyceraldehyde-3-phosphate dehydrogenase; MYH7: myosin heavy chain-7; FLNC: filamin-C; CDH13: Cadherin-13.
Disclaimer/Publisher’s Note: The statements, opinions and data contained in all publications are solely those of the individual author(s) and contributor(s) and not of MDPI and/or the editor(s). MDPI and/or the editor(s) disclaim responsibility for any injury to people or property resulting from any ideas, methods, instructions or products referred to in the content. |
© 2026 by the authors. Licensee MDPI, Basel, Switzerland. This article is an open access article distributed under the terms and conditions of the Creative Commons Attribution (CC BY) license.
Copyright: This open access article is published under a Creative Commons CC BY 4.0 license, which permit the free download, distribution, and reuse, provided that the author and preprint are cited in any reuse.