

Submitted:
09 August 2026
Posted:
10 August 2026
You are already at the latest version
Abstract
Peach (Prunus persica) production and the northward expansion of its cultivation boundaries are severely constrained by recurrent extreme climatic events. Based on time-series transcriptomic analysis and qRT-PCR validation, multiple candidate transcription factor genes responsive to abscisic acid (ABA) were identified (PpERF48, PpERF017, PpMYB6, PpWRKY46, PpWRKY40, and PpbHLH35). Among these, PpMYB6 was further characterized through bioinformatic analysis, and transgenic peach callus and Arabidopsis thaliana lines overexpressing PpMYB6 were generated, revealing its dual role in modulating plant growth and conferring low-temperature stress tolerance. Yeast one-hybrid and dual-luciferase reporter assays confirmed that PpMYB6 directly binds to the PpCBF2 promoter to activate its transcription, thereby enhancing cold resistance. Furthermore, yeast two-hybrid library screening identified DWARF8 as a candidate interacting protein, pointing to a putative mechanism by which PpMYB6 may negatively regulate vegetative growth via the gibberellin pathway. Together, this study elucidates a novel molecular framework governing cold tolerance and growth balance in peach, providing a promising target gene for molecular breeding of cold-resistant cultivars and rootstocks.
Keywords:
Prunus persica
; cold stress
; abscisic acid (ABA)
; PpMYB6
; temporal transcriptomics
; growth–defense trade-off
; protein interactions
1. Introduction
Peach (Prunus persica (L.) Batsch) has a long cultivation history spanning over 4,000 years, making it one of the oldest cultivated fruit trees in China [1]. Due to its strong adaptability to diverse soil and climatic conditions, peach is widely grown across a wide latitudinal range from northern to southern China. Furthermore, peach cultivation holds substantial economic value, characterized by early bearing, rapid economic returns, and manageable orchard maintenance. However, cold stress—comprising chilling stress (<20 °C) and freezing stress (< 0 °C)—represents a major abiotic constraint that hinders the further expansion of the peach industry and limits its northern cultivation boundaries [2].
Low-temperature stress severely impairs various physiological processes in plants, leading to reduced vigor, growth retardation, leaf curling and browning, branch desiccation, pericarp discoloration, and eventual wilting, with extreme freezing ultimately causing plant mortality. Furthermore, cold stress induces cellular membrane damage, alters osmoprotectant levels, and triggers antioxidant defense mechanisms [3,4,5].
Numerous studies have demonstrated that endogenous phytohormones play crucial roles in mediating abiotic stress responses [6,7,8,9]. As a classic stress hormone, abscisic acid (ABA) plays a pivotal role in mediating plant tolerance to cold, drought, and saline-alkali stress [9,10,11,12,13]. Similarly, substantial physiological evidence indicates that exogenous ABA application significantly alleviates stress-induced peroxidative damage and maintains photosynthetic system stability [14,15]. In our previous study, we confirmed that exogenous ABA application enhanced cold tolerance in peach trees, identifying 50 mg·L−1¹ as the optimal concentration [16].
Existing findings reveal that ABA modulates cold stress responses through multi-layered mechanisms, including phytohormone crosstalk, hierarchical transcription factor cascades, and protein phosphorylation [17,18]. However, despite the well-documented protective role of exogenous ABA, how cold and ABA signaling pathways interactively regulate low-temperature tolerance in peach remains poorly understood. Specifically, the transcriptomic mechanisms underlying cold stress responses in peach remain elusive. Unraveling the transcriptomic network mediated by cold and ABA signal crosstalk is therefore of paramount importance.
In recent years, RNA sequencing (RNA-Seq) has emerged as a powerful tool for dissecting transcriptomic regulation under abiotic stress and has been widely applied in crops such as apple, wheat, rice, and citrus [19,20,21,22]. RNA-Seq has also been utilized to explore cold stress regulatory networks in peach. Previous studies revealed that cold-responsive differentially expressed genes (DEGs) in peach are significantly enriched in pathways such as biosynthesis of secondary metabolites, galactose metabolism, phenylpropanoid biosynthesis, and flavonoid biosynthesis [23,24].
Among the established molecular mechanisms governing cold acclimation, the ICE-CBF-COR module forms the core cold-signaling cascade [25,26,27]. Furthermore, multiple transcription factor families, including AP2/ERF, WRKY, NAC, and MYB, participate in the co-regulation of ABA signaling and cold responses [28,29,30,31,32]. Notably, MYB transcription factors serve not only as master switches regulating anthocyanin and flavonoid biosynthesis, but also as key players in phytohormone-mediated stress adaptation [33,34].
Nevertheless, research on ABA-mediated responses to short-term cold stress in peach remains limited. To address this scientific question, we conducted time-course RNA-seq analysis on peach seedlings to identify core DEGs co-responsive to cold stress and ABA treatment.
2. Materials and Methods
2.1. Plant Materials and Treatments
Seedlings of the cold-tolerant peach cultivar ‘Shiji Zhixing’ grown under field conditions were obtained from the Horticulture and Landscape Experimental Station of Hebei Normal University of Science and Technology (39.708° N, 119.176° E). For cold stress treatment, seedlings were placed in a growth chamber at 0 °C, and leaf samples were collected at 0, 1, 2, and 4 h. Concurrently, seedlings exhibiting uniform growth were sprayed with an exogenous ABA solution (50 mg·L−1¹), and leaf samples were harvested at the corresponding time points. All collected leaves were immediately frozen in liquid nitrogen and stored at -80 °C until use. Three biological replicates were performed for each treatment.
2.2. RNA Extraction, Library Construction, and RNA-Seq
Total RNA was extracted using the Polyphenol/Polysaccharide Plant RNA Extraction Kit (Coolaber, Beijing, China) according to the manufacturer’s instructions. RNA integrity was assessed using an Agilent 2100 Bioanalyzer (Agilent Technologies, CA, USA). Sequencing libraries were constructed following standard protocols with the NEBNext Ultra RNA Library Prep Kit (NEB, Ipswich, MA, USA). Preliminary quantification and insert size detection were conducted using a Qubit 2.0 Fluorometer (Life Technologies, CA, USA). Effective library concentrations (> 2 nM) were precisely quantified via qRT-PCR prior to high-throughput sequencing on the Illumina platform at Novogene Co., Ltd. (Beijing, China) [35,36].
2.3. Transcriptome Alignment, DEG Identification, and Functional Enrichment
Raw sequencing reads were processed for quality control by filtering out adaptor sequences and low-quality reads to obtain clean reads. Clean reads were aligned to the peach reference genome using HISAT2 software. Gene expression levels were normalized using the fragments per kilobase of transcript per million mapped reads (FPKM) method. Differentially expressed genes (DEGs) responsive to cold stress and ABA treatment were identified using the DESeq2 package, with P-values adjusted using the Benjamini-Hochberg method to control the false discovery rate [37,38].
Hierarchical clustering (H-cluster) was performed on log2(FPKM+1)-transformed and mean-centered expression values, partitioning DEGs into four distinct clusters with similar expression trends across treatments [39]. Functional annotations of DEGs were performed by integrating multiple databases. Gene Ontology (GO) and Kyoto Encyclopedia of Genes and Genomes (KEGG) pathway enrichment analyses were conducted using the clusterProfiler package. A threshold of P < 0.05 was defined as statistically significant for GO terms and KEGG pathways, and directed acyclic graphs (DAGs) were constructed to visualize the GO enrichment results [40].
2.4. Quantitative Real-Time PCR (qRT-PCR) Verification
Six DEGs co-responsive to cold stress and ABA treatment were selected for qRT-PCR validation, with the PpActin gene used as the internal reference [41]. Specific forward and reverse primers were designed using Primer3 software and synthesized by Sangon Biotech (Shanghai, China). Quantitative real-time PCR was performed using the Hieff® SYBR Green Master Mix (Yisheng Biotech, Shanghai, China) on a Bio-Rad CFX Real-Time PCR Detection System (Bio-Rad, Hercules, CA, USA). The relative expression levels of target genes were calculated using the 2−ΔΔCt method, with the control samples (0 °C treatment) serving as the baseline reference. Three biological and technical replicates were analyzed for each gene [42].
2.5. Bioinformatic and Promoter Analysis
In this study, the physicochemical properties of the PpMYB6 protein sequence were analyzed using the online ExPASy ProtParam tool (https://web.expasy.org/protparam/). The tertiary (3D) structure of the protein was predicted using the SWISS-MODEL online server (https://swissmodel.expasy.org/). Multiple sequence alignment was conducted using DNAMAN software, and phylogenetic tree analysis was performed using MEGA 12 software. For promoter sequence analysis, cis-acting regulatory elements within the promoter region were identified using the PlantPAN 4.0 database (https://plantpan.itps.ncku.edu) and the PlantCARE database (http://bioinformatics.psb.ugent.be/webtools/plantcare/html/).
2.6. Generation of PpMYB6-Overexpressing Peach Callus
To construct the PpMYB6 overexpression vector, the full-length coding sequence of PpMYB6 was cloned into the pCAMBIA-2300 vector using the Biomed 2×Seamless Mix (Biomed, Beijing, China). The recombinant construct was transformed into Agrobacterium tumefaciens strain GV3101 competent cells. A 50 μL aliquot of the transformed A. tumefaciens culture was inoculated into 50 mL of liquid YEP medium containing 50 mg·L−1¹ kanamycin and 50 mg−1L⁻¹ rifampicin, and incubated at 220 rpm for 16 h. The bacterial cells were harvested by centrifugation at 5,000 rpm for 10 min and resuspended in infection medium (4.43−1g·L⁻¹ MS salts and 35−10 g·L⁻¹ sucrose).
Dark-adapted peach calli were immersed in the bacterial suspension and shaken at 220 rpm at 37 °C for 1 h. Following infection, the calli were filtered and blotted dry on sterile filter paper. The calli were then co-cultivated on co-cultivation medium (4.43 g·L−1¹ MS, 35.0 g−1L⁻¹ sucrose, 6.0−1g·L⁻¹ agar, 1.−1 mg·L⁻¹ 6-BA, −1.2 mg·L⁻¹ IBA, an−1 031 mg·L⁻¹ GA₃) in the dark for 2–3 days. Subsequently, the calli were transferred to selection medium (co-cultivation medium supplemented−1with 80 mg·L⁻¹ kanamyc−1n and 300 mg·L⁻¹ cefotaxime) under light conditions. Proliferating calli were subcultured onto fresh selection medium, and stable transgenic lines were verified via genomic PCR and qRT-PCR [43,44].
2.7. Generation and Selection of Transgenic Arabidopsis thaliana Lines
Arabidopsis thaliana seeds were sown in pots containing soil substrate and stratified in the dark at 4 °C for 3 days to synchronize germination. The pots were then transferred to an environmental growth chamber and cultivated until plants reached the bolting stage for floral dip transformation.
For primary bacterial culture preparation, a 50 µL aliquot of Agrobacterium tumefaciens culture harboring the PpMYB6 overexpression construct was inoculated into 500 µL of YEP liquid medium (supplemented with 50 mg·L−1¹ rifampicin and 50 mg−1L⁻¹ kanamycin) in a sterile 2 mL microcentrifuge tube and cultured overnight at 28 °C on a shaker. Subsequently, a 100 µL volume of the primary culture was transferred into a sterile 50 mL Erlenmeyer flask containing 25 mL of fresh YEP medium (+ Rif + Kana) and cultivated at 28 °C with shaking for 14 h. Bacterial cells were harvested by centrifugation at 5,000 rpm for 10 min. After discarding the supernatant, the pellet was washed with 10 mL of sterile distilled water and centrifuged at 5,000 rpm for 5 min to recollect the bacterial cells. The resulting pellet was resuspended in floral dip infiltration medium (2.2−1g·L⁻¹ MS salts, −10 g·L⁻¹ sucrose, −100 µL·L⁻¹ Silwet L-77, and 100µM acetosyringone).
The inflorescences of bolting Arabidopsis plants were submerged in the bacterial suspension for 45 s. The dipped plants were placed horizontally under dark conditions for 24 h and then returned to normal growth conditions in the growth chamber. The floral dip transformation was repeated weekly for a total of three treatments.
Harvested T0 seeds were collected into 2 mL microcentrifuge tubes and surface-sterilized by vortexing in 75% ethanol for 1 min, followed by 6% sodium hypochlorite solution for 10 min, and rinsed six times with sterile distilled water (2 min per wash). The sterilized seeds were sown onto 1/2 MS solid medium containing 50 mg·−1⁻¹ kanamycin. The plates were stratified at 4 °C in the dark for 3 days and transferred to a growth chamber. Kanamycin-resistant green seedlings were selected to obtain positiv1 T₁ transgenic lines. Homozygo3s T₃ transgenic lines were established through three consecutive generations of antibiotic screening and subsequently verified via genomic PCR and qRT-PCR.
2.8. Cold Stress Tolerance Assays of Transgenic Callus and Arabidopsis thaliana
Successfully transformed PpMYB6-overexpressing (OE) peach calli were subcultured on selection medium every 20 days for propagation. Wild-type (WT) calli and three independent OE lines were inoculated onto the same MS medium plate, with each line occupying one quadrant. Plates were incubated at 28 °C under light for 7 days. For cold stress treatment, the plates were exposed to -5 °C for 6 h and subsequently transferred back to 28 °C for a 7-day recovery period. Morphological changes and growth phenotypes were observed to evaluate the differences between WT and transgenic calli under cold stress.
Seeds of selected T3 generation transgenic Arabidopsis thaliana lines and wild-type (WT) controls were sown. After completing cold stratification (vernalization), the seeds were transferred to an environmental growth chamber for germination and cultivated for 7 days. The 7-day-old seedlings were photographed to document the baseline phenotype of the non-stressed control group. Subsequently, the seedlings were subjected to freezing cold stress at -4℃ for 3.5h in a temperature-controlled growth chamber, after which morphological changes and cold-stress phenotypes were observed and evaluated.
2.9. Yeast One-Hybrid (Y1H) Assay
Carrier DNA was denatured in a boiling water bath for 5 min and immediately chilled on ice for 5 min.
The yeast transformation reaction mixture was assembled as follows: Carrier DNA 10 µL, Recombinant pHIS2 plasmid 500 ng, Y187 yeast competent cells 100.0 µL, PEG/LiAc solution 500 µL.
The mixture was mixed extremely gently and incubated in a 30 °C water bath for 10 min. The tube was removed and mixed gently again before continuing incubation; this step was repeated 3 times for a total incubation time of 30 min.
A volume of 70 µL of DMSO was added to the mixture.
The solution was again mixed extremely gently, incubated in a 42 °C water bath for 5 min, and repeated 3 times for a total of 15 min.
Following incubation, the mixture was briefly centrifuged at 12,000 rpm, and the supernatant was discarded to collect the yeast cell pellet.
The cell pellet was resuspended in 1 mL of liquid YPDA medium and incubated at 30 °C with shaking at 220 rpm for 1 h.
After cultivation, the mixture was centrifuged at 12,000 rpm, the supernatant was discarded, and the yeast pellet was resuspended in 200 µL of 0.9% NaCl solution.
Aliquots of 100 µL suspension were spread onto synthetic dropout medium lacking tryptophan (SD/−Trp) and medium lacking tryptophan and histidine (SD/−Trp/−His) agar plates, followed by incubation at 30 °C for 3–5 days.
Colony growth on SD/−Trp/−His plates was evaluated to test for reporter gene auto-activation; colony formation indicated auto-activation of the promoter construct.
If auto-activation was observed, SD/−Trp/−His agar media supplemented with 3-amino-1,2,4-triazole (3-AT) at concentrations of 20, 30, 40, 50, 60, and 70 mM were prepared.Yeast colonies harboring the recombinant plasmid were resuspended in liquid medium and spot-plated onto SD/−Trp/−His media containing varying 3-AT concentrations. Plates were incubated at 30 °C for 3–5 days to determine the optimal 3-AT concentration required to completely inhibit auto-activation.
Recombinant pHIS2-PpCBF2 reporter vector and pGADT7-PpMYB6 effector vector were co-transformed into Y187 yeast competent cells. Following transformation, cell suspensions were spread onto double dropout media (SD/−Trp/−Leu) and incubated at 30 °C for 3–5 days. Single colonies were picked from SD/−Trp/−Leu plates and spot-plated onto triple selective media (SD/−Trp/−His/−Leu) supplemented with the pre-determined optimal concentration of 3-AT. Plates were incubated at 30 °C for 3–5 days to evaluate yeast growth and confirm promoter-binding activity.
2.10. Dual-Luciferase Reporter Assay
Sequencing-verified recombinant reporter plasmid pGreenII 0800-PpCBF2 was transformed into Agrobacterium tumefaciens strain GV3101 competent cells. A 100 µL aliquot of the transformed cell culture was inoculated into 2 mL of YEP liquid medium supplemented with kanamycin (Kana) and rifampicin (Rif) and cultured overnight at 28 °C with shaking at 220 rpm for 14–16 h. A portion of the culture was transferred into 20 mL of fresh YEP (+ Kana + Rif) medium and grown until reaching an OD600 of 0.8. Cells were harvested by centrifugation at 5,000 rpm for 10 min, and the supernatant was discarded.
MES buffer was prepared (2.033 g·L−1¹ Mg2l₂26H₂O, 2.132−1g·L⁻¹ MES and 100 μM acetosyringone, and adjust the pH to 5.5). The bacterial pellet obtained in the previous step was resuspended in the buffer to a fi600al OD₆₀₀ of 0.8–1.0, and incubated at 28 °C in the dark for 1 h for recovery.
Agrobacterium culture harboring the reporter plasmid (pGreenII 0800-PpCBF2) was mixed with Agrobacterium culture harboring the PpMYB6-overexpression effector construct. The mixed suspension was infiltrated into the abaxial surface of Nicotiana benthamiana leaves using a needleless syringe. Infiltrated plants were kept in the dark for 48 h prior to bioluminescence detection using a plant live imaging system.
Leaf discs were sampled from the infiltrated regions using a leaf puncher and homogenized in a mortar. Protein extraction was performed by adding 200 µL of cell lysis buffer (Firefly Luciferase Reporter Gene Assay Kit, Beyotime). The homogenate was centrifuged at 12,000 rpm for 2 min, and the supernatant was collected for analysis.
A 20 µL aliquot of the supernatant was loaded into a microplate well and mixed thoroughly with 50 µL of Firefly luciferase detection reagent by pipetting. Firefly luciferase luminescence (LUC) was measured using a multifunctional microplate reader in chemiluminescence mode.
Subsequently, 100 µL of Renilla luciferase detection reagent was added to the same well and mixed thoroughly by pipetting, after which Renilla luciferase luminescence (REN) was recorded. Luminescence measurements were completed within 5 min.
Relative promoter activity was calculated as the ratio of Firefly luciferase activity to Renilla luciferase activity (LUC/REN).
2.11. Yeast Two-Hybrid (Y2H) Library Screening for PpMYB6-Interacting Proteins
To investigate the molecular mechanisms underlying PpMYB6 function, the full-length coding sequence of PpMYB6 was cloned into the pGBKT7 vector to generate the bait construct, and its autoactivation was evaluated. The recombinant bait plasmid was then co-transformed with a peach cDNA library into yeast competent cells.
Yeast cells harboring the pGBKT7-PpMYB6 construct were cultured in 100 mL of medium until reaching an OD600₀₀ of 0.8. The culture was centrifuged at 4,000 rpm for 5 min, and the cell pellet was resuspended in 1 mL of LiAc/TE buffer, transferred to a 1.5 mL microcentrifuge tube, and briefly spun at 12,000 rpm. The resulting pellet was resuspended in 600 μL of LiAc/TE buffer and incubated on ice for 30 min to prepare competent yeast cells, which were used within 4 h.
The peach cDNA library plasmids were transformed into the prepared competent cells and subsequently plated on double-dropout (SD/-Trp/-Leu, DDO) and quadruple-dropout (SD/-Trp/-Leu/-His/-Ade, QDO) synthetic media. After incubation at 30 °C for 5 days, single colonies surviving on QDO plates were picked and resuspended in 0.9% NaCl solution. Aliquots (5 μL) of the cell suspensions were spotted onto fresh QDO plates and cultured at 30 °C for an additional 3–5 days to confirm potential positive interactions. Plasmids from robustly growing colonies were isolated using a Yeast Plasmid Extraction Kit (Coolaber, Beijing, China). Colony PCR was performed using pGADT7-specific primers, and positive inserts were sequenced to identify candidate PpMYB6-interacting proteins [45].
3. Results
3.1. Transcriptome Sequencing and Quality Control
To investigate gene expression dynamics in peach branches under low-temperature stress, time-series transcriptome sequencing was performed. As shown in Table 1, following stringent quality control, a total of 157.01 Gb of clean data were obtained, with each sample yielding over 6.01 Gb. The GC content across all samples exceeded 45%, and the Q30 percentage consistently surpassed 93.12%. These metrics demonstrate the high quality and accuracy of the sequencing data, providing a robust dataset for subsequent analysis of ABA- and cold-responsive transcriptomic changes.
3.2. Sample Correlation and Principal Component Analysis
A sample correlation heatmap was generated by calculating Pearson correlation coefficients of gene expression levels among all samples. As shown in Figure 1, biological replicates within each treatment group exhibited exceptionally high reproducibility, with coefficient of determination (R2) values exceeding 0.95. These results confirmed the reliability and experimental reproducibility of the sampling process. Furthermore, distinct gene expression profiles were observed between different treatment groups, laying a solid foundation for identifying differentially expressed genes (DEGs).
To further evaluate the sample spatial distribution and treatment-specific effects, principal component analysis (PCA) was conducted. The first two principal components accounted for 32.12% (PC1) and 19.24% (PC2) of the total variance, respectively. In the 2D PCA score plot, biological replicates within the same treatment group clustered tightly, further validating high intra-group consistency. Spatially, ABA-treated samples were predominantly localized along the negative PC1 axis. In contrast, cold-treated samples displayed a distinct shift along the positive PC1 axis over time. These findings indicate that both ABA application and low-temperature stress exert profound and distinct impacts on the global transcriptomic landscape of peach.
3.3. Identification and Expression Dynamics of Differentially Expressed Genes
To systematically analyze transcriptomic alterations under cold stress and ABA treatment, differentially expressed genes (DEGs) across comparisons were identified, and their numerical distribution and overlaps were evaluated. Overall, the total number of DEGs displayed a time-dependent increasing trend under both ABA application and low-temperature stress.
As shown in Figure 2, in ABA-treated samples, the number of DEGs peaked at 4 h (ABA4 vs. ABA0), with a total of 2,962 DEGs (1,548 upregulated and 1,414 downregulated), which was significantly higher than those observed at 1 h and 2 h. Similarly, DEG abundance under cold stress reached its maximum at 4 h (Cold4 vs. Cold0), yielding 1,898 DEGs (1,515 upregulated and 383 downregulated). Notably, upregulated DEGs markedly outnumbered downregulated DEGs under cold stress.
Venn diagram analysis revealed that 419 DEGs were consistently differentially expressed across all cold stress time points (1, 2, and 4 h), whereas 641 DEGs responded to ABA across all treatment durations. For both treatments, the overall transcriptomic response culminated at 4 h.
To elucidate the potential synergistic crosstalk between ABA signaling and cold stress responses in peach, DEGs from both treatments were integrated. A total of 1,105 DEGs were co-responsive to both cold stress and ABA treatment. These co-regulated DEGs represented candidate genes mediated by the ABA pathway in response to low temperature, likely serving as pivotal hubs within the ABA-dependent cold signaling network.
As shown in Figure 3, hierarchical clustering of DEG expression profiles classified these genes into four distinct expression patterns (Clusters a–d):
Cluster a: Genes in this cluster exhibited continuous downregulation over time under cold stress, accompanied by minimal responsiveness to ABA treatment.
Cluster b: Genes responded simultaneously to both ABA and cold treatments, displaying progressive upregulation over time. These genes were candidate participants in the ABA-mediated cold tolerance pathway, likely functioning in cross-signal integration.
Cluster c: Genes showed transient upregulation followed by a decline under cold stress, suggesting their involvement in the early perception of cold signals. Conversely, their expression levels steadily decreased following ABA application.
Cluster d: Genes displayed opposite expression trends between the two treatments, characterized by continuous downregulation under cold stress but steady upregulation under ABA treatment.
3.4. Gene Ontology (GO) Functional Enrichment Analysis
To elucidate the functional classifications of DEGs, Gene Ontology (GO) enrichment analysis was conducted across different time points for both ABA and cold treatments.
As shown in Figure 4, in ABA-treated samples, the overall enrichment intensity and the number of significantly enriched GO terms progressively decreased over time.
At 1 h, DEGs were significantly enriched in Molecular Function (MF) terms including transferase activity, transcription factor binding, oxidoreductase activity, and sulfate transmembrane transporter activity. Biological Process (BP) terms primarily encompassed defense response, response to stress, response to biotic stimulus, carbohydrate metabolic process, and protein modification process. Cellular Component (CC) terms were significantly enriched in the ribosome, cell wall, and extracellular matrix.
At 2 h, the number of enriched terms declined, though defense response and response to biotic stimulus maintained high significance.
By 4 h, enrichment intensity diminished further, with transmembrane transport, ion binding, and maintenance of cellular homeostasis becoming the predominant enriched functions.
In contrast, cold-stressed samples exhibited a temporal expansion in both the quantity and functional spectrum of enriched GO terms.
At 1 h, biological processes were dominated by response to endogenous stimulus, response to hormone, and response to chemical, while molecular functions were mainly enriched in glycosyltransferase activity, polysaccharide binding, and DNA-binding transcription factor activity.
At 2 h, iron ion binding and oxidoreductase activity became significantly enriched, with an increasing proportion of DEGs involved in polysaccharide metabolism and signal transduction pathways.
By 4 h, the functional coverage broadened further, highlighting significant enrichment in regulation of enzyme activity, ion binding, transcriptional regulation, polysaccharide metabolism, and extracellular matrix components. This transition indicates a shift in cold response from early stress perception and hormone signaling toward structural reorganization and metabolic remodeling.
Comparative synthesis of GO enrichment profiles between both treatments demonstrated shared enrichment in defense response, redox homeostasis regulation, ion transmembrane transport, and transcription factor-mediated transcriptional reprogramming. Both ABA application and cold stress exhibited a highly conserved response logic, initiated by early defense activation and signal transduction cascades, followed by a transition toward cellular homeostasis maintenance and metabolic acclimation in the later stages.
3.5. KEGG Pathway Enrichment Analysis
To further elucidate the metabolic networks and signal transduction pathways involved, KEGG pathway enrichment analysis was conducted for DEGs under ABA and cold treatments across different time points.
As shown in Figure 5, under ABA application, the enriched pathways exhibited a distinct temporal transition from basal metabolic activation toward hormone signal transduction cascades over time.
At 1 h, DEGs were predominantly enriched in metabolic biosynthesis pathways, including phenylpropanoid biosynthesis and sulfur metabolism.
At 2 h, significantly enriched pathways included flavonoid biosynthesis, ribosome biogenesis, and terpenoid and polyketide biosynthesis.
By 4 h, the most enriched pathways shifted from metabolic biosynthesis to signal transduction and stress response pathways, specifically plant-pathogen interaction, protein processing in endoplasmic reticulum, plant hormone signal transduction, and the MAPK signaling cascade.
Conversely, under cold stress, enriched pathways demonstrated an inverse temporal shift from initial signal transduction toward downstream metabolic biosynthesis.
At 1 h, early-responsive pathways were concentrated on signal perception and relay modules, including plant hormone signal transduction, the MAPK signaling cascade, protein processing in endoplasmic reticulum, and plant-pathogen interaction.
At 2 h and 4 h, enriched pathways progressively transitioned toward metabolic biosynthesis, such as biosynthesis of amino acids, cysteine and methionine metabolism, and flavonoid biosynthesis.
Cross-comparison revealed that both ABA application and cold stress significantly co-regulated secondary metabolism (e.g., phenylpropanoid biosynthesis and flavonoid biosynthesis) and shared core signaling pathways, including plant-pathogen interaction, protein processing in endoplasmic reticulum, plant hormone signal transduction, and the MAPK signaling cascade.
Notably, a temporal divergence was observed between the two stimuli: ABA application initially activated biosynthetic pathways before engaging signal transduction cascades, whereas cold stress immediately triggered signal transduction networks followed by secondary metabolic biosynthesis. These findings highlighted both functional crosstalk and distinct temporal division of labor between ABA- and cold-mediated stress regulatory networks in peach.
3.6. qRT-PCR Validation of Co-Responsive DEGs
Through cluster and enrichment analyses, six genes co-responsive to both cold stress and ABA signals—ERF48, ERF017, MYB6, WRKY46, WRKY40, and BHLH35—were selected for qRT-PCR validation. As shown in Figure 6, the qRT-PCR results indicated that under cold stress, the expression of PpMYB6 in ‘Shiji Zhixing’ peach exhibited an initial increase followed by a decrease over the treatment time series. Its expression peaked at 2 h of cold exposure, reaching a level 4-fold higher than that of the untreated control. Similarly, PpERF017 expression peaked at 2 h before declining slightly, showing a maximum expression level 40-fold higher than the untreated control. In contrast, the transcript levels of PpERF48, PpWRKY40, PpWRKY46, and PpBHLH35 continued to be upregulated throughout the treatment, reaching their maximum levels at 4 h. The qRT-PCR expression patterns of all six genes were highly consistent with the RNA-Seq dataset.
3.7. Bioinformatic Analysis of PpMYB6
As shown in Figure 7 and Figure 8, physicochemical property analysis using ExPASy ProtParam indicated that the PpMYB6 protein comprises 368 amino acids, with a predicted molecular weight of 42.22 kDa and a theoretical isoelectric point (pI) of 5.90. The PpMYB6 gene is located on chromosome 4 of the peach genome (genomic coordinates: 1,629,509–1,678,488 bp), with a total genomic length of 1,577 bp and a coding sequence (CDS) of 1,107 bp. Conserved domain analysis via NCBI CD-Search revealed that residues 15–118 aa harbor typical conserved R2R3-MYB and SANT domains. Secondary structure prediction using SOPMA showed that random coils constituted the largest fraction (56.30%), followed by extended strands (22.36%) and α-helices (21.34%). Tertiary structure modeling via Swiss-Model generated a 3D structure with 70.94% sequence coverage relative to the template model. Multiple sequence alignment and phylogenetic tree analysis demonstrated that PpMYB6 (Accession No. XM_007211402.2) shares high sequence similarity and conserved MYB-binding domains with MYB orthologs from almond (Prunus dulcis MYB102), plum (Prunus domestica MYB6), and pear (Pyrus pyrifolia MYB102).
To further explore the upstream regulatory mechanisms of PpMYB6 in response to cold and ABA signaling, cis-acting elements within the upstream promoter sequence of PpMYB6 were predicted. As shown in Figure 9, the promoter sequence of PpMYB6 contained multiple core cis-acting elements directly responsive to ABA and low temperature. Several DRE/CRT elements harboring the conserved CCGAC core motif were densely localized in the 600–900 bp upstream region of the promoter, suggesting that PpMYB6 can be directly activated by cold stress signaling pathways. Typical ABRE elements containing the ACGT core motif were also densely distributed in the 1100–1300 bp region, which can be directly bound and activated by bZIP transcription factors—the core regulators of ABA signaling—indicating that PpMYB6 directly participates in ABA responsiveness. Additionally, W-box elements recognized by WRKY transcription factors were widely present, which are extensively involved in the crosstalk between ABA signaling and abiotic stress responses. Cis-acting element analysis demonstrated that PpMYB6 is dual-regulated by both ABA and cold signals at the transcriptional promoter level, which is consistent with its functional role in mediating ABA-induced cold tolerance in peach described above.
3.8. Generation and Phenotypic Analysis of PpMYB6-Overexpressing Calli and Arabidopsis thaliana
As shown in Figure 10, following confirmation by genomic PCR and qRT-PCR, three independent positive PpMYB6-overexpressing (OE) callus lines were successfully established. To evaluate cold stress tolerance, wild-type (WT) and transgenic calli were subjected to low-temperature treatment, and their fresh weight (FW) changes were measured. Following cold treatment, the average FW of WT calli decreased by 51.2%, whereas the average FW of PpMYB6-OE calli decreased by only 5.8%. Phenotypic evaluation revealed that under normal growth conditions (28 °C), PpMYB6-OE calli exhibited a slightly slower growth rate compared with WT calli. However, under cold stress, while WT callus growth was severely restricted, the growth of PpMYB6-OE calli remained largely unaffected. These results demonstrated that overexpression of PpMYB6 significantly enhanced cold tolerance in peach callus while repressing callus growth under non-stress conditions.
As shown in Figure 11, following confirmation by genomic PCR and qRT-PCR, three independent positive PpMYB6-overexpression (OE) lines were successfully established. Wild-type (WT) and PpMYB6-OE Arabidopsis thaliana plants were subjected to freezing stress at -4 ℃, and their survival rates were evaluated. Following freezing treatment, the survival rate of WT plants dropped to 56.1%, whereas the survival rates of the three OE lines remained at 81.9%, 77.6%, and 79.3%, respectively, which were significantly higher than that of WT.
Under normal growth conditions (23 °C), WT plants exhibited a significantly greater plant height of 23.5 cm compared to the three OE lines (16.4 cm, 15.7 cm, and 15.1 cm, respectively). These results demonstrate that overexpression of PpMYB6 enhances freezing tolerance in Arabidopsis thaliana under cold stress, while repressing vegetative growth under non-stress conditions, which is highly consistent with the phenotypes observed in peach callus.
3.9. PpMYB6 Directly Binds to and Transcriptionally Activates the PpCBF2 Promoter
As shown in Figure 12, the PpCBF2 promoter region was significantly enriched with numerous cis-acting elements harboring MYB and MYB/SANT binding motifs. These findings suggest that the promoter of PpCBF2 may directly bind to MYB transcription factors. To verify whether PpMYB6 directly interacts w (PpERF48, PpERF017, PpMYB6, PpWRKY46, PpWRKY40, and PpbHLH3 ith the promoter of PpCBF2, a yeast one-hybrid (Y1H) assay was conducted. Yeast Y187 cells co-transformed with the recombinant reporter construct pHIS2-PpCBF2pro and the effector construct pGADT7-PpMYB6 grew normally on triple selective medium (SD/−Trp/−Leu/−His) supplemented with 55mM 3-AT. In contrast, negative control yeast co-transformed with empty pGADT7 vector and pHIS2-PpCBF2pro failed to grow under the same selective conditions.
Live bioluminescence imaging showed that leaf areas co-infiltrated with both 35Spro::PpMYB6 and PpCBF2pro::LUC exhibited significantly higher fluorescence intensity than control combinations (35Spro + LUC, 35Spro + PpCBF2pro::LUC, and 35Spro::PpMYB6 + LUC). Quantitative measurements of relative Firefly to Renilla luciferase activity (LUC/REN ratio) further confirmed that co-expression of 35Spro::PpMYB6 and PpCBF2pro::LUC yielded the highest relative LUC/REN value among all treatments. Altogether, These findings suggest that MYB transcription factors may directly bind to the PpCBF2 promoter and acts as a positive transcriptional activator to upregulate PpCBF2 expression.
3.10. Yeast Two-Hybrid (Y2H) Screening for PpMYB6-Interacting Proteins
To identify protein partners interacting with PpMYB6, a peach cDNA library was screened using a yeast two-hybrid (Y2H) system. Putative positive yeast single colonies were isolated and spot-plated onto quadruple dropout medium (SD/−Ade/−His/−Leu/−Trp, QDO) to validate potential interactions. As shown in Figure 13(a,b), following colony PCR confirmation, 58 positive yeast plasmids were recovered and sequenced.
As shown in Table 1, BLAST alignment and functional annotation against the NCBI database identified 24 non-redundant candidate interacting proteins involved in stress responses and developmental regulation. Notably, the identified candidate interactors included DWARF8: A DELLA protein serving as a master transcriptional repressor in gibberellin (GA) signaling and a negative regulator of plant growth.
The identification of these candidate partners laid a solid foundation for further elucidating the molecular mechanisms by which PpMYB6 coordinates cold stress tolerance and growth balance in peach.
4. Discussion
Cold stress represents one of the major environmental factors restricting peach yield and northern cultivation boundaries, while also exerting profound effects on fruit quality. During plant adaptation to low temperatures, phytohormone-mediated transcriptional regulation constitutes a highly complex molecular mechanism of cold resistance. Among plant hormones, abscisic acid (ABA) serves as a core stress hormone whose pivotal role in regulating abiotic stress responses in peach has been widely established. Furthermore, the protective effect of exogenous ABA application against cold stress in peach was confirmed in our previous study. However, the early molecular mechanisms governing ABA-mediated cold responses in peach remain to be fully elucidated.
Our transcriptomic analysis revealed that a substantial number of genes co-responded to both cold stress and ABA treatments, identifying a total of 1,105 overlapping DEGs. This overlap reinforces the functional role of ABA as a key hormonal regulator mediating cold stress tolerance in peach. These findings corroborate our group’s previous physiological research demonstrating that exogenous ABA enhances cold resistance in peach, while remaining consistent with established literature defining ABA as a primary phytohormone in plant cold responses [14,15,16].
GO and KEGG enrichment analyses demonstrated that the biological functions and responsive pathways under cold stress and ABA treatment exhibited both functional crosstalk and temporal divergence. DEGs from both treatments were significantly enriched in phenylpropanoid biosynthesis, flavonoid biosynthesis, oxidoreductase activity, MAPK signaling cascades, and plant hormone signal transduction pathways. These enrichment patterns closely mirror transcriptome characteristics reported in cold-stressed apple and citrus [19,20,21,22]. In particular, the enrichment of phenylpropanoid and flavonoid biosynthetic pathways aligns with earlier findings on cold resistance in peach, indicating that these pathways represent conserved defense mechanisms against cold stress across fruit tree species.
Furthermore, this study uncovered distinct temporal patterns during early responses to cold and ABA signals in peach. At early stress stages, cold treatment and ABA application displayed contrasting response kinetics. Cold stress first activated signal transduction pathways, followed by the regulation of cellular metabolism and biological functions. Conversely, ABA-responsive DEGs exhibited an inverse trend, with enrichment first observed in metabolic pathways before subsequently activating signal transduction cascades [23,24].
From the DEG clusters that co-responded to ABA and cold stress in an upregulated manner, six transcription factors—ERF48, ERF017, PpMYB6, WRKY46, WRKY40, and BHLH35—were selected for further investigation. qRT-PCR validation yielded expression profiles consistent with the RNA-Seq data, confirming that all six genes positively respond to cold stress, likely through an ABA-dependent regulatory pathway. Members of the MYB family have been extensively documented as master regulators mediating hormone signaling and cold stress adaptation [33,34], while numerous MYB transcription factors also act as key switches in flavonoid biosynthesis.
Through bioinformatic analysis and transgenic overexpression in peach calli, we demonstrated that PpMYB6 significantly enhanced cold tolerance in peach calli while suppressing callus growth under room temperature. The overexpressing calli exhibited a phenotype characterized by enhanced stress resistance accompanied by growth inhibition. To rigorously validate its biological function at the whole-plant level, heterologous overexpression lines were established in Arabidopsis thaliana. Under freezing stress, PpMYB6-overexpressing Arabidopsis plants displayed strikingly lower mortality rates and reduced freezing injury compared to wild-type controls. Intriguingly, under non-stress growth conditions, these transgenic lines displayed a distinct dwarfism/growth retardation phenotype. These whole-plant phenotypic observations directly mirror the responses observed in peach calli, providing definitive in vivo genetic evidence that PpMYB6 enhances cold resilience at the expense of vegetative growth. This trade-off aligns with previous findings on MYB-mediated growth-defense balance in wheat, as well as established evidence that abscisic acid (ABA) orchestrates the trade-off between stress tolerance and plant growth [46], suggesting that PpMYB6 serves as a key potential regulator coordinating stress tolerance and growth balance in peach.
To elucidate the downstream molecular mechanisms by which PpMYB6 regulates cold stress tolerance, we analyzed the cis-acting regulatory elements within the promoter of PpCBF2, a candidate downstream cold-responsive gene, and identified multiple MYB transcription factor binding motifs. Based on this finding, we confirmed the direct binding of PpMYB6 to the PpCBF2 promoter using yeast one-hybrid (Y1H) and dual-luciferase reporter assays. As PpCBF2 is a core regulatory component of the canonical ICE-CBF-COR signaling cascade [25,26,27], its direct upregulation by PpMYB6 substantially enhances cold tolerance in peach. Altogether, these results demonstrate that the ABA-responsive transcription factor PpMYB6 acts as a key upstream transcriptional activator governing cold stress tolerance in peach (Prunus persica).
Through Y2H library screening, we identified multiple potential interacting proteins for PpMYB6, offering critical clues into its dual functions in conferring cold tolerance and suppressing growth. Among these candidates, NCED1 acts as a key rate-limiting enzyme in ABA biosynthesis, a role validated in various crops including tomato, wheat, and maize [47,48]. The interaction between PpMYB6 and NCED1 may promote endogenous ABA accumulation, thereby exerting positive feedback control that amplifies ABA signaling under cold stress.
Another candidate, DWARF8, belongs to the DELLA protein family and serves as a major transcriptional repressor in the gibberellin (GA) signaling pathway. Extensive research indicates that DELLA proteins regulate plant growth and development through binding to GID1[49,50]. The interaction between DWARF8 and PpMYB6 may represent the molecular basis underlying the negative growth regulation exerted by PpMYB6. By integrating ABA biosynthesis and GA signaling, PpMYB6 concurrently coordinates stress tolerance and plant growth during cold exposure.Additionally, the identified transcriptional coactivator SRC2 has been reported to regulate abiotic stress resistance in maize and interact with AtRbohF in Arabidopsis to facilitate downstream stress gene expression [51]. Its interaction with PpMYB6 may enhance the transcriptional activation efficiency of downstream target genes.
Altogether, the identification of these interacting proteins outlines a preliminary molecular framework through which PpMYB6 balances cold tolerance and growth in peach, laying a solid foundation for future pathway dissection.
5. Conclusions
Integrative transcriptomic analysis under abscisic acid (ABA) and low-temperature treatments, combined with quantitative real-time PCR (qRT-PCR) validation, identified PpMYB6 as a core transcription factor gene co-responsive to ABA and cold signaling. Bioinformatic characterization and phenotypic assays of PpMYB6-overexpressing (OE) transgenic peach callus and Arabidopsis thaliana revealed the vital function of PpMYB6 in coordinating the balance between plant growth and cold stress tolerance. Furthermore, yeast one-hybrid (Y1H) and dual-luciferase reporter assays confirmed that PpMYB6 directly binds to the promoter of the key downstream cold-tolerance gene PpCBF2 to activate its transcription. Yeast two-hybrid (Y2H) library screening identified candidate protein partners, providing valuable resources for mapping the PpMYB6 regulatory network. Among these candidates, PpDWARF8 represses plant growth by modulating the gibberellin (GA) signaling pathway, serving as a key interactor mediating the negative growth regulation by PpMYB6.
Supplementary Materials
The following supporting information can be downloaded at the website of this paper posted on Preprints.org.
Author Contributions
Conceptualization, C.Z. and X.Z.; methodology, Y.D., C.Z. and X.Z.; investigation, Y.D., D.Z., B.G., S.W., M.L. and R.G.; data curation, D.Z., B.G., S.W., M.L. and R.G.; writing—original draft preparation, Y.D.; writing—review and editing, Y.D., J.W., X.X., L.Z., C.Z. and X.Z.; supervision, J.W., X.X., L.Z., C.Z. and X.Z.; project administration, C.Z.; funding acquisition, C.Z. All authors have read and agreed to the published version of the manuscript.
Funding
This research was funded by the National Natural Science Foundation of China (Grant No. 32302501), the Central Guidance on Local Science and Technology Development Fund of China (Grant No. 236Z6304G), and the Natural Science Foundation of Hebei Province (Grant No. C2024407078).
Data Availability Statement
The raw sequence data reported in this paper have been deposited in the Genome Sequence Archive (GSA) in National Genomics Data Center, China National Center for Bioinformation / Beijing Institute of Genomics, Chinese Academy of Sciences, under accession number CRA047049 that are publicly accessible at https://ngdc.cncb.ac.cn/gsa. Other data supporting the findings of this study are available from the corresponding author upon reasonable request.
Conflicts of Interest
The authors declare no conflicts of interest.
References
- Li, Y.; Wang, L. Genetic Resources, Breeding Programs in China, and Gene Mining of Peach: A Review. Hortic. Plant J. 2020, 6, 205–215. [Google Scholar] [CrossRef]
- Franzoni, G.; Spadafora, N.D.; Sirangelo, T.M.; Ferrante, A.; Rogers, H.J. Biochemical and molecular changes in peach fruit exposed to cold stress conditions. Mol. Hortic. 2023, 3, 24. [Google Scholar] [CrossRef] [PubMed]
- Kim, J.-S.; Kidokoro, S.; Yamaguchi-Shinozaki, K.; Shinozaki, K. Regulatory networks in plant responses to drought and cold stress. Plant Physiol. 2024, 195, 170–189. [Google Scholar] [CrossRef] [PubMed]
- Kidokoro, S.; Shinozaki, K.; Yamaguchi-Shinozaki, K. Transcriptional regulatory network of plant cold-stress responses. Trends Plant Sci. 2022, 27, 922–935. [Google Scholar] [CrossRef] [PubMed]
- Kang, H.; Thomas, H.R.; Xia, X.; Shi, H.; Zhang, L.; Hong, J.; Shi, K.; Zhou, J.; Yu, J.; Zhou, Y. An integrative overview of cold response and regulatory pathways in horticultural crops. J. Integr. Plant Biol. 2025, 67, 1028–1059. [Google Scholar] [CrossRef] [PubMed]
- Hou, Y.; Wong, D. C. J.; Wang, L. A Hierarchical VvbHLH30-VvERF70-VvACS2 Module Orchestrates Ethylene Biosynthesis and Cold Adaptation in Grapevine. Plant Biotechnol. J. 2026, 24(no. 6), 4317–4341. [Google Scholar] [CrossRef] [PubMed]
- Wang, X.; Li, Z.; Shi, Y.; Liu, Z.; Zhang, X.; Gong, Z.; Yang, S. Strigolactones promote plant freezing tolerance by releasing the WRKY41-mediated inhibition of CBF/DREB1 expression. EMBO J. 2023, 42, e112999. [Google Scholar] [CrossRef] [PubMed]
- Ye, J.; Yu, C.; Hu, Y. Decoding the cold signal: hormonal networks orchestrating the trade-off between growth and tolerance. Trop. Plants 2026, 5, e008. [Google Scholar] [CrossRef]
- Li, W.; Wen, Y.; Quan, J.; Gao, M.; Shang, C.; Liu, X.; Liu, G.; Hu, X.; Li, J. Regulation of jasmonic acid signalling in tomato cold stress response: Insights into the MYB15-LOXD and MYB15-MYC2-LOXD regulatory modules. Plant Biotechnol. J. 2025, 23, 4246–4260. [Google Scholar] [CrossRef] [PubMed]
- Zhang, R.; Luo, S.; Li, L.; Mu, T.; Wang, P.; Zhang, G. The role of PYL genes as core components of abscisic acid signaling in plant abiotic stress response. Hortic. Plant J. 2025. [Google Scholar] [CrossRef]
- Liu, T.; Wang, J.; Chen, L.; Liu, S.; Liu, T.; Yu, L.; Guo, J.; Chen, Y.; Zhang, Y.; Song, B. ScAREB4 promotes potato constitutive and acclimated freezing tolerance associated with enhancing trehalose synthesis and oxidative stress tolerance. Plant Cell Environ. 2023, 46, 3839–3857. [Google Scholar] [CrossRef] [PubMed]
- Lu, J.; Li, N.; Li, G.; Tian, Z.; Shi, L.; Wang, Y.; Cai, Y.; Zhang, K.; Sun, W.; Wang, D.; et al. N-glycosylation of SnRK2s affects NADPH maintenance in peroxisomes during prolonged ABA signalling. Nat. Commun. 2024, 15, 6630. [Google Scholar] [CrossRef] [PubMed]
- Zhang, Y.; Han, L.; Liu, J.; Chang, M.; Li, C.; Shang, J.-X.; Deng, Z.; Tang, W.; Sun, Y. Two E-clade protein phosphatase 2Cs enhance ABA signaling by dephosphorylating ABI1 in Arabidopsis. Mol. Plant 2025, 18, 783–796. [Google Scholar] [CrossRef] [PubMed]
- Waadt, R.; Seller, C.A.; Hsu, P.-K.; Takahashi, Y.; Munemasa, S.; Schroeder, J.I. Plant hormone regulation of abiotic stress responses. Nat. Rev. Mol. Cell Biol. 2022, 23, 680–694. [Google Scholar] [CrossRef] [PubMed]
- Qiu, D.; Hu, W.; Zhou, Y.; Xiao, J.; Hu, R.; Wei, Q.; Zhang, Y.; Feng, J.; Sun, F.; Sun, J.; et al. TaASR1-D confers abiotic stress resistance by affecting ROS accumulation and ABA signalling in transgenic wheat. Plant Biotechnol. J. 2021, 19, 1588–1601. [Google Scholar] [CrossRef] [PubMed]
- Liang, G.; Zhao, C.Y.; Su, K.; Liu, C. S.; Xiao, K.; Li, G.; Wu, J. K.; Xiao, X.; Zhang, L. B.; Zhang, C. G. Effect of exogenous ABA on cold resistance of ‘21st Century’ and ‘Jiushuo’ peach shoots under low temperature stress. J. Fruit. Sci. 2023, 40, 2136–2148. [Google Scholar]
- Xu, Z.; Wang, J.; Ma, Y.; Wang, F.; Wang, J.; Zhang, Y.; Hu, X. The bZIP transcription factor SlAREB1 regulates anthocyanin biosynthesis in response to low temperature in tomato. Plant J. 2023, 115, 205–219. [Google Scholar] [CrossRef] [PubMed]
- Deng, M.; Zhao, Q.; Pang, H.; Yu, F.; Miao, B.; Yan, J.; Wang, J.; Fu, J.; Song, X.; Ma, F.; et al. ABSCISIC ACID INSENSITIVE 5 confers cold tolerance by regulating MdCBF3 and MdJAZ1/3 in apple. Plant Physiol. 2026, 200, kiaf612. [Google Scholar] [CrossRef] [PubMed]
- Li, L.; Han, C.; Yang, J.; Tian, Z.; Jiang, R.; Yang, F.; Jiao, K.; Qi, M.; Liu, L.; Zhang, B.; et al. Comprehensive Transcriptome Analysis of Responses during Cold Stress in Wheat (Triticum aestivum L.). Genes 2023, 14. [Google Scholar] [CrossRef] [PubMed]
- Tian, Y.; Peng, K.; Lou, G.; Ren, Z.; Sun, X.; Wang, Z.; Xing, J.; Song, C.; Cang, J. Transcriptome analysis of the winter wheat Dn1 in response to cold stress. BMC Plant Biol. 2022, 22, 277. [Google Scholar] [CrossRef] [PubMed]
- Zhong, Y.; Luo, Y.; Sun, J.; Qin, X.; Gan, P.; Zhou, Z.; Qian, Y.; Zhao, R.; Zhao, Z.; Cai, W.; et al. Pan-transcriptomic analysis reveals alternative splicing control of cold tolerance in rice. Plant Cell 2024, 36, 2117–2139. [Google Scholar] [CrossRef] [PubMed]
- Li, X.; Yue, H.; Chu, Y.; Jia, Y. Comparative transcriptomes reveal molecular mechanisms of apple blossoms of different tolerance genotypes to chilling injury. Open Life Sci. 2023, 18, 20220613. [Google Scholar] [CrossRef] [PubMed]
- Li, Y.; Tian, Q.; Wang, Z.; Li, J.; Liu, S.; Chang, R.; Chen, H.; Liu, G. Integrated analysis of transcriptomics and metabolomics of peach under cold stress. Front. Plant Sci. 2023, 14, 1153902. [Google Scholar] [CrossRef] [PubMed]
- Muto, A.; Bruno, L.; Madeo, M.L.; Ludlow, R.; Ferrari, M.; Stimpson, L.; LoGiudice, C.; Picardi, E.; Ferrante, A.; Pasti, L.; et al. Comparative transcriptomic profiling of peach and nectarine cultivars reveals cultivar-specific responses to chilled postharvest storage. Front. Plant Sci. 2022, 13, 1062194. [Google Scholar] [CrossRef] [PubMed]
- Wang, S.; Yin, C.; Yuan, Y.; He, M.; Babalola, O.O.; Qiu, D.; Deng, W. Molecular mechanisms involved in the cold tolerance response and regulation of fruits and vegetables. Hortic. Adv. 2026, 4, 4. [Google Scholar] [CrossRef]
- Hwarari, D.; Guan, Y.; Ahmad, B.; Movahedi, A.; Min, T.; Hao, Z.; Lu, Y.; Chen, J.; Yang, L. ICE-CBF-COR Signaling Cascade and Its Regulation in Plants Responding to Cold Stress. Int. J. Mol. Sci. 2022, 23. [Google Scholar] [CrossRef] [PubMed]
- Yu, M.M.; Wang, R.; Xia, J.Q.; Li, C.; Xu, Q.H.; Cang, J.; Wang, Y.Y.; Zhang, D. JA-induced TaMPK6 enhanced the freeze tolerance of Arabidopsis thaliana through regulation of ICE-CBF-COR module and antioxidant enzyme system. Plant Sci. An. Int. J. Exp. Plant Biol. 2023, 329, 111621. [Google Scholar] [CrossRef] [PubMed]
- Zhang, M.; Zhao, R.; Huang, K.; Huang, S.; Wang, H.; Wei, Z.; Li, Z.; Bian, M.; Jiang, W.; Wu, T.; et al. The OsWRKY63-OsWRKY76-OsDREB1B module regulates chilling tolerance in rice. Plant J. Cell Mol. Biol. 2022, 112, 383–398. [Google Scholar] [CrossRef] [PubMed]
- Xu, L.; Yang, L.; Li, A.; Guo, J.; Wang, H.; Qi, H.; Li, M.; Yang, P.; Song, S. An AP2/ERF transcription factor confers chilling tolerance in rice. Sci. Adv. 2024, 10, eado4788. [Google Scholar] [CrossRef] [PubMed]
- Hu, C.; Wang, M.; Zhu, C.; Wu, S.; Li, J.; Yu, J.; Hu, Z. A transcriptional regulation of ERF15 contributes to ABA-mediated cold tolerance in tomato. Plant Cell Env. 2024, 47, 1334–1347. [Google Scholar] [CrossRef] [PubMed]
- Chen, N.; Pan, L.; Yang, Z.; Su, M.; Xu, J.; Jiang, X.; Yin, X.; Wang, T.; Wan, F.; Chi, X. A MYB-related transcription factor from peanut, AhMYB30, improves freezing and salt stress tolerance in transgenic Arabidopsis through both DREB/CBF and ABA-signaling pathways. Front. Plant Sci. 2023, 14, 1136626. [Google Scholar] [CrossRef] [PubMed]
- Kurowska, M.; Daszkowska-Golec, A. Molecular mechanisms of SNAC1 (Stress-responsive NAC1) in conferring the abiotic stress tolerance. Plant Sci. An. Int. J. Exp. Plant Biol. 2023, 337, 111894. [Google Scholar] [CrossRef] [PubMed]
- Htun, A.A.; Wang, Y.; Liu, J.; Guo, Z.; Zheng, Y.; Wang, W.; Ma, S.; Jia, A.; Ren, Y.; Chen, F. MYB Factors: Hubs of Plant Stress and Hormone Crosstalk. Plant Biotechnol. J. 2026, n/a. [Google Scholar] [CrossRef] [PubMed]
- Yong, Y.; Bi, H.; Li, M.; Zhu, Y.; Zhou, Q.; Xing, W.; Zheng, S.; Zhang, L.; Lyu, Y.; Song, R. LlR3MYB-mediated flavonoid biosynthesis confers cold stress tolerance in Lilium lancifolium through the LlDREB-LlCHS2 regulatory cascade. Hortic. Res. 2026, 13, 065. [Google Scholar] [CrossRef] [PubMed]
- Wang, Z.; Gerstein, M.; Snyder, M. RNA-Seq: a revolutionary tool for transcriptomics. Nat. Rev. Genet. 2009, 10, 57–63. [Google Scholar] [CrossRef] [PubMed]
- Parkhomchuk, D.; Borodina, T.; Amstislavskiy, V.; Banaru, M.; Hallen, L.; Krobitsch, S.; Lehrach, H.; Soldatov, A. Transcriptome analysis by strand-specific sequencing of complementary DNA. Nucleic Acids Res. 2009, 37, e123–e123. [Google Scholar] [CrossRef] [PubMed]
- Pertea, M.; Pertea, G.M.; Antonescu, C.M.; Chang, T.-C.; Mendell, J.T.; Salzberg, S.L. StringTie enables improved reconstruction of a transcriptome from RNA-seq reads. Nat. Biotechnol. 2015, 33, 290–295. [Google Scholar] [CrossRef] [PubMed]
- Liao, Y.; Smyth, G.K.; Shi, W. featureCounts: an efficient general purpose program for assigning sequence reads to genomic features. Bioinformatics 2014, 30, 923–930. [Google Scholar] [CrossRef] [PubMed]
- Garber, M.; Grabherr, M.G.; Guttman, M.; Trapnell, C. Computational methods for transcriptome annotation and quantification using RNA-seq. Nat. Methods 2011, 8, 469–477. [Google Scholar] [CrossRef] [PubMed]
- Wu, T.; Hu, E.; Xu, S.; Chen, M.; Guo, P.; Dai, Z.; Feng, T.; Zhou, L.; Tang, W.; Zhan, L.; et al. clusterProfiler 4.0: A universal enrichment tool for interpreting omics data. The Innovation 2021, 2. [Google Scholar] [CrossRef] [PubMed]
- Tong, Z.; Gao, Z.; Wang, F.; Zhou, J.; Zhang, Z. Selection of reliable reference genes for gene expression studies in peach using real-time PCR. BMC Mol. Biol. 2009, 10, 71. [Google Scholar] [CrossRef] [PubMed]
- Livak, K.J.; Schmittgen, T.D. Analysis of relative gene expression data using real-time quantitative PCR and the 2(-Delta Delta C(T)) Method; Methods: San Diego, Calif., 2001; Volume 25, pp. 402–408. [Google Scholar]
- Wang, P.; Li, R.; Liu, X.; Zhao, X.; Hyden, B.; Han, Y.; Zhang, X.; Wang, J.; Chen, H.; Cao, H. Establishment of genetic transformation system of peach callus. Sci. Hortic. 2024, 323, 112501. [Google Scholar] [CrossRef]
- Toro, C.; Barrera, M.; Olmedo, B.; Vergara, R.; Muñoz, M.; Olivares, F.; Prieto, H. Agrobacterium-Mediated Transformation of Prunus persica (Peach) Immature Cotyledons. In Agrobacterium: Methods and Protocols; Stange Klein, C., Ed.; Springer US: New York, NY, 2025; pp. 189–198. [Google Scholar]
- Fields, S.; Song, O.-k. A novel genetic system to detect protein–protein interactions. Nature 1989, 340, 245–246. [Google Scholar] [CrossRef] [PubMed]
- Zhou, W.; Fan, Y.; Li, W.; Phan Tran, L.-S.; Shu, K. From activation to desensitization: How ABA balances plant growth and abiotic stress response? Plant Commun. 2026, 101977. [Google Scholar] [CrossRef] [PubMed]
- Iuchi, S.; Kobayashi, M.; Taji, T.; Naramoto, M.; Seki, M.; Kato, T.; Tabata, S.; Kakubari, Y.; Yamaguchi-Shinozaki, K.; Shinozaki, K. Regulation of drought tolerance by gene manipulation of 9-cis-epoxycarotenoid dioxygenase, a key enzyme in abscisic acid biosynthesis in Arabidopsis. Plant J. Cell Mol. Biol. 2001, 27, 325–333. [Google Scholar] [CrossRef] [PubMed]
- Holsteens, K.; De Jaegere, I.; Wynants, A.; Prinsen, E.L.J.; Van de Poel, B. Mild and severe salt stress responses are age-dependently regulated by abscisic acid in tomato. Front. Plant Sci. 2022, 13, 982622. [Google Scholar] [CrossRef] [PubMed]
- Davière, J.-M.; Achard, P. A Pivotal Role of DELLAs in Regulating Multiple Hormone Signals. Mol. Plant 2016, 9, 10–20. [Google Scholar] [CrossRef] [PubMed]
- Peng, J.; Richards, D.E.; Hartley, N.M.; Murphy, G.P.; Devos, K.M.; Flintham, J.E.; Beales, J.; Fish, L.J.; Worland, A.J.; Pelica, F.; et al. ‘Green revolution’ genes encode mutant gibberellin response modulators. Nature 1999, 400, 256–261. [Google Scholar] [CrossRef] [PubMed]
- Mittler, R.; Zandalinas, S.I.; Fichman, Y.; Van Breusegem, F. Reactive oxygen species signalling in plant stress responses. Nat. Rev. Mol. Cell Biol. 2022, 23, 663–679. [Google Scholar] [CrossRef] [PubMed]
Figure 1.
Sample correlation and principal component analysis (PCA) of transcriptomic data. (a) Correlation heatmap of gene expression levels among samples under cold stress and ABA treatment. The coefficient of determination (R2) is indicated by the blue color intensity, where darker blue denotes higher expression similarity between samples. (b) Two-dimensional PCA score plot of cold-stressed and ABA-treated samples. Different colors represent distinct treatment groups, and axes PC1 and PC2 indicate the proportion of total variance explained.
Figure 1.
Sample correlation and principal component analysis (PCA) of transcriptomic data. (a) Correlation heatmap of gene expression levels among samples under cold stress and ABA treatment. The coefficient of determination (R2) is indicated by the blue color intensity, where darker blue denotes higher expression similarity between samples. (b) Two-dimensional PCA score plot of cold-stressed and ABA-treated samples. Different colors represent distinct treatment groups, and axes PC1 and PC2 indicate the proportion of total variance explained.
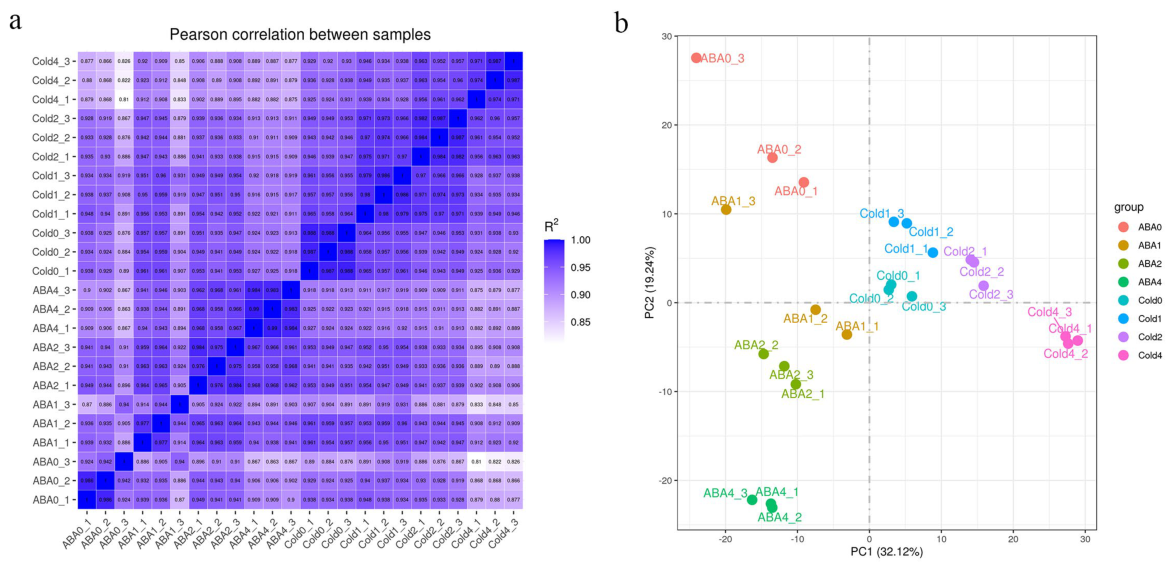
Figure 2.
Statistics of differentially expressed genes under ABA treatment and cold stress. (a) Summary of the total, upregulated, and downregulated DEG counts in each comparison group. (b) Venn diagram illustrating the intersection between ABA-responsive DEGs and cold-responsive DEGs. (c) Venn diagram showing the overlap of DEGs at 1 h, 2 h, and 4 h of ABA treatment. (d) Venn diagram showing the overlap of DEGs at 1 h, 2 h, and 4 h of cold stress.
Figure 2.
Statistics of differentially expressed genes under ABA treatment and cold stress. (a) Summary of the total, upregulated, and downregulated DEG counts in each comparison group. (b) Venn diagram illustrating the intersection between ABA-responsive DEGs and cold-responsive DEGs. (c) Venn diagram showing the overlap of DEGs at 1 h, 2 h, and 4 h of ABA treatment. (d) Venn diagram showing the overlap of DEGs at 1 h, 2 h, and 4 h of cold stress.
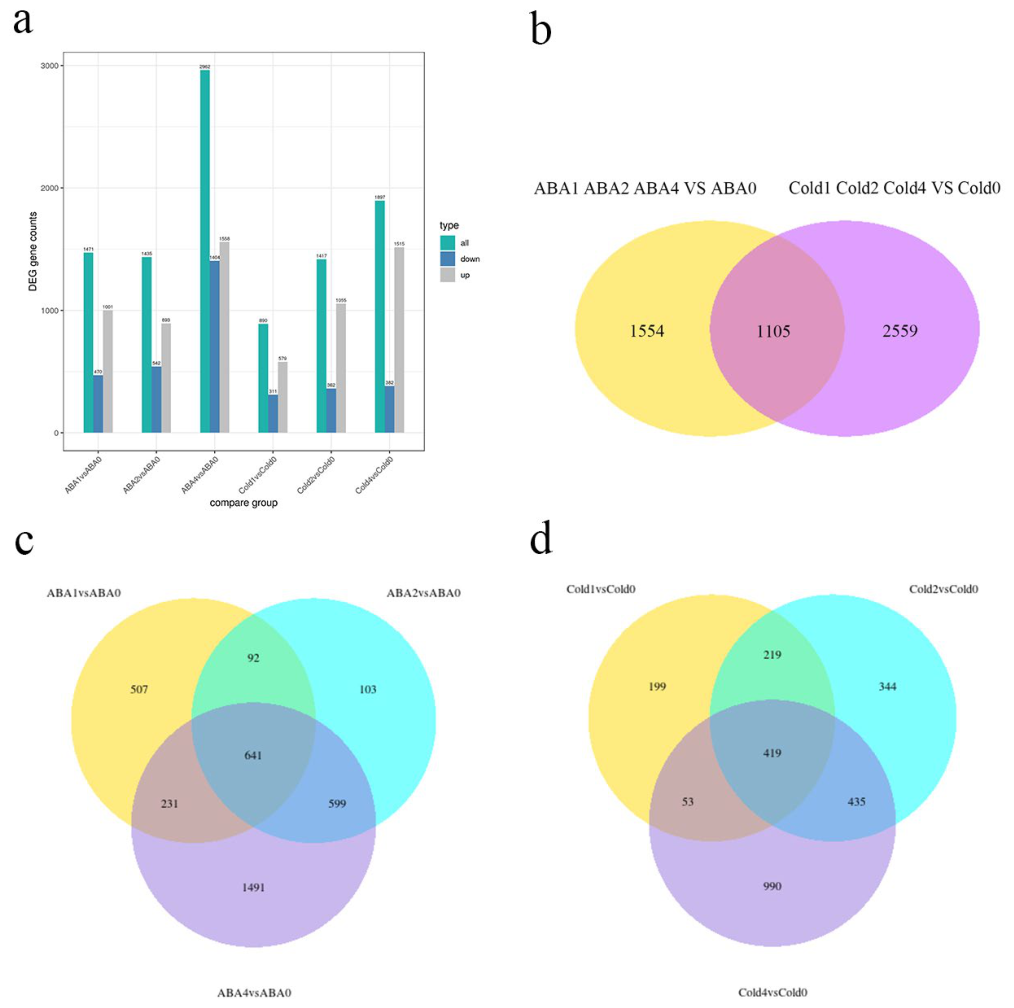
Figure 3.
Figure 3. Hierarchical clustering analysis of differentially expressed genes (DEGs). Letters a–d denote four distinct expression trend clusters partitioned based on normalized gene expression levels across all treated samples at each time point. Blue lines represent the mean expression trend of genes within each cluster, while gray lines depict the expression patterns of individual genes. The vertical axis represents centralized log2(FPKM+1) normalized expression values.
Figure 3.
Figure 3. Hierarchical clustering analysis of differentially expressed genes (DEGs). Letters a–d denote four distinct expression trend clusters partitioned based on normalized gene expression levels across all treated samples at each time point. Blue lines represent the mean expression trend of genes within each cluster, while gray lines depict the expression patterns of individual genes. The vertical axis represents centralized log2(FPKM+1) normalized expression values.
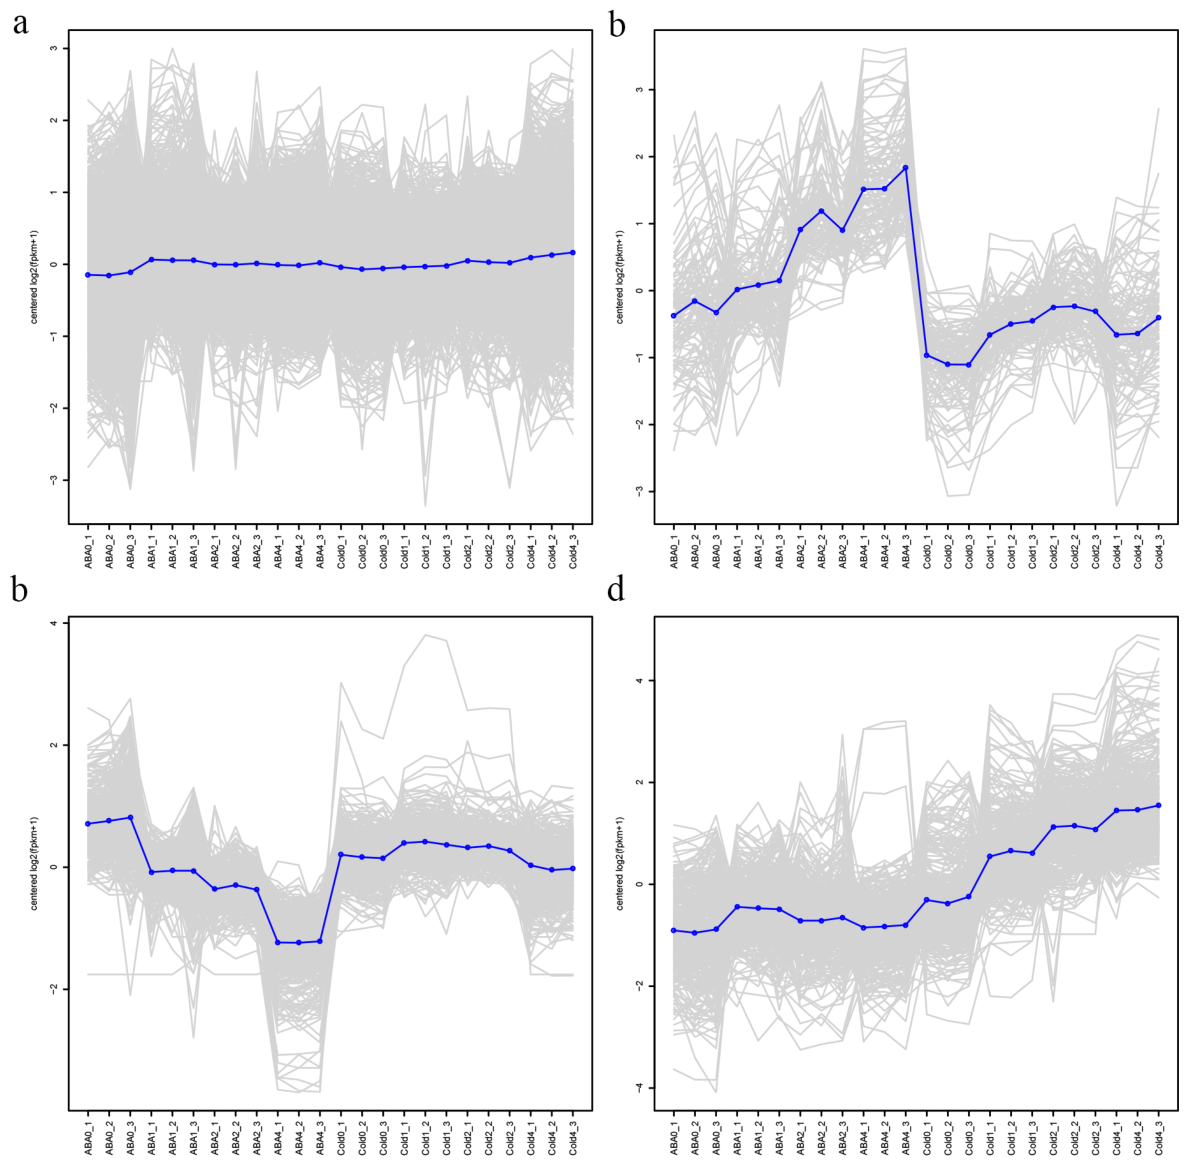
Figure 4.
Figure 4. Gene Ontology (GO) functional enrichment analysis of differentially expressed genes. (a–c) GO enrichment results of DEGs at 1 h, 2 h, and 4 h of ABA treatment, respectively. (d–f) GO enrichment results of DEGs at 1 h, 2 h, and 4 h of cold stress, respectively. Bubble size represents the number of enriched genes, and the color gradient corresponds to the adjusted P-value (padj).
Figure 4.
Figure 4. Gene Ontology (GO) functional enrichment analysis of differentially expressed genes. (a–c) GO enrichment results of DEGs at 1 h, 2 h, and 4 h of ABA treatment, respectively. (d–f) GO enrichment results of DEGs at 1 h, 2 h, and 4 h of cold stress, respectively. Bubble size represents the number of enriched genes, and the color gradient corresponds to the adjusted P-value (padj).
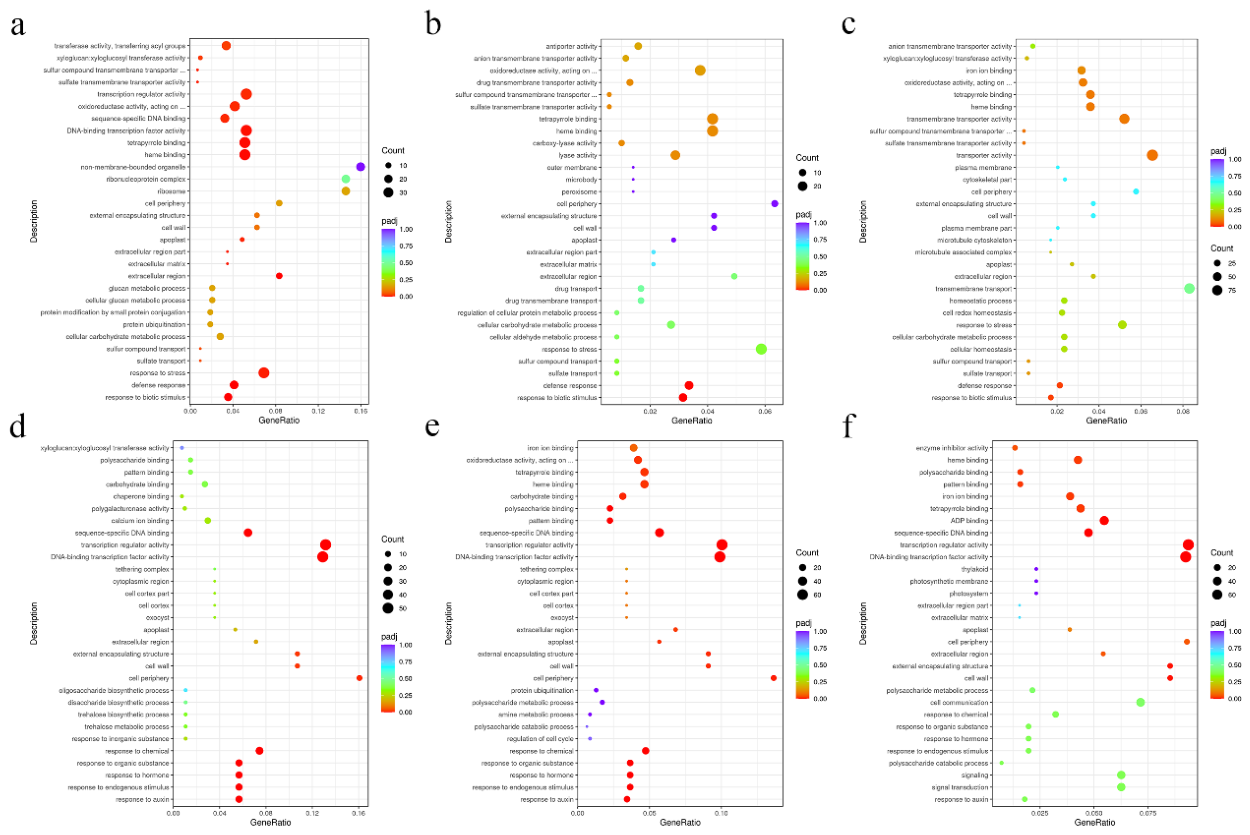
Figure 5.
Figure 5. KEGG pathway enrichment analysis of differentially expressed genes. (a–c) KEGG pathway enrichment results of DEGs at 1 h, 2 h, and 4 h of ABA treatment, respectively. (d–f) KEGG pathway enrichment results of DEGs at 1 h, 2 h, and 4 h of cold stress, respectively. Bubble size represents the number of enriched genes, and the color gradient corresponds to the adjusted P-value (padj).
Figure 5.
Figure 5. KEGG pathway enrichment analysis of differentially expressed genes. (a–c) KEGG pathway enrichment results of DEGs at 1 h, 2 h, and 4 h of ABA treatment, respectively. (d–f) KEGG pathway enrichment results of DEGs at 1 h, 2 h, and 4 h of cold stress, respectively. Bubble size represents the number of enriched genes, and the color gradient corresponds to the adjusted P-value (padj).
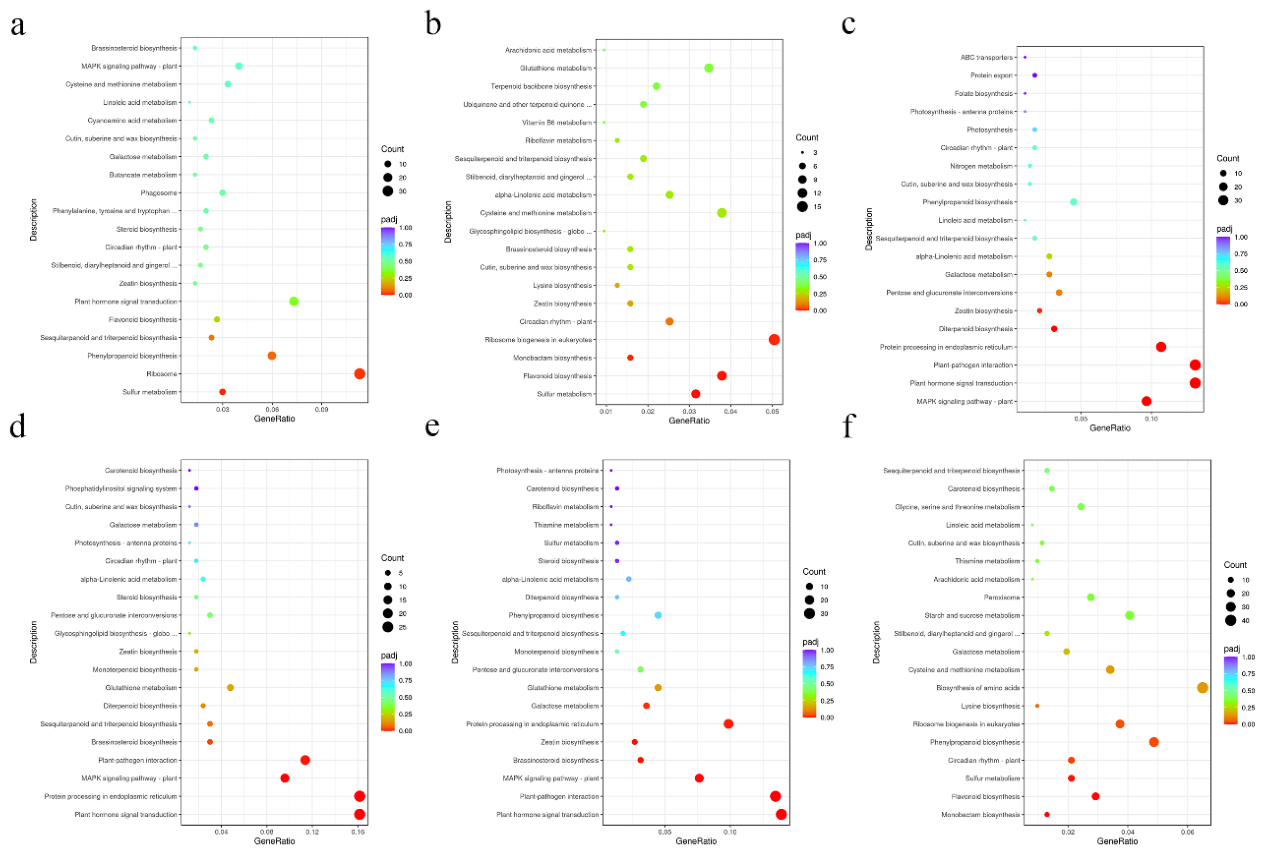
Figure 6.
qRT-PCR validation of RNA-Seq datasets. Expression patterns of six co-responsive genes (WRKY46, ERF017, MYB6, bHLH35, ERF48, and WRKY40) under cold stress across different time points. Bar charts depict relative expression levels measured by qRT-PCR (right vertical axis), and line graphs represent FPKM expression values from RNA-Seq (left vertical axis). Data represent the mean ± SD of three biological replicates.
Figure 6.
qRT-PCR validation of RNA-Seq datasets. Expression patterns of six co-responsive genes (WRKY46, ERF017, MYB6, bHLH35, ERF48, and WRKY40) under cold stress across different time points. Bar charts depict relative expression levels measured by qRT-PCR (right vertical axis), and line graphs represent FPKM expression values from RNA-Seq (left vertical axis). Data represent the mean ± SD of three biological replicates.
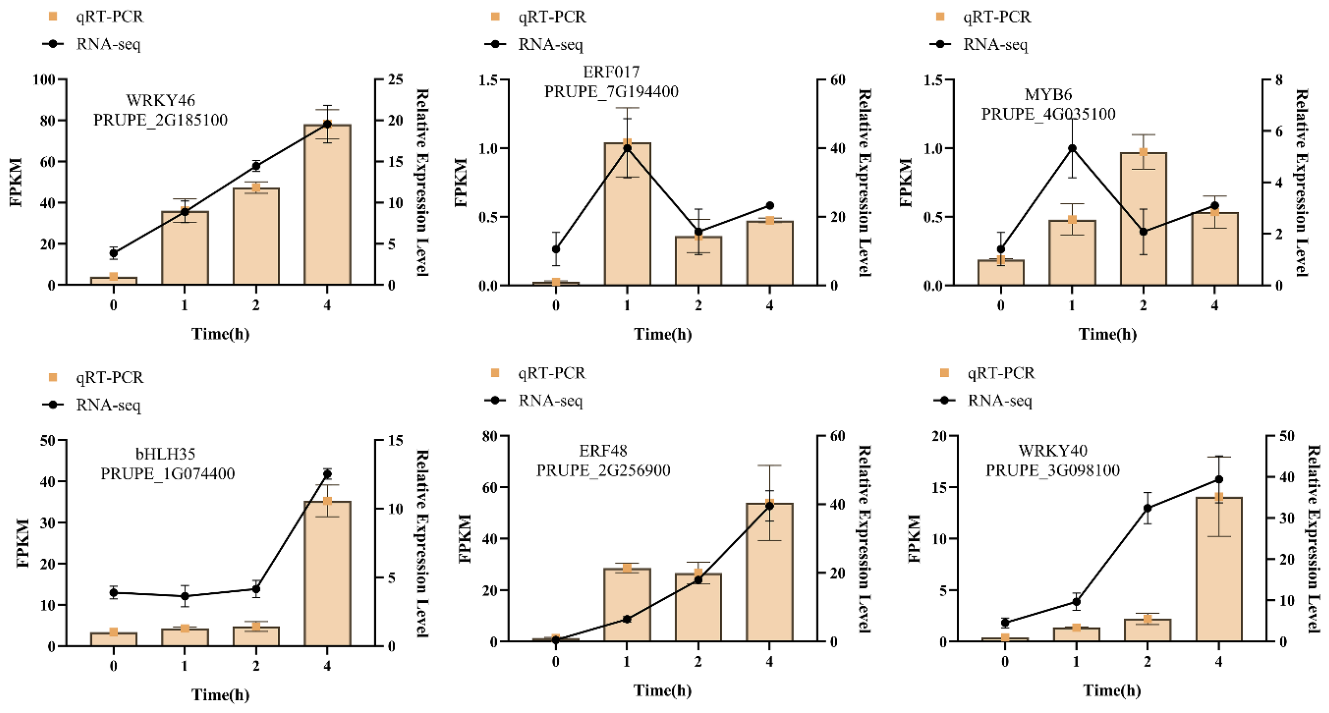
Figure 7.
Bioinformatic characterization of the PpMYB6 gene. (a) Chromosomal location, gene structure, and conserved domain analysis of PpMYB6, displaying full-length genomic sequence, coding sequence (CDS), and conserved SANT and Myb domains. (b) Predicted three-dimensional protein structure of PpMYB6. (c) Multiple sequence alignment of peach PpMYB6 with homologous MYB proteins from other plant species. Shaded backgrounds of different colors highlight conserved amino acid residues.
Figure 7.
Bioinformatic characterization of the PpMYB6 gene. (a) Chromosomal location, gene structure, and conserved domain analysis of PpMYB6, displaying full-length genomic sequence, coding sequence (CDS), and conserved SANT and Myb domains. (b) Predicted three-dimensional protein structure of PpMYB6. (c) Multiple sequence alignment of peach PpMYB6 with homologous MYB proteins from other plant species. Shaded backgrounds of different colors highlight conserved amino acid residues.
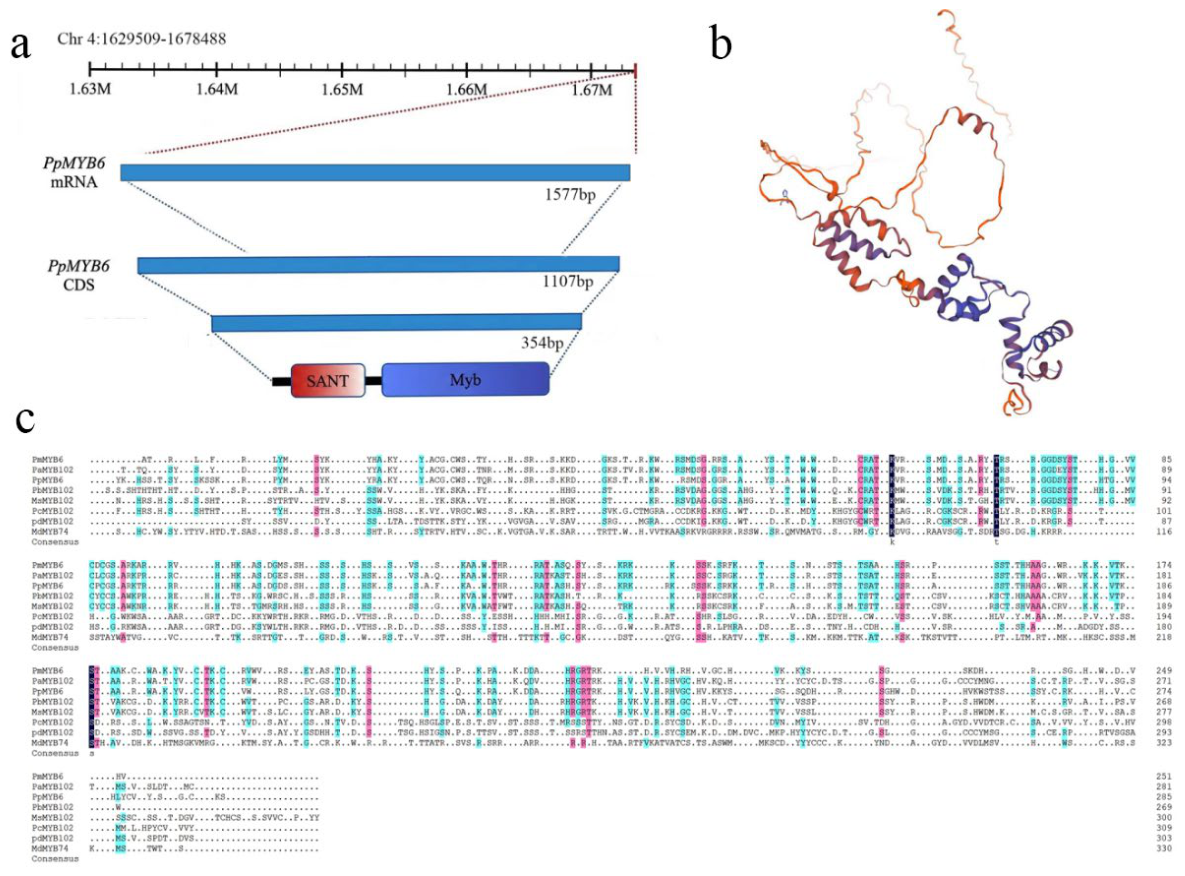
Figure 8.
Phylogenetic analysis of PpMYB6 homologous proteins. A neighbor-joining phylogenetic tree constructed based on full-length amino acid sequences of MYB proteins from various plants. The red box indicates PpMYB6, and bootstrap support values are displayed at the tree nodes.
Figure 8.
Phylogenetic analysis of PpMYB6 homologous proteins. A neighbor-joining phylogenetic tree constructed based on full-length amino acid sequences of MYB proteins from various plants. The red box indicates PpMYB6, and bootstrap support values are displayed at the tree nodes.
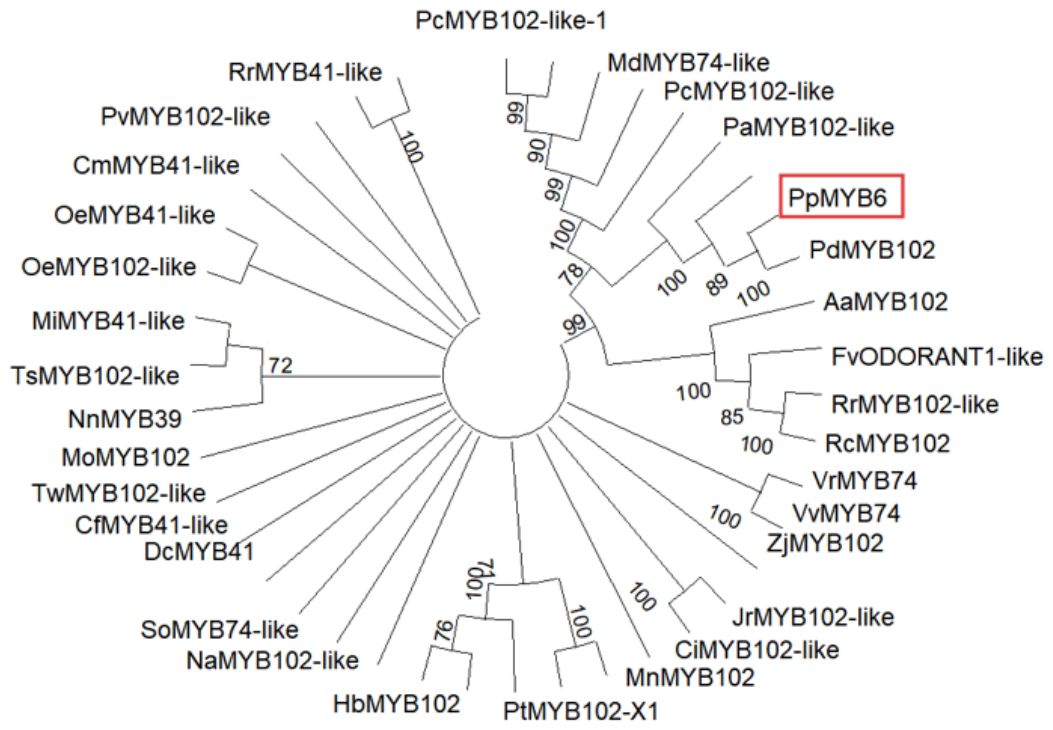
Figure 9.
Linear distribution map of ABA- and cold-responsive cis-acting elements in the PpMYB6 promoter.The horizontal axis represents the nucleotide length of the PpMYB6 promoter (unit: base pair, bp). Elements on the positive DNA strand are labeled above the axis, and those on the negative strand are labeled below. Red circles represent ABA- and ABA/stress-related cis-elements, including the core ABA-responsive element (ABRE) with the AACGT/ACGTT motif. Blue diamonds represent cold- and cold/drought-related cis-elements, dominated by the dehydration-responsive element/C-repeat (DRE/CRT) with the CCGAC.
Figure 9.
Linear distribution map of ABA- and cold-responsive cis-acting elements in the PpMYB6 promoter.The horizontal axis represents the nucleotide length of the PpMYB6 promoter (unit: base pair, bp). Elements on the positive DNA strand are labeled above the axis, and those on the negative strand are labeled below. Red circles represent ABA- and ABA/stress-related cis-elements, including the core ABA-responsive element (ABRE) with the AACGT/ACGTT motif. Blue diamonds represent cold- and cold/drought-related cis-elements, dominated by the dehydration-responsive element/C-repeat (DRE/CRT) with the CCGAC.
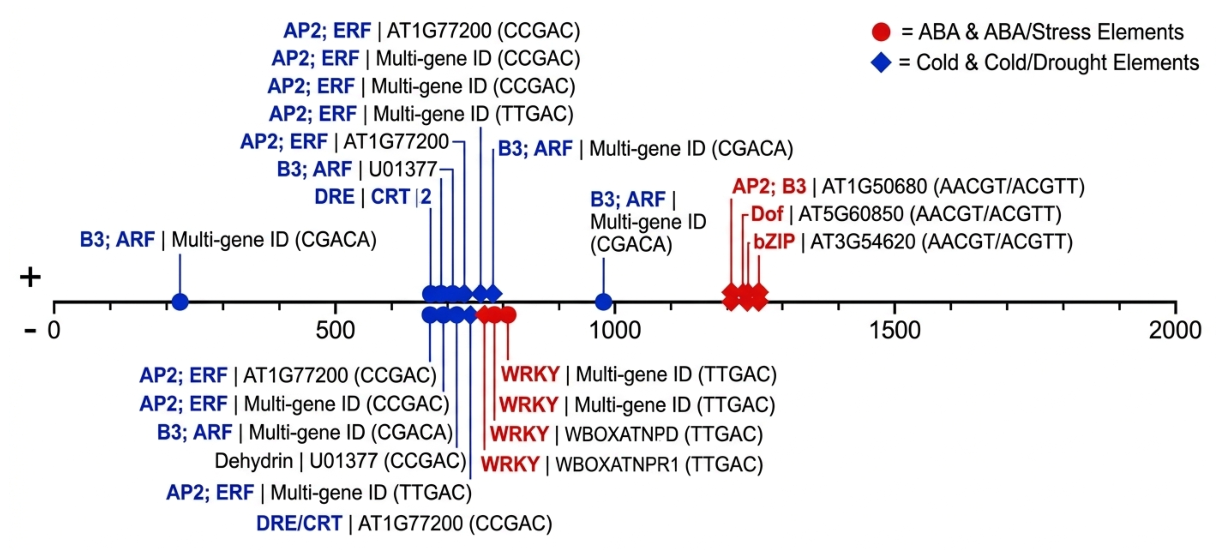
Figure 10.
Overexpression of PpMYB6 enhances cold tolerance in transgenic peach calli. (a) Growth phenotypes of WT and PpMYB6-OE peach calli under normal condition (28℃) and cold stress (-5℃ for 6 h). (b) Relative transcript levels of PpMYB6 in WT and three independent transgenic peach callus lines detected by qRT-PCR. (c) Fresh weight of WT and PpMYB6-OE calli after normal and cold treatments. (d) Genomic PCR verification of transgenic calli.
Figure 10.
Overexpression of PpMYB6 enhances cold tolerance in transgenic peach calli. (a) Growth phenotypes of WT and PpMYB6-OE peach calli under normal condition (28℃) and cold stress (-5℃ for 6 h). (b) Relative transcript levels of PpMYB6 in WT and three independent transgenic peach callus lines detected by qRT-PCR. (c) Fresh weight of WT and PpMYB6-OE calli after normal and cold treatments. (d) Genomic PCR verification of transgenic calli.
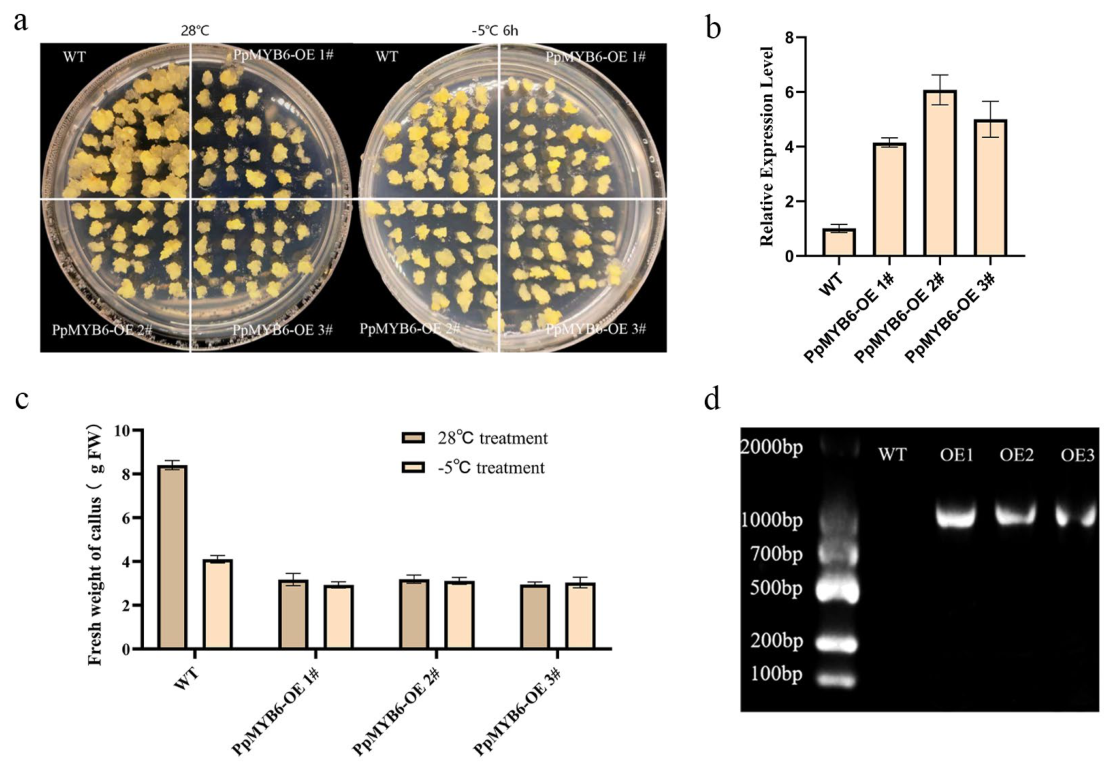
Figure 11.
Molecular identification and cold tolerance analysis of PpMYB6-overexpressing Arabidopsis thaliana lines. (a) Growth phenotypes of wild-type (WT) and PpMYB6-overexpressing Arabidopsis seedlings under cold stress and non-stress control conditions. (b) Genomic PCR verification of transgenic Arabidopsis thaliana lines. (c) Relative transcript levels of PpMYB6 in WT and transgenic lines detected by qRT-PCR. (d) Growth phenotypes of adult WT and PpMYB6-overexpressing Arabidopsis plants under normal growth conditions. (e) Statistical analysis of plant height in WT and transgenic adult plants. (f) Statistical analysis of seedling survival rate in WT and transgenic lines after cold stress treatment.
Figure 11.
Molecular identification and cold tolerance analysis of PpMYB6-overexpressing Arabidopsis thaliana lines. (a) Growth phenotypes of wild-type (WT) and PpMYB6-overexpressing Arabidopsis seedlings under cold stress and non-stress control conditions. (b) Genomic PCR verification of transgenic Arabidopsis thaliana lines. (c) Relative transcript levels of PpMYB6 in WT and transgenic lines detected by qRT-PCR. (d) Growth phenotypes of adult WT and PpMYB6-overexpressing Arabidopsis plants under normal growth conditions. (e) Statistical analysis of plant height in WT and transgenic adult plants. (f) Statistical analysis of seedling survival rate in WT and transgenic lines after cold stress treatment.
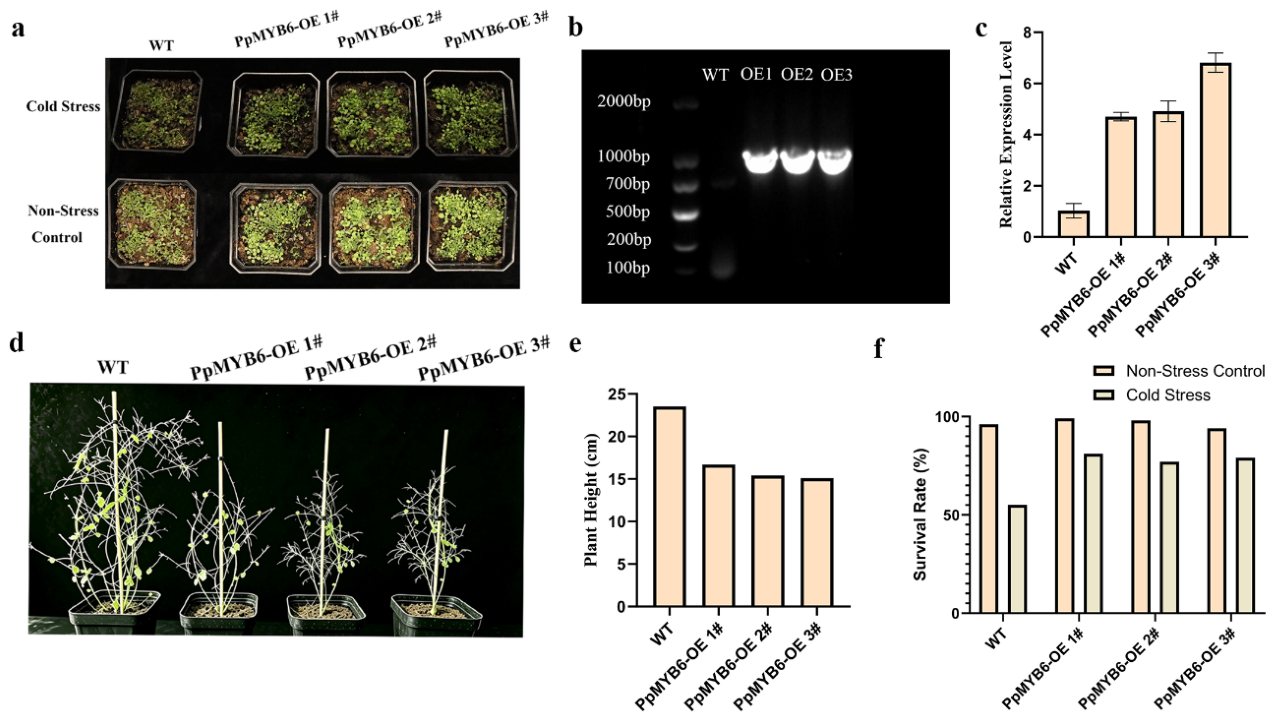
Figure 12.
PpMYB6 directly binds to the PpCBF2 promoter and activates its transcription. (a) Linear distribution of predicted MYB-binding cis-acting elements within the 2000 bp promoter region of PpCBF2. (b) Yeast one-hybrid (Y1H) assay verifying the in vivo binding between PpMYB6 and the PpCBF2 promoter. Serial dilutions of yeast cells were cultured on SD/-Trp/-Leu medium (control, lower panel) and SD/-Trp/-Leu/-His medium supplemented with 55 mM 3-AT (selection, upper panel). (c) Luciferase imaging of Nicotiana benthamiana leaves after transient co-transformation. (d) Schematic illustration of the reporter and effector constructs used in the dual-luciferase reporter assay. (e) Relative LUC/REN ratio in the dual-luciferase reporter assay. Different lowercase letters indicate statistically significant differences (P < 0.05).
Figure 12.
PpMYB6 directly binds to the PpCBF2 promoter and activates its transcription. (a) Linear distribution of predicted MYB-binding cis-acting elements within the 2000 bp promoter region of PpCBF2. (b) Yeast one-hybrid (Y1H) assay verifying the in vivo binding between PpMYB6 and the PpCBF2 promoter. Serial dilutions of yeast cells were cultured on SD/-Trp/-Leu medium (control, lower panel) and SD/-Trp/-Leu/-His medium supplemented with 55 mM 3-AT (selection, upper panel). (c) Luciferase imaging of Nicotiana benthamiana leaves after transient co-transformation. (d) Schematic illustration of the reporter and effector constructs used in the dual-luciferase reporter assay. (e) Relative LUC/REN ratio in the dual-luciferase reporter assay. Different lowercase letters indicate statistically significant differences (P < 0.05).
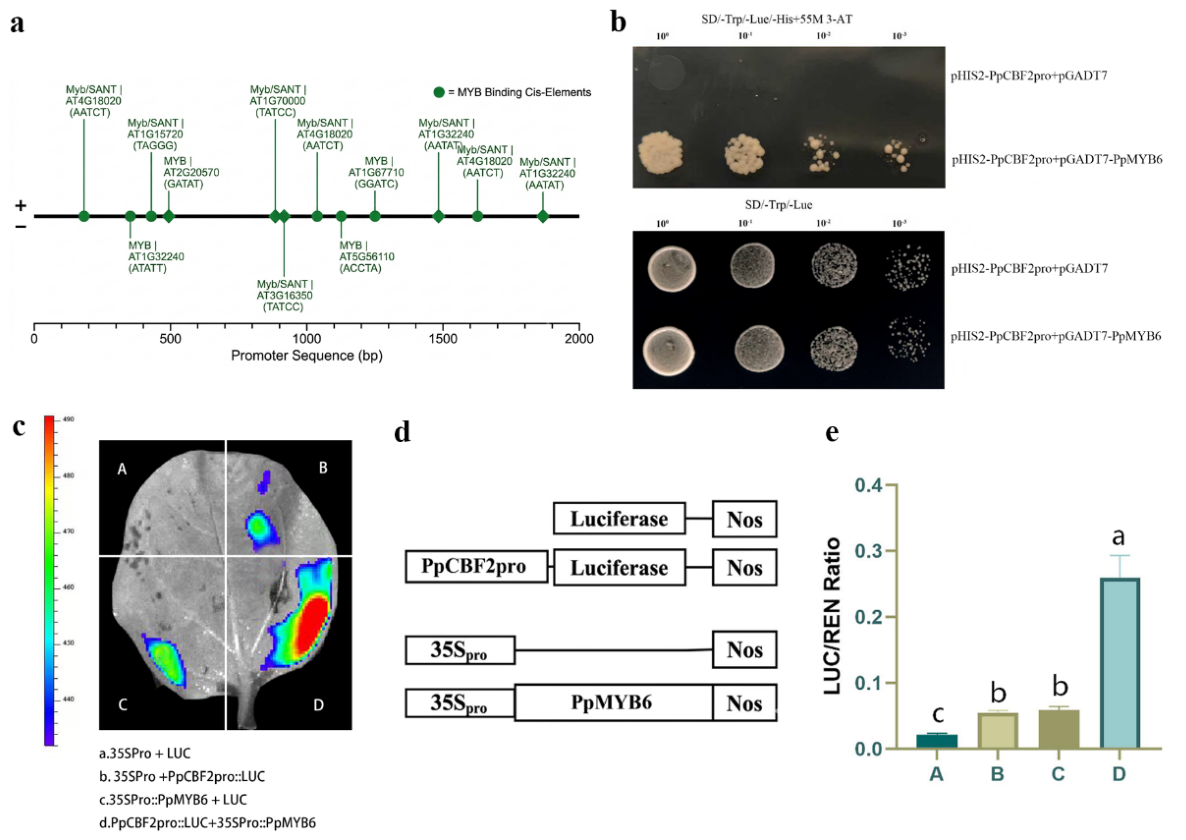
Figure 13.
Yeast two-hybrid (Y2H) verification of candidate PpMYB6-interacting proteins. (a) Spotting assay results of candidate positive clones on SD/-Ade/-His/-Leu/-Trp (QDO) quadruple dropout selective medium. (b) Colony PCR agarose gel electrophoresis of positive clones to confirm inserted cDNA fragments.
Figure 13.
Yeast two-hybrid (Y2H) verification of candidate PpMYB6-interacting proteins. (a) Spotting assay results of candidate positive clones on SD/-Ade/-His/-Leu/-Trp (QDO) quadruple dropout selective medium. (b) Colony PCR agarose gel electrophoresis of positive clones to confirm inserted cDNA fragments.
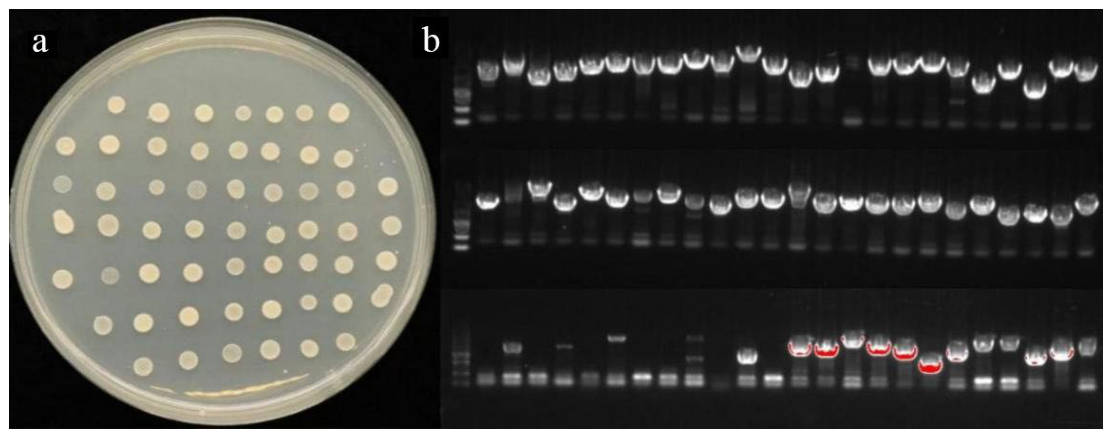

Table 1.
Yeast two-hybrid library screening of PpMYB6.
| NCBI Gene ID | Annotation |
|---|---|
| LOC18784924 | Prunus persica protein SRC2 |
| LOC18777768 | Prunus persica probable pectate lyase 18 |
| LOC18769295 | Prunus persica enolase |
| LOC18780753 | Prunus persica 9-cis-epoxycarotenoid dioxygenase NCED1 |
| LOC18789258 | Prunus persica chloroplast sensor kinase, chloroplastic |
| LOC18778224 | Prunus persica CBL-interacting serine/threonine-protein kinase12 |
| LOC18789892 | Prunus persica probable pectate lyase 8 |
| LOC18793823 | Prunus persica uncharacterized |
| LOC18773609 | Prunus persica cell number regulator 8 |
| LOC18769184 | Prunus persica DELLA protein DWARF8 |
| LOC18767142 | Prunus persica cysteine protease RD19A |
| LOC18789787 | Prunus persica 3-isopropylmalate dehydratase large subunit, chloroplastic |
| LOC18771692 | Prunus persica UPF0183 protein At3g51130 |
| LOC18766643 | Prunus persica arginine decarboxylase |
| LOC18791900 | Prunus persica S-adenosylmethionine synthase 5 |
| LOC18793654 | Prunus persica adenosylhomocysteinase |
| LOC18785128 | Prunus persica glycine-rich cell wall structural protein 2 |
| LOC18779686 | Prunus persica NAC transcription factor 56 |
| LOC18773053 | Prunus persica flowering locus K homology domain |
| LOC18784998 | Prunus persica 21 kDa protein |
| LOC18780743 | Prunus persica NAC domain-containing protein 72 |
| LOC117624799 | Prunus dulcis NAC domain-containing protein 2-like |
| LOC18769808 | Prunus persica ankyrin repeat protein SKIP35 |
| LOC18789573 | Prunus persica cysteine proteinase RD21A |
Disclaimer/Publisher’s Note: The statements, opinions and data contained in all publications are solely those of the individual author(s) and contributor(s) and not of MDPI and/or the editor(s). MDPI and/or the editor(s) disclaim responsibility for any injury to people or property resulting from any ideas, methods, instructions or products referred to in the content. |
© 2026 by the authors. Licensee MDPI, Basel, Switzerland. This article is an open access article distributed under the terms and conditions of the Creative Commons Attribution (CC BY) license (http://creativecommons.org/licenses/by/4.0/).
Copyright: This open access article is published under a Creative Commons CC BY 4.0 license, which permit the free download, distribution, and reuse, provided that the author and preprint are cited in any reuse.