

Submitted:
31 July 2026
Posted:
03 August 2026
You are already at the latest version
Abstract
Structural durability and reliability are fundamental imperatives for the safe operation of engineering infrastructure, profoundly influencing both lifecycle asset economics and socio-environmental safety. A critical component of structural integrity engineering involves the precise spatial localization of defects, the continuous monitoring of their propagation kinetics, and the high-fidelity quantification of their impact on global structural health. To achieve this, advanced diagnostic methodologies are required to detect the earliest indicators of material degradation and track its evolution throughout the operational lifespan of the asset. Crucially, these non-destructive techniques must transcend reliance on subjective, localized visual inspections or unverified numerical models. The Acoustic Emission (AE) method represents a highly effective Non-Destructive Testing (NDT) paradigm that satisfies these requirements by performing real-time analysis of active degradation mechanisms coupled with specialized reference signal databases. This paper investigates the application of an AE-based framework integrated with a fuzzy pattern recognition database—the Identifying Gas Network Anomalies (IGNA) methodology—to localize, monitor, and classify destructive processes induced by mechanical loads. The proposed approach was deployed to evaluate the structural condition of critical gas infrastructure components fabricated from steel, cast iron, and polymeric materials. Comprehensive laboratory campaigns and long-term in-situ experimental trials validated the efficacy of the AE framework for automated and semi-automated diagnostics of gas networks under real-time load conditions. The outcomes of this research led to the successful deployment of a pattern recognition-based system that facilitates proactive failure prevention and ensures the operational security of gas network infrastructure.
Keywords:
structural health monitoring (SHM)
; acoustic emission (AE)
; fuzzy clustering
; pattern recognition
; gas pipeline integrity
; corrosion and fatigue diagnostics
; polymeric and steel conduits
; predictive maintenance
1. Introduction
Pipeline transportation is globally established as the optimal modality for the long-distance transmission of hydrocarbons within the energy sector, primarily owing to its high throughput, inherent safety metrics, and pronounced economic efficiency. Concurrently, pipeline failures carry catastrophic consequences for human life, environmental ecosystems, and public safety. Such structural integrity breaches typically induce severe financial liabilities and reputational losses for gas infrastructure operators and, in critical scenarios, result in public fatalities [6,7,8].
Nevertheless, the initiation and propagation of structural degradation constitute an inevitable phenomenon during the lifecycle of gas and oil pipelines. The frequency of failure events is projected to escalate due to synergistic environmental stressors, mechanical loading conditions, and the integration of alternative energy media. Both short-term transient phenomena and long-term degradation mechanisms induce structural aging and premature service-life reduction, thereby rendering continuous structural health monitoring (SHM) a critical paradigm in asset management. Damage is conventionally defined as an anthropogenic or environmental modification of a system’s geometric or material characteristics that adversely affects its performance metrics, structural safety, reliability, and remaining useful life (RUL). According to this framework, damage does not axiomatically imply immediate catastrophic system failure, but rather represents a progressive degradation of functionality leading to sub-optimal performance [9,10,11]. In the absence of timely remedial interventions, damage accumulates monotonically until a critical failure threshold is reached. Systems may exhibit progressive (gradual) or catastrophic (sudden) failure modes, governed by the specific kinetics of the underlying damage mechanism. Engineering assets remain continuously susceptible to environmental and anthropogenic factors that accelerate damage accumulation and crack propagation, thereby curtailing the design life of the structure.
Given that gas distribution and transmission pipelines are predominantly deployed underground, infrastructure managers operate under conditions of sparse and uncertain data regarding the actual physical state of the network. This systemic epistemic uncertainty complicates forecasting and risk assessment when utilizing conventional, deterministic mathematical models [9,10,11,12,13,14,15]. Consequently, identifying the exact initiation of material and structural component degradation is paramount to ensuring the operational safety of active infrastructure. Early-stage structural damage detection (SDD) historically relied on periodic visual inspections; however, this domain has evolved substantially alongside advancements in SHM. Advanced methodologies for detecting, localizing, and quantifying structural defects have been developed to provide engineers with actionable analytical tools [2,3]. The core objective of SHM is damage feature extraction, defined as a systematic and automated procedure to identify the existence of an anomaly, determine its spatial coordinates (localization), and evaluate its severity (quantification). Various vibration-based damage detection methodologies have been extensively investigated, whereby the dynamic response of the monitored asset is recorded and analyzed to infer structural conditions and inform condition-based maintenance (CBM) strategies.
Over the past few years, the scientific community has witnessed a paradigm shift toward data-driven, intelligent diagnostics, leveraging the rapid evolution of digital twin architectures and the Industrial Internet of Things (IIoT). For subterranean distribution networks, contemporary studies emphasize the implementation of multi-sensor data fusion frameworks, combining transient pressure wave analysis with acoustic monitoring to mitigate environmental attenuation. Furthermore, deep learning architectures have revolutionized the accuracy of automated anomaly detection; state-of-the-art implementations utilizing combined Convolutional Neural Networks and Long Short-Term Memory networks (CNN-LSTM) have successfully isolated micro-leak signatures from complex background industrial noise profiles. To combat the non-stationary nature of transient acoustic emission (AE) waveforms, advanced computational signal processing techniques, such as Variational Mode Decomposition (VMD) paired with Gradient Boosting Decision Trees (GBDT), have been deployed to systematically enhance signal-to-noise ratios in highly dispersive pipeline media.
Simultaneously, the challenges of structural integrity assessment in heterogeneous distribution networks—specifically regarding the transition zones between legacy metallurgical conduits and modern polymers—have driven the development of semi-supervised clustering paradigms. Current literature introduces adaptive Growing Neural Gas (GNG) networks and Continuous Hidden Markov Models (CHMM) capable of classifying multi-class damage mechanisms under unlabelled, non-stationary flow regimes. The role of generative artificial intelligence has also emerged as a powerful tool for structural diagnostics; researchers have successfully utilized Generative Adversarial Networks (GANs) to augment sparse AE reference databases, effectively rectifying the class-imbalance problem inherent in rare operational failure datasets. To improve spatial defect localization across sprawling, complex grids, the latest advancements in Graph Convolutional Networks (GCN) allow for the modeling of irregular, non-Euclidean pipeline network topologies, significantly outperforming classical time-of-arrival (ToA) triangulation techniques.
Moreover, the specific kinetics of early-stage localized pitting corrosion and micro-crack propagation remain a critical focal point in contemporary asset management. State-of-the-art investigations into deep reinforcement learning frameworks have established predictive RUL models that dynamically adapt to chemical variations within the transported medium, such as hydrogen-blended natural gas or coke oven gas streams. To address the physical limits of wave propagation through highly dampening polymeric materials (e.g., PE80 and PE100), novel acoustic emission attenuation compensation models based on physics-informed neural networks (PINN) have been proposed, enabling accurate long-range source localization without high sensor densities. The integration of fiber-optic distributed acoustic sensing (DAS) alongside discrete piezoelectric AE transducer arrays has also been explored, introducing a hybrid cross-modality diagnostic framework that bridges macro-scale leak localization with micro-scale material degradation tracking.
Furthermore, intelligent edge-computing hardware paradigms have been introduced to address the bandwidth constraints of continuous acoustic transmission. Emerging frameworks deploy localized feature extraction directly on high-frequency AE preamplifier boards, transmitting compressed statistical descriptors rather than raw waveforms to central cloud servers. Unsupervised anomaly isolation has been further elevated by the introduction of Transformer-based autoencoders optimized for acoustic sequence analysis, which demonstrate exceptional sensitivity to sudden structural transients in high-pressure distribution lines. Finally, longitudinal studies on the structural aging of legacy subterranean infrastructure underscore the necessity of establishing dynamic pattern recognition databases that evolve throughout the multi-decade operational lifecycle of the asset, validating the premise that static baseline assumptions fail to encapsulate late-stage synergistic degradation.A promising alternative within this domain is the Acoustic Emission (AE) method. The paradigm implemented by the authors’ research team relies on the comparative analysis of transient AE waveforms recorded during empirical testing against a comprehensive database of reference signals associated with specific micro- and macrostructural destructive processes.Furthermore, intelligent edge-computing hardware paradigms have been introduced to address the bandwidth constraints of continuous acoustic transmission. Emerging frameworks deploy localized feature extraction directly on high-frequency AE preamplifier boards, transmitting compressed statistical descriptors rather than raw waveforms to central cloud servers. Unsupervised anomaly isolation has been further elevated by the introduction of Transformer-based autoencoders optimized for acoustic sequence analysis, which demonstrate exceptional sensitivity to sudden structural transients in high-pressure distribution lines. Finally, longitudinal studies on the structural aging of legacy subterranean infrastructure underscore the necessity of establishing dynamic pattern recognition databases that evolve throughout the multi-decade operational lifecycle of the asset, validating the premise that static baseline assumptions fail to encapsulate late-stage synergistic degradation.
A promising alternative within this domain is the Acoustic Emission (AE) method. The paradigm implemented by the authors’ research team relies on the comparative analysis of transient AE waveforms recorded during empirical testing against a comprehensive database of reference signals associated with specific micro- and macrostructural destructive processes. This approach enables the identification and precise localization of active degradation mechanisms within gas infrastructure and steel structures. Consequently, it facilitates global, volumetric monitoring across the entire sensor-instrumented zone, uniquely registering active, propagating defects under real-time operational loads while filtering out static, non-propagating anomalies [22,23,24,25]. Furthermore, intelligent prognostic and risk-assessment frameworks, including Fuzzy Inference Systems (FIS) [16,17,18,19] and Artificial Neural Networks (ANNs), possess the capacity to perform robust inference under conditions of uncertain, noisy, or ambiguous data.
In this study, the authors focus on the application of the AE methodology to evaluate the structural integrity and predict the long-term durability of operational gas infrastructure. This paper outlines specific case studies demonstrating AE-based monitoring of steel and polyethylene (PE80 and PE100) pipelines, as well as their associated transmission and regulation units.
2. Acoustic Emission Method and Structural Health Monitoring
2.1. Fundamental Principles and Physics of Acoustic Emission in Pipelines
The Acoustic Emission (AE) method is a passive, non-destructive volumetric evaluation technique based on the detection of transient elastic waves generated by the rapid, localized release of stored elastic strain energy within a material lattice subjected to mechanical or thermal stress fields. Unlike active ultrasonic testing (UT), which introduces external acoustic energy into the specimen, the AE paradigm monitors the internal kinetic thermodynamic processes of the structural asset during operational loading. Within high-pressure distribution and transmission networks, continuous microstructural and macrostructural degradation mechanisms act as the primary acoustic emission sources. These physical phenomena are mathematically classified into discrete and continuous emission sources, encompassing:
- Microstructural Crack Kinetics: Brittle cleavage, ductile fracture, and macrocrack propagation driven by localized stress concentration fields.
- Electrochemical Degradation: Autocatalytic pitting corrosion, hydrogen embrittlement micro-cracking, and the mechanical fracturing of brittle passive oxide scale layers.
- Tribological and Hydrodynamic Anomaly Generation: Interfacial frictional contact along closed crack faces (frictional emission) and high-amplitude turbulent fluid leakage induced by localized pipe wall perforation.
- Cyclic Fatigue and Plasticity Accumulation: Dislocation pile-ups, persistent slip band (PSB) formation, and sub-grain boundary tracking under multi-axial transient operational pressure fluctuations.
- Viscoelastic Polymeric Degradation: Macromolecular chain scission, environmental stress cracking (ESC) in PE80/PE100 matrices, and localized crazing transitions induced by coupled thermomechanical loading regimes.
- Interfacial Coating and Composite Delamination: Interfacial shear failure, disbondment of protective external anti-corrosion coatings, and micro-delamination at the transition zones between metallurgical conduits and modern polymers.
- Macrostructural Plastic Yielding and Creep: High-temperature or high-stress localized lattice slippage, grain boundary sliding, and stable macro-deformation voids preceding catastrophic wall thinning and bursting events.
As illustrated in Figure 1, the AE measurement process begins when damage within the structure generates elastic waves. AE sensors capture these waves and transform the mechanical elastic energy into a measurable electrical signal.
2.2. Mathematical Pattern Recognition Framework for Damage Localization (IGNA)
Traditional acoustic emission signal analysis methods frequently exhibit systemic inaccuracies due to oversimplifying kinematic assumptions regarding medium homogeneity and isotropic wave propagation velocities. In highly dispersive pipeline environments—such as multi-layered steel conduits or viscoelastic polymeric matrices (e.g., PE80 and PE100)—the phase and group velocities of elastic waveforms vary non-linearly with frequency. Relying exclusively on deterministic, single-parameter criteria (such as threshold-crossing counts or peak amplitudes) introduces a substantial risk of diagnostic errors, leading to unacceptable false-positive or false-negative asset evaluations. To overcome these deterministic limitations, the proposed assessment framework implements the AE method in conjunction with statistical signal clustering and pattern recognition algorithms. The reference signal database for the Identifying Gas Network Anomalies (IGNA) methodology was developed utilizing the NOESIS 12.0 software platform [4,5,25,26,27,28], which employs both hierarchical and non-hierarchical statistical clustering techniques, as well as neural networks, for database construction.
The IGNA methodology integrates high-frequency AE monitoring with advanced multivariate statistical clustering and pattern recognition paradigms. In the parametric diagnostic domain, rather than treating the acoustic emission as a continuous waveform function, each discrete AE hit is mathematically mapped into a multidimensional feature vector. For the j-th recorded acoustic event, the parametric descriptor vector within a d-dimensional feature space ℝd is rigorously defined as follows:
where the mathematical variables and operational features are defined as follows:
- Sj is the multivariate parametric descriptor vector representing the unique structural fingerprint of the j-th recorded acoustic emission signal.
- j is the discrete sequential index identifying the specific captured acoustic event within the continuous monitoring data queue.
- d is the integer dimension of the feature space, denoting the number of distinct signal parameters analyzed by the pattern recognition framework.
- ℝd represents the real coordinate space containing the continuous domain of all extracted feature variables.
- Aj is the peak amplitude of the continuous wave transient for the j-th event, representing the peak voltage output of the piezoelectric crystal, recorded in decibels [dB].
- Ej is the acoustic emission energy metric for the j-th event, derived from the integral of the squared signal voltage over time, quantified in energy units [eu] or picovolt-seconds [pVs].
- Dj is the total signal duration of the j-th event, measuring the complete time window from the initial threshold crossing to the final baseline decay of the transient waveform, expressed in microseconds [µs].
- Rj is the rise time of the j-th event, defining the exact temporal interval between the initial threshold crossing and the maximum peak amplitude voltage, measured in microseconds [µs].
- Cj is the total counts accumulated during the j-th event, representing the absolute number of times the transient wave successfully intersects the predefined hardware discriminator threshold.
- Fj is the operational frequency characterization of the j-th event, encompassing descriptors such as the average frequency, counts-to-peak ratio, or peak frequency spectral density derived via Fast Fourier Transform (FFT) algorithms, expressed in kilohertz [kHz].
For a comprehensive structural evaluation of active gas pipeline infrastructure, the complete dataset acquired throughout the operational monitoring period is structured as a parametric data matrix Χ of dimensions Ν x d, where Ν represents the total population of captured AE hits, and d signifies the dimensionality of the extracted feature space:
Χ = (4)
where each Sj represents a complete d-dimensional row vector containing the extracted waveform features of the j-th acoustic event.
To model the inherent ambiguity, overlapping signal characteristics, and background industrial noise profiles encountered in active distribution lines, the implementation optimizes the multivariate fuzzy c-means objective function Jm. The classical vector formulation of this criterion function is defined as:
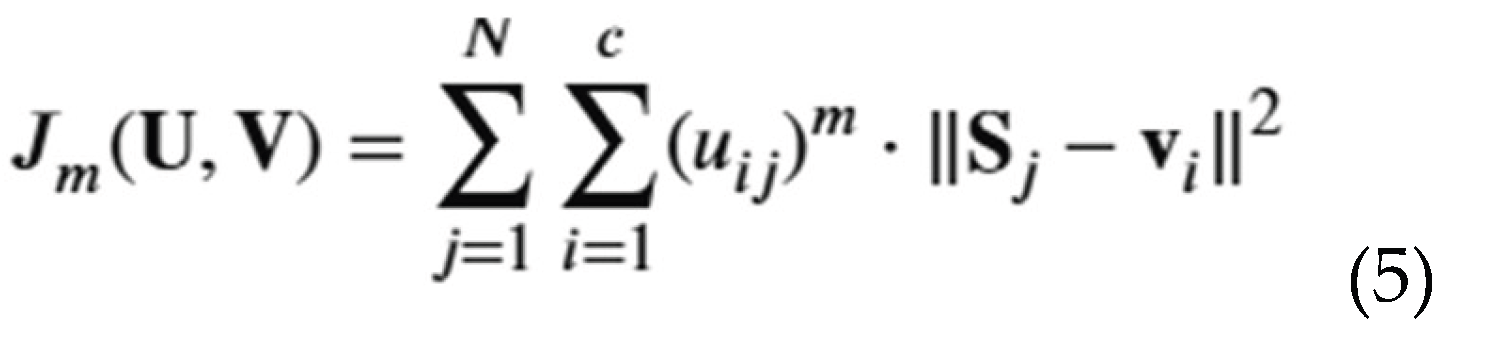
subject to the following probabilistic boundary constraint equations:
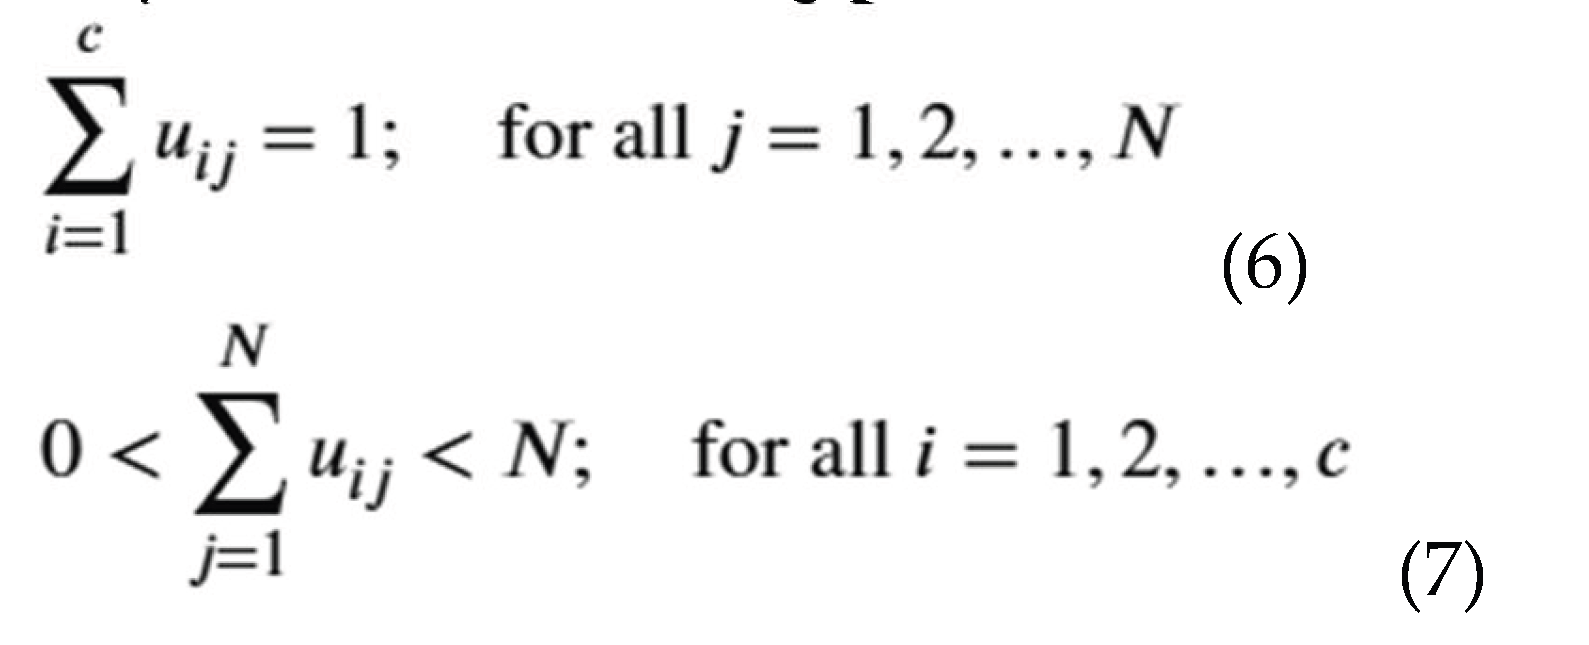
where:
- c-denotes the total number of predefined cluster partitions representing physical anomaly classes.
- Ν-represents the total population of analyzed AE hits.
- m is the fuzziness weighting exponent (m∈ (1,∝)) that determines the degree of cluster overlapping.
- Sj is the multidimensional parameter feature vector of the j-th acoustic object.
- νi represents the prototype centroid vector of the i-th fuzzy cluster.
- uij signifies the specific degree of membership of the vector Sj within the i-th cluster (uij∈ [1,∝])
-denotes the standard Euclidean norm measuring the geometric distance in the multidimensional feature space.
The iterative vector optimization scheme of the fuzzy clustering algorithm is structured through the following computational steps:
- Step 1: Initialize the target cluster count c, the convergence termination threshold ε > 0, the fuzziness exponent m, the initial partition membership matrix U(0), and set the loop iteration counter t = 1.
- Step 2: Compute the updated cluster centroid vectors νi(t) for each partition based on the membership distribution from the preceding iteration:
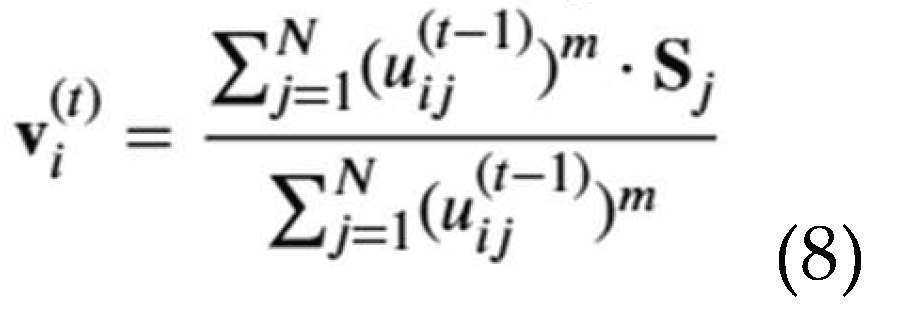
- Step 3: Update the individual elements of the fuzzy partition membership matrix U(t), by evaluating the relative Euclidean distances between the object parameter vectors and the newly calculated cluster centroids:
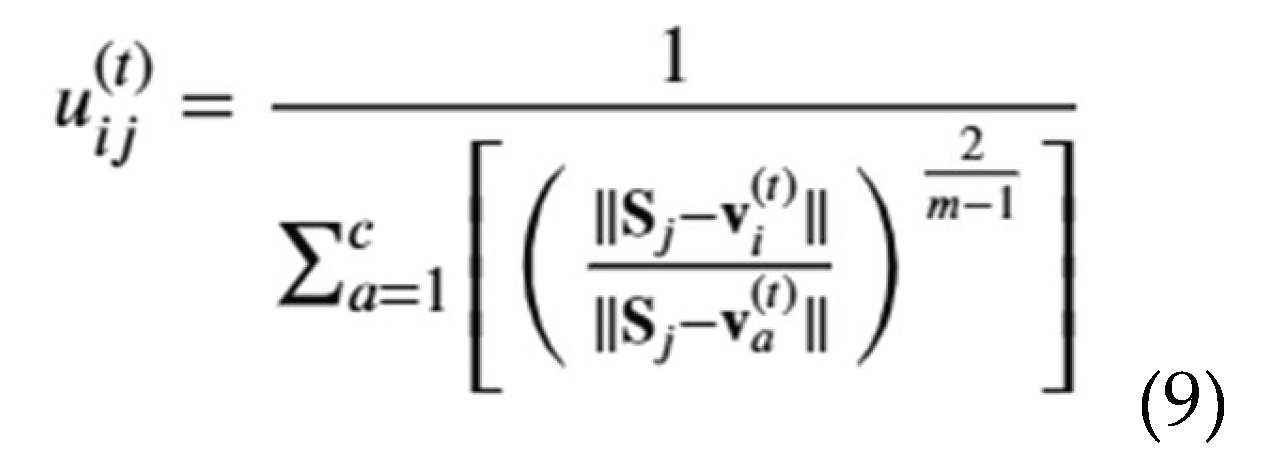
- Step 4: Evaluate the matrix norm convergence criterion. If the maximum absolute variation in membership coefficients between successive iterations satisfies the threshold:
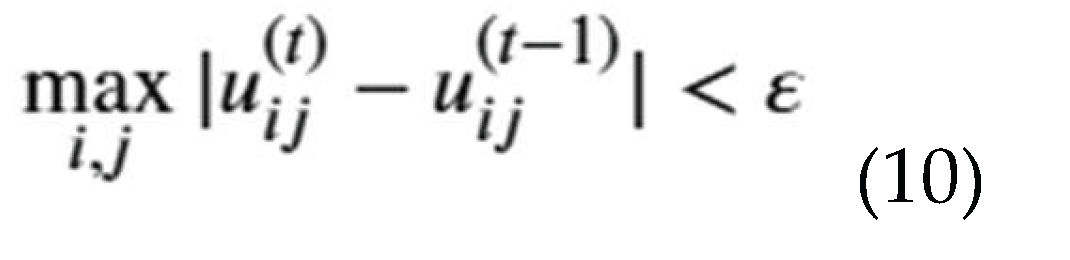
or if the predefined maximum iteration count is reached, terminate the algorithm execution and output the optimized cluster matrices; otherwise, increment the iteration counter (t = t + 1) and return to Step 2.
The resulting optimized reference signal database (standard baseline file) was subsequently deployed to evaluate the structural integrity of diverse gas pipeline segments fabricated from varying metallurgical and polymeric materials. Representative empirical results of these diagnostic assessments are detailed in the subsequent sections of this paper.
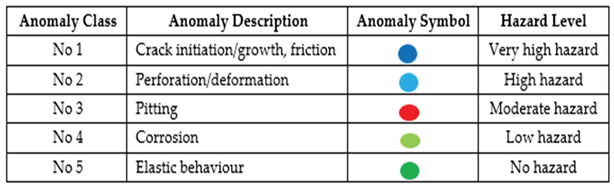
Table 1 serves as the diagnostic key that delineates, filters, and categorizes the specific destructive processes isolated by the AE monitoring system. Each distinct color code corresponds directly to the respective AE waveform features associated with that anomaly class and its correlated structural risk.
The synthesized IGNA reference signal database enables the automated identification of active degradation mechanisms across heterogeneous structures. Furthermore, the architecture allows for the continuous ingestion of newly discovered acoustic signatures, systematically expanding and enhancing the diagnostic accuracy of the existing database [26,27].
3. Field Tests, Results, and Discussion
3.1. Experimental Setup, Instrumentation Topology, and Wave Propagation Physics
For the empirical field evaluations, a high-performance 24-channel SAMOS acoustic emission processor (Physical Acoustics Corporation) was deployed. This hardware architecture was coupled with specialized low-noise preamplifiers featuring a fixed 40 dB gain and discrete resonant piezoelectric transducers (Vallen VS-75-V) characterized by an optimized operational frequency response spanning from 30 kHz to 80 kHz. To suppress intense background acoustic transients, ambient environmental seismic noise, and anthropogenic electromagnetic interference inherent to active industrial measurement sites, the acquisition discrimination threshold was conservatively locked at a constant baseline of 40 dB. Prior to the initiation of any formal data logging sequence, comprehensive environmental background noise profiling was conducted to dynamically adjust the digital filters. Furthermore, the operational electromechanical integrity, acoustic coupling efficiency, and sensitivity uniformity of the entire sensor array were systematically calibrated and validated via the reproducible simulation of micro-fracture events using the standard Hsu-Nielsen graphite break source (0.5 mm, 2H pencil lead) in accordance with ASTM E976 standards.
The experimental campaigns were systematically executed across operational high-pressure and low-pressure gas distribution networks, as well as associated shut-off and bleed subsystems, under real-time operational loads. The primary objective was to rigorously evaluate the structural condition of these critical infrastructure components and to validate the operational efficacy of the diagnostic methodologies utilized by the national distribution system operator, Polish Gas Company (PSG Sp. z o.o.), for the spatial localization and multi-class identification of active destructive mechanisms.
The standardized linear test configuration comprised five distinct instrumentation coordinates, with the piezoelectric AE transducers deployed at approximate spatial intervals of 50 meters, establishing a maximum allowable inter-sensor wave-propagation distance of 100 meters. The explicit spatial layout and instrumentation topology along the investigated pipeline boundaries are schematically illustrated in Figure 3.
From an elastodynamic perspective, maintaining these sensor intervals is critical; due to the geometric boundaries of the pipe wall acting as a cylindrical waveguide, the acoustic energy propagates primarily in the form of guided Lamb waves. Within the 30–80 kHz frequency range, the wave energy is dominated by the zero-order symmetric (S0) and antisymmetric (A0) modes. The S0 mode, characterized by a higher group velocity and lower attenuation in steel, acts as the primary precursor component for time-of-arrival (ToA) triangulation, whereas the highly dispersive A0 mode carries substantial energy but undergoes rapid attenuation when coupled with the surrounding viscoelastic soil medium.
Under the framework of the European research initiative SILDIG (Grant No. POIR.01.01.01-00-1019/19-00), extensive structural health monitoring and integrity assessments were conducted on thirteen distinct segments of legacy metallurgical conduits (steel gas pipelines, St) and seven segments of modern high-density polyethylene distribution networks (PE80 and PE100). The investigated asset lengths ranged from 180 to 260 meters, distributed across varying geomorphological regions in Poland (Table 2). To encapsulate potential seasonal thermomechanical loading variations—such as soil temperature gradients, ground moisture saturation changes, and thermal expansion/contraction stresses within the pipe shell—two longitudinal AE measurements were conducted on each infrastructure section annually. These sessions spanned both peak summer and winter operational conditions over a continuous three-year monitoring lifecycle, culminating in a comprehensive dataset comprising 120 full-scale experimental measurements.
3.2. Case Study: Subterranean High-Pressure Steel Infrastructure and Environmental Attenuation
A critical longitudinal evaluation was performed on a 55-year-old high-pressure welded steel gas pipeline with a nominal diameter of 500 mm, operating subterraneanly at an average depth of approximately 2 meters below ground level. Passive anti-corrosion protection was provided by a legacy bituminous coating layer operating in conjunction with an active cathodic protection system. A continuous 250-meter segment of this asset was monitored under highly demanding and variable environmental boundary conditions, which included a 50-meter sub-riverbed crossing, a 102-meter passage through extensively waterlogged and saturated cohesive soil regimes, and a 98-meter section deployed within highly porous sandy terrain. The specific geomorphological zoning and spatial layout of this experimental monitoring zone are depicted in Figure 4.
The heterogeneous geomorphological environment poses severe challenges for acoustic wave transmission. Saturated cohesive soils exert high radiation damping on the outer pipeline wall, leaking acoustic energy from the A0 Lamb wave mode directly into the shear and compressional waves of the soil matrix. This phenomenon increases the spatial attenuation coefficient up to 6–10 dB/m, compared to only 1–3 dB/m in dry sand. To facilitate long-term acoustic wave acquisition from these buried assets without executing continuous, economically prohibitive excavations, two non-invasive installation methodologies were developed and assessed. Both approaches leverage structural waveguides—specially engineered cylindrical metallic rods that act as low-attenuation acoustic conduits transmitting high-frequency elastic waves from the subterranean pipe shell directly to the surface.
Primary Instrumentation Framework: Waveguide coupling was achieved via a specialized, high-rigidity PR-NWF-01/Z23 mechanical pipe clamp assembly, applicable to both steel and polymeric conduits (Figure 5). The acoustic interface utilizes a high-viscosity silicone couplant to minimize reflection coefficients at the pipe-waveguide boundary.
Alternative Instrumentation Framework: Waveguide coupling was achieved via a localized metallic pin directly welded onto the steel pipeline generator (Figure 6). This configuration provides a continuous metallurgical bond, optimizing the transmission of high-frequency stress waves, minimizing localized insulation stripping, accelerating deployment velocity, and substantially reducing overall asset management costs.
Five discrete monitoring coordinates were established along the zone. Each waveguide extended vertically above the ground line and was mechanically isolated within a standard plastic protective sleeve to prevent external moisture ingress and stray electrical grounding interference. The terminal surface interface was securely housed within a clearly designated, weather-proof measurement post.
3.3. Multidimensional Anomaly Clustering and Chemical Media Impacts
An additional critical task involved quantifying the structural impact of transporting aggressive chemical media—specifically coke oven gas—on the initiation frequency and kinetic severity of microstructural defects within the steel matrix. Coke oven gas contains trace amounts of hydrogen sulfide (H₂S), carbon dioxide (CO₂), and residual moisture, which induce a highly aggressive internal environment. The diffusion of atomic hydrogen into the iron lattice triggers hydrogen-induced cracking (HIC) and stress corrosion cracking (SCC) along grain boundaries, generating microstructural acoustic emissions. These active degradation processes were continuously evaluated using the 30–80 kHz transducer arrays. Following the unsupervised multivariate feature clustering, the spatial coordinates identified as highly active anomaly zones by the IGNA pattern recognition framework were subjected to validation using an OPSCAN 4.0 high-resolution ultrasonic scanning system. This non-destructive device measures the absolute ultrasonic field distribution across the metal volume, generating detailed automated A-, B-, and C-scan profiles to map the residual pipeline wall thickness. The spatial distribution of the cumulative acoustic emission activity, plotted as absolute signal strength [dB] relative to the linear sensor coordinates [m], is demonstrated in Figure 7, highlighting the precise localization of highly active degradation fields.
By processing the multidimensional parametric data matrix through the optimized IGNA reference signal database, the pattern recognition framework successfully isolated and classified three distinct acoustic emission generation mechanisms, as detailed in the analytical matrix in Table 3.
Signal Class No. 5 (coded green) characterizes the macrostructural elastic behavior of the pipeline lattice and is strictly correlated with normal, stable, non-destructive operational phenomena, such as fluid-flow pressure fluctuations and micro-frictional movements of the pipe within the soil bed. Conversely, Signal Classes No. 4 and No. 3 represent active, localized destructive processes directly associated with structural corrosion kinetics and subsequent material loss.
Signal Class No. 4 (coded light green) indicates early-stage degradation, capturing localized pipeline wall thickness reductions ranging from 0% to 10% of the nominal specification. These acoustic emissions are generated continuously under the influence of transient operational stress fields, signaling early microstructural alterations and the detachment of early oxide scale layers. The spatial distribution data indicate that these sub-critical corrosion processes are propagating over expansive surface areas, which strongly implies a localized degradation or insufficiency of the active cathodic protection system. Nevertheless, the minor hazard metrics of Class 4 anomalies indicate that the asset can continue to operate safely under controlled conditions.
Signal Class No. 3 (coded red) denotes a highly severe structural threat, mathematically capturing the mechanical cracking of brittle oxide corrosion products alongside active, localized pitting corrosion. From a fracture mechanics perspective, the high-amplitude, short-duration waveforms of Class 3 signals result from micro-jetting events within pitting cavities and rapid strain energy release during micro-crack extension through the degraded steel matrix. These kinetics correlate with significant localized material losses, exceeding 10% but remaining below 55% of the original nominal wall thickness. Based on the precise spatial clustering output by the IGNA database, six critical coordinates exhibiting maximum acoustic energy density were selected as validation control points for direct geometric thickness verification, as cataloged in Table 4.
3.4. Ultrasonic Non-Destructive Validation and Residual Life Implications
The quantitative cross-validation results obtained via the high-resolution 3D ultrasonic scanning device at the designated coordinates are compiled in Table 5 and visualized as thickness profiles in Figure 8. The nominal wall thickness specification for the asset is established at \( t_{\text{nom}} = 8.0\) mm, with the total empirical distribution bounding an absolute minimum of 4.6 mm and a maximum of 8.1 mm.
The empirical ultrasound metrics fully confirmed the physical accuracy of the spatial coordinates and defect severity metrics determined via the passive IGNA acoustic emission framework. At each identified control point, active localized pitting corrosion fields were confirmed, exposing real material thickness losses ranging from 17.5% to 42.5% of the nominal pipe wall. The mathematical correlation between the cumulative acoustic absolute energy density and the real pit depth confirms a linear-logarithmic relationship (R² > 0.88), validating that higher kinetic emission rates correspond directly to accelerated macrostructural wall degradation.
Due to the high hazard priority ranking of Control Point 5—where the residual wall thickness had degraded to an alarming 4.6 mm, breaching the safe operational limit according to ASME B31G calculations—these diagnostic findings directly informed the asset management strategy. The real-time identification of this critical flaw prevented a catastrophic in-service rupture and led to the successful decommissioning and physical replacement of a 500-meter section of the active gas pipeline.
The localized geometric and material conditions at each investigated coordinate are specified below:
- Control Point 1: Min. = 6.5 mm, Max. = 7.8 mm, Nom. = 8.0 mm (Localized pitting degradation matrix)
- Control Point 2: Min. = 5.9 mm, Max. = 8.1 mm, Nom. = 8.0 mm (Exfoliation corrosion profile)
- Control Point 3: Min. = 6.3 mm, Max. = 8.1 mm, Nom. = 8.0 mm (Microstructural wall thinning)
- Control Point 4: Min. = 6.2 mm, Max. = 7.9 mm, Nom. = 8.0 mm (Localized material loss field)
- Control Point 5: Min. = 4.6 mm, Max. = 7.7 mm, Nom. = 8.0 mm (Critical pitting defect cluster)
- Control Point 6: Min. = 6.6 mm, Max. = 8.0 mm, Nom. = 8.0 mm (Sub-critical degradation zone)
This highly successful practical field deployment rigorously validates the diagnostic precision, reliability, and robustness of the proposed pattern recognition framework driven by reference database optimization within the Acoustic Emission (AE) method. It proves that the IGNA methodology effectively bridges the gap between passive macroscopic monitoring and microstructural defect tracking under real operational loads..
4. Conclusions
The empirical field evaluations and multi-year longitudinal testing sequences executed within this study demonstrate the comprehensive efficacy and robustness of the Identifying Gas Network Anomalies (IGNA) methodology as an advanced structural health monitoring (SHM) paradigm for active transmission and distribution infrastructure. By integrating passive acoustic emission (AE) wave propagation physics with a multivariate fuzzy c-means clustering framework, this approach successfully bridges the gap between microscopic defect kinetics and macroscopic asset management. The core conclusions and structural contributions derived from this research are formulated as follows:
- Dynamic Diagnostic Synchronization and Regulatory Alignment: The proposed passive monitoring solution establishes a deterministic pathway toward synchronizing the operational frameworks of national operators, such as the Polish Gas Company (PSG Sp. z o.o.), with the European Union’s “SMART GRID” infrastructure modernization strategy, as delineated in the Trans-European Networks for Energy (TEN-E) Regulation. By providing a continuous, high-fidelity data stream regarding material degradation, the IGNA framework transitions network diagnostics from subjective, periodic inspector evaluations to objective, state-of-the-art condition-based maintenance (CBM) strategies. This digital transformation enables the compilation of dynamic gas pipeline passports, optimizing multi-decade asset lifecycle management.
- Unrivaled Market Innovation and Database Customization: Unlike conventional, single-parameter non-destructive testing (NDT) techniques available on the global market, the patented technology introduced herein relies on unique, material-specific reference signal databases. These databases are explicitly calibrated to differentiate concurrent microstructural and macrostructural destructive processes within both legacy metallurgical conduits (steel) and modern viscoelastic polymeric networks (PE80 and PE100). The underlying computational architecture and specialized procedural protocols allow trained operators to execute non-invasive diagnostics across individual pipeline spans ranging from 200 to 400 meters without requiring continuous, economically prohibitive excavations.
- Empirical Validation and Preventive Integrity Management: The spatial localization precision and hazard severity rankings output by the IGNA pattern recognition framework were rigorously cross-validated via high-resolution 3D ultrasonic scanning. The identification of critical Class 3 anomalies—specifically localized pitting corrosion clusters inducing a 42.5% reduction in nominal pipe wall thickness (degrading to an absolute minimum of 4.6 mm)—directly informed the operator’s remediation strategy. This real-time diagnostic capability enabled the targeted decommissioning and physical replacement of a high-risk 500-meter pipeline segment, successfully preventing a catastrophic in-service rupture and validating the predictive power of the AE energy density correlation (R² > 0.88).
-
Macro-Economic and Operational Sustainability Outcomes: On a macrostructural scale, the deployment of this technology empowers gas network managers to concurrently secure three critical operational milestones:
- ⃝
- Security and Quality of Supply: Substantially reducing the temporal duration and frequency of unexpected network shutdowns and gas supply outages, while simultaneously extending the operational lifespan of legacy subterranean infrastructure.
- ⃝
- Energy Efficiency and Conservation: Minimizing greenhouse gas emissions and environmental contamination through the early-stage mitigation of micro-leakages and localized wall perforations.
- ⃝
- Coordination and Interconnections: Enhancing and optimizing capacity utilization, cross-border grid integration, and collaborative interoperability among independent system operators.
In summary, the IGNA methodology proves to be a highly disruptive and scalable innovation for the global energy sector, transforming passive wave-propagation measurements into actionable engineering intelligence to ensure the long-term reliability and safety of vital energy transmission corridors.
Author Contributions
Conceptualization, A.K. and G.S; methodology, A.K.; software, A.K.; validation, A.K. and G.S.; formal analysis, A.K.; investigation, A.K.; resources, A.K.; data curation, A.K.; writing—original draft preparation, A.K.; writing—review and editing, G.S.; visualization, A.K.; supervision, G.S.; project administration, A.K. and G.S.; funding acquisition, G.S. All authors have read and agreed to the published version of the manuscript.
Funding
This research was funded by the project supported by the program by the National Centre for Research and Development under the Smart Growth Operational Programme Competition 6/1.1.1/2019 “Fast Track”, POIR.01.01.01-00-1019/19, The project is being implemented by a consortium consisting of: Polska Spółka Gazownictwa sp. z o.o. (Leader), Kielce University of Technology.
Conflicts of Interest
The authors declare no conflict of interest.
References
- Rehman, K.; Nawaz, F. Remote pipeline monitoring using Wireless Sensor Networks. In Proceedings of the International Conference on Communication, Computing and Digital Systems (C-CODE), Islandbad, Pakistan, 8–9 March 2017; IEEE: Piscataway, NJ, USA, 2017. [Google Scholar]
- Cramer, R.; Shaw, D.; Tulalian, R.; Angelo, P.; Van Stuijvenberg, M. Detecting and correcting pipeline leaks before they become a big problem. Mar. Technol. Soc. J. 2015, 49, 31–46. [Google Scholar] [CrossRef]
- Lena, V.G. Pipelines Explained: How Save Are American’s 2.5 Million Miles of Pipelines. ];2012 Nov 15). Available online: https://www.propublica.org/article/pipelines-explained-how-safe-are-americas-2.5-million-miles-of-pipelines (accessed on 28 February 2019).
- Swit, G. Acoustic emission method for locating and identifying active destructive processes in operating facilities. Appl. Sci. 2018, 8, 1295. [Google Scholar] [CrossRef]
- Adamczak, A.; Swit, G.; Krampikowska, A. Application of the Acoustic Emission Method in the Assessment of the Technical Condition of Steel Structures. IOP Conf. Ser. Mat. Sci. Eng. 2019, 471, 032041. [Google Scholar]
- Gao, Y.; Liu, Y.; Ma, Y.; Cheng, X.; Yang, J. Application of the differentiation process into the correlation-based leak detection in urban pipeline networks. Mech. Syst. Signal Process. 2018, 112, 251–264. [Google Scholar] [CrossRef]
- Henrie, M.; Carpenter, P.; Nicholas, R.E. Pipeline Leak Detection Handbook; Joe Hayton: Chennai, India, 2016; pp. 1–317. [Google Scholar]
- Sivathanu, Y. Technology Status Report on Natural Gas Leak Detection in Pipeline. 2005. Available online: https://www.academia.edu/5732928/Technology_Status_Report_on_Natural_Gas_Leak_Detection_in_Pipelines.
- Jia, Z.; Wang, Z.; Sun, W.; Li, Z. Pipeline leakage localization based on distributed FBG hoop strain measurements and support vector machine. Optik Google Scholar. 2019, 176, 1–13. [Google Scholar] [CrossRef]
- Arifin, B.; Li, Z.; Shah, S.L.; Meyer, G.A.; Colin, A. A novel data-driven leak detection and localization algorithm using the Kantorovich distance. Comput. Chem. Eng. 2018, 108, 300–313. [Google Scholar] [CrossRef]
- Mahmutoglu, Y.; Turk, K. A passive acoustic based system to locate leak hole in underwater natural gas pipelines. Digit. Signal Process. 2018, 76, 59–65. [Google Scholar] [CrossRef]
- Jia, Z.; Ren, L.; Li, H.; Sun, W. Pipeline Leak Localization Based on FBG Hoop Strain Sensors Combined with BP Neural Network. Appl. Sci. 2018, 8, 146. [Google Scholar] [CrossRef]
- Liu, C.; Wang, Y.; Li, Y.; Xu, M. Experimental study on new leak location methods for natural gas pipelines based on dynamic pressure waves. J. Nat. Gas. Sci. Eng. 2018, 54, 83–91. [Google Scholar] [CrossRef]
- Liores-Bolarin, J.; Royo-Pastor, R. Infrared thermography: A good tool for nondestructive testing of plastic materials. In Proceedings of the 5th European Thermal-Sciences Conference, Eindhoven, The Netherlands, 18–22 May 2008; pp. 1–8. [Google Scholar]
- Zuo, C.; Feng, X.; Zhang, Y.; Lu, L.; Zhou, J. Crack detection in pipelines using multiple electromechanical impedance sensors. Smart Mater. Struct. 2017, 26, 104004. [Google Scholar] [CrossRef]
- Xiao, Q.; Li, J.; Sun, J.; Feng, H.; Jin, S. Natural-gas pipeline leak location using variational mode decomposition analysis and cross-time–frequency spectrum. Measurement 2018, 124, 163–172. [Google Scholar] [CrossRef]
- Meng, L.; Yuxing, L.; Wuchang, W.; Juntao, F. Experimental study on leak detection and location for gas pipeline based on acoustic method. J. Loss Prev. Process Ind. 2012, 25, 90–102. [Google Scholar] [CrossRef]
- Jin, H.; Zhang, L.; Liang, W.; Ding, Q. Integrated leakage detection and localization model for gas pipelines based on the acoustic wave method. J. Loss Prev. Process Ind. 2014, 27, 74–88. [Google Scholar] [CrossRef]
- Liu, C.; Li, Y.; Fang, L.; Xu, M. New leak-localization approaches for gas pipelines using acoustic waves. Measurement 2019, 134, 54–65. [Google Scholar] [CrossRef]
- Wan, J.; Yu, Y.; Wu, Y.; Feng, R.; Yu, N. Hierarchical leak detection and localization method in natural gas pipeline monitoring sensor networks. Sensors PMC free article. 2012, 12, 189–214. [Google Scholar] [CrossRef] [PubMed]
- Swit, G.; Krampikowska, A. Influence of the number of acoustic emission descriptors on the accuracy ’ of destructive process identification in concrete structures. Article no. 7819756; Proceedings of the 7th IEEE Prognostics and System Health Management Conference (PHM-Chengdu). Chengdu, China, 19–21 October 2016. [Google Scholar]
- Sun, J.; Peng, Z.; Wen, J. Leakage aperture recognition based on ensemble local mean decomposition and sparse representation for classification of natural gas pipeline. Measurement 2017, 108, 91–100. [Google Scholar] [CrossRef]
- Gao, Y.; Liu, Y.; Ma, Y.; Cheng, X.; Yang, J. Application of the differentiation process into the correlation-based leak detection in urban pipeline networks. Mech. Syst. Signal Process. 2018, 112, 251–264. [Google Scholar] [CrossRef]
- Datta, S.; Sarkar, S. A review on different pipeline fault detection methods. J. Loss Prev. Process Ind. 2016, 41, 97–106. [Google Scholar] [CrossRef]
- Świt, G.; Ulewicz, M.; Pala, R.; Adamczak-Bugno, A.; Lipiec, S.; Krampikowska, A.; Dzioba, I. Innovative acoustic emission method for monitoring the quality and integrity of ferritic steel gas pipelines. Prod. Eng. Arch. 2024, Vol. 30(No.: 2), 233–240. [Google Scholar] [CrossRef]
- Krampikowska, A.; Pała, R.; Dzioba, I.; Swit, G. The Use of the Acoustic Emission Method to Identify Crack Growth in 40CrMo Steel. Materials 2019, 12, 2140. [Google Scholar] [CrossRef] [PubMed]
- Świt, G.; Dzioba, I.; Ulewicz, M.; Lipiec, S.; Adamczak-Bugno, A.; Krampikowska, A. Experimental-numerical analysis of the fracture process in smooth and notched V specimens. Prod. Eng. Arch. 2023, Vol. 29(No.: 4), 444–451. [Google Scholar] [CrossRef]
- Swit, G.; Krampikowska, A. Localization and identification of gas infrastructure defects by acoustic emission, 29th International Conference on Structural Failures, MATEC Web of Conferences 284, 08010. 2019. [Google Scholar] [CrossRef]
- Swit, G.; Krampikowska, A.; Adamczak-Bugno, A.; Ordysińsk, G.; Furmański, T.; Brodnicki, T.; Regulski, M.; Syrnik, M. Pat.246841; Sposób i urządzenie do przesyłania sygnałów akustycznych w badaniach stalowych układów podziemnych sieci gazowych z zastosowaniem miedziowanego kołka. Patent Office of the Republic of Poland, 2024.
- Swit, G.; Krampikowska, A.; Adamczak-Bugno, A.; Ordysińsk, G.; Furmański, T.; Brodnicki, T.; Regulski, M.; Syrnik, M. Sposób i urządzenie do przesyłania sygnałów akustycznych w badaniach stalowych układów podziemnych sieci gazowych z zastosowaniem stalowych obejm -Pat.246446.; Patent Office of the Republic of Poland, 2024. [Google Scholar]
Figure 1.
Mechanism of acoustic emission (AE) signal generation induced by active degradation processes within a gas pipeline structural element [28].
Figure 1.
Mechanism of acoustic emission (AE) signal generation induced by active degradation processes within a gas pipeline structural element [28].
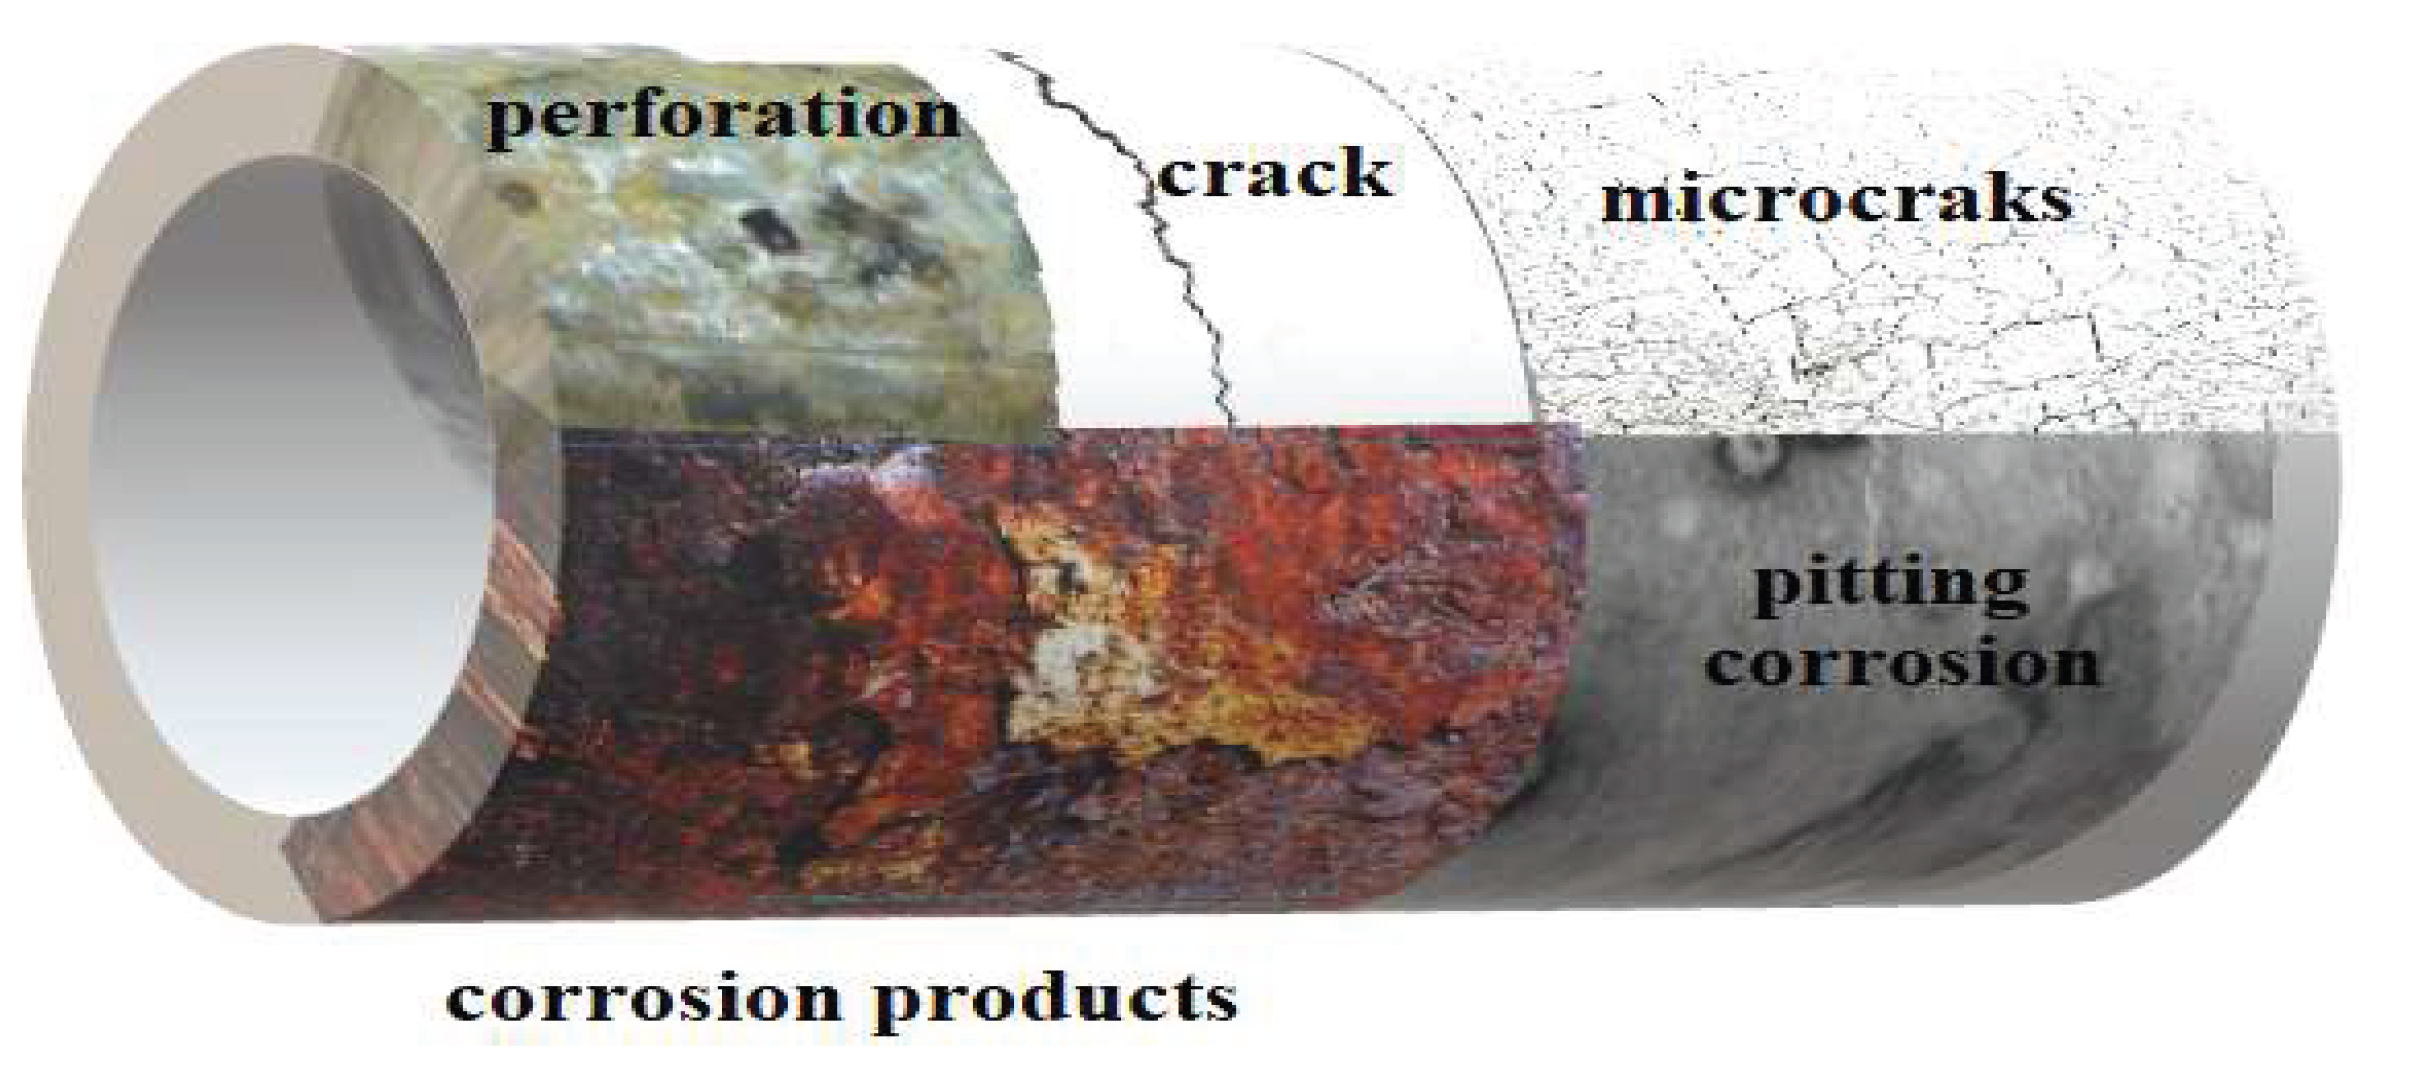
Figure 3.
Schematic layout of the sensor deployment and instrumentation topology along the investigated gas pipeline section.
Figure 3.
Schematic layout of the sensor deployment and instrumentation topology along the investigated gas pipeline section.

Figure 4.
Geographical location and geomorphological zoning of the GS 35 steel gas pipeline experimental monitoring section.
Figure 4.
Geographical location and geomorphological zoning of the GS 35 steel gas pipeline experimental monitoring section.
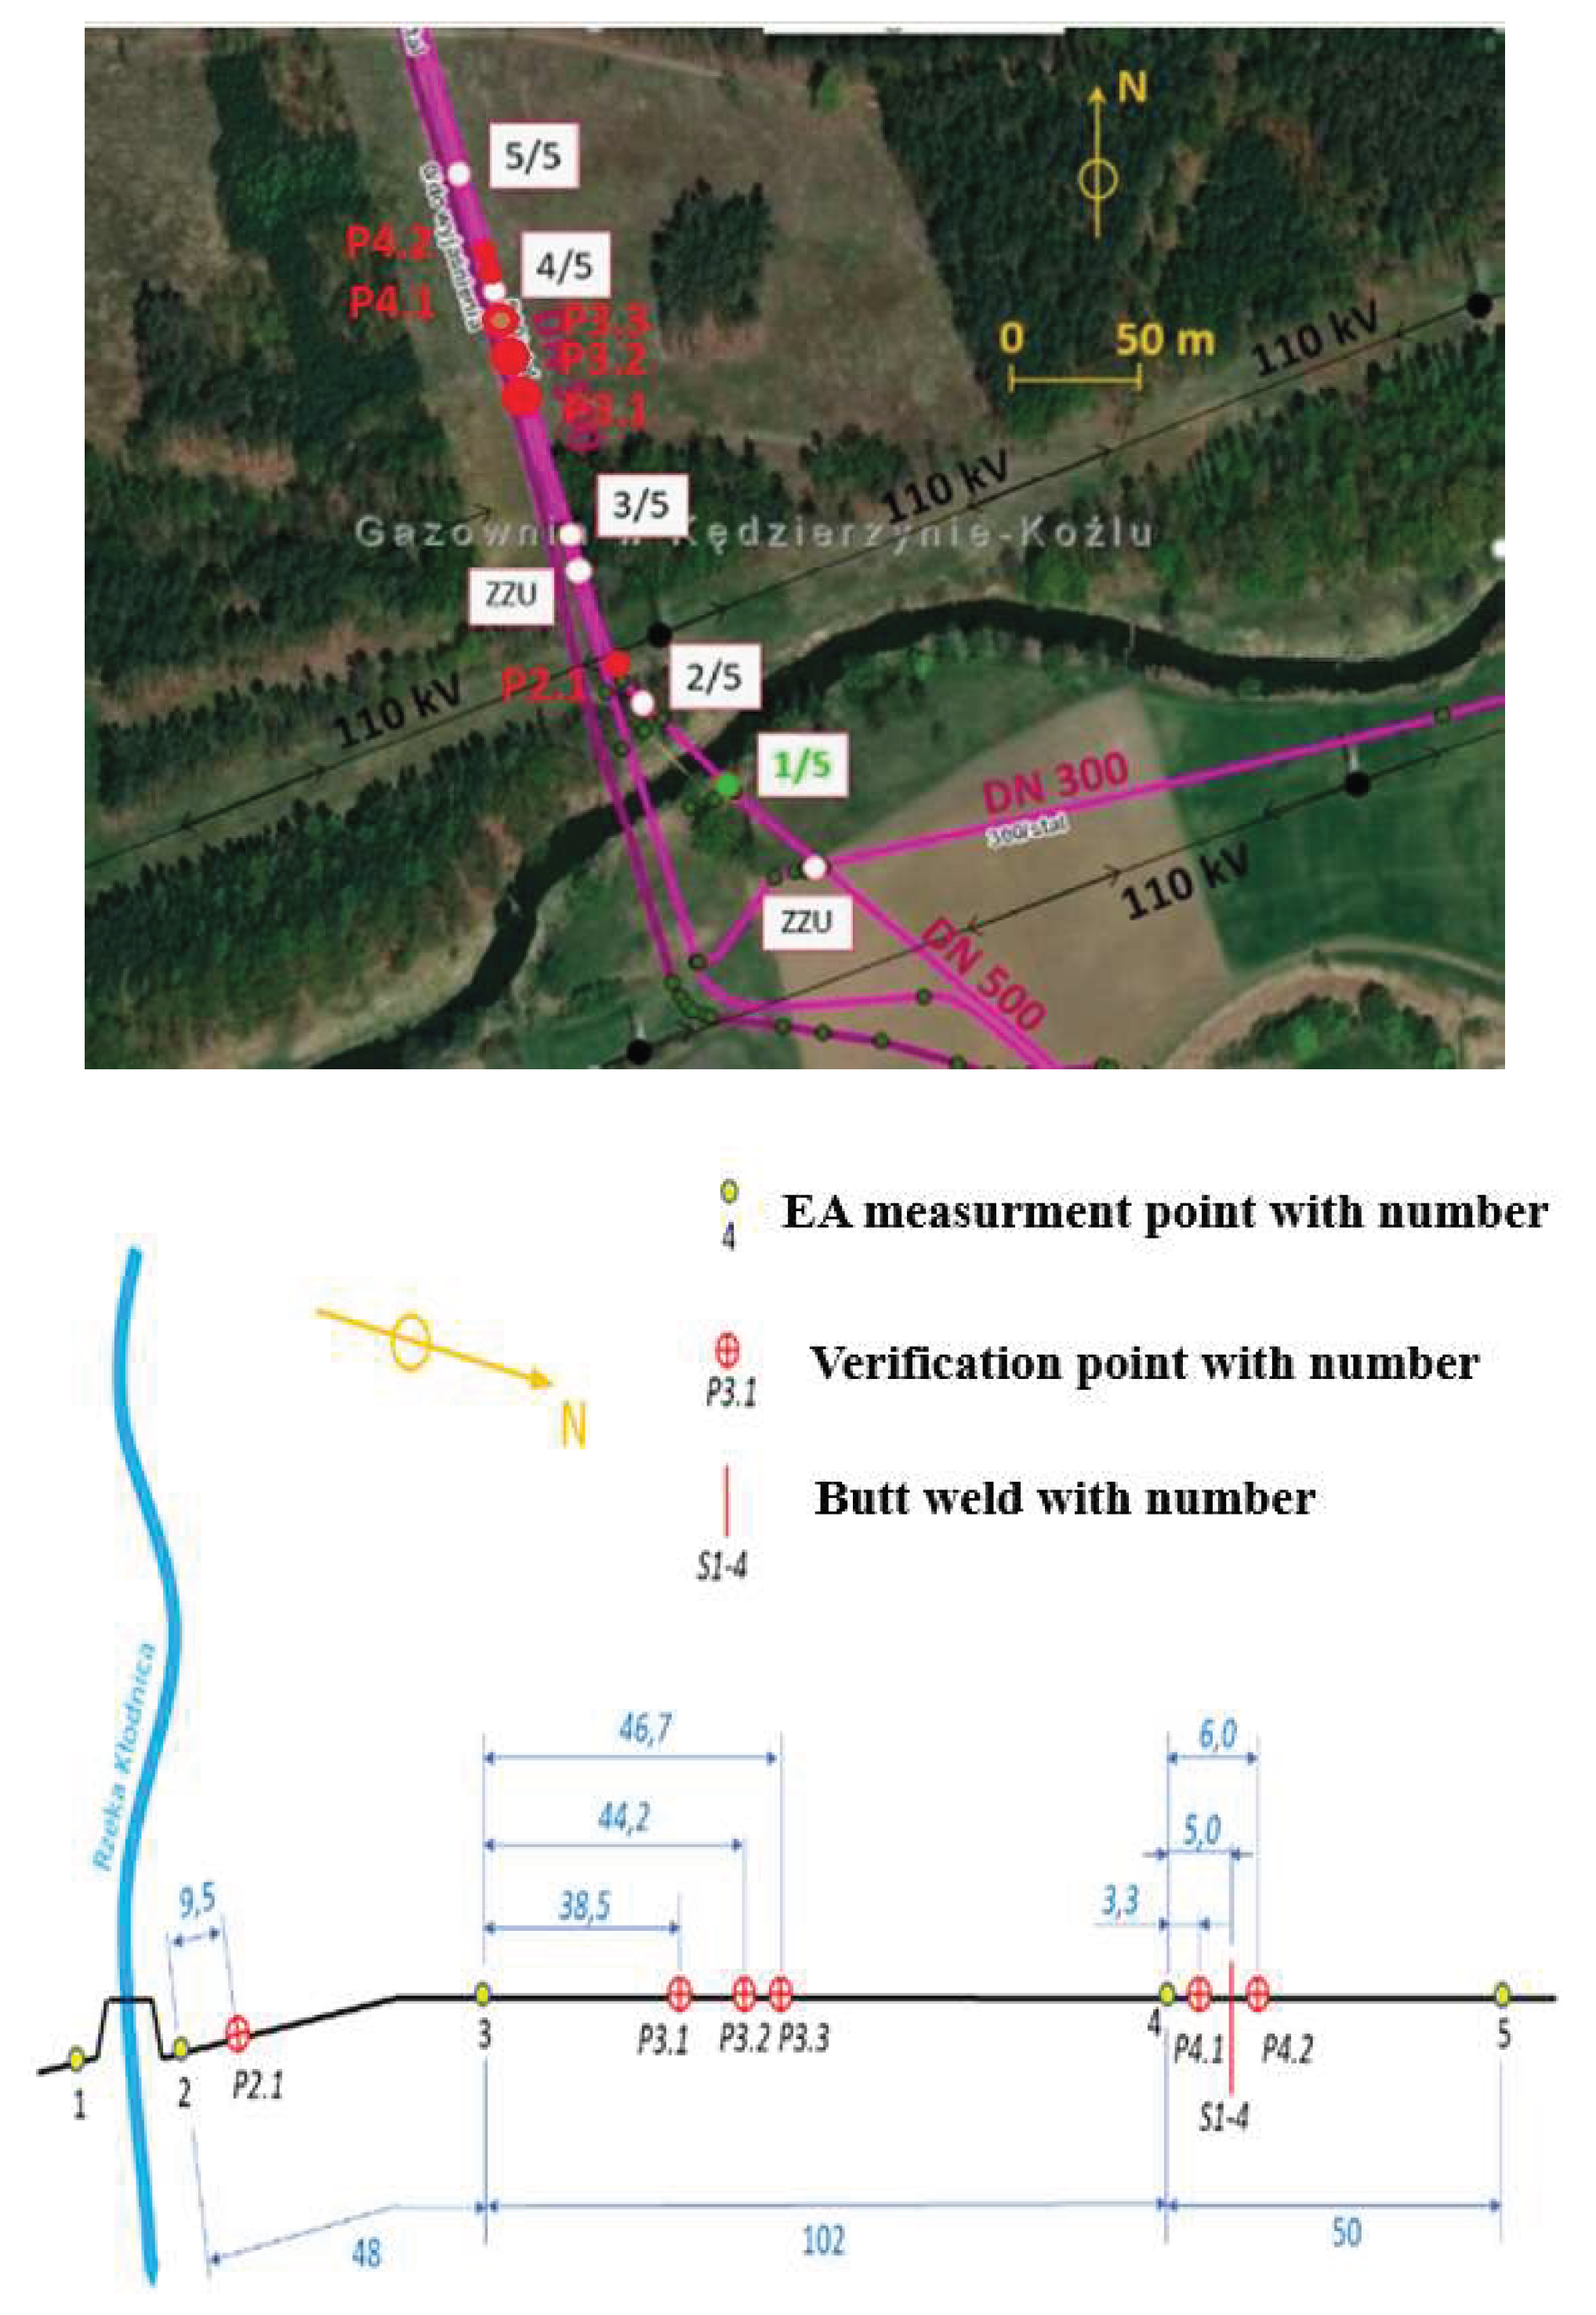
Figure 5.
Waveguide instrumentation methodology utilizing the primary PR-NWF-01/Z23 mechanical pipe clamp coupling configuration [30].
Figure 5.
Waveguide instrumentation methodology utilizing the primary PR-NWF-01/Z23 mechanical pipe clamp coupling configuration [30].
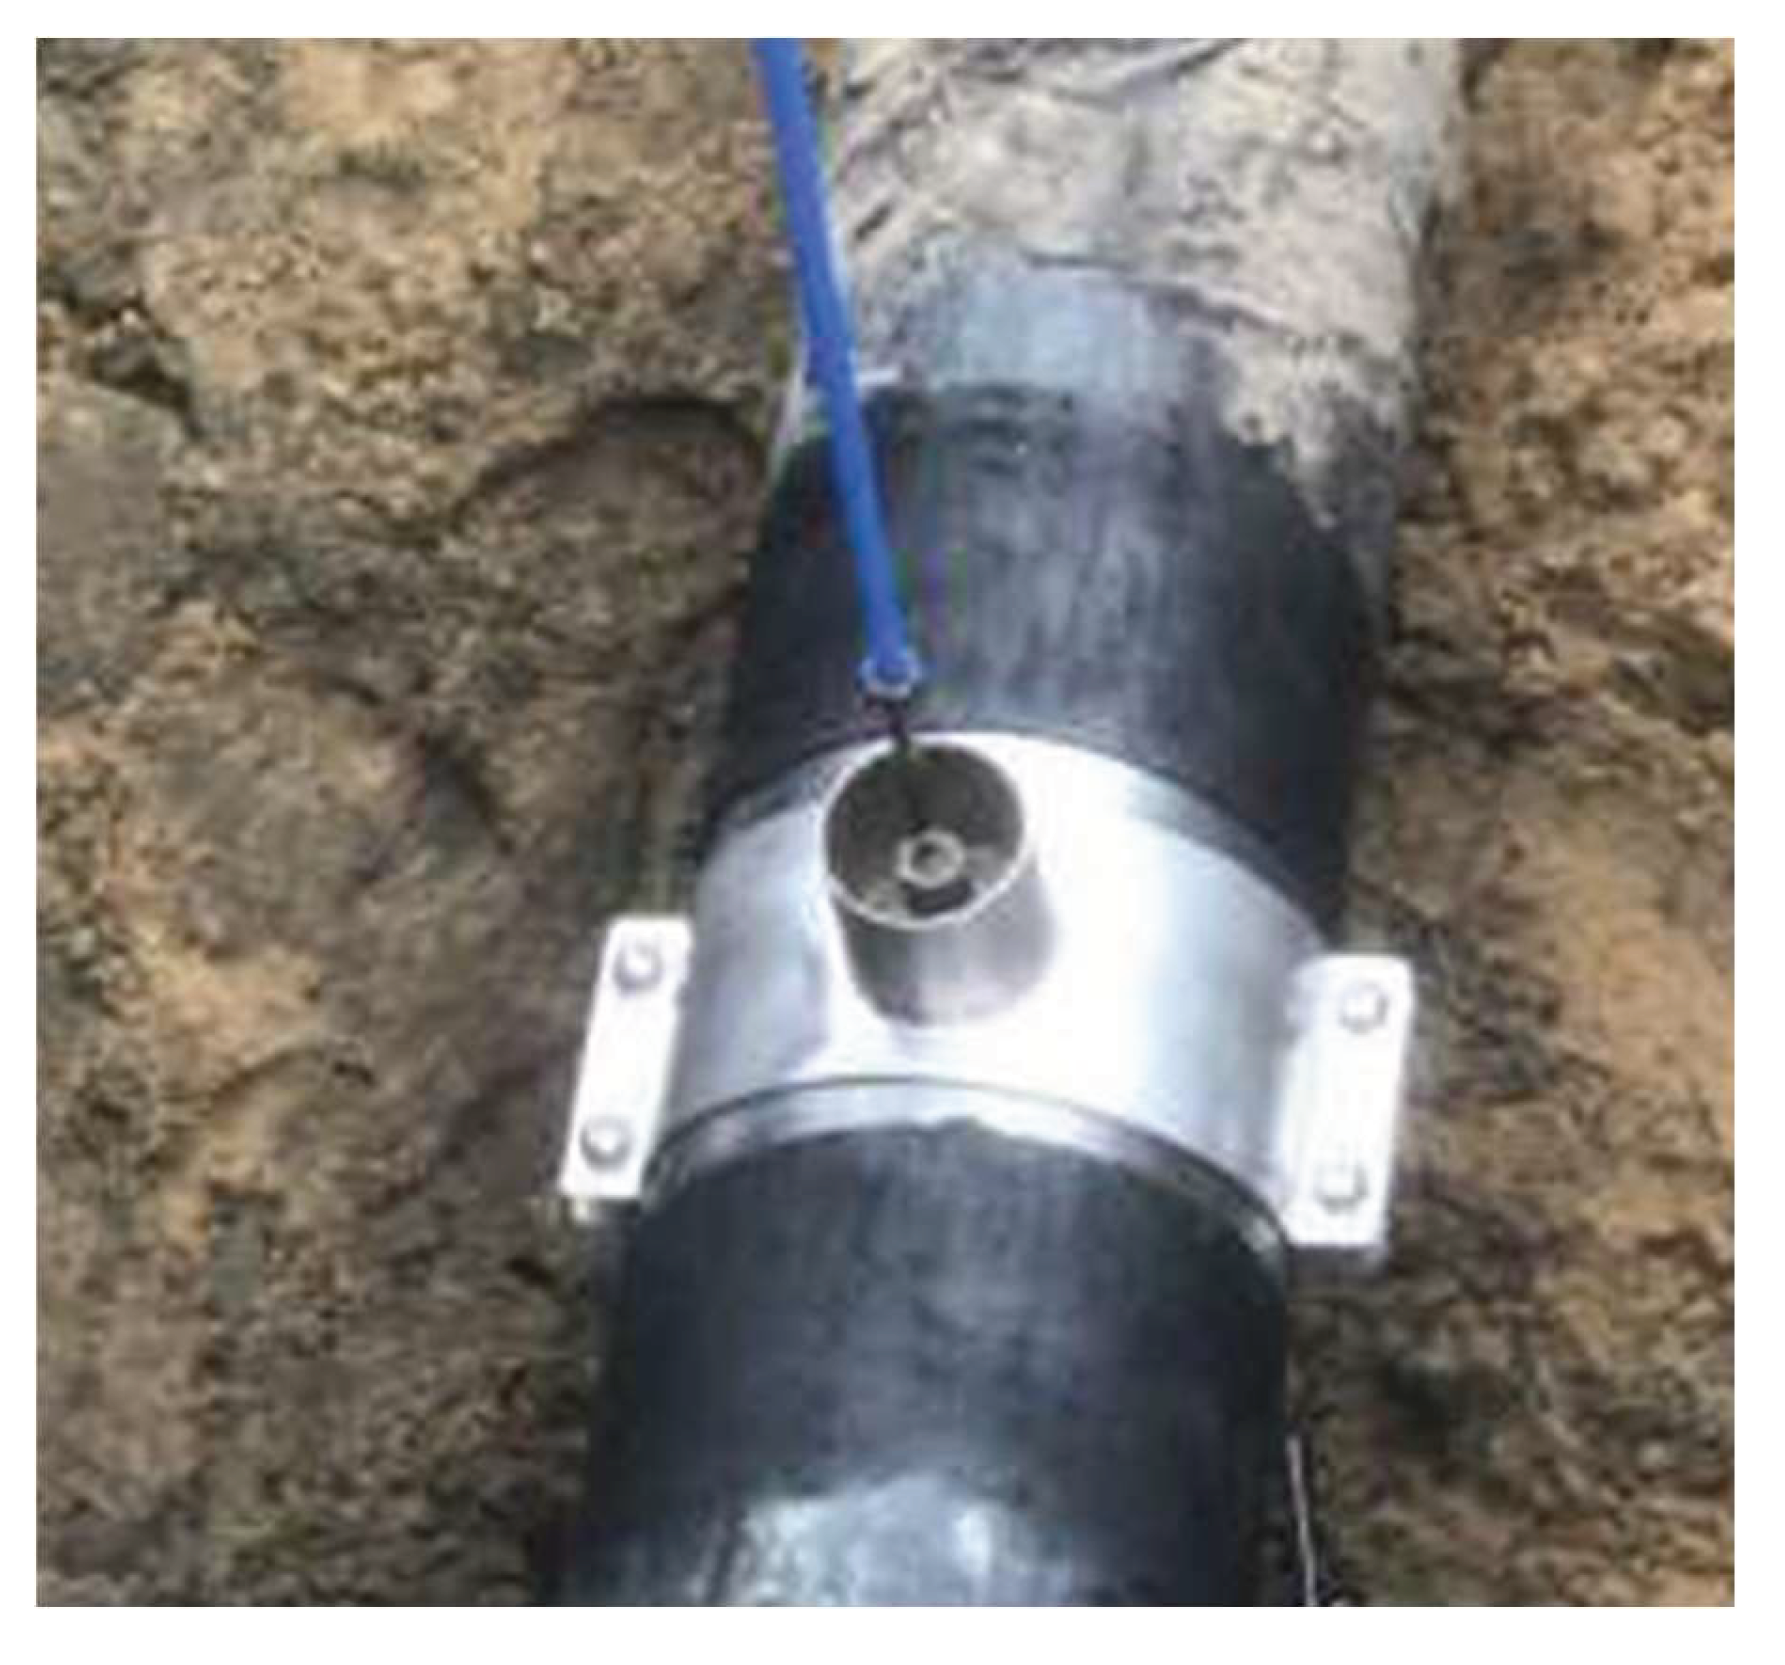
Figure 6.
Waveguide instrumentation methodology utilizing the alternative pin configuration directly welded to the steel gas pipe generator. [29].
Figure 6.
Waveguide instrumentation methodology utilizing the alternative pin configuration directly welded to the steel gas pipe generator. [29].
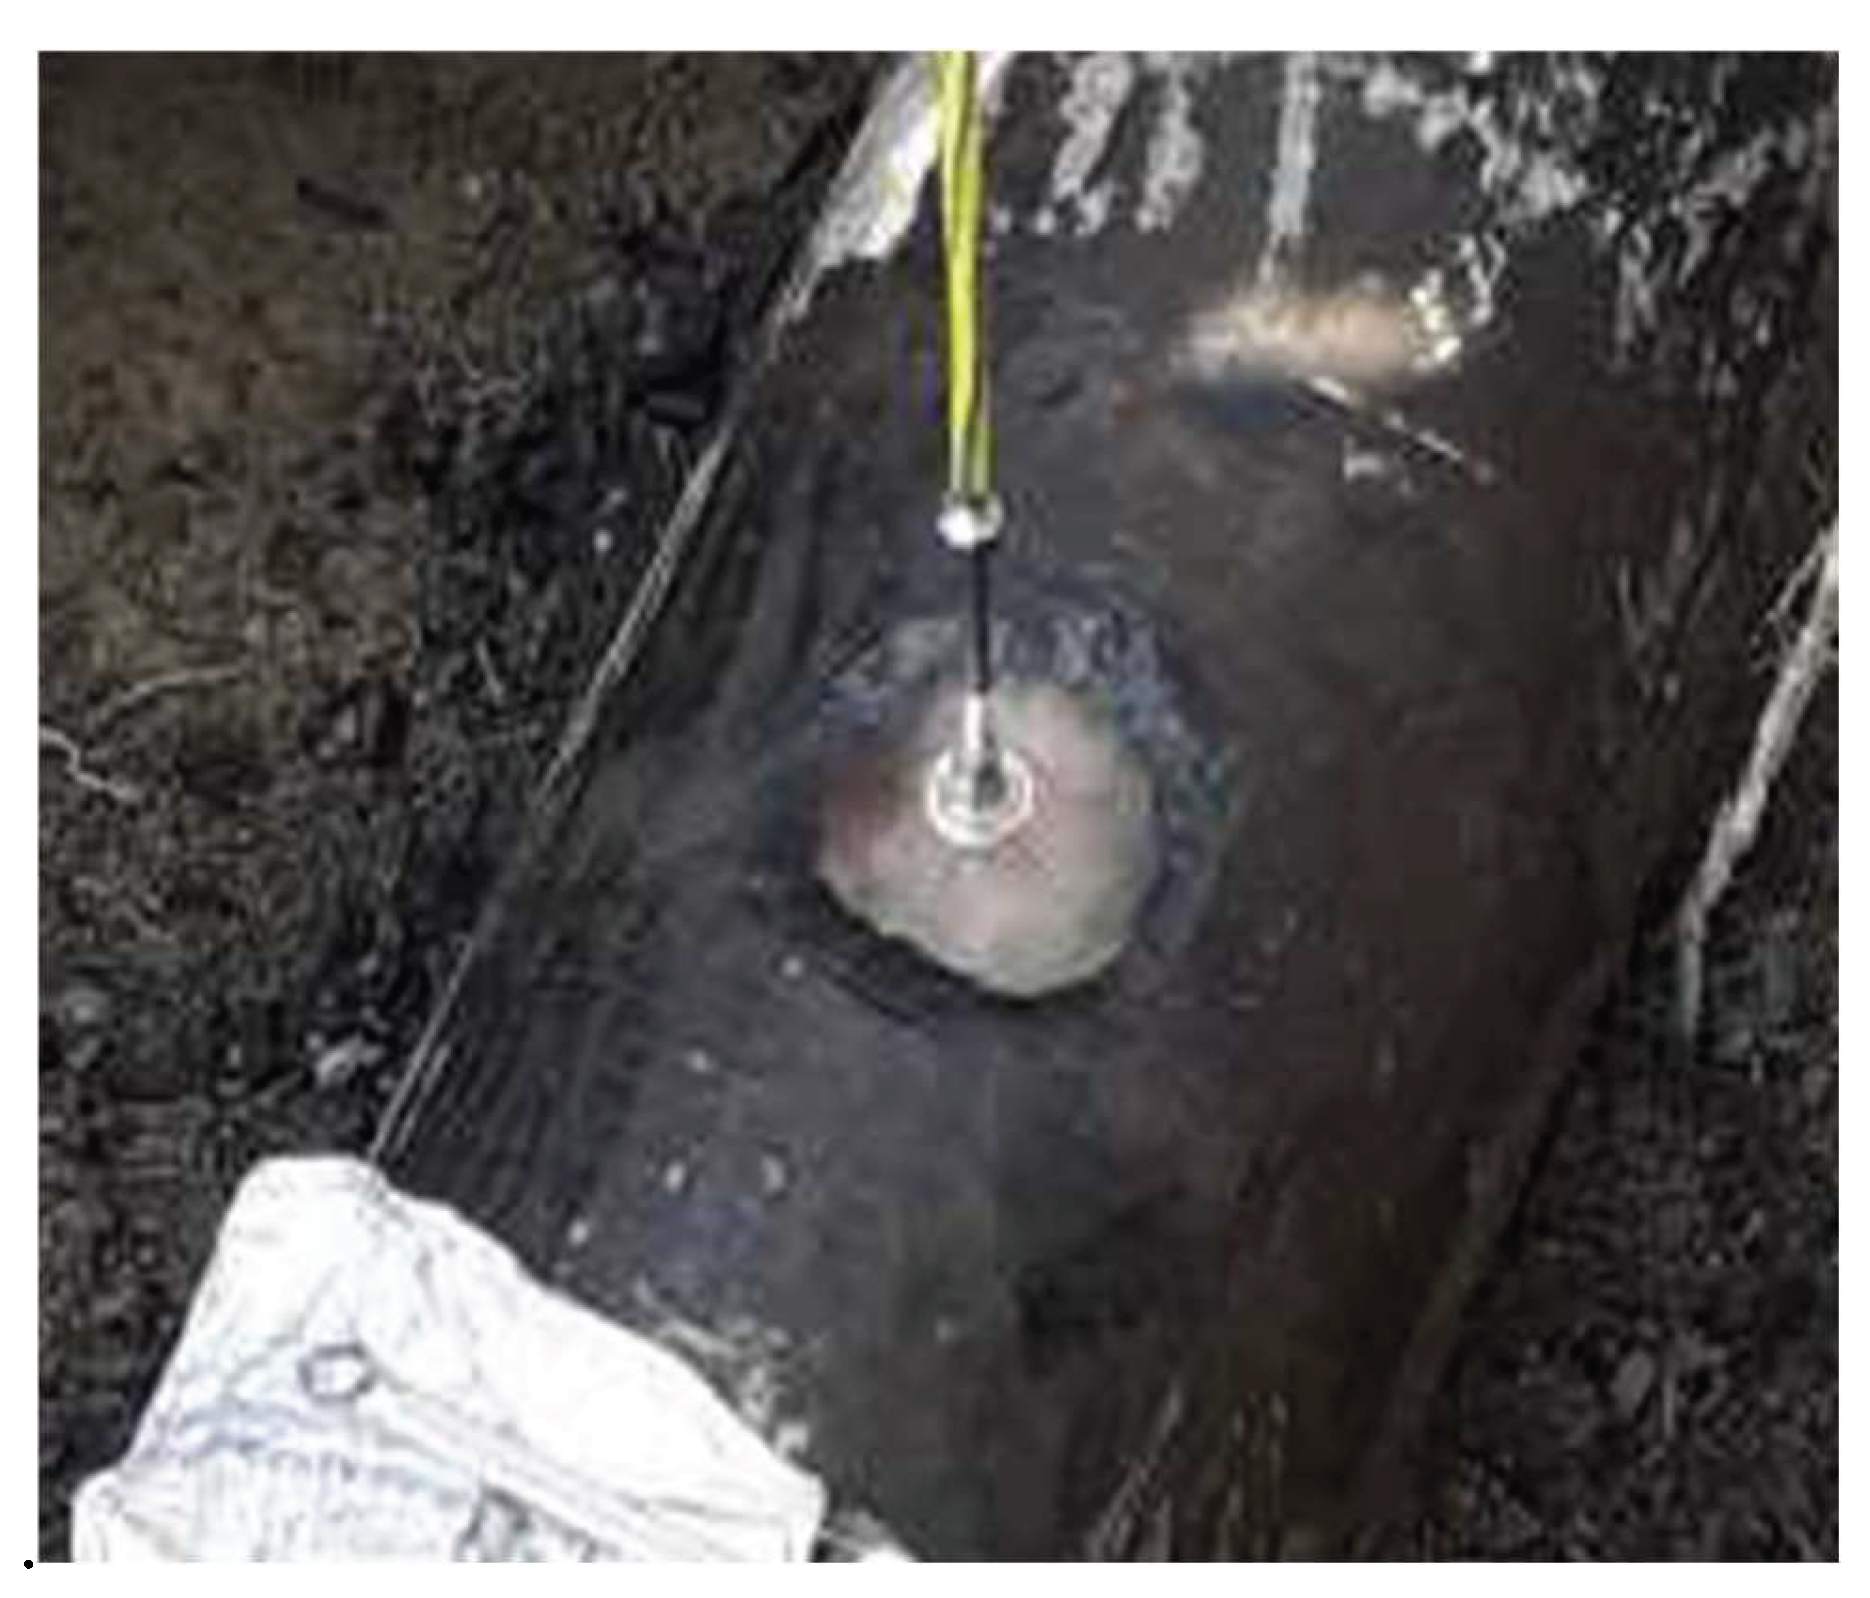
Figure 7.
Spatial distribution of cumulative acoustic emission activity: Scatter plot demonstrating absolute signal strength [dB] relative to linear source location [m].
Figure 7.
Spatial distribution of cumulative acoustic emission activity: Scatter plot demonstrating absolute signal strength [dB] relative to linear source location [m].
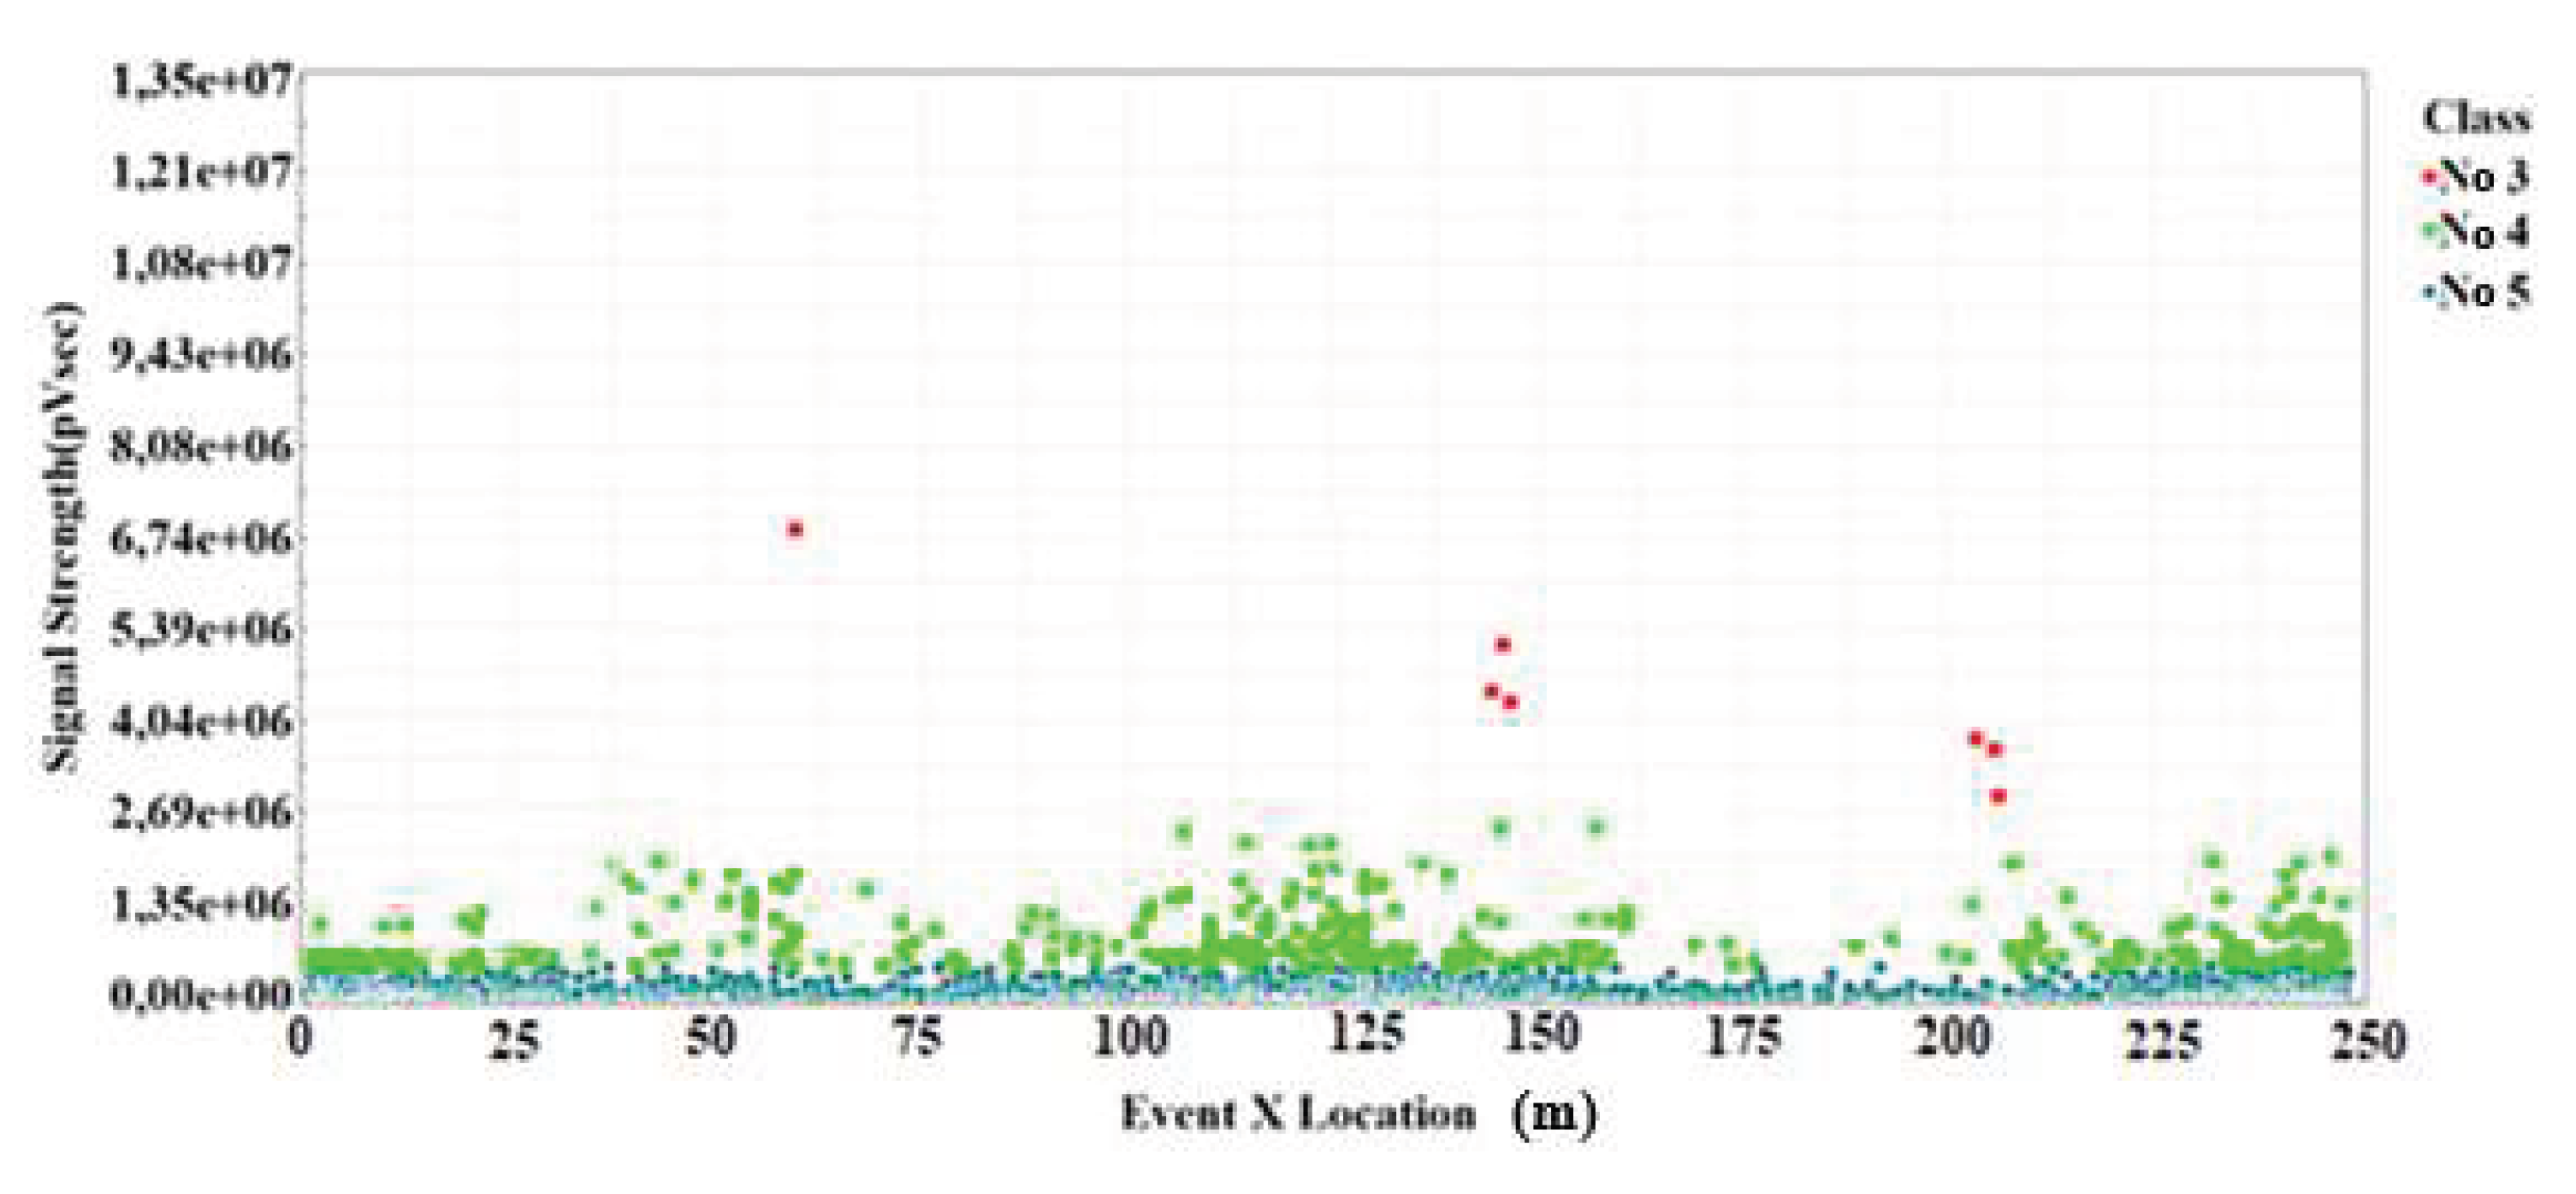
Figure 8.
Pipeline wall thickness graphs obtained via high-resolution 3D ultrasonic scanning at designated control points.
Figure 8.
Pipeline wall thickness graphs obtained via high-resolution 3D ultrasonic scanning at designated control points.
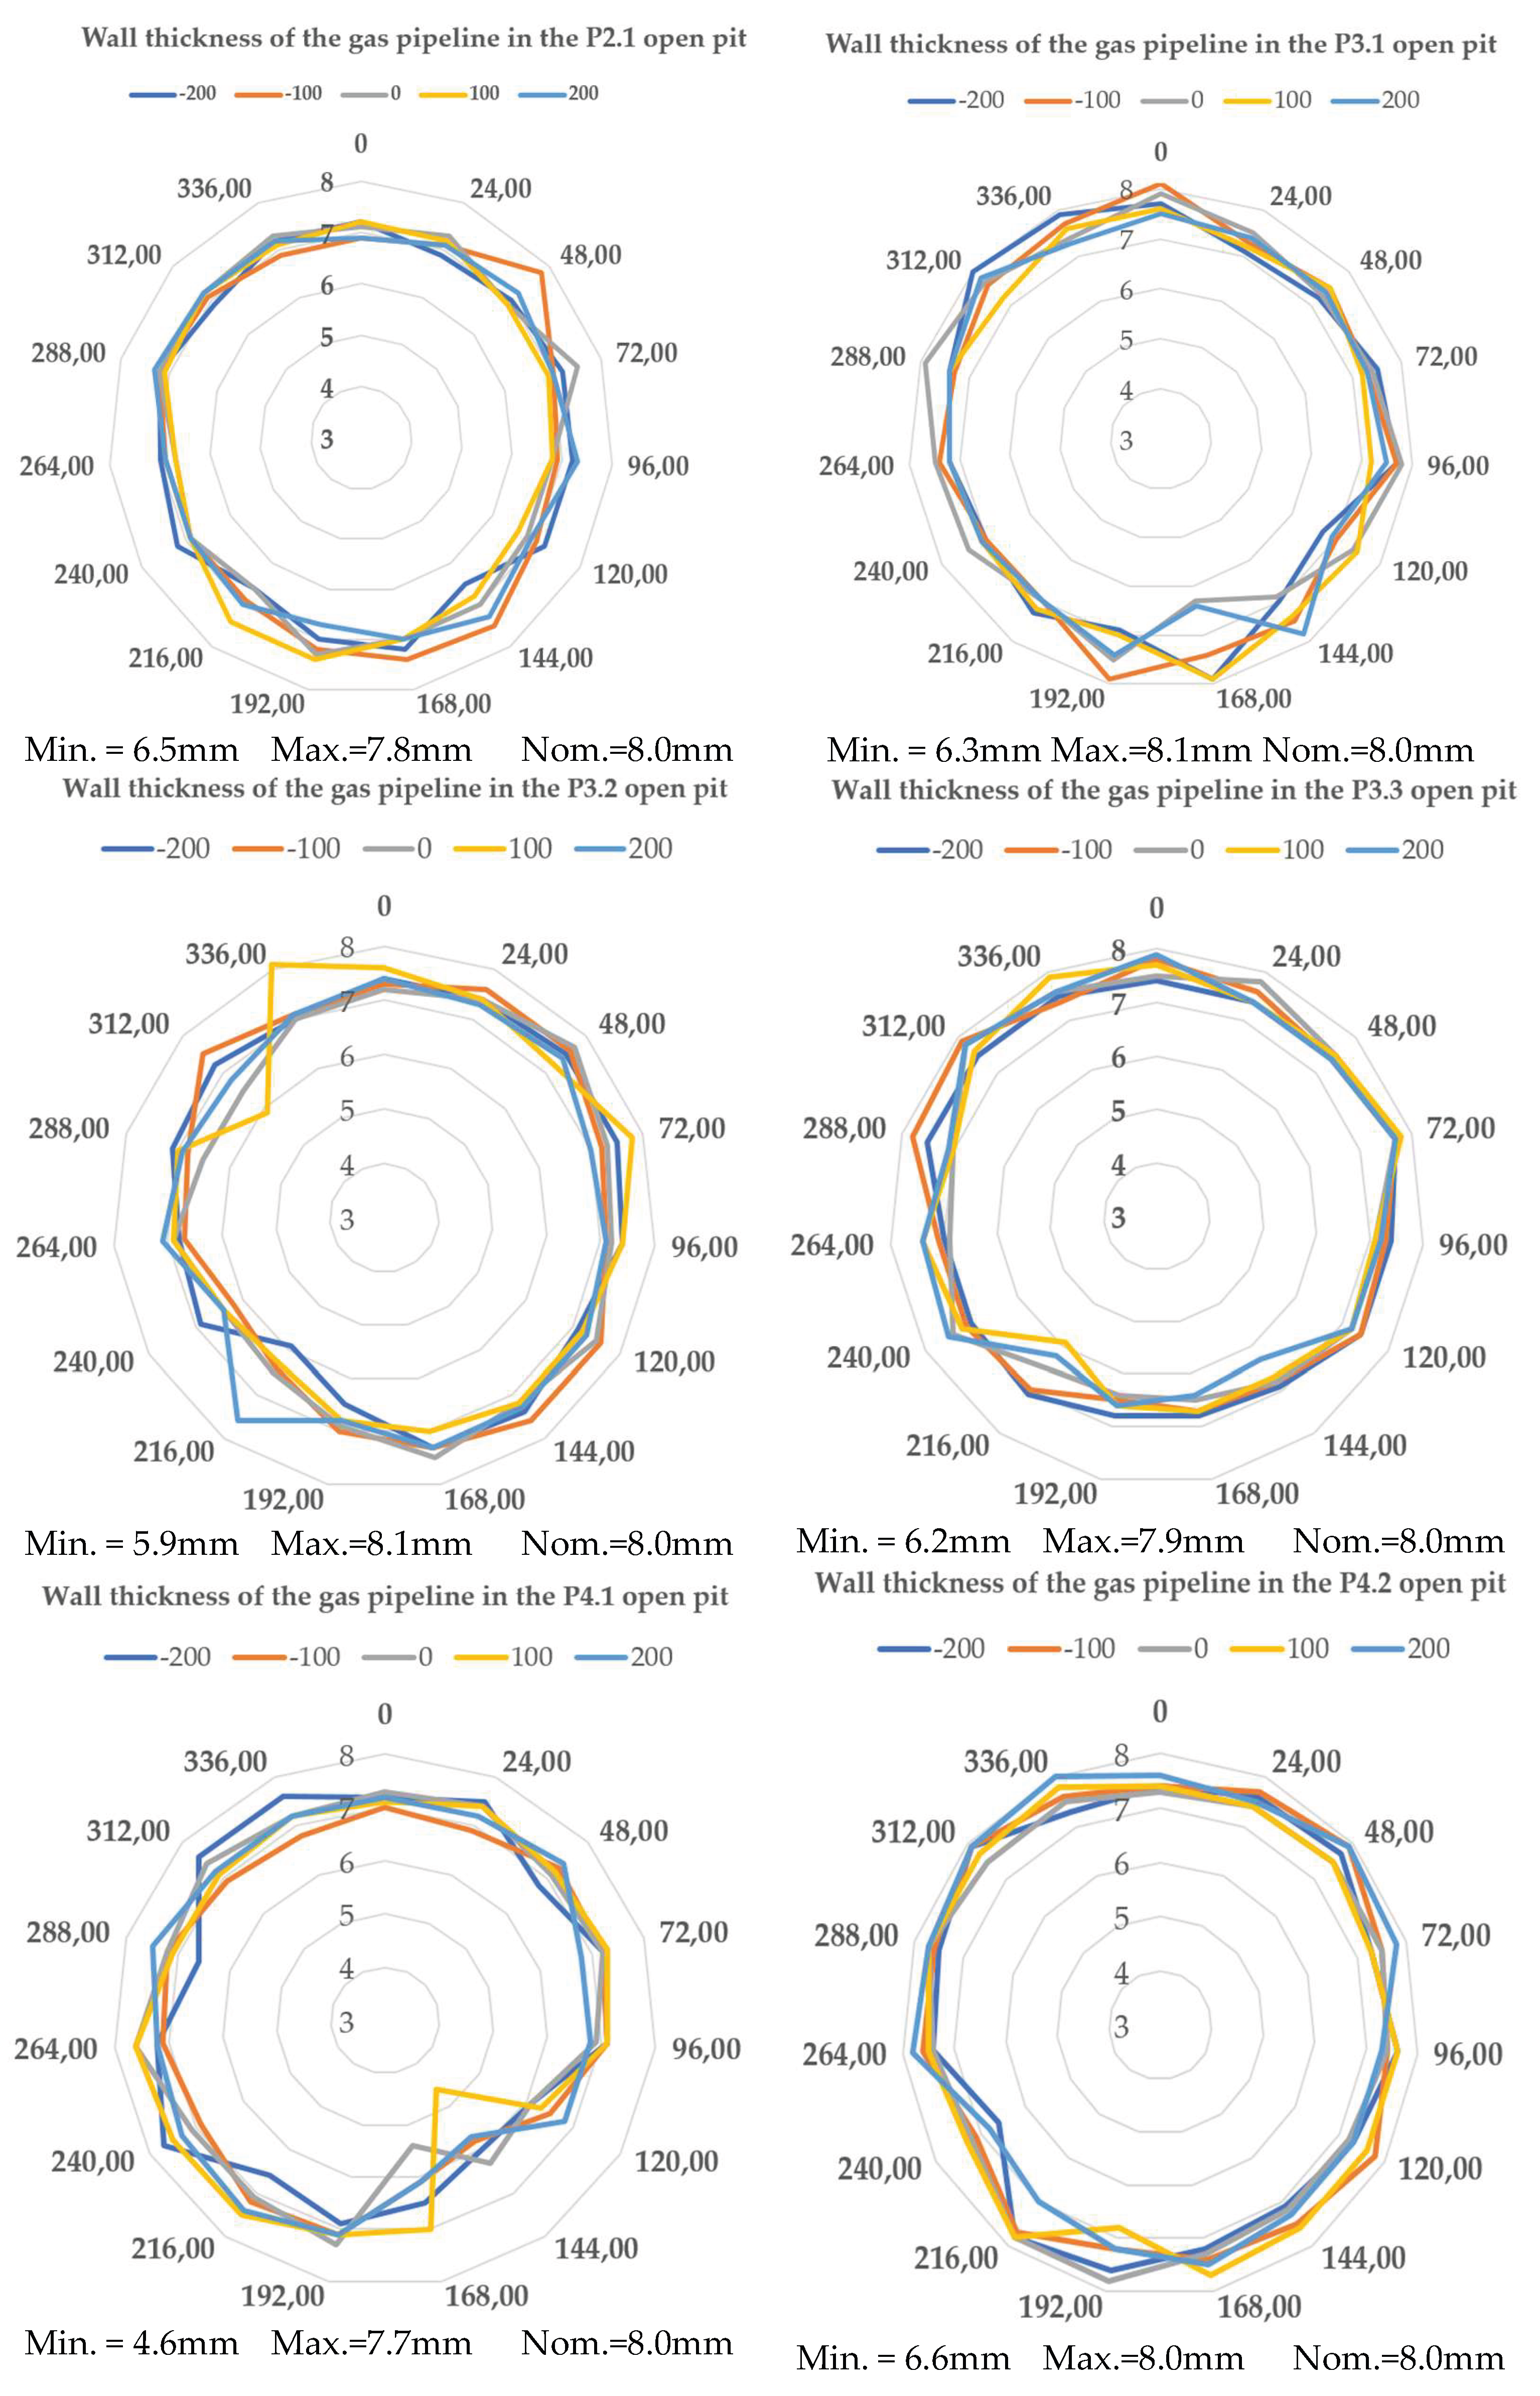

Table 1.
Anomaly classifications, graphical nomenclature, and structural hazard assessment levels.
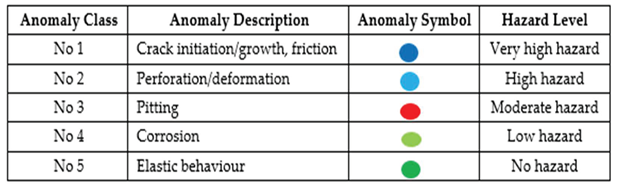 |
Table 2.
Geographical location, material characteristics, and technical designation of the investigated experimental study sections.
Table 2.
Geographical location, material characteristics, and technical designation of the investigated experimental study sections.
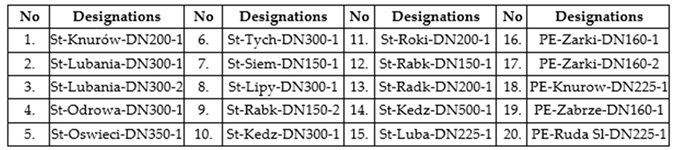 |
Table 3.
Analytical classification matrix of IGNA identified anomalies, graphical symbols, risk codes, and structural hazard priority rankings.
Table 3.
Analytical classification matrix of IGNA identified anomalies, graphical symbols, risk codes, and structural hazard priority rankings.
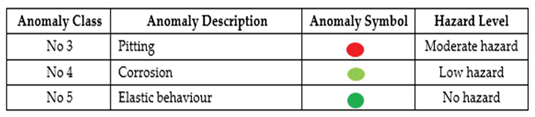 |
Table 4.
Spatial localization coordinates, anomaly typologies, and corresponding hazard levels of the selected validation control points.
Table 4.
Spatial localization coordinates, anomaly typologies, and corresponding hazard levels of the selected validation control points.
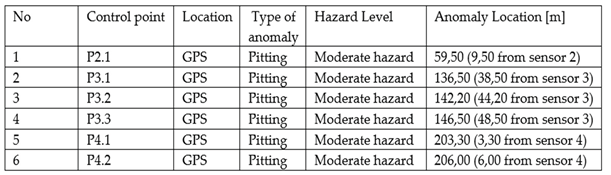 |
Table 5.
Residual pipeline wall thickness parameters evaluated via high-resolution 3D ultrasonic scanning at the designated control points.
Table 5.
Residual pipeline wall thickness parameters evaluated via high-resolution 3D ultrasonic scanning at the designated control points.
 |
Disclaimer/Publisher’s Note: The statements, opinions and data contained in all publications are solely those of the individual author(s) and contributor(s) and not of MDPI and/or the editor(s). MDPI and/or the editor(s) disclaim responsibility for any injury to people or property resulting from any ideas, methods, instructions or products referred to in the content. |
© 2026 by the authors. Licensee MDPI, Basel, Switzerland. This article is an open access article distributed under the terms and conditions of the Creative Commons Attribution (CC BY) license (http://creativecommons.org/licenses/by/4.0/).
Copyright: This open access article is published under a Creative Commons CC BY 4.0 license, which permit the free download, distribution, and reuse, provided that the author and preprint are cited in any reuse.