

Submitted:
31 July 2026
Posted:
03 August 2026
You are already at the latest version
Abstract
Real-time monitoring of volatile organic compounds (VOCs) in adherent cell cultures remains a significant analytical challenge. Current methods are typically limited by invasive sampling, time-consuming enrichment that disrupts the sterile barrier, and a reliance on infrastructure-heavy mass spectrometry. We report a benchtop headspace gas chromatography–ion mobility spectrometry (GC-IMS) approach that overcomes these limitations, enabling continuous, non-invasive volatilomics. By integrating a membrane-based gas dryer for moisture removal, the system continuously samples directly from T75 flasks without compromising the incubation environment. We demonstrated this capability through the time-resolved monitoring of HT-29 cells, CCD-1137Sk fibroblasts, and a co-culture model, successfully capturing dynamic metabolic fluxes of key markers (ethanol, isopropyl alcohol, acetic acid, 1-propanol, acetone, and 2-butanone). To address the compound annotation challenges caused by limited GC-IMS reference libraries, we utilized a dual-platform strategy. A trapped-headspace GC-QMS-IMS system provided tentative annotations, which were mapped to the online GC-IMS data via reduced ion mobility (K0) values and subsequently confirmed using reference substances. This cross-platform mapping strategy establishes a robust analytical workflow for generating cell-line-specific VOC databases. By decoupling near real-time metabolic fingerprinting from complex MS infrastructure, this method facilitates accessible volatile monitoring for standard in vitro applications.
Keywords:
GC-IMS
; cell cultures
; volatilomics
; machine learning
Introduction
Human in vitro cell cultures are broadly used to study cell functions, metabolic pathways, and interactions between different cells. In a research context, cell culture models are used as the first step in drug discovery and safety testing. Over the last years, particularly three-dimensional (3D) cell culture models have gained significant attention in anti-tumor drug testing, as these models might be able to bridge the gap between conventional two-dimensional (2D) cell models and tests based on animal models 1–3. Analytical testing using in vitro cell cultures is often performed by fluorescence microscopy or enzymatic assays, which require either the addition of fluorophores or, in the case of enzymatic assays, the fixation and isolation of cells 4,5. However, approaches for online cell culture monitoring are limited and are based on either live-cell imaging systems or spectroscopic techniques for bioreactor monitoring 6–8. Nearly all routine applications so far focus on the liquid medium with the cells, with all related disadvantages, such as breaking the sterile barrier and/or taking samples. An interesting approach for cell culture monitoring could be the headspace above the medium in the flask, as in particular small, volatile metabolites from the cells should be detectable in the gas phase and could potentially deliver vital information about the status of the cells in the medium. As intriguing as this idea may seem, as complex it is—at least so far in reality. Since the level of VOCs emerging from the cultivated cells strongly depends on the cell count, this poses a limiting factor for the analyst in terms of detection limits of these substances. Typically, the approaches found in literature are mass spectrometry (MS) based. Studies published so far on VOC analysis of cell culture are mainly relying on a combination of enrichment techniques, such as thermal desorption gas chromatography mass spectrometry (TD-GC-MS) or solid phase micro extraction (SPME-GC-MS) 9–11. Although these techniques are established, they suffer from a number of limitations. The first challenge arises during the transfer of the cell culture flask to the GC-MS system, for which the flask has to be removed from the incubator, which potentially could lead to artifacts from inducing stress in the cells. Further, the process of enrichment, e.g. via SPME or in-tube extraction (ITEX) is time consuming and highly prone to detection of background signals, among other from the commonly used polystyrene cell culture flasks 12,13. Lastly, conventional EI-MS based detectors are characterized by a hard ionization process at 70eV, which is a limiting factor for polar or medium polar compounds, leading to extensive fragmentation to unspecific fragment ions and the loss of the molecular ion. Technically complex alternatives are proton transfer reaction mass spectrometry (PTR-MS) and selected ion flow tube mass spectrometry (SIFT-MS), which were demonstrated to be feasible for continuous monitoring without the need for enrichment systems 14–16. However, the disadvantage of nearly all MS-based online monitoring systems is the high instrument cost and demand for infrastructure because these systems operate under vacuum conditions. Together with a system-immanent sensitivity towards shock, temperature and humidity, these systems may not be the most suitable choice for routine environments and furthermore, require specialized personnel.
In this context, the hyphenation of GC and IMS presents a promising alternative. GC-IMS systems have found widespread application across diverse fields, ranging from security to food analysis. These instruments are typically realized as compact benchtop appliances that pair a simple, isothermal GC system with a drift-tube IMS (DTIMS). These systems are operated under atmospheric pressure conditions, which reduces energy consumption and simplifies the system in comparison to MS-based systems, such as quadrupole mass spectrometry (QMS)- or time of flight (TOF)- MS systems that are dependent on vacuum pumps 17,18. Paired with the small footprint of these systems, GC-IMS may be easily used at the point-of-need 19,20.
GC-IMS offers several key advantages over traditional GC- QMS-based techniques for online monitoring of volatile organic compounds (VOCs) from biological samples. One major benefit of this method is its high sensitivity to small, polar to mid-polar compounds 21, which typically allows direct analysis without prior enrichment steps and as such, also an online monitoring of processes via loop sampling or direct inlets. This is mainly the result of the soft ionization process based on 3H, 63Ni, corona discharge, or ultraviolet light ionization. The multi-step process leads to the formation of protomers of the analytes and therefore allows for an efficient, soft ionization of small polar molecules 22,23. This aspect is particularly advantageous for the detection of volatile metabolites, like alcohols, ketones, and organic acids, that are commonly found in human breath or human in vitro cell cultures 24,25.
These aspects make GC-IMS a promising platform for online process monitoring of living systems, as it can be used as a point-of-need analyzer adjacent to the cell culture incubator, without the need to handle cell culture flasks or even breaking the sterile barrier.
A system-immanent disadvantage of GC-IMS in comparison to MS-based approaches is the lower selectivity due to the lack of m/z information and so far, also the lack of available and robust databases for substance identification. One possible approach to overcome this limitation is the simultaneous detection by IMS and MS in one system and the mapping of offline-based GC-MS information towards the GC-IMS data, as described earlier by our group 20,26. One way to address the lower sensitivity of EI-QMS-based MS systems for polar metabolites is the use of an online enrichment strategy on the MS side. Recently, we demonstrated a simultaneous trapped-headspace (THS)-GC-IMS-MS system with a simultaneous detection by MS and IMS, which allowed a tentative annotation of specific VOCs by means of their m/z values and database search 27. The peak matching of MS and IMS data via their retention time (RT)and the subsequent calculation of the reduced mobility K0 should allow a calibration of the simpler and faster online GC-IMS system to assign relevant metabolites and generate RT/K0-databases.
Consequently, this study aimed to establish a method for mapping metabolites annotated via THS-GC-IMS-MS to an online GC-IMS system integrated with a cell culture incubator, enabling near real-time monitoring of volatile metabolites.
Material and Methods
Cell culture samples and materials
HT-29 human colorectal adenocarcinoma cells, CCD-1137Sk human foreskin fibroblasts, and a co-culture consisting of both cell types were used. All cells were maintained in McCoy’s 5a medium (Capricorn, MCC-A) supplemented with 10% fetal bovine serum (FCS) (Capricorn, FBS-12B) and 1% penicillin/streptomycin (Pen/Strep) (Capricorn, PS-B). FBS Xtra (Capricorn, FBS-56B) was used as a defined medium with reduced serum content. Cell cultures were passaged twice a week and seeded at a density of 3 × 10⁶ cells/T75 flask for HT-29 cells and 6 × 10⁶ cells/T75 flask for CCD-1137Sk cells. The seeding density of the co-cultures was 1.5 x 10⁶ HT-29 cells and 3 x 10⁶ CCD-1137Sk cells/T75 flask (Greiner Bio-One; PS; 658 175). Media were replaced every three days. Cell cultures were analyzed from day 3 to 6 after cell seeding. During the period between measurements, the cell culture flasks were incubated at 37 °C and 5% CO2 (Thermo Electron Corporation, HERA cell® 150).
Reagents and instrumentation
Reference chemicals such as propanone, 2-butanone, ethanol, 1-propanol, acetic acid (Sigma-Aldrich, Taufkirchen, Germany), 2-pentanone, 2-hexanone, 2-heptanone, 2-octanone, 2-nonanone, and 2-decanone (Thermo Fisher Scientific, Dreieich, Germany) were obtained at a purity of at least 95%. The reference substances were diluted in water (Milli-Q, Merck Millipore) to the specified concentration.
Instrumentation for online monitoring of cell cultures
For direct VOC analysis, the vented cap of the cell culture flask was removed under a biosafety hood (Biosafety Cabinet Class II, Nuaire, Fernwald, Germany) and replaced with a conical silicone plug (diameter 27–21 mm) using two metal blunt needle syringes (Sterican blunt needle 18G, B. Braun, Melsungen, Germany), serving as inlet and outlet. To reduce the risk of contamination, all materials that might come into contact with the cell culture were sterilized in an autoclave (Systec V-150, Systec GmbH & Co. KG, Linden, Germany). The flask was connected to a mass flow controller (Vögtlin Instruments GmbH, Muttenz, Switzerland) and subjected to a constant gas flow of synthetic air (50 mL/min). The analyte gas stream was passed through a membrane separator (Genie®170, A+ Corporation, Gonzales, United States) to remove excess moisture prior to injection into GC-IMS (GC-IMS, G.A.S. mbH, Dortmund, Germany). The GC-IMS instrument was equipped with an MXT-WAX (Restek GmbH, Bad Homburg, Deutschland) polar column (15 m length x 0.53 mm ID x 1 µm film thickness) and a 100% crossbond Carbowax polyethylene glycol stationary phase. The temperature of the sample loop and column oven was set to 45 °C and the IMS drift tube was operated at 70 °C. The IMS drift tube had a length of 5.3 cm, and the drift voltage was set to 2132 V. Analyte ionization was facilitated by an 3H ionization source with 100 MBq β-emission. Nitrogen with a purity of 99.9999% was used as the drift and carrier gas for the chromatographic column. The drift gas flow was set to 150 mL/min, while the carrier gas stream was operated with a variable flow program starting at 2 mL/min for 20 s and ramping to 5 mL/min over the course of 9.7 min. Finally, the flow rate was increased to 10 mL/min over a time interval of 5 min, resulting in a total program run time of 15 min.
THS-GC-QMS-IMS system for tentative identification of cell culture metabolites
1 mL of media from HT-29 cells after six days of incubation was removed from the cell culture flask and transferred to a 20 mL headspace vial. The HS-GC-QMS-IMS system was previously reported by our group 27. Deviating method parameters will be explained in this section. The HS-20 headspace sampler (Shimadzu Corporation, Kyoto, Japan) was set at 50 °C. The transfer and sample lines were operated at 150 °C. The trap desorption temperature was set to 220 °C and the trap material was Tenax TA (Shimadzu Corporation, Kyoto, Japan). The equilibrium temperature was set to 25 °C, with a cooling temperature of -10 °C and five multi-injection counts. Chromatographic separation was performed with a Nexis™ GC-2030 (Shimadzu Corporation, Kyoto, Japan) equipped with a polar VF-23ms (Agilent Technologies, Waldbronn) 30 m length x 0.25 mm ID x 0.25 µm film thickness, cyanopropyl low-bleed phase. The oven program started at 40 °C for 2 min, followed by a temperature ramp of 4 °C/min to 80 °C, 6 °C/min to 140 °C, and 10 °C/min to 200 °C then holding for 2 min, resulting in a total program run time of 30 min. The IMS drift tube had a length of 5.3 cm and was set to a temperature of 140 °C.
Data analysis and preprocessing
MS data were processed using GCMSsolutions 4.53 (Shimadzu Corporation, Kyoto, Japan), and tentative substance identification was performed by spectral matching with the NIST Mass Spectral Library 23 NIST (Gaithersburg, MD, USA). To compare the MS and IMS spectra total ion current (TIC) was integrated, and the RT at the peak maximum was compared to the corresponding IMS spectrum. The peak maximum position in the drift time dimension of the IMS was then used to calculate the respective K0 to compare the system with GC-IMS for direct cell culture analysis. The GC-IMS spectra used for direct cell culture analysis were processed using Python version 3.12.4. The corresponding workflow is described in the following section.
The gc-ims-tools package (version 0.1.10) was used for preprocessing, data visualization, and multivariate analysis of GC-IMS spectra 28. First, the raw data files were imported and organized into a dataset annotated with corresponding group and sample labels. To reduce data dimensionality and facilitate further analysis, binning by a factor of two was applied to the dataset. This was followed by alignment of the drift time dimension and normalization to the reactant ion peak (RIP). Drift time alignment was used to correct for minor fluctuations in atmospheric pressure and ambient temperature between measurement days. To compensate for static shifts caused by time fluctuations in the switching valve, the retention time axis was aligned to a reference signal identified via a threshold-based peak detection algorithm. The spectra were cropped to a region of interest of 120–880 s in the retention time axis and 1.025–1.5 in the relative drift time axis. Background drift was removed using Asymmetric Least Squares (AsLS) baseline correction. Finally, mean centering and Pareto scaling were applied. Pareto scaling was selected to avoid the noise amplification artifacts associated with autoscaling on AsLS-corrected baselines.
Calculation of reduced ion mobility K0
The ion mobility K is a characteristic parameter in IMS and can be calculated accurately under low field conditions by the Mason-Schamp equation 29. Low-field ion mobility conditions are typically present in electrical fields between 2 and 10 Townsend (Td), where Td is defined as the ratio E/N, with E as the electric field and N as the concentration of neutral particles 30. To facilitate comparability between low-field ion mobility systems, the reduced ion mobility (K0) was calculated using Eq. (1), where L is the length of the drift tube in cm, td denotes the drift time in seconds, Ud is the drift voltage in Volts, and T and p are the actual temperature and pressure inside the drift tube, respectively.
Changes in neutral gas molecule concentration due to temperature and pressure fluctuations are compensated for by normalizing to the standard values p0 = 1013.25 hPa and T0 = 273.15 K 31,32.
Results and Discussion
Overall, the use of GC-IMS in fields outside of the food realm is still limited. In previous publications, GC-IMS was used for process control and contamination detection of microbial organisms 33–35. In the context of human samples, the use of GC-IMS has primarily focused on breath monitoring for cancer diagnosis 36–38. To the best of our knowledge, monitoring of human in vitro cell cultures with GC-IMS has not been reported before. One of the reasons might be the challenging environment for online cell culture sampling and the plethora of sources of interference from the cell flask, cell culture media, residual moisture, as well as the inherent difficulty of adapting the cell culture flask to the GC-IMS while maintaining sterility 13.
Removal of moisture from the gas stream with a benchtop setup
One crucial step regarding the direct headspace analysis is the removal of moisture from the gas stream which was realized by a Genie®170 (A+ Corporation, LLC Gonzales, United States) membrane separator. The filter was placed outside the incubator, directly upstream of the GC-IMS instrument, as shown in Figure 1.
One primary concern associated with the use of the Genie® filter is the potential loss of analytes due to interaction with the membrane. To assess this effect, a homologous series of ketones was analyzed with and without the Genie® filter in place. The comparison of both spectra (Figure 2a with the Genie® filter and Figure 2b with a standard syringe filter) indicates that the analyte loss due to the use of the Genie® filter is less critical, as a reduction of less than 20% in signal intensity was observed when the Genie® filter was employed. This decrease was likely attributable to the flow splitting between the outlet and the bypass within the membrane separator.
Separation of HT-29, CCD-1137Sk and a co-culture based on the incubation time
The aim of this experiment was to investigate whether online GC-IMS can differentiate cell cultures based on their incubation time and to assess potential differences between individual cell lines and a co-culture model. Mono- and co-cultures of HT-29 and CCD-1137Sk were seeded three days prior to analysis, and measurements were started after a medium exchange. The headspace fraction of the cell cultures was analyzed online for 45 minutes on each of days (day1– day4), in 24-hour intervals. For each condition (HT-29, CCD-1137Sk, and co-culture), three biological replicates were prepared, and each biological replicate was measured in technical triplicate, resulting in three consecutive 15-minute measurements per flask. Control samples consisting of growth medium without cells were processed identically, with two biological replicates and three technical replicates measured at each 24-hour time point over the four-day period.
To avoid selection bias, all cell cultures were analyzed in a random order. The spectra were preprocessed as described before and principal component analysis (PCA) was performed on the whole dataset. PC1 and PC2 explain 61,43% of the total variance of the data and the scores plot is shown in Figure 3a.
The PCA scores plot (Figure 3a) shows a clear trend along PC1 and PC2, where data points from longer cultivation times progressively shift toward positive score values on PC1 and negative score values on PC2. This indicates a time-dependent variation in the measured VOC profiles, suggesting that the main source of variance among samples was related to cell proliferation. In addition, samples from day 3 and day 4 cluster closely together in the lower right quadrant, indicating limited separation between these time points. This likely reflected that cultures have reached maximum cell density, where growth becomes space-limited and the VOC profile approaches a saturation state. Differences between cell lines were not apparent, as neither CCD-1137Sk nor HT-29 cultures exhibited unique volatile compounds captured by the online GC-IMS system. A comparison of spectra from both cell lines is provided in the Supporting Information (Figure S1).
To further investigate the contribution of individual signals to the observed variance, the loadings were back-projected onto the original GC-IMS data space and visualized as a two-dimensional heatmap (Figure 3b). The loadings plot highlights three distinct signals (S1, S2, S3) with high positive loadings and two signals (S4 and S5) with a strong negative loading value, indicating that these features predominantly drive the variation along PC1. Since PC1 correlates closely with cultivation time, signals S1–S3 likely increase during cell growth, whereas S4 and S5 decrease. These key signals were therefore selected for further analysis.
Annotation of metabolite signals by THS-GC-QMS-IMS and mapping to online GC-IMS
To obtain further insights into the volatile metabolites exhibited by the HT-29 cell lines, a prototypic THS-GC-QMS-IMS system was used. The advantage of this system lies in the simultaneous acquisition of mass spectra and ion mobility spectra along a common RT axis, enabling direct matching of IMS peaks with their corresponding MS signals for tentative compound annotation. Figure 4 illustrates this alignment, showing the TIC from MS alongside the IMS spectrum. Peaks highlighted in yellow denote tentatively identified substances, with “#” indicating dimeric species. Annotations were performed using the NIST23 EI mass spectral library. The corresponding compounds together with their match factors are summarized in the Supporting information (Table S2).
To transfer this information to the online GC-IMS system, K0 values were calculated according to Eq. 1. Substances were then assigned in the online system based on agreement of K₀ values and similarity in peak morphology. The peaks corresponding to styrene (7), and N,N-dimethylacetamide (8) were not detected in the online GC-IMS. The absence of styrene and N,N-dimethylacetamide were likely attributable to the lack of enrichment and the limited ionization efficiency of IMS for non-polar analytes. All substances successfully matched in the online GC-IMS system are reported in Table 1.
The substances tentatively identified with the THS-GC-QMS-IMS system and matched to the Online GC-IMS data are summarized in Table 1, including their respective K₀ values. Building on the continuous Online monitoring results, the offline THS platform served as a reference system to assign tentatively chemical identities to the most prominent signals. The bar graphs in Figure 5 and Figure 6 illustrate how these annotated compounds—ethanol, acetic acid, isopropyl alcohol, 1-propanol, acetone and 2-butanone—evolved over the four-day cultivation period in the Online GC-IMS system. This combined strategy highlights the complementary roles of both instruments: Online GC-IMS enables dynamic, real-time profiling of VOCs, while the offline THS-GC-QMS-IMS provides the chemical specificity necessary for tentative compound identification.
Verification with reference substances
To achieve a higher level of confidence, reference substances were procured for all six annotated substances listed in Table 1. The compounds were diluted in water to a specific target concentration (Table 2) and measured with the same settings as the cell cultures. The RT and K0 values are given with the absolute deviation to the measured peaks in [s] or [cm2/V*s] respectively.
Net metabolic flux analysis of identified VOCs
The six VOCs identified with reference substances (Table 2) were tracked over four cultivation days. Background-subtracted data (n=9 replicates) reveals net metabolic fluxes, allowing for the differentiation between cellular production and consumption.
Primary metabolite excretion and stress markers
The analysis reveals distinct metabolic behaviors tied to the physiological state of the cell cultures. As shown in Figure 5, acetic acid and ethanol display pronounced, biphasic accumulation trends. Acetic acid emission is characterized by a rapid accumulation between days one and two, followed by a distinct stabilization and plateau. This initial surge is consistent with active cellular metabolism during the exponential growth phase, particularly the oxidation of higher aldehydes catalyzed by aldehyde dehydrogenases 39. The abrupt plateau by day three likely indicates a transition into a stationary growth phase, where contact inhibition and the gradual depletion of primary metabolic precursors limit further acetic acid excretion.
Ethanol levels exhibit a nearly identical dynamic (Figure 5). While ethanol production in mammalian cells can sometimes be attributed to exogenous factors like sterilization residues 40, the background-subtracted data here demonstrates active endogenous production. This aligns with observations in various cell lines where ethanol arises from the reduction of hydroperoxides generated during lipid peroxidation under in vitro stress conditions, previously reported by Filipiak et al. 25,41 and Hakim et al. 42 for lung cancer cells.
Metabolic Scavenging and Nutrient Depletion
In contrast to the accumulating metabolites, a separate subset of VOCs demonstrates dynamic cellular uptake and metabolic switching (Figure 6). 1-Propanol exhibits a consistent decrease across the cultivation period, suggesting active cellular uptake. In mammalian cell cultures, short-chain alcohols and aldehydes are frequently scavenged from the microenvironment and metabolized by cellular dehydrogenases, serving as alternative carbon sources or detoxifying agents as primary nutrients in the media begin to deplete 43.
A similar consumption trend is observed for isopropyl alcohol. While the monomeric signal of isopropyl alcohol appears to increase over time, the dimer signal concurrently decreases. This inverse behavior is a well-documented behavior of the atmospheric pressure chemical ionization (APCI) mechanism inherent to GC-IMS, particularly when utilizing -emitting sources ( or ) 44. In the ionization region, a reaction cascade in the drift gas generates predominant proton-water clusters, , which serve as reactant ions. Analyte molecules (M) entering this region are ionized via proton transfer from these reactant ions, forming hydrated monomeric ions, . At elevated analyte concentrations, these monomers undergo subsequent ion-molecule collisions with neutral analyte molecules to form stable, proton-bound dimers, 23. As the absolute concentration of isopropyl alcohol in the headspace decreases due to active cellular uptake, the concentration-dependent ionization equilibrium shifts backward. Consequently, the signal of the dominant dimer species decreases, while the monomer signal increases. However, when evaluating the total sum of both monomer and dimer ion intensity, the signal strictly decreases, confirming active cellular scavenging.
Furthermore, 2-butanone demonstrates a highly dynamic profile: net production peaks during the initial growth phase, followed by a distinct shift toward net consumption by day four. This transition likely reflects a metabolic switch from fatty acid oxidation to the secondary utilization of these exuded metabolites as energy substrates via the citric acid cycle as nutrient availability decreases 45. The ability of the benchtop GC-IMS to capture this bidirectional metabolic flux demonstrates its viability not merely as a static detector, but as a real-time monitor for phase-transitioning in biomanufacturing and drug testing contexts.
Conclusion
This study establishes a successful proof-of-concept for the continuous, non-invasive metabolic profiling of mammalian cell cultures using benchtop GC-IMS. By integrating a membrane-based gas dryer to mitigate incubator moisture interference, we present a robust workflow capable of tracking dynamic metabolic fluxes in near real-time. Crucially, this approach preserves the sterile incubation barrier while eliminating the need for sample enrichment or continuous reliance on infrastructure-heavy mass spectrometry at the point of need.
Although the annotated metabolites represent a subset of the total volatilome, they successfully captured critical biological phase transitions. The time-resolved monitoring of key markers (acetic acid, ethanol, 1-propanol, and 2-butanone) reflected exponential cell proliferation and metabolic switching driven by nutrient depletion. Furthermore, the implementation of a cross-platform peak-mapping strategy effectively bypasses the inherent reference library limitations of GC-IMS. This provides a practical framework to narrow down the number of molecules for the following identification with reference substances. This might prove useful for the generation of cell-line specific VOC databases at a later stage.
Despite these bioanalytical advancements, certain limitations must be acknowledged. Standard submerged cell cultures inherently act as a mass-transfer barrier, potentially obscuring highly volatile or less soluble compounds of biological origin. Furthermore, enrichment and partitioning effects within the liquid media can introduce a time-dependent lag between the actual metabolic stage of the cells and the detection of the analyzed volatiles in the headspace. Conversely, a distinct analytical advantage of this online setup is the mitigation of common background interferences. Artifacts such as styrene emissions from polystyrene cell culture flasks or signals resulting from SPME fiber degradation are significantly less pronounced, owing to the specific atmospheric pressure chemical ionization mechanism and the absence of enrichment phases in the GC-IMS workflow.
Because the captured part of the baseline volatilome may lack the specificity to differentiate the studied cell phenotypes (HT-29 and CCD-1137Sk), future research should focus on characterizing volatile profiles under varied cultivation conditions and targeted environmental perturbations. Introducing metabolic pathway inhibitors (e.g., 2-deoxy-D-glucose) to artificially force metabolic divergence, or exposing cells to environmental toxins, and drug treatments, will better capture condition-specific metabolic responses 46,47.
Ultimately, this work provides an analytical framework for deploying GC-IMS as a dynamic, real-time metabolic sensor, presenting a low-infrastructure benchtop tool for bioprocess control, in vitro toxicology, and drug discovery.
Use of Artificial intelligence tools
Artificial intelligence tools were utilized to assist in the preparation of this manuscript. Base visual assets for Figure 1 (GC-IMS instrument, cell flask, Genie filter and MFC) were generated using Gemini Thinking 3 Pro. Subsequent editing and corrections (Figure 1) were done using Canva Affinity. Furthermore, Gemini Thinking 3.1 Pro and ChatGPT 5.2 were employed to improve language, style and readability of specific text sections. The authors carefully verified all AI-assisted outputs and take full responsibility for the scientific correctness of the entire publication.
Supplementary Materials
The following supporting information can be downloaded at the website of this paper posted on Preprints.org, Figure S1 Comparison of spectra of HT-29 and CCD-1137Sk cell lines. Table S2 All substances tentatively identified in the THS-GC-QMS-IMS system.
Author Contributions
The manuscript was written through contributions of all authors. / All authors have given approval to the final version of the manuscript.
Acknowledgments
PW And RR were funded by DFG grant INST-874/9. RF was a fellow of the collaborative research training group “Perpharmance”, funded by the Ministry of Science, Research and Arts of Baden-Württemberg.
References
- Badr-Eldin, S. M.; Aldawsari, H. M.; Kotta, S.; Deb, P. K.; Venugopala, K. N. Three-Dimensional In Vitro Cell Culture Models for Efficient Drug Discovery: Progress So Far and Future Prospects. Pharmaceuticals 2022, 15(8), 926. [Google Scholar] [CrossRef]
- Edmondson, R.; Broglie, J. J.; Adcock, A. F.; Yang, L. Three-Dimensional Cell Culture Systems and Their Applications in Drug Discovery and Cell-Based Biosensors. ASSAY. Drug Dev. Technol. 2014, 12(4), 207–218. [Google Scholar] [CrossRef] [PubMed]
- Lovitt, C. J.; Shelper, T. B.; Avery, V. M. Cancer Drug Discovery: Recent Innovative Approaches to Tumor Modeling. Expert Opin. Drug Discov. 2016, 11(9), 885–894. [Google Scholar] [CrossRef] [PubMed]
- Balss, J.; Pusch, S.; Beck, A.-C.; Herold-Mende, C.; Krämer, A.; Thiede, C.; Buckel, W.; Langhans, C.-D.; Okun, J. G.; Von Deimling, A. Enzymatic Assay for Quantitative Analysis of (d)-2-Hydroxyglutarate. Acta Neuropathol. 2012, 124(6), 883–891. [Google Scholar] [CrossRef] [PubMed]
- Lichtman, J. W.; Conchello, J.-A. Fluorescence Microscopy. Nat. Methods 2005, 2(12), 910–919. [Google Scholar] [CrossRef] [PubMed]
- Cole, R. Live-Cell Imaging: The Cell’s Perspective. Cell Adhes. Migr. 2014, 8(5), 452–459. [Google Scholar] [CrossRef] [PubMed]
- Claßen, J.; Aupert, F.; Reardon, K. F.; Solle, D.; Scheper, T. Spectroscopic Sensors for In-Line Bioprocess Monitoring in Research and Pharmaceutical Industrial Application. Anal. Bioanal. Chem. 2017, 409(3), 651–666. [Google Scholar] [CrossRef] [PubMed]
- Lourenço, N. D.; Lopes, J. A.; Almeida, C. F.; Sarraguça, M. C.; Pinheiro, H. M. Bioreactor Monitoring with Spectroscopy and Chemometrics: A Review. Anal. Bioanal. Chem. 2012, 404(4), 1211–1237. [Google Scholar] [CrossRef] [PubMed]
- Baranska, A.; Smolinska, A.; Boots, A. W.; Dallinga, J. W.; van Schooten, F. J. Dynamic Collection and Analysis of Volatile Organic Compounds from the Headspace of Cell Cultures. J. Breath Res. 2015, 9(4), 047102. [Google Scholar] [CrossRef] [PubMed]
- Eckert, K. E.; Carter, D. O.; Perrault, K. A. Sampling Dynamics for Volatile Organic Compounds Using Headspace Solid-Phase Microextraction Arrow for Microbiological Samples. Separations 2018, 5(3), 45. [Google Scholar] [CrossRef]
- Acevedo, C. A.; Sanchez, E. Y.; Reyes, J. G.; Young, M. E. Volatile Profiles of Human Skin Cell Cultures in Different Degrees of Senescence. J. Chromatogr. B 2010, 878(3), 449–455. [Google Scholar] [CrossRef] [PubMed]
- Chu, Y.; Zhou, J.; Ge, D.; Lu, Y.; Zou, X.; Xia, L.; Huang, C.; Shen, C.; Chu, Y. Variable VOCs in Plastic Culture Flasks and Their Potential Impact on Cell Volatile Biomarkers. Anal. Bioanal. Chem. 2020, 412(22), 5397–5408. [Google Scholar] [CrossRef] [PubMed]
- Schallschmidt, K.; Becker, R.; Jung, C.; Rolff, J.; Fichtner, I.; Nehls, I. Investigation of Cell Culture Volatilomes Using Solid Phase Micro Extraction: Options and Pitfalls Exemplified with Adenocarcinoma Cell Lines. J. Chromatogr. B Anal. Technol. BioMed Life Sci. 2015, 1006, 158–166. [Google Scholar] [CrossRef] [PubMed]
- Chippendale, T. W. E.; Hu, B.; El Haj, A. J.; Smith, D. A Study of Enzymatic Activity in Cell Cultures via the Analysis of Volatile Biomarkers. Analyst 2012, 137(20), 4677. [Google Scholar] [CrossRef] [PubMed]
- Bajtarevic, A.; Ager, C.; Pienz, M.; Klieber, M.; Schwarz, K.; Ligor, M.; Ligor, T.; Filipiak, W.; Denz, H.; Fiegl, M.; Hilbe, W.; Weiss, W.; Lukas, P.; Jamnig, H.; Hackl, M.; Haidenberger, A.; Buszewski, B.; Miekisch, W.; Schubert, J.; Amann, A. Noninvasive Detection of Lung Cancer by Analysis of Exhaled Breath. BMC Cancer 2009, 9, 348. [Google Scholar] [CrossRef] [PubMed]
- Schmidberger, T.; Gutmann, R.; Bayer, K.; Kronthaler, J.; Huber, R. Advanced Online Monitoring of Cell Culture Off-Gas Using Proton Transfer Reaction Mass Spectrometry. Biotechnol. Prog. 2014, 30(2), 496–504. [Google Scholar] [CrossRef] [PubMed]
- Christmann, J.; Weber, M.; Rohn, S.; Weller, P. Nontargeted Volatile Metabolite Screening and Microbial Contamination Detection in Fermentation Processes by Headspace GC-IMS. Anal. Chem. 2024. [Google Scholar] [CrossRef] [PubMed]
- Lu, Y.; Zeng, L.; Li, M.; Yan, B.; Gao, D.; Zhou, B.; Lu, W.; He, Q. Use of GC-IMS for Detection of Volatile Organic Compounds to Identify Mixed Bacterial Culture Medium. AMB Express 2022, 12(1), 31. [Google Scholar] [CrossRef] [PubMed]
- Hernández-Mesa, M.; Ropartz, D.; García-Campaña, A. M.; Rogniaux, H.; Dervilly-Pinel, G.; Le Bizec, B. Ion Mobility Spectrometry in Food Analysis: Principles, Current Applications and Future Trends. Molecules 2019, 24(15). [Google Scholar] [CrossRef] [PubMed]
- Brendel, R.; Schwolow, S.; Rohn, S.; Weller, P. Volatilomic Profiling of Citrus Juices by Dual-Detection HS-GC-MS-IMS and Machine Learning-An Alternative Authentication Approach. J. Agric. Food Chem. 2021, 69(5), 1727–1738. [Google Scholar] [CrossRef] [PubMed]
- Capitain, C.; Weller, P. Non-Targeted Screening Approaches for Profiling of Volatile Organic Compounds Based on Gas Chromatography-Ion Mobility Spectroscopy (GC-IMS) and Machine Learning. Molecules 2021, 26(18), 5457. [Google Scholar] [CrossRef] [PubMed]
- Parastar, H.; Weller, P. Towards Greener Volatilomics: Is GC-IMS the New Swiss Army Knife of Gas Phase Analysis? TrAC Trends Anal. Chem. 2024, 170, 117438. [Google Scholar] [CrossRef]
- Borsdorf, H.; Eiceman, G. A. Ion Mobility Spectrometry: Principles and Applications. Appl. Spectrosc. Rev. 2006, 41(4), 323–375. [Google Scholar] [CrossRef]
- Rudnicka, J.; Kowalkowski, T.; Buszewski, B. Searching for Selected VOCs in Human Breath Samples as Potential Markers of Lung Cancer. Lung Cancer 2019, 135, 123–129. [Google Scholar] [CrossRef] [PubMed]
- Filipiak, W.; Mochalski, P.; Filipiak, A.; Ager, C.; Cumeras, R.; Davis, C. E.; Agapiou, A.; Unterkofler, K.; Troppmair, J. A Compendium of Volatile Organic Compounds (VOCs) Released By Human Cell Lines. Curr. Med. Chem. 2016, 23(20), 2112–2131. [Google Scholar] [CrossRef] [PubMed]
- Brendel, R.; Schwolow, S.; Rohn, S.; Weller, P. Gas-Phase Volatilomic Approaches for Quality Control of Brewing Hops Based on Simultaneous GC-MS-IMS and Machine Learning. Anal. Bioanal. Chem. 2020, 412(26), 7085–7097. [Google Scholar] [CrossRef] [PubMed]
- Bodenbender, L.; Rohn, S.; Sauer, S.; Jungen, M.; Weller, P. Chiral Trapped-Headspace GC-QMS-IMS: Boosting Untargeted Benchtop Volatilomics to the Next Level. Chemosensors 2024, 12(8), 165. [Google Scholar] [CrossRef]
- Christmann, J.; Rohn, S.; Weller, P. Gc-Ims-Tools—A New Python Package for Chemometric Analysis of GC–IMS Data. Food Chem. 2022, 394, 133476. [Google Scholar] [CrossRef] [PubMed]
- Mason, E. A.; Schamp, H. W. Mobility of Gaseous Lons in Weak Electric Fields. Ann. Phys. 1958, 4(3), 233–270. [Google Scholar] [CrossRef]
- Yousef, A.; Shrestha, S.; Viehland, L. A.; Lee, E. P. F.; Gray, B. R.; Ayles, V. L.; Wright, T. G.; Breckenridge, W. H. Interaction Potentials and Transport Properties of Coinage Metal Cations in Rare Gases. J. Chem. Phys. 2007, 127(15), 154309. [Google Scholar] [CrossRef] [PubMed]
- Ahrens, A.; Zimmermann, S. Towards a Hand-Held, Fast, and Sensitive Gas Chromatograph-Ion Mobility Spectrometer for Detecting Volatile Compounds. Anal. Bioanal. Chem. 2021, 413(4), 1009–1016. [Google Scholar] [CrossRef] [PubMed]
- Vautz, W.; Bödeker, B.; Baumbach, J. I.; Bader, S.; Westhoff, M.; Perl, T. An Implementable Approach to Obtain Reproducible Reduced Ion Mobility. Int. J. Ion. Mobil. Spec. 2009, 12(2), 47–57. [Google Scholar] [CrossRef]
- Christmann, J.; Weber, M.; Rohn, S.; Weller, P. Nontargeted Volatile Metabolite Screening and Microbial Contamination Detection in Fermentation Processes by Headspace GC-IMS. Anal. Chem. 2024, 96(9), 3794–3801. [Google Scholar] [CrossRef] [PubMed]
- Wang, Z.; Hao, W.; Wang, J.; Wang, Y.; Zeng, X.; Huang, M.; Wu, J.; Sun, B. Using GC-O-MS, GC-IMS, and Chemometrics to Investigate Flavor Component Succession Regularity in the Niulanshan Erguotou Baijiu Brewing Process. Food Chem. X 2024, 22, 101353. [Google Scholar] [CrossRef] [PubMed]
- Langejuergen, J.; Wagner, C.; Beutel, S.; Hopmeier, T.; Scheper, T.; Zimmermann, S. Non-Invasive Monitoring of Bacterial Growth and Auto-Induced Protein Production in a Bioreactor with a Closed-Loop GC-IMS. Int. J. Ion. Mobil. Spectrom. 2015, 18(1–2), 9–15. [Google Scholar] [CrossRef]
- Mochalski, P.; Wiesenhofer, H.; Allers, M.; Zimmermann, S.; Güntner, A. T.; Pineau, N. J.; Lederer, W.; Agapiou, A.; Mayhew, C. A.; Ruzsanyi, V. Monitoring of Selected Skin- and Breath-Borne Volatile Organic Compounds Emitted from the Human Body Using Gas Chromatography Ion Mobility Spectrometry (GC-IMS). J. Chromatogr. B Anal. Technol. BioMed Life Sci. 2018, 1076, 29–34. [Google Scholar] [CrossRef] [PubMed]
- Ruzsanyi, V.; Mochalski, P.; Schmid, A.; Wiesenhofer, H.; Klieber, M.; Hinterhuber, H.; Amann, A. Ion Mobility Spectrometry for Detection of Skin Volatiles. J. Chromatogr. B Anal. Technol. BioMed Life Sci. 2012, 911, 84–92. [Google Scholar] [CrossRef] [PubMed]
- Czippelová, B.; Nováková, S.; Šarlinová, M.; Baranovičová, E.; Urbanová, A.; Turianiková, Z.; Krohová, J. Č.; Halašová, E.; Škovierová, H. Impact of Breath Sample Collection Method and Length of Storage of Breath Samples in Tedlar Bags on the Level of Selected Volatiles Assessed Using Gas Chromatography-Ion Mobility Spectrometry (GC-IMS). J. Breath Res. 2024, 18(3). [Google Scholar] [CrossRef] [PubMed]
- Marchitti, S. A.; Brocker, C.; Stagos, D.; Vasiliou, V. Non-P450 Aldehyde Oxidizing Enzymes: The Aldehyde Dehydrogenase Superfamily. Expert Opin. Drug Metab. Toxicol. 2008, 4(6), 697–720. [Google Scholar] [CrossRef] [PubMed]
- Mizuno, M.; Abe, K.; Kakimoto, T.; Yano, K.; Ota, Y.; Tomita, K.; Kagi, N.; Sekiya, I. Volatile Organic Compounds and Ionic Substances Contamination in Cell Processing Facilities during Rest Period; a Preliminary Assessment of Exposure to Cell Processing Operators. Regen. Ther. 2023, 24, 211–218. [Google Scholar] [CrossRef] [PubMed]
- Filipiak, W.; Sponring, A.; Filipiak, A.; Ager, C.; Schubert, J.; Miekisch, W.; Amann, A.; Troppmair, J. TD-GC-MS Analysis of Volatile Metabolites of Human Lung Cancer and Normal Cells in Vitro. Cancer Epidemiol. Biomark. Prev. 2010, 19(1), 182–195. [Google Scholar] [CrossRef] [PubMed]
- Hakim, M.; Broza, Y. Y.; Barash, O.; Peled, N.; Phillips, M.; Amann, A.; Haick, H. Volatile Organic Compounds of Lung Cancer and Possible Biochemical Pathways. Chem. Rev. 2012, 112(11), 5949–5966. [Google Scholar] [CrossRef] [PubMed]
- Leiherer, A.; Ślefarska, D.; Leja, M.; Heinzle, C.; Mündlein, A.; Kikuste, I.; Mezmale, L.; Drexel, H.; Mayhew, C. A.; Mochalski, P. The Volatilomic Footprints of Human HGC-27 and CLS-145 Gastric Cancer Cell Lines. Front. Mol. Biosci. 2021, 7, 607904. [Google Scholar] [CrossRef] [PubMed]
- Ewing, R. G.; Eiceman, G. A.; Stone, J. A. Proton-Bound Cluster Ions in Ion Mobility Spectrometry. Int. J. Mass Spectrom. 1999, 193(1), 57–68. [Google Scholar] [CrossRef] [PubMed]
- Puchalska, P.; Crawford, P. A. Multi-Dimensional Roles of Ketone Bodies in Fuel Metabolism, Signaling, and Therapeutics. Cell Metab. 2017, 25(2), 262–284. [Google Scholar] [CrossRef] [PubMed]
- Oyerinde, A. S.; Selvaraju, V.; Boersma, M.; Babu, J. R.; Geetha, T. Effect of H2O2 Induced Oxidative Stress on Volatile Organic Compounds in Differentiated 3T3-L1 Cells. Sci. Rep. 2025, 15(1), 2597. [Google Scholar] [CrossRef] [PubMed]
- Allen, D. D.; Caviedes, R.; Cárdenas, A. M.; Shimahara, T.; Segura-Aguilar, J.; Caviedes, P. A. Cell Lines as In Vitro Models for Drug Screening and Toxicity Studies. Drug Dev. Ind. Pharm. 2005, 31(8), 757–768. [Google Scholar] [CrossRef] [PubMed]
- Drees, C.; Vautz, W.; Liedtke, S.; Rosin, C.; Althoff, K.; Lippmann, M.; Zimmermann, S.; Legler, T. J.; Yildiz, D.; Perl, T.; Kunze-Szikszay, N. GC-IMS Headspace Analyses Allow Early Recognition of Bacterial Growth and Rapid Pathogen Differentiation in Standard Blood Cultures. Appl. Microbiol. Biotechnol. 2019, 103(21–22), 9091–9101. [Google Scholar] [CrossRef] [PubMed]
- Arroyo-Manzanares, N.; García-Nicolás, M.; Castell, A.; Campillo, N.; Viñas, P.; López-García, I.; Hernández-Córdoba, M. Untargeted Headspace Gas Chromatography—Ion Mobility Spectrometry Analysis for Detection of Adulterated Honey. Talanta 2019, 205, 120123. [Google Scholar] [CrossRef] [PubMed]
- Gerhardt, N.; Schwolow, S.; Rohn, S.; Pérez-Cacho, P. R.; Galán-Soldevilla, H.; Arce, L.; Weller, P. Quality Assessment of Olive Oils Based on Temperature-Ramped HS-GC-IMS and Sensory Evaluation: Comparison of Different Processing Approaches by LDA, kNN, and SVM. Food Chem. 2019, 278, 720–728. [Google Scholar] [CrossRef] [PubMed]
Figure 1.
Schematics of the direct headspace analysis of adherent cells from a T 75 flask, plugged with a silicone stopper. Air from the mass flow controller (MFC) was directed through the cell culture flask to the Genie® filter. The gas stream was split in the Genie® filter as follows: from the 50 mL/min entering the inlet, 42 mL/min were directed to the bypass (serving as a drain for excess moisture), while 8 mL/min were directed to the outlet and subsequently analyzed by GC-IMS.
Figure 1.
Schematics of the direct headspace analysis of adherent cells from a T 75 flask, plugged with a silicone stopper. Air from the mass flow controller (MFC) was directed through the cell culture flask to the Genie® filter. The gas stream was split in the Genie® filter as follows: from the 50 mL/min entering the inlet, 42 mL/min were directed to the bypass (serving as a drain for excess moisture), while 8 mL/min were directed to the outlet and subsequently analyzed by GC-IMS.
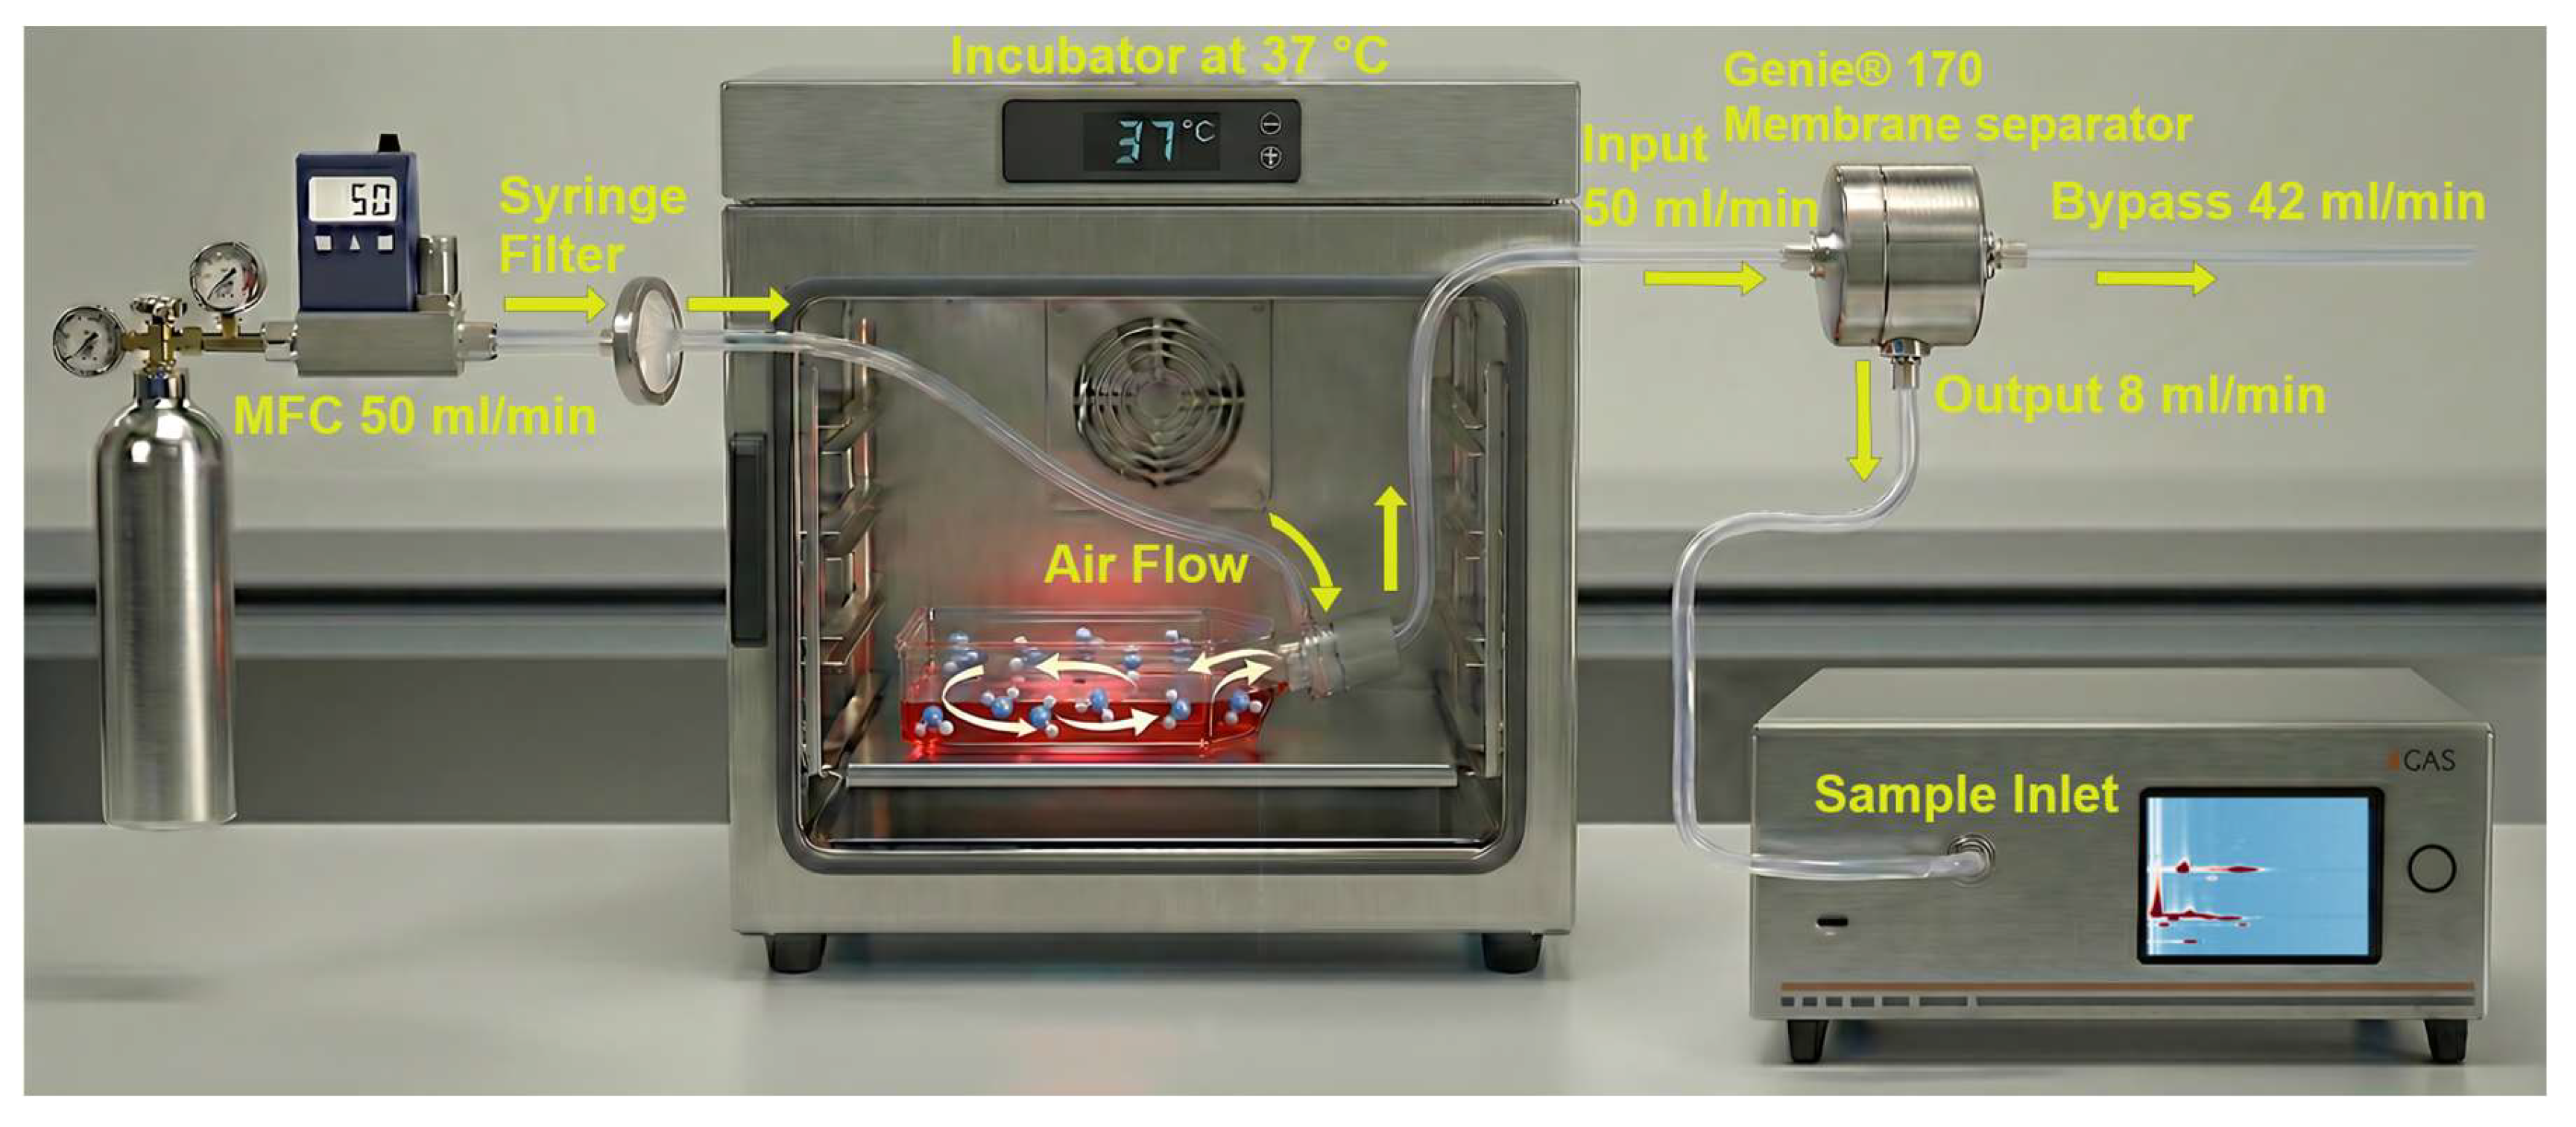
Figure 2.
GC-IMS spectra of a homologous series of ketones (C3–C10) acquired with (a) and without (b) the Genie® membrane separator. Averaging the peak-area ratios (Genie/Syringe) across all analytes indicated a mean signal retention of ~81% (≈19% reduction).
Figure 2.
GC-IMS spectra of a homologous series of ketones (C3–C10) acquired with (a) and without (b) the Genie® membrane separator. Averaging the peak-area ratios (Genie/Syringe) across all analytes indicated a mean signal retention of ~81% (≈19% reduction).
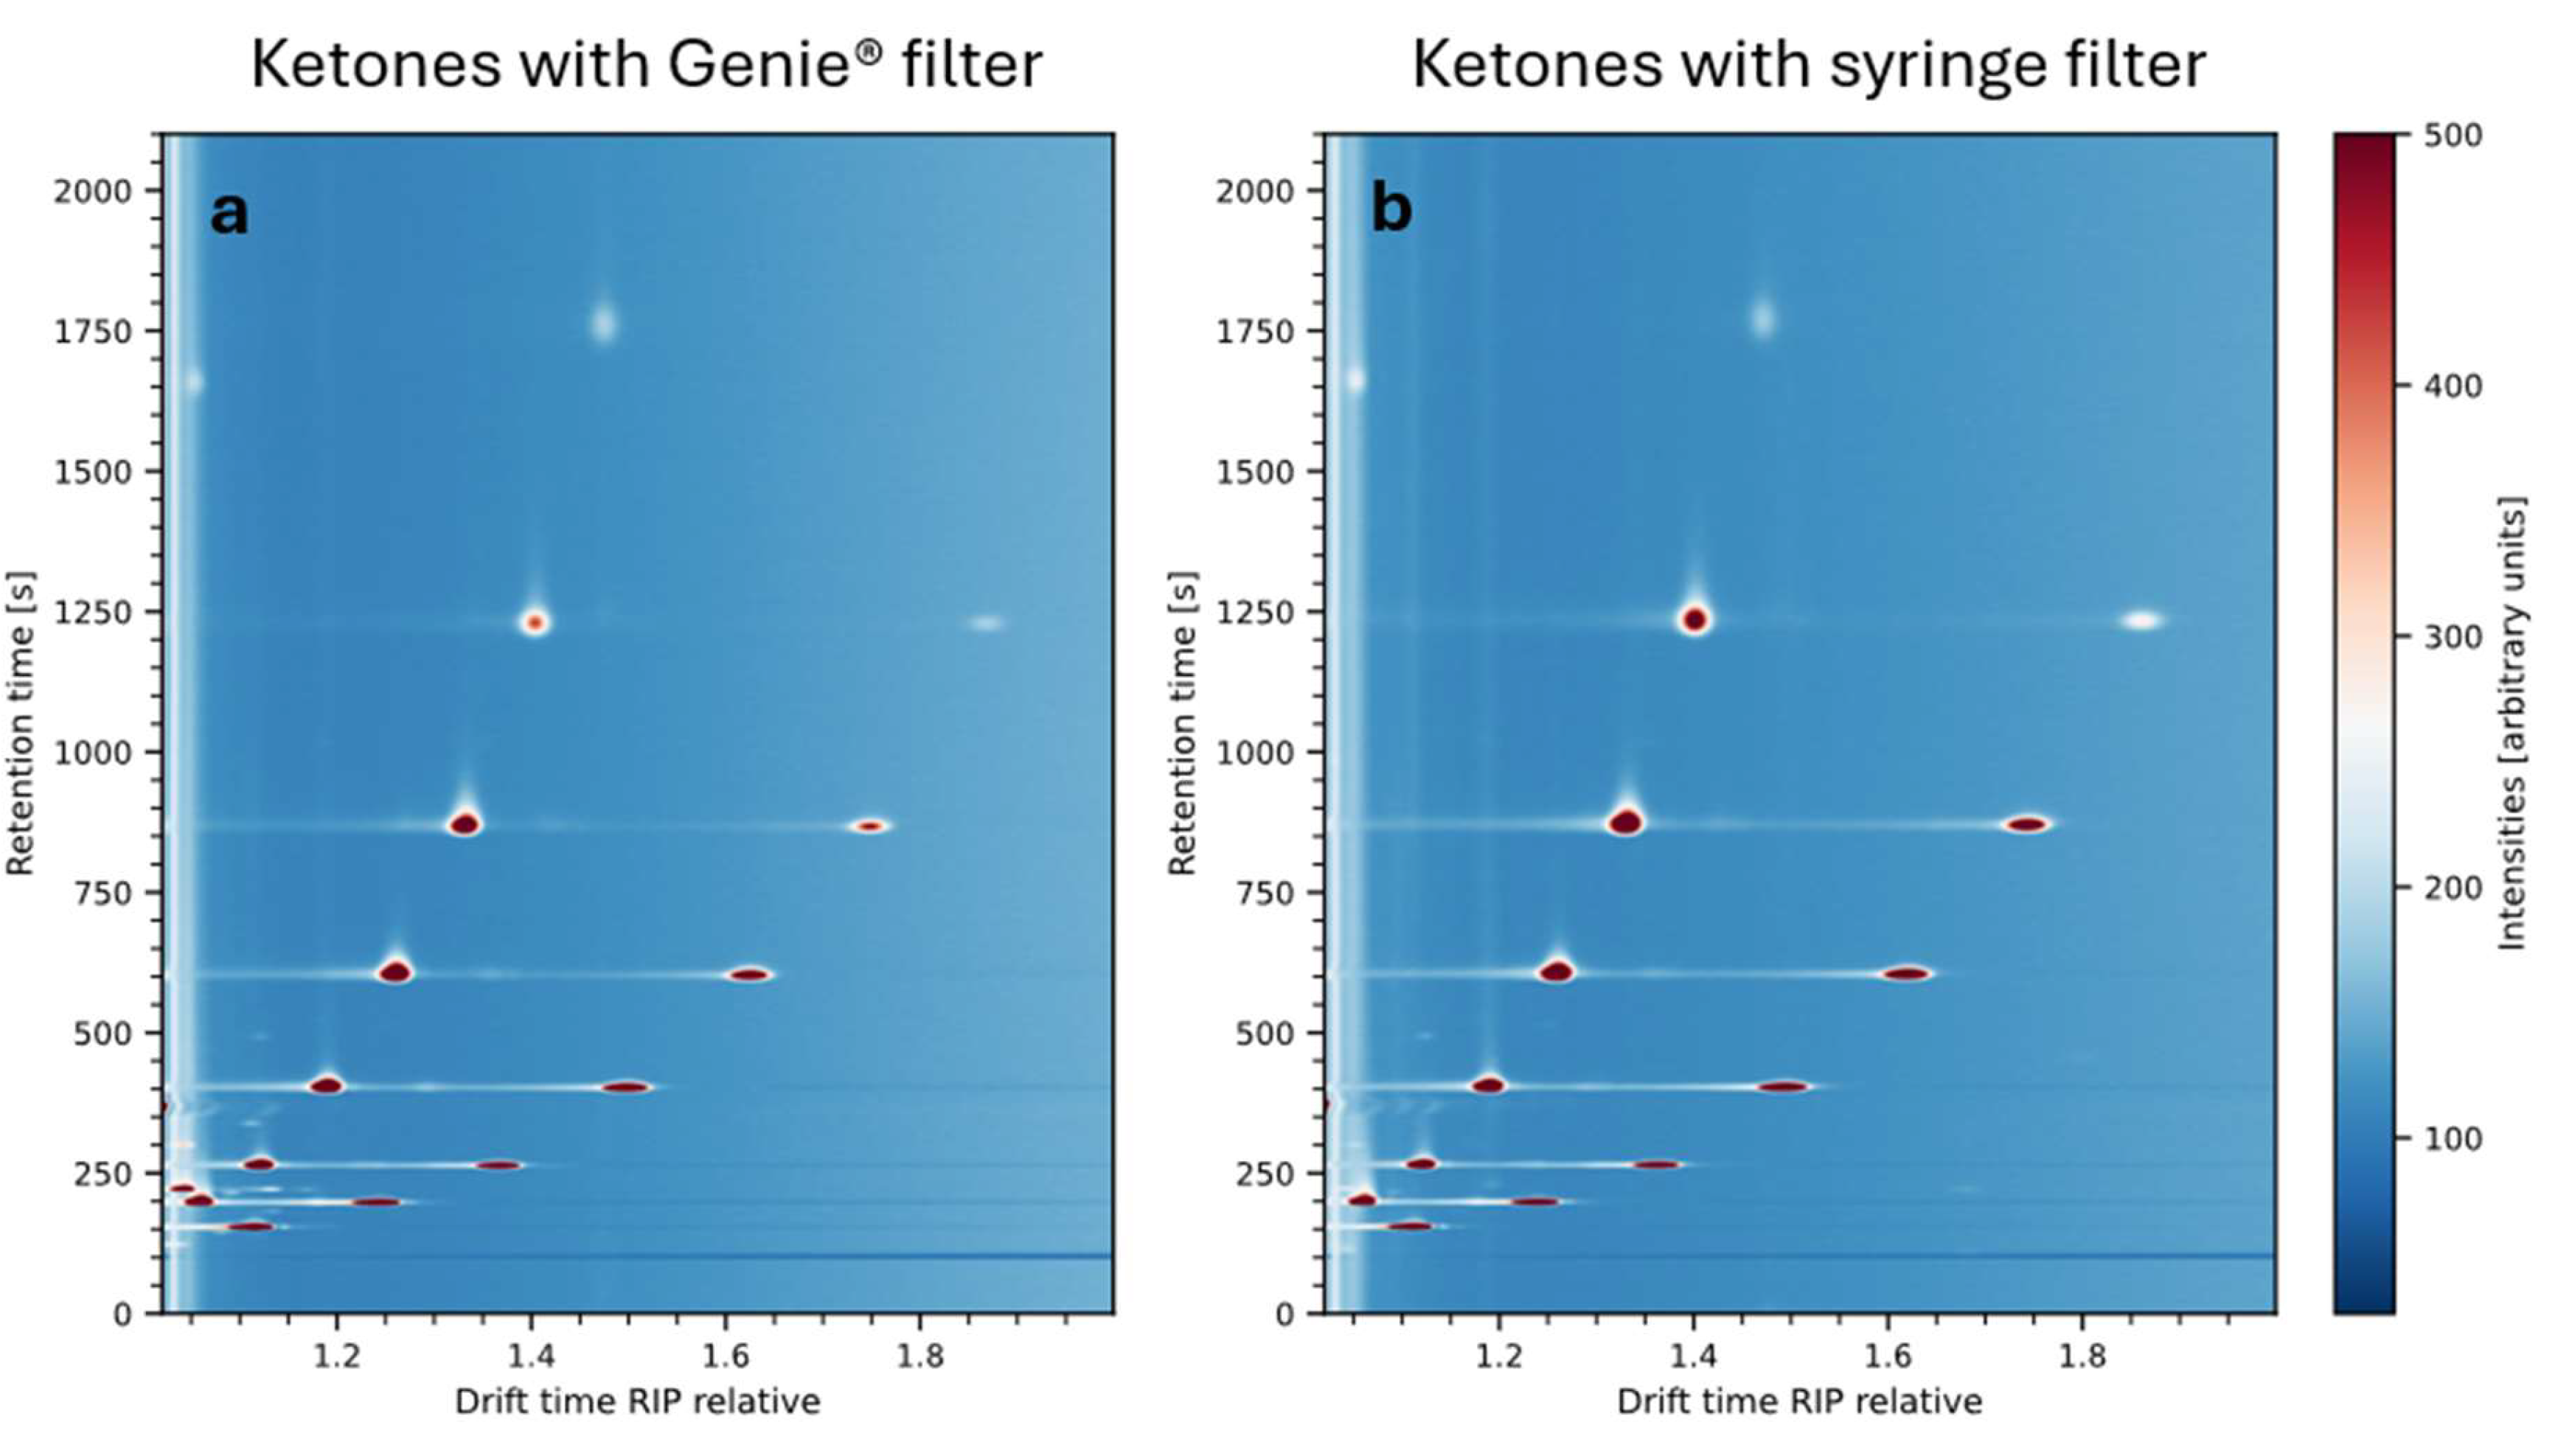
Figure 3.
a) PCA scores plot of the first two principal components (PCs), where color denotes the cultivation day and symbol shape indicates the cell type. The PCA reveals greater variance between cultivation days than between cell types. Increasing cultivation time correlates with higher values along PC1. (b) Corresponding loadings plot for PC1, with color representing loading values. The loadings of PC1 highlight signals S1, S2, and S3 with high positive loadings, whereas signal S4 and S5 exhibit a strong negative loading value. Since PC1 correlates closely with cultivation time, signals S1–S3 can be inferred to increase over the course of cultivation, while S4 and S5 decrease.
Figure 3.
a) PCA scores plot of the first two principal components (PCs), where color denotes the cultivation day and symbol shape indicates the cell type. The PCA reveals greater variance between cultivation days than between cell types. Increasing cultivation time correlates with higher values along PC1. (b) Corresponding loadings plot for PC1, with color representing loading values. The loadings of PC1 highlight signals S1, S2, and S3 with high positive loadings, whereas signal S4 and S5 exhibit a strong negative loading value. Since PC1 correlates closely with cultivation time, signals S1–S3 can be inferred to increase over the course of cultivation, while S4 and S5 decrease.
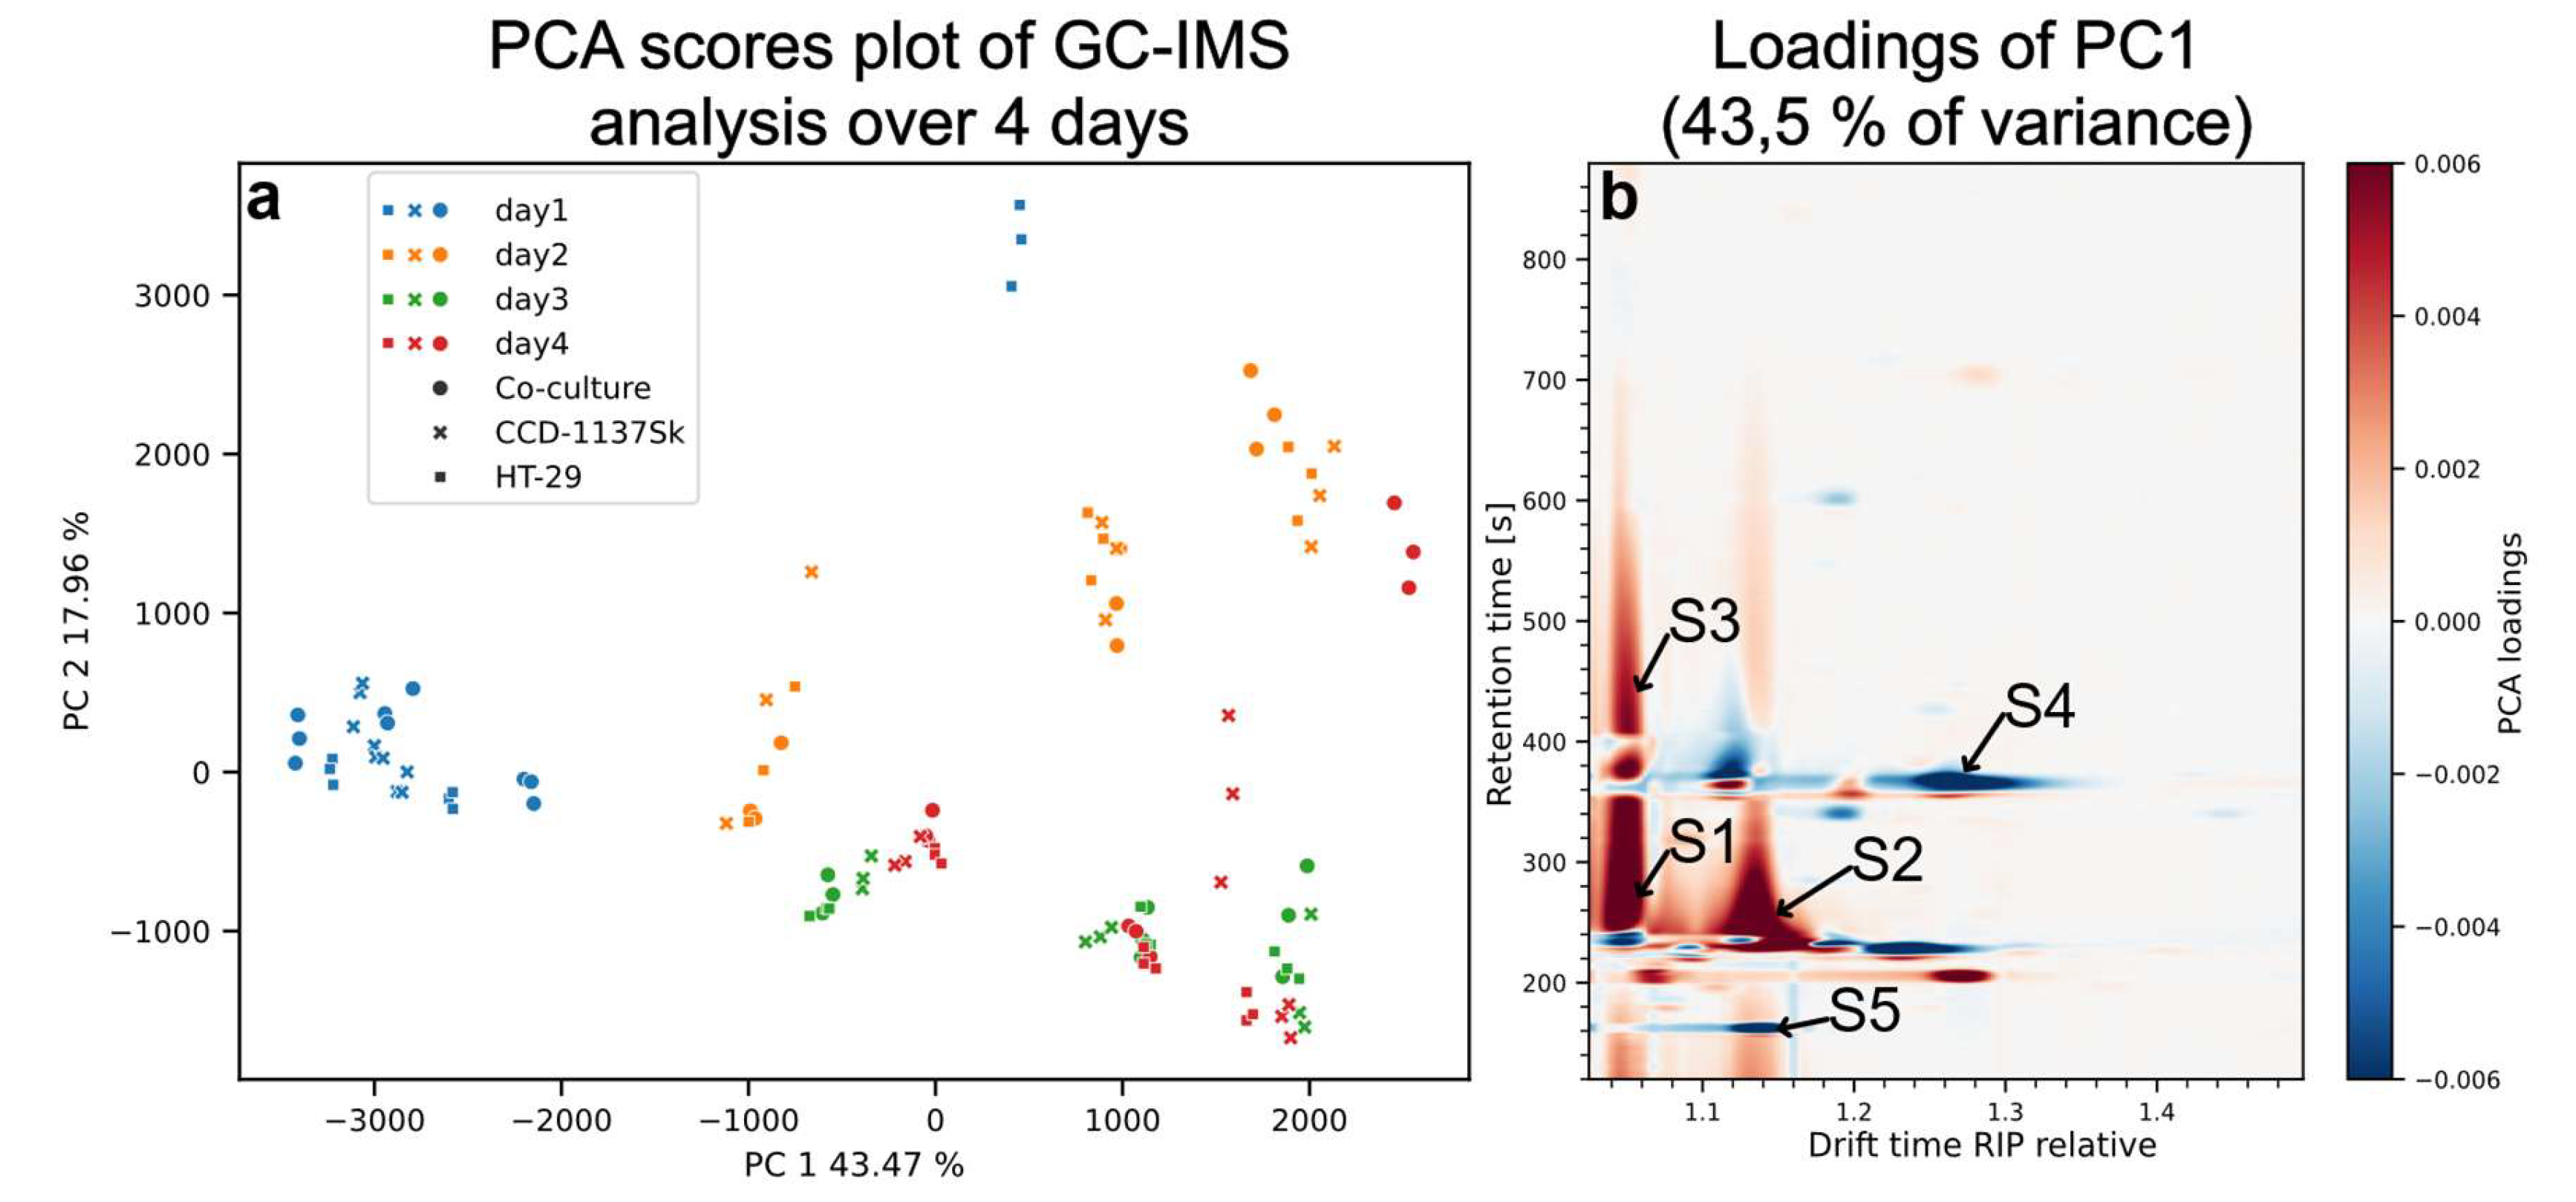
Figure 4.
Visualization of peak matching between the mass spectrum (left), the corresponding ion mobility spectrum (middle), and the online GC-IMS system (right). Annotated IMS peaks are highlighted in yellow, with “#” indicating dimeric species. Signals in the online GC-IMS were assigned based on calculated K₀ values and similarity in peak morphology. All peaks annotated in the THS-GC-QMS-IMS system were traceable in the Online GC-IMS data, except for peaks 7 and 8, corresponding to, styrene, and N,N-dimethylacetamide, which were not detected in the Online GC-IMS system.
Figure 4.
Visualization of peak matching between the mass spectrum (left), the corresponding ion mobility spectrum (middle), and the online GC-IMS system (right). Annotated IMS peaks are highlighted in yellow, with “#” indicating dimeric species. Signals in the online GC-IMS were assigned based on calculated K₀ values and similarity in peak morphology. All peaks annotated in the THS-GC-QMS-IMS system were traceable in the Online GC-IMS data, except for peaks 7 and 8, corresponding to, styrene, and N,N-dimethylacetamide, which were not detected in the Online GC-IMS system.
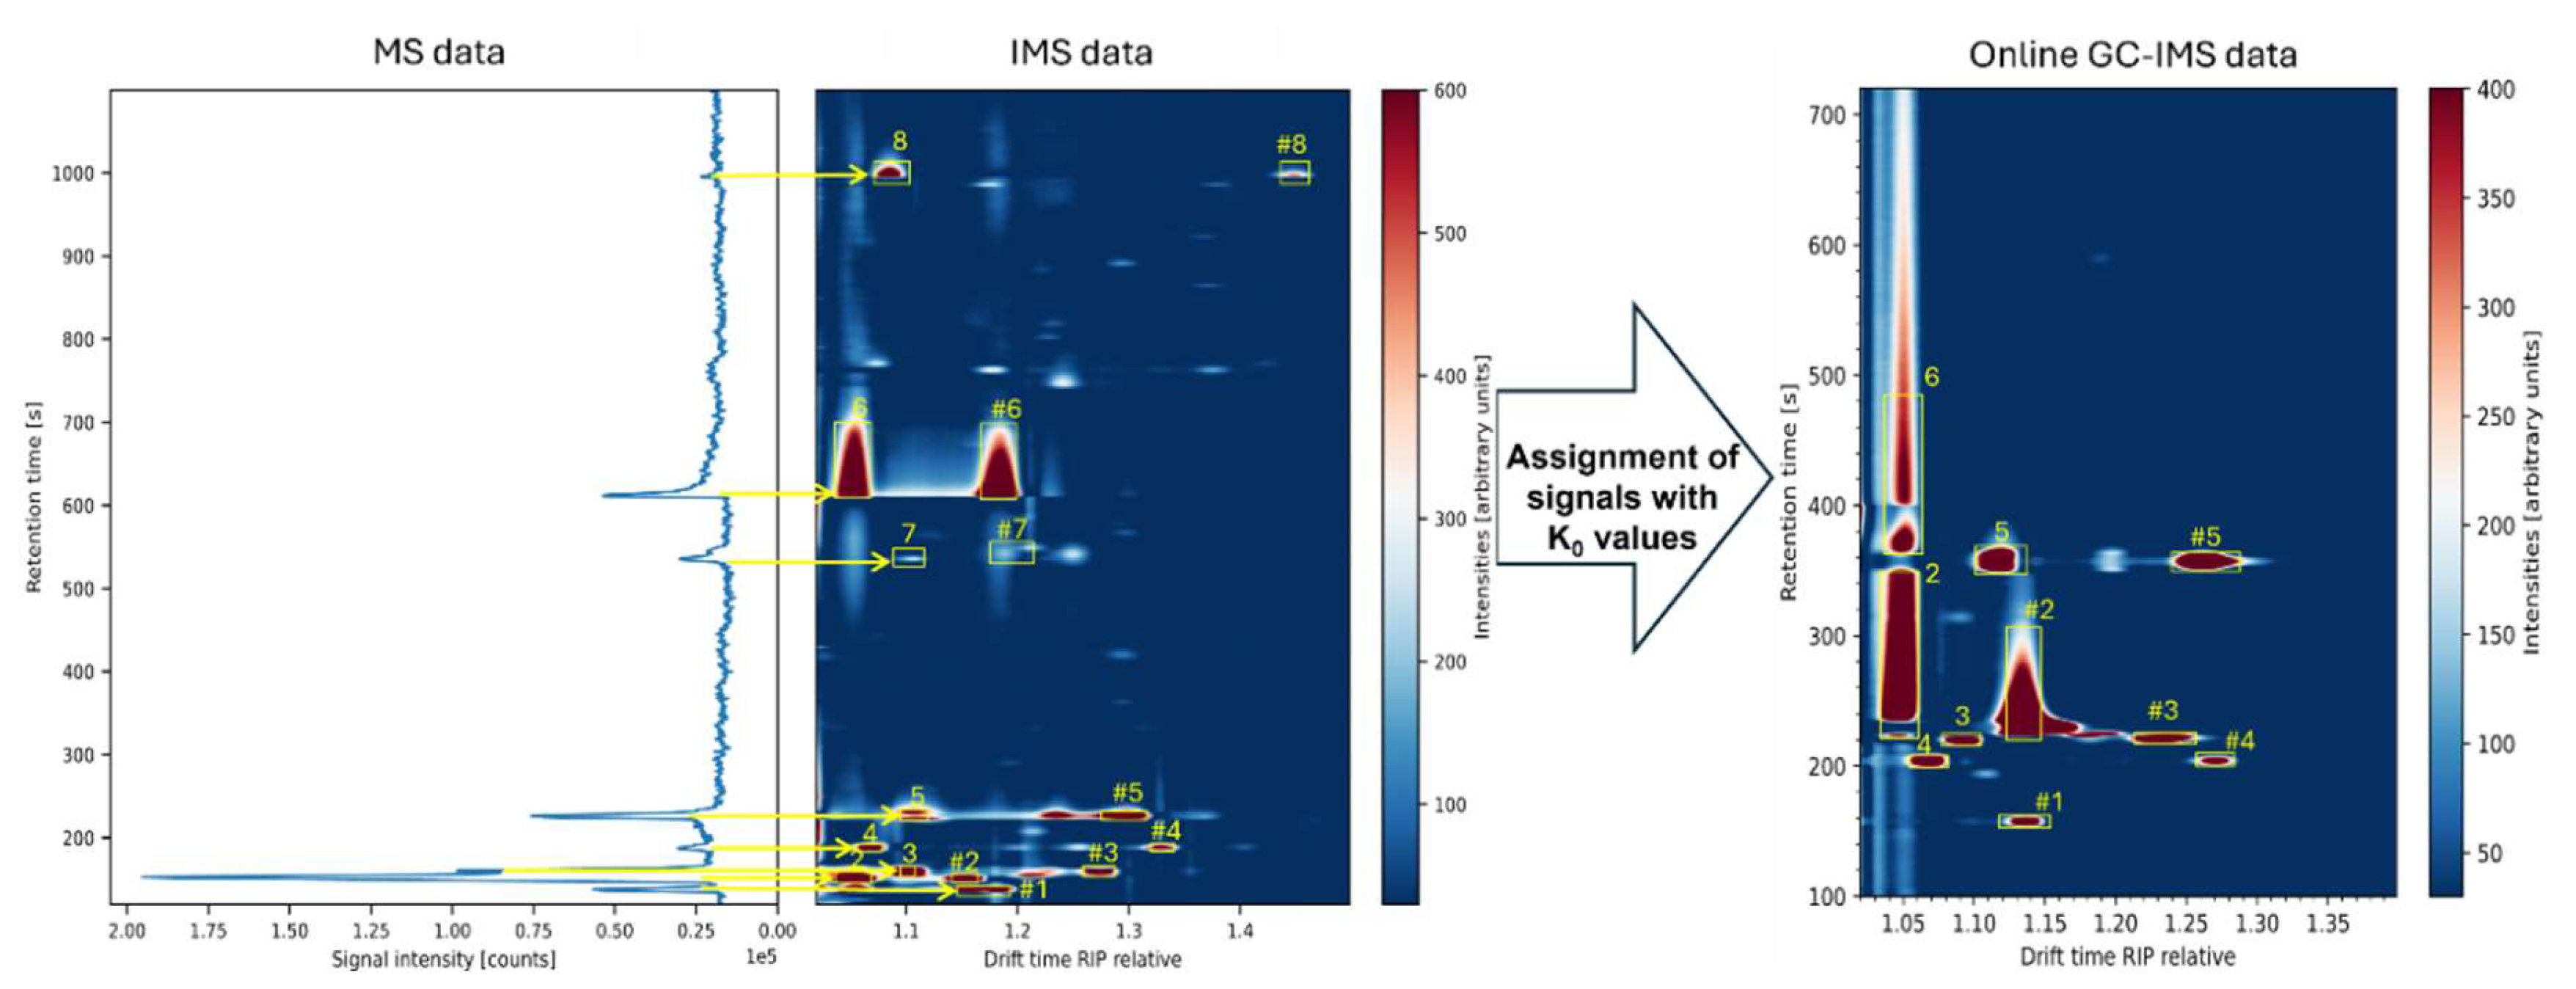
Figure 5.
Net metabolic flux of ethanol and acetic acid across three cell culture models over four days. Bar charts represent daily mean intensity (a.u.); positive values indicate net biological production, negative values indicate net consumption. The # symbol denotes dimer species; error bars indicate SEM (n = 9).
Figure 5.
Net metabolic flux of ethanol and acetic acid across three cell culture models over four days. Bar charts represent daily mean intensity (a.u.); positive values indicate net biological production, negative values indicate net consumption. The # symbol denotes dimer species; error bars indicate SEM (n = 9).
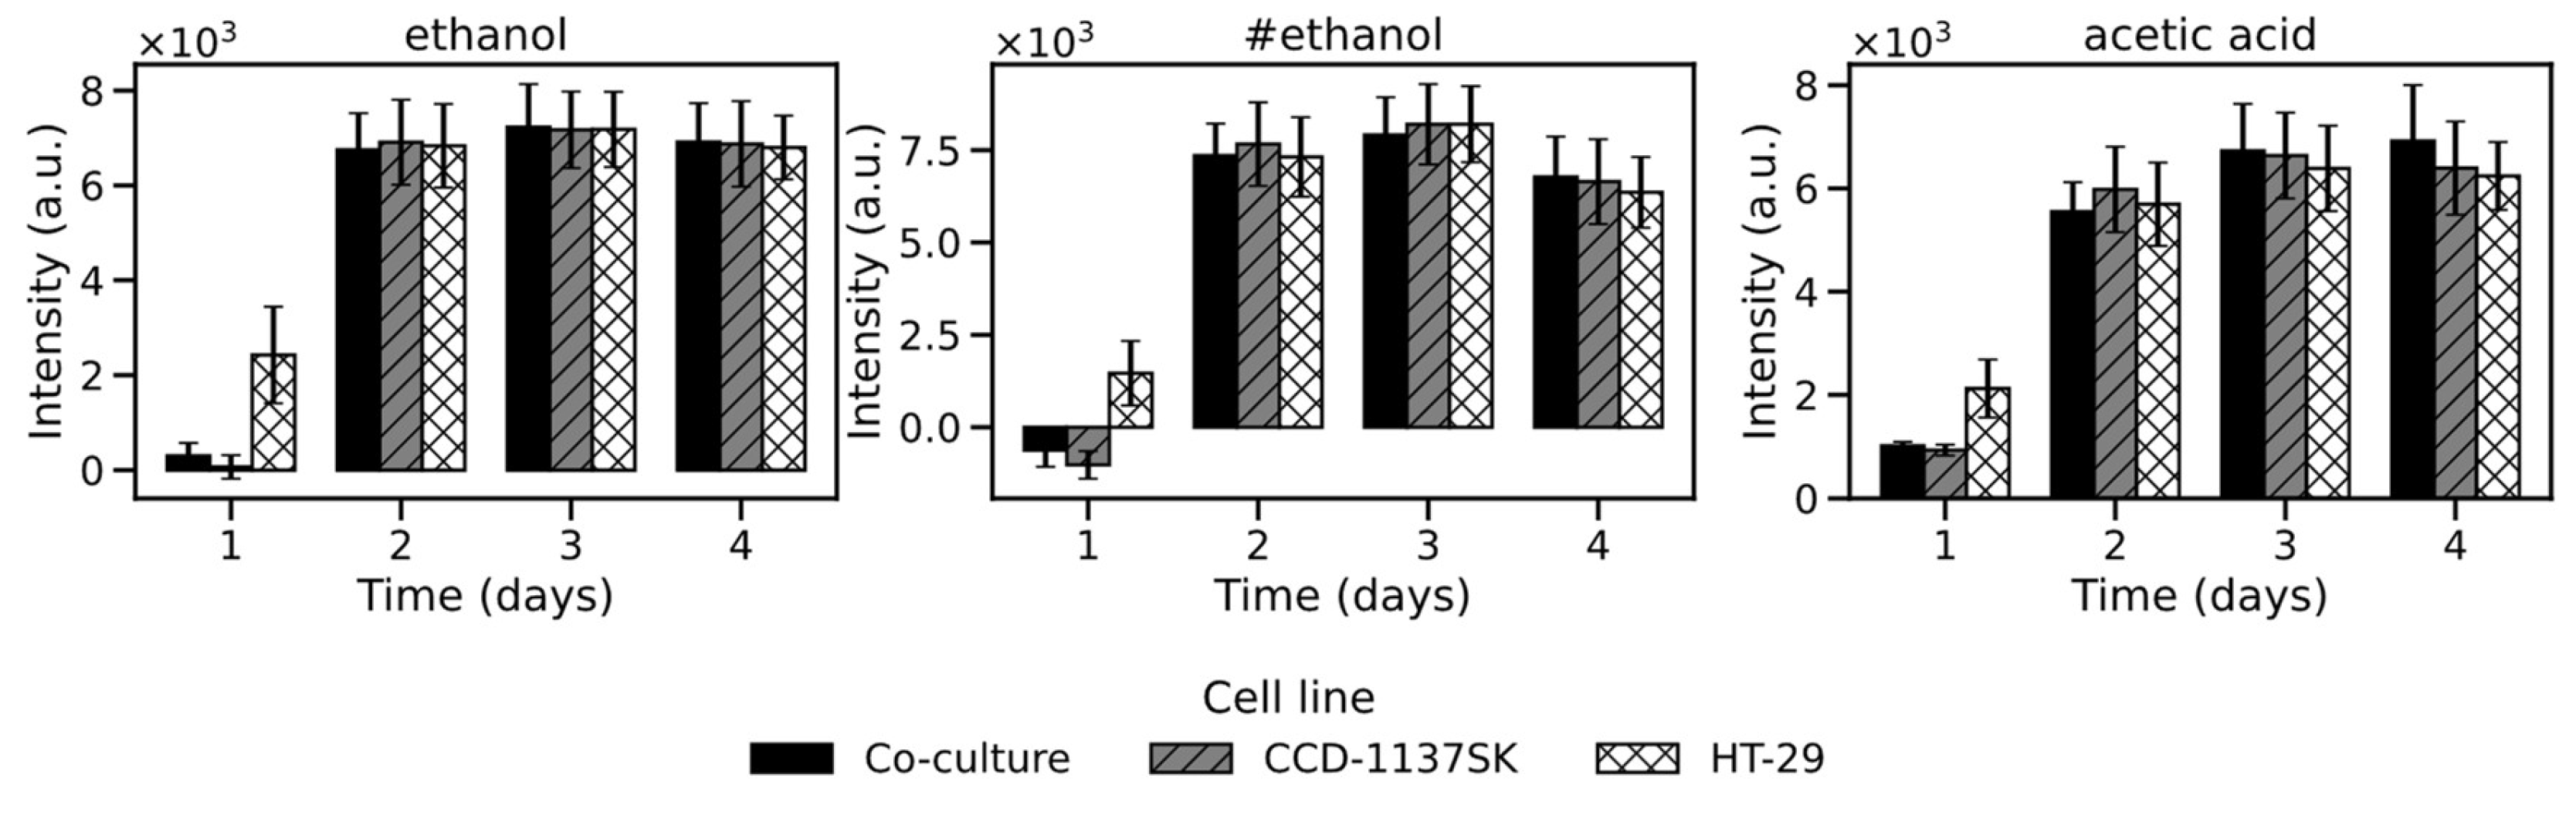
Figure 6.
Net metabolic flux of 1-propanol, butanone, isopropyl alcohol and acetone across three cell culture models over four days. Bar charts represent daily mean intensity (a.u.); positive values indicate net biological production, negative values indicate net consumption. The # symbol denotes dimer species; error bars indicate SEM (n = 9).
Figure 6.
Net metabolic flux of 1-propanol, butanone, isopropyl alcohol and acetone across three cell culture models over four days. Bar charts represent daily mean intensity (a.u.); positive values indicate net biological production, negative values indicate net consumption. The # symbol denotes dimer species; error bars indicate SEM (n = 9).
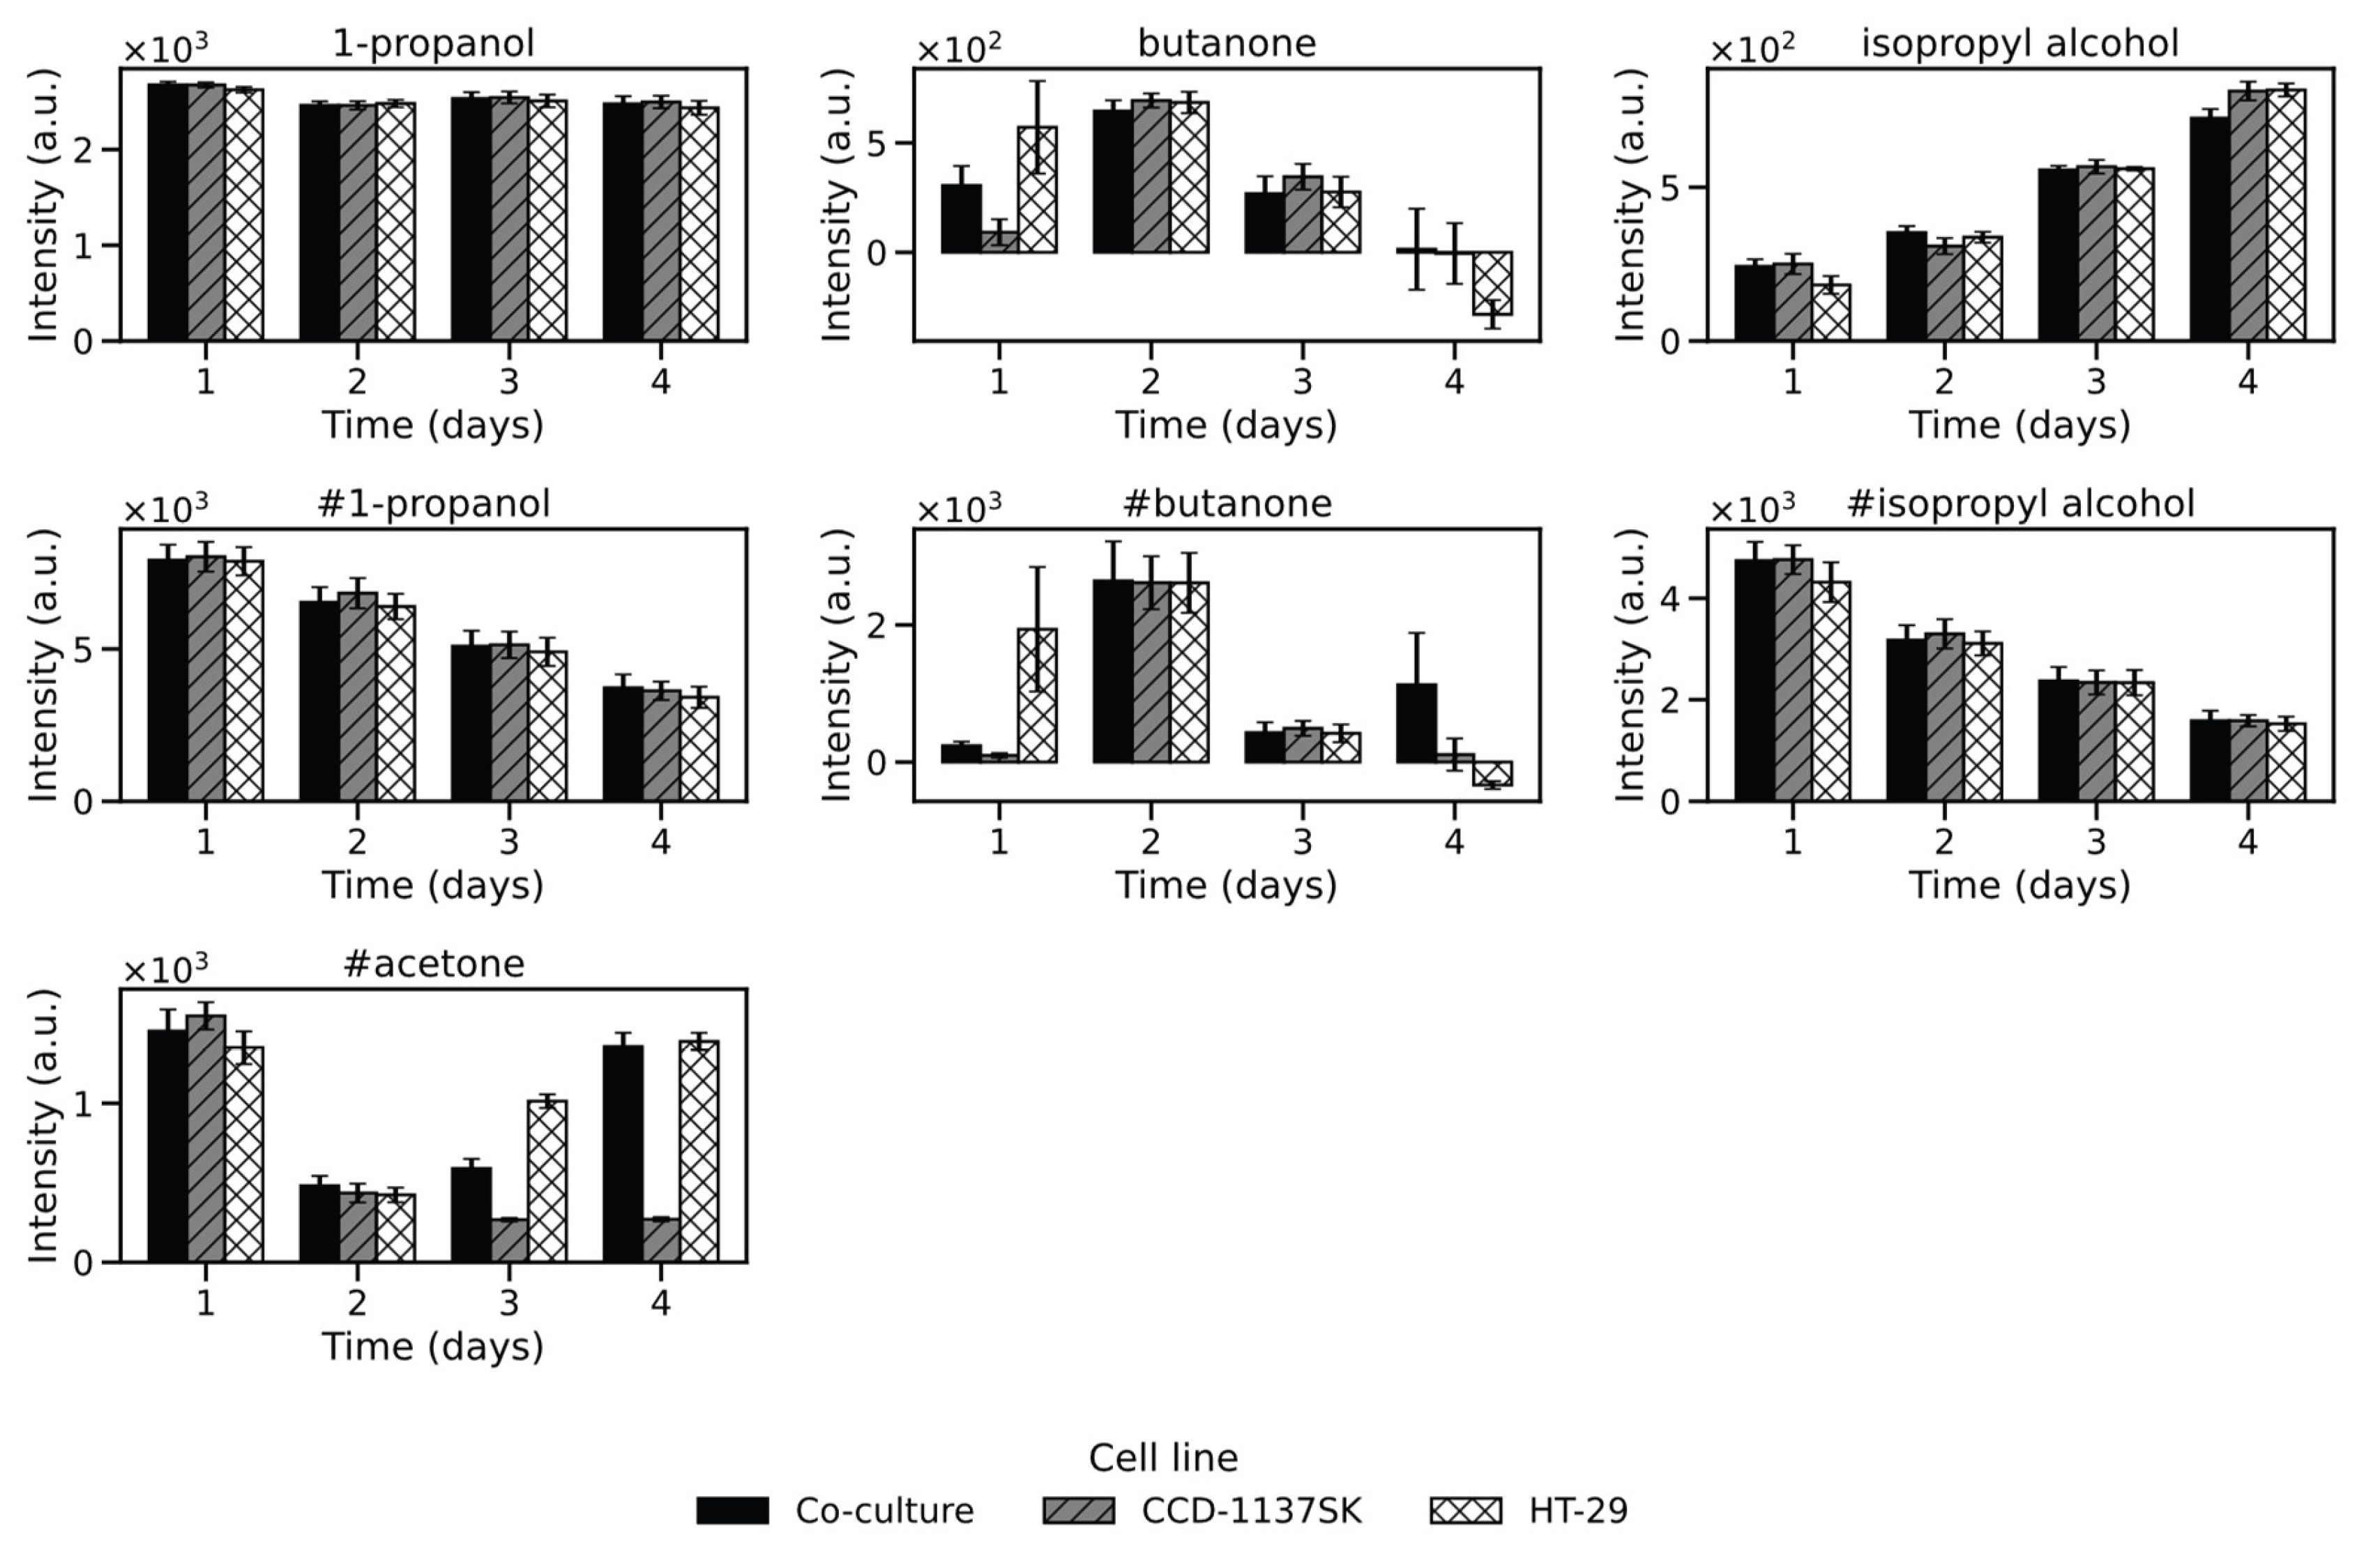

Table 1.
Overview of all compounds detected and separated by the online GC-IMS system. The substances were tentatively identified by comparing the K0 values between the online GC-IMS spectra and the offline measurements using the THS-GC-QMS-IMS system. Deviations are expressed as relative value between the online and the offline system.
Table 1.
Overview of all compounds detected and separated by the online GC-IMS system. The substances were tentatively identified by comparing the K0 values between the online GC-IMS spectra and the offline measurements using the THS-GC-QMS-IMS system. Deviations are expressed as relative value between the online and the offline system.
| No | Compound | RT online GC-IMS [s] | K0 monomer online GC-IMS | K0 monomer THS-GC-IMS | Deviation monomer [%] | K0 dimer online GC-IMS | K0 dimer THS-GC-IMS | Deviation dimer [%] |
|---|---|---|---|---|---|---|---|---|
| 1 | Acetone | 158 | - | - | - | 1.805 | 1.811 | 0.34 |
| 2 | Ethanol | 242 | 1.921 | 1.977 | 2.86 | 1.786 | 1.810 | 1.31 |
| 3 | Isopropyl alcohol | 223 | 1.852 | 1.895 | 2.27 | 1.625 | 1.639 | 0.88 |
| 4 | 2-butanone | 210 | 1.911 | 1.957 | 2.38 | 1.605 | 1.664 | 3.53 |
| 5 | 1-propanol | 357 | 1.801 | 1.888 | 4.62 | 1.601 | 1.612 | 0.66 |
| 6 | Acetic acid | 410 | 1.955 | 1.985 | 1.53 | - | 1.764 | - |
Table 2.
Reference substances measured in the specified concentrations. The absolute deviation to the compounds in the cell cultures is given in parentheses.
Table 2.
Reference substances measured in the specified concentrations. The absolute deviation to the compounds in the cell cultures is given in parentheses.
| No | Compound | CAS number | Concentration [µg/ml] |
RT [s] | K0 monomer [cm2/V*s] | K0 dimer [cm2/V*s] |
|---|---|---|---|---|---|---|
| 1 | Acetone | 67-64-1 | 0.5 | 156 (-2) | - | 1.801 (-0.004) |
| 2 | Ethanol | 64-17-5 | 0.5 | 240 (-2) | 1.929 (-0.008) | 1.780 (+0.006) |
| 3 | Isopropyl alcohol | 67-63-0 | 1 | 224 (-1) | 1.849 (+0.003) | 1.632 (-0.007) |
| 4 | 2-butanone | 78-93-3 | 0.5 | 205 (-5) | 1.905 (+0.006) | 1.603 (+0.002) |
| 5 | 1-propanol | 71-23-8 | 1 | 359 (+2) | 1.803 (-0.002) | 1.596 (+0.005) |
| 6 | Acetic acid | 64-19-7 | 5 | 396 (-14) | 1.920 (+0.035) | - |
Disclaimer/Publisher’s Note: The statements, opinions and data contained in all publications are solely those of the individual author(s) and contributor(s) and not of MDPI and/or the editor(s). MDPI and/or the editor(s) disclaim responsibility for any injury to people or property resulting from any ideas, methods, instructions or products referred to in the content. |
© 2026 by the authors. Licensee MDPI, Basel, Switzerland. This article is an open access article distributed under the terms and conditions of the Creative Commons Attribution (CC BY) license (http://creativecommons.org/licenses/by/4.0/).
Copyright: This open access article is published under a Creative Commons CC BY 4.0 license, which permit the free download, distribution, and reuse, provided that the author and preprint are cited in any reuse.


