
Submitted:
01 August 2026
Posted:
03 August 2026
You are already at the latest version
Abstract
Honey biosynthesis is a biochemical transformation process in which nectar-derived phenolic compounds undergo selective modification during collection, enzymatic processing and maturation within the hive. This study investigated the influence of geographical origin (GeO), botanical origin (BO) and drying treatment (DT) on the phenolic composition and antioxidant activity of nectariferous flowers and their corresponding honeys from Yucatán, Mexico. A 5 × 8 × 2 multifactorial design was applied to floral biomass, whereas 4² and 3 × 6 multifactorial designs were used for monofloral and multifloral honeys, respectively. Total phenolic content (TPC), antioxidant activity (DPPH) and individual phenolic compounds were determined by the Folin–Ciocalteu assay, DPPH radical scavenging assay and UPLC-DADFreeze-dried flowers showed higher total phenolic content, antioxidant capacity, and flavonoid concentrations than oven-dried flowers. Among the floral samples, Gymnopodium floribundum from Peto showed the highest total phenolic content (1,754.69 ± 128.67 mg GAE/100 g DM) and antioxidant capacity (96.82 ± 1.09% DPPH inhibition), whereas Bursera simaruba from the same locality had the highest catechin concentration (998.72 ± 1.45 mg/100 g DM). In contrast, honey displayed a more selective phenolic profile, characterized by lower flavonoid abundance and the predominance of protocatechuic acid (84.76 ± 0.09 mg/100 g DM). These findings indicate that honey does not proportionally preserve the floral phenolic profile but instead emerges from a selective biochemical reorganization in which individual metabolites are differentially retained, transformed, enriched, or depleted during nectar conversion, providing new insight into the metabolomic transition from nectar to honey.
Keywords:
honey
; nectariferous flowers
; phenolic compounds
; UPLC-DAD
; freeze-drying
; antioxidant activity
1. Introduction
Floral nectar constitutes the primary source of metabolites that ultimately become incorporated into honey, making the chemical characterization of nectariferous flowers essential for understanding the composition and biological properties of bee-derived products. Beyond serving as a carbohydrate-rich reward for pollinators, nectar is now recognized as a chemically complex matrix containing a wide diversity of secondary metabolites, including phenolic acids, flavonoids, alkaloids, amino acids, non-protein amino acids and volatile organic compounds. These constituents are associated with pollinator nutrition and behavior, plant defense, plant–pollinator communication, and interactions with nectar-associated microorganisms [1,2]. Among these metabolites, phenolic compounds are of particular interest because they perform essential physiological and ecological functions in plants, including protection against ultraviolet radiation, oxidative stress, pathogens and herbivores, while simultaneously contributing to the antioxidant potential and characteristic phytochemical profile ultimately associated with honey [1,3]. The abundance and composition of floral phenolics are influenced by plant genotype, floral physiology, environmental conditions, geographical location and seasonal variation, making nectariferous flowers chemically dynamic biological matrices whose metabolite composition determines the pool of compounds available for honey biosynthesis [4].
Following nectar collection, floral metabolites enter a naturally occurring biochemical transformation process in which nectar is converted into a chemically distinct and stable product. During foraging and hive maturation, honeybees catalyze enzymatic reactions, promote progressive dehydration and induce physicochemical modifications through nectar collection, trophallaxis, regurgitation and storage inside the comb. These transformations selectively preserve, modify, degrade or generate bioactive metabolites, including phenolic compounds, thereby shaping the phytochemical profile and antioxidant properties of the resulting honey [5,6]. Among the best-characterized reactions, invertase hydrolyzes sucrose into glucose and fructose, whereas glucose oxidase catalyzes the oxidation of glucose to gluconic acid and hydrogen peroxide, contributing to honey acidification and antimicrobial activity [7]. Beyond carbohydrate metabolism, these reactions progressively alter the physicochemical environment in which secondary metabolites remain stable or undergo transformation. Honey is not simply concentrated nectar, as this nectar is transformed into honey, its metabolites are continuously modified by bee physiology, hive maturation, and environmental conditions, shaping the chemical composition of the final product [8].
Advances in metabolomics and high-resolution chromatographic techniques have expanded the understanding of honey biosynthesis beyond its traditional interpretation as a process limited to sugar conversion and water evaporation. Phenolic acids and flavonoids constitute one of the principal groups of bioactive compounds in honey and have long been employed as compositional markers for assessing botanical origin, authenticity and quality [9,10]. Recent evidence shows that the abundance and composition of these compounds can change during honey biosynthesis, indicating that botanical markers are modified rather than preserved unchanged during the conversion of nectar into honey. Using untargeted UPLC-MS/MS metabolomics, Sun et al. (2025) [11] identified 595 differential metabolites between loquat (Eriobotrya japonica Lindl.) floral nectar and the corresponding monofloral honey. Flavonoids and phenolic acids were among the metabolite classes that showed the greatest compositional changes. Their study showed that bee metabolism modifies flavonoids during honey biosynthesis. As nectar is converted into honey, differences in flavonoid composition arise from biochemical transformations as well as concentration effects. These findings suggest that the phenolic profile of honey reflects both its floral origin and the transformations that occur during honey biosynthesis. As nectar is converted into honey, some phenolic compounds are retained, others are transformed or enriched, and some are no longer detected in the final product [5,7,10,11]
Although the biochemical changes associated with honey biosynthesis have been widely studied, much less attention has been given to the behavior of individual phenolic compounds during this process. Most studies have focused on botanical origin, but recent evidence suggests that bee enzymatic activity, oxidation, nectar and honey-associated microorganisms, bee foraging behavior, geographical origin, climatic conditions, floral resource availability, and hive maturation also influence the phenolic profile of honey [4,5]. Together, these factors help explain the chemical diversity observed among honeys from different floral and geographical origins [11,12].
Beyond their ecological functions, phenolic compounds have attracted considerable attention because of their recognized antioxidant, antimicrobial, anti-inflammatory, and cardiometabolic protective activities, highlighting their relevance to both food quality and human health [13]. Among the compounds identified in the present study, catechin has been particularly associated with vascular protection; a meta-analysis of randomized controlled trials showed that catechin supplementation improved flow-mediated dilation and reduced pulse-wave velocity and augmentation index, indicating enhanced endothelial function and reduced arterial stiffness [14]. Rutin has primarily been linked to glucose homeostasis and protection against diabetic complications, with experimental evidence indicating that it may reduce intestinal carbohydrate absorption and hepatic gluconeogenesis while promoting peripheral glucose uptake, insulin secretion, and preservation of pancreatic β-cell function [15]. Protocatechuic acid has shown a more specific protective effect on the vascular endothelium under diabetic inflammatory conditions; at physiologically relevant concentrations, it attenuated endothelial inflammation and improved nitric oxide-related function through activation of the Akt/eNOS signaling pathway in cultured endothelial cells [16]. In honey, these compounds are widely used as indicators of botanical origin, authenticity, geographical origin, and commercial quality. Comparing the phenolic profiles of nectariferous flowers with those of the corresponding honey helps explain how phenolic compounds are transferred and modified during honey biosynthesis [10].
Although the phenolic composition of floral samples and honey samples has been widely studied, only a few studies have examined both together. Most have focused on monofloral honey, allowing direct comparisons between floral nectar and the corresponding honey. Recent metabolomic studies further show that honey does not simply retain the chemical composition of its floral source. For example, Yan et al. (2024) [17] showed that the characteristic metabolites of chaste (Vitex negundo) honey are formed during honey biosynthesis rather than being directly transferred from nectar. Subsequently, Sun et al. (2025) [11] reported that, in a loquat (Eriobotrya japonica Lindl.) system, only a fraction of nectar-derived phenolic metabolites persisted in honey, whereas others were substantially modified during bee-mediated processing. In contrast, species-rich ecosystems present substantially greater analytical complexity because honeybees simultaneously exploit nectar from numerous co-flowering plant species that differ in phenology, nectar chemistry and spatial availability, generating a continuously changing mixture of floral resources available to the colony [18,19,20]. Multifloral honey integrates metabolites originating from multiple botanical sources while simultaneously undergoing enzymatic and physicochemical transformations during nectar ripening, making it difficult to distinguish compounds directly inherited from floral resources from those generated or selectively enriched during honey biosynthesis [11,17,20]. Despite recent advances in comparative metabolomics, studies simultaneously evaluating flowers and their corresponding monofloral and multifloral honeys under naturally diverse tropical conditions remain extremely limited [21].
Yucatán is one of Mexico's principal apicultural regions, producing 9,250 t of honey in 2024. About 38.5% of the country's honey production is exported, mainly to European and North American markets, making honey an important economic product in southeastern Mexico [22]. It constitutes an excellent natural model for investigating the relationships between floral and honey phenolic profiles because of its remarkable diversity of native nectariferous flora. Recent floristic surveys have documented approximately 935 melliferous taxa distributed across 98 botanical families and 498 genera throughout the peninsula, including 767 taxa reported exclusively for the state of Yucatán [20]. This exceptional botanical richness is accompanied by marked flowering seasonality, generating successive waves of floral resources that strongly influence bee foraging dynamics and the botanical composition of both monofloral and multifloral honeys [23]. These ecological and productive characteristics provide an appropriate natural framework for investigating how botanical origin, geographical origin and honey biosynthesis interact to influence phenolic composition across metabolically connected floral and honey matrices.
Therefore, the objective of the present study was to identify the phenolic compounds present in native nectariferous flowers and their associated monofloral and multifloral honeys from Yucatán, Mexico, using targeted UPLC-DAD profiling, and to evaluate the influence of botanical origin, geographical origin, and honey type on their phenolic composition.
2. Materials and Methods
2.1. Study Area and Sample Collection
Floral biomass and their associated honey samples were collected between January and November 2023. The floral survey comprised seven native nectariferous species representative of the principal honey-producing flora of Yucatán: Dzidzilché (Gymnopodium floribundum Rolfe), Jabín (Piscidia piscipula L. Sarg.), Xtabentún (Turbina corymbosa (L.) Raf.), Tahonal (Viguiera dentata (Cav.) Spreng.), Chaká (Bursera simaruba (L.) Sarg.), Tzalam (Lysiloma latisiliquum (L.) Benth.), and Box muk (Haematoxylum campechianum L.) (Figure 1a). Sampling was conducted in five representative beekeeping localities in Yucatán, Mexico: Acanceh, Pixyah (Holenchén), Tahdziú, Peto, and Popolnah (Tizimín) (Figure 1b). Sampling dates were adjusted to coincide with the flowering period of each nectariferous species, allowing the establishment of metabolically connected floral and honey matrices in which floral biomass and honey samples originated from the same locality and corresponded to the predominant nectar source associated with each honey type. Honey samples were obtained directly from local beekeepers, who classified each harvest according to the predominant nectariferous plant species based on the flowering season and the traditional botanical designation commonly used in the Yucatán beekeeping sector [20,23,24]. Floral biomass was subsequently collected from flowering individuals of the corresponding species located within a maximum radius of 3 km from each apiary during the respective flowering period. This sampling strategy was implemented to strengthen the biological correspondence between floral biomass and honey samples by increasing the likelihood that the collected flowers represented the principal nectar resources available to foraging Apis mellifera colonies during honey biosynthesis. The selected radius is consistent with the typical foraging distances reported for Apis mellifera, although foraging range may vary according to floral resource availability, landscape structure, colony requirements and seasonal conditions [19,25]. Only fresh, fully opened flowers showing no visible signs of damage or disease were collected to minimize variability associated with floral developmental stage and tissue deterioration.
In total, 16 floral biomass samples and 13 honey samples were collected and subsequently subjected to physicochemical, spectrophotometric and chromatographic analyses. Floral biomass samples were used to evaluate the effects of geographical origin (GeO), botanical origin (BO) and drying treatment (DT) on phenolic composition and antioxidant properties, whereas honey samples were evaluated to determine the effects of GeO and honey type (HTy) and to explore compositional relationships between source floral matrices and the corresponding bee-derived products.
2.2. Experimental Design
To evaluate the influence of botanical origin, geographical origin, drying treatment and raw material type on total phenolic content (TPC), antioxidant activity (Ax) and individual polyphenolic composition, the dataset was organized into three factorial comparison schemes. Because the availability of floral and honey samples differed among localities and botanical sources not all factor combinations were represented in every case. The full structure of each experimental design is presented in the Annex (Table A1, Table A2 and Table A3). The response variables evaluated across the three experimental designs were TPC, expressed as mg gallic acid equivalents (GAE)/100 g of dry matter (DM) for floral biomass or mg GAE/100 g honey for honey samples; antioxidant (Ax), expressed as percentage of DPPH inhibition; and the concentration of individual polyphenols, expressed as mg/100 g DM or mg/100 g honey, respectively.
2.2.1. Floral Matrices
Floral samples were evaluated using an unbalanced 5 × 8 × 2 multifactorial experimental design considering geographical origin (GeO), botanical origin (BO) and drying treatment (DT) as experimental factors. Geographical origin comprised five sampling localities (Acanceh, Pixyah, Tahdziú, Peto and Popolnah), whereas BO included eight native nectariferous species: Dzidzilché, Jabín, Tahonal, Chaká, Box muk, Bejuco, Tzalam and Xtabentún. Drying treatment (DT) consisted of two preservation methods applied to the floral biomass prior to analysis: oven drying and freeze-drying.
2.2.2. Honey Matrices
Honey samples were evaluated contrasting botanical composition of monofloral and multifloral honeys. Monofloral honey samples were arranged in an unbalanced multifactorial 4², comprising four geographical origins (Acanceh, Tahdziú, Popolnah and Peto) and four botanical origins (Dzidzilché, Jabín, Box muk and Tzalam). In turn, multifloral honey samples followed an unbalanced 3 × 6 design, including three geographical origins (Pixyah, Popolnah and Peto) and six botanical composition categories (Tahonal–Dzidzilché, Dzidzilché–Jabín, Tahonal–Xtabentún, Dzidzilché–Jabín–Chaká, Chaká–Jabín and Tahonal–Bejuco).
2.3. Sample Preparation
2.3.1. Floral Samples
Fresh floral biomass was transported to the laboratory under refrigerated conditions and manually cleaned to remove leaves, stems and other non-floral structures, retaining only reproductive tissues associated with nectar production. Floral samples were subjected to two drying treatments: oven and freeze-drying. The drying conditions were established according to previous studies conducted, where both treatments proved suitable for preserving phenolic compounds and antioxidant properties [21].
Oven-drying samples were dried in a gravity-convection oven (FE-292, FELISA®, Zapopan, Jalisco, Mexico) at 50 °C for 48 h. Freeze-drying consisted of freezing samples at −36 °C for 24 h followed by lyophilization at −50 °C and 0.340 mBar for 72 h using a Freeze dryer (Labconco®, Kansas City, MO, USA).
After dried, samples were ground using a coffee grinder (MasterChef®) and passed through a 500 µm sieve (#35, Fisher Scientific, Boston, MA, USA) to obtain particles of uniform size, with a final moisture under 5%. The resulting floral flours (oven and freeze dried) were packaged in aluminum-lined resealable bags and stored at room temperature (33°C) until extraction and analysis.
2.3.2. Honey Samples
Honey samples were obtained directly from local beekeepers and stored in amber glass containers at room temperature (30 – 33°C) until analysis.
2.4. Physicochemical Characterization of Honey Samples
Honey samples were physiochemically characterized to assess their quality attributes prior to phenolic analysis. The resulting values were interpreted according to the quality limits established by the Mexican standard NOM-004-SAG/GAN-2018[26] to verify compliance with the physicochemical requirements for commercial honey. Soluble solids content (°Brix) was determined by refractometry according to NOM-003-SAG/GAN-2017[26], pH and titratable acidity were measured following the International Honey Commission methodology [27], reducing sugars were quantified using the 3,5-dinitrosalicylic acid (DNS) method described by Miller (1959) [28] and hydroxymethylfurfural (HMF) content was determined spectrophotometrically according to the method of White (1979) [29]. Spectrophotometric determinations (reducing sugars and HMF) were performed using a UV–Vis spectrophotometer (GENESYS™ 140, Thermo Scientific™, Madison, WI, USA).
2.5. Extraction of Phenolic Compounds from Floral Biomass and Honey
Phenolic compounds were extracted from floral biomass and honey samples following the methodology reported by Avilés-Betanzos et al. (2023) [30], with slight modifications. For floral biomass 500 mg of floral flour obtained from each drying treatment (oven-dried and freeze-dried) were weighed. Subsequently, 2.5 mL of a methanol:water solution (80:20, v/v) were added and the mixture was homogenized using a vortex mixer. Samples were sonicated in an Ultrasonic bath (Branson 3510, Branson Ultrasonics, USA) for 30 min at 42 kHz. After sonication, the extracts were centrifuged at 4700 rpm for 30 min at 4 °C using a Megafuge™ 40 centrifuge (Thermo Scientific™, Osterode am Harz, Germany).
For honey samples, 3 g of honey were weighed and mixed with 5 mL of distilled water using a vortex. The solutions were sonicated for 10 min in an ultrasonic bath and subsequently brought to a 10ml volume with distilled water.
All the extracts were filtered through 0.22 μm nylon syringe filters, transferred into amber chromatographic vials and stored under refrigeration until further analysis.
2.6. Determination Total Phenolic Content in Floral Flour and Honey Extracts
Total polyphenol content was determined according to the method described by Singleton et al. (1999) [31], with modifications. Briefly, 25 µL of extract from either floral flour or honey was mixed with 25 µL of distilled water. Subsequently, 3 mL of distilled water and 250 µL of Folin Ciocalteu reagent were added. After 5 min, 750 µL of 20% sodium carbonate solution and 950 µL of distilled water were incorporated. The reaction mixture was incubated for 30 min at room temperature and absorbance was measured at 765 nm using a UV–Vis spectrophotometer (GENESYS™ 140, Thermo Scientific™, Madison, WI, USA). All determinations were performed in triplicate.
Quantification was performed using a gallic acid calibration curve (0–100 μg mL⁻¹) and results were expressed as milligrams of gallic acid equivalents per 100 g of dry matter (mg GAE/100 g DM). Floral biomass results were expressed on a dry weight basis, whereas honey results were expressed on a fresh weight basis.
2.7. Determination of Antioxidant Activity in Floral Flour and Honey Extracts
Antioxidant activity of floral flour and honey extracts was evaluated using the 2,2-diphenyl-1-picrylhydrazyl (DPPH; Sigma-Aldrich, St. Louis, MO, USA) radical scavenging assay according to Brand Williams et al. (1995) [32]. A DPPH solution was prepared by dissolving 3.3 mg of DPPH in methanol and adjusting the final volume to 100 mL. The absorbance of the solution was adjusted to 0.700 ± 0.002 at 515 nm using a UV–Vis spectrophotometer (GENESYS™ 140, Thermo Scientific™, Madison, WI, USA).
For DPPH assay, 3.9 mL of the adjusted DPPH solution was mixed with 100 µL of sample extract, followed by incubation for 30 min in the dark at room temperature. Absorbance was then recorded at 515 nm and Ax was expressed as percentage of inhibition according to Equation (1).
Where DPPHadj corresponds to the absorbance of the adjusted DPPH solution and DPPHspl corresponds to the absorbance of the sample extract. All analyses were performed in triplicate.
2.8. UPLC-DAD Profiling of Individual Phenolic Compounds in Floral Biomass and Honey
Polyphenolic compounds were quantified in all samples from the three experimental designs, comprising monofloral and multifloral honey samples and floral biomass obtained from oven-dried and freeze-dried nectariferous flowers collected in Acanceh, Pixyah, Tahdziú, Peto, and Popolnah. Chromatographic analyses were performed using an ultra-performance liquid chromatography system equipped with a diode array detector (UPLC-DAD, Waters, Milford, MA, USA) and an HSS C18 column (Waters, Milford, MA, USA). Separation was carried out at a flow rate of 0.5 mL min⁻¹, a column temperature of 45 °C and an injection volume of 2 μL. The mobile phases consisted of water containing 0.2% acetic acid (solvent A) and acetonitrile containing 0.1% acetic acid (solvent B). The elution gradient was programmed as follows: 1–30% B from 0 to 10 min, maintained at 30% B from 10 to 12 min and returned to 1% B from 12 to 15 min. Polyphenolic compounds were monitored at 280 nm.
Identification and quantification were performed by comparison of retention times and external calibration curves prepared from analytical standards. The reference compounds included gallic acid, protocatechuic acid, catechin, chlorogenic acid, cinnamic acid, rutin, quercetin, luteolin, kaempferol, vanillin, diosmin, hesperidin, neohesperidin, naringenin, apigenin and diosmetin (Sigma-Aldrich®, St. Louis, MO, USA); compounds with overlapping or nearly identical retention times were reported as the sum of both compounds (quercetin + luteolin and diosmin + hesperidin). Individual stock solutions (1 mg mL⁻¹) were prepared and subsequently diluted to obtain calibration levels ranging from 2 to 75 μg mL⁻¹. Polyphenol concentrations were expressed as mg/100 g DM for floral biomass and mg/100 g honey for honey samples
2.9. Comparative Analysis of Phenolic Profiles fromFloral and Honey Matrices
To provide an integrated visualization of the relationships among floral biomass and honey samples, total phenolic content (TPC) and antioxidant activity (Ax) were analyzed using a hierarchical cluster heatmap. The dataset included TPC and Ax values obtained for oven-dried flowers, freeze-dried flowers and the corresponding honey samples. Prior to clustering, each variable was standardized by Z-score normalization to enable direct comparison among measurements expressed on different scales. Hierarchical clustering of samples and variables was performed using Euclidean distance and Ward's linkage method (Ward, 1963[33]). The analysis was performed in Python using the SciPy and Seaborn libraries (Virtanen et al., 2020[34]; Waskom, 2021[35]). For multifloral honey samples, the floral values were represented by the arithmetic mean of the corresponding nectariferous floral species associated with each honey sample at the same geographical origin, allowing each floral–honey system to be represented as a single multivariate observation in the clustering analysis.
To facilitate the comparative interpretation of the individual phenolic profiles determined by UPLC-DAD, the identified compounds were classified as phenolic acids or flavonoids according to their chemical structure. Concentration patterns were examined independently for each phenolic group using descriptive analyses and graphical visualization. Comparative distributions among oven-dried flowers, freeze-dried flowers and honey samples were evaluated using boxplots. Heatmaps generated using the procedure described above were employed to identify similarities among samples and compounds. Sankey diagrams were additionally generated to visualize changes in the relative distribution of individual phenolic compounds between floral biomass and the associated honey samples.
These analyses were designed to provide an integrated visualization of phenolic composition across biologically connected matrices without assuming direct biochemical conversion of individual metabolites.
2.10. Statistical Analysis
All determinations were performed in triplicate and results were expressed as mean ± standard deviation. Statistical analyses were conducted according to the factorial structure of each experimental design. Analysis of variance (ANOVA) was used to evaluate the effects of the experimental factors and their interactions on physicochemical properties, total phenolic content, antioxidant activity and individual phenolic compounds, as appropriate for each experimental design. When significant effects were detected, mean comparisons were performed using Fisher's Least Significant Difference (LSD) test as a protected post hoc procedure at a significance level of p < 0.05. Statistical analyses were performed using STATGRAPHICS Centurion XVI, version 16.1.03 (StatPoint Technologies, Inc., Warrenton, VA, USA). Data organization and preprocessing were carried out in Microsoft Excel LTSC Professional Plus 2021 (Microsoft Corporation, Redmond, WA, USA), whereas graphical visualization and multivariate analyses were performed in Google Colab (Google LLC, Mountain View, CA, USA) using Python 3.11 with the pandas, NumPy, Matplotlib, SciPy, Seaborn and Plotly libraries.
3. Results
3.1. Total Phenolic Content and Antioxidant Activity across Floral and Honey Matrices
The total phenolic content (TPC) and antioxidant activity (Ax) of floral samples exhibited considerable variability among botanical origins and drying treatments (Figure 2). Complete treatmenst for TPC and Ax are presented in Appendix A (Table A1). Because nectariferous flowers constitute the biological starting point of honey biosynthesis, their characterization establishes the initial phenolic composition entering the honey biosynthetic process and provides the reference framework for subsequent comparisons with the corresponding honey samples.
As shown in Figure 2a, TPC differed significantly among botanical origins and drying treatments (p < 0.05), with freeze-dried floral samples consistently exhibiting higher phenolic concentrations than oven-dried floral samples. Under oven drying, the lowest TPC was recorded for the Xtabentún floral sample collected in Popolnah (sample 15), whereas the highest value was observed for the Chaká floral sample 11, from Peto (812.65 ± 32.05 mg GAE/100 g DM). However, this value did not differ significantly from that of the Dzidzilché floral sample collected in the same locality (809.32 ± 36.92 mg GAE/100 g DM; p > 0.05). Following freeze-drying, TPC increased in all floral samples. The highest concentration was detected in the Dzidzilché floral sample from Peto, which differed significantly from all other floral samples (p < 0.05), whereas the lowest TPC again corresponded to the Xtabentún floral sample from Popolnah (510.66 ± 72.29 mg GAE/100 g DM). Although freeze-drying substantially increased TPC across all floral samples, it did not modify the relative ranking of botanical origins according to TPC. Floral samples from Peto, particularly Dzidzilché and Chaká, consistently exhibited the highest TPC values under both drying treatments, whereas the Xtabentún floral sample from Popolnah consistently presented the lowest TPC regardless of the drying treatment.
A similar trend was observed for antioxidant activity (Ax) (Figure 2b), with significant differences among botanical origins and drying treatments (p < 0.05). Under oven drying, the highest Ax was recorded for the Dzidzilché floral sample from Acanceh (sample 1; 88.03 ± 0.56% inhibition). However, this value did not differ significantly from those of the Tahonal floral sample from Pixyah (sample 5; 87.89 ± 1.13% inhibition) and the Chaká floral sample from Peto (sample 11; 87.25 ± 0.21% inhibition) (p > 0.05). In contrast, the lowest antioxidant activity was observed in the Xtabentún floral sample from Popolnah (sample 15; 71.33 ± 3.03% inhibition), which did not differ significantly from the Xtabentún floral sample from Tahdziú (sample 7; p > 0.05), with both samples exhibiting the lowest Ax values under oven drying. Under freeze-drying, the highest Ax was detected in the Dzidzilché floral sample from Peto (sample 9; 96.82 ± 1.09% inhibition), which differed significantly from all other floral samples (p < 0.05), whereas the lowest antioxidant activity was again recorded for the Xtabentún floral sample from Popolnah (sample 15; 81.90 ± 1.75% inhibition). Overall, floral samples exhibiting the highest antioxidant activity also presented the highest TPC values, particularly the Dzidzilché floral sample from Peto following freeze-drying, whereas Xtabentún floral samples consistently exhibited the lowest antioxidant capacity under both drying treatments and among the lowest TPC values.
A multifactorial analysis of variance (ANOVA) was performed to identify the experimental factors contributing to the variability observed among floral samples. For TPC, geographical origin (GeO; p = 0.0015), botanical origin (BO; p < 0.0001) and drying treatment (DT; p < 0.0001) significantly affected the response. Among the interaction terms, only the GeO × BO interaction was significant (p = 0.0031), whereas the remaining two-way interactions and the three-way interaction were not significant (p > 0.05) (Figure 3a). A similar pattern was observed for antioxidant activity (Ax), for which GeO (p = 0.0066), BO (p = 0.0003) and DT (p < 0.0001) also exerted significant effects. Likewise, only the GeO × BO interaction significantly affected Ax (p = 0.0070), whereas the remaining.
Overall, these results indicate that the phenolic composition and antioxidant capacity of nectariferous flowers were independently influenced by geographical origin, botanical origin, and drying treatment, while the significant GeO × BO interaction suggests rather than acting independently, botanical identity and geographical origin jointly determined phenolic accumulation, indicating that the phenolic profile of nectariferous flowers could emerged from the interaction between species-specific metabolism and local environmental conditions.
3.2. Physicochemical Characterization of Honey Samples
The physicochemical characteristics of the honey samples are presented in Table 1. Soluble solids differed significantly among honey samples (p < 0.05). The highest value was recorded for the monofloral Dzidzilché honey from Tahdziú (90.00 ± 0.00 °Brix), whereas the monofloral Box muk honey from Tahdziú (77.00 ± 0.00 °Brix) and the multifloral Dzidzilché–Tahonal honey from Pixyah (77.50 ± 0.00 °Brix) exhibited the lowest soluble solids contents. These two samples were the only ones below the minimum value of 78 °Brix established by the Mexican standard. Honey pH also differed significantly among samples (p < 0.05), ranging from 3.69 ± 0.02 in the multifloral Box muk–Tahonal honey from Peto to 4.13 ± 0.01 in the multifloral Chaká–Jabín honey from Peto, although no regulatory limits have been established for this parameter. Titratable acidity varied significantly (p < 0.05), with the lowest value observed in the monofloral Tzalam honey from Popolnah (26.50 ± 2.12 meq kg⁻¹) and the highest in the monofloral Dzidzilché honey from Peto (46.00 ± 1.41 meq kg⁻¹). HMF content also differed significantly (p < 0.05), ranging from 7.2 ± 0.4 mg kg⁻¹ in the multifloral Tahonal–Xtabentún honey from Popolnah to 56.9 ± 0.4 mg kg⁻¹ in the multifloral Dzidzilché–Jabín honey from Pixyah. All honey samples exhibited HMF contents below the regulatory limit established by the Mexican standard for tropical honeys. Reducing sugars also varied significantly among honey samples (p < 0.05). The highest value was recorded for the monofloral Box muk honey from Tahdziú (82.75 ± 2.76%), although it did not differ significantly from the monofloral Dzidzilché and Jabín honeys from Tahdziú (80.40 ± 3.18% and 80.05 ± 3.15%, respectively). In contrast, the lowest value corresponded to the multifloral Tahonal–Xtabentún honey from Popolnah (64.85 ± 3.52%), which likewise did not differ significantly from the monofloral Tzalam honey from Popolnah (67.85 ± 2.71%), the multifloral Dzidzilché–Tahonal honey from Pixyah (67.70 ± 2.76%), the multifloral Chaká–Jabín honey from Peto (67.35 ± 3.55%), the multifloral Dzidzilché–Chaká–Jabín honey from Peto (69.35 ± 1.59%) and the multifloral Box muk–Tahonal honey from Peto (69.25 ± 1.97%). Nevertheless, all honey samples exceeded the minimum reducing sugar content required by the Mexican standard. Overall, the physicochemical characterization indicated that the analyzed honey samples exhibited compositional properties consistent with commercial-quality honey, providing an appropriate baseline for the subsequent evaluation of phenolic composition and antioxidant activity.
3.3. Total Phenolic Content and Antioxidant Activity of Honey Samples
Following characterization, total phenolic content (TPC) and antioxidant activity (Ax) were determined in the corresponding honey samples, revealing significant variation according to botanical origin, geographical origin, and honey type (Figure 4). Complete treatment is presented in Appendix A (Table A2 and Table A3). Total phenolic content differed significantly among the evaluated honey samples (Figure 4A). Within the monofloral honeys, the highest TPC was recorded in Dzidzilché honey from Peto (treatment 3), reaching 11.86 ± 0.89 mg GAE/100 g honey, whereas the lowest value corresponded to Dzidzilché honey from Acanceh (treatment 1), with 5.28 ± 0.47 mg GAE/100 g honey. In contrast, multifloral honeys exhibited substantially greater TPC values than monofloral honeys. The highest concentration was observed in Tahonal–Bejuco honey from Peto (treatment 13), reaching 25.95 ± 0.55 mg GAE/100 g honey, followed by Tahonal–Dzidzilché honey from Pixyah (treatment 8), with 24.30 ± 0.55 mg GAE/100 g honey, whereas the lowest TPC among multifloral honeys was found in Chaká–Jabín honey from Peto (treatment 12), with 14.67 ± 0.70 mg GAE/100 g honey. Overall, the multifloral honeys contained approximately two-fold higher phenolic concentrations than the monofloral honeys, suggesting that the contribution of nectar from multiple botanical sources increased the accumulation of phenolic compounds in the final honey.
In contrast, antioxidant activity followed an opposite trend (Figure 4B). Among the monofloral honeys, the greatest Ax was recorded in Tzalam honey from Popolnah (treatment 7), reaching 27.37 ± 2.16% inhibition, followed by Jabín honey from Acanceh (treatment 4), with 21.60 ± 0.36% inhibition, whereas the lowest activity corresponded to Box muk honey from Tahdziú (treatment 6), with 9.78 ± 0.06% inhibition. Antioxidant capacity in multifloral honeys remained markedly lower despite their higher TPC. The highest Ax within this group was detected in Dzidzilché–Jabín honey from Pixyah (treatment 9), reaching only 8.14 ± 0.71% inhibition, while the lowest value was observed in Tahonal–Bejuco honey from Peto (treatment 13), with 4.97 ± 0.17% inhibition. Therefore, although multifloral honeys accumulated considerably greater amounts of total phenolic compounds, these samples consistently exhibited lower antioxidant activity than monofloral honeys. Additionally, monofloral honeys showed lower TPC but substantially higher antioxidant activity, indicating that antioxidant performance in these samples was not solely determined by the total phenolic concentration but also by qualitative differences in phenolic composition and the relative abundance of individual antioxidant constituents.
To further investigate the sources of variation observed among honey samples, separate factorial analyses were performed for monofloral and multifloral honeys (Figure 5). Monofloral honeys were analyzed using an unbalanced 42 factorial design including geographical origin (GeO) and botanical origin (BO). For TPC (Figure 5a), only the GeO × BO interaction significantly affected the response (p = 0.0070), whereas the main effects of GeO and BO were not significant (p > 0.05). For Ax (Figure 5b), both the GeO × BO interaction (p = 0.0018) and GeO (p = 0.0080) significantly influenced antioxidant activity, whereas BO showed no significant effect (p > 0.05). These results indicate that, in monofloral honeys, variation in TPC was primarily explained by the combined influence of geographical and botanical origins, whereas antioxidant activity was influenced both by geographical origin and by its interaction with botanical origin.
In contrast, the unbalanced 3 × 6 factorial analyses performed for multifloral honeys detected no significant effects (p > 0.05) of geographical origin (GeO), botanical composition (BO), or their interaction on either TPC or Ax. These results indicate that, unlike monofloral honeys, the variability observed in multifloral honeys could not be attributed to the evaluated geographical or botanical factors, suggesting that the coexistence of multiple floral sources may attenuate or mask the individual contribution of each origin to the overall phenolic composition and antioxidant capacity.
To complement the factorial analyses, hierarchical cluster analysis based on Z-score standardized values of TPC and Ax was performed to explore the overall relationships among floral samples and the corresponding honey samples (Figure 6). The dendrogram separated the variables into two main clusters, distinguishing honey-related parameters from those determined in floral samples. Within the floral variables, TPC and Ax from freeze-dried samples clustered together and were subsequently associated with the oven-dried measurements, indicating that the overall phenolic and antioxidant patterns were more strongly preserved within the floral samples than between flowers and honey.
Among the evaluated systems, PE-DZ exhibited the highest standardized values for both honey TPC (Z = 2.02) and freeze-dried Ax (Z = 1.74), together with elevated values for oven-dried TPC (Z = 1.76), identifying this monofloral system as the most phenolic-rich and antioxidant-active across matrices. PIHOL-TD displayed the highest standardized freeze-dried TPC (Z = 2.60), accompanied by relatively high oven-dried Ax (Z = 0.65) and intermediate values for the remaining variables, suggesting that elevated phenolic content was not directly reflected in antioxidant activity. In contrast, TAH-BM exhibited the lowest standardized Ax in honey (Z = −1.89) and oven-dried flowers (Z = −2.62), together with reduced freeze-dried Ax (Z = −1.66) and low TPC in both floral samples (Z = −1.28 and −1.09), indicating consistently poor bioactive performance. Overall, the clustering analysis revealed that similarities among floral–honey systems were driven by the combined contribution of TPC and Ax rather than by any single variable, highlighting the multivariate nature of the relationships between nectariferous flowers and the honeys produced from them.
Overall, hierarchical clustering demonstrated that the similarity among samples was determined by the combined standardized responses of TPC and Ax rather than botanical or geographical origin alone. Although some systems, such as the monofloral Dzidzilché honey from Peto (PE-DZ), consistently exhibited high standardized values across multiple variables, others displayed contrasting responses between floral samples and honey. For example, PIHOL-TD exhibited the highest standardized TPC in freeze-dried floral samples but only intermediate antioxidant responses, whereas POTI-TZ showed relatively high Ax in honey despite comparatively low standardized values in the corresponding floral samples. These observations indicate that the biochemical transformation occurring during honey biosynthesis modifies the overall phenolic and antioxidant profiles. These multivariate patterns complement the factorial analyses by revealing global relationships among samples that cannot be identified through univariate comparisons alone. Consequently, a more detailed characterization at the individual compound level is required to identify the specific phenolic compounds underlying the observed clustering patterns.
3.4. Individual Polyphenol Profiles of Floral and Corresponding Honey Samples
To evaluate the overall distribution of phenolic compounds across the evaluated matrices, Figure 7 illustrates the mean concentration of each polyphenol calculated from all combined samples of oven-dried flowers, freeze-dried flowers, and honey. The concentration profiles of the quantified phenolic acids revealed clear matrix-dependent distribution patterns among these three groups (Figure 7a). Most phenolic acids were predominantly associated with floral tissues. Gallic acid reached its highest concentration in freeze-dried flowers (1.99 ± 0.02 mg GAE/100 g DM), chlorogenic acid accumulated mainly in freeze-dried flowers (14.14 ± 1.14 mg /100 g DM), p-coumaric acid was detected almost exclusively in freeze-dried flowers (2.33 ± 1.21 mg /100 g DM), whereas cinnamic acid reached 6.79 ± 0.82 and 9.70 ± 0.32 mg /100 g DM in oven- and freeze-dried flowers, respectively. In contrast to this general trend, protocatechuic acid exhibited a distinct accumulation pattern, becoming the predominant compound in honey, where it reached 30.82 ± 3.81 mg/100 g DM, whereas its maximum concentrations in oven- and freeze-dried flowers were only 0.47 ± 0.07 and 1.19 ± 0.26 mg /100 g DM, respectively. These distribution patterns were supported by the multifactorial analysis. These distribution patterns were supported by the multifactorial analysis (Table A4), which identified drying treatment as the principal source of variation for gallic acid (p = 0.0157), protocatechuic acid (p = 0.0121), and chlorogenic acid (p = 0.0018), while geographical origin exerted the strongest influence on protocatechuic acid and cinnamic acid (both p < 0.0001). Among the evaluated compounds, protocatechuic acid exhibited the most complex statistical response, with significant GeO × BO, GeO × DT, BO × DT, and GeO × BO × DT interactions (all p ≤ 0.0063), indicating that its accumulation depended on the combined effects of geographical origin, botanical origin, and drying treatment rather than on any single factor.
Compared with phenolic acids, flavonoids exhibited greater chemical diversity and a more pronounced matrix-dependent distribution (Figure 7b). Freeze-dried flowers contained the highest concentrations of most identified flavonoids, including catechin (120.56 ± 8.63 mg/100 g DM), rutin (54.37 ± 3.28 mg/100 g DM), quercetin + luteolin (44.20 ± 4.67 mg/100 g DM), diosmetin (17.15 ± 0.56 mg/100 g DM), neohesperidin (10.05 ± 1.21 mg/100 g DM), and naringenin (3.52 ± 0.87 mg/100 g DM), whereas honey contained only trace or negligible amounts of all flavonoids. Kaempferol represented the primary exception, reaching its highest concentration in oven-dried flowers (46.86 ± 3.58 mg/100 g DM) and substantially lower levels in freeze-dried flowers (2.24 ± 1.65 mg/100 g DM). Likewise, apigenin accumulated Kaempferol? predominantly in oven-dried flowers (5.67 ± 0.74 mg/100 g DM) compared to freeze-dried flowers (1.65 ± 0.46 mg/100 g DM). Diosmin + hesperidin remained abundant across both floral tissues, displaying higher levels in oven-dried flowers (11.46 ± 2.02 mg/100 g DM) than in freeze-dried flowers (7.83 ± 2.82 mg/100 g DM). The multifactorial analysis (Table A7) supported these distribution patterns, revealing that geographical origin and drying treatment were the principal factors governing the accumulation of catechin and rutin (p ≤ 0.0051), whereas quercetin + luteolin and neohesperidin were primarily affected by drying treatment (p = 0.0001 and p = 0.0004, respectively). In contrast, kaempferol showed a strong dependence on botanical origin (p < 0.0001), drying treatment (p = 0.0004), and their interaction (p = 0.0001), while naringenin and apigenin were mainly associated with botanical origin (p = 0.0137 and p = 0.0058, respectively).
To further examine the behaviour between freeze-dried floral samples and multifloral honeys, Pearson correlation analysis was performed using the concentrations of the 15 identified phenolic compounds (Figure 8). The filtered similarity network (Figure 8a), which retained only correlations with r ≥ 0.45, revealed marked differences in the connectivity of the evaluated multifloral honeys. The Pixyah Dzidzilché–Jabín honey showed the highest number of positive associations, exhibiting its strongest correlation with Box muk from Peto (r = 0.781), followed by Jabín from Tahdziú (r = 0.633), Jabín from Peto (r = 0.631), Chaká from Peto (r = 0.602), Box muk from Tahdziú (r = 0.598), Jabín from Acanceh (r = 0.555), Tahonal from Pixyah (r = 0.483), Xtabentún from Popolnah (r = 0.470), and Dzidzilché from Acanceh (r = 0.468). In contrast, the Pixyah Tahonal–Dzidzilché honey displayed only two positive associations above the selected threshold, corresponding to Tahonal from Pixyah (r = 0.483) and Tahonal from Peto (r = 0.470). The remaining multifloral honeys (PE–DZJACHA, PE–CHAJA, and PE–TBX) exhibited only weak positive correlations (r ≤ 0.125) or predominantly negative coefficients with the evaluated floral samples. These relationships were confirmed by the complete Pearson correlation matrix (Figure 8b), in which the strongest positive correlations were concentrated in the Pixyah Dzidzilché–Jabín honey, whereas the remaining multifloral honeys were characterized by weak or negative associations across most floral samples. Overall, the correlation patterns showed that the highest similarities were not restricted to floral samples collected in the same geographical origin as the corresponding honey.
Overall, the results revealed marked differences in total phenolic content, antioxidant capacity, and individual phenolic composition among the evaluated floral and honey samples as a function of botanical and geographical origin. While freeze-dried flowers exhibited distinct phenolic fingerprints and generally higher concentrations of individual phenolic compounds, the Pearson correlation analysis further revealed variable degrees of phenolic profile similarity between floral sources and multifloral honeys, providing an integrated overview of the flower–honey relationships evaluated in this study
4. Discussion
Among the evaluated floral matrices, freeze-dried Gymnopodium floribundum (Dzidzilche) collected in Peto exhibited the highest total phenolic content (1754.69 ± 128.67 mg GAE/100 g DM), together with the greatest antioxidant activity (96.82 ± 1.09% DPPH inhibition). These values position G. floribundum, a wild nectariferous species native to the Yucatán Peninsula, within the upper range of phenolic concentrations reported for edible and nectariferous flowers. Similar TPC values have been reported for freeze-dried inflorescences of pitseed goosefoot (Chenopodium berlandieri), a wild edible species (approximately 1,200–1,600 mg GAE/100 g DW), which is recognized as a rich source of phenolic compounds due to its adaptation to environmentally stressful conditions [36]. Likewise, Demasi et al. (2021) [37] evaluated eight edible flower species, including Calendula officinalis, Tropaeolum majus, Viola × wittrockiana, Begonia semperflorens, Centaurea cyanus and Tagetes patula, reporting total phenolic contents ranging from approximately 320 to 1,380 mg GAE/100 g DW, values generally lower than those obtained for G. floribundum in the present study. A similar comparison can be established with rose (Rosa spp.) petals, one of the most extensively investigated floral matrices because of their nutraceutical and cosmetic applications, for which freeze-dried materials have been reported to contain approximately 1,500–1,800 mg GAE/100 g DW, depending on the cultivar and postharvest conditions [38]. These comparisons indicate that the phenolic richness of G. floribundum is not only high within the native nectariferous flora of Yucatán but also comparable to or greater than that of internationally recognized phenolic-rich floral matrices. Moreover, the simultaneous occurrence of the highest TPC and antioxidant capacity suggests that phenolic compounds constituted the principal contributors to DPPH radical scavenging in this species, consistent with reports demonstrating a positive relationship between phenolic concentration and antioxidant activity in edible flowers [36,37]. This behavior is consistent with the preservation mechanism associated with freeze-drying, in which water is removed by sublimation under reduced pressure and low temperatures, thereby largely avoiding the liquid-water phase where diffusion-driven oxidative reactions readily occur. These conditions markedly restrict the activity of oxidative enzymes such as polyphenol oxidase and peroxidase, minimize oxygen exposure, and reduce the thermal degradation, oxidation, polymerization, and irreversible binding of phenolic compounds to proteins and cell-wall polysaccharides, thereby preserving both their chemical integrity and extractability In addition, ice-crystal sublimation generates a highly porous cellular microstructure that facilitates solvent penetration during extraction and improves the recovery of intracellular phenolics[39]. A comprehensive review by Nwankwo et al. (2023) [40] identified low processing temperature, reduced pressure, and limited oxidative exposure as the principal mechanisms responsible for the superior preservation of thermolabile phytochemicals during freeze-drying. Likewise, Feng and Bi (2022) [41] reviewed the effects of freeze-drying on fruits and vegetables and concluded that the preservation of cellular architecture and the increased porosity generated after sublimation contribute to higher phenolic stability and extraction efficiency compared with conventional drying methods. Vargas-Madriz et al. (2023) [36] compared freeze-drying and oven drying in leaves and inflorescences of Chenopodium berlandieri and found significantly greater retention of total phenolics, flavonoids, and antioxidant activity after lyophilization. Similarly, Baibuch et al. (2023) [38] evaluated freeze-dried Rosa spp. petals and reported superior preservation of phenolic composition and antioxidant properties relative to thermal dehydration, attributing these differences to the reduced thermal and oxidative stress associated with the freeze-drying process.
Among the evaluated monofloral honeys, Gymnopodium floribundum (Dzidzilché) honey collected in Peto exhibited the highest total phenolic content (11.86 ± 0.89 mg GAE/100 g honey). Like the corresponding floral matrix, this result highlights G. floribundum as one of the nectariferous species associated with the greatest phenolic accumulation within the evaluated Yucatecan flora. Although absolute TPC values reported for monofloral honeys vary considerably among studies because of differences in botanical origin, extraction procedures and analytical methodologies, numerous investigations consistently identify floral source as one of the principal determinants of honey phenolic composition. For example, monofloral honeys from Greece exhibited TPC values ranging from 72.1 ± 45.7 mg GAE/100 g in cotton honey to 203.7 ± 34.8 mg GAE/100 g in oak honey, whereas chestnut and heather honeys contained 149.9 ± 34.8 and 133.2 ± 24.4 mg GAE/100 g, respectively [42]. Also, a full review by Aumeeruddy et al. (2021) [43] summarized TPC values ranging from 31.85 to 117.65 mg GAE/100 g among Portuguese monofloral honeys, with strawberry tree and heather honeys consistently presenting the highest phenolic contents. Consistent with these observations, the present results demonstrated that both botanical and geographical origin contributed jointly to honey phenolic composition. The significant BO × GeO interaction observed for both TPC and antioxidant capacity mirrored the response previously identified in floral samples, indicating that the influence of botanical origin remained dependent on geographical origin after nectar was converted into honey. For example, Piscidia piscipula (Jabín) accumulated higher TPC in Peto than in Acanceh, Pixyah, or Tahdziú, whereas Viguiera dentata (Tahonal) exhibited different phenolic accumulation patterns between Peto and Popolnah, demonstrating that the same botanical origin did not maintain a consistent phytochemical performance across municipalities. Similar species-by-environment interactions have been reported in edible flowers from Oaxaca, where the influence of collection site on phenolic content, flavonoid concentration, and antioxidant activity differed among Agave salmiana, Yucca filifera, Diphysa americana, and Chamaedorea tepejilote [44]. Geographically separated populations of Achillea millefolium and A. arabica exhibited significant differences in phenolic acid and flavonoid composition despite belonging to the same species, indicating that geographical origin can influence the accumulation of secondary metabolites independently of taxonomy. These studies attributed such variation to differences in local environmental conditions, including temperature, solar radiation, altitude, soil characteristics, and water availability, which regulate the phenylpropanoid pathway and consequently affect phenolic biosynthesis. Moreover, not all compounds responded similarly to geographical gradients, suggesting compound-specific metabolic responses to local environmental conditions [4][46]. This pattern is consistent with the regulation of the phenylpropanoid pathway, whereby environmental factors such as water availability, irradiance, nutrient availability, and edaphic conditions modulate the activity of enzymes involved in phenolic biosynthesis, while the magnitude of this response ultimately depends on the genetic and metabolic characteristics of each species [45,47]. Such regulation is biologically plausible under the environmental heterogeneity of Yucatán, where differences in soil properties, vegetation composition, nutrient availability, and seasonal water balance have been documented among the sampled municipalities despite their shared tropical subhumid climate [48].Therefore, the interaction between botanical and geographical origin shapes the phenolic composition of floral matrices, providing the biochemical framework from which honey phenolic profiles subsequently evolve through the enzymatic and physicochemical transformations associated with honey maturation [7,41,49]. This interpretation was further supported by the heatmap, where PE-DZ consistently showed high standardized values for honey TPC (Z = 2.02) and antioxidant capacity (Z = 1.74), together with positive responses in both freeze-dried and oven-dried flowers. In contrast, PIHOL-TD exhibited the highest standardized TPC in freeze-dried flowers (Z = 2.60), but this increase was not accompanied by a comparable rise in antioxidant capacity (Z = 0.04). These contrasting patterns suggest that the preservation of the botanical–geographical signature is influenced not only by the number of phenolic compounds transferred from flowers to honey, but also by differences in their phenolic composition.
Among the evaluated multifloral honeys, the Tahonal–Bejuco honey collected in Peto exhibited the highest total phenolic content (25.95 ± 0.55 mg GAE/100 g honey). Ucuncu et al. (2025) reported a wide variation in the phenolic content of floral honeys from different districts of Türkiye (9.21–98.25 mg GAE/100 g) and attributed these differences to floral origin and local environmental conditions. This interpretation agrees with the present findings, where both botanical and geographical origin significantly influenced honey phenolic content [50]. Although multifloral honeys exhibited a higher mean TPC than monofloral honeys in the present study, they showed lower antioxidant activity. This apparent discrepancy suggests that the antioxidant properties of honey depend not only on the total amount and qualitative composition of phenolic compounds but also on the interactions between these compounds and other antioxidant constituents, including vitamins, carotenoids, proteins, enzymes, and Maillard reaction products, which collectively determine the overall antioxidant response. In addition, the radical-scavenging efficiency of phenolic compounds is strongly influenced by structural characteristics, such as the number and position of hydroxyl groups, the degree of conjugation, and synergistic or antagonistic interactions among individual phenolics. These factors may explain why honey samples with higher TPC do not necessarily exhibit greater antioxidant activity [7,49,51]. Similar observations have been reported by Aumeeruddy et al. (2021) [43], who emphasized that global spectrophotometric parameters provide only a partial representation of honey bioactivity because antioxidant capacity ultimately depends on the composition and relative abundance of individual phenolic compounds rather than their cumulative concentration.
In contrast, neither botanical nor geographical origin significantly affected TPC or antioxidant activity in multifloral honeys. This result suggests that the greater botanical complexity of multifloral honeys may mask differences that are readily detected in monofloral samples when only global spectrophotometric parameters are considered. In agreement with this interpretation, Pauliuc et al. (2020) [53] demonstrated that the discrimination of Romanian monofloral and multifloral honeys improved substantially when individual phenolic profiles were evaluated together with global antioxidant parameters, indicating that chromatographic characterization can reveal compositional differences that remain undetected using TPC or antioxidant activity alone. A comparable pattern was reported by Ciulu et al. (2016) [53], who observed substantial variability in the phenolic profiles of Italian Mediterranean multifloral honeys, attributing these differences to the relative contribution of multiple nectariferous species rather than to the predominance of a single botanical source. More recently, Aumeeruddy et al. (2021) [43] highlighted that multifloral honeys represent chemically heterogeneous matrices whose phenolic composition depends on the simultaneous contribution of multiple nectar sources, making global spectrophotometric parameters less effective for differentiating botanical origin. Similarly, Da Silva et al. (2016) [7] explained that the integration of nectar from numerous plant species dilutes the influence of individual botanical sources on overall compositional characteristics. These observations are consistent with the present study, where the integration of multiple floral resources attenuated the BO × GeO effect on both response variables. The heatmap further illustrated this behavior, as samples such as POTI-TZ (Popolnah-Tzalam) exhibited elevated antioxidant activity in honey (Z = 1.54) despite a negative standardized TPC value (Z = −0.74), while TAH-BM (Tahdziu-Box Muk) presented positive honey TPC (Z = 1.12) but consistently low antioxidant responses in floral matrices. Together, these findings indicate that comparable global TPC and antioxidant values may arise from distinct phenolic compositions, emphasizing that individual phenolic profiles provide greater discriminatory effect than global spectrophotometric measurements alone.
The individual phenolic profiles revealed a marked matrix-dependent redistribution of phenolic compounds. Whereas freeze-dried flowers contained high concentrations of several flavonoids, including catechin, rutin, and quercetin + luteolin, honey was characterized by the predominance of protocatechuic acid and comparatively lower concentrations of most remaining phenolics. A comparable shift has been described in studies investigating flavonoid degradation pathways rather than honey itself. Zenkevich et al. (2007) [54] demonstrated that oxidative degradation of quercetin generated protocatechuic acid as one of its principal low-molecular-weight products following cleavage of the heterocyclic C ring, while Makris and Rossiter (2002) [55] reported the formation of protocatechuic acid together with phloroglucinol carboxylic acid following hydroxyl radical-mediated oxidation of quercetin. More recently, Lin et al. (2022) [56] confirmed by UPLC-Q-TOF-MS/MS that quercetin degradation proceeds through oxidation and heterocyclic C-ring cleavage, generating protocatechuic acid as one of the major low-molecular-weight degradation products. This mechanism provides a plausible explanation for the predominance of protocatechuic acid and the concomitant reduction of flavonoid concentrations observed in the honey samples. Recent evidence indicates that structurally complex flavonoids undergo oxidative, enzymatic, and microbial transformations that progressively generate lower-molecular-weight phenolic acids. Quercetin, in particular, is susceptible to oxidative degradation through both enzymatic and non-enzymatic pathways, yielding several intermediate metabolites that ultimately converge toward simple hydroxybenzoic acids, including protocatechuic acid [54,55,56]. In addition to these oxidative reactions, enzymatic and microbial biotransformation pathways further contribute to the conversion of flavonoids into low-molecular-weight phenolic acids, reinforcing the role of protocatechuic acid as a common end product of flavonoid metabolism [57]. Similarly, the biotransformation of glycosylated flavonols such as rutin involves an initial deglycosylation to quercetin, followed by cleavage of the heterocyclic ring and subsequent formation of low-molecular-weight phenolic acids, among which protocatechuic acid has been consistently identified [58]. Flavan-3-ols such as catechin also undergo microbial catabolism involving ring-cleavage reactions and the formation of lower-molecular-weight phenolic metabolites, supporting the progressive conversion of structurally complex floral flavonoids into simpler phenolic compounds during biological transformation processes [59]. Although these pathways have been primarily described in enzymatic and microbial systems rather than directly during honey maturation, they are consistent with the present results, in which freeze-dried floral samples were dominated by catechin, rutin, and quercetin-containing flavonoids, whereas honey was characterized by the predominance of protocatechuic acid. Plant-derived polyphenols are transferred from nectar and other floral sources into honey, where glycosylated flavonoids may undergo enzymatic transformation by bee-derived enzymes during nectar processing [60]. The observed compositional shift therefore suggests that the phenolic profile of honey reflects both the selective persistence and the transformation of floral phenolics during nectar processing and honey maturation. This pattern was particularly evident for Gymnopodium floribundum (Dzidzilché) collected in Peto, which previously exhibited the highest total phenolic content and antioxidant activity among all floral matrices and whose corresponding monofloral honey also presented the highest TPC. Its freeze-dried flowers contained the highest concentration of catechin (998.72 ± 1.45 mg/100 g DM), together with elevated rutin (593.93 ± 2.46 mg/100 g DM) and quercetin + luteolin (210.36 ± 9.22 mg/100 g DM). The predominance of catechin provides a plausible explanation for the outstanding antioxidant properties of this floral matrix because flavan-3-ols possess one of the highest radical-scavenging efficiencies among naturally occurring flavonoids due to the catechol structure of the B ring and the presence of multiple hydroxyl groups capable of donating hydrogen atoms and stabilizing phenoxyl radicals [51]. Similar relationships between elevated catechin concentrations and increased antioxidant activity have been reported in edible flowers and medicinal plants, where catechin contributed disproportionately to total antioxidant activity despite representing only one component of the phenolic profile [61].
The coincidence of the highest TPC, antioxidant activity, and catechin concentration in G. floribundum suggests that this flavan-3-ol constitutes one of the principal contributors to the antioxidant potential of this floral resource. In contrast, the corresponding honey no longer exhibited catechin, rutin, or quercetin-containing flavonoids as the dominant constituents but instead showed a marked predominance of protocatechuic acid. This compositional transition is consistent with previously described oxidative and enzymatic degradation pathways of flavonoids, in which glycosylated flavonols are hydrolyzed to their aglycones and subsequently converted into simpler phenolic acids through oxidative cleavage reactions [54,55,56].
Catechin may also contribute to this compositional shift through oxidative degradation, although its transformation pathway differs from that of quercetin. Like quercetin, catechin contains a 3′,4′-dihydroxylated B ring, the structural moiety retained in protocatechuic acid. Recent mechanistic studies have demonstrated that flavan-3-ols readily undergo enzymatic oxidation through o-quinone formation, followed by C-ring cleavage and successive molecular rearrangements that generate progressively simpler phenolic structures. Using LC–MS-based metabolomics, Zha et al. (2022) [62] demonstrated that catechins progressively decreased during enzymatic oxidation while multiple oxidation products accumulated through these reaction pathways, supporting the conversion of structurally complex flavan-3-ols into lower-molecular-weight phenolic compounds. Likewise, Peng and Shahidi (2023) [63] demonstrated that oxidation of catechin derivatives promoted extensive cleavage of both the C and B rings, generating a variety of low-molecular-weight aldehydes and phenolic acids. These findings indicate that catechins are susceptible to oxidative fragmentation into simpler aromatic compounds under oxidizing conditions. Earlier biodegradation studies further identified protocatechuic acid as one of the principal intermediates formed during catechin catabolism. Sambandam and Mahadevan (1993) [64] detected protocatechuic acid, catechol, and phloroglucinol carboxylic acid during catechin degradation by Chaetomium cupreum, whereas Hopper and Mahadevan (1997) [65] reported protocatechuic acid, phloroglucinol carboxylic acid, phloroglucinol, resorcinol, and hydroxyquinol during catechin utilization by Bradyrhizobium japonicum. These microbial degradation pathways were later summarized by Rogowska-van der Molen et al. (2023) [66], who highlighted that catechin catabolism converges on protocatechuic acid and phloroglucinol carboxylic acid following heterocyclic ring cleavage. These observations support the progressive conversion of structurally complex flavan-3-ols into simpler hydroxybenzoic acids through oxidative and microbial transformation. Within this framework, the predominance of protocatechuic acid in the present honey samples is consistent with the selective transformation of floral flavonoids during nectar processing and honey maturation.
The contrasting correlation patterns among multifloral honeys underscore the complexity of flower–honey relationships. Pixyah honeys displayed stronger associations with several floral profiles, whereas Popolnah and Peto honeys showed weak or predominantly negative correlations. This heterogeneity is consistent with recent chromatographic studies showing that honey phenolic composition varies substantially within the same declared floral category and may be influenced by geographical origin, secondary nectar sources, and harvest period. Jaśkiewicz et al. (2025) [67], for example, analyzed 84 varietal honeys and found that neither clustering nor principal component analysis completely separated the botanical categories because of pronounced intravarietal variability. Nyarko et al. (2023) [68] reported TPC values ranging from 81.6 to 105.7 mg GAE/100 g among honeys from different regions of the United States and identified 12 compounds with potential geographical discriminatory value, whereas Hamiti et al. (2025) [69] found significant botanical and geographical differences among 44 Albanian honeys, with TPC ranging from 29.8 to 171 mg/kg and gallic acid from 5.5 to 127 mg/kg. Accordingly, the correlations extending across floral samples from different localities may reflect similarities in the relative distribution of shared phenolic compounds rather than an exclusive correspondence with geographical origin. The weak correlations recorded for most Peto and Popolnah honeys may indicate that their complete phenolic profiles were not closely represented by any single floral sample included in the analysis, potentially because several floral sources contributed simultaneously or because relevant nectariferous species were not represented in the evaluated set. Therefore, although phenolic profiling provides a useful complementary approach for examining multifloral honeys, these associations should be interpreted as chemical similarities rather than direct evidence of botanical contribution, emphasizing the combined influence of botanical diversity and geographical variability on the final phenolic composition of honey.
5. Conclusions
The results obtained in this study suggest that phenolic composition across related floral and honey matrices is influenced by a combination of processing and biological factors whose relative importance depends on the analyzed matrix. Freeze-drying preserved phenolic compounds and antioxidant activity more effectively than oven drying, confirming its suitability for the preparation of floral biomass intended for phenolic characterization. Botanical and geographical origin influenced the phenolic composition of flowers, and this pattern was also reflected in monofloral honeys, whereas neither factor significantly affected multifloral honeys, suggesting that their phenolic composition and antioxidant properties are likely determined by more complex interactions associated with the contribution of multiple floral sources. This behavior was particularly evident for Gymnopodium floribundum (Dzidzilché) from Peto, which consistently exhibited the greatest phenolic richness across the evaluated matrices. Its floral biomass was characterized by the predominance of catechin, rutin, and quercetin + luteolin, whereas the corresponding honey was dominated by protocatechuic acid. Although the biochemical mechanisms underlying this compositional shift were not directly investigated, the observed distribution is consistent with flavonoid degradation pathways previously described in the literature and suggests that selective transformation of the original floral phenolic pool may contribute to the phenolic profile ultimately expressed in honey. Likewise, the contrasting relationship between total phenolic content and antioxidant activity observed in monofloral and multifloral honeys indicates that antioxidant potential depends not only on the concentration of phenolic compounds but also on their qualitative composition. Overall, integrating floral and honey matrices provides a more comprehensive understanding of the factors governing honey phenolic composition, highlighting the value of evaluating related matrices to better understand the relationships between floral resources, postharvest processing, and the phenolic characteristics ultimately observed in honey. This integrative approach may serve as a useful framework for future studies on botanical authentication, phenolic traceability, and the biochemical processes underlying honey quality.
Author Contributions
Conceptualization, A.E.M.-O. and I.M.R.-B.; methodology, A.E.M.-O., K.A.A.-B. and A.U.-V.; software, A.E.M.-O. and K.A.A.-B.; validation, I.M.R.-B., M.O.R.-S., A.U.-V. and M.C.-Q.; formal analysis, I.M.R.-B., A.E.M.-O. and K.A.A.-B.; investigation, A.E.M.-O, A.U.-V., M.C.-Q. and I.M.R-B.; resources, I.M.R.-B.; data curation, A.E.M.-O. and K.A.A.-B.; writing—original draft preparation, A.E.M.-O.; writing—review and editing, A.E.M.-O., I.M.R.-B. M.C-Q, A.U.-V and M.O.R.-S.; visualization, A.E.M.-O. and K.A.A.-B.; supervision, I.M.R.-B. and M.O.R.-S.; project administration, I.M.R.-B. and M.C.-Q.; funding acquisition, I.M.R.-B. All authors have read and agreed to the published version of the manuscript.
Funding
This research received no external funding.
Data Availability Statement
We encourage all authors of articles published in MDPI journals to share their research data. In this section, please provide details regarding where data supporting reported results can be found, including links to publicly archived datasets analyzed or generated during the study. Where no new data were created, or where data is unavailable due to privacy or ethical restrictions, a statement is still required. Suggested Data Availability Statements are available in section “MDPI Research Data Policies” at https://www.mdpi.com/ethics.
Acknowledgments
The Secretariat of Science, Humanities, Technology, and Innovation of Mexico (SECIHTI), formerly CONAHCYT, which financed scholarship 1192863 for Andrea Elizabeth Mendoza-Osorno.
Conflicts of Interest
The authors declare no conflicts of interest.
Appendix A

Table A1.
Unbalance 5×8×2 experimental design for evaluating the effects of botanical origin, geographical origin and drying type on total polyphenol content, antioxidant capacity and polyphenol profile in flours from melliferous flowers.
Table A1.
Unbalance 5×8×2 experimental design for evaluating the effects of botanical origin, geographical origin and drying type on total polyphenol content, antioxidant capacity and polyphenol profile in flours from melliferous flowers.
| Exp | Coded values | Real values | Response variable | |||||
|---|---|---|---|---|---|---|---|---|
| X1 | X2 | X3 | GeO | BO | DT | TPC | Ax | |
| 1 | -2 | -3 | -1 | Peto | Bejuco | Freeze-dried | 997.53 ± 68.53 no | 84.36 ± 1.46 defgh |
| 2 | -2 | -2 | -1 | Peto | Tahonal | Freeze-dried | 948.86 ± 36.6 mn | 90.09 ± 1.85 jk |
| 3 | -1 | -2 | -1 | Pixyah | Tahonal | Freeze-dried | 1277.05 ± 43.93 q | 85.57 ± 0.73 efghij |
| 4 | 0 | -2 | -1 | Popolnah | Tahonal | Freeze-dried | 1292.5 ± 100.11 q | 93.96 ± 1.97 l |
| 5 | -2 | -1 | -1 | Peto | Dzidzilche | Freeze-dried | 1754.69 ± 128.67 s | 96.82 ± 1.09 m |
| 6 | -1 | -1 | -1 | Pixyah | Dzidzilche | Freeze-dried | 1174.03 ± 83.8 p | 94.22 ± 0.91 lm |
| 7 | 1 | -1 | -1 | Acanceh | Dzidzilche | Freeze-dried | 1431.24 ± 15.38 r | 92.39 ± 0.22 kl |
| 8 | 2 | -1 | -1 | Tahdziu | Dzidzilche | Freeze-dried | 920.09 ± 36.92 m | 85.3 ± 0.87 efghij |
| 9 | 2 | 0 | -1 | Tahdziu | Box Muk | Freeze-dried | 584.64 ± 9.92 h | 82.95 ± 0.78 bcde |
| 10 | -2 | 1 | -1 | Peto | Jabín | Freeze-dried | 773.42 ± 41 jk | 92.86 ± 1.16k l |
| 11 | -1 | 1 | -1 | Pixyah | Jabín | Freeze-dried | 809.32 ± 36.92 k | 93.95 ± 1.56 l |
| 12 | 1 | 1 | -1 | Acanceh | Jabín | Freeze-dried | 1030.85 ± 35.05 o | 92.63 ± 0.87 kl |
| 13 | 2 | 1 | -1 | Tahdziu | Jabín | Freeze-dried | 1141.62 ± 20.81 p | 93.16 ± 0.57 l |
| 14 | -2 | 2 | -1 | Peto | Chaká | Freeze-dried | 957.01 ± 15.69 mno | 83.43 ± 0.71 bcdef |
| 15 | 0 | 3 | -1 | Popolnah | Tzalam | Freeze-dried | 555.49 ± 9.72 gh | 84.89 ± 0.65 efghi |
| 16 | 0 | 4 | -1 | Popolnah | Xtabentun | Freeze-dried | 510.66 ± 72.3 fgh | 81.9 ± 1.75 bcd |
| 17 | -2 | -3 | 1 | Peto | Bejuco | Oven-dried | 386.13 ± 31.56 cde | 80.7 ± 2.87 b |
| 18 | -2 | -2 | 1 | Peto | Tahonal | Oven-dried | 537.39 ± 35.46 fg | 85.52 ± 0.81 efghij |
| 19 | -1 | -2 | 1 | Pixyah | Tahonal | Oven-dried | 732.03 ± 61.94 gh | 87.89 ± 1.13 ij |
| 20 | 0 | -2 | 1 | Popolnah | Tahonal | Oven-dried | 714.55 ± 21.02 ij | 86.3 ± 0.62 ghij |
| 21 | -2 | -1 | 1 | Peto | Dzidzilche | Oven-dried | 493.93 ± 41.33 k | 86.32 ± 0.57 ghij |
| 22 | -1 | -1 | 1 | Pixyah | Dzidzilche | Oven-dried | 809.32 ± 36.92 ij | 85.84 ± 0.59 fghij |
| 23 | 1 | -1 | 1 | Acanceh | Dzidzilche | Oven-dried | 294 ± 11.09 ab | 88.03 ± 0.57 ij |
| 24 | 2 | -1 | 1 | Tahdziu | Dzidzilche | Oven-dried | 661.96 ± 1.48 i | 86.41 ± 5.29 ghij |
| 25 | 2 | 0 | 1 | Tahdziu | Box Muk | Oven-dried | 263.45 ± 34.26 a | 73.12 ± 4.43 a |
| 26 | -2 | 1 | 1 | Peto | Jabín | Oven-dried | 400.03 ± 17.89 de | 86.07 ± 1.89 fghij |
| 27 | -1 | 1 | 1 | Pixyah | Jabín | Oven-dried | 453.71 ± 17.89 ef | 86.09 ± 0.39 fghij |
| 28 | 1 | 1 | 1 | Acanceh | Jabín | Oven-dried | 347.57 ± 1.33 bcd | 81.45 ± 0.57 bc |
| 29 | 2 | 1 | 1 | Tahdziu | Jabín | Oven-dried | 291.46 ± 31.56 ab | 83.64 ± 0.46 cdefg |
| 30 | -2 | 2 | 1 | Peto | Chaká | Oven-dried | 812.66 ± 32.05 k | 87.25 ± 0.21 hi |
| 31 | 0 | 3 | 1 | Popolnah | Tzalam | Oven-dried | 318.78 ± 18.44 abc | 86.56 ± 0.41 ghi |
| 32 | 0 | 4 | 1 | Popolnah | Xtabentun | Oven-dried | 252.62 ± 17.43 a | 71.34 ± 3.03 a |
Note: Exp = experiment; BO = botanical origin; GeO = geographical origin; DT = drying type; TPC = total polyphenol content (mg GAE/100 g DM); Ax = antioxidant capacity for DPPH (% inhibition).
Table A2.
Unbalance 4² factorial experimental design for the response variables total polyphenol content, antioxidant activity and individual polyphenol profile in monofloral honey originating from Acanceh, Tahdziu, Popolnah and Peto.
Table A2.
Unbalance 4² factorial experimental design for the response variables total polyphenol content, antioxidant activity and individual polyphenol profile in monofloral honey originating from Acanceh, Tahdziu, Popolnah and Peto.
| Exp | Coded values | Real values | Response variable | |||
|---|---|---|---|---|---|---|
| X1 | X2 | GeO | BO | TPC | Ax | |
| 1 | -2 | -2 | Acanceh | Dzidzilche | 5.28 ± 0.47 a | 20.32 ± 0.5 e |
| 2 | -1 | -2 | Tahdziu | Dzidzilche | 9.92 ± 0.56 c | 18.52 ± 0.25 d |
| 3 | 1 | -2 | Peto | Dzidzilche | 11.86 ± 0.89 d | 16.78 ± 0.62 c |
| 4 | -2 | -1 | Acanceh | Jabin | 5.38 ± 0.14 a | 21.6 ± 0.36 e |
| 5 | -1 | -1 | Tahdziu | Jabin | 8.7 ± 0.51 b | 13.68 ± 0.75 b |
| 6 | -1 | 0 | Tahdziu | Box Muk | 9.88 ± 0.77 c | 9.78 ± 0.06 a |
| 7 | 0 | 1 | Popolnah | Tzalam | 5.81 ± 0.42 a | 27.37 ± 2.16 f |
Note: Exp = experiment; BO = botanical origin; GeO = geographical origin; TPC = total polyphenol content (mg GAE/100 g); Ax = antioxidant capacity for DPPH (% inhibition).
Table A3.
Unbalance 3×6 experimental design to evaluate the effects of botanical origin and geographical origin on total polyphenol content and antioxidant capacity in multifloral honeys from Pixyah, PopolnahandPeto.
Table A3.
Unbalance 3×6 experimental design to evaluate the effects of botanical origin and geographical origin on total polyphenol content and antioxidant capacity in multifloral honeys from Pixyah, PopolnahandPeto.
| Exp | Coded values | Real values | Response variable | |||
|---|---|---|---|---|---|---|
| X1 | X2 | GeO | BO | TPC | Ax | |
| 1 | -1 | -2 | Pixyah | Tahonal-Dzidzilche | 24.3±0.55 ab | 5.5±0.17 e |
| 2 | -1 | -1 | Pixyah | Dzidzilche-Jabin | 21.24±0.18 d | 8.14±0.71 c |
| 3 | 0 | 0 | Popolnah | Tahonal-Xtabentun | 22.65±0.55 b | 6.01±0.17 d |
| 4 | 1 | 1 | Peto | Dzidzilche-Jabin-Chaká | 16.3±1.02d | 7.12±0.5 b |
| 5 | 1 | 2 | Peto | Chaká-Jabin | 14.67±0.7 d | 8±0.29 a |
| 6 | 1 | 3 | Peto | Tahonal-bejuco | 25.95±0.55 a | 4.97±0.17 f |
Note: Exp = experiment; BO = botanical origin; GeO = geographical origin; TPC = total polyphenol content (mg GAE/100 g); Ax = antioxidant capacity for DPPH (% inhibition).
Table A4.
P-values of the multifactorial ANOVA for phenolic acids in floral biomass.
| Phenolic compound | GeO | BO | DT | GeO×BO | GeO×DT | BO×DT | GeO×BO×DT |
|---|---|---|---|---|---|---|---|
| Gallic acid | 0.5833 | 0.0021 | 0.0157 | 0.1905 | 0.8342 | 0.0033 | 0.1419 |
| Protocatechuic acid | <0.0001 | 0.0725 | 0.0121 | 0.0011 | <0.0001 | 0.0062 | 0.0063 |
| Chlorogenic acid | 0.6157 | 0.0001 | 0.0018 | 0.8974 | 0.3809 | 0.5973 | 0.1186 |
| p-Coumaric acid | 0.6141 | 0.5211 | 0.2482 | 0.0234 | 0.6141 | 0.5211 | 0.0234 |
| Cinnamic acid | <0.0001 | 0.5723 | 0.0639 | 0.0531 | <0.0001 | 0.0001 | 0.0012 |
| Vanillin | 0.5012 | 0.3549 | 0.4671 | 0.0090 | 0.9302 | 0.5800 | 0.0006 |
Note: Only phenolic acids detected at quantifiable concentrations in multifloral honey samples were included in the statistical analysis. GeO = geographical origin; DT = drying type; BO = botanical origin. Effects were considered statistically significant at p < 0.05.
Table A5.
P-values of the multifactorial ANOVA evaluating the effects of geographical origin (GeO), botanical origin (BO)andtheir interaction on individual phenolic acids in multifloral honey samples (unbalanced 3 × 6 design).
Table A5.
P-values of the multifactorial ANOVA evaluating the effects of geographical origin (GeO), botanical origin (BO)andtheir interaction on individual phenolic acids in multifloral honey samples (unbalanced 3 × 6 design).
| Phenolic compound | GeO | BO | GeO × BO |
|---|---|---|---|
| Gallic acid | 0.0727 | 0.1389 | 0.0201 |
| Protocatechuic acid | 0.0010 | 0.9282 | 0.2685 |
| Vanillin | <0.0001 | 0.0001 | <0.0001 |
Note: Only phenolic acids detected at quantifiable concentrations in multifloral honey samples were included in the statistical analysis. GeO = geographical origin; BO = botanical origin. Effects were considered statistically significant at p < 0.05.
Table A6.
P-values of the multifactorial ANOVA evaluating the effects of geographical origin (GeO), botanical origin (BO)andtheir interaction on individual phenolic acids in monofloral honey samples (unbalanced 42 design).
Table A6.
P-values of the multifactorial ANOVA evaluating the effects of geographical origin (GeO), botanical origin (BO)andtheir interaction on individual phenolic acids in monofloral honey samples (unbalanced 42 design).
| Phenolic compound | GeO | BO | GeO × BO |
|---|---|---|---|
| Gallic acid | <0.0001 | <0.0001 | <0.0001 |
| Protocatechuic acid | 0.0106 | 0.1337 | 0.0371 |
| Chlorogenic acid | 0.6203 | 0.3220 | 0.5397 |
| Vanillin | 0.0604 | 0.6400 | 0.3299 |
Note: Only phenolic acids detected at quantifiable concentrations in multifloral honey samples were included in the statistical analysis. GeO = geographical origin; BO = botanical origin. Effects were considered statistically significant at p < 0.05.
Table A7.
P-values obtained from the multifactorial ANOVA for flavonoid concentrations in floral biomass.
Table A7.
P-values obtained from the multifactorial ANOVA for flavonoid concentrations in floral biomass.
| Flavonoid | GeO | BO | DT | GeO × BO | GeO × DT | BO × DT | GeO × BO × DT |
|---|---|---|---|---|---|---|---|
| Catechin | 0.0001 | 0.4805 | 0.0017 | 0.0199 | 0.0001 | 0.4622 | 0.0186 |
| Rutin | <0.0001 | 0.6113 | 0.0051 | <0.0001 | 0.1368 | 0.7183 | 0.0515 |
| Quercetin + luteolin | 0.8724 | 0.5545 | 0.0001 | 0.0003 | 0.6086 | 0.3331 | 0.0035 |
| Kaempferol | 0.3805 | <0.0001 | 0.0004 | 0.2947 | 0.4163 | 0.0001 | 0.2489 |
| Diosmin + hesperidin | 0.0578 | 0.3729 | 0.5547 | 0.0820 | 0.5792 | 0.0207 | 0.8066 |
| Neohesperidin | 0.2026 | 0.8336 | 0.0004 | 0.0902 | 0.1478 | 0.6176 | 0.6790 |
| Naringenin | 0.1617 | 0.0137 | 0.1833 | 0.0241 | 0.7060 | 0.3883 | 0.2763 |
| Apigenin | 0.3335 | 0.0058 | 0.4917 | 0.0024 | 0.4401 | 0.9289 | 0.3279 |
| Diosmetin | 0.9060 | 0.5063 | 0.5600 | 0.0206 | 0.2606 | 0.0023 | 0.9173 |
Note: Only phenolic acids detected at quantifiable concentrations in multifloral honey samples were included in the statistical. GeO = geographical origin; DT = drying type; BO = botanical origin. Effects were considered statistically significant at p < 0.05.
References
- Barberis, M.; Calabrese, D.; Galloni, M.; Nepi, M. Secondary Metabolites in Nectar-Mediated Plant–Pollinator Relationships. Plants 2023, 12, 550. [Google Scholar] [CrossRef] [PubMed]
- Slavković, F.; Bendahmane, A. Floral Phytochemistry: Impact of Volatile Organic Compounds and Nectar Secondary Metabolites on Pollinator Behavior and Health. Chem. Biodivers. 2023, 20, e202201139. [Google Scholar] [CrossRef] [PubMed]
- Cheynier, V.; Comte, G.; Davies, K.M.; Lattanzio, V.; Martens, S. Plant Phenolics: Recent Advances on Their Biosynthesis, Genetics and Ecophysiology. Plant Physiol. Biochem. 2013, 72, 1–20. [Google Scholar] [CrossRef] [PubMed]
- Stevenson, P.C.; Nicolson, S.W.; Wright, G.A. Plant Secondary Metabolites in Nectar: Impacts on Pollinators and Ecological Functions. Funct. Ecol. 2017, 31, 65–75. [Google Scholar] [CrossRef]
- Nicolson, S.W.; Human, H.; Pirk, C.W.W. Honey Bees Save Energy in Honey Processing by Dehydrating Nectar before Returning to the Nest. Sci. Rep. 2022, 12, 16224. [Google Scholar] [CrossRef] [PubMed]
- Farooq, S.; Ngaini, Z. The Enzymatic Role in Honey from Honey Bees and Stingless Bees. Curr. Org. Chem. 2023, 27, 1215–1229. [Google Scholar] [CrossRef]
- da Silva, P.M.; Gauche, C.; Gonzaga, L.V.; Costa, A.C.O.; Fett, R. Honey: Chemical Composition, Stability and Authenticity. Food Chem. 2016, 196, 309–323. [Google Scholar] [CrossRef] [PubMed]
- Yiğit, Y.; Yalçın, S.; Onbaşılar, E.E. Effects of Different Packaging Types and Storage Periods on Physicochemical and Antioxidant Properties of Honeys. Foods 2024, 13, 3594. [Google Scholar] [CrossRef] [PubMed]
- Cianciosi, D.; Forbes-Hernández, T.Y.; Afrin, S.; Gasparrini, M.; Reboredo-Rodriguez, P.; Manna, P.P.; Zhang, J.; Bravo-Lamas, L.; Martínez-Flórez, S.; Agudo-Toyos, P.; et al. Phenolic Compounds in Honey and Their Associated Health Benefits: A Review. Molecules 2018, 23, 2322. [Google Scholar] [CrossRef] [PubMed]
- Machado De-Melo, A.A.; Almeida-Muradian, L.B.; Sancho, M.T.; Pascual-Maté, A. Composition and Properties of Apis mellifera Honey: A Review. J. Apic. Res. 2018, 57, 5–37. [Google Scholar] [CrossRef]
- Sun, X.; Shu, R.; Qu, Y.; Dai, J. Determination of Metabolite Differences between Loquat Nectar and Honey by UPLC–MS/MS. PeerJ 2025, 13, e19988. [Google Scholar] [CrossRef] [PubMed]
- Brudzynski, K.; Miotto, D. Honey Melanoidins: Analysis of the Composition of High-Molecular-Weight Melanoidins Exhibiting Radical-Scavenging Activity. Food Chem. 2011, 127, 1023–1030. [Google Scholar] [CrossRef] [PubMed]
- Olas, B. Honey and Its Phenolic Compounds as an Effective Natural Medicine for Cardiovascular Diseases in Humans? Nutrients 2020, 12, 283. [Google Scholar] [CrossRef] [PubMed]
- Shafabakhsh, R.; Milajerdi, A.; Reiner, Ž.; Kolahdooz, F.; Amirani, E.; Mirzaei, H.; Barekat, M.; Asemi, Z. The Effects of Catechin on Endothelial Function: A Systematic Review and Meta-Analysis of Randomized Controlled Trials. Crit. Rev. Food Sci. Nutr. 2020, 60, 2369–2378. [Google Scholar] [CrossRef] [PubMed]
- Ghorbani, A. Mechanisms of Antidiabetic Effects of Flavonoid Rutin. Biomed. Pharmacother. 2017, 96, 305–312. [Google Scholar] [CrossRef] [PubMed]
- Chook, C.Y.B.; Cheung, Y.M.; Ma, K.Y.; Leung, F.P.; Zhu, H.; Niu, Q.J.; Wong, W.T.; Chen, Z.-Y. Physiological Concentration of Protocatechuic Acid Directly Protects Vascular Endothelial Function against Inflammation in Diabetes through Akt/eNOS Pathway. Front. Nutr. 2023, 10, 1060226. [Google Scholar] [CrossRef] [PubMed]
- Yan, S.; Yuan, Y.; Pan, F.; Mu, G.; Xu, H.; Xue, X. Exploring the Formation of Chemical Markers in Chaste Honey by Comparative Metabolomics: From Nectar to Mature Honey. J. Agric. Food Chem. 2024, 72, 10596–10604. [Google Scholar] [CrossRef] [PubMed]
- Visscher, P.K.; Seeley, T.D. Foraging Strategy of Honeybee Colonies in a Temperate Deciduous Forest. Ecology 1982, 63, 1790–1801. [Google Scholar] [CrossRef]
- Beekman, M.; Ratnieks, F.L.W. Long-Range Foraging by the Honey-Bee, Apis mellifera L. Funct. Ecol. 2000, 14, 490–496. [Google Scholar] [CrossRef]
- Zúñiga-Díaz, D.; Cetzal-Ix, W.; López-Castilla, H.; Noguera-Savelli, E.; Tamayo-Cen, I.; Martínez-Puc, J.F.; Basu, S.K. A Review of the Melliferous Flora of Yucatan Peninsula, Mexico, on the Basis for the Honey Production Cycle. J. Ethnobiol. Ethnomed. 2024, 20, 40. [Google Scholar] [CrossRef] [PubMed]
- Mendoza-Osorno, A.E.; Avilés-Betanzos, K.A.; Rodríguez-Buenfil, I.M.; Uc-Varguez, A.; Ramírez-Sucre, M.O. Phenolic Composition and Antioxidant Capacity of Native Nectariferous Flowers from Yucatán, Mexico. Processes 2023, 11, 3028. [Google Scholar] [CrossRef]
- Secretaría de Agricultura y Desarrollo Rural (SADER). Actividad Apícola, una Dulce Tradición de México para el Mundo; Gobierno de México: Ciudad de México, Mexico, 2025; Available online: https://www.gob.mx/agricultura/yucatan/articulos/actividad-apicola-una-dulce-tradicion-de-mexico-para-el-mundo-390814?idiom=es (accessed on 28 July 2026).
- Villanueva-Gutiérrez, R.; Roubik, D.W.; Porter-Bolland, L. Bee–Plant Interactions: Competition and Phenology of Flowers Visited by Bees. In Biodiversity and Conservation of the Yucatán Peninsula; Islebe, G.A., Calmé, S., León-Cortés, J.L., Schmook, B., Eds.; Springer: Cham, Switzerland, 2015; pp. 131–152. [Google Scholar] [CrossRef]
- Moguel-Ordóñez, Y.B.; Echazarreta-González, C.; Mora-Escobedo, R. Calidad Fisicoquímica de la Miel de Abeja Apis mellifera Producida en el Estado de Yucatán Durante Diferentes Etapas del Proceso de Producción y Tipos de Floración. Téc. Pecu. Méx. 2005, 43, 323–334. Available online: https://www.redalyc.org/pdf/613/61343303.pdf.
- Danner, N.; Molitor, A.M.; Schiele, S.; Härtel, S.; Steffan-Dewenter, I. Season and Landscape Composition Affect Pollen Foraging Distances and Habitat Choice of Honey Bees. Ecol. Appl. 2016, 26, 1920–1929. [Google Scholar] [CrossRef] [PubMed]
- Secretaría de Agricultura y Desarrollo Rural. Norma Oficial Mexicana NOM-004-SAG/GAN-2018, Producción de Miel y Especificaciones; Diario Oficial de la Federación: Ciudad de México, México, 2018; Available online: https://www.dof.gob.mx/nota_detalle_popup.php?codigo=5592435 (accessed on 12 July 2026).
- Bogdanov, S.; Ruoff, K.; Persano Oddo, L. Methods for the Characterisation of Honey; International Honey Commission. 2009. Available online: https://www.ihc-platform.net/ihcmethods2009.pdf (accessed on 10 July 2026).
- Miller, G.L. Use of Dinitrosalicylic Acid Reagent for Determination of Reducing Sugar. Anal. Chem. 1959, 31, 426–428. [Google Scholar] [CrossRef]
- White, J.W. Spectrophotometric Method for Hydroxymethylfurfural in Honey. J. Assoc. Off. Anal. Chem. 1979, 62, 509–514. [Google Scholar] [CrossRef]
- Avilés-Betanzos, K.A.; Cauich-Rodríguez, J.V.; González-Ávila, M.; Scampicchio, M.; Morozova, K.; Ramírez-Sucre, M.O.; Rodríguez-Buenfil, I.M. Natural Deep Eutectic Solvent Optimization to Obtain an Extract Rich in Polyphenols from Capsicum chinense Leaves Using an Ultrasonic Probe. Processes 2023, 11, 1729. [Google Scholar] [CrossRef]
- Singleton, V.L.; Orthofer, R.; Lamuela-Raventós, R.M. Analysis of Total Phenols and Other Oxidation Substrates and Antioxidants by Means of Folin–Ciocalteu Reagent. Methods Enzymol. 1999, 299, 152–178. [Google Scholar] [CrossRef]
- Brand-Williams, W.; Cuvelier, M.E.; Berset, C. Use of a Free Radical Method to Evaluate Antioxidant Activity. LWT—Food Sci. Technol. 1995, 28, 25–30. [Google Scholar] [CrossRef]
- Ward, J.H., Jr. Hierarchical Grouping to Optimize an Objective Function. J. Am. Stat. Assoc. 1963, 58, 236–244. [Google Scholar] [CrossRef]
- Virtanen, P.; Gommers, R.; Oliphant, T.E.; Haberland, M.; Reddy, T.; Cournapeau, D.; Burovski, E.; Peterson, P.; Weckesser, W.; Bright, J.; et al. SciPy 1.0: Fundamental Algorithms for Scientific Computing in Python. Nat. Methods 2020, 17, 261–272. [Google Scholar] [CrossRef] [PubMed]
- Waskom, M.L. Seaborn: Statistical Data Visualization. J. Open Source Softw. 2021, 6, 3021. [Google Scholar] [CrossRef]
- Vargas-Madriz, Á.F.; Kuri-García, A.; Luzardo-Ocampo, I.; Vargas-Madriz, H.; Pérez-Ramírez, I.F.; Anaya-Loyola, M.A.; Ferriz-Martínez, R.A.; Roldán-Padrón, O.; Hernández-Sandoval, L.; Guzmán-Maldonado, S.H.; et al. Impact of Drying Process on the Phenolic Profile and Antioxidant Capacity of Raw and Boiled Leaves and Inflorescences of Chenopodium berlandieri ssp. berlandieri. Molecules 2023, 28, 7235. [Google Scholar] [CrossRef] [PubMed]
- Demasi, S.; Caser, M.; Donno, D.; Enri, S.R.; Lonati, M.; Scariot, V. Exploring Wild Edible Flowers as a Source of Bioactive Compounds: New Perspectives in Horticulture. Folia Hortic. 2021, 33, 27–48. [Google Scholar] [CrossRef]
- Baibuch, S.; Zema, P.; Bonifazi, E.; Cabrera, G.; Mondragón Portocarrero, A.d.C.; Campos, C.; Malec, L. Effect of the Drying Method and Optimization of Extraction on Antioxidant Activity and Phenolic of Rose Petals. Antioxidants 2023, 12, 681. [Google Scholar] [CrossRef] [PubMed]
- Jakubczyk, E.; Gondek, E.; Kamińska-Dwórznicka, A.; Samborska, K. The Freeze-Drying of Foods—The Characteristic of the Process Course and the Effect of Its Parameters on the Physical Properties of Food Materials. Foods 2020, 9, 1488. [Google Scholar] [CrossRef] [PubMed]
- Nwankwo, C.S.; Okpomor, E.O.; Dibagar, N.; Wodecki, M.; Zwierz, W.; Figiel, A. Recent Developments in the Hybridization of the Freeze-Drying Technique in Food Dehydration: A Review on Chemical and Sensory Qualities. Foods 2023, 12, 3437. [Google Scholar] [CrossRef] [PubMed]
- Feng, S.; Bi, J. Freeze-Drying of Fruits and Vegetables in Food Industry: Effects on Phytochemicals and Bioactive Properties Attributes—A Comprehensive Review. Food Rev. Int. 2023, 39, 6611–6629. [Google Scholar] [CrossRef]
- Tananaki, C.; Rodopoulou, M.-A.; Dimou, M.; Kanelis, D.; Liolios, V. The Total Phenolic Content and Antioxidant Activity of Nine Monofloral Honey Types. Appl. Sci. 2024, 14, 4329. [Google Scholar] [CrossRef]
- Aumeeruddy, M.Z.; Aumeeruddy-Elalfi, Z.; Neetoo, H.; Zengin, G.; Mahomoodally, M.F. Monofloral Honeys as a Potential Source of Natural Antioxidants, Minerals and Medicine. Antioxidants 2021, 10, 1023. [Google Scholar] [CrossRef] [PubMed]
- Marcos-Gómez, R.; Vera-Guzmán, A.M.; Aquino-Bolaños, E.N.; Chávez-Servia, J.L.; Carrillo-Rodríguez, J.C. Phenolic Compounds and Antioxidant Activity in Edible Flower Species from Oaxaca. Appl. Sci. 2024, 14, 3136. [Google Scholar] [CrossRef]
- Cirak, C.; Radusiene, J.; Ivanauskas, L.; Janulis, V. Variation of Bioactive Secondary Metabolites in Achillea arabica Populations from Different Geographical Origins. S. Afr. J. Bot. 2022, 147, 425–433. [Google Scholar] [CrossRef]
- Radušienė, J.; Karpavičienė, B.; Raudone, L.; Vilkickyte, G.; Çırak, C.; Seyis, F.; Yayla, F.; Marksa, M.; Rimkienė, L.; Ivanauskas, L. Trends in Phenolic Profiles of Achillea millefolium from Different Geographical Gradients. Plants 2023, 12, 746. [Google Scholar] [CrossRef] [PubMed]
- Cheynier, V.; Comte, G.; Davies, K.M.; Lattanzio, V.; Martens, S. Plant Phenolics: Recent Advances on Their Biosynthesis, Genetics and Ecophysiology. Plant Physiol. Biochem. 2013, 72, 1–20. [Google Scholar] [CrossRef] [PubMed]
- Campo, J.; Merino, A. Linking Organic P Dynamics in Tropical Dry Forests to Changes in Rainfall Regime: Evidences of the Yucatan Peninsula. For. Ecol. Manag. 2019, 438, 75–85. [Google Scholar] [CrossRef]
- Alvarez-Suarez, J.M.; Gasparrini, M.; Forbes-Hernández, T.Y.; Mazzoni, L.; Giampieri, F. The Composition and Biological Activity of Honey: A Focus on Manuka Honey. Foods 2014, 3, 420–432. [Google Scholar] [CrossRef] [PubMed]
- Ucuncu, O.; Kalafat Kul, M.; Baltaci, C.; Aykoc, A.M. Physicochemical Properties of Fifteen Flower Honey Samples from Five Districts in Türkiye. Sci. Rep. 2026, 16, 1233. [Google Scholar] [CrossRef] [PubMed]
- Shahidi, F.; Ambigaipalan, P. Phenolics and Polyphenolics in Foods, Beverages and Spices: Antioxidant Activity and Health Effects—A Review. J. Funct. Foods 2015, 18, 820–897. [Google Scholar] [CrossRef]
- Pauliuc, D.; Dranca, F.; Oroian, M. Antioxidant Activity, Total Phenolic Content, Individual Phenolics and Physicochemical Parameters Suitability for Romanian Honey Authentication. Foods 2020, 9, 306. [Google Scholar] [CrossRef] [PubMed]
- Ciulu, M.; Spano, N.; Pilo, M.I.; Sanna, G. Recent Advances in the Analysis of Phenolic Compounds in Unifloral Honeys. Molecules 2016, 21, 451. [Google Scholar] [CrossRef] [PubMed]
- Zenkevich, I.G.; Eshchenko, A.Y.; Makarova, S.V.; Vitenberg, A.G.; Dobryakov, Y.G.; Utsal, V.A. Identification of the Products of Oxidation of Quercetin by Air Oxygenat Ambient Temperature. Molecules 2007, 12, 654–672. [Google Scholar] [CrossRef] [PubMed]
- Makris, D.P.; Rossiter, J.T. Hydroxyl Free Radical-Mediated Oxidative Degradation of Quercetin and Morin: A Preliminary Investigation. J. Food Compos. Anal. 2002, 15, 103–113. [Google Scholar] [CrossRef]
- Lin, S.; Zhang, H.; Simal-Gandara, J.; Cheng, K.-W.; Wang, M.; Cao, H.; Xiao, J. Investigation of New Products of Quercetin Formed in Boiling Water via UPLC-Q-TOF-MS/MS Analysis. Food Chem. 2022, 386, 132747. [Google Scholar] [CrossRef] [PubMed]
- Cardona, F.; Andrés-Lacueva, C.; Tulipani, S.; Tinahones, F.J.; Queipo-Ortuño, M.I. Benefits of Polyphenols on Gut Microbiota and Implications in Human Health. J. Nutr. Biochem. 2013, 24, 1415–1422. [Google Scholar] [CrossRef] [PubMed]
- Jaganath, I.B.; Mullen, W.; Lean, M.E.J.; Edwards, C.A.; Crozier, A. In Vitro Catabolism of Rutin by Human Fecal Bacteria and the Antioxidant Capacity of Its Catabolites. Free Radic. Biol. Med. 2009, 47, 1180–1189. [Google Scholar] [CrossRef] [PubMed]
- Stevens, J.F.; Maier, C.S. The Chemistry of Gut Microbial Metabolism of Polyphenols. Phytochem. Rev. 2016, 15, 425–444. [Google Scholar] [CrossRef] [PubMed]
- Istasse, T.; Jacquet, N.; Berchem, T.; Haubruge, E.; Nguyen, B.K.; Richel, A. Extraction of Honey Polyphenols: Method Development and Evidence of Cis Isomerization. Anal. Chem. Insights 2016, 11, 49–57. [Google Scholar] [CrossRef] [PubMed]
- Que, F.; Mao, L.; Zheng, X. In vitro and vivo antioxidant activities of daylily flowers and the involvement of phenolic compounds. Asia Pac. J. Clin. Nutr. 2007, 16 Suppl 1, 196–203. Available online: https://pubmed.ncbi.nlm.nih.gov/17392104/. [PubMed]
- Zha, M.; Lian, L.; Wen, M.; Ercisli, S.; Ren, Y.; Jiang, Z.; Ho, C.-T.; Zhang, L. The Oxidation Mechanism of Flavan-3-ols by an Enzymatic Reaction Using Liquid Chromatography–Mass Spectrometry-Based Metabolomics Combined with Captured o-Quinone Intermediates of Flavan-3-ols by o-Phenylenediamine. J. Agric. Food Chem. 2022, 70, 5715–5727. [Google Scholar] [CrossRef] [PubMed]
- Peng, H.; Shahidi, F. Oxidation and Degradation of (Epi)gallocatechin Gallate (EGCG/GCG) and (Epi)catechin Gallate (ECG/CG) in Alkali Solution. Food Chem. 2023, 408, 134815. [Google Scholar] [CrossRef] [PubMed]
- Sambandam, T.; Mahadevan, A. Degradation of Catechin and Purification and Partial Characterization of Catechin Oxygenase from Chaetomium cupreum. World J. Microbiol. Biotechnol. 1993, 9, 37–44. [Google Scholar] [CrossRef] [PubMed]
- Hopper, W.; Mahadevan, A. Degradation of Catechin by Bradyrhizobium japonicum. Biodegradation 1997, 8, 159–165. [Google Scholar] [CrossRef]
- Rogowska-van der Molen, M.A.; Berasategui-Lopez, A.; Coolen, S.; Jansen, R.S.; Welte, C.U. Microbial Degradation of Plant Toxins. Environ. Microbiol. 2023, 25, 2988–3010. [Google Scholar] [CrossRef] [PubMed]
- Jaśkiewicz, K.; Szczęsna, T.; Jachuła, J. How Phenolic Compounds Profile and Antioxidant Activity Depend on Botanical Origin of Honey—A Case of Polish Varietal Honeys. Molecules 2025, 30, 360. [Google Scholar] [CrossRef] [PubMed]
- Nyarko, K.; Boozer, K.; Greenlief, C.M. Profiling of the Polyphenol Content of Honey from Different Geographical Origins in the United States. Molecules 2023, 28, 5011. [Google Scholar] [CrossRef] [PubMed]
- Hamiti, X.; Shallari, G.; Pupuleku, B.; Yücel, A.; Çelik, S.; Sulejmani, E.; Lazo, P. Phenolic Profiling of Albanian Honeys by LC–MS/MS: Gallic Acid as a Predictive Marker of Antioxidant Potential. Molecules 2025, 30, 4037. [Google Scholar] [CrossRef] [PubMed]
Figure 1.
Native nectariferous species and sampling localities evaluated in the study. (a) Representative flowers of the nectariferous species included in the study: DZ, Dzidzilché (Gymnopodium floribundum Rolfe); JA, Jabín (Piscidia piscipula L. Sarg.); XT, Xtabentún (Turbina corymbosa (L.) Raf.); TH, Tahonal (Viguiera dentata (Cav.) Spreng.); CH, Chaká (Bursera simaruba (L.) Sarg.); TZ, Tzalam (Lysiloma latisiliquum (L.) Benth.); and BM, Box muk (Haematoxylum campechianum L.). (b) Geographic location of the sampling sites in Yucatán, Mexico: (1) Acanceh, (2) Pixyah (Holenchén), (3) Tahdziú, (4) Peto, (5) Popolnah Apiary 1 (Tizimín), and (6) Popolnah Apiary 2 (Tizimín).
Figure 1.
Native nectariferous species and sampling localities evaluated in the study. (a) Representative flowers of the nectariferous species included in the study: DZ, Dzidzilché (Gymnopodium floribundum Rolfe); JA, Jabín (Piscidia piscipula L. Sarg.); XT, Xtabentún (Turbina corymbosa (L.) Raf.); TH, Tahonal (Viguiera dentata (Cav.) Spreng.); CH, Chaká (Bursera simaruba (L.) Sarg.); TZ, Tzalam (Lysiloma latisiliquum (L.) Benth.); and BM, Box muk (Haematoxylum campechianum L.). (b) Geographic location of the sampling sites in Yucatán, Mexico: (1) Acanceh, (2) Pixyah (Holenchén), (3) Tahdziú, (4) Peto, (5) Popolnah Apiary 1 (Tizimín), and (6) Popolnah Apiary 2 (Tizimín).
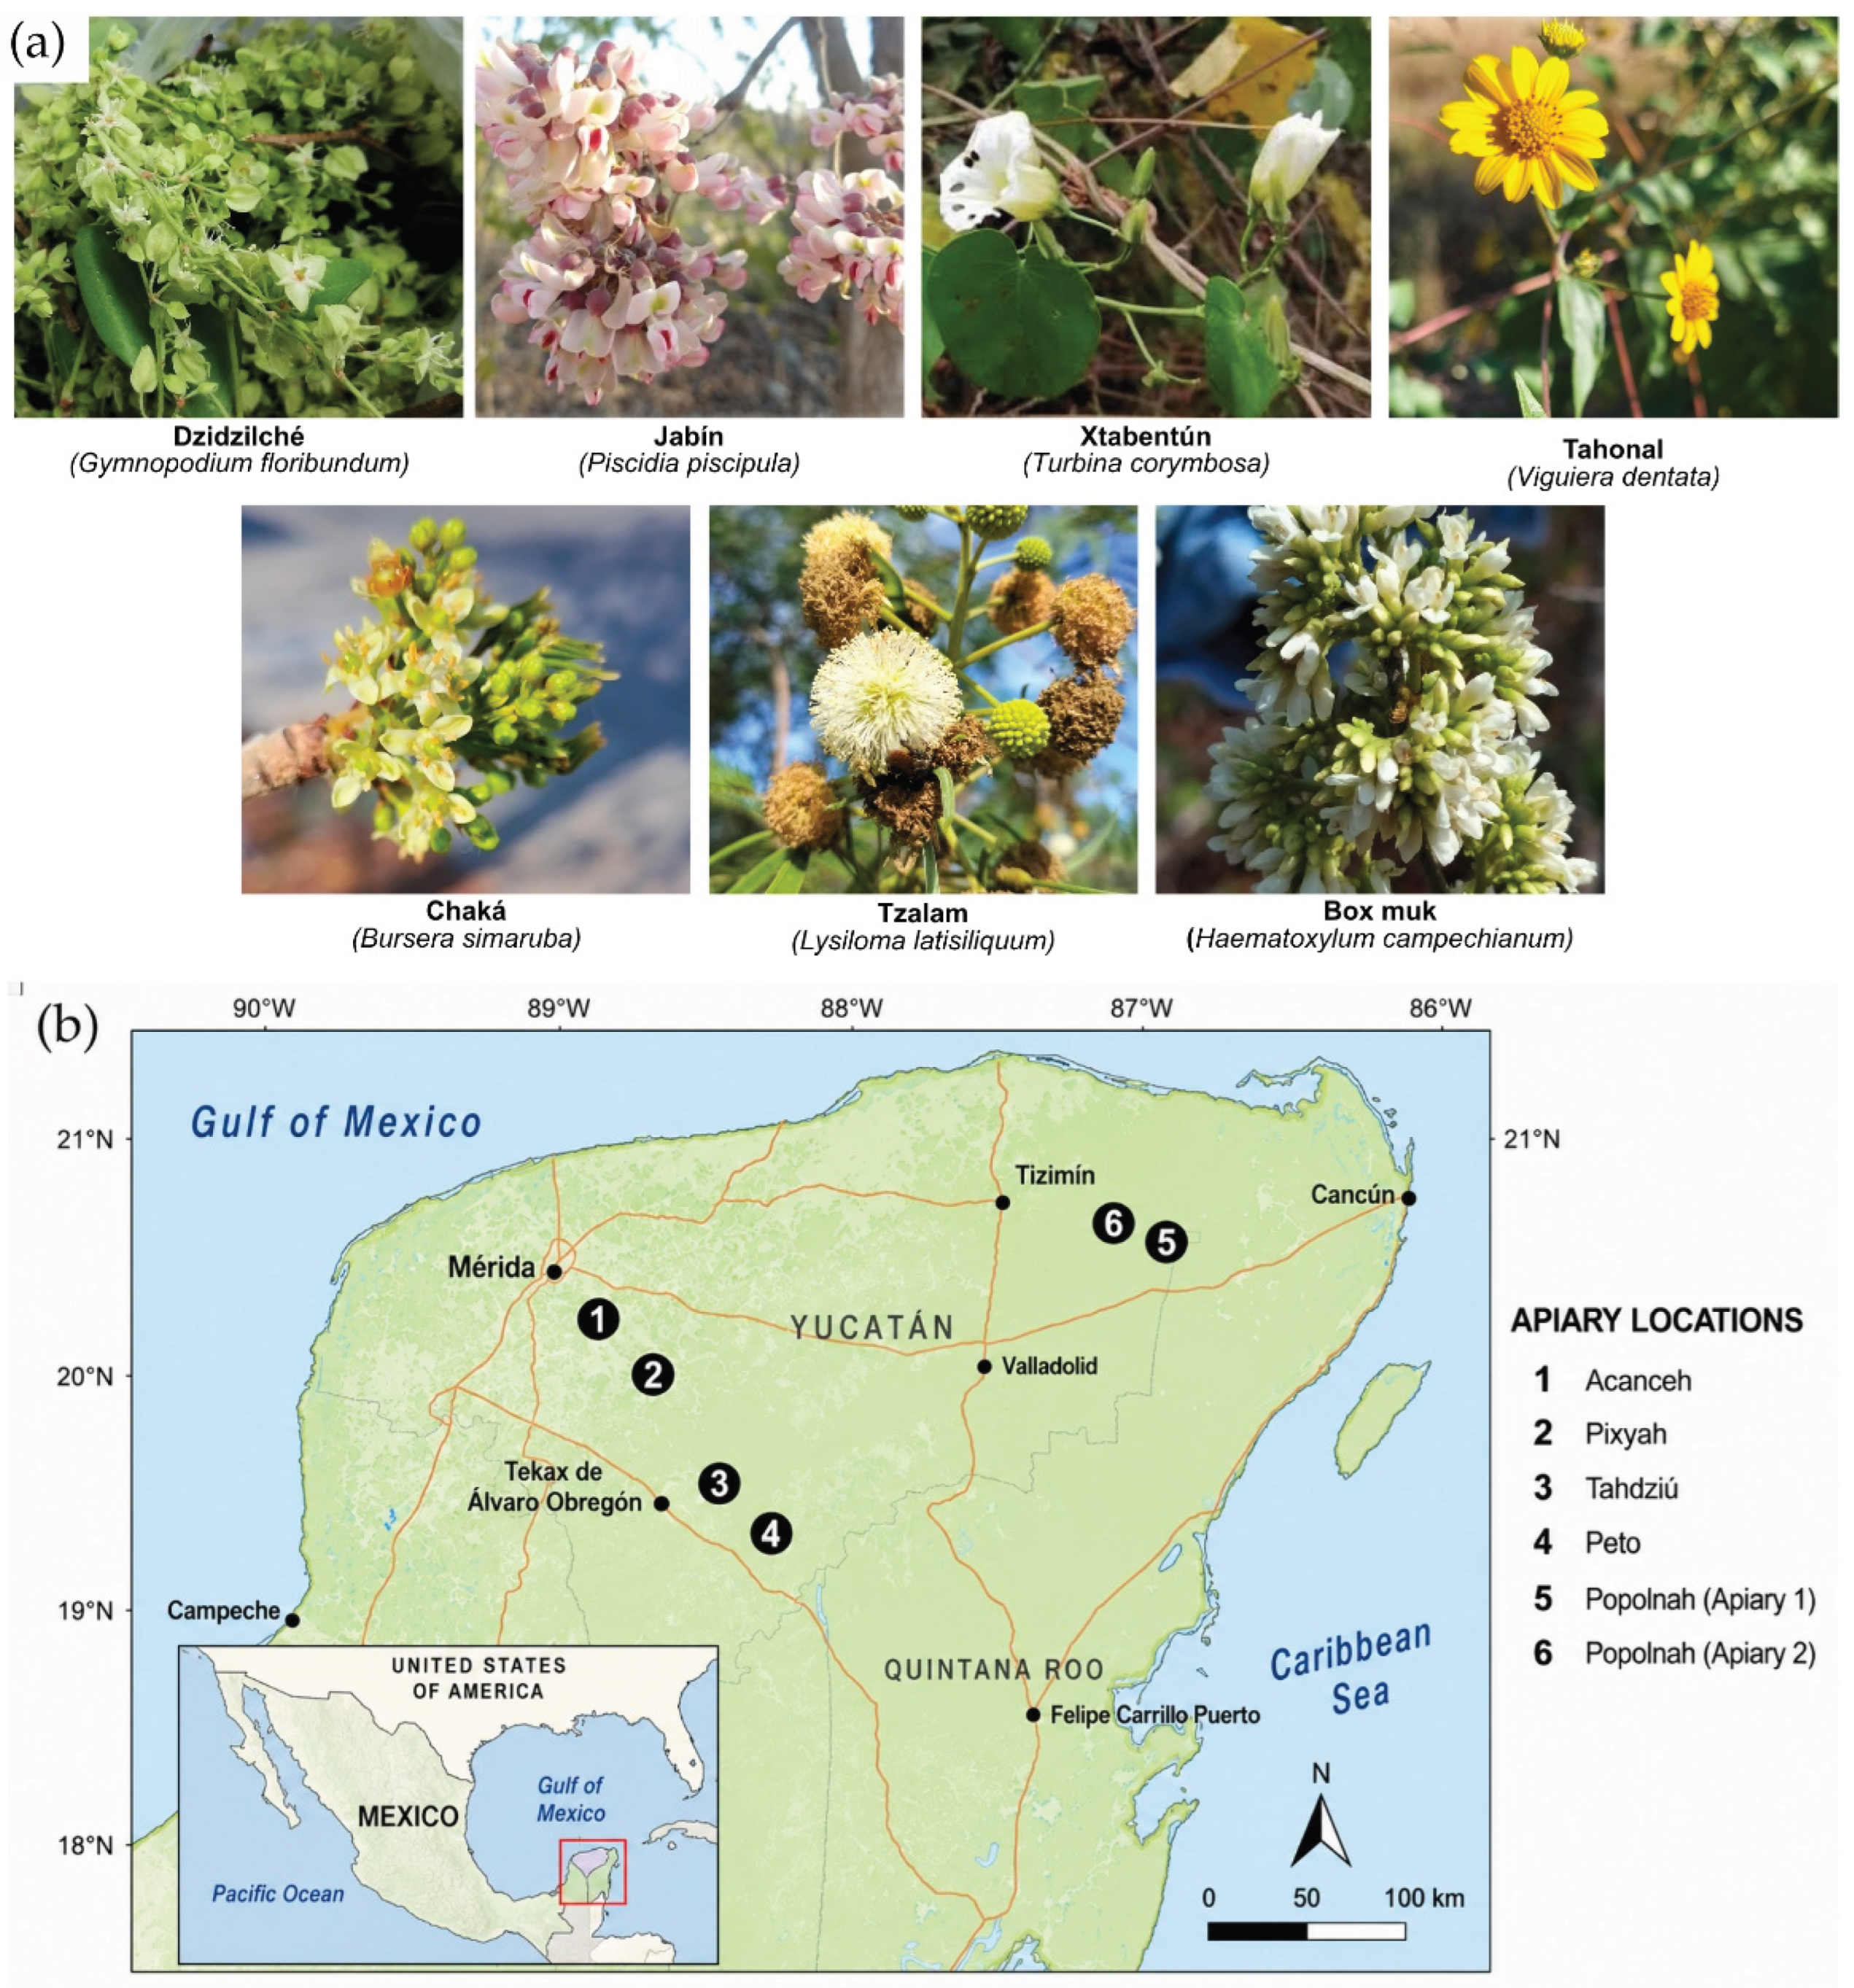
Figure 2.
(TPC) Total phenolic content (a) and (Ax) antioxidant activity (b) of freeze-dried (blue) and oven-dried (red) floral biomass. Error bars represent standard deviation (n = 3). Different lowercase letters indicate significant differences among TPC and Ax means according to LSD test (p < 0.05). Sample numbers correspond to: (1) Dzidzilché (Acanceh); (2) Jabín (Acanceh); (3) Dzidzilché (Pixyah); (4) Jabín (Pixyah); (5) Tahonal (Pixyah); (6) Dzidzilché (Tahdziu); (7) Box muk (Tahdziu); (8) Jabín (Tahdziu); (9) Dzidzilché (Peto); (10) Jabín (Peto); (11) Chaká (Peto); (12) Tahonal (Peto); (13) Box Muk (Peto); (14) Tahonal (Popolnah); (15) Xtabentun (Popolnah); (16) Tzalam (Popolnah).
Figure 2.
(TPC) Total phenolic content (a) and (Ax) antioxidant activity (b) of freeze-dried (blue) and oven-dried (red) floral biomass. Error bars represent standard deviation (n = 3). Different lowercase letters indicate significant differences among TPC and Ax means according to LSD test (p < 0.05). Sample numbers correspond to: (1) Dzidzilché (Acanceh); (2) Jabín (Acanceh); (3) Dzidzilché (Pixyah); (4) Jabín (Pixyah); (5) Tahonal (Pixyah); (6) Dzidzilché (Tahdziu); (7) Box muk (Tahdziu); (8) Jabín (Tahdziu); (9) Dzidzilché (Peto); (10) Jabín (Peto); (11) Chaká (Peto); (12) Tahonal (Peto); (13) Box Muk (Peto); (14) Tahonal (Popolnah); (15) Xtabentun (Popolnah); (16) Tzalam (Popolnah).
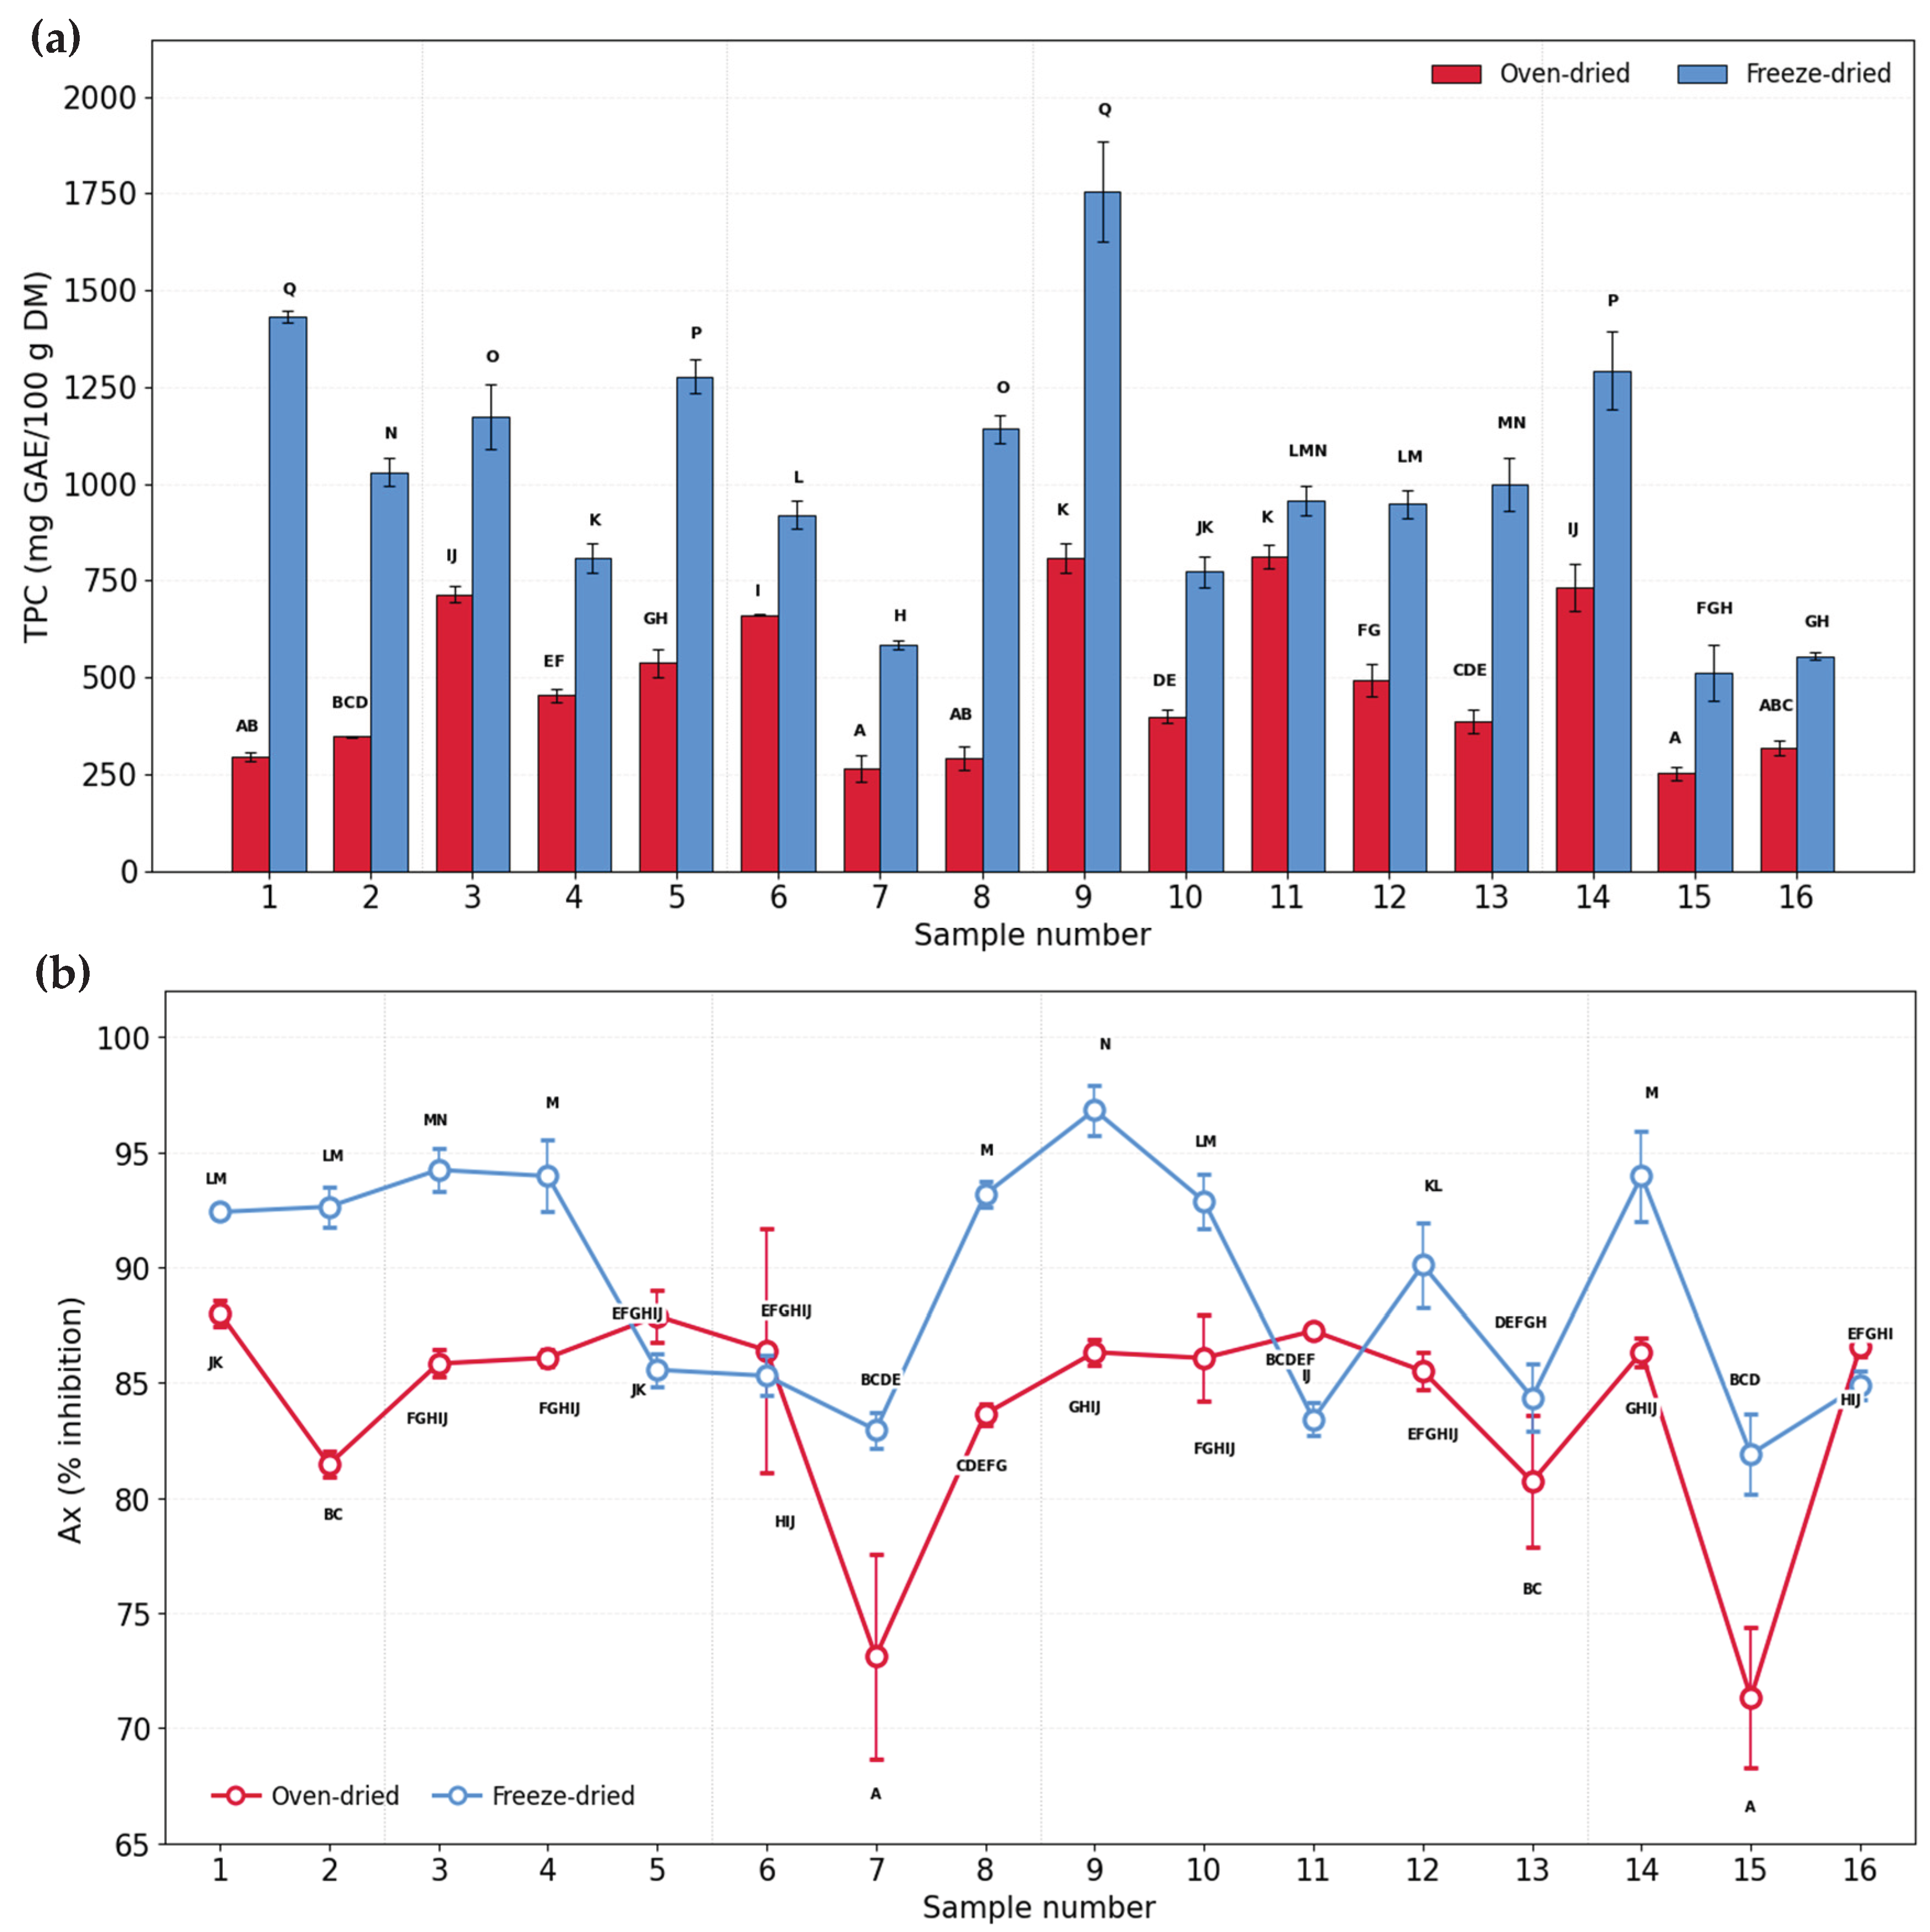
Figure 3.
Standardized Pareto charts obtained from the unbalance 5 × 8 × 2 factorial designs evaluating the effects of geographical origin, botanical origin and drying treatment on TPC (a) and Ax (b) of floral samples. The vertical blue reference line denotes the significance threshold (p < 0.05).
Figure 3.
Standardized Pareto charts obtained from the unbalance 5 × 8 × 2 factorial designs evaluating the effects of geographical origin, botanical origin and drying treatment on TPC (a) and Ax (b) of floral samples. The vertical blue reference line denotes the significance threshold (p < 0.05).
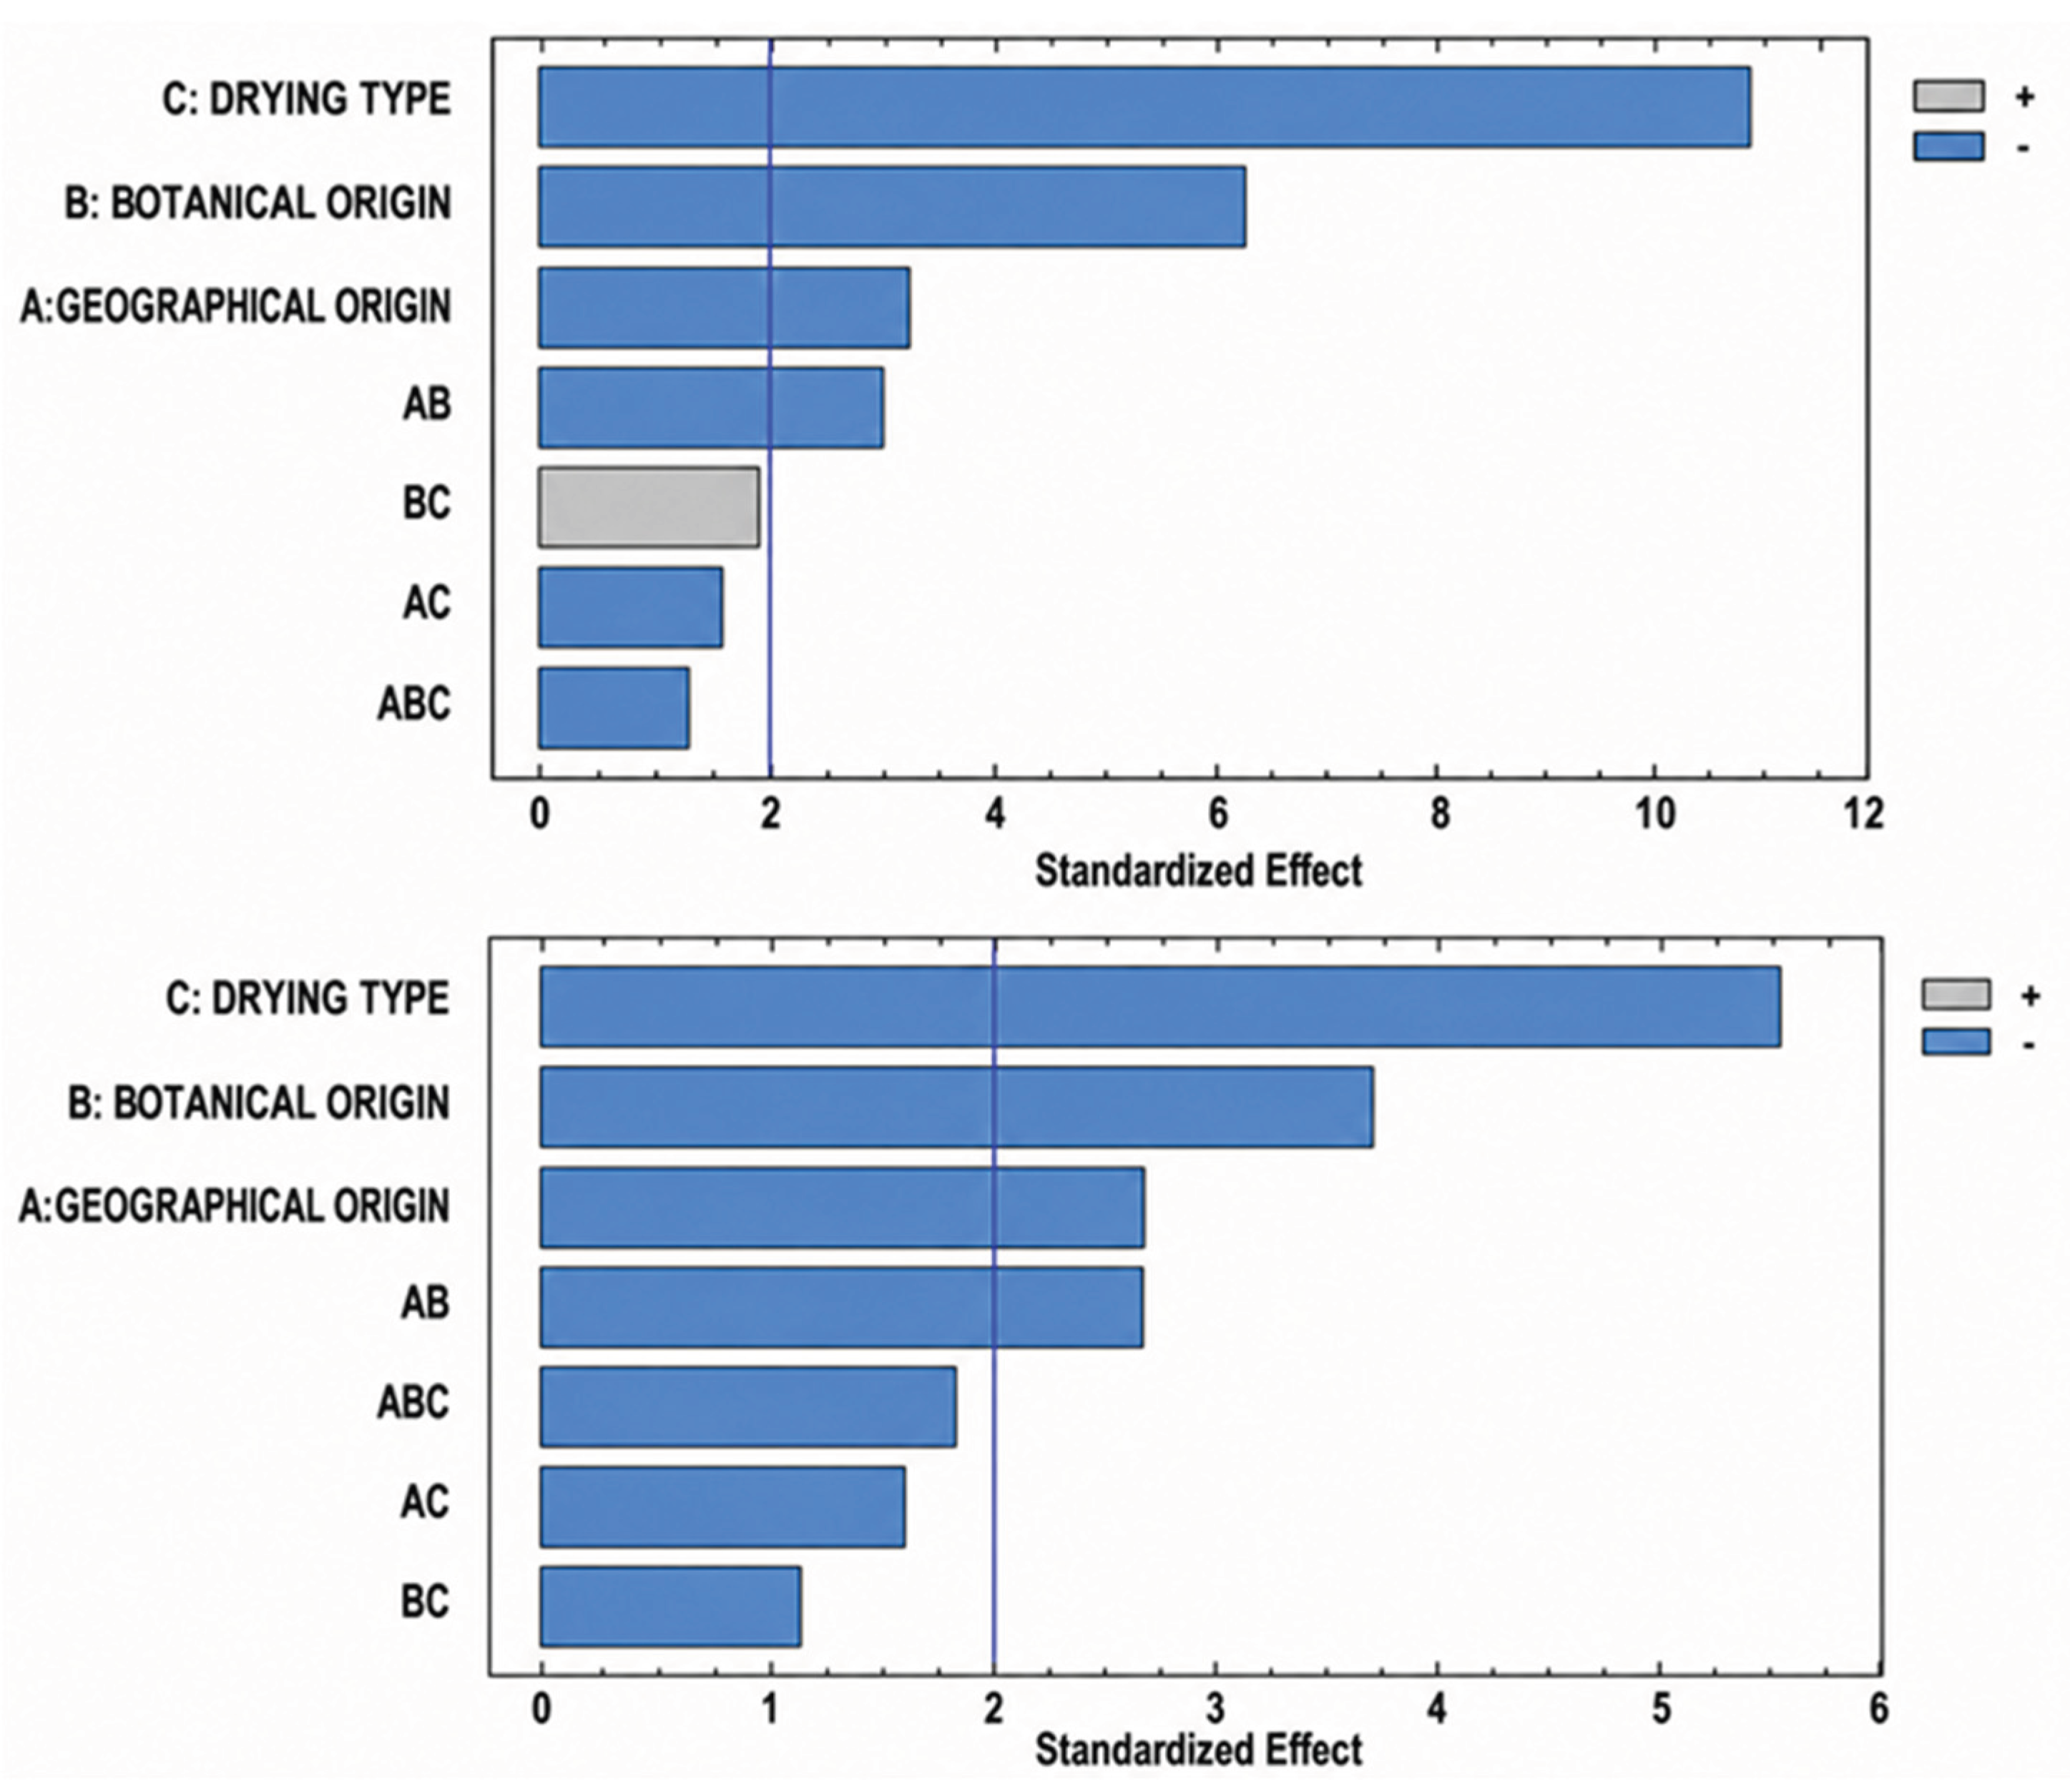
Figure 4.
Total phenolic content (a) and antioxidant activity (b) of honey samples obtained from different nectariferous species, corresponding to: 1 = Dzidzilché–Acanceh; 2 = Jabín–Acanceh; 3 = Dzidzilché + Jabín–Pixyah; 4 = Tahonal + Dzidzilché–Pixyah; 5 = Box muk–Tahdziú; 6 = Dzidzilché–Tahdziú; 7 = Jabín–Tahdziú; 8 = Dzidzilché–Peto; 9 = Dzidzilché + Jabín + Chaká–Peto; 10 = Tahonal + Box muk–Peto; 11 = Chaká + Jabín–Peto; 12 = Tzalam–Popolnah; and 13 = Tahonal + Xtabentún–Popolnah.
Figure 4.
Total phenolic content (a) and antioxidant activity (b) of honey samples obtained from different nectariferous species, corresponding to: 1 = Dzidzilché–Acanceh; 2 = Jabín–Acanceh; 3 = Dzidzilché + Jabín–Pixyah; 4 = Tahonal + Dzidzilché–Pixyah; 5 = Box muk–Tahdziú; 6 = Dzidzilché–Tahdziú; 7 = Jabín–Tahdziú; 8 = Dzidzilché–Peto; 9 = Dzidzilché + Jabín + Chaká–Peto; 10 = Tahonal + Box muk–Peto; 11 = Chaká + Jabín–Peto; 12 = Tzalam–Popolnah; and 13 = Tahonal + Xtabentún–Popolnah.
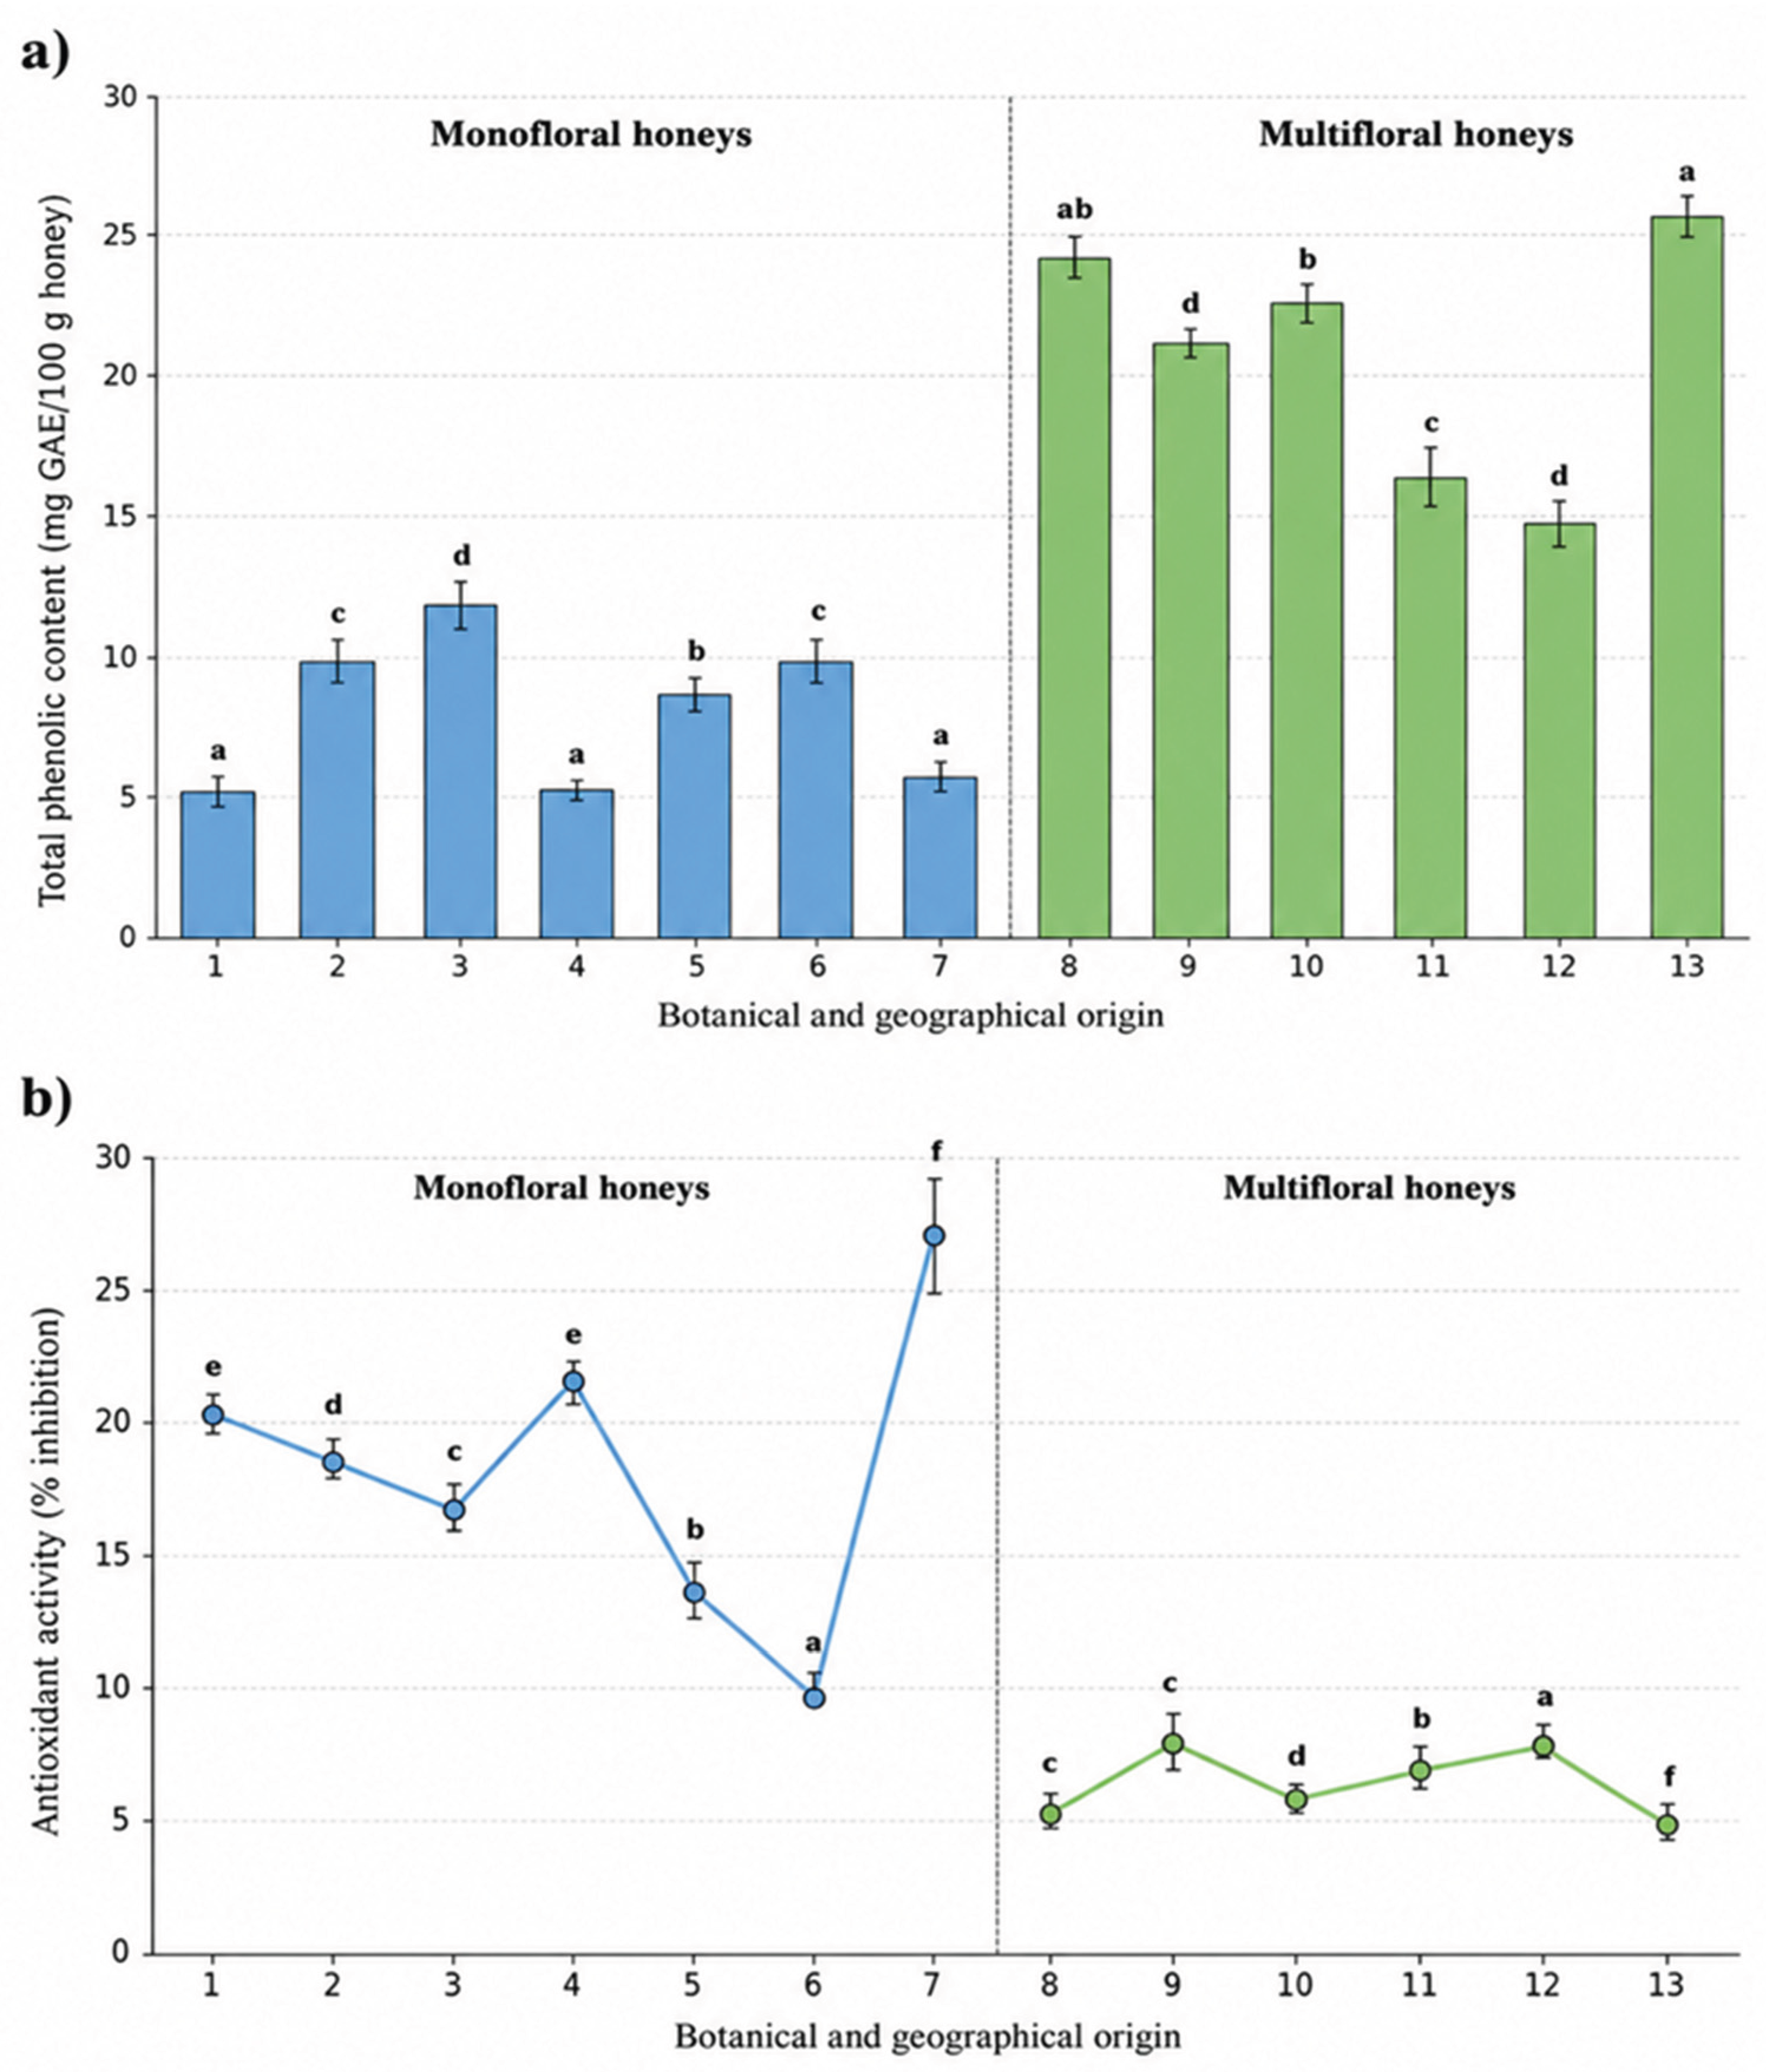
Figure 5.
Standardized Pareto charts: effects of geographical origin (GeO), botanical origin (BO) and their interaction (GeO × BO, AB) on (a) total phenolic content (TPC) and (b) antioxidant activity (Ax) in 42 factorial designs in monofloral honeys. Bars extending beyond the vertical reference line indicate statistically significant effects (p < 0.05).
Figure 5.
Standardized Pareto charts: effects of geographical origin (GeO), botanical origin (BO) and their interaction (GeO × BO, AB) on (a) total phenolic content (TPC) and (b) antioxidant activity (Ax) in 42 factorial designs in monofloral honeys. Bars extending beyond the vertical reference line indicate statistically significant effects (p < 0.05).
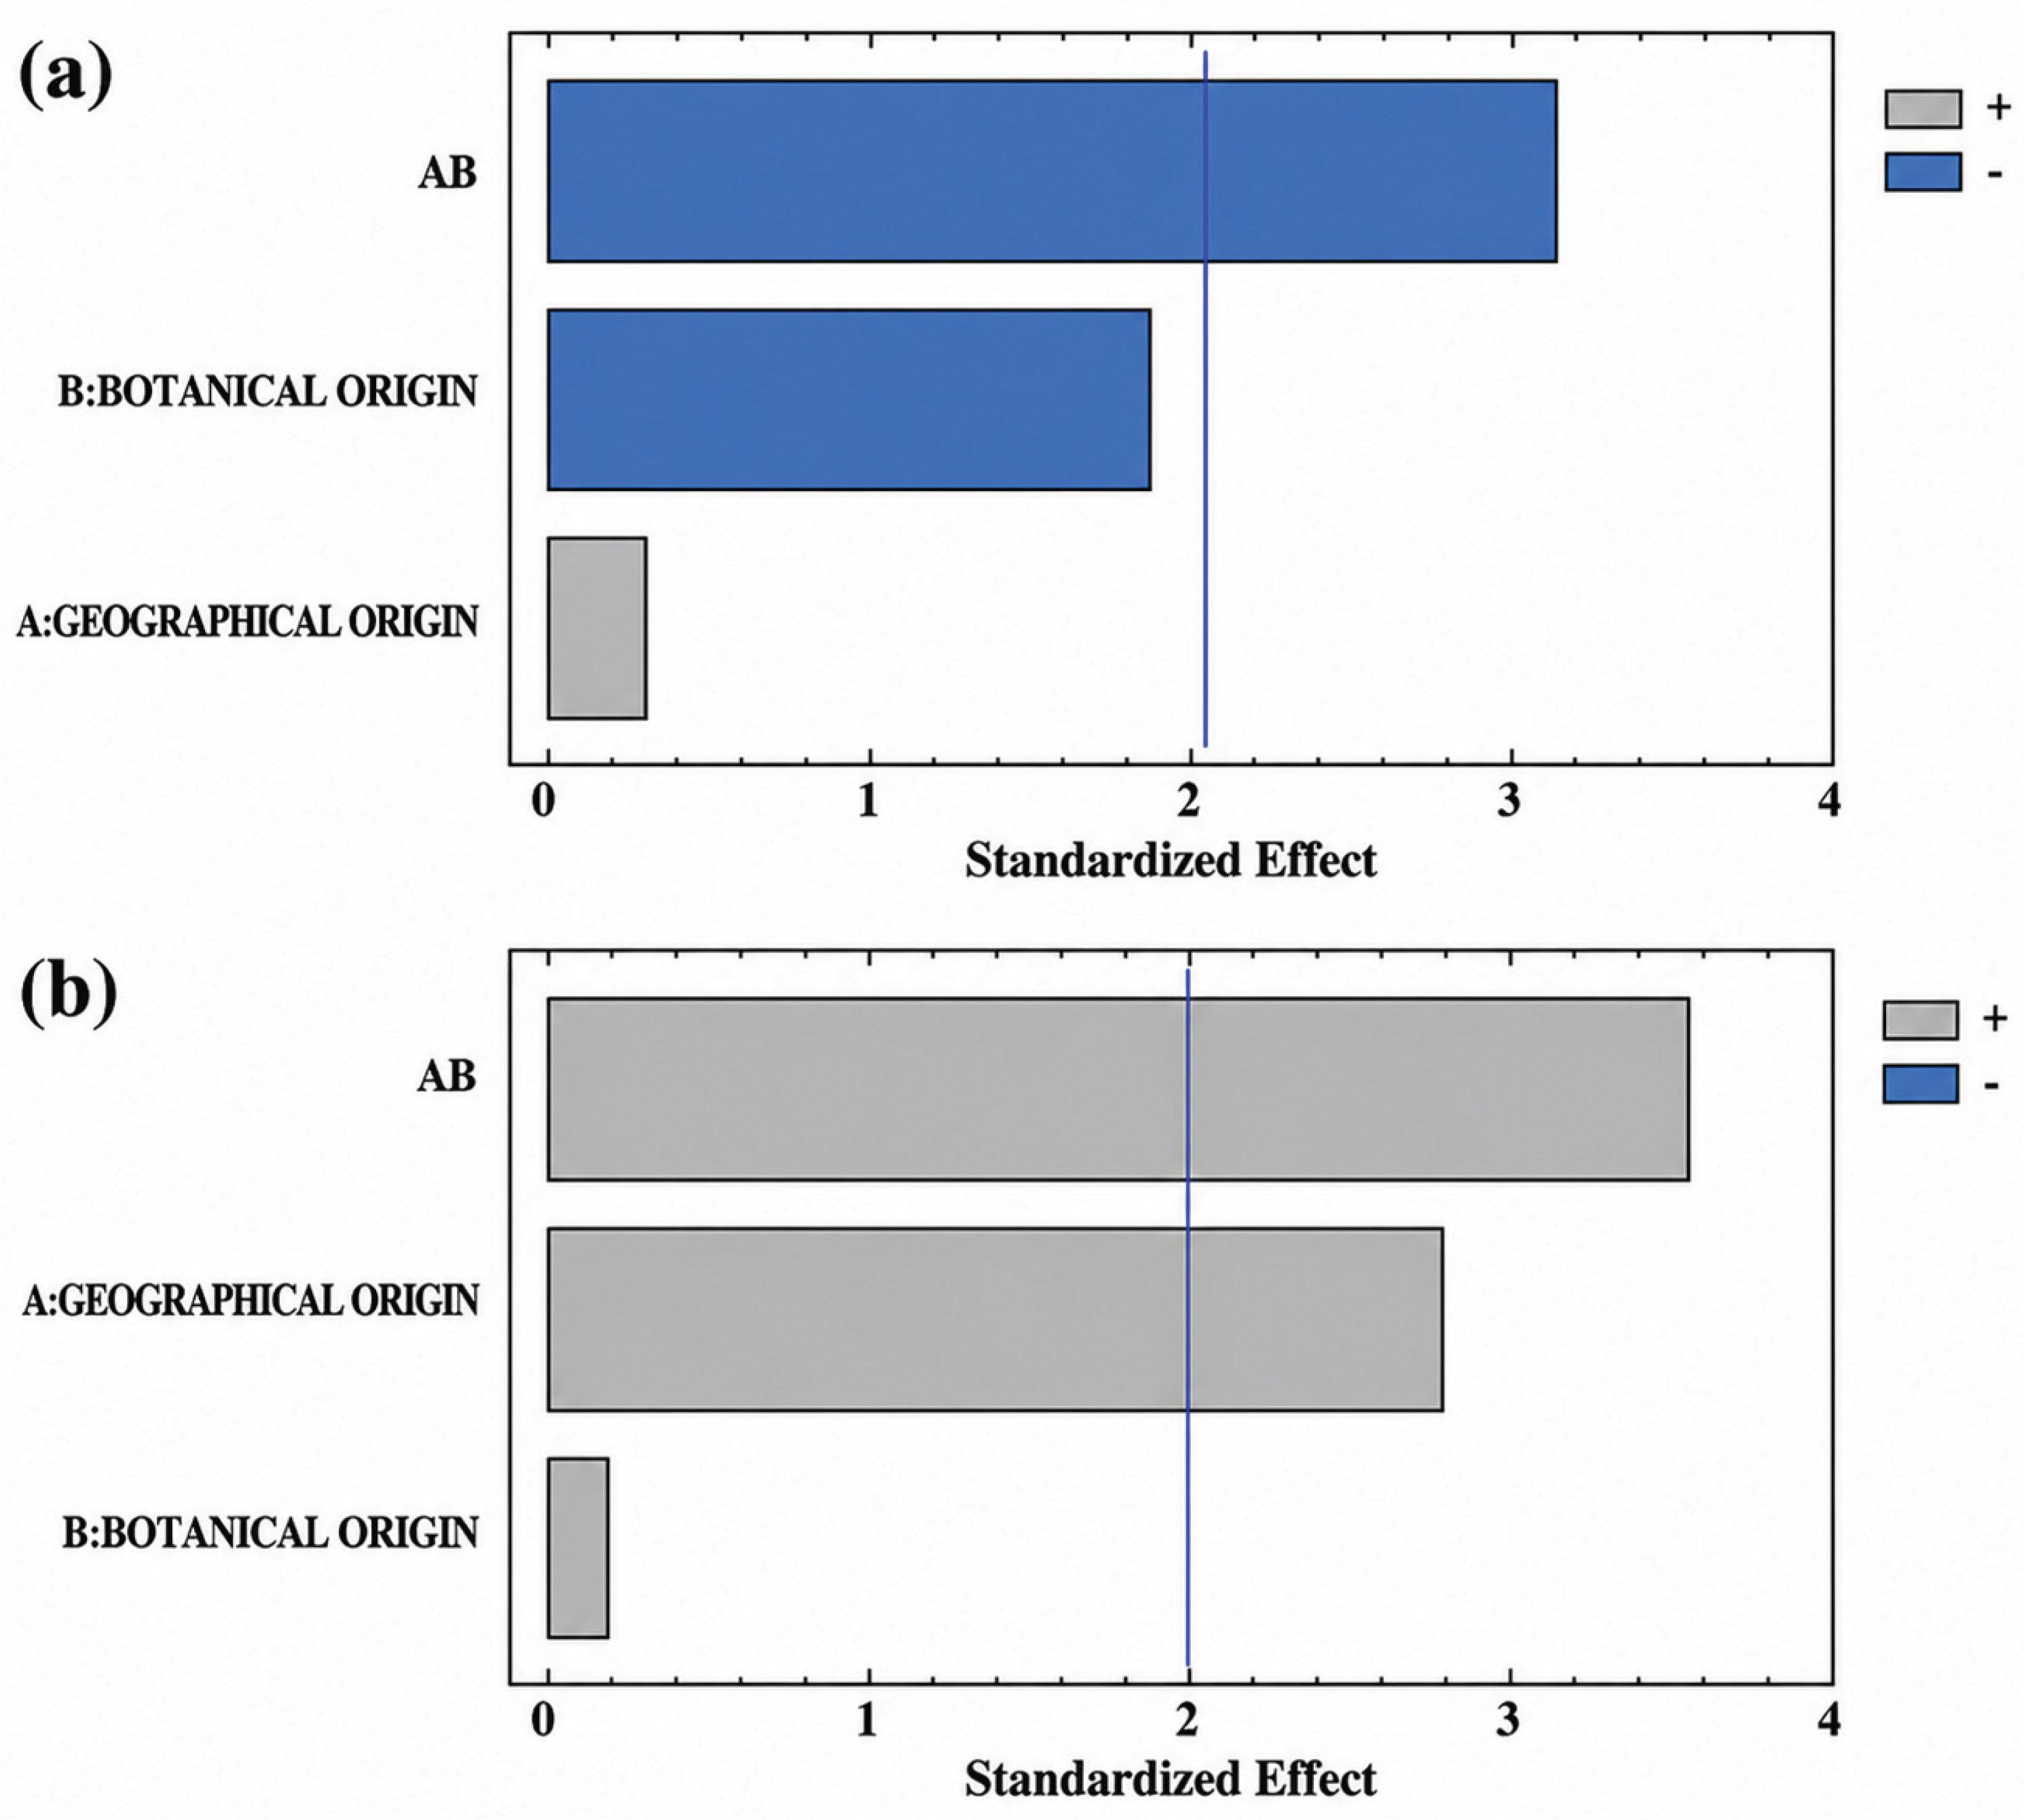
Figure 6.
Cluster heatmap showing the distribution patterns of total phenolic content (TPC) and antioxidant capacity (Ax) across freeze-dried flower flours (FD), oven-dried flower flours (OD), and honey samples. Data were standardized using Z-score normalization to allow comparison among variables with different measurement scales. Y-axis sample codes represent the combination of geographical origin (ACEK, Acanceh; PIHOL, Pixyah (Holenchén); TAH, Tahdziú; PE, Peto; and POTI, Popolnah (Tizimín)) and botanical origin (DZ, Dzidzilché; JA, Jabín; TD, Tahonal; CHA, Chaká; BM, Box muk; TX, Xtabentún; and TABE, Tahonal–Bejuco).
Figure 6.
Cluster heatmap showing the distribution patterns of total phenolic content (TPC) and antioxidant capacity (Ax) across freeze-dried flower flours (FD), oven-dried flower flours (OD), and honey samples. Data were standardized using Z-score normalization to allow comparison among variables with different measurement scales. Y-axis sample codes represent the combination of geographical origin (ACEK, Acanceh; PIHOL, Pixyah (Holenchén); TAH, Tahdziú; PE, Peto; and POTI, Popolnah (Tizimín)) and botanical origin (DZ, Dzidzilché; JA, Jabín; TD, Tahonal; CHA, Chaká; BM, Box muk; TX, Xtabentún; and TABE, Tahonal–Bejuco).
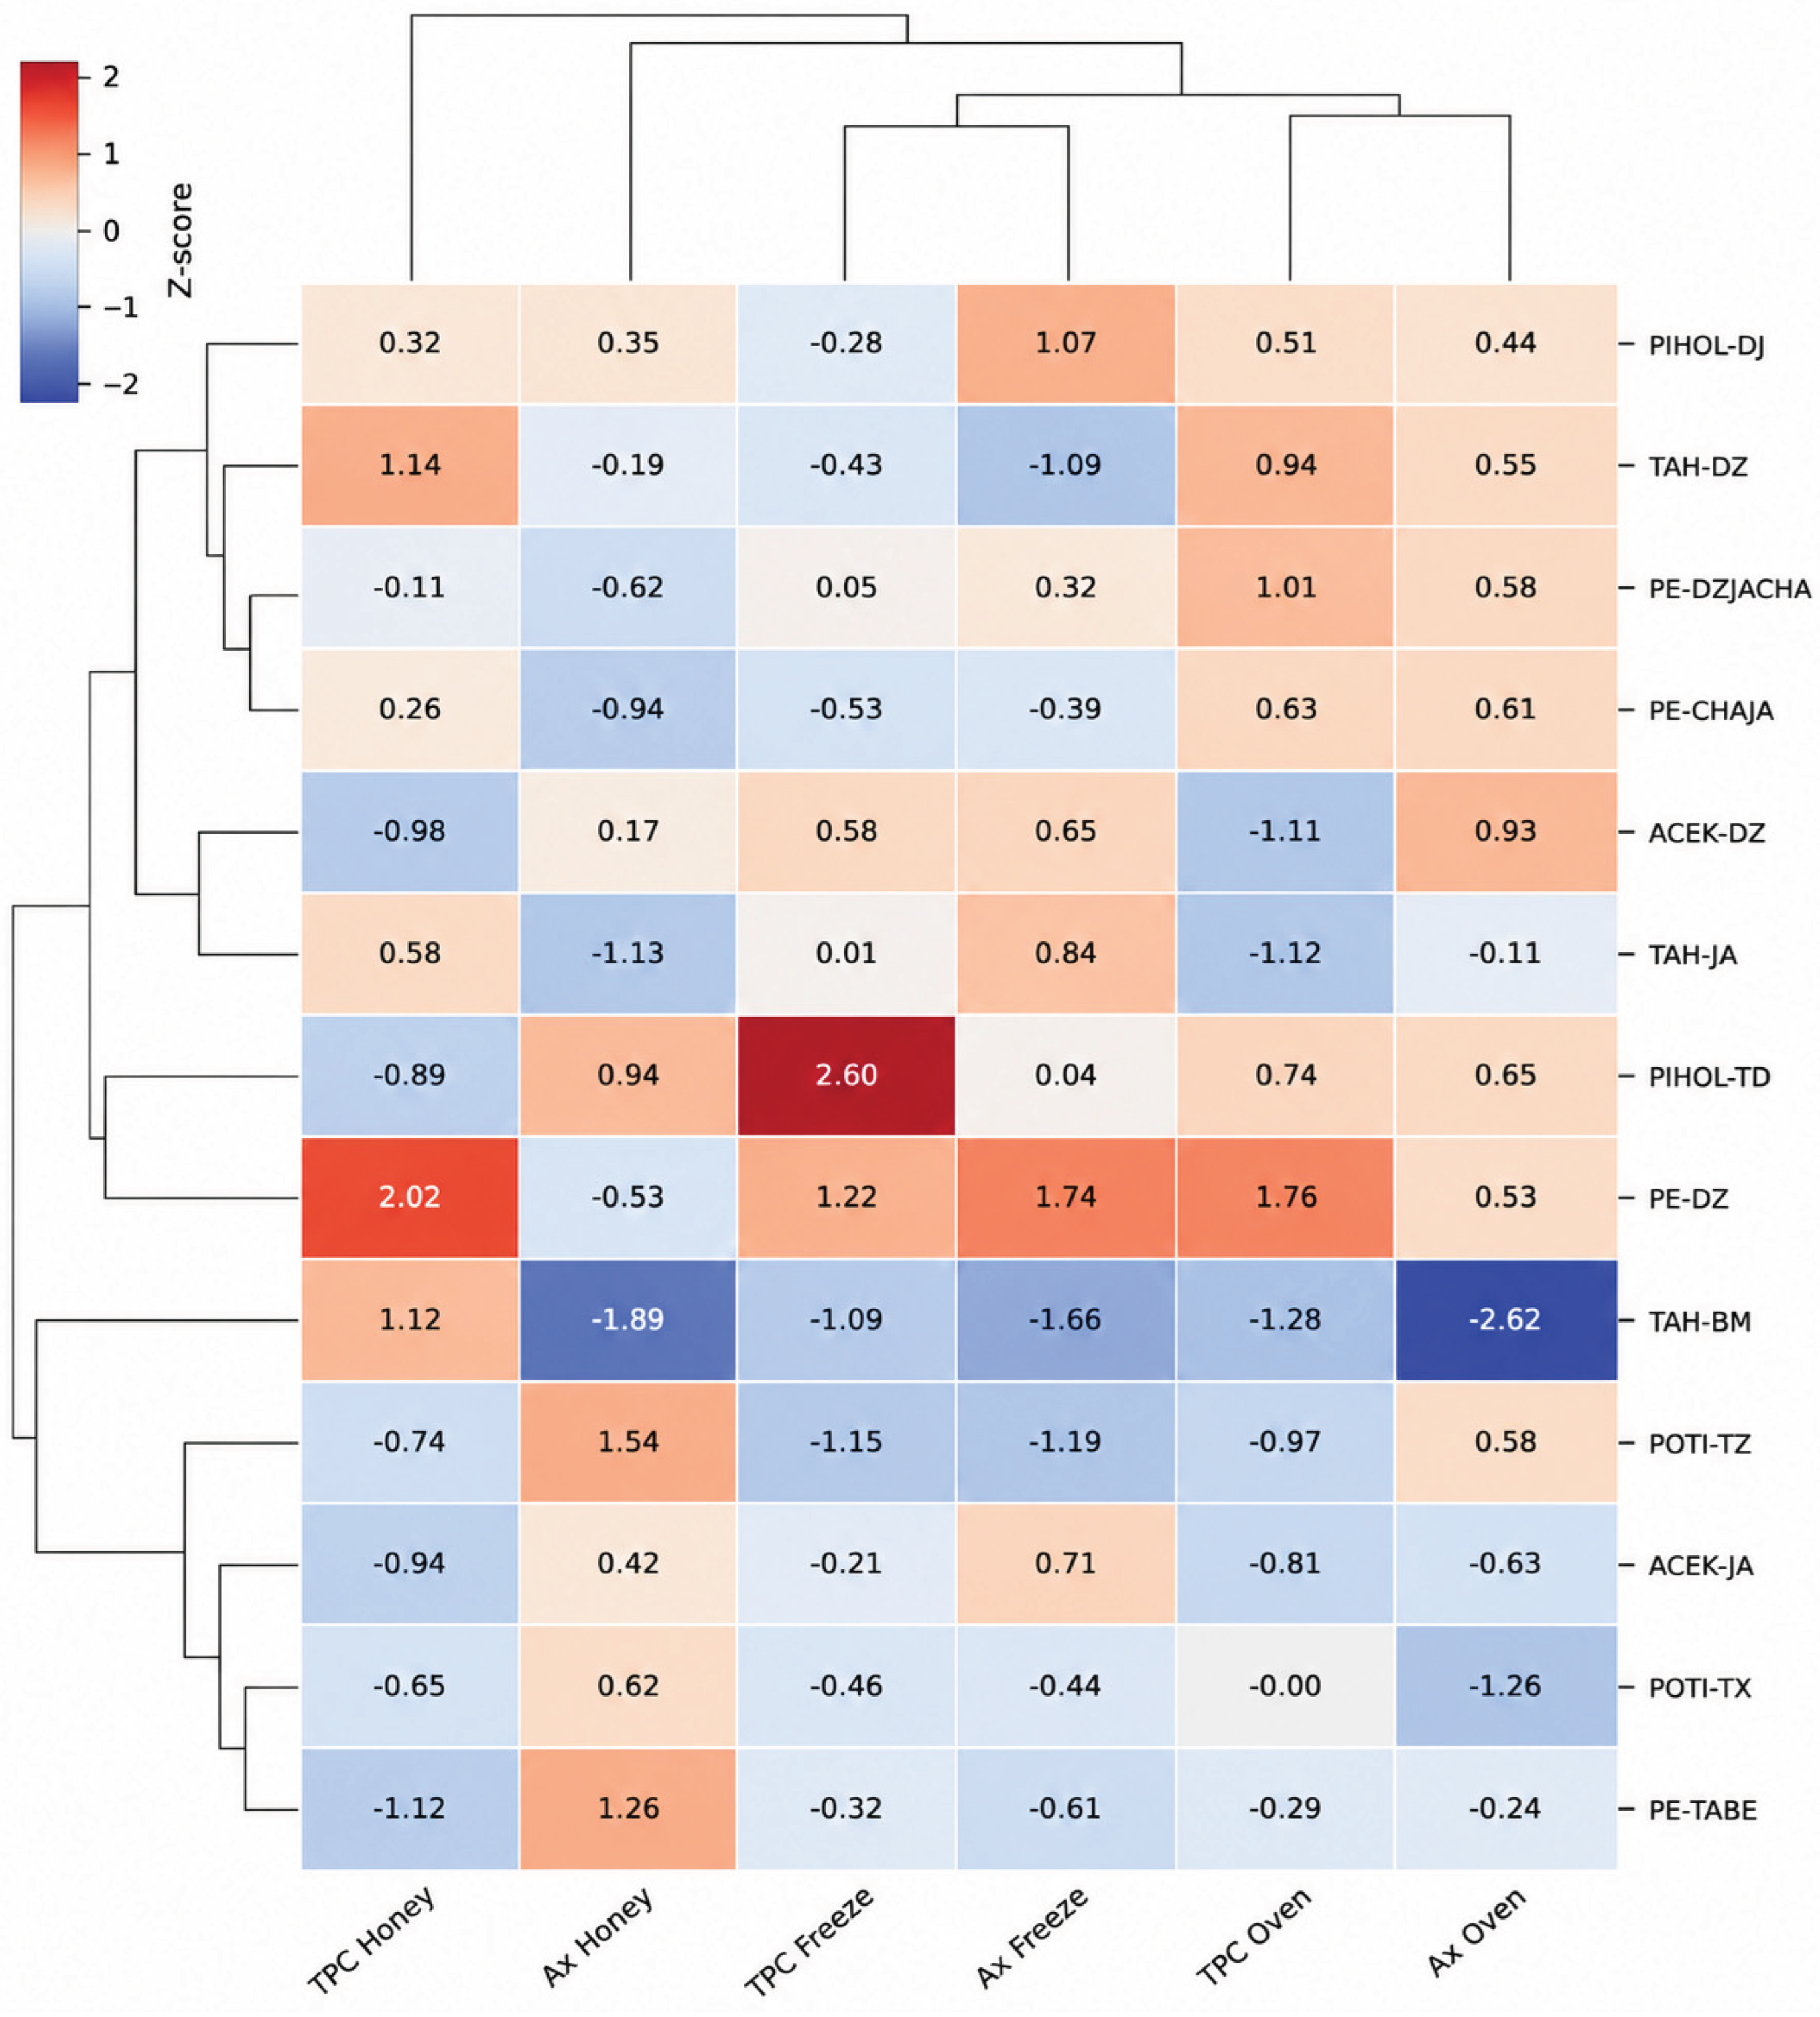
Figure 7.
Polyphenol concentration profile across analyzed matrices (Freeze-dried Flower, Oven-dried Flower, and Honey), classified into a) Phenolic acids and b) Flavonoids. Each bar represents the overall matrix mean (± standard deviation) calculated from all combined origin samples per matrix. Parallel diagonal slashes (//) denote a broken x axis.
Figure 7.
Polyphenol concentration profile across analyzed matrices (Freeze-dried Flower, Oven-dried Flower, and Honey), classified into a) Phenolic acids and b) Flavonoids. Each bar represents the overall matrix mean (± standard deviation) calculated from all combined origin samples per matrix. Parallel diagonal slashes (//) denote a broken x axis.
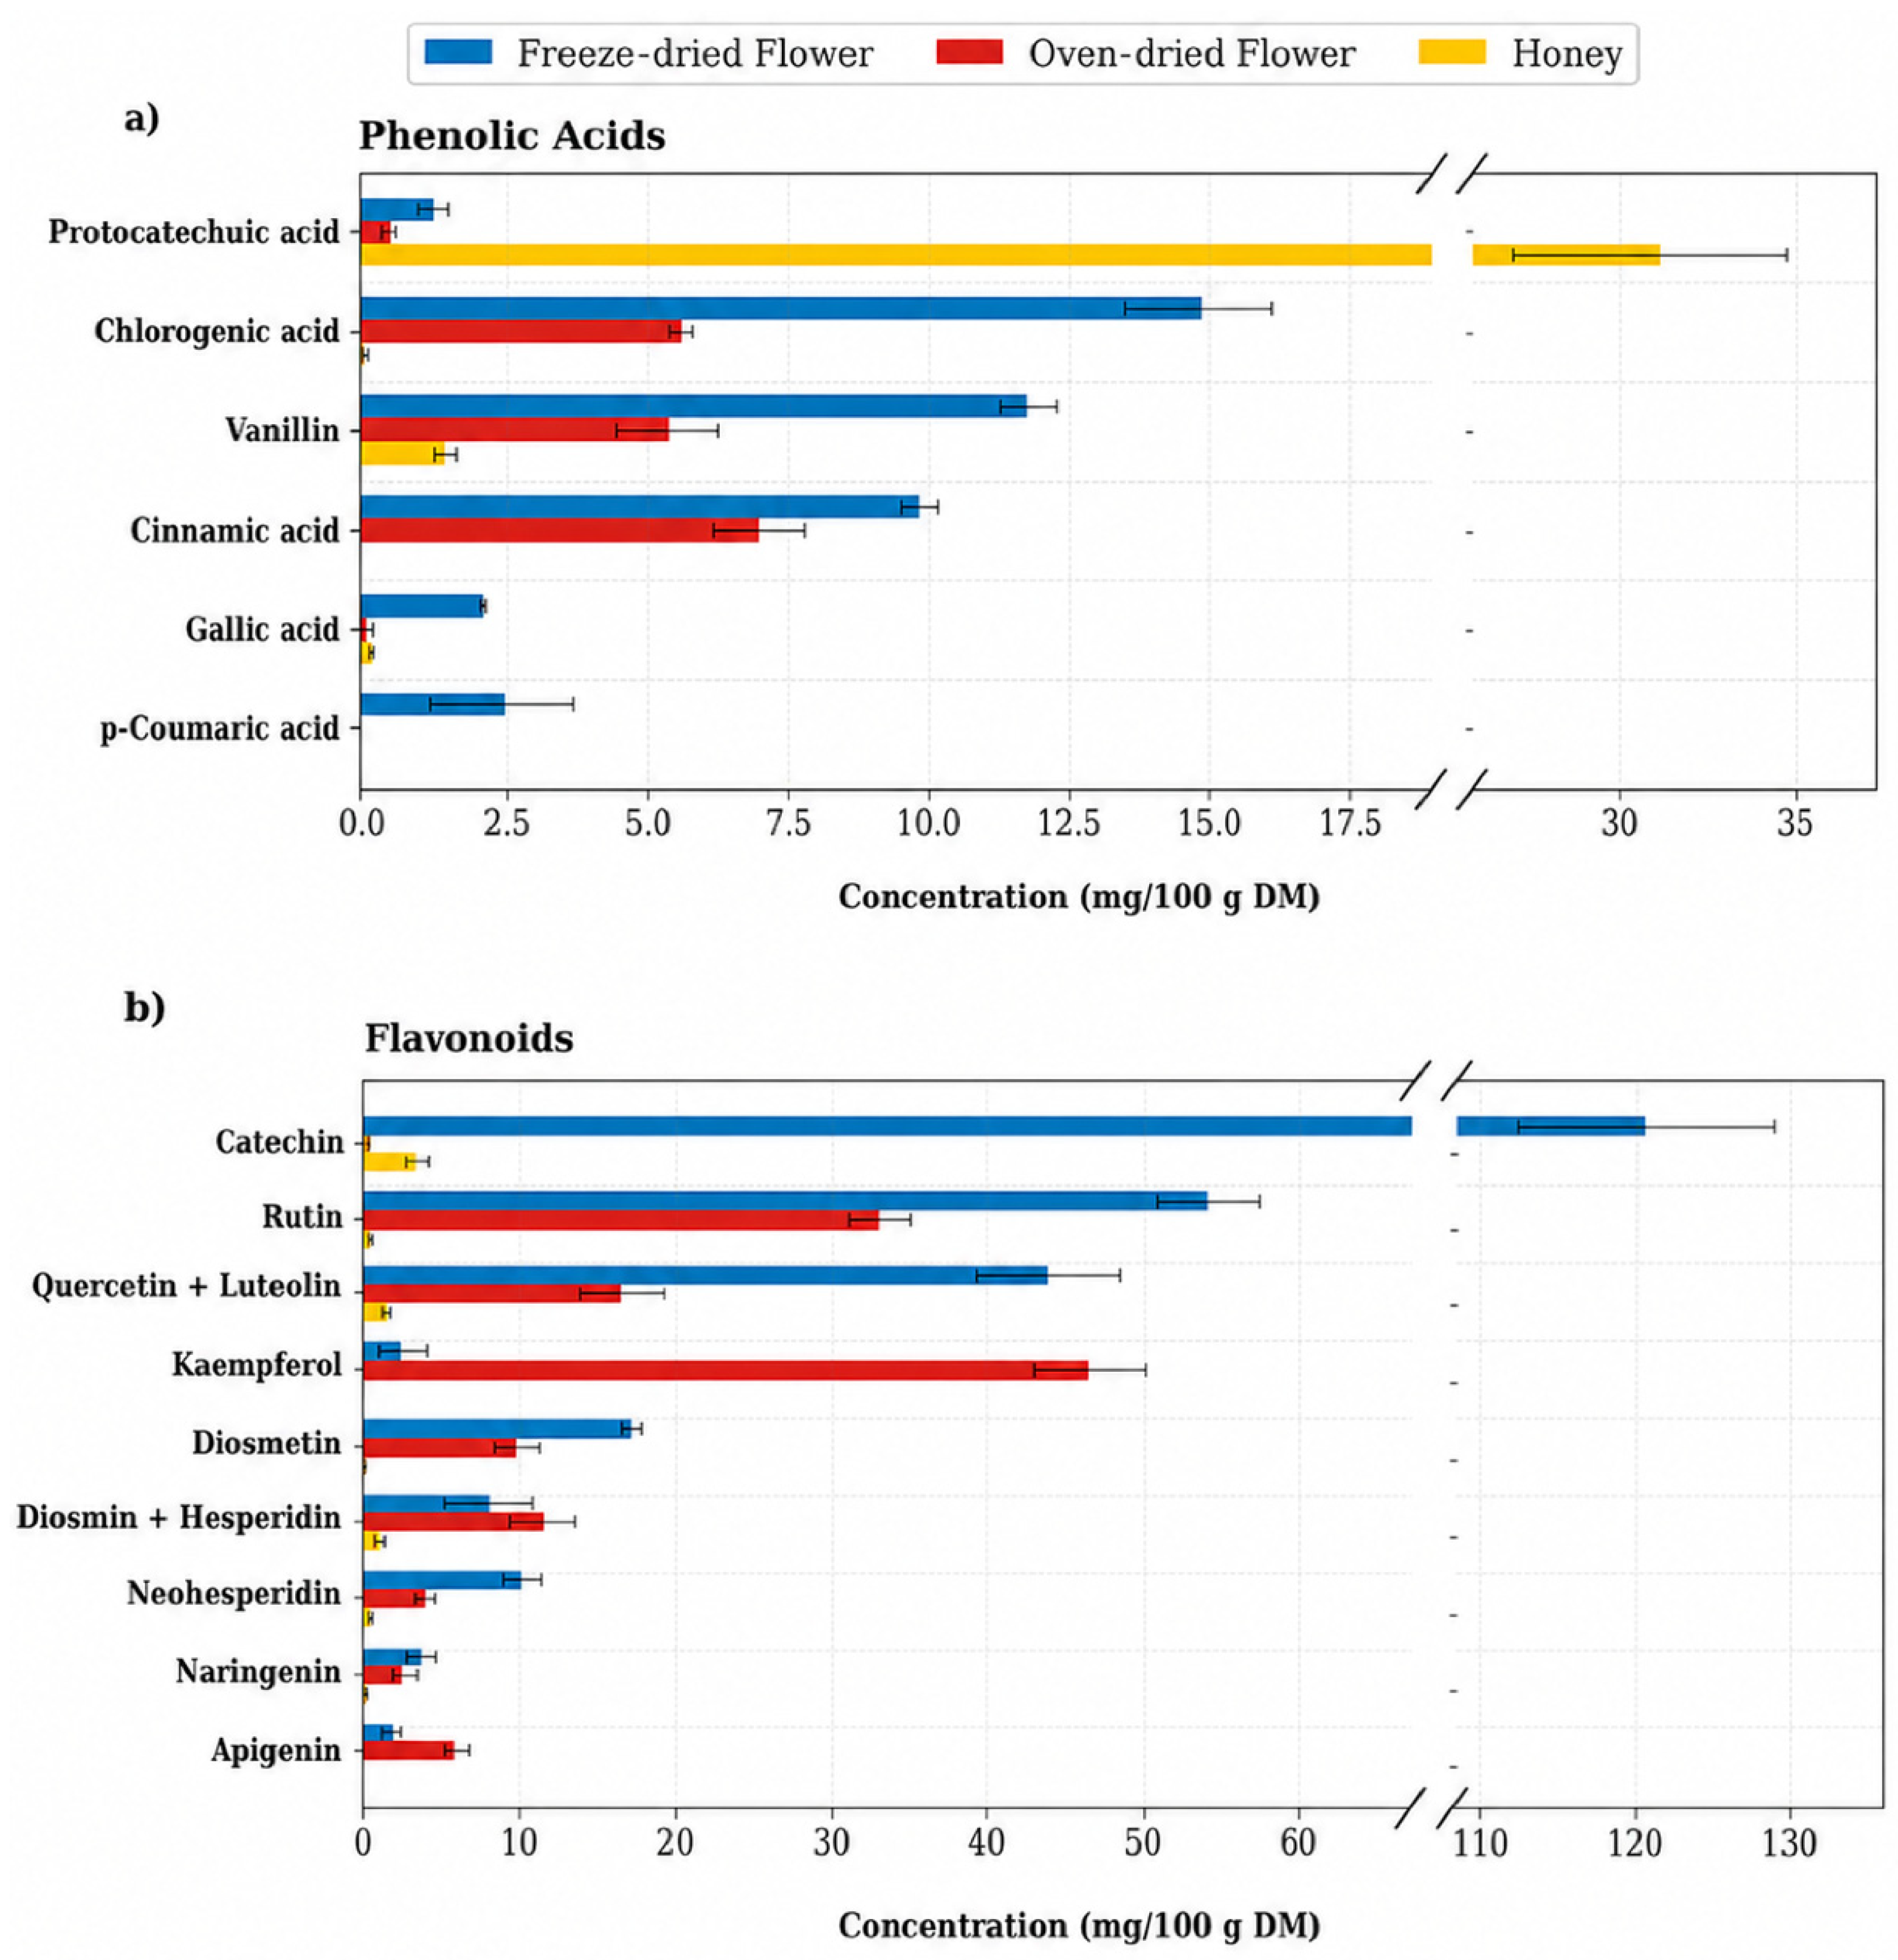
Figure 8.
Phenolic profile similarity between freeze-dried floral sources and multifloral honeys based on Pearson correlation analysis. (a) Filtered similarity network and (b) complete Pearson correlation heatmap constructed from the concentrations of the 15 phenolic compounds identified by UPLC-DAD. Nodes represent complete phenolic profiles, whereas edges represent Pearson correlation coefficients (r); only associations with r ≥ 0.45 are displayed in the network. Floral nodes are colored according to their geographical origin, and multifloral honey samples are represented by yellow nodes. In the heatmap, cell colors indicate the magnitude and direction of Pearson's correlation coefficient (r). Abbreviations: TH, Tahonal; JB, Jabín; DZ, Dzidzilché; BM, Box muk; CH, Chaká; XT, Xtabentún; PI, Pixyah; PE, Peto; TA, Tahdziú; AC, Acanceh; and PO, Popolnah.
Figure 8.
Phenolic profile similarity between freeze-dried floral sources and multifloral honeys based on Pearson correlation analysis. (a) Filtered similarity network and (b) complete Pearson correlation heatmap constructed from the concentrations of the 15 phenolic compounds identified by UPLC-DAD. Nodes represent complete phenolic profiles, whereas edges represent Pearson correlation coefficients (r); only associations with r ≥ 0.45 are displayed in the network. Floral nodes are colored according to their geographical origin, and multifloral honey samples are represented by yellow nodes. In the heatmap, cell colors indicate the magnitude and direction of Pearson's correlation coefficient (r). Abbreviations: TH, Tahonal; JB, Jabín; DZ, Dzidzilché; BM, Box muk; CH, Chaká; XT, Xtabentún; PI, Pixyah; PE, Peto; TA, Tahdziú; AC, Acanceh; and PO, Popolnah.
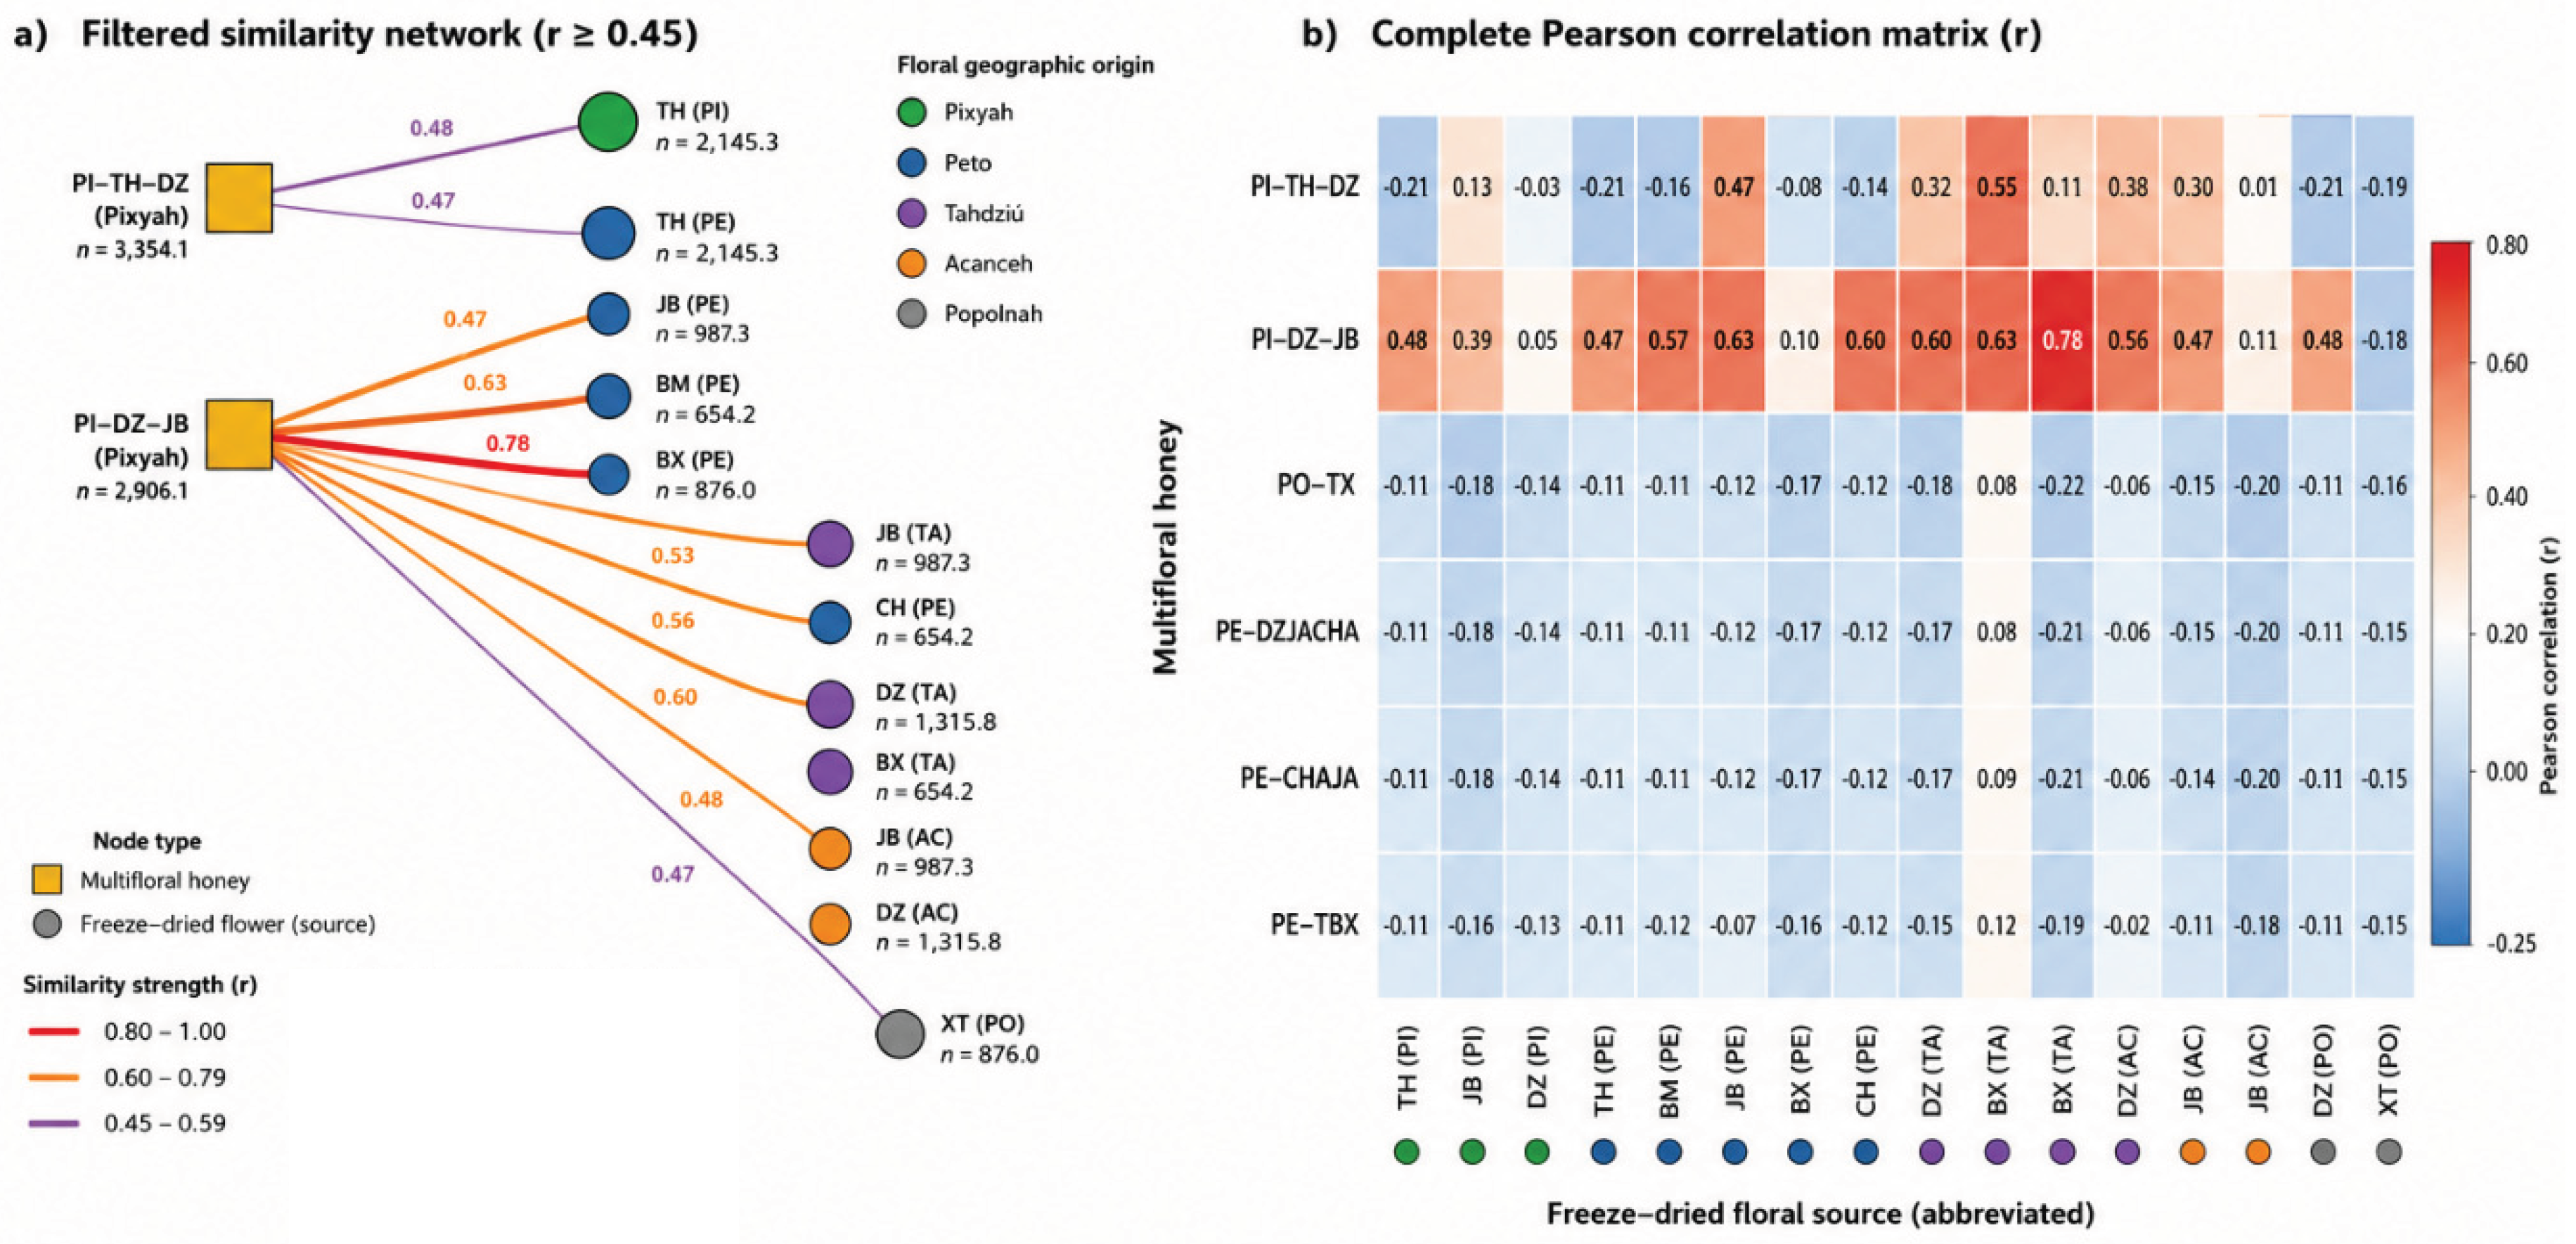
Table 1.
Physicochemical characteristics of monofloral and multifloral honeys from Yucatán, Mexico.
| HTy | GeO | BO | SS (°Brix) | pH* | TA (meq kg⁻¹) | HMF (mg kg⁻¹) | RS (%) |
|---|---|---|---|---|---|---|---|
| MoF | Acanceh | Jabín | 85.00 ± 0.00ᵍ | 3.99 ± 0.09ᵉ | 42.35 ± 1.34fᵍ | 38.6 ± 0.7ᵉ | 73.30 ± 2.37ᵇ |
| Acanceh | Dzidzilché | 82.33 ± 1.44ᵈ | 3.86 ± 0.03cᵈ | 36.70 ± 1.84ᵈ | 40.1 ± 0.9f | 71.80 ± 3.90ᵇ | |
| Tahdziú | Box muk | 77.00 ± 0.00ᵃ | 3.94 ± 0.01cᵈᵉ | 44.20 ± 1.13fgh | 41.4 ± 1.0ᵍ | 82.75 ± 2.76c | |
| Tahdziú | Dzidzilché | 90.00 ± 0.00h | 3.92 ± 0.06cᵈᵉ | 45.30 ± 0.00ᵍh | 46.4 ± 0.6a | 80.40 ± 3.18c | |
| Tahdziú | Jabín | 84.50 ± 0.00fᵍ | 3.96 ± 0.00ᵈᵉ | 37.75 ± 0.64ᵈ | 43.2 ± 0.4h | 80.05 ± 3.15c | |
| Peto | Dzidzilché | 83.21 ± 0.29ᵉ | 3.85 ± 0.02ᵇc | 46.00 ± 1.41h | 36.7 ± 0.4ᵈ | 71.15 ± 2.75ᵇ | |
| Popolnah | Tzalam | 79.00 ± 0.00ᵇ | 3.95 ± 0.02cᵈᵉ | 26.50 ± 2.12ᵃ | 10.0 ± 0.4ᵇ | 67.85 ± 2.71ᵃᵇ | |
| MuF | Pixyah | Dzidzilché-Jabín | 84.00 ± 0.00ᵉf | 3.70 ± 0.02ᵃ | 44.00 ± 1.41fgh | 56.9 ± 0.4j | 72.85 ± 4.36ᵇ |
| Pixyah | Dzidzilche-Tahonal | 77.50 ± 0.00ᵃ | 3.70 ± 0.13ᵃ | 41.40 ± 1.13ᵉf | 41.4 ± 0.7ᵍ | 67.70 ± 2.76ᵃᵇ | |
| Peto | Chaká -Jabín | 80.00 ± 0.00c | 4.13 ± 0.01f | 30.15 ± 0.21ᵇ | 9.2 ± 0.3ᵇ | 67.35 ± 3.55ᵃᵇ | |
| Peto | DZ-Chaká-Jabín | 79.29 ± 0.29ᵇc | 3.74 ± 0.07ᵃᵇ | 37.65 ± 2.33ᵈ | 22.3 ± 0.2c | 69.35 ± 1.59ᵃᵇ | |
| Peto | Box muk-Tahonal | 79.00 ± 0.00ᵇ | 3.69 ± 0.02ᵃ | 38.50 ± 0.71ᵈᵉ | 38.8 ± 0.3ᵉ | 69.25 ± 1.97ᵃᵇ | |
| Popolnah | Tahonal-Xtabentún | 79.00 ± 0.00ᵇ | 3.85 ± 0.01ᵇc | 33.50 ± 2.12c | 7.2 ± 0.4ᵃ | 64.85 ± 3.52ᵃ |
Note: Reference quality criteria for honey established by NOM-004-SAG/GAN-2018[19] are SS= soluble solids ≥ 78 °Brix, TA= titratable acidity ≤ 50 meq kg⁻¹, RS= reducing sugars ≥ 60% and hydroxymethylfurfural (HMF) for tropical honeys ≤ 80 mg kg⁻¹.*no regulatory limit is established for pH. HTy= hony tipe: MoF = monofloral and MuF = multifloral, DZ=Dzidzilché. Values are expressed as mean ± standard deviation (n = 3). Different lowercase superscript letters within the same column indicate significant differences (LSD, p < 0.05).
Disclaimer/Publisher’s Note: The statements, opinions and data contained in all publications are solely those of the individual author(s) and contributor(s) and not of MDPI and/or the editor(s). MDPI and/or the editor(s) disclaim responsibility for any injury to people or property resulting from any ideas, methods, instructions or products referred to in the content. |
© 2026 by the authors. Licensee MDPI, Basel, Switzerland. This article is an open access article distributed under the terms and conditions of the Creative Commons Attribution (CC BY) license (http://creativecommons.org/licenses/by/4.0/).
Copyright: This open access article is published under a Creative Commons CC BY 4.0 license, which permit the free download, distribution, and reuse, provided that the author and preprint are cited in any reuse.


