
Submitted:
30 July 2026
Posted:
03 August 2026
You are already at the latest version
Abstract
Elution chromatography was used to analyze the content of SARA fractions in simulated raffinate and extract phases containing furfural, and the influence mechanism of furfural on the content analysis of SARA in the two phases was explored by molecular simulation. The experimental results showed that the content analysis of SARA fractions was more affected by the furfural with a higher content of furfural in the sample. During the process of sample loading, some chromatographic bands of R and A significantly shifted down, some A being eluted down earlier while eluting S with n-heptane, and some R being eluted out earlier while eluting A with toluene. In addition, the molecular simulation results showed that the order of adsorption capacity of model molecules and FUL on the FCP-Al2O3 surface was S<A<FUL<R, and the order of interaction between S, A, R model molecules and FUL was S<A<R. The molecular simulation results revealed the mechanism of the influence of furfural on the analysis of SARA fractions, that was, the unadsorbed furfural would promote the desorption of some A and R, resulting in the downward movement of chromatographic bands and affecting the elution effect, thereby affecting the accuracy of the SARA fractions analysis data. Furthermore, the improved vacuum distillation method, namely the vacuum-oven method could be used to accurately determine the content of furfural in the sample.
Keywords:
heavy oils
; furfural extraction
; intermolecular interactions
; molecular simulation
; vacuum-oven method
1. Introduction
With the increasing shortage of petroleum resources in today’s world, crude oil becomes heavy and inferior [1,2,3]. Faced with the gradual growth of heavy crude oil proportion, full exploitation and rational processing of heavy oil has become a concern for researchers in consequence. Currently, processing technologies of heavy oil mainly involve hydrogenation [1,4,5,6,7] and carbon rejection [5,6,8,9,10,11]. As one of the important decarburization processes, catalytic cracking has problems such as high coke yield and serious catalyst poisoning caused by sulfur nitrogen heteroatoms or heavy metals in heavy oil processing [12,13,14,15]. Therefore, it is necessary to pretreat the heavy oil feedstock before entering fluid catalytic cracking (FCC) unit.
Solvent extraction, as an prominent separation method in refining industry, has been widely used in residual oil deasphalting [16,17,18], lubricating oil refining [19,20], reforming oil extraction aromatics [21,22,23,24] and so on. Unsaturated fractions (i.e., aromatics, resins, and asphaltenes) in vacuum residue are removed by combination processes of SDA and furfural extraction, and obtained saturates fraction can be used as high-quality catalytic cracking raw materials. In the process of furfural extraction for DAO, the removal rates and selectivity of unsaturated fractions in DAO are taken as key indexes, which are directly related to extraction efficiency, solvent-oil ratio and energy consumption. It is noteworthy that the accurate analysis of SARA (saturates, aromatics, resins, and asphaltenes) fractions in raffinate and extract oil, furfural in raffinate phase and extract phase is an important prerequisite for obtaining extraction efficiency and selectivity.
For the analysis of SARA fractions, currently there are many determination methods [25,26,27,28,29,30], such as classical elution adsorption chromatography (EC) [25,26], high performance liquid chromatography (HPLC) [27], thin-layer chromatography with flame ionization detection (TLC-FID) [28], etc. . However, the solvent needs to be removed prior to the analysis of the four components by the above methods [31], which may due to the interaction between polar solvents (e.g., furfural, NMP, phenol) and SARA. The interaction may interfere the analysis of SARA in heavy oils, and the degree of the interference and its mechanism have not been studied yet. In order to clarify these issues, the widely used method of elution chromatography was adopted to analyze SARA in simulated raffinate and extract phases containing furfural, and the influence mechanism of furfural on the analysis of SARA content in two phases was explored by means of molecular simulations. As furfural might indeed potentially affect the analysis of SARA content, it is necessary to accurately determine the furfural content. An improved vacuum distillation method, namely vacuum-oven method, was used for the determination of furfural in raffinate phase and extract phase.
2. Experimental
2.1. Materials
Deasphalted oil (DAO) was obtained from China Petroleum Chemical Co Jiujiang branch. Heavy Paraffin oil (HPO), Furfural (AR, 99%), and silica gel-self indicator were purchased from Shanghai Macklin Biochemical Technology Co., Ltd. Heptane (AR, 99%) and Aluminum oxide for chromatography purpose (FCP-Al2O3) was obtained from Sinopharm Group. Toluene (AR, 99.5%) were provided by Xilong Scientific. The properties of DAO and HPO were listed in Table 1.
2.2. Samples Preparation
DAO and HPO (mass ratio of 1:3) were poured into a beaker, vigorously stirred at 100 ℃ for 1 h, and then the mixture was left to cool to room temperature to obtain DAO-HPO mixed oil. FUL and DAO-HPO were mixed well by an adjustable high-speed homogenizer (FSH-2A, China) equipped with a homogenizer knife (L120×Ф17.5 mm), The DAO-HPO samples containing FUL mass fractions of 5%, 15%, 20%, 25%, 30%, 80%, 85%, 90% and 95% were obtained and denoted as FUL5, FUL10, FUL15, FUL20, FUL25, FUL30, FUL80, FUL85, FUL90 and FUL95 respectively. According to the solvent content in the two phases, FUL5-FUL30 could be considered as simulated raffinate phase samples and FUL80-FUL95 could be considered as simulated extract phase samples.
DAO and FUL were placed in extraction kettle according to a certain ratio of solvent to oil, and stirred for 30 minutes under the conditions of 100 °C and 500 RPM. After standing for 1 hour, the raffinate and extract phases were released from the discharge bottom valve and stirred well to obtain the real DAO raffinate and extract phase samples, which were respectively recorded as R-SL-x and E-SL-y (where x and y were 1-5 respectively).
2.3. Analysis of SARA Fractions Content
In accordance with the method for separation of asphalt into four fractions (NB/SH/T0509-2010) which was further improved by patent CN102527088 A, the saturates and aromatics fractions in the sample were separated by column chromatography at -20 KPa, and the contents of S and A in sample were recorded as and , respectively. Since the asphaltenes fractions content in DAO was less than 1%, the content of asphaltenes and resins fractions was summed as (%) which was obtained by subtraction method using equation (1).
Where and
were the mass fractions of saturates and aromatics fractions in the samples, respectively.
2.4. Simulation and Calculation Section
The geometries of S, A and R model molecules and FUL molecules were optimized by using the GGA-BLYP functionals of DMol3 module in MS2019 software, and the corresponding electrostatic potential (ESP) distributions were obtained. COSMO files for subsequent calculations were obtained using Tmolex2021. As shown in Figure 1 (1a, 1b and 1c), S, A and R model molecules represented saturates, aromatics, resins fractions in DAO, respectively, and they were all obtained with simple modifications based on the G&D model [32].
Adsorption energy of S, A and R model molecules and FUL molecules on the surface of FCP-Al2O3 (100) was calculated using the adsorption locator module in MS2019. The simulated annealing calculation parameters were set as 100000 loading steps, 5 heating cycles, and 50000 steps per cycle for structural optimization. The energy parameters were selected as COMPASS (Version 2.8) Forcefield and Charges of forcefield assigned. In addition, the electrostatic terms were selected as summation method of Ewald, accuracy of 0.0001 kcal/mol, and buffer width of 0.5 A. The van der Waals terms were selected as summation method of atom based, truncation method of cubic spline, cutoff distance of 15.5 A, spline width of 1 A, and buffer width of 0.5 A.
Interaction energies between S, A, R model molecules and furfural molecules were calculated using COSMOtherm2021 (version: BP_TZVPD_FINE_21.ctd) at the BP-TZVP quantization level and corresponding parameters.
2.5. Determination of FUL Content
The schematic diagrams of the traditional vacuum distillation method and the improved vacuum distillation method for the determination of FUL content were shown in Figure 2a and Figure 2b respectively. When the traditional vacuum distillation method was used to analyze the solvent content in raffinate and the extract phases for heavy oil, a single set of traditional vacuum distillation devices could only analyze one sample at a time, and thus the efficiency was relatively low. Furthermore, it was difficult to maintain identical analysis conditions for each experiment, thereby affacting the accuracy of the data. To overcome the shortcomings of the above method, in this study, the traditional vacuum distillation device was improved into a vacuum drying oven. Besides, a low-temperature condenser was installed between the vacuum oven and the oil pump for solvent recovery, avoiding the corrosion of sealing components of oil pump caused by solvent vapor. Compared with the traditional vacuum distillation method, the improved vacuum distillation method, namely the vacuum-oven method, could analyze multiple parallel samples at one time with more efficiency. In addition, the analytical conditions could be kept consistent for each experiment, thus improving the accuracy of the data.
The detailed experimental procedure for the determination of furfural content by vacuum-oven method were as follows: the empty weighing bottle (L 40×Ф 25 mm) with a constant weight after drying was weighed using a high precision analytical balance (AB135-S/FACT METTLER TOLEDO, Switzerland), and then the balance was adjusted to zero value. Secondly, the samples prepared in accordance with Section 2.2 were taken by a 2 mL pipette and added into these weighing bottles for accurate weighing of samples. Then weighing bottles containing samples were transferred to an intelligent electric heating vacuum drying oven (6090AB, Beijing Hennuo Lixing Technology Co., Ltd.) equipped with the rotary-vane vacuum pump (2XZ-4, Shanghai Double Goose Refrigeration Co., Ltd.). After the set time, weighing bottles were taken out while hot, and immediately transferred to the desiccator (Ф 400 mm, containing 1 kg silica gel-self indicator), and weighed after cooling to room temperature (see Figure 2b). The content of FUL in samples (w,%) was calculated by using equation (2).
Where was the mass of empty weighing bottle (g), was the mass of sample (g), and was the mass of weighing bottle containing sample that has been heated and vacuumed to remove FUL (g).
The accuracy was measured by the recovery of FUL in samples for the raffinate phase and extract phases. The closer the recovery rate was to 100%, the higher the accuracy was. The recovery of FUL was calculated by using equation (3).
Where was the true value of content of FUL in the sample and was the measured value of FUL content in the sample.
The precision was measured by relative standard deviation (RSD) of multiple parallel determination values of FUL content in the sample [33], and when the closer the RSD was to 0, the better the precision was. RSD was calculated by using equation (4).
Where SD was the standard deviation of multiple parallel determination values of FUL content in the sample and was the arithmetic mean of multiple parallel determination values of FUL content in the sample.
The SD was calculated by using equation (5).
Where, n was the number of parallel determination experiments and was the measured value of FUL content in the i-th sample in n parallel experiments.
3. Results and Discussion
3.1. The Experimental Results
In order to investigate the effect of FUL on the analysis of contents of SARA fractions, the contents of SARA fractions in the simulated raffinate and extract phases were analyzed by elution chromatography, and the experimental phenomena were observed. From Figure 3a, Chromatographic bands diagram after sample loading were corresponding to FUL0, FUL10, FUL20, FUL30, FUL80 and FUL90 from left to right. Compared with FUL0 (blank sample without furfural), the chromatographic bands of FUL10, FUL20 and FUL30 didn’t show marked variation, while the chromatographic bands of FUL80 and FUL90 color bands moved down significantly. Figure 3b showed the chromatographic bands diagram after eluting saturates fraction. Compared with FUL0, the chromatographic bands of FUL10, FUL20 and FUL30 did not change obviously, while the yellow chromatographic bands of FUL80 and FUL90 moved downward obviously. Figure 3c displayed the chromatographic bands diagram after eluting aromatics fraction. Compared with FUL0, the corresponding chromatographic bands of FUL10, FUL20 and FUL30 did not change significantly, while the reddish-brown chromatographic bands of FUL80 and FUL90 moved downward obviously.
Figure 3d and Figure 3e respectively showed the eluate of saturates and aromatics fractions corresponding to FUL0, FUL10, FUL20, FUL30, FUL80 and FUL90 from left to right. According to the color change of the eluate of saturates fraction, compared with FUL0, the color of the eluate of saturates fraction corresponding to FUL10, FUL20 and FUL30 were colorless, while the color of eluate of saturates fraction corresponding to FUL80 and FUL90 were slightly light yellow, indicating that the eluate of saturates fraction of FUL80 and FUL90 were mixed with a small amount of aromatics fraction. Compared with FUL0, the color of the eluate of aromatics fraction corresponding to FUL10, FUL20 and FUL30 were bright yellow, while the color of the eluate of aromatics fractions corresponding to FUL80 and FUL90 were obviously reddish brown, indicating that some resins fraction was mixed in the eluate of aromatics fraction corresponding to FUL80 and FUL90.
The contents of SARA fractions in simulated two-phase samples were listed in Table 2. Compared with FUL0, the contents of the SARA fractions in FUL10, FUL20 and FUL30 didn’t change significantly. However, the contents of saturates and aromatics fractions in FUL80 and FUL90 increased but the contents of resins and asphaltenes fractions decreased significantly, again indicating that the saturates fraction in FUL80 and FUL90 contained a small amount of aromatics fraction and the aromatics fraction contained some resins fraction.
Based on the variation of the chromatographic band, the color of the eluate of saturated and aromatic fraction and the content data of SARA fractions mentioned above, the results showed that the influence of FUL on the content analysis of SARA fractions for FUL10, FUL20 and FUL30 samples with low content of FUL was relatively small, while the influence of FUL on the content analysis of SARA fractions for FUL80 and FUL90 samples with high content of FUL was more significant.
3.2. The Simulation Results
In Section 3.1, the significant influence of the higher content of FUL in the sample on the content analysis of SARA was described from a macroscopic perspective by experimental means. To investigate the reasons, the adsorption of FUL molecules and SAR model molecules on the surface of FCP-Al2O3 and the interaction between FUL and SAR model molecules were analyzed from a microscopic perspective by molecular simulations, and the influence mechanism of furfural on SAR was proposed.
3.2.1. Adsorption of SAR and FUL on the Surface of FCP-Al2O3
Elution chromatography is based on the adsorption difference between each component of the mixture and the adsorbent, realizing the separation of each component under the elution of the mobile phase. The sample loading process, as an important step in the process of elution chromatography to separate SARA of heavy oil, could be simulated by the dynamic process of adsorption and desorption of SARA model molecules and FUL molecules on the surface of model of column packing. In this work, FUL model molecules, SAR model molecules and FCP-Al2O3 were selected to carry out molecular simulation research on the interaction between these model molecules and FCP-Al2O3. Figure 4 represented the optimized structures of SAR model molecules and FUL adsorbed on the surface of FCP-Al2O3, where the aromatic rings in A and R were close to the surface of FCP-Al2O3. The adsorption energies (Table 3) of SAR model molecules and FUL model molecules on the surface of FCP-Al2O3 were -400.35, -473.71, 599.99, 496.15 kJ/mol, respectively. Therefore, the order of adsorption ability of model molecules and FUL on the FCP-Al2O3 surface was S<A<FUL<R.
According to the mechanism of the acidic centers, the interactions between polycyclic aromatic hydrocarbons (PAHs) and the acidic sites on the adsorbent surface results in the adsorption of PAHs [34,35,36]. From the perspective of Lewis acid-base theory, R and A model molecules have the ability to donate electrons, and their π electrons could interact with the Lewis acid center in FCP-Al2O3. The adsorption energies of S, A, and R model molecules on the surface of FCP-Al2O3(100) were gradually enhanced, which were mainly attributed to R and A containing aromatic rings, and the electron density on the aromatic rings in R was higher than that in A (See Figure 5), resulting in stronger interaction between the π electrons on the aromatic ring in R and the Lewis acid center than that between A and the center. However, there was no aromatic ring in S, and van der Waals interaction was the dominant interaction between S and Lewis acid center, so the adsorption energy of S on the surface of FCP-Al2O3(100) was the weakest.
3.2.2. Interactions Between FUL and SAR Model Molecules
The σ-profiles of S, A, R and FUL were shown in Figure 6. The σ-profile of FUL had wider distribution than that of S, A and R model molecules, indicating that FUL was more polar than S, A and R model molecules. In addition, the distribution width of the screening charge of S, A and R model molecules increased in sequence, indicating that the order of polarity for the model molecules was S<A<R. According to the principle of “like dissolves like”, unadsorbed furfural would promote the desorption of S, A and R molecules which were adsorbed on the surface of FCP-Al2O3 ( the promotion effect is similar to elution, and the effect is enhanced in turn).
It could be seen from Table 4 that the interaction energy between S, A, R and FUL was -82.278, -88.197, -104.56 kJ/mol respectively, indicating that the order of interaction between S, A, R model molecules and FUL was S<A<R, which was consistent with the order of polarity of S, A, R model molecules. The reason for the increasing interaction between S, A, R and FUL molecules in turn was mainly that the electronic cloud density of R was greater than that of A, so the interaction between the electron deficient H atom of five-membered ring in FUL and the π-electron of the aromatic ring in R was greater than that between A and FUL, besides, there was no aromatic ring in S, so the interaction between between A and FUL was greater than that between S and FUL. Based on the difference in the interaction between FUL and model molecules, the promotion effect of unadsorbed FUL for the desorption S, A, R model molecules adsorbed on the adsorbent was gradually enhanced.
3.2.3. The Influence Mechanism of FUL on the Analysis of SARA Fractions
In order to understand the influence of FUL on the analysis of SARA fractions in raffinate and extract phases for DAO more clearly, a mechanism was proposed as shown in Figure 7. When the sample did not contain FUL, the adsorption ability of saturates fraction, aromatics fraction and resins fraction on the surface of FCP-Al2O3 was sequentially enhanced during the sample loading process, resulting that the chromatographic bands of R, A and S were in order from top to bottom. During the elution process, the DAO samples were separated S, A and R fractions by using eluents with sequentially increasing polarity (such as n-heptane, toluene, toluene-ethanol). When the content of FUL in the sample was higher, during the sample loading process, the adsorption ability of FUL on the surface of FCP-Al2O3 was stronger than that of A and S. Therefore, FUL would be preferentially adsorbed on the surface of FCP-Al2O3 and occupy the adsorption sites belonged to A and S originally, which made the chromatographic bands of A and S move downward as a whole. On the other hand, the interaction between unadsorbed polar solvent FUL and S, A, and R molecules was sequentially enhanced, indicating that the promotion effect of unadsorbed FUL for the desorption S, A, R model molecules adsorbed on the adsorbent was enhanced in turn, and resulting in the significantly shift down of chromatographic bands for R and A. In summary, the comprehensive influence of a large amount of FUL on the adsorption and desorption of S, A, and R on the surface of FCP-Al2O3 eventually led to some A being eluted down earlier while eluting S with n-heptane, and some R being eluted out earlier while eluting A with toluene.
3.3. The Determination of FUL Content
The results of determination of content for SARA fractions in simulated raffinate and extract phases containing FUL indicated that the FUL with a higher content in sample did have influence on the analysis of SARA fractions, and the mechanism of the influence of furfural on the analysis of SARA content was revealed by molecular simulation accordingly. On one hand, the production process required the control of the furfural content in the product or intermediate product. On the other hand, the analysis of SARA content of the oil required that the solvent must be removed. Therefore, it is necessary to provide an accurate method for the analysis of the furfural content. The improved vacuum oven method had been described in the experimental section (Figure 2). In order to verify the reliability of the method, the analytical conditions were first optimized and then the precision and accuracy of the method were investigated.
3.3.1. The Optimization of Analytical Conditions
The effects of sample mass, the set time of oven for processing the sample, the set vacuum degree, and the set temperature of oven on the furfural recovery rate in FUL10 were listed in Figure 8 a, b, c, and d respectively. Furfural recovery rate in FUL10 gradually decreased with the increase of sample mass, and increased with the increase of the set time, the set vacuum degree, and the set temperature of oven. In addition, the furfural recovery rate in FUL10 corresponding to the sample mass of 0.8g, the set time of 60min, the set vacuum degree of 93 KPa, and the set temperature of 105℃ were 100.06%, 100.11%, 100.28%, and 99.879%, respectively. Accordingly, it was suitable to choose the above conditions as the analysis conditions of furfural content in simulated raffinate phase.
On the premise of not affecting the accuracy and precision of the experimental results, in order to improve the operability and convenience of the analytical experimental process, the sample mass and vacuum degree of the analysis conditions of furfural content in the simulated extract phase could be kept consistent with those of the simulated raffinate phase. Therefore, it was only necessary to study the effects of the set time and the set temperature of oven on the recovery of furfural in the simulated extract phase. The effect of the set time and set temperature on the recovery of furfural in the simulated raffinate phase was represented in Figure 9, from which it could be seen that the recovery of furfural increased with the increase of the time and the set temperature. Besides, when sample mass was 0.8g and the set vacuum degree was 93 KPa, in the condition of the set time of 50min and the set temperature of 75℃, the furfural recovery rate of FUL90 were closer to 100% respectively. Consequently, it was more appropriate to select the above conditions as the analysis conditions of furfural content in the simulated extract phase.
3.3.2. The Accuracy and Precision of Vacuum-Oven Method
Under optimized analytical conditions, the precision and accuracy of the determination of furfural content in simulated raffinate phase are listed in Table 5. Obviously, RSD of the measured value of furfural content in FUL5-30 were less than 1%, and the recovery of furfural were in the range of 99.9-100.3%. RSD of the measured value of furfural content in FUL80-95 were less than 0.5%, and the recovery of furfural were in the range of 99.7-100.5%. It showed that the vacuum oven method had good precision and accuracy for the determination of furfural content in the simulated raffinate and extract phase.
The determination results of furfural content in real DAO raffinate and extract phase samples were summarized in Table 6. RSD of the measured value of furfural content in R-SL-1, R-SL-2, R-SL-3, R-SL-4, and R-SL-5 were 0.47%, 0.36%, 0.34%, 0.48%, and 0.92%, respectively. Similarly, RSD of the measured value of furfural content in E-SL-1, E-SL-2, E-SL-3, E-SL-4 and E-SL-5 were 0.11%, 0.06%, 0.08%, 0.06%, and 0.02%, respectively. Thus, it was now clear that the vacuum-oven method also had a good precision for the determination of furfural content in real DAO raffinate and extract phase samples.
4. Conclusions
The results of analysis for SARA fractions showed that the chromatographic band, the color of the eluate and the content of SARA fractions were less affected by FUL when the content of FUL in the sample was low. Nevertheless the content analysis of SARA fractions was more affected by the furfural with a higher content in the sample, and during the process of sample loading, some chromatographic bands of R and A significantly shifted down, some A being eluted down earlier while eluting S with n-heptane, and some R being eluted out earlier while eluting A with toluene. The results of molecular simulation indicated that the order of adsorption energy of model molecules (S、A、R and FUL) on the surface of FCP-Al2O3 was S<A<FUL<R, and the order of interaction energy between FUL and model molecules was S< A<R. During the process of sample loading, FUL would be preferentially adsorbed on the surface of FCP-Al2O3, meanwhile, some unadsorbed furfural would promote the desorption of S, A and R molecules which were adsorbed on the surface of FCP-Al2O3 (the promotion effect was similar to elution, and the effect was enhanced in turn), which made some chromatographic bands of R and A significantly shift down, and led to the earlier elution of A and R. Hence, the influence of FUL on the analysis of SARA fractions could be better explained by the results of molecular simulations. Furthermore, the improved vacuum distillation method, namely the vacuum-oven method could be used to accurately determine the content of furfural in the sample.
Acknowledgments
The author was particularly grateful to Wuhan Institute of Technology and Sinopec Research Institute of Petroleum Processing for providing experimental conditions.
Conflicts of Interest
The authors declare that they have no known competing financial interests or personal relationships that could have appeared to influence the work reported in this paper.
References
- Duan, Y. J.; Liu, Y. L.; Chen, Z. J.; et al. Amorphous molybdenum sulfide nanocatalysts simultaneously realizing efficient upgrading of residue and synergistic synthesis of 2D MoS2 nanosheets/carbon hierarchical structures [J]. Green Chem. 2020, 22, 44–53. [Google Scholar] [CrossRef]
- Hu, H.; Wu, M. B. Heavy oil-derived carbon for energy storage application [J]. J. Mater. Chem. A 2020, 8(15), 1–18. [Google Scholar] [CrossRef]
- Kang, J.; Myint, A. A.; Sim, S.; et al. Kinetics of the upgrading of heavy oil in supercritical methanol[J]. J. Supercrit. Fluids 2018, 133, 133–138. [Google Scholar] [CrossRef]
- Lim, S. H.; Go, K. S.; Nho, N. S.; et al. Effect of reaction temperature and time on the products and asphaltene dispersion stability in slurry-phase hydrocracking of vacuum residue[J]. Fuel 2018, 234, 305–311. [Google Scholar] [CrossRef]
- Kim, C. H.; Hur, Y. G.; Lee, S. H.; et al. Hydrocracking of vacuum residue using nano-dispersed tungsten carbide catalyst[J]. Fuel 2018, 233, 200–206. [Google Scholar] [CrossRef]
- Im, S. I.; Shin, S.; Park, J. W.; et al. Selective separation of solvent from deasphalted oil using CO2 for heavy oil upgrading process based on solvent deasphalting[J]. Chem. Eng. J. 2018, 331, 389–394. [Google Scholar] [CrossRef]
- Kim, S. H.; Kim, K. D.; Lee, Y. K. Effects of dispersed MoS2 catalysts and reaction conditions on slurry phase hydrocracking of vacuum residue[J]. J. Catal. 2017, 347, 127–137. [Google Scholar] [CrossRef]
- Chen, Z.; Yao, X. H.; Guan, D.; et al. Vacuum residue coking process simulation using molecular-level kinetic model coupled with vapor-liquid phase separation[J]. Chin. J. Chem. Eng. 2022, 41, 301–310. [Google Scholar] [CrossRef]
- Xing, B.; Ye, L.; Liu, J.; et al. Reaction network of sulfur compounds in delayed coking process[J]. Chem. Eng. J. 2021, 422, 129903. [Google Scholar] [CrossRef]
- Alonso-Ramírez, G.; Cuevas-García, R.; Sanchez-Minero, F.; et al. Catalytic hydrocracking of a Mexican heavy oil on a MoS2/Al2O3 catalyst: I. Study of the transformation of isolated saturates fraction obtained from SARA analysis[J]. Catal. Today 2020, 353, 153–162. [Google Scholar] [CrossRef]
- Bisht, H.; Balachandran, V. S.; Patel, M.; et al. Effect of composition of coke deposited in delayed coker furnace tubes on on-line spalling[J]. Fuel Process. Technol. 2018, 172, 133–141. [Google Scholar] [CrossRef]
- Prajapati, R.; Kohli, K.; Maity, S. K. Residue upgradation with slurry phase catalyst: effect of feedstock properties[J]. Fuel 2019, 239, 452–460. [Google Scholar] [CrossRef]
- Tang, R. Y.; Yuan, M.; Liu, K.; et al. Utilization of bifunctional catalyst for upgrading petroleum residue via cracking and gasification: effect of catalysts[J]. J. Energy Inst. 2019, 92, 1936–1943. [Google Scholar] [CrossRef]
- Che, Y. J.; Yuan, M.; Qiao, Y. Y.; et al. Fundamental study of hierarchical millisecond gas-phase catalytic cracking process for enhancing the production of light olefins from vacuum residue[J]. Fuel 2019, 237, 1–9. [Google Scholar] [CrossRef]
- Manek, E.; Haydary, J. Hydrocracking of vacuum residue with solid and dispersed phase catalyst: modeling of sediment formation and hydrodesulfurization[J]. Fuel Process. Technol. 2017, 159, 320–327. [Google Scholar] [CrossRef]
- Park, J. W.; Kim, M. Y.; Im, S. I.; et al. Development of correlations between deasphalted oil yield and Hansen solubility parameters of heavy oil SARA fractions for solvent deasphalting extraction[J]. J. Ind. Eng. Chem. 2022, 107, 456–465. [Google Scholar] [CrossRef]
- Zhang, W.; Luo, T.; Ye, Z. Y.; et al. Effect of temperature on the solubility of SARA components in n-Alkane (C3-C5) deasphalting: molecular simulation and experimental study[J]. J. Mol. Liq. 2021, 342, 117523. [Google Scholar] [CrossRef]
- Magomedov, R. N.; Pripakhaylo, A. V.; Dzhumamukhamedov, D. S.; et al. Solvent deasphalting of vacuum residue using carbon dioxide-toluene binary mixture[J]. J. CO2 Util. 2020, 40, 101206. [Google Scholar] [CrossRef]
- Mostafa, H. Y.; El Naggar, A. M. A.; Elshamy, E. A.; et al. Microwave-assisted extraction for refining of petroleum wax distillate feedstock[J]. J. Clean. Prod. 2019, 228, 1034–1047. [Google Scholar] [CrossRef]
- Pinheiro, C. T.; Pais, R. F.; Quina, M. J.; et al. Regeneration of waste lubricant oil with distinct properties by extraction-flocculation using green solvents[J]. J. Clean. Prod. 2018, 200, 578–587. [Google Scholar] [CrossRef]
- Yang, W.; Wang, X.; Ni, S.; et al. Effective extraction of aromatic monomers from lignin oil using a binary petroleum ether/dichloromethane solvent[J]. Sep. Purif. Technol. 2021, 267, 118599. [Google Scholar] [CrossRef]
- Li, H.; Guo, J.; Zhang, Y.; et al. Influence of solvent structure on the extraction of aromatics from FCC diesel and computational thermodynamics study[J]. Fuel Process. Technol. 2021, 224, 107021. [Google Scholar] [CrossRef]
- Suganuma, S.; Katada, N. Innovation of catalytic technology for upgrading of crude oil in petroleum refinery[J]. Fuel Process. Technol. 2020, 208, 106518. [Google Scholar] [CrossRef]
- Larriba, M.; De Riva, J.; Navarro, P.; et al. COSMO-based/Aspen Plus process simulation of the aromatic extraction from pyrolysis gasoline using the {[4empy][NTf2] + [emim][DCA]} ionic liquid mixture[J]. Sep. Purif. Technol. 2018, 190, 211–227. [Google Scholar] [CrossRef]
- Ferreira, P. S.; Madeira, N. C. L.; Folli, G. S.; et al. SAP fractions from light, medium and heavy oils: correlation between chemical profile and stationary phases[J]. Fuel 2020, 274, 117866. [Google Scholar] [CrossRef]
- Wang, J. Y.; Wang, T.; Hou, X. D.; et al. Modelling of rheological and chemical properties of asphalt binder considering SARA fraction[J]. Fuel 2019, 238, 320–330. [Google Scholar] [CrossRef]
- Karevan, A.; Yamchi, H. S.; Aghajamali, M.; et al. Automated high-performance liquid chromatography for SARA analysis (SARA-HPLC)[J]. Energy Fuels 2021, 35, 17642–17650. [Google Scholar] [CrossRef]
- Kumar, R.; Chebrolu, S.; Voolapalli, R. K.; et al. A solvent and deasphalting dearomatization (SD-A2) process for heavy oil upgradation[J]. Fuel 2022, 307, 121923. [Google Scholar] [CrossRef]
- Chu, X. L.; Yuan, H. F.; Lu, W. Z. Determining four component contents in residues by partial least squares-ultraviolet-visible spectrophotometry[J]. Chin. J. Anal. Chem. 2000, 28, 1457–1461. [Google Scholar]
- Mohammadi, M.; Khanmohammadi Khorrami, M.; Vatani, A.; et al. Genetic algorithm based support vector machine regression for prediction of SARA analysis in crude oil samples using ATR-FTIR spectroscopy[J]. Spectrochim. Acta Part A Mol. Biomol. Spectrosc. 2021, 245, 118945. [Google Scholar] [CrossRef] [PubMed]
- Du, P. A.; Ren, M. N.; Jiang, D.; et al. An experimental study on optimization utilization of deasphalted oil[J]. Fuel Process. Technol. 2012, 99, 64–68. [Google Scholar] [CrossRef]
- Li, D. D.; Greenfield, M. L. Chemical compositions of improved model asphalt systems 4 for molecular simulations[J]. Fuel 2014, 115(1), 347–356. [Google Scholar] [CrossRef]
- Gilbert-López, B.; Robles-Molina, J.; García-Reyes, J. F.; et al. Rapid determination of BTEXS in olives and olive oil by headspace-gas chromatography/mass spectrometry (HS-GC–MS) [J]. Talanta 2010, 83, 391–399. [Google Scholar] [CrossRef] [PubMed]
- Wang, W. Y.; Liu, C.; Yuan, P. Advances on the removal of polycyclic aromatic hydrocarbons in environment by adsorption[J]. Chem. Ind. Eng. Prog. 2017, 36(1), 355–362. [Google Scholar]
- Araújo, R. S.; Azevedo, D. C. S.; Cavalcante, C. L., Jr.; et al. Adsorption of polycyclic aromatic hydrocarbons (PAHs) from isooctane solutions by mesoporous molecular sieves: Influence of the surface acidity[J]. Microporous Mesoporous Mater. 2008, 108, 213–222. [Google Scholar] [CrossRef]
- Costa, A. A.; Wilson, W. B.; Wang, H. Y. Comparison of BEA, USY and ZSM-5 for the quantitative extraction of polycyclic aromatic hydrocarbons from water samples[J]. Microporous Mesoporous Mater. 2012, 149(1), 186–192. [Google Scholar] [CrossRef]
Figure 1.
Molecular structures of (a)S, (b)A, (c)R model molecules in DAO and FUL.
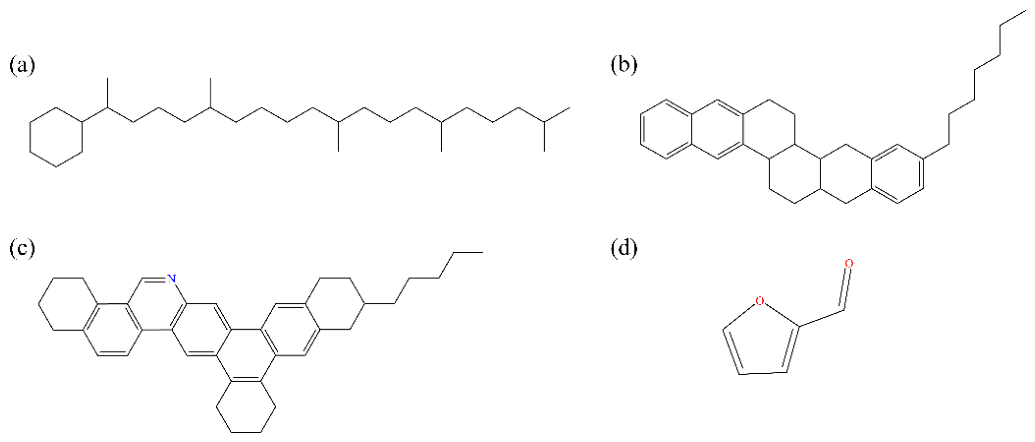
Figure 2.
Schematic diagrams for determination of FUL in samples by (a) the traditional vacuum distillation and (b) the improved vacuum distillation method.
Figure 2.
Schematic diagrams for determination of FUL in samples by (a) the traditional vacuum distillation and (b) the improved vacuum distillation method.
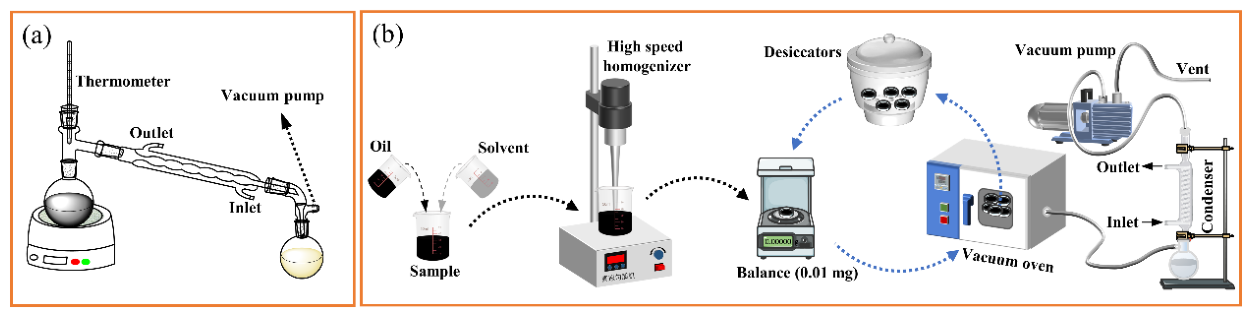
Figure 3.
The experimental phenomena for the content analysis of SARA fractions in the simulated raffinate and extract phases. (a) Chromatographic band after sample loading, (b) Chromatographic band after eluting saturates fraction, (c) Chromatographic band after eluting aromatic, (d) Eluate of saturates fraction, (e) Eluate of aromatics fraction.
Figure 3.
The experimental phenomena for the content analysis of SARA fractions in the simulated raffinate and extract phases. (a) Chromatographic band after sample loading, (b) Chromatographic band after eluting saturates fraction, (c) Chromatographic band after eluting aromatic, (d) Eluate of saturates fraction, (e) Eluate of aromatics fraction.
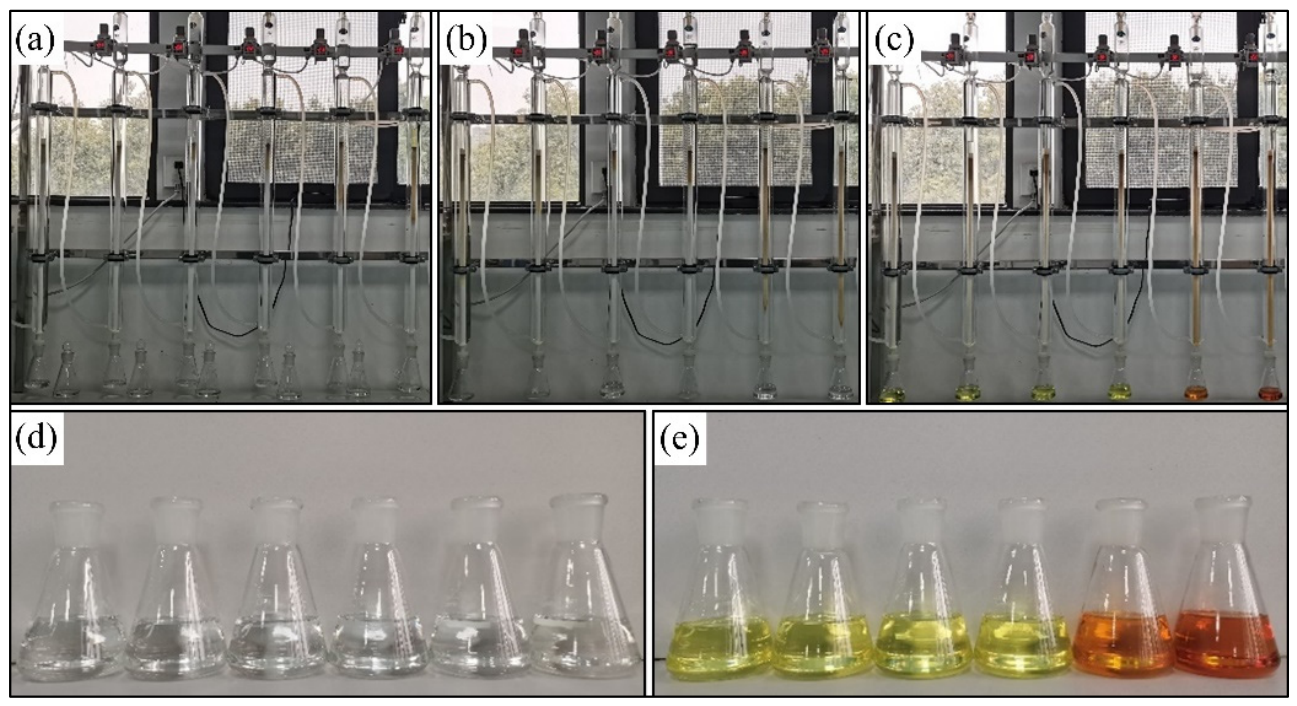
Figure 4.
Optimization structures for adsorption of (a) S, (b) A, (c) R, (d) FUL on the surface of Al2O3(100).
Figure 4.
Optimization structures for adsorption of (a) S, (b) A, (c) R, (d) FUL on the surface of Al2O3(100).
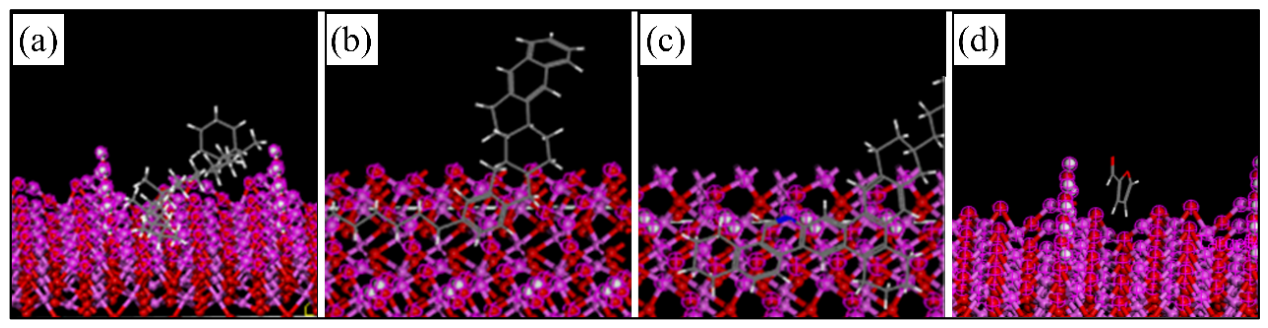
Figure 5.
The ESPs of (a) S, (b) A, (c) R, and (d) FUL.
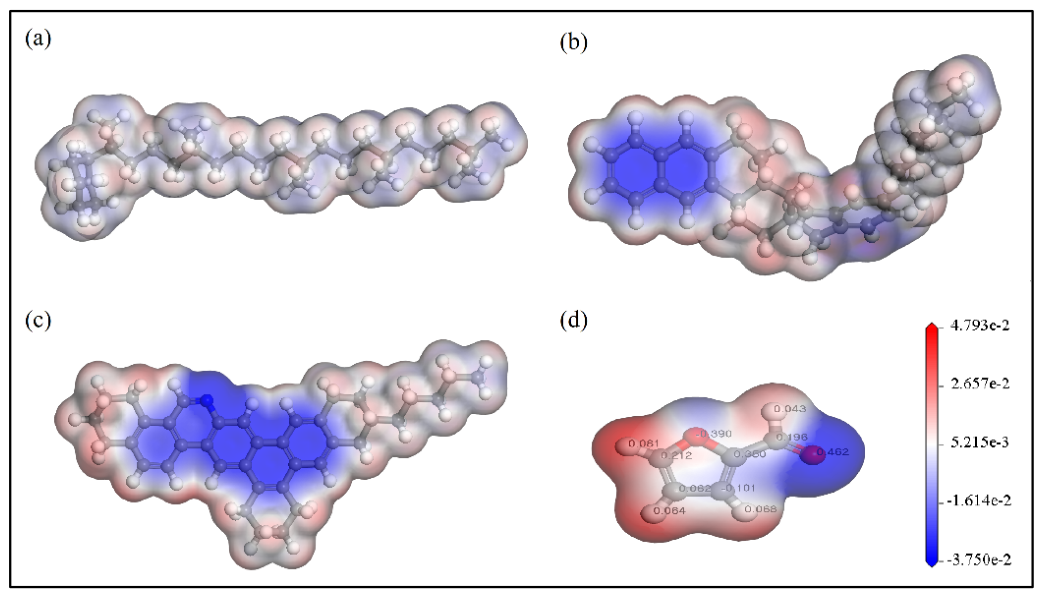
Figure 6.
The σ-profiles of model molecules of S, A, R and FUL.
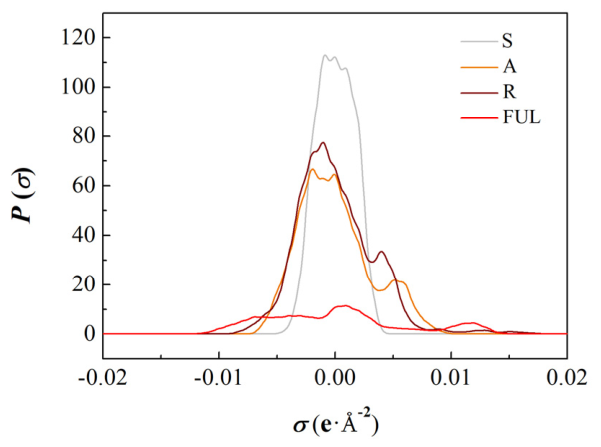
Figure 7.
The influence mechanism of FUL on the analysis of SARA fractions in DAO by EC.
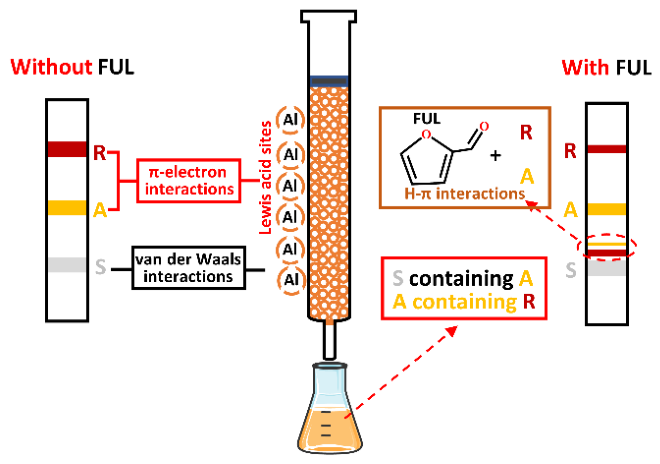
Figure 8.
Influences of analysis conditions on the furfural recovery of FUL10: (a) sample mass, (b) time, (c) vacuum degree, and (d) temperature.
Figure 8.
Influences of analysis conditions on the furfural recovery of FUL10: (a) sample mass, (b) time, (c) vacuum degree, and (d) temperature.
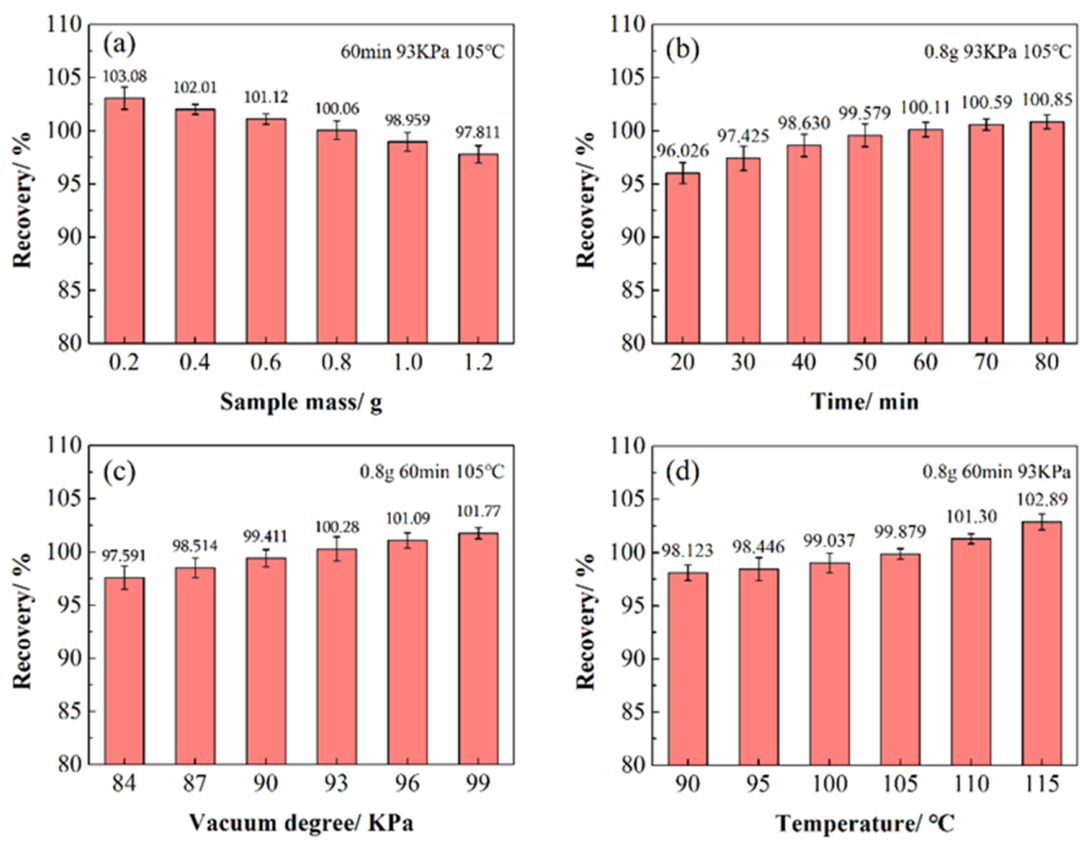
Figure 9.
Influences of analysis conditions on the furfural recovery of FUL-90: (a) time and (b) temperature.
Figure 9.
Influences of analysis conditions on the furfural recovery of FUL-90: (a) time and (b) temperature.
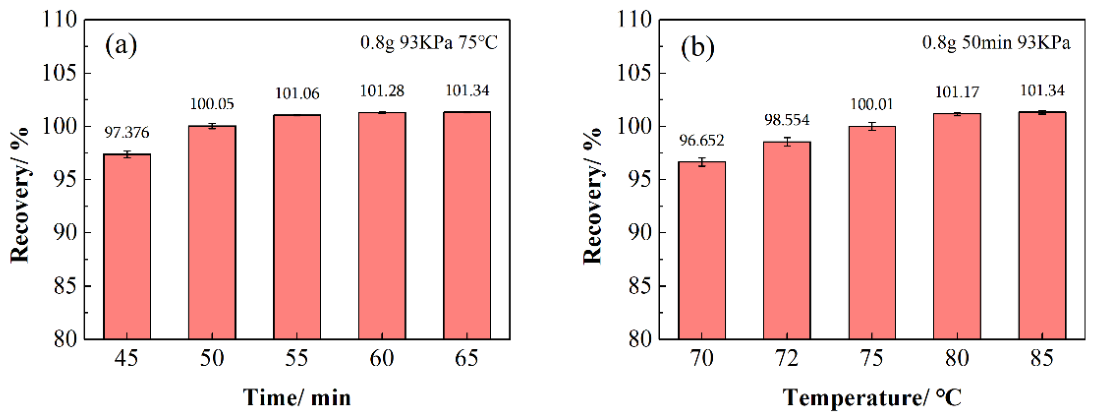

Table 1.
The properties of DAO and HPO.
| DAO | HPO | |
| ρ/kg·m-3 | 922.4 (50℃) | 866.2 (25℃) |
| v/mm2·s-1 | 6174.0 (50℃) | 25.7(25℃) |
| S/% | 28.868 | 97.256 |
| A/% | 44.668 | 0.569 |
| RA/% | 26.464 | 2.175 |
Table 2.
The contents of SARA fractions in sample for simulated raffinate and extract phases.
| Samples | The contents of SARA fractions,% | ||
| wS | wA | wRA | |
| FUL0 | 80.721 | 8.4790 | 10.800 |
| FUL10 | 80.125 | 8.7199 | 11.155 |
| FUL20 | 80.662 | 8.7689 | 10.569 |
| FUL30 | 80.236 | 9.0033 | 10.761 |
| FUL80 | 81.153 | 10.344 | 8.5030 |
| FUL90 | 82.390 | 12.392 | 5.2180 |
Table 3.
The adsorption energy of model molecules and FUL model molecules on the surface of FCP-Al2O3(100), kJ/mol.
Table 3.
The adsorption energy of model molecules and FUL model molecules on the surface of FCP-Al2O3(100), kJ/mol.
| S-Al2O3 | A-Al2O3 | R-Al2O3 | FUL-Al2O3 |
| -400.35 | -473.71 | -599.99 | -496.15 |
Table 4.
The interaction energy between model molecules and FUL, kJ/mol.
| S- FUL | A- FUL | R- FUL |
| -82.278 | -88.197 | -104.56 |
Table 5.
The precision and accuracy of determination of FUL content in the simulated raffinate and extract phases.
Table 5.
The precision and accuracy of determination of FUL content in the simulated raffinate and extract phases.
| Sample | wture (%) | w (%,n=5) | (%) | RSD (%) | Recovery (%) | ||||
| 1 | 2 | 3 | 4 | 5 | |||||
| FUL5 | 5.0061 | 5.0160 | 5.0555 | 5.0653 | 4.9886 | 4.9550 | 5.0161 | 0.92 | 100.20 |
| FUL10 | 10.006 | 10.010 | 9.9197 | 9.9760 | 10.159 | 10.098 | 10.033 | 0.95 | 100.27 |
| FUL15 | 15.004 | 15.136 | 15.111 | 15.065 | 15.011 | 14.921 | 15.049 | 0.57 | 100.30 |
| FUL20 | 20.013 | 20.035 | 19.959 | 20.025 | 20.011 | 19.981 | 20.002 | 0.16 | 99.946 |
| FUL25 | 25.009 | 25.056 | 25.073 | 24.972 | 24.990 | 24.880 | 24.994 | 0.31 | 99.941 |
| FUL30 | 30.000 | 29.934 | 30.083 | 30.090 | 29.956 | 30.000 | 30.013 | 0.24 | 100.04 |
| FUL80 | 79.999 | 79.756 | 79.945 | 80.159 | 80.204 | 80.357 | 80.084 | 0.29 | 100.11 |
| FUL85 | 84.998 | 84.628 | 85.287 | 84.733 | 85.461 | 84.850 | 84.992 | 0.43 | 99.993 |
| FUL90 | 90.009 | 89.708 | 89.632 | 90.050 | 89.719 | 89.868 | 89.795 | 0.18 | 99.763 |
| FUL95 | 94.993 | 95.535 | 95.520 | 95.131 | 95.469 | 95.618 | 95.455 | 0.20 | 100.49 |
Table 6.
The determination of FUL content in real DAO raffinate and extract phases.
| Sample | w (%,n=5) | (%) | RSD (%) | ||||
| 1 | 2 | 3 | 4 | 5 | |||
| R-SL-1 | 17.893 | 18.080 | 18.072 | 18.084 | 18.095 | 18.045 | 0.47 |
| E-SL-1 | 88.353 | 88.211 | 88.433 | 88.457 | 88.324 | 88.356 | 0.11 |
| R-SL-2 | 13.382 | 13.289 | 13.269 | 13.261 | 13.309 | 13.302 | 0.36 |
| E-SL-2 | 91.046 | 91.044 | 91.009 | 91.132 | 91.116 | 91.069 | 0.06 |
| R-SL-3 | 15.379 | 15.413 | 15.320 | 15.355 | 15.278 | 15.349 | 0.34 |
| E-SL-3 | 93.365 | 93.259 | 93.294 | 93.327 | 93.441 | 93.337 | 0.08 |
| R-SL-4 | 18.632 | 18.673 | 18.729 | 18.500 | 18.562 | 18.619 | 0.48 |
| E-SL-4 | 93.668 | 93.792 | 93.774 | 93.801 | 93.795 | 93.766 | 0.06 |
| R-SL-5 | 9.6711 | 9.8992 | 9.8241 | 9.8848 | 9.8119 | 9.8182 | 0.92 |
| E-SL-5 | 94.599 | 94.564 | 94.596 | 94.597 | 94.584 | 94.588 | 0.02 |
Disclaimer/Publisher’s Note: The statements, opinions and data contained in all publications are solely those of the individual author(s) and contributor(s) and not of MDPI and/or the editor(s). MDPI and/or the editor(s) disclaim responsibility for any injury to people or property resulting from any ideas, methods, instructions or products referred to in the content. |
© 2026 by the authors. Licensee MDPI, Basel, Switzerland. This article is an open access article distributed under the terms and conditions of the Creative Commons Attribution (CC BY) license (http://creativecommons.org/licenses/by/4.0/).
Copyright: This open access article is published under a Creative Commons CC BY 4.0 license, which permit the free download, distribution, and reuse, provided that the author and preprint are cited in any reuse.