
Submitted:
31 July 2026
Posted:
31 July 2026
You are already at the latest version
Abstract
Background: Overexpression and increased activity of ATP-binding cassette (ABC) transporters, such as P-glycoprotein (ABCB1/P-gp), breast cancer resistance protein (ABCG2/BCRP), and multidrug resistance-associated proteins (ABCC/MRPs), are known to be among the major contributors to multidrug resistance (MDR) in tumors to structurally similar or even different chemotherapeutic agents, thereby decreasing treatment efficacy. Thus, there is an urgent need to develop novel, effective therapies that overcome MDR and increase chemotherapy response rates. Results: We showed here that receptor tyrosine kinase inhibitors (RTKIs) designed to inhibit the overactivated FGFR and/or VEGFR signaling pathways exert an “off-target” effect on MDR proteins in colorectal cancer (CRC), thereby sensitizing CRC to certain chemotherapies. In particular, Pemigatinib and Infigratinib ranked among the top 8 tested selective and non-selective FGFR/VEGFR inhibitors that effectively resensitized all types of CRC cells to the DNA topoisomerase II inhibitor Doxorubicin and, in fewer experimental settings, to the antimetabolite 5-Fluorouracil. This was evidenced by a significant increase in apoptosis in CRC cells treated with the aforementioned chemotherapeutic drugs in combination with RTKIs. Of note, despite the CRCs exhibiting signs of FGFR and VEGFR activation, RTKIs alone exhibited only minor pro-apoptotic and anti-proliferative activities. The enhancement of pro-apoptotic activity of Doxorubicin when co-treated with Pemigatinib, Lucitanib, and Regorafenib in HCT116 cells was consistent with a decrease in proliferative activity in CRC cells treated with these RTKIs alone. This was also revealed by high synergy scores (SC) between several RTKIs (e.g., Pemigatinib, Lucitanib, and Regorafenib) and Doxorubicin in CRC cells. The aforementioned effects of RTKIs were due to inhibition of MDR-related ABC transporter activity, particularly ABCB1 and ABCG2. Indeed, in HCT116 cells, Lucitanib and, to a lesser extent, Pemigatinib impaired the efflux of the intrinsically fluorescent Doxorubicin and Mitoxantrone. Similarly, the efflux of Calcein AM, an ABCB1 substrate, was significantly impaired in Lucitanib- and Pemigatinib-treated CRC cells, thereby revealing ABCB1 as a molecular target for these RTKIs. Consistent with SC data, Infigratinib and Cabozatinib effectively impaired the efflux of Doxorubicin from Colon-26 cells. Similarly, ABCB1 protein was found to be a primary target for Infigratinib in Colon-26 cancer cells, which was evidenced by competitive assay data based on the combined use of selective ABCB1 and ABCG2 inhibitors (e.g., Tariquidar and Ko-143, respectively). Importantly, ABC-inhibitory effects of RTKIs in CRC cells were mediated solely by impaired efflux of chemotherapeutic agents from CRCs and were not due to decreased expression of ABC-transporters or their subcellular distribution. Lastly, we found Infigratinib to be an effective chemosensitizing agent for the Colon-26 murine colon carcinoma in vivo. This was evidenced by reduced growth of Colon-26 allografts in the experimental group receiving the combined therapy of Infigratinib and Doxorubicin compared with the single-treated groups. Consistent with these findings, immunohistochemical (IHC) staining revealed a substantial increase in apoptotic cells (e.g., cleaved caspase-3-positive) and a decrease in proliferative cells (e.g., Ki-67-positive) in allografts from animals treated with a combination of Infigratinib and Doxorubicin. Conclusions: We show here for the first time that some FGFR inhibitors (e.g., Pemigatinib and Infigratinib) can effectively potentiate cytotoxic and antiproliferative activity against CRC cells overexpressing MDR-related ABC transporters, thereby providing novel therapeutic avenues for treating CRC that progresses despite standard conventional therapies.
Keywords:
receptor tyrosine kinase inhibitors (RTKI)
; colorectal cancer (CRC)
; resistance
; ABC transporters
; sensitization
; apoptosis
1. Introduction
Colorectal cancer (CRC) is one of the most commonly diagnosed human malignancies, which accounts for about 10% of all cancer incidence [1] and is the fifth leading cause of death worldwide [2,3]. Surgery and chemotherapy are currently established treatment options for colon cancer patients, depending upon the tumor location, size, and stage of cancer [4]. Chemotherapy may be given at any stage of the disease and is generally administered in an adjuvant setting (i.e., after surgery). Despite the increase in the overall survival (OS) of patients with colon cancer over the past decades, the vast majority of them eventually develop multi-drug resistance (MDR), which decreases the efficacy of the chemotherapeutic agents and ultimately leads to failure of the chemotherapy [5].
The mechanisms of MDR in cancer are complex, including activation of DNA repair and drug detoxifying enzymes [6,7], alterations in apoptosis signaling pathways [8,9], development of epithelial-to-mesenchymal transition (EMT) [10,11], presence of cancer stem cells (CSCs) [12], and enhanced efflux of anti-cancer agents by membrane transporters [13,14]. The last one is based on the enhanced expression and activity of ATP-binding cassette (ABC) superfamily proteins, mainly P-glycoprotein (P-gp/ABCB1/MDR1), multidrug resistance protein 1 (MRP-1/ABCC1), and breast cancer resistance protein (BCRP/ABCG2) [13,14]. P-glycoprotein, encoded by the multidrug resistance 1 (MDR1) gene, is the best-known ABC transporter mediating the efflux of chemotherapeutic agents from cancer cells in an ATP-dependent manner [14]. Indeed, a significant correlation was found between increased P-gp expression in cancer cells and their resistance to a broad spectrum of chemotherapeutic agents. In particular, this includes DNA topoisomerase II inhibitors (e.g., Doxorubicin and Etoposide), mitotic-poisoning agents (e.g., Paclitaxel and Vinblastine), and PARP inhibitors (e.g., Olaparib) [15,16,17,18]. As expected, elevated expression of P-gp, MRP-1, and BCRP in cancer cells is often associated with reduced chemotherapeutic responses and OS across a broad spectrum of human malignancies, including both solid tumors and blood cancers [19,20,21,22].
Therefore, the development of reversal strategies or the discovery of novel reversal agents to overcome MDR-mediated mechanisms in cancer cells is currently the research focus of cancer therapy. Unfortunately, there is still no therapeutic agent approved by the U.S. Food and Drug Administration (FDA) for patients with multidrug-resistant cancers. Despite the potent synthetic inhibitors of ABCB1 and ABCG2 discovered in recent years [23], the lack of selectivity and unfavorable drug-drug interactions have hindered further development of these inhibitors [24,25]. As an alternative, a tremendous amount of effort, including our own, has recently been devoted to repurposing tyrosine kinase inhibitors (TKIs) as ABCB1 and ABCG2 modulators to enhance the sensitivity of multidrug-resistant cancer cells to conventional chemotherapeutic agents [13,26,27]. This includes Nilotinib, a selective BCR-ABL kinase inhibitor [28], Afatinib, a pan-ErbB inhibitor [29], Imatinib, targeting BCR-ABL and KIT tyrosine kinases [30,31], Dasatinib, a BCR-ABL kinase inhibitor [32], Gefitinib, an EGFR inhibitor [33], Lapatinib, a dual HER2/neu and EGFR inhibitor [34], Erlotinib, an EGFR inhibitor [35], Sunitinib, an inhibitor of PDGFR and VEGFR [36], etc. Moreover, several TKIs exhibited potent ABC-transporter inhibitory activity ex vivo. This was shown for Alectinib, an inhibitor of ALK [37]; Ibrutinib, an inhibitor of BTK [38]; Neratinib (Nerlynx, HKI-272), a dual inhibitor of EGFR and HER2 [39]; and Osimertinib (Tagrisso, Tagrix), a third-generation EGFR inhibitor [40].
We previously showed that BGJ-398 (Infigratinib), a well-known selective FGFR inhibitor, targets P-gp and increases chemotherapy-induced mortality in several multidrug-resistant tumor cell lines, including triple-negative breast cancer and gastrointestinal stromal tumor cells [41]. Given that the MDR phenotype is a common signature of a broad spectrum of human malignancies, including CRC, and taking into account activation of the FGFR and VEGFR pathways, which is frequently detected in CRC [42,43,44,45], we expanded our research to examine whether multi-kinase inhibitors targeting the aforementioned signaling pathways can also exhibit their “off-target” effect and increase the sensitivity of CRC to conventional chemotherapies. For this purpose, we used a panel of cancer cell lines, including HCT116 and RKO human colorectal carcinoma cell lines. The mouse adenocarcinoma cell line Colon-26 was used in both in vitro and in vivo studies to demonstrate enhanced anti-tumor activity of the chemotherapeutic agent Doxorubicin when combined with an RTKI. The ability of RTKIs to sensitize CRC cells to doxorubicin was examined for TKIs selectively targeting the FGFR pathway (e.g., Infigratinib and Pemigatinib), and multi-kinase RTKIs targeting VEGFR, FGFR, and the other signaling pathways (e.g., Axitinib, Regorafenib, Sunitinib, Cabozantinib, Alofanib, and Lucitanib).
We found that Pemigatinib, Lucitanib, Regorafenib, and Infigratinib were the most potent RTKI, effectively sensitizing CRC cells to certain chemotherapeutic agents, including the DNA topoisomerase inhibitors Doxorubicin and Mitoxantrone, as well as the antimetabolite 5-Fluorouracil. Indeed, CRC cells treated with chemotherapeutic agents in combination with Regorafenib exhibited a dramatic decrease in cellular viability and proliferative activity when compared with CRCs treated with chemotherapeutic agents or RTKI alone. This was also revealed by high values of synergy scores (SC) between RTKIs and Doxorubicin in cancer cell lines used in the present study. Despite the CRC cells exhibiting signs of activation of FGFR and/or VEGFR signaling pathways, the chemosensitizing effects of RTKIs to Doxorubicin and Mitoxantrone were also due to their ability to promote retention within cancer cells. Importantly, by using the competitive assays with selective ABCB1 and ABCG2 inhibitors, we identified ABCB1 as a primary target for Infigratinib. Molecular docking analysis revealed that the aforementioned “off-target” effect of this FGFR inhibitor was attributable to its effective binding to the ABCB1 transmembrane domain. Of note, RTKI’s ability was not associated with decreased expression and/or relocalization of the 3 major ABC transporters (e.g., P-gp, MRP-1, and BCRP). Lastly, we showed that Infigratinib, a selective FGFR inhibitor previously found to be the most effective chemosensitizing agent for Colon-26 murine carcinoma cells in vitro, also sensitized CRC cells to Doxorubicin in vivo. This was evidenced by the reduced growth of Colon-26 colon cancer allografts when used in combination with Infigratinib and Doxorubicin. Immunohistochemical (IHC) staining revealed a substantial increase in apoptotic cells (e.g., cleaved caspase-3-positive) in allografts from animals receiving the combined therapy of Infigratinib and Doxorubicin compared with the single-treated groups. Conversely, the number of proliferative (e.g., Ki-67-positive cells) was significantly reduced after such combined therapy, thereby suggesting a therapeutic rationale for the combined use of FGFR and/or VEGFR inhibitors with certain chemotherapies, including DNA topoisomerase II inhibitors, such as Doxorubicin and Mitoxantrone.
2. Materials and Methods
2.1. Cell Lines and Culture Conditions
НСТ 116 and RKO human colon carcinoma cell lines were purchased from the American Type Culture Collection (ATCC, Manassas, VA, USA), whereas the Colon-26 murine colon adenocarcinoma cell line was obtained from CLS Cell Lines Service GmbH (Eppelheim, Germany). The parental SaOS-2 osteosarcoma and HCC1806 triple-negative breast cancer cells were obtained from the American Type Culture Collection (ATCC, Manassas, VA, USA), whereas Doxorubicin-resistant subline SaOS-2 DoxR and Paclitaxel-resistant HCC1806 Tx-R sublines, as well as Imatinib-resistant gastrointestinal stromal tumor subline, GIST T-1R, were generated previously and characterized in our lab [46,47,48], respectively. RPMI-1640 medium (Paneco, Moscow, Russia) was used for culturing all the aforementioned cancer cell lines. Fetal bovine serum 15% (Gibco; Thermo Fisher Scientific, Inc., Waltham, MA, USA) and 50 U/ml penicillin with 50 μg/ml streptomycin (Paneco, Moscow, Russia) were added to the medium. A temperature of 37 °C and a humidified atmosphere with 5% CO2 were maintained in the CO2 incubator (Binder GmbH, Tuttlingen, Germany) for culturing the cancer cells.
2.2. Chemical Compounds
Most of the chemical compounds were purchased from SelleckChem (Houston, TX, USA). This included inhibitors of receptor tyrosine kinases (e.g., Infigratinib, Pemigatinib, Alofanib, Axitinib, Lucitanib, Regorafenib, Cabozantinib, and Sunitinib), inhibitors of ABC transporters (e.g., Tariquidar, Mk-571, and Ko-143), and the chemotherapeutic drugs Doxorubicin and 5-Fluorouracil. Mitoxantrone dihydrochloride was acquired from Sigma-Aldrich (Merck KGaA, Darmstadt, Germany). Dimethyl sulfoxide (DMSO) was used for dissolving all compounds in accordance with the manufacturer’s recommendations.
2.3. Antibodies
The primary antibodies were purchased from Cell Signaling Technology Inc., Danvers, MA, USA (phospho-FGF Receptor (Tyr653/654) - cat. no. 3471S, FGF Receptor 1 (D8E4) - cat. no. 9740S, FGF Receptor 2 (D4L2V) - cat. no. 23328S, phospho-FRS2-alpha (Tyr196) - cat. no. 3864S, VEGF Receptor 1 (E7T9H) - cat. no. 64094T, phospho-VEGF Receptor 2 (Tyr996) - cat. no. 2474T, VEGF Receptor 2 (D5B1) - cat. no. 9698T, cleaved PARP - cat. no. 5625T, cleaved caspase-3 - cat. no. 9661T, actin - cat. no. 4970S); Santa Cruz Biotechnology, Dallas, TX, USA (FRS2 (A-5) - cat. no. sc-17841, MDR1/ABCB1 - cat. no. sc-55510, ABCG2 - cat. no. sc-58222); Sigma-Aldrich, St-Louis, MO, USA (Anti-phospho-VEGFR1 (pTyr1333) - cat. no. SAB4504006); Abcam plc., Cambridge, UK (anti-MRP1 - cat. no. ab260038). The secondary antibodies were obtained from Santa Cruz Biotechnology, Dallas, TX, USA (mouse anti-rabbit IgG-HRP - cat. no. sc-2357, m-IgGκ BP-HRP - cat. no. sc-516102). The antibody concentrations were determined according to the manufacturer’s instructions.
2.4. MTS-Based Assay of Interactions Between Chemotherapeutic Drugs
CRC cells were seeded into 96-well plates (Corning Inc., Corning, New York, USA). After 24 h of incubation, the culture medium was replaced with a new medium containing DMSO (as a control), chemotherapeutic compounds alone or in combinations for 72 h. To determine cellular viability, the culture medium was supplemented with MTS reagent (Promega, Madison, WI, USA) and phenazine methosulfate (Sigma-Aldrich, St-Louis, MO, USA) at a 20:1 ratio for 1 h. Detection was performed at 492 nm using a MultiScan FC plate reader (Thermo Fisher Scientific, Waltham, MA, USA). Results were normalized to the untreated control.
Half-inhibitory concentration (IC50) was calculated for CRCs treated with Doxorubicin, 5-Fluorouracil alone and with 10 μM of RTKIs, as well as monotherapy with all these inhibitors. Concentration which reduces cellular viability up to 50% was obtained using the online Very Simple IC50 Tool Kit (https://ic50.org/, accessed on 21 March 2026).
The interaction type between chemotherapeutic drugs was assessed by uploading normalized cell viability data to the online SynergyFinder+ Tool (https://synergyfinder.org/#!/dashboard, accessed on 08 June 2026). The resulting synergy score (SC) value indicated an antagonistic effect (SC < −10), an additive effect (−10 < SC < 10), or a synergistic effect (SC > 10).
2.5. Crystal Violet Staining
Colorectal cancer cells cultured according to the study design, without chemotherapeutic drugs (control), with RTKIs, Doxorubicin, or their combination, were fixed and stained using crystal violet solution (25 mg crystal violet, 1% formaldehyde solution, 1% methanol in 50 ml 1X PBS). The cells were kept in this solution for 20 min at room temperature in the dark, then washed out with running cold water for 2 min and dried on filter paper overnight at room temperature. To extract the crystal violet fixed solution from cells, 1% SDS was added to the cells and incubated for 1 hour at room temperature on a shaker. The optical density of the resulting solution was measured at 540 nm using a MultiScan FC plate reader (Thermo Fisher Scientific, Waltham, MA, USA) in triplicate.
2.6. Western Blotting
The protein expression levels were assessed by Western blotting. For this examination, apoptotic cells were separated from the culture medium by centrifugation in phosphate-buffered saline (PBS), and the resulting pellet was added to cells scraped from the dish surface. The cells were incubated in radio-immunoprecipitation (RIPA) buffer (25 mM Tris-HCl, pH 7.6, 5 mM EDTA, 150 mM NaCl, 0.1% SDS, 1% NP-40, 1% sodium deoxycholate, and a cocktail of protease and phosphatase inhibitors) for 20 min on ice. After that, proteins were separated through centrifugation for 30 min at 11400 rpm at 2 °C. Their amount was calculated using the Bradford assay. Lysates were diluted in additional RIPA buffer until equal protein concentrations (20 µg) were reached in each sample, and then separated by electrophoresis on 4–12% Bis-Tris or 3–8% Tris-acetate NuPAGE gels (Invitrogen, Carlsbad, CA, USA). Then, proteins from gels were transferred to a nitrocellulose membrane (Bio-Rad, Hercules, CA, USA), which was further incubated with primary and secondary antibodies for 12 h at 4 °C and 1 h at room temperature, respectively. For visualization, Western Lightning Plus-ECL reagent (PerkinElmer, Waltham, MA, USA) was used. Western blotting images were analyzed using densitometry analysis in NIH ImageJ software (Bethesda, MD, USA).
2.7. RNA Extraction and Real-Time Quantitative PCR
Total RNA was extracted from cancer cells according to the standard protocol as de-scribed elsewhere [40]. PCR reaction mix for real-time quantitative PCR (qPCR) consists of the following components: 1 µL of synthesized cDNA, 2x HS-qPCR SYBR Blue (MHC030-400, Biolabmix, Novosibirsk, Russia), and 10 mM each of forward and reverse PCR primers for MDR1, MRP1, ABCG2 or control genes. Real-time qPCR was carried out according to the manufacturer’s protocol by the CFX96 Real-Time detection system (Bio-Rad, Hercules, CA, USA). The absolute levels of each mRNA were normalized to GAPDH, a control gene. The production of quantitative data based on the number of cycles required for fluorescent detection and amplification of target genes (the Ct value). The relative level of expression of the target genes was based on the following formula 2−ΔΔCt.
2.8. Real-Time Monitoring of Cell Proliferation
To assess the proliferative activity, the CRC cells were seeded into gold microelectrode E-plates (Roche Diagnostics GmbH, Mannheim, Germany) and incubated for 72 h in the presence of DMSO (control), one of the top RTKI (e.g., Pemigatinib, Lucitanib, and Regorafenib – 10 µM), Doxorubicin (1 µM), or their combinations. The growth kinetic curves were plotted in real time at 1-hour intervals using the iCELLigence system (ACEA Biosciences, San Diego, CA, USA). The normalized cell index was calculated from cell index measurements at each detected point in RTCA software, version 1.2 (Roche Diagnostics GmbH, Mannheim, Germany).
2.9. Immunofluorescence Staining
HCT116 and Colon-26 cells were cultured on Poly-L-lysine-coated (Sigma-Aldrich, St. Louis, MO, USA) coverslips in culture medium without (control) or with studied RTKI (Pemigatinib, Lucitanib, Regorafenib, Infigratinib and Cabozantinib – 10 µM) for 24 h. After that, colon cancer cells were fixed with ice-cold 100% methanol for 15 min at -20 °C, washed out using 1X PBS three times for 5 min in the dark, and incubated in a blocking buffer containing 5% normal goat serum and 0.3% Triton X-100 in 1X PBS for 60 min at room temperature. Further coverslips were incubated with primary antibodies MDR1/ABCB1, MRP1 and ABCG2 (cat. no. sc-55510, sc-18835 and sc-58222, respectively, Santa Cruz Biotechnology, Dallas, TX, USA) overnight at 4 °C. Afterward, cells were washed out using 1X PBS three times for 5 min in the dark with the subsequent incubation of Alexa488-conjugated mouse secondary antibodies (Invitrogen, Carlsbad, CA, USA) diluted in antibody dilution buffer (1X PBS, 1% BSA, 0.3% Triton X-100) for 60 min at room temperature in the dark. After washing out in 1X PBS, DAPI was added to the colon cancer cells for 30 s (Sigma-Aldrich, St. Louis, MI, USA). Coverslips were washed once in 1X PBS and placed on the glass slides. A fluorescent microscope (Olympus BX63, Tokyo, Japan) was used for visualization. The images were obtained by the Spot Advanced Imaging System.
2.10. Flow Cytometry
The fluorescence intensity of ABC-transporter substrates was examined using a BD FACS Canto II flow cytometer (Becton Dickinson Biosciences, Franklin Lakes, NJ, USA) with BD FACS Diva Software, version 7.0. In each sample, at least 50,000 events were indicated in 3 independent experiments.
The preparation of cells consisted of sequential replacement of culture medium without (control) or with inhibitors (20 µM of ABC transporters inhibitors or RTKi) for 3 h, substrates (40 µM of Doxorubicin or Mitoxantrone) for 1 h, and repeated addition of corresponding inhibitors or not for 3 h, with washing out using FBS-free culture medium after each step. To perform the flow cytometric examination, CRC cells were trypsinized and centrifuged in PBS.
For the Calcein AM assay, the fluorescent compound Calcein AM (cat. no. ab141420, Abcam plc., Cambridge, UK) was used. Briefly, the cells were trypsinized, centrifuged, and incubated with Calcein AM (100 nM) for 30 min at 37 °C. After centrifugation, cells were incubated in culture medium with 20 µM of ABC transporter inhibitors or RTKi for 60 min at 37 °C and subjected to FACS analysis.
2.11. Molecular Docking
Examination of the potential binding sites of FGFR/VEGFR inhibitors and selective ABC transporter inhibitors, including Tariquidar and Ko-143, was performed using AutoDock v4.2.6 (Center for Computational Structural Biology, CCSB, La Jolla, CA, USA, 2012). The structures of Tariquidar, Ko-143, and RTKIs were obtained from PubChem (https://pubchem.ncbi.nlm.nih.gov/, accessed on 1 June 2025) and subsequently optimized. The ABCB1 (PDB ID: 7A6E) and ABCG2 (PDB ID: 6FEQ) structures were downloaded from the Protein Data Bank (http://www.rcsb.org/, accessed on 9 June 2025) and prepared by removing water and adding missing hydrogen atoms. The Lamarckian genetic algorithm was used as a search method. Docking results were visualized using UCSF Chimera v1.17.3 (University of California, San Francisco, CA, USA, 2023). 2D diagrams were created in BIOVIA Discovery Studio Visualizer (BIOVIA, Dassault Systèmes, San Diego, USA, 2024).
2.12. Allograft Studies
Antitumor activity of the studied drugs was investigated at tumor allografts generated by subcutaneous inoculation of 2*105/ml Colon-26 cancer cells into the lateral surface of the back of BALB/c mice. When the volume of the tumor reached 50 mm3, mice were randomized into 4 groups, which were intraperitoneally injected with 100 µl of solvent (control), Infigratinib (10 mg/kg), Doxorubicin (10 mg/kg), and a combination of both drugs at the mentioned doses 3 times per week for 3 weeks. During the experiment, the general health of the mice was monitored. On the 28th day of the experiment, allografts were isolated, and the final volume (length × width × width × 0.5) and weight were measured. Formalin-fixed, paraffin-embedded (FFPE) tissues were sectioned at 4 μm for hematoxylin and eosin (H&E) staining and subjected to IHC staining for cleaved caspase-3 and Ki-67 expression. The images were captured using ScanScope XT (Aperio Technologies Inc., Vista, CA, USA).
2.13. Statistics
All experiments were carried out at least 3 times. Based on this data, results were presented in the article as value ± standard error (SE). Statistical significance for flow cytometry results was determined using one-way ANOVA with a Dunnett’s post-hoc test. The Student’s t-test was performed using an online calculator (https://medstatistic.ru/calculators/averagestudent.html, accessed on 24 February 2026).
3. Results
3.1. Colorectal Cancer Cells (CRCs) Are Characterized by Activation of FGFR and VEGFR Signaling Pathways
To identify FGFR and/or VEGFR inhibitors that synergize with certain chemotherapeutic agents used for CRC therapy, a preselected panel of 8 small-molecule inhibitors was screened across 3 CRC cell lines, including HCT116, RKO, and Colon-26. Based on the 2D structures, the receptor tyrosine kinase inhibitors (RTKi) were divided into three groups as shown in Figure 1. The first one, which include Infigratinib and Pemigatinib, contains a 3,5-dimethoxyphenyl and urea in the core (Figure 1A). The second group comprises Lucitanib and Cabozantinib and shares a quinoline ring bearing 2 methoxy groups at the 6th and 7th positions (Figure 1B). The last one consists of 4 structurally different TKIs — Alofanib, Axitinib, Sunitinib and Regorafenib (Figure 1C).
All the aforementioned RTKI, which effectively target the FGFR and/or VEGFR signaling pathways, alone or in combination with other hyperactivated kinases, were approved for the treatment of a broad spectrum of human malignancies, as shown in Supplementary Table S1.
To examine the abilities of the aforementioned small-molecule inhibitors to modulate Doxorubicin- or 5-Fluorouracil-induced cytotoxicity in CRC cells, we first assessed whether FGFR and VEGFR signaling pathways are activated in CRC cell lines. GIST T-1R cell line, which acquired secondary resistance to the targeted drug imatinib mesylate due to overactivation of FGFR and VEGFR signaling pathways [48,49] was used for the positive control. The data shown in Figure 2 illustrate activation of both signaling pathways in all 3 CRC cell lines, thereby providing a molecular basis for the anti-cancer activities of the aforementioned RTKI against CRC cells.
3.2. Receptor Tyrosine Kinase Inhibitors Sensitize CRCs to Doxorubicin
To examine the impact of FGFR and VEGFR inhibitors on Doxorubicin- or 5-Fluorouracil-induced cytotoxicity in CRC cells, we first assessed the cytotoxic effects of these chemotherapeutic agents. IC50 values for the aforementioned chemotherapeutic agents, measured by MTS colorimetric assay after 72 h of exposure, are shown in Table 1.
In particular, we observed a significant decrease in the IC50 of Doxorubicin-treated Colon-26 cells when Infigratinib, Pemigatinib and Cabozantinib were added to the cell cultures. Similarly, Infigratinib potently potentiated the cytotoxic activity of Doxorubicin in HCT116 colon cancer cells. In addition, we also found Axitinib, Lucitanib, Sunitinib, and Regorafenib to be potent chemosensitizing agents in HCT116 cells. In contrast, no such effect was observed in the RKO cell line, probably due to its high sensitivity to Doxorubicin used alone and extremely low IC50 values. In contrast, the cytotoxic effect of 5-fluoracil was much less potentiated by RTKIs in CRC cells (except the RKO cell line), which allowed us to focus our subsequent studies predominantly on the DNA topoisomerase inhibitors Doxorubicin and Mitoxantrone.
Next, we assessed whether RTKIs used at subtoxic concentrations (< IC50) could potentiate the cytotoxicity of the DNA topoisomerase II inhibitor Doxorubicin. The data shown in Figure 3 illustrate that Pemigatinib, Lucitanib, and Regorafenib effectively potentiated the cytotoxic activity of Doxorubicin in HCT116 cells, as evidenced by a significant decrease in confluency and an increase in the number of floating cells.
Similar results were obtained in the Colon-26 cell line, highlighting the high potency of RTKIs in sensitizing it to Doxorubicin (Supplementary Figure S1). Again, Pemigatinib effectively potentiated the cytotoxic activity of Doxorubicin. Additionally, Infigratinib and Cabozantinib enhanced the cytotoxic effect of this topoisomerase II inhibitor, consistent with the IC50 values shown in Table 1.
This was consistent with crystal violet staining of CRC cultures treated with these drugs alone or in combination. We observed a moderate decrease in CRC cell viability in monotherapy, whereas the combinations exerted significant anti-proliferative and cytotoxic effects. Cell viability across 3 CRC cell lines treated with Doxorubicin, 5-Fluorouracil, and RTKI, alone or in combination, was assessed using crystal violet staining and is shown in Table 2.
Representative images of crystal violet staining of HCT116 and Colon-26 are shown in Figure 4 and Supplementary Figure S2. For example, the viability of HCT116 cells treated with Doxorubicin in combination with Regorafenib was nearly 0%, highlighting the high potency of this combination (Figure 4A). Quantitative analysis also revealed a substantial decrease in the viability of HCT116 cells treated with a combination of Doxorubicin and Regorafenib, whereas these drugs alone had no effect on cellular viability (Figure 4B). Similarly, Pemigatinib and Lucitanib effectively potentiated the anti-proliferative and cytotoxic activities of Doxorubicin (Figure 4A). This data was also quantified, showing a >70% reduction in cellular viability in HCT116 cells treated with a combination of Doxorubicin and Lucitanib (Figure 4B). Pemigatinib was less potent but induced a statistically significant decrease in HCT116 viability when co-treated with Doxorubicin (Figure 4A,B).
Importantly, a similar pattern was observed in Colon-26 cells treated with the aforementioned combinations of the chemotherapeutic agents (Supplementary Figure S2), thereby highlighting the high potency of these RTKIs in overcoming CRC resistance to conventional chemotherapies. Again, the RTKI pattern that sensitized Colon-26 cells to Doxorubicin differed from that in HCT116 cells and demonstrated high potency of Infigratinib, Pemigatinib, and Cabozantinib in decreasing cellular viability when used in combination with Doxorubicin. This data was in line with the IC50 values shown in Table 1. Of note, HCT116 and Colon-26 were much less sensitive to 5-Fluorouracil when used in combination with the aforementioned RTKIs than Doxorubicin-treated cells. In contrast, RKO cells exhibited a prominent cytotoxic effect of 5-Fluorouracil used in combination with some RTKIs. Pemigatinib and Lucitanib were the most effective when used in combination with 5-Fluorouracil.
3.3. Synergistic Effect of Receptor Tyrosine Kinase Inhibitors and Doxorubicin in CRCs
The values of the synergistic interactions between the aforementioned RTKIs and Doxorubicin were assessed using the IC50-based colorimetric assay and the Highest Single Agent (HSA) model, and calculated using the R-package computational tool in the SynergyFinder 2.0 platform. Single-agent dose-response curves showed a concentration-dependent decrease in cellular viability with RTKIs and Doxorubicin alone in HCT116 and Colon-26 cell lines (Figure 5A,D). Strikingly, the dose-response matrices revealed that combined treatment led to markedly greater cytotoxicity, particularly when both agents were used at higher concentrations (Figure 5B,F). Two-dimensional synergy maps illustrated robust (>10) synergy scores (SC) between Pemigatinib and Doxorubicin, with HSA scores of 10.03 for HCT116 cells and 17.16 for Infigratinib and Doxorubicin for Colon-26, thereby illustrating a potent combinatorial effect (Figure 5C,G). This was also supported by three-dimensional HSA synergy landscapes, as shown in Figure 5D,H, which reveal a pronounced combinatorial benefit of the aforementioned RTKIs and Doxorubicin.
Synergy scores (SC), representing synergistic, additive or antagonistic effects, for all types of RTKIs and chemotherapeutic agents (e.g., Doxorubicin and 5-Fluorouracil), were calculated to identify the most potent combinations for CRC cell lines and are shown in Table 3.
3.4. Receptor Tyrosine Kinase Inhibitors Enhance Pro-Apoptotic and Anti-Proliferative Activity of Doxorubicin in CRC Cells
To further corroborate these findings, we examined whether the RTKIs indicated above potentiate the pro-apoptotic activities of Doxorubicin in CRC cells. For this, HCT116 cells were treated with RTKIs and Doxorubicin alone or in combinations for 72 h and subjected to western blotting to examine the expression of the well-known markers of apoptosis - the cleaved forms of PARP or caspase-3. As expected, no evidence of apoptosis was observed in CRC cells treated with the RTKi alone (besides the Lucitanib-treated cells), whereas Doxorubicin treatment resulted in the increase in cleaved PARP in HCT116 cells (Figure 6A), suggesting about the sensitivity of this cancer cell line to Doxorubicin. In contrast to the single-treated HCT116 cells, a significant increase in the expression of the cleaved form of PARP was observed in HCT116 cells treated with a combination of Pemigatinib and Doxorubicin. A similar effect was observed in Doxorubicin-treated HCT116 cells, cultured in the presence of Regorafenib. Consistent with these findings, all 3 types of RTKIs effectively potentiated the cytotoxic effect of Doxorubicin in Colon-26 cells, as evidenced by a significant increase in the expression of the cleaved form of caspase-3 (Figure 6B). Important, no increase of cleaved caspase-3 was detected in the single-treated Colon-26 cells, suggesting the intrinsic resistance to RTKI and Doxorubicin in this particular cancer cell line.
Consistent with the enhancement of Doxorubicin-induced pro-apoptotic activity in CRC cell lines, RTKI potentiated its anti-proliferative activity, as evidenced by a significant reduction in CRC cells growth kinetics. Of note, Doxorubicin exhibited minor inhibitory effect on the growth kinetics in HCT116 cells when used alone (Figure 7A–C). Again, proliferative activity of HCT116 cells significantly decreased when cells were treated with Doxorubicin in the presence of Pemigatinib (Figure 7A). A similar pattern was found in Doxorubicin-treated HCT116 cells cultured in the presence of Lucitanib (Figure 7B) and Regorafenib (Figure 7C). This was expanded to the other chemotherapeutic agents and CRC cell lines, as well. For example, Colon-26 murine colon adenocarcinoma cells treated with 5-Fluorouracil in combination with various RTKI (e.g., Infigratinib) also demonstrated reduced proliferative activity compared with single-treated and mock-treated cells (Supplementary Figure S3).
3.5. Anti-Proliferative and Pro-Apoptotic Activities of Receptor Tyrosine Kinase Inhibitors Used in Combination with Doxorubicin Are Not Due to the Inhibition of FGFR or VEGFR Signaling Cascades
Even though RTKIs used alone did not inhibit survival and proliferative capacities in CRC cell lines, we examined whether these activities of RTKIs used in combination with Doxorubicin were due to the impairment of FGFR or VEGFR signaling pathways. To assess this possibility directly, we examined the levels of the total and phosphorylated forms of FGFR1-2, its adaptor protein FRS-2, and VEGFR1-2, which are involved in cell survival and proliferation. The data shown in Figure 8 indicate no difference in the expression of the aforementioned proteins in CRC cells cultured with RTKIs alone (except for Lucitanib-treated CRC cells), thereby suggesting that impairment of FGFR or VEGFR signaling by RTKIs was not the main factor mediating the decreased survival and proliferation of CRCs treated with Doxorubicin. Of note, Lucitanib-induced reduction in the expression of the phosphorylated form of VEGFR2 (Figure 8B) suggests that the apoptotic and anti-proliferative activities observed in single-treated cells (Figure 6A and Figure 7B, respectively) are due to impairment of the overactivated VEGF-mediated signaling cascade in HCT116 cells.
3.6. Receptor Tyrosine Kinase Inhibitors Have No Impact on ABC Transporter’s Expression and Subcellular Distribution
The overexpression of ABC transporters facilitating drug efflux from cancer cells is known to be one of the mechanisms of cancer chemoresistance. Multiple reports, including our own [41], illustrate RTKI’s ability to regulate the activity and function of ABC transporters via multiple mechanisms (e.g., altering their expression, modifying their subcellular localization, and inhibiting their efflux function). To test these possibilities directly, the following studies were designed.
We initially examined the expression of 3 major multidrug resistance (MDR) proteins (P-gp, ABCG2, and MRP-1) on both protein and translational levels in CRC cells. Chemoresistant cancer cell lines (e.g., triple-negative breast cancer HCC1806 TxR [47] and osteosarcoma SaOS-2 DoxR [46] served as the positive control for high expression of these transporters. Western blot data shown in Figure 9 illustrate high expression of ABC-related proteins in CRC cells when compared with chemoresistant cancer sublines. This was consistent with RT-PCR data showing high mRNA levels of MDR1, MRP-1, and ABCG2 in CRC cells compared with chemoresistant-naive HCC1806 triple-negative breast cancer and SaoS-2 osteosarcoma cells (Table 4 and Table 5), thereby indicating high basal expression of ABC transporters in CRC cells. Importantly, all 3 CRC cell lines used in the present study exhibited high mRNA levels of MRP-1 compared with both chemoresistant cancer cell lines (e.g., HCC1806 TxR breast cancer and SaOS-2 DoxR osteosarcoma cell sub-lines - Supplementary Tables S2 and S3), thereby suggesting high intrinsic chemoresistance of CRC cells to certain chemotherapies known to be substrates for this particular ABC-transporter.
Next, we examined whether RTKI-induced sensitization of CRCs to Doxorubicin was due to the downregulation of ABC transporters at the protein level. Western blot data shown in Figure 10 (left) indicate that HCT116 cells exhibited similar levels of ABC-related proteins compared with untreated controls, thereby suggesting that Lucitanib and Pemigatinib cannot sensitize HCT116 cells to Doxorubicin by decreasing the expression of MDR-related proteins. Of note, a moderate decrease of MRP-1 expression was observed in Regorafenib-treated HCT116 cells, whereas the expression of MDR1 and BCRP1 remained unchanged. Similar results were obtained in Colon-26 cells (Figure 10 - right).
Next, we assessed the subcellular distribution of MDR-related proteins in CRC cells treated with RTKIs or DMSO (i.e., solvent), serving as a negative control, for 24 h. The immunofluorescence microscopy data shown in Figure 11 also showed no changes in the subcellular localization of MDR proteins in RTKI-treated HCT116 cells. Similar results were obtained in Colon-26 cells (Supplementary Figure S4).
This data, together with the absence of down-regulation of ABC transporter expression, as shown in Figure 10, suggests that impaired ABC transporter activity and decreased efflux of chemotherapeutic agents might be a predominant molecular mechanism responsible for RTKI-induced sensitization of CRC to chemotherapeutic agents used for CRC chemotherapy.
3.7. Receptor Tyrosine Kinase Inhibitors Decrease the Efflux of Chemotherapeutic Drugs from CRCs
To test this possibility directly and assess whether RTKIs can retain chemotherapeutic agents within CRCs, we used fluorescent chemotherapeutic agents (e.g., Doxorubicin and Mitoxantrone) and fluorescent substrates for specific ABC transporters (e.g., Calcein AM as a substrate for ABCB1). For this purpose, we measured the mean fluorescence intensity (MFI) of Doxorubicin and Mitoxantrone in HCT116 and Colon-26 cells treated with these agents in the presence of Regorafenib, Lucitanib, Pemigatinib, Infigratinib or Cabozantinib. In this experimental setting, Tariquidar (ABCB1 inhibitor), Ko-143 (ABCG2 inhibitor), and Mk-571 (MRP-1 inhibitor) served as the positive controls.
Strikingly, 2 of the 3 aforementioned RTKIs (i.e., Pemigatinib and Lucitanib) induced a significant (>30%) increase in MFI for Doxorubicin when compared with HCT116 cells treated with Doxorubicin alone (Figure 12A, Table 6 - left panel). Moreover, a similar pattern illustrating RTKI-mediated inhibition of chemotherapeutic efflux from colon cancer cells was observed in Mitoxantrone-treated HCT116 cells, as shown in Supplementary Figure S5 and Supplementary Table S4.
Next, using Calcein AM, a well-known P-gp substrate, we revealed that this MDR protein is a molecular target for Pemigatinib and Lucitanib. Indeed, these RTKI effectively inhibited the efflux of Calcein AM from HCT116 (Supplementary Figure S6 and Supplementary Table S5). As expected, we found that Tariquidar produced a maximal increase in Calcein AM-mediated MFI, whereas Mk-571 and Ko-143 were almost ineffective at altering the MFI parameters of Calcein AM in these CRCs, thereby illustrating that the ability of the aforementioned RTKI to sensitize CRCs to Doxorubicin was predominantly due to inhibition of its efflux via the ABCB1 transporter.
Given that Infigratinib and Cabozatinib were found to be the most effective RTKIs for sensitizing Colon-26 cells to Doxorubicin (Figure 6), we tested whether this was also due to decreased Doxorubicin efflux from this cell line. Indeed, we observed a similar pattern for Colon-26 cells treated with Doxorubicin in combination with RTKIs, as shown in Figure 12B and the right panel of Table 6. Thus, consistent with the apoptosis data shown in Figure 6, Infigratinib and Cabozatinib induced a prominent accumulation of Doxorubicin within cancer cells, suggesting that RTKI-induced impairment of Doxorubicin efflux from cancer cells might be a predominant mechanism underlying RTKI-induced sensitization of CRC cells to this particular chemotherapeutic agent.
Of note, Mk-571, the MRP-1 inhibitor, was ineffective across all the aforementioned experimental conditions, consistent with the western blot data shown in Figure 9, which illustrates low expression of this particular ABC transporter in CRC cells.
The results from the competition assay using Tariquidar (ABCB1 inhibitor) and Ko-143 (ABCG2 inhibitor) demonstrated that the MFI of both Doxorubicin and Mitoxantrone increased with the Tariquidar-Infigratinib combination, thereby reducing the release of the chemotherapeutic agents relative to the substrate alone (Table 7). The values of this parameter were similar when Tariquidar was used alone and with Infigratinib for both substrates, Doxorubicin and Mitoxantrone (Table 7). This means that the combination did not exert a stronger effect on intracellular accumulation because it inhibited the common protein ABCB1. On the other hand, the combined use of Ko-143 and Infigratinib significantly increased the MFI of substrates (Table 7). The MFI values for Doxorubicin or Mitoxantrone obtained using this combination were approximated to those for Infigratinib, Tariquidar alone, and their combination, as Ko-143 did not have a particular influence on this parameter (Table 7). These results showed that Infigratinib inhibited ABCB1 transporter activity in the Colon-26 cancer cell line. As a result, the intracellular accumulation of substrates for these proteins increased, allowing these chemotherapeutic drugs to exert their influence effectively.
3.8. Infigratinib Potentiates the Cytotoxic Activity of Doxorubicin In Vivo
To corroborate the in vitro studies, we examined whether Infigratinib used alone or in combination with Doxorubicin exhibited anti-tumor activity against Colon-26 allografts. For this purpose, Colon-26 cells were injected into the flanks of female Balb-c mice, and tumors were allowed to grow for at least 2 weeks before single (e.g., Infigratinib or Doxorubicin) or dual treatment. Although both chemotherapies exhibited moderate anti-tumor activity against Colon-26, their combination significantly reduced the weight and volume of Colon-26 allografts over 3 weeks of treatment compared with the baseline (Figure 13A,B). This correlated with the decreased number of viable cancer cells in this experimental group, as evidenced by hematoxylin-eosin staining (Figure 13C, upper panel). We also observed an increase in cleaved caspase-3 expression in Colon-26 allografts treated with a combination of Doxorubicin and Infigratinib (Figure 13C, middle panel). As expected, a significant decrease in the number of proliferative (i.e., Ki-67-positive) cells was observed in Colon-26 allografts treated with a combination of Infigratinib and Doxorubicin, compared with non-treated controls or with experimental groups treated with either a single RTKI or Doxorubicin (Figure 13C, bottom panel). Based on these results, we concluded that Infigratinib, a selective pan-FGFR inhibitor, effectively re-sensitized Colon-26 colon carcinoma cells in vivo.
3.9. In Silico Investigation of RTKI Interaction with ABC Transporters Reveals Molecular Mechanism of Their “Off-Target” Effects
Lastly, we performed molecular docking analysis to identify potential binding sites of the aforementioned RTKI on 2 major ABC transporters upregulated in CRCs - ABCB1 and ABCG2. High-resolution, occluded conformation bound to Tariquidar and of human origin was the most important parameter for selecting the structure of the ABCB1 transporter (PDB ID: 7A6E). Before studying RTKI, we validated the docking protocol. For this purpose, we removed the protein ligands, re-docked Tariquidar, and saved all grid and docking parameters for use with FGFR and VEGFR signaling inhibitors. Based on the data presented in Table 8, Cabozantinib, Infigratinib, and Regorafenib showed the lowest Estimated Free Energy of Binding with ABCB1 among all RTKI (-7.86, -6.95, and -6.83 kcal/mol, respectively). This docking score was not lower than that of specific ABC transporter inhibitors (-8.34 kcal/mol), but confirmed the strong connection of the aforementioned inhibitors with this protein. That was consistent with the FACs analysis, in which 2 of them (Cabozantinib and Infigratinib) significantly increased the intracellular accumulation of Doxorubicin in the Colon-26 murine colon adenocarcinoma (Figure 12B and Table 6, right panel).
Moreover, a similar drug-binding pocket in the transmembrane domain (TMD) of ABCB1 was predicted to be an RTKI-binding site. This data was in concordance with known drug-binding cavity residues [50]. All inhibitors interacted with almost the same amino acid residues, as shown in Table 9. The most important amino acids for Cabozantinib and Infigratinib included LEU65, PHE336, ILE340, PHE983 and MET986, which were involved in the most significant chemical interactions (Figure 14). For example, most interactions in the Infigratinib structure were with the 3,5-dimethoxyphenyl group bearing 2 chlorides (Figure 14A), whereas in Cabozantinib, the interactions were with the quinoline ring and the 4-fluorophenyl group (Figure 14B).
Ko-143 was used for the preparation of the docking protocol for the ABCG2 transporter (PDB ID: 6FEQ), which is characterized by an inward-facing conformation bound with Ko-143, human origin and high resolution, as well as the ABCB1 protein. Molecular docking analysis of Ko-143 showed low Estimated Free Energy of Binding (-6.52 kcal/mol), but docking scores obtained for some RTKI, e.g., Cabozantinib, Lucitanib and Pemigatinib were even lower than the value for this specific ABCG2 inhibitor (-7.29, -6.88, and -6.53 kcal/mol, respectively), as shown in Table 8. ABCG2 protein is characterized by a symmetrical structure with two identical chains. All ABC transporter inhibitors and RTKI were bound to both of them in the TMD, forming the drug-binding cavity composed of similar amino acids (Table 9). As well as for binding with ABCB1, the quinoline ring of Cabozantinib and Lucitanib was connected with the TMD of ABCG2 (Figure 15A,B), whereas the difluoride 3,5-dimethoxyphenyl group in Pemigatinib showed more interactions with this transporter (Figure 15C).
Сollectively, we show here, for the first time, the “off-target” effects of several FGFR/VEGFR inhibitors on multidrug-resistant CRC cells. This included Pemigatinib and Infigratinib (selective FGFR inhibitors), Cabozatinib, Regorafenib, and Lucitanib (multi-kinase inhibitors targeting multiple signaling pathways, including FGFR and VEGFR). Most of these inhibitors were structurally similar (Figure 1A,B), which could contribute to their most effective binding to various members of the ABC transporter family, particularly ABCB1 or ABCG2, and thus lead to changes in the functional activity of the aforementioned proteins by blocking the pumping function. These effects were due to the RTKI’s ability to inhibit ABCB1-mediated efflux of chemotherapeutic agents (e.g., Doxorubicin, Mitoxantrone, and Calcein AM) from CRC cells. At the same time, these RTKIs did not alter ABC transporter expression at the transcriptional and translational levels or affect their subcellular distribution. Importantly, the ability of the aforementioned RTKI to sensitize CRC to conventional therapies and induce their apoptosis was not associated with inhibition of the FGFR or VEGFR signaling pathways, revealing their “off-target” effect on CRC, which was primarily mediated by inhibition of P-gp-induced efflux of chemotherapeutic agents from CRCs.
4. Discussion
Despite significant improvements in the early diagnosis and treatment of colorectal cancer (CRC), the prognosis for metastatic CRC (mCRC) remains unfavorable [51]. Indeed, objective responses to combination therapies, including the antimetabolite 5-Fluorouracil combined with either the DNA-adduct-forming agent oxaliplatin (i.e., FOLFOX) or the DNA Topoisomerase I inhibitor irinotecan (i.e., FOLFIRI), are observed in only 50% of patients [52,53]. This, in part, can be due to the development of multidrug resistance (MDR) in tumors to structurally similar or even different chemotherapeutic agents, thereby decreasing treatment efficacy. Thus, there is an urgent need to develop novel, effective therapies that overcome MDR and increase therapeutic response rates in CRC.
Given that overexpression of ABC transporters is a major mechanism of intrinsic (i.e., primary) resistance in cancer to chemotherapeutic agents, facilitating the efflux of these drugs from cancer cells, we tested whether RTKI could sensitize CRC to chemotherapies by regulating the activity of MDR-related proteins. Indeed, we showed here that several RTKI targeting multiple signaling pathways, including FGFR- and VEGFR-mediated cascades, can enhance the sensitivity of CRCs to certain chemotherapeutic agents, including the DNA topoisomerase inhibitors Doxorubicin and Mitoxantrone, as well as the anti-metabolite 5-Fluorouracil. Indeed, HCT116 cells treated with Doxorubicin in combination with Regorafenib, Pemigatinib, or Lucitanib exhibited a dramatic decrease in cellular viability compared with CRCs treated with chemotherapeutic agents or these RTKI alone (Table 1 and Table 2, Figure 3 and Figure 4). This was due to enhanced apoptosis in HCT116 cells treated with the aforementioned combinations of RTKIs and Doxorubicin (Figure 6). Moreover, these combinations decreased the proliferative activity of HCT116 cells compared with untreated controls or single-treated cells (Figure 7). This data was also consistent with high synergy scores (SC) between RTKIs and Doxorubicnin in HCT116 colon cancer cells (Figure 5A–D, Table 3). These RTKI effects were not limited to HCT116 cells but also extended to the Colon-26 murine adenocarcinoma cell line and the RKO human colorectal cancer cell line. As expected, the types of RTKI sensitizing these CRCs to chemotherapies partially overlapped, and different combinations of small-molecule inhibitors and chemotherapeutic agents effectively reduced viability and proliferative activity in these CRC cell lines. In particular, similar to HCT116 cells, Pemigatinib effectively sensitized Colon-26 cells to Doxorubicin, whereas Regorafenib was ineffective (Table 1 and Table 2, Supplementary Figures S1 and S2). Meanwhile, and in contrast to HCT116 cells, Infigratinib and Cabozatinib exhibited potent chemosensitizing activities in Doxorubicin-treated Colon-26 cells (Table 1 and Table 2, Figure 5E–H, Supplementary Figures S1 and S2). Of note, the vast majority of RTKI used in the present study were ineffective in 5-Fluorouracil-treated HCT116 and Colon-26 cancer cell lines, whereas we did observe high potency of the selective (Infigratinib and Pemigatinib) and non-selective (Cabozatinib, Lucitanib and Regorafenib) inhibitors to sensitize these particular colon cancer cell lines to this anti-metabolite (Table 1 and Table 2). In contrast to HCT116 and Colon-26 cell lines, no RTKI-mediated chemosensitizing effect was observed in Doxorubicin-treated RKO cells (Table 1 and Table 2). Overall, this data illustrate the ability of RTKI to potentiate the cytotoxic activities of certain chemotherapies across various CRCs and highlight the importance of individual variations in the types of RTKI and chemotherapeutic agents in different CRC cell lines. In particular, these differences might be due to a broad spectrum of molecular mechanisms, including intrinsic resistance to chemotherapeutic agents, differences in ABC transporter expression (Figure 9), and the presence of cancer stem cells. And, of course, the differences in RTK profiles, including FGFR and VEGFR signaling pathways, observed between these CRC cell lines (Figure 2) can also be taken into account.
Next, we provided direct evidence about the RTKI’s to increase the intracellular concentrations of chemotherapeutic agents with autofluorescence moieties (e.g., Doxorubicin and Mitoxantrone) in CRCs (Figure 12, Table 6, Supplementary Figure S5, Supplementary Table S4), therefore suggesting that decreased activity of the overexpressed ABC transporters and an impaired efflux of chemotherapeutic agents from cancer cells can be a major molecular mechanism of RTKI-induced chemosensitization in CRC. Indeed, the aforementioned effects of RTKIs were not attributable to decreased expression and/or subcellular redistribution of 3 major ABC transporters (e.g., P-gp, MRP-1, and BCRP) (Figure 10 and Figure 11, Supplementary Figure S4).
Notably, using competitive assays with selective ABCB1 and ABCG2 inhibitors, we identified the ABCB1 protein as a primary target for Infigratinib (Table 7). This was consistent with our previous study, which identified this type of ABC transporter as a predominant molecular target for aforementioned selective FGFR inhibitor [41]. Molecular docking analysis revealed that the “off-target” effect of this RTKI was attributable to its effective binding to the ABCB1 transmembrane domain (Figure 14).
Lastly, we showed that RTKIs can potentiate the cytotoxic effects of chemotherapy in CRC cells in vivo. For this purpose, we used Infigratinib, a selective FGFR inhibitor, which has previously been shown to be an effective chemosensitizing agent for Colon-26 murine carcinoma cells in vitro. Data, shown in Figure 13, illustrate the high potency of this inhibitor in Doxorubicin-treated CRC allografts. This was evidenced by the reduced growth of Colon-26 colon cancer allografts when combination of Infigratinib and Doxorubicin was used. Immunohistochemical (IHC) staining revealed a substantial increase in apoptotic cells (e.g., cleaved caspase-3-positive) in allografts from animals receiving the combined therapy of Infigratinib and Doxorubicin compared with the single-treated groups. Conversely, the number of proliferative (e.g., Ki-67-positive cells) was significantly reduced after such combined therapy.
Thus, this data is consistent with multiple reports indicating that the “off-target” effects of small-molecule inhibitors targeting various signaling cascades can effectively potentiate the cytotoxic activities of chemotherapies by promoting the retention of chemotherapeutic agents within cancer cells, thereby increasing efficacy of anticancer treatment. For example, Wu C.-P., with co-authors, illustrates a high potency of Erdafitinib, a small-molecule pan-FGFR kinase inhibitor, to induce sensitization of ABCB1-overexpressing cancer cells to certain chemotherapeutic drugs, including the mitotic-poisoning agents (e.g., Paclitaxel and Vincristine), and Topotecan [54]. Additionally, Kim S.H. et al. demonstrated that Paclitaxel, in combination with Infigratinib, synergistically suppressed urothelial carcinoma cell migration and colony formation by regulating EMT-associated factors, while FGFR1 knockdown enhanced the antitumor effect of Paclitaxel [55].
5. Conclusions
Overall, the role of RTKI in the modulation of ABC transporter-mediated MDR phenotype in cancer has attracted significant attention over the past decades and has been extensively discussed in multiple original manuscripts and several comprehensive reviews, including our own, to demonstrate their potent “off-target” effects to inhibit the efflux of chemotherapies from human malignancies and therefore overcome primary and secondary chemoresistances [27,50,56,57,58]. We show here, for the first time, that some RTKIs targeting FGFR and VEGFR signaling pathways can sensitize colorectal cancer cells to certain chemotherapeutic agents (e.g., Doxorubicin) by inhibiting their efflux, thereby supporting a rationale for combined therapies for CRCs.
Supplementary Materials
The following supporting information can be downloaded at website of this paper posted on Preprints.org, Figure S1: Representative brightfield images of Colon-26 colon cancer cells after exposure to DMSO (control), Doxorubicin (1 µM), RTKIs (Infigratinib, Cabozantinib, and Pemigatinib - 10 µM), and their combinations; Figure S2: Cristal violet staining of Colon-26 cancer cells treated with DMSO (control), Doxorubicin (1 µM), and RTKIs (i.e., Infigratinib, Cabozantinib, Pemigatinib - 10 µM) alone, and when combined with Doxorubicin; Figure S3: Anti-proliferative effects of Infigratinib used alone or in combination with 5-Fluorouracil in the Colon-26 colon cancer cell line; Figure S4: RTKI did not influence the subcellular localization of MDR1 (A), MRP-1 (B), and BCRP1 (C) in Colon-26 cells. Figure S5: RTKIs increase the intracellular accumulation of Mitoxantrone in the HCT116 cancer cell line. The intracellular accumulation of Mitoxantrone in combination with ABC transporters inhibitors (Tariquidar, Ko-143, and Mk-571) and RTKIs (Pemigatinib, Lucitanib, Regorafenib). Figure S6: RTKIs increase the intracellular accumulation of Calcein AM, a specific MDR1 substrate, in the HCT116 cancer cell line. The intracellular accumulation of Calcein AM in combination with ABC transporters inhibitors (Tariquidar, Ko-143, and Mk-571) and RTKI (Pemigatinib, Lucitanib, Regorafenib). Table S1: Molecular targets and clinical application of the studied RTKI.; Table S2: The expression of MDR1, MRP-1, and ABCG2 mRNA in CRC cells when compared with chemo-resistant HCC1806 TxR triple-negative breast cancer cell sub-line; Table S3: The expression of MDR1, MRP-1, and ABCG2 mRNA in CRC cells when compared with chemo-resistant SaOS-2 DoxR osteosarcoma cancer cell sub-line; Table S4: The Mean Fluorescence Intensity of Mitoxantrone in HCT116 cells was determined from 3 independent experiments. The intracellular accumulation of Mitoxantrone alone and with pre- and post-incubation with ABC transporter inhibitors (Tariquidar, Ko-143, and Mk-571) and RTKIs (Pemigatinib, Lucitanib, Regorafenib).; Table S5: The Mean Fluorescence Intensity of Calcein AM, a specific MDR1 substrate, in HCT116 cells was determined from 3 independent experiments. The intracellular accumulation of Calcein AM alone and in combination with ABC transporter inhibitors (Tariquidar, Ko-143, and Mk-571) and RTKI (Pemigatinib, Lucitanib, Regorafenib) in HCT116. File S1: The uncropped original Western blotting images.
Author Contributions
Conceptualization S.B.; methodology S.B., T.G., P.D., E.E., and A.G. (Aigul Galembikova).; resources S.B.; investigation, data analysis, visualization S.B., T.G., P.D., A.G. (Aigul Galembikova), A.G. (Alina Galyautdinova). N.A., and P.K.; biological investigation—S.B., T.G., P.D., P.K., N.A., E.E., A.G. (Alina Galyautdinova), and A.G. (Aigul Galembikova); writing—original draft preparation S.B. and T.G; writing—review and editing S.B.; supervision – S.B.; project administration – S.B.; funding acquisition – S.B.
Funding
This research was funded by the Russian Science Foundation (grant #25-15-00086).
Institutional Review Board Statement
The animal study protocol was approved by the Ethics Committee of N.N.Blokhin NMRCO (decision 2026-5, Issued on May 12, 2026).
Informed Consent Statement
Not applicable.
Data Availability Statement
The original contributions presented in the study are included in the article and Supplementary Materials; further inquiries can be directed to the corresponding author.
Conflicts of Interest
The authors declare no conflicts of interest.
Abbreviations
The following abbreviations are used in this manuscript:
| ABC transporters | ATP-binding cassette transporters |
| MDR | Multidrug resistance |
| FGFR | Fibroblast growth factor receptor |
| VEGFR | Vascular endothelial growth factor receptor |
| CRC | Colorectal cancer |
| P-gp | P-glycoprotein |
| BCRP | Breast cancer resistance protein |
| MRP | Multidrug resistance-associated protein |
| RTKI | Receptor tyrosine kinase inhibitor |
| SC | Synergy score |
| IHC staining | Immunohistochemical staining |
| EMT | Epithelial-to-mesenchymal transition |
| CSC | Cancer stem cell |
| PARP | Poly-(ADP)-ribose-polymerase |
| FDA | Food and Drug Administration |
| ATCC | American Type Culture Collection |
| SaOS-2 DoxR | Doxorubicin-resistant SaOS-2 osteosarcoma subline |
| HCC1806 Tx-R | Paclitaxel-resistant HCC1806 triple-negative breast cancer subline |
| GIST T-1R | Imatinib-resistant gastrointestinal stromal tumor subline |
| DMSO | Dimethyl sulfoxide |
| SDS | Sodium Dodecyl Sulfate solution |
| PBS | Phosphate-buffered saline |
| RIPA buffer | Radio-immunoprecipitation buffer |
| PCR | Polymerase Chain Reaction |
| RNA | Ribonucleic acid |
| FFPE tissues | Formalin-fixed, paraffin-embedded tissues |
| H&E | Hematoxylin and Eosin |
| SE | Standard error |
| IC50 | Half maximal inhibitory concentration |
| HSA model | Highest Single Agent model |
| MFI | Mean fluorescence intensity |
| TMD | Transmembrane domain |
References
- Sung, H.; Ferlay, J.; Siegel, R.L.; Laversanne, M.; Soerjomataram, I.; Jemal, A.; Bray, F. Global Cancer Statistics 2020: GLOBOCAN Estimates of Incidence and Mortality Worldwide for 36 Cancers in 185 Countries. CA Cancer J. Clin. 2021, 71, 209–249. [Google Scholar] [CrossRef] [PubMed]
- Ferlay, J.; Ervik, M.; Lam, F.; Laversanne, M.; Colombet, M.; Mery, L.; Piñeros, M.; Znaor, A.; Soerjomataram, I.; Bray, F. Global Cancer Observatory: Cancer Today (version 1.1); International Agency for Research on Cancer: Lyon, France; Available online: https://gco.iarc.who.int/today (accessed on 6 May 2026).
- Brenner, H.; Kloor, M.; Pox, C.P. Colorectal cancer. Lancet 2014, 383, 1490–1502. [Google Scholar] [CrossRef]
- Alrushaid, N.; Khan, F.A.; Al-Suhaimi, E.; Elaissari, A. Progress and Perspectives in Colon Cancer Pathology, Diagnosis, and Treatments. Diseases 2023, 11, 148. [Google Scholar] [CrossRef] [PubMed]
- Duan, C.; Yu, M.; Xu, J.; Li, B.Y.; Zhao, Y.; Kankala, R.K. Overcoming Cancer Multi-drug Resistance (MDR): Reasons, mechanisms, nanotherapeutic solutions, and challenges. Biomed. Pharmacother. 2023, 162, 114643. [Google Scholar] [CrossRef] [PubMed]
- Groelly, F.J.; Fawkes, M.; Dagg, R.A.; Blackford, A.N.; Tarsounas, M. Targeting DNA damage response pathways in cancer. Nat. Rev. Cancer. 2023, 23, 78–94. [Google Scholar] [CrossRef] [PubMed]
- McDonnell, A.M.; Dang, C.H. Basic review of the cytochrome p450 system. J. Adv. Pract. Oncol. 2013, 4, 263–268. [Google Scholar] [CrossRef] [PubMed]
- Viktorsson, K.; Lewensohn, R.; Zhivotovsky, B. Apoptotic Pathways and Therapy Resistance in Human Malignancies. Adv. Cancer Res. 2005, 94, 143–196. [Google Scholar] [CrossRef] [PubMed]
- Carneiro, B.A.; El-Deiry, W.S. Targeting apoptosis in cancer therapy. Nat. Rev. Clin. Oncol. 2020, 17, 395–417. [Google Scholar] [CrossRef] [PubMed]
- Zheng, X.; Carstens, J.L.; Kim, J.; Scheible, M.; Kaye, J.; Sugimoto, H.; Wu, C.-C.; LeBleu, V.S.; Kalluri, R. Epithelial-to-Mesenchymal Transition Is Dispensable for Metastasis but Induces Chemoresistance in Pancreatic Cancer. Nature 2015, 527, 525–530. [Google Scholar] [CrossRef] [PubMed]
- Du, B.; Shim, J.S. Targeting Epithelial-Mesenchymal Transition (EMT) to Overcome Drug Resistance in Cancer. Molecules 2016, 21, 965. [Google Scholar] [CrossRef] [PubMed]
- Chu, X.; Tian, W.; Ning, J.; Xiao, G.; Zhou, Y.; Wang, Z.; Zhai, Z.; Tanzhu, G.; Yang, J.; Zhou, R. Cancer stem cells: advances in knowledge and implications for cancer therapy. Signal Transduct. Target. Ther. 2024, 9, 170. [Google Scholar] [CrossRef] [PubMed]
- Boichuk, S.V.; Ivoilova, T.V. The role of ABC-transporters in homeostasis, cancer pathogenesis and therapy. Adv. Mol. Oncol. 2024, 11, 8–21. [Google Scholar] [CrossRef]
- Karthika, C.; Sureshkumar, R.; Zehravi, M.; Akter, R.; Ali, F.; Ramproshad, S.; Mondal, B.; Tagde, P.; Ahmed, Z.; Khan, F.S.; et al. Multidrug Resistance of Cancer Cells and the Vital Role of P-Glycoprotein. Life 2022, 12, 897. [Google Scholar] [CrossRef] [PubMed]
- Lagas, J.S.; Fan, L.; Wagenaar, E.; Vlaming, M.L.; van Tellingen, O.; Beijnen, J.H.; Schinkel, A.H. P-glycoprotein (P-gp/Abcb1), Abcc2, and Abcc3 determine the pharmacokinetics of etoposide. Clin. Cancer Res. 2010, 16, 130–140. [Google Scholar] [CrossRef] [PubMed]
- Lal, S.; Wong, Z.W.; Sandanaraj, E.; Xiang, X.; Ang, P.C.; Lee, E.J.; Chowbay, B. Influence of ABCB1 and ABCG2 polymorphisms on doxorubicin disposition in Asian breast cancer patients. Cancer Sci. 2008, 99, 816–823. [Google Scholar] [CrossRef] [PubMed]
- Satake, K.; Tsukamoto, M.; Mitani, Y.; Regasini, L.O.; da Silva Bolzani, V.; Efferth, T.; Nakagawa, H. Human ABCB1 confers cells resistance to cytotoxic guanidine alkaloids from Pterogyne nitens. Biomed. Mater. Eng. 2015, 25, 249–256. [Google Scholar] [CrossRef] [PubMed]
- Vaidyanathan, A.; Sawers, L.; Gannon, A.L.; Chakravarty, P.; Scott, A.L.; Bray, S.E.; Ferguson, M.J.; Smith, G. ABCB1 (MDR1) induction defines a common resistance mechanism in paclitaxel- and olaparib-resistant ovarian cancer cells. Br. J. Cancer 2016, 115, 431–441. [Google Scholar] [CrossRef] [PubMed]
- Kovalev, A.A.; Tsvetaeva, D.A.; Grudinskaja, T.V. Role of ABC-cassette transporters (MDR1, MRP1, BCRP) in the development of primary and acquired multiple drug resistance in patients with early and metastatic breast cancer. Exp. Oncol. 2013, 35, 287–290. [Google Scholar] [PubMed]
- Tsubaki, M.; Satou, T.; Itoh, T.; Imano, M.; Komai, M.; Nishinobo, M.; Yamashita, M.; Yanae, M.; Yamazoe, Y.; Nishida, S. Overexpression of MDR1 and survivin, and decreased Bim expression mediate multidrug-resistance in multiple myeloma cells. Leuk. Res. 2012, 36, 1315–1322. [Google Scholar] [CrossRef] [PubMed]
- Matthews, C.; Catherwood, M.A.; Larkin, A.M.; Clynes, M.; Morris, T.C.; Alexander, H.D. MDR-1, but not MDR-3 gene expression, is associated with unmutated IgVH genes and poor prognosis chromosomal aberrations in chronic lymphocytic leukemia. Leuk. Lymphoma 2006, 47, 2308–2313. [Google Scholar] [CrossRef] [PubMed]
- Uggla, B.; Stahl, E.; Wagsater, D.; Paul, C.; Karlsson, M.G.; Sirsjo, A.; Tidefelt, U. BCRP mRNA expression v. clinical outcome in 40 adult AML patients. Leuk. Res. 2005, 29, 141–146. [Google Scholar] [CrossRef] [PubMed]
- Szakacs, G.; Paterson, J.K.; Ludwig, J.A.; Booth-Genthe, C.; Gottesman, M.M. Targeting multidrug resistance in cancer. Nat. Rev. 2006, 5, 219–234. [Google Scholar] [CrossRef] [PubMed]
- Kannan, P.; Telu, S.; Shukla, S.; Ambudkar, S.V.; Pike, V.W.; Halldin, C.; Gottesman, M.M.; Innis, R.B.; Hall, M.D. The “specific” P-glycoprotein inhibitor Tariquidar is also a substrate and an inhibitor for breast cancer resistance protein (BCRP/ABCG2). ACS Chem. Neurosci. 2011, 2, 82–89. [Google Scholar] [CrossRef] [PubMed]
- Weidner, L.D.; Zoghbi, S.S.; Lu, S.; Shukla, S.; Ambudkar, S.V.; Pike, V.W.; Mulder, J.; Gottesman, M.M.; Innis, R.B.; Hall, M.D. The Inhibitor Ko143 Is Not Specific for ABCG2. J. Pharm. Exp. 2015, 354, 384–393. [Google Scholar] [CrossRef] [PubMed]
- Shukla, S.; Chen, Z.S.; Ambudkar, S.V. Tyrosine kinase inhibitors as modulators of ABC transporter-mediated drug resistance. Drug Resist. Updat. 2012, 15, 70–80. [Google Scholar] [CrossRef] [PubMed]
- Boichuk, S.; Gessel, T. Repurposing the Tyrosine Kinase Inhibitors Targeting FGFR and VEGFR Pathways for Cancer Therapy: A Comprehensive Review. Cancers 2025, 17, 3354. [Google Scholar] [CrossRef] [PubMed]
- Tiwari, A.K.; Sodani, K.; Dai, C.L.; Abuznait, A.H.; Singh, S.; Xiao, Z.J.; Patel, A.; Talele, T.T.; Fu, L.; Kaddoumi, A.; et al. Nilotinib potentiates anticancer drug sensitivity in murine ABCB1-, ABCG2-, and ABCC10-multidrug resistance xenograft models. Cancer Lett. 2013, 328, 307–317. [Google Scholar] [CrossRef] [PubMed]
- Wang, S.Q.; Liu, S.T.; Zhao, B.X.; Yang, F.H.; Wang, Y.T.; Liang, Q.Y.; Sun, Y.B.; Liu, Y.; Song, Z.H.; Cai, Y.; et al. Afatinib reverses multidrug resistance in ovarian cancer via dually inhibiting ATP binding cassette subfamily B member 1. Oncotarget 2015, 6, 26142–26160. [Google Scholar] [CrossRef] [PubMed]
- Houghton, P.J.; Germain, G.S.; Harwood, F.C.; Schuetz, J.D.; Stewart, C.F.; Buchdunger, E.; Traxler, P. Imatinib mesylate is a potent inhibitor of the ABCG2 (BCRP) transporter and reverses resistance to topotecan and SN-38 in vitro. Cancer Res. 2004, 64, 2333–2337. [Google Scholar] [CrossRef] [PubMed]
- Sims, J.T.; Ganguly, S.S.; Bennett, H.; Friend, J.W.; Tepe, J.; Plattner, R. Imatinib reverses doxorubicin resistance by affecting activation of STAT3-dependent NF-κB and HSP27/p38/AKT pathways and by inhibiting ABCB1. PLoS ONE 2013, 8, e55509. [Google Scholar] [CrossRef] [PubMed]
- Hegedus, C.; Ozvegy-Laczka, C.; Apáti, A.; Magócsi, M.; Német, K.; Orfi, L.; Kéri, G.; Katona, M.; Takáts, Z.; Váradi, A.; Szakács, G.; Sarkadi, B. Interaction of nilotinib, dasatinib and bosutinib with ABCB1 and ABCG2: implications for altered anti-cancer effects and pharmacological properties. Br. J. Pharmacol. 2009, 158, 1153–1164. [Google Scholar] [CrossRef] [PubMed]
- Leggas, M.; Panetta, J.C.; Zhuang, Y.; Schuetz, J.D.; Johnston, B.; Bai, F.; Sorrentino, B.; Zhou, S.; Houghton, P.J.; Stewart, C.F. Gefitinib modulates the function of multiple ATP-binding cassette transporters in vivo. Cancer Res. 2006, 66, 4802–4807. [Google Scholar] [CrossRef] [PubMed]
- Ma, S.L.; Hu, Y.P.; Wang, F.; Huang, Z.C.; Chen, Y.F.; Wang, X.K.; Fu, L.W. Lapatinib antagonizes multidrug resistance-associated protein 1-mediated multidrug resistance by inhibiting its transport function. Mol. Med. 2014, 20, 390–399. [Google Scholar] [CrossRef] [PubMed]
- Shi, Z.; Peng, X.X.; Kim, I.W.; Shukla, S.; Si, Q.S.; Robey, R.W.; Bates, S.E.; Shen, T.; Ashby, C.R., Jr.; Fu, L.W.; et al. Erlotinib (Tarceva, OSI-774) antagonizes ATP-binding cassette subfamily B member 1 and ATP-binding cassette subfamily G member 2-mediated drug resistance. Cancer Res. 2007, 67, 11012–11020. [Google Scholar] [CrossRef] [PubMed]
- Dai, C.L.; Liang, Y.J.; Wang, Y.S.; Tiwari, A.K.; Yan, Y.Y.; Wang, F.; Chen, Z.S.; Tong, X.Z.; Fu, L.W. Sensitization of ABCG2-overexpressing cells to conventional chemotherapeutic agent by sunitinib was associated with inhibiting the function of ABCG2. Cancer Lett. 2009, 279, 74–83. [Google Scholar] [CrossRef] [PubMed]
- Yang, K.; Chen, Y.; To, K.K.; Wang, F.; Li, D.; Chen, L.; Fu, L. Alectinib (CH5424802) antagonizes ABCB1- and ABCG2-mediated multidrug resistance in vitro, in vivo and ex vivo. Exp. Mol. Med. 2017, 49, e303. [Google Scholar] [CrossRef] [PubMed]
- Zhang, H.; Patel, A.; Ma, S.L.; Li, X.J.; Zhang, Y.K.; Yang, P.Q.; Kathawala, R.J.; Wang, Y.J.; Anreddy, N.; Fu, L.W.; et al. In vitro, in vivo and ex vivo characterization of ibrutinib: a potent inhibitor of the efflux function of the transporter MRP1. Br. J. Pharmacol. 2014, 171, 5845–5857. [Google Scholar] [CrossRef] [PubMed]
- Zhao, X.Q.; Xie, J.D.; Chen, X.G.; Sim, H.M.; Zhang, X.; Liang, Y.J.; Singh, S.; Talele, T.T.; Sun, Y.; Ambudkar, S.V.; et al. Neratinib reverses ATP-binding cassette B1-mediated chemotherapeutic drug resistance in vitro, in vivo, and ex vivo. Mol. Pharmacol. 2012, 82, 47–58. [Google Scholar] [CrossRef] [PubMed]
- Chen, Z.; Chen, Y.; Xu, M.; Chen, L.; Zhang, X.; To, K.K.; Zhao, H.; Wang, F.; Xia, Z.; Chen, X.; et al. Osimertinib (AZD9291) Enhanced the Efficacy of Chemotherapeutic Agents in ABCB1- and ABCG2-Overexpressing Cells In Vitro, In Vivo, and Ex Vivo. Mol. Cancer Ther. 2016, 15, 1845–1858. [Google Scholar] [CrossRef] [PubMed]
- Boichuk, S.; Dunaev, P.; Mustafin, I.; Mani, S.; Syuzov, K.; Valeeva, E.; Bikinieva, F.; Galembikova, A. Infigratinib (BGJ 398), a Pan-FGFR Inhibitor, Targets P-Glycoprotein and Increases Chemotherapeutic-Induced Mortality of Multidrug-Resistant Tumor Cells. Biomedicines 2022, 10, 601. [Google Scholar] [CrossRef] [PubMed]
- McCarthy, M. Antiangiogenesis drug promising for metastatic colorectal cancer. Lancet 2003, 361, 1959. [Google Scholar] [CrossRef] [PubMed]
- Giordano, G.; Febbraro, A.; Venditti, M.; Campidoglio, S.; Olivieri, N.; Raieta, K.; Parcesepe, P.; Imbriani, G.C.; Remo, A.; Pancione, M. Targeting angiogenesis and tumor microenvironment in metastatic colorectal cancer: role of aflibercept. Gastroenterol. Res. Pract. 2014, 2014, 526178. [Google Scholar] [CrossRef] [PubMed]
- Zhou, Y.; Wu, C.; Lu, G.; Hu, Z.; Chen, Q.; Du, X. FGF/FGFR signaling pathway involved in resistance in various cancer types. J. Cancer 2020, 11, 2000–2007. [Google Scholar] [CrossRef] [PubMed]
- Dakowicz, D.; Zajkowska, M.; Mroczko, B. Relationship between VEGF Family Members, Their Receptors and Cell Death in the Neoplastic Transformation of Colorectal Cancer. Int. J. Mol. Sci. 2022, 23, 3375. [Google Scholar] [CrossRef] [PubMed]
- Boichuk, S.; Bikinieva, F.; Valeeva, E.; Dunaev, P.; Vasileva, M.; Kopnin, P.; Mikheeva, E.; Ivoilova, T.; Mustafin, I.; Galembikova, A. Establishment and Characterization of Multi-Drug Resistant p53-Negative Osteosarcoma SaOS-2 Subline. Diagnostics 2023, 13, 2646. [Google Scholar] [CrossRef] [PubMed]
- Boichuk, S.; Galembikova, A.; Sitenkov, A.; Khusnutdinov, R.; Dunaev, P.; Valeeva, E.; Usolova, N. Establishment and characterization of a triple negative basal-like breast cancer cell line with multi-drug resistance. Oncol. Lett. 2017, 14, 5039–5045. [Google Scholar] [CrossRef] [PubMed]
- Boichuk, S.; Galembikova, A.; Dunaev, P.; Valeeva, E.; Shagimardanova, E.; Gusev, O.; Khaiboullina, S. A Novel Receptor Tyrosine Kinase Switch Promotes Gastrointestinal Stromal Tumor Drug Resistance. Molecules 2017, 22, 2152. [Google Scholar] [CrossRef] [PubMed]
- Boichuk, S.; Dunaev, P.; Galembikova, A.; Valeeva, E. Fibroblast Growth Factor 2 (FGF2) Activates Vascular Endothelial Growth Factor (VEGF) Signaling in Gastrointestinal Stromal Tumors (GIST): An Autocrine Mechanism Contributing to Imatinib Mesylate (IM) Resistance. Cancers 2024, 16, 3103. [Google Scholar] [CrossRef] [PubMed]
- Moosavi, F.; Hassani, B.; Mortazavi, M.; Peters, G.J.; Firuzi, O. Protein Kinase Inhibitors as Regulators of ABC Transporters in Overcoming Cancer Multidrug Resistance: A Comprehensive Review of Recent Advances. Cancers 2026, 18, 1957. [Google Scholar] [CrossRef] [PubMed]
- Cardoso, R.; Guo, F.; Heisser, T.; Hackl, M.; Ihle, P.; De Schutter, H.; Van Damme, N.; Valerianova, Z.; Atanasov, T.; Majek, O.; et al. Colorectal cancer incidence, mortality, and stage distribution in European countries in the colorectal cancer screening era: an international population-based study. Lancet Oncol. 2021, 22, 1002–1013. [Google Scholar] [CrossRef] [PubMed]
- Davies, J.M.; Goldberg, R.M. Treatment of metastatic colorectal cancer. Semin Oncol. 2011, 38, 552–560. [Google Scholar] [CrossRef] [PubMed]
- Chibaudel, B.; Tournigand, C.; Bonnetain, F.; Richa, H.; Benetkiewicz, M.; André, T.; de Gramont, A. Therapeutic strategy in unresectable metastatic colorectal cancer: an updated review. Ther. Adv. Med. Oncol. 2015, 7, 153–169. [Google Scholar] [CrossRef] [PubMed]
- Wu, C.-P.; Hung, T.-H.; Hsiao, S.-H.; Huang, Y.-H.; Hung, L.-C.; Yu, Y.-J.; Chang, Y.-T.; Wang, S.-P.; Wu, Y.-S. Erdafitinib Resensitizes ABCB1-Overexpressing Multidrug-Resistant Cancer Cells to Cytotoxic Anticancer Drugs. Cancers 2020, 12, 1366. [Google Scholar] [CrossRef] [PubMed]
- Kim, S.H.; Ryu, H.; Ock, C.-Y.; Suh, K.J.; Lee, J.Y.; Kim, J.-W.; Lee, J.-O.; Kim, J.W.; Kim, Y.J.; Lee, K.-W.; et al. BGJ398, A Pan-FGFR Inhibitor, Overcomes Paclitaxel Resistance in Urothelial Carcinoma with FGFR1 Overexpression. Int. J. Mol. Sci. 2018, 19, 3164. [Google Scholar] [CrossRef] [PubMed]
- Anreddy, N.; Gupta, P.; Kathawala, R.J.; Patel, A.; Wurpel, J.N.D.; Chen, Z.-S. Tyrosine Kinase Inhibitors as Reversal Agents for ABC Transporter Mediated Drug Resistance. Molecules 2014, 19, 13848–13877. [Google Scholar] [CrossRef] [PubMed]
- Beretta, G.L.; Cassinelli, G.; Pennati, M.; Zuco, V.; Gatti, L. Overcoming ABC transporter-mediated multidrug resistance: The dual role of tyrosine kinase inhibitors as multitargeting agents. Eur. J. Med. Chem. 2017, 142, 271–289. [Google Scholar] [CrossRef] [PubMed]
- Wu, S.; Fu, L. Tyrosine kinase inhibitors enhanced the efficacy of conventional chemotherapeutic agent in multidrug resistant cancer cells. Mol. Cancer 2018, 17, 25. [Google Scholar] [CrossRef] [PubMed]
- Neuzillet, C. Infigratinib in pretreated cholangiocarcinoma with FGFR2 fusions or rearrangements. Lancet Gastroenterol. Hepatol. 2021, 6, 773–775. [Google Scholar] [CrossRef] [PubMed]
- Makawita, S.; K Abou-Alfa, G.; Roychowdhury, S.; Sadeghi, S.; Borbath, I.; Goyal, L.; Cohn, A.; Lamarca, A.; Oh, D.Y.; Macarulla, T.; et al. Infigratinib in patients with advanced cholangiocarcinoma with FGFR2 gene fusions/translocations: the PROOF 301 trial. Future Oncol. 2020, 16, 2375–2384. [Google Scholar] [CrossRef] [PubMed]
- Abou-Alfa, G.K.; Sahai, V.; Hollebecque, A.; Vaccaro, G.; Melisi, D.; Al-Rajabi, R.; Paulson, A.S.; Borad, M.J.; Gallinson, D.; Murphy, A.G.; et al. Pemigatinib for previously treated, locally advanced or metastatic cholangiocarcinoma: a multicentre, open-label, phase 2 study. Lancet Oncol. 2020, 21, 671–684. [Google Scholar] [CrossRef] [PubMed]
- Bekaii-Saab, T.S.; Melisi, D.; Wilmink, H.; Garufi, C.; Tran, N.; Tortora, G.; De Braud, F.; Frodin, J.E.; Lonardi, S.; Lin, E.; et al. Pemigatinib for Unresectable or Metastatic Cholangiocarcinoma With Fibroblast Growth Factor Receptor-2 Rearrangement: Results From the Phase III FIGHT-302 Trial. J. Clin. Oncol. 2026. Epub ahead of print. [Google Scholar] [CrossRef] [PubMed]
- Verstovsek, S.; Kiladjian, J.J.; Vannucchi, A.M.; Patel, J.L.; Rambaldi, A.; Shomali, W.E.; Oh, S.T.; Usuki, K.; Harrison, C.N.; Ritchie, E.K.; et al. Pemigatinib for Myeloid/Lymphoid Neoplasms with FGFR1 Rearrangement. NEJM Evid. 2025, 4, EVIDoa2500017. [Google Scholar] [CrossRef] [PubMed]
- Tsimafeyeu, I.; Statsenko, G.; Vladimirova, L.; Besova, N.; Artamonova, E.; Raskin, G.; Rykov, I.; Mochalova, A.; Utyashev, I.; Gorbacheva, S.; et al. A phase 1b study of the allosteric extracellular FGFR2 inhibitor alofanib in patients with pretreated advanced gastric cancer. Invest. New Drugs. 2023, 41, 324–332. [Google Scholar] [CrossRef] [PubMed]
- Mayer, I.; Arteaga, C.; Nanda, R.; Miller, K.; Jhaveri, K.; Brufsky, A.; Rugo, H.; Yardley, D.A.; Vahdat, L.T.; adeghi, S.; et al. Abstract P6-11-03: A phase 2 open-label study of lucitanib in patients (pts) with FGF aberrant metastatic breast cancer (MBC). Cancer Res. 2017, 77, P6–11-03. [Google Scholar] [CrossRef]
- Hui, R.; Pearson, A.; Cortes, J.; Campbell, C.; Poirot, C.; Azim, H.A., Jr.; Fumagalli, D.; Lambertini, M.; Daly, F.; Arahmani, A.; et al. Lucitanib for the Treatment of HR+/HER2- Metastatic Breast Cancer: Results from the Multicohort Phase II FINESSE Study. Clin. Cancer Res. 2020, 26, 354–363. [Google Scholar] [CrossRef] [PubMed]
- Campone, M.; Bachelot, T.; Penault-Llorca, F.; Pallis, A.; Agrapart, V.; Pierrat, M.J.; Poirot, C.; Dubois, F.; Xuereb, L.; Bossard, C.J.; et al. A phase Ib dose allocation study of oral administration of lucitanib given in combination with fulvestrant in patients with estrogen receptor-positive and FGFR1-amplified or non-amplified metastatic breast cancer. Cancer Chemother. Pharmacol. 2019, 83, 743–753. [Google Scholar] [CrossRef] [PubMed]
- Rini, B.I.; Plimack, E.R.; Stus, V.; Gafanov, R.; Hawkins, R.; Nosov, D.; Pouliot, F.; Alekseev, B.; Soulières, D.; Melichar, B.; et al. Pembrolizumab plus Axitinib versus Sunitinib for Advanced Renal-Cell Carcinoma. N. Engl. J. Med. 2019, 380, 1116–1127. [Google Scholar] [CrossRef] [PubMed]
- Powles, T.; Plimack, E.R.; Soulières, D.; Waddell, T.; Stus, V.; Gafanov, R.; Nosov, D.; Pouliot, F.; Melichar, B.; Vynnychenko, I.; et al. Pembrolizumab plus axitinib versus sunitinib monotherapy as first-line treatment of advanced renal cell carcinoma (KEYNOTE-426): extended follow-up from a randomised, open-label, phase 3 trial. Lancet Oncol. 2020, 21, 1563–1573. [Google Scholar] [CrossRef] [PubMed]
- Vecchio, S.J.D.; Ellis, R.J. Cabozantinib for the Management of Metastatic Clear Cell Renal Cell Carcinoma. J. Kidney Cancer VHL. 2018, 5, 1–5. [Google Scholar] [CrossRef] [PubMed]
- Abou-Alfa, G.K.; Meyer, T.; Cheng, A.L.; El-Khoueiry, A.B.; Rimassa, L.; Ryoo, B.Y.; Cicin, I.; Merle, P.; Chen, Y.; Park, J.W.; et al. Cabozantinib in Patients with Advanced and Progressing Hepatocellular Carcinoma. N. Engl. J. Med. 2018, 379, 54–63. [Google Scholar] [CrossRef] [PubMed]
- Duke, E.S.; Barone, A.K.; Chatterjee, S.; Mishra-Kalyani, P.S.; Shen, Y.L.; Isikwei, E.; Zhao, H.; Bi, Y.; Liu, J.; Rahman, N.A.; et al. Cabozantinib for Differentiated Thyroid Cancer. Clin. Cancer Res. 2022, 28, 4173–4177. [Google Scholar] [CrossRef] [PubMed]
- Chan, J.A.; Geyer, S.; Zemla, T.; Knopp, M.V.; Behr, S.; Pulsipher, S.; Ou, F.S.; Dueck, A.C.; Acoba, J.; Shergill, A.; et al. Phase 3 Trial of Cabozantinib to Treat Advanced Neuroendocrine Tumors. N. Engl. J. Med. 2025, 392, 653–665. [Google Scholar] [CrossRef] [PubMed]
- Ferraro, D.; Zalcberg, J. Regorafenib in gastrointestinal stromal tumors: clinical evidence and place in therapy. Ther. Adv. Med. Oncol. 2014, 6, 222–228. [Google Scholar] [CrossRef] [PubMed]
- Grothey, A.; Van Cutsem, E.; Sobrero, A.; Siena, S.; Falcone, A.; Ychou, M.; Humblet, Y.; Bouché, O.; Mineur, L.; Barone, C.; et al. Regorafenib monotherapy for previously treated metastatic colorectal cancer (CORRECT): an international, multicentre, randomised, placebo-controlled, phase 3 trial. Lancet 2013, 381, 303–312. [Google Scholar] [CrossRef] [PubMed]
- Li, J.; Qin, S.; Xu, R.; Yau, T.C.; Ma, B.; Pan, H.; Xu, J.; Bai, Y.; Chi, Y.; Wang, L.; et al. Regorafenib plus best supportive care versus placebo plus best supportive care in Asian patients with previously treated metastatic colorectal cancer (CONCUR): a randomised, double-blind, placebo-controlled, phase 3 trial. Lancet Oncol. 2015, 16, 619–629. [Google Scholar] [CrossRef] [PubMed]
- Regorafenib Approved for Liver Cancer. Cancer Discov. 2017, 7, 660. [CrossRef] [PubMed]
- Raymond, E.; Dahan, L.; Raoul, J.L.; Bang, Y.J.; Borbath, I.; Lombard-Bohas, C.; Valle, J.; Metrakos, P.; Smith, D.; Vinik, A.; et al. Sunitinib malate for the treatment of pancreatic neuroendocrine tumors. N. Engl. J. Med. 2011, 364, 501–513. [Google Scholar] [CrossRef] [PubMed]
- Motzer, R.J.; Hutson, T.E.; Tomczak, P.; Michaelson, M.D.; Bukowski, R.M.; Rixe, O.; Oudard, S.; Negrier, S.; Szczylik, C.; Kim, S.T.; et al. Sunitinib versus interferon alfa in metastatic renal-cell carcinoma. N. Engl. J. Med. 2007, 356, 115–124. [Google Scholar] [CrossRef] [PubMed]
- Demetri, G.D.; van Oosterom, A.T.; Garrett, C.R.; Blackstein, M.E.; Shah, M.H.; Verweij, J.; McArthur, G.; Judson, I.R.; Heinrich, M.C.; Morgan, J.A.; et al. Efficacy and safety of sunitinib in patients with advanced gastrointestinal stromal tumour after failure of imatinib: a randomised controlled trial. Lancet 2006, 368, 1329–1338. [Google Scholar] [CrossRef] [PubMed]
Figure 1.
2D structures of the studied receptor tyrosine kinase inhibitors are divided into 3 groups depending on the structural similarity. Infigratinib and Pemigatinib (A) and Lucitanib and Cabozantinib (B) have the same scaffold. Alofanib, Axitinib, Sunitinib, and Regorafenib (C) do not have a common core.
Figure 1.
2D structures of the studied receptor tyrosine kinase inhibitors are divided into 3 groups depending on the structural similarity. Infigratinib and Pemigatinib (A) and Lucitanib and Cabozantinib (B) have the same scaffold. Alofanib, Axitinib, Sunitinib, and Regorafenib (C) do not have a common core.
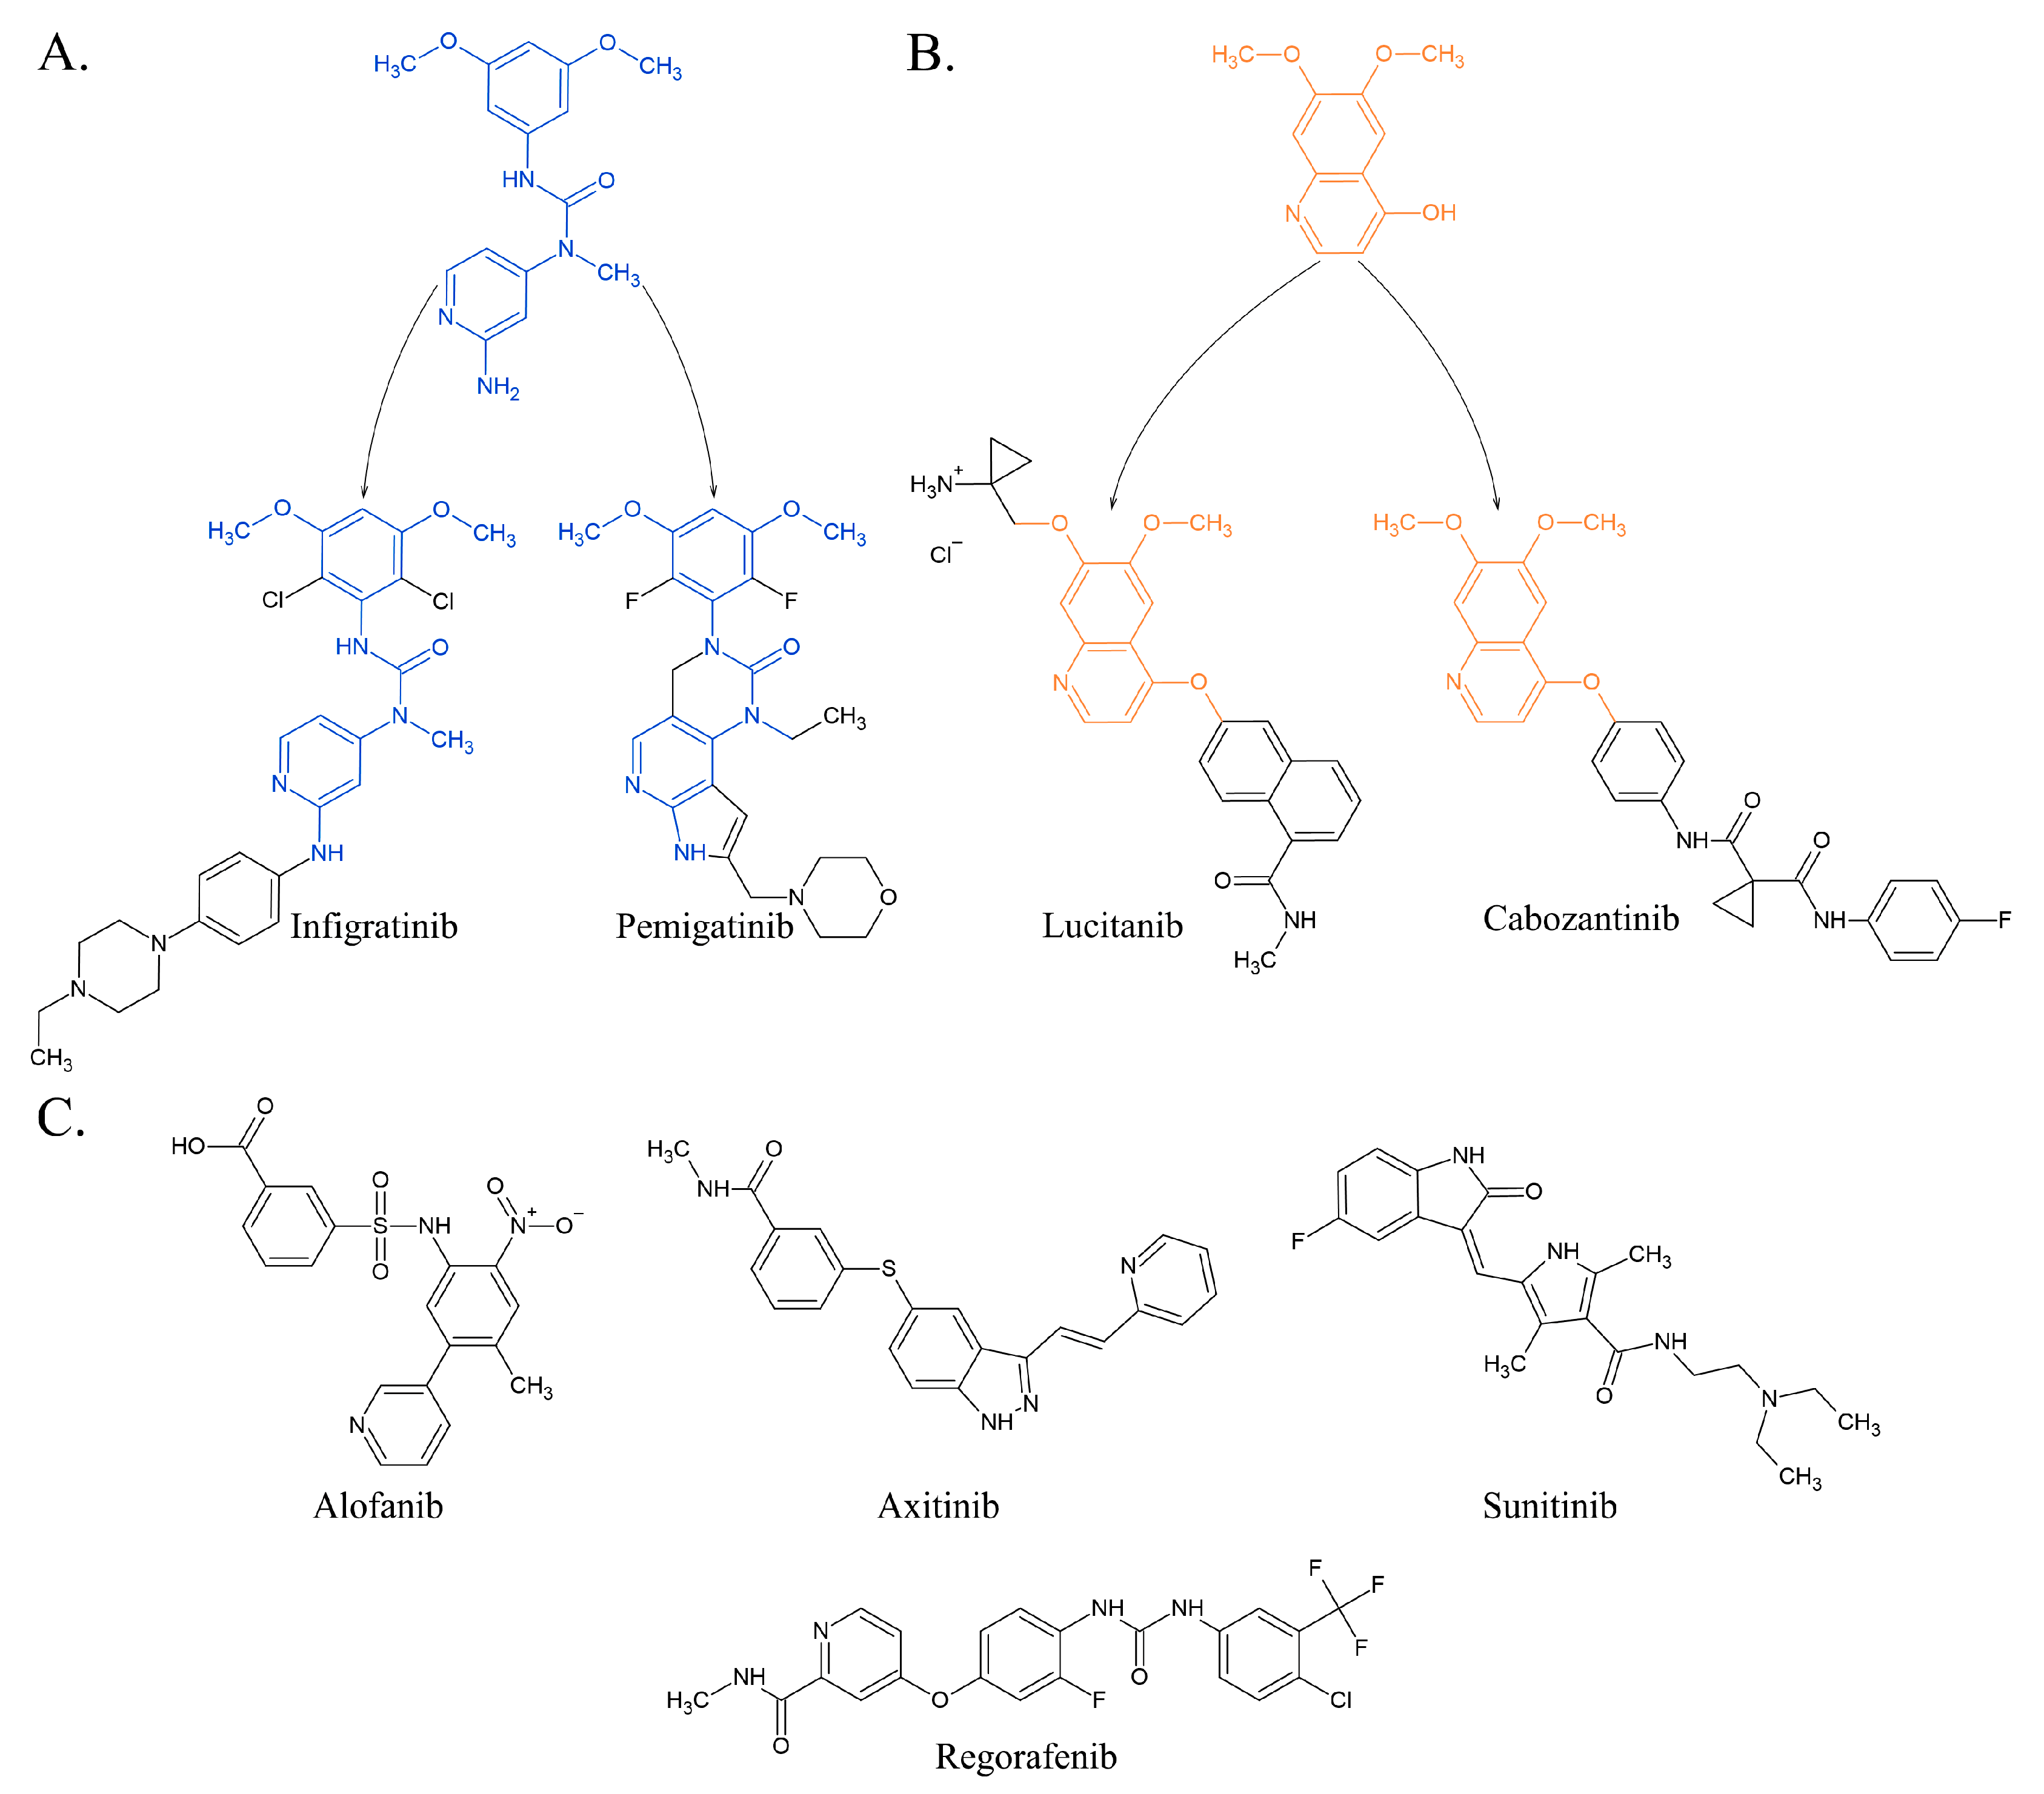
Figure 2.
Assessment of activation of FGFR and VEGFR signaling pathways in 3 CRC cell lines (Colon-26, HCT116, and RKO) by western blotting. GIST T-1R cells were used as a positive control. (A) Expression of total and phosphorylated forms of FGFR1/2 and the adaptor protein FRS-2 in 3 CRC cell lines and GIST T-1R cells. An actin stain was used as a loading control. (B) Expression of total and phosphorylated VEGFR1/2 in the aforementioned cancer cell lines. An actin stain was used as a loading control.
Figure 2.
Assessment of activation of FGFR and VEGFR signaling pathways in 3 CRC cell lines (Colon-26, HCT116, and RKO) by western blotting. GIST T-1R cells were used as a positive control. (A) Expression of total and phosphorylated forms of FGFR1/2 and the adaptor protein FRS-2 in 3 CRC cell lines and GIST T-1R cells. An actin stain was used as a loading control. (B) Expression of total and phosphorylated VEGFR1/2 in the aforementioned cancer cell lines. An actin stain was used as a loading control.
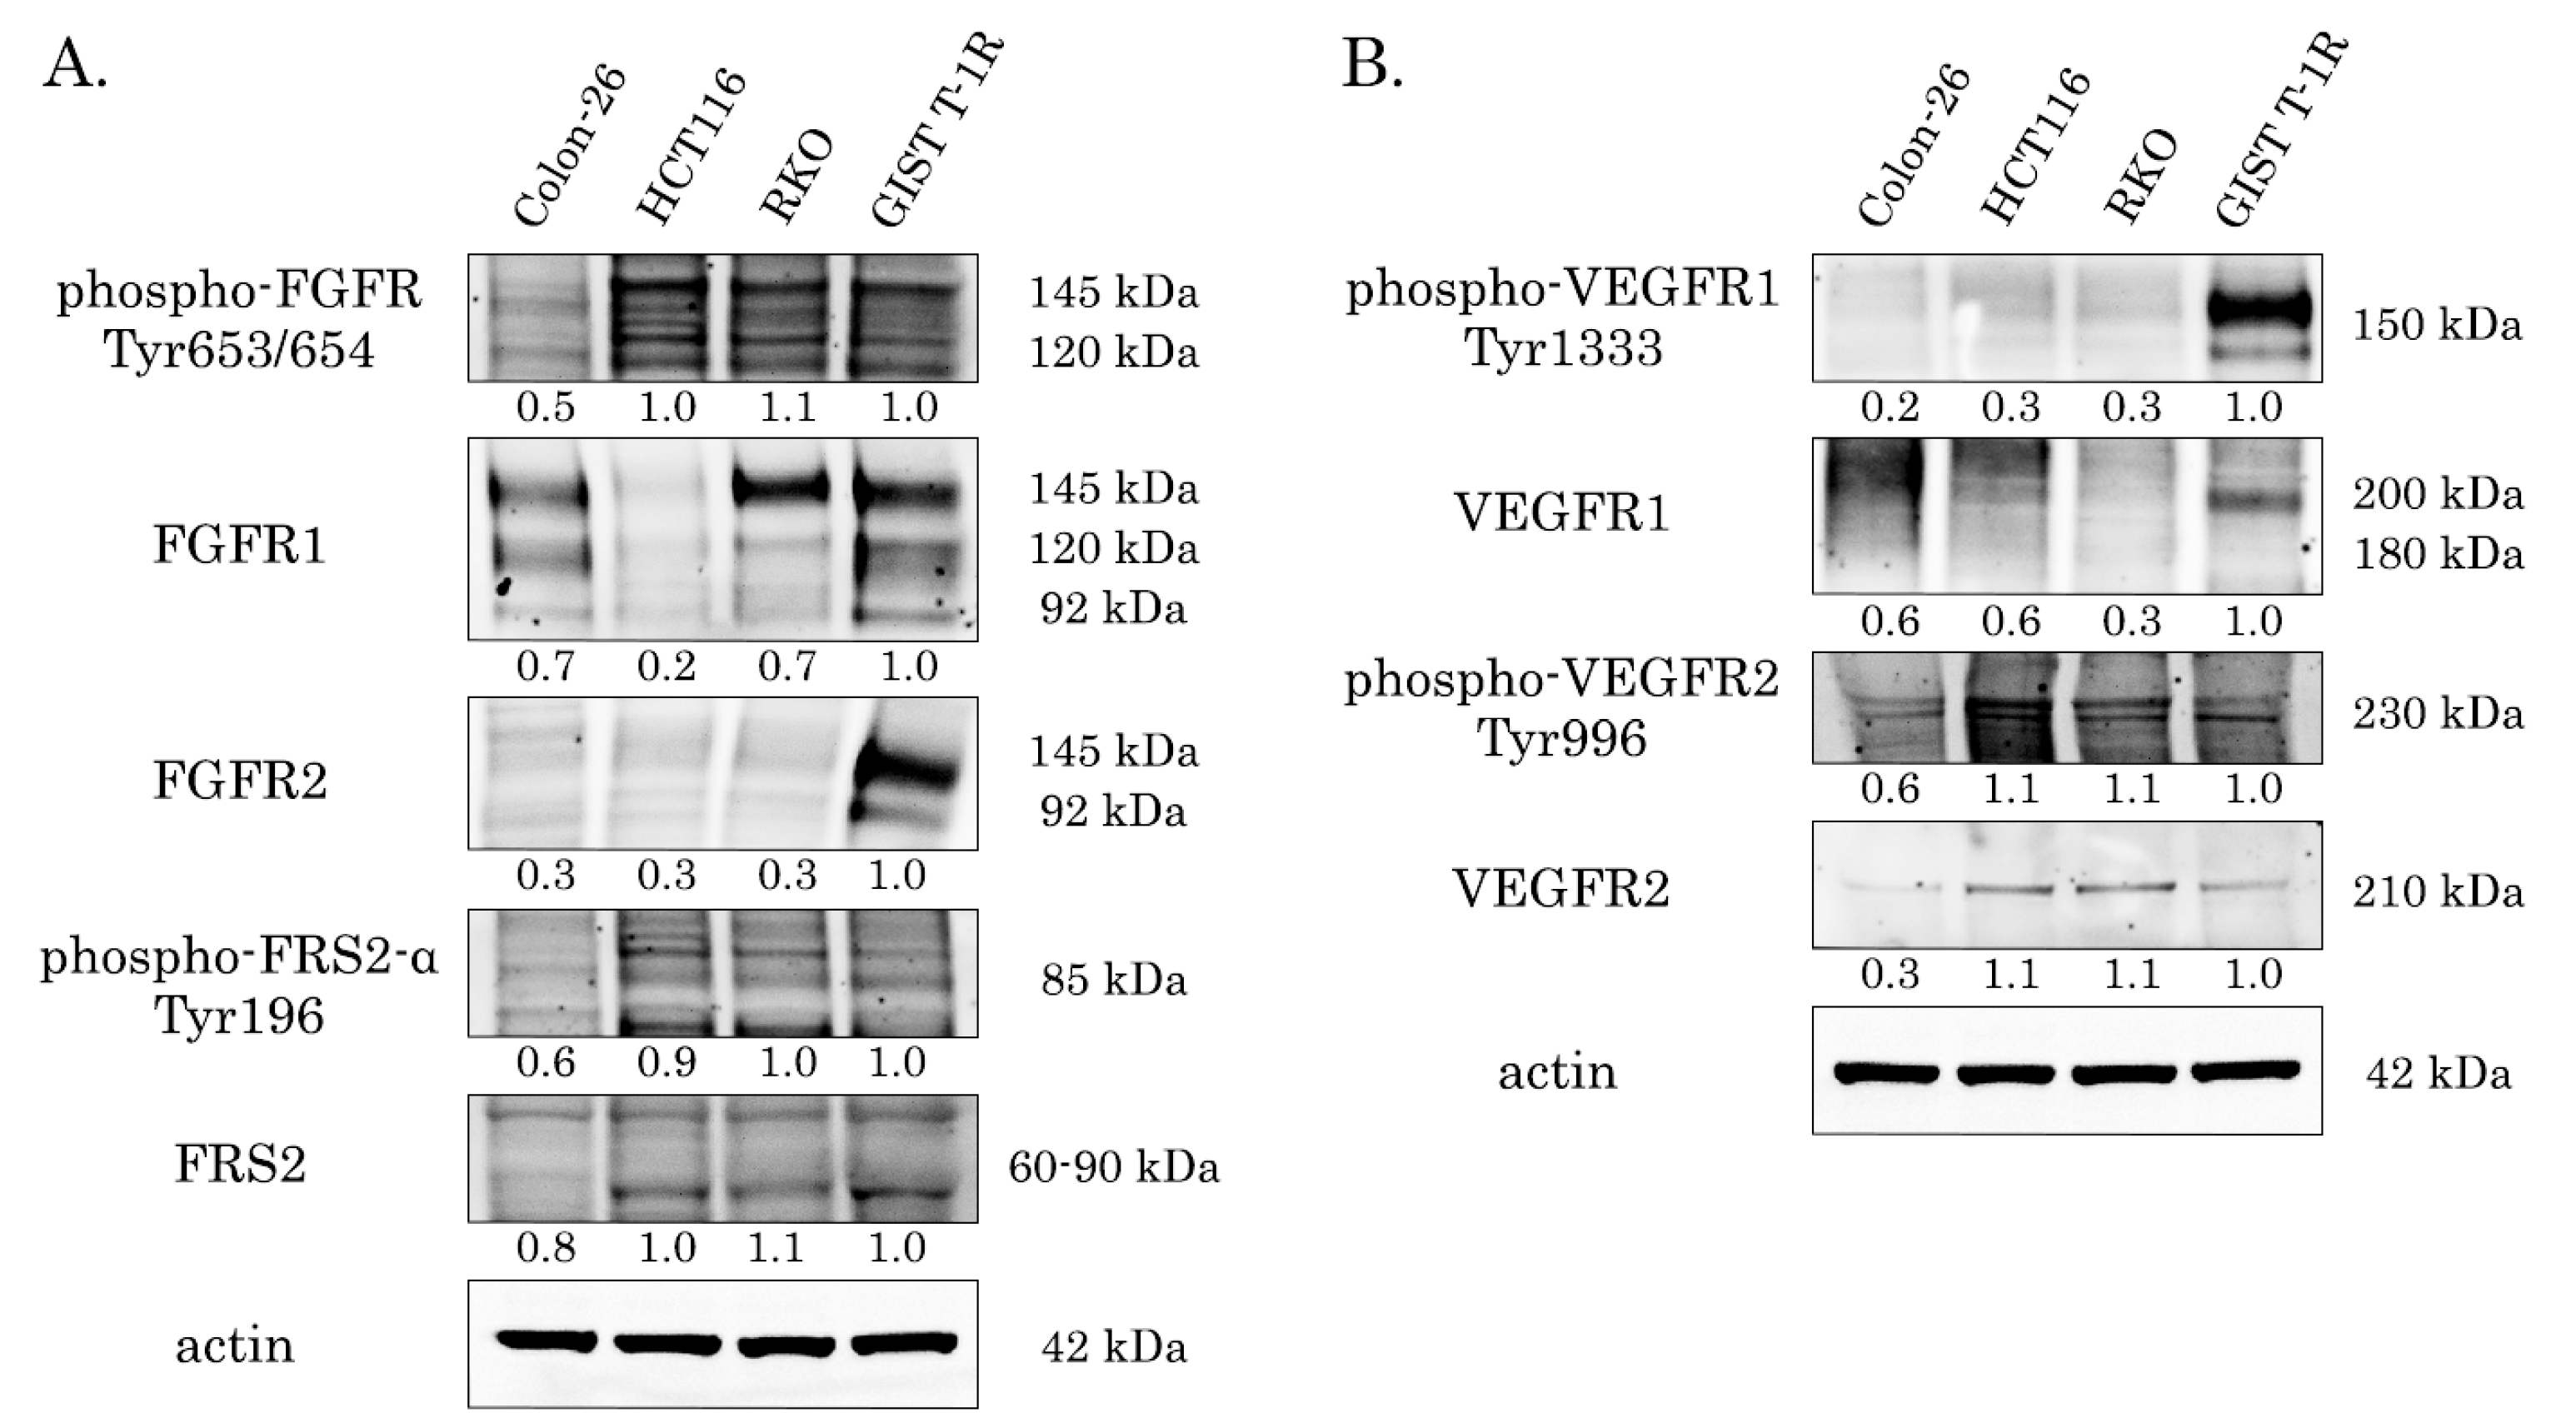
Figure 3.
Representative brightfield images of HCT116 colon cancer cells after exposure to DMSO (control), Doxorubicin (2 µM), RTKIs (Pemigatinib, Lucitanib, and Regorafenib - 10 µM), and their combinations for 72 h. Combinational treatment significantly reduces cell confluency when compared with monotherapies and control.
Figure 3.
Representative brightfield images of HCT116 colon cancer cells after exposure to DMSO (control), Doxorubicin (2 µM), RTKIs (Pemigatinib, Lucitanib, and Regorafenib - 10 µM), and their combinations for 72 h. Combinational treatment significantly reduces cell confluency when compared with monotherapies and control.
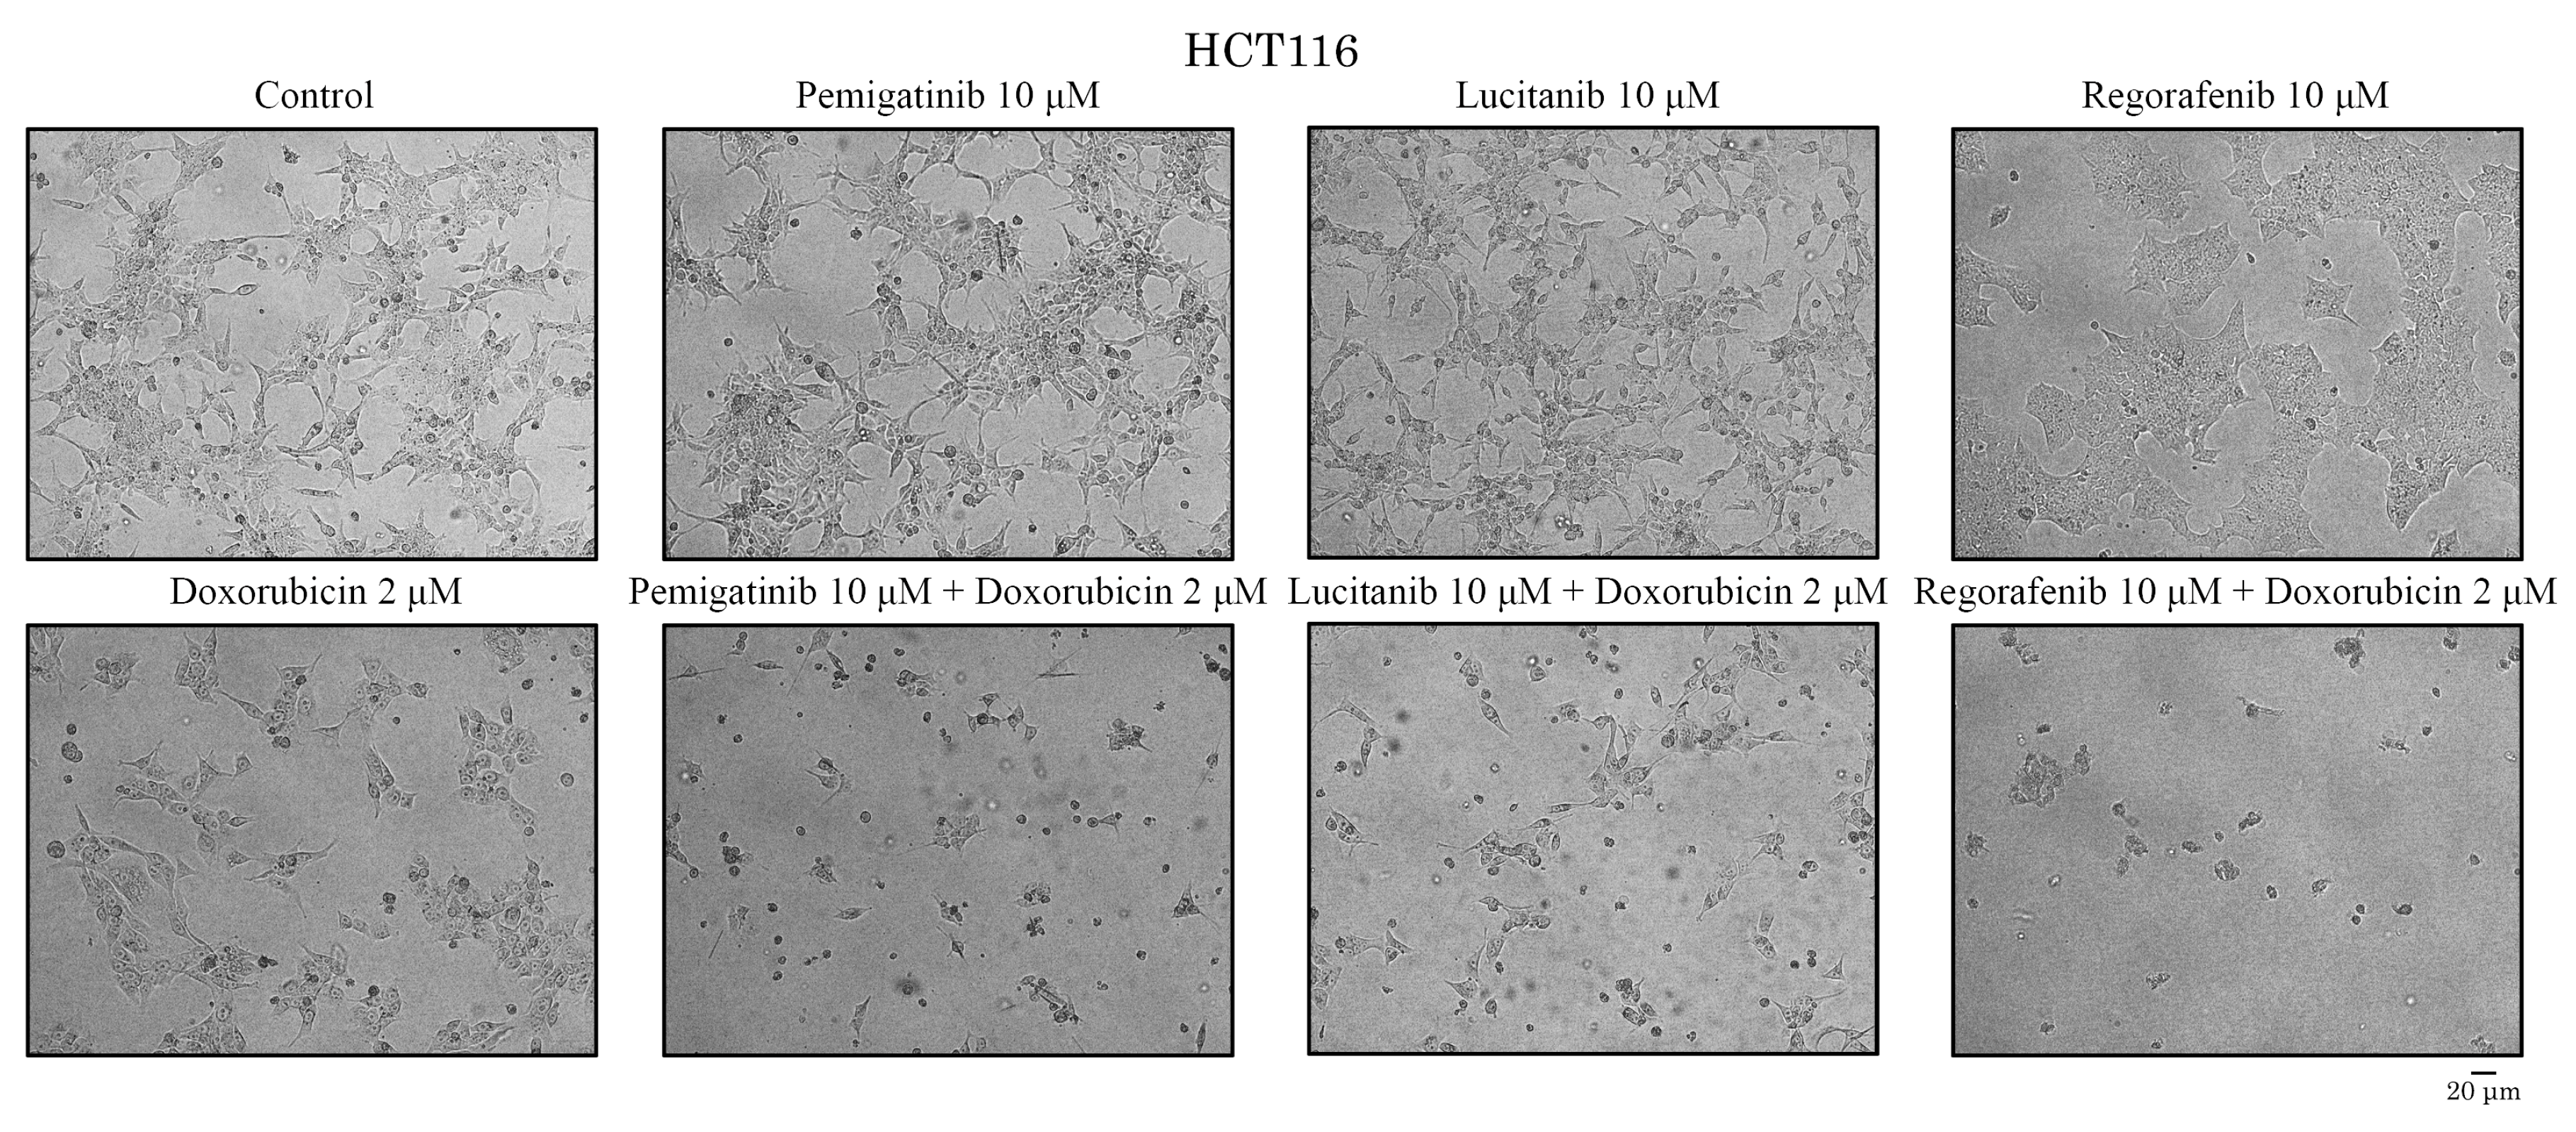
Figure 4.
Cristal violet staining of HCT116 cancer cells treated with DMSO (control), Doxorubicin (2 µM), and RTKIs (i.e., Pemigatinib, Lucitanib and Regorafenib - 10 µM) alone for 72 h, and when combined with Doxorubicin. (A) Representative images of HCT116 cancer cells stained with crystal violet solution after 72 hours of incubation with aforementioned chemotherapeutic drugs. (B) Quantitative analysis of HCT116 cells stained with crystal violet solution. Control was taken as 100% of cellular viability. Data was presented as mean (%) ± SD (n=3). Significant differences compared to control at p < 0.05 (*) and p < 0.01 (**).
Figure 4.
Cristal violet staining of HCT116 cancer cells treated with DMSO (control), Doxorubicin (2 µM), and RTKIs (i.e., Pemigatinib, Lucitanib and Regorafenib - 10 µM) alone for 72 h, and when combined with Doxorubicin. (A) Representative images of HCT116 cancer cells stained with crystal violet solution after 72 hours of incubation with aforementioned chemotherapeutic drugs. (B) Quantitative analysis of HCT116 cells stained with crystal violet solution. Control was taken as 100% of cellular viability. Data was presented as mean (%) ± SD (n=3). Significant differences compared to control at p < 0.05 (*) and p < 0.01 (**).
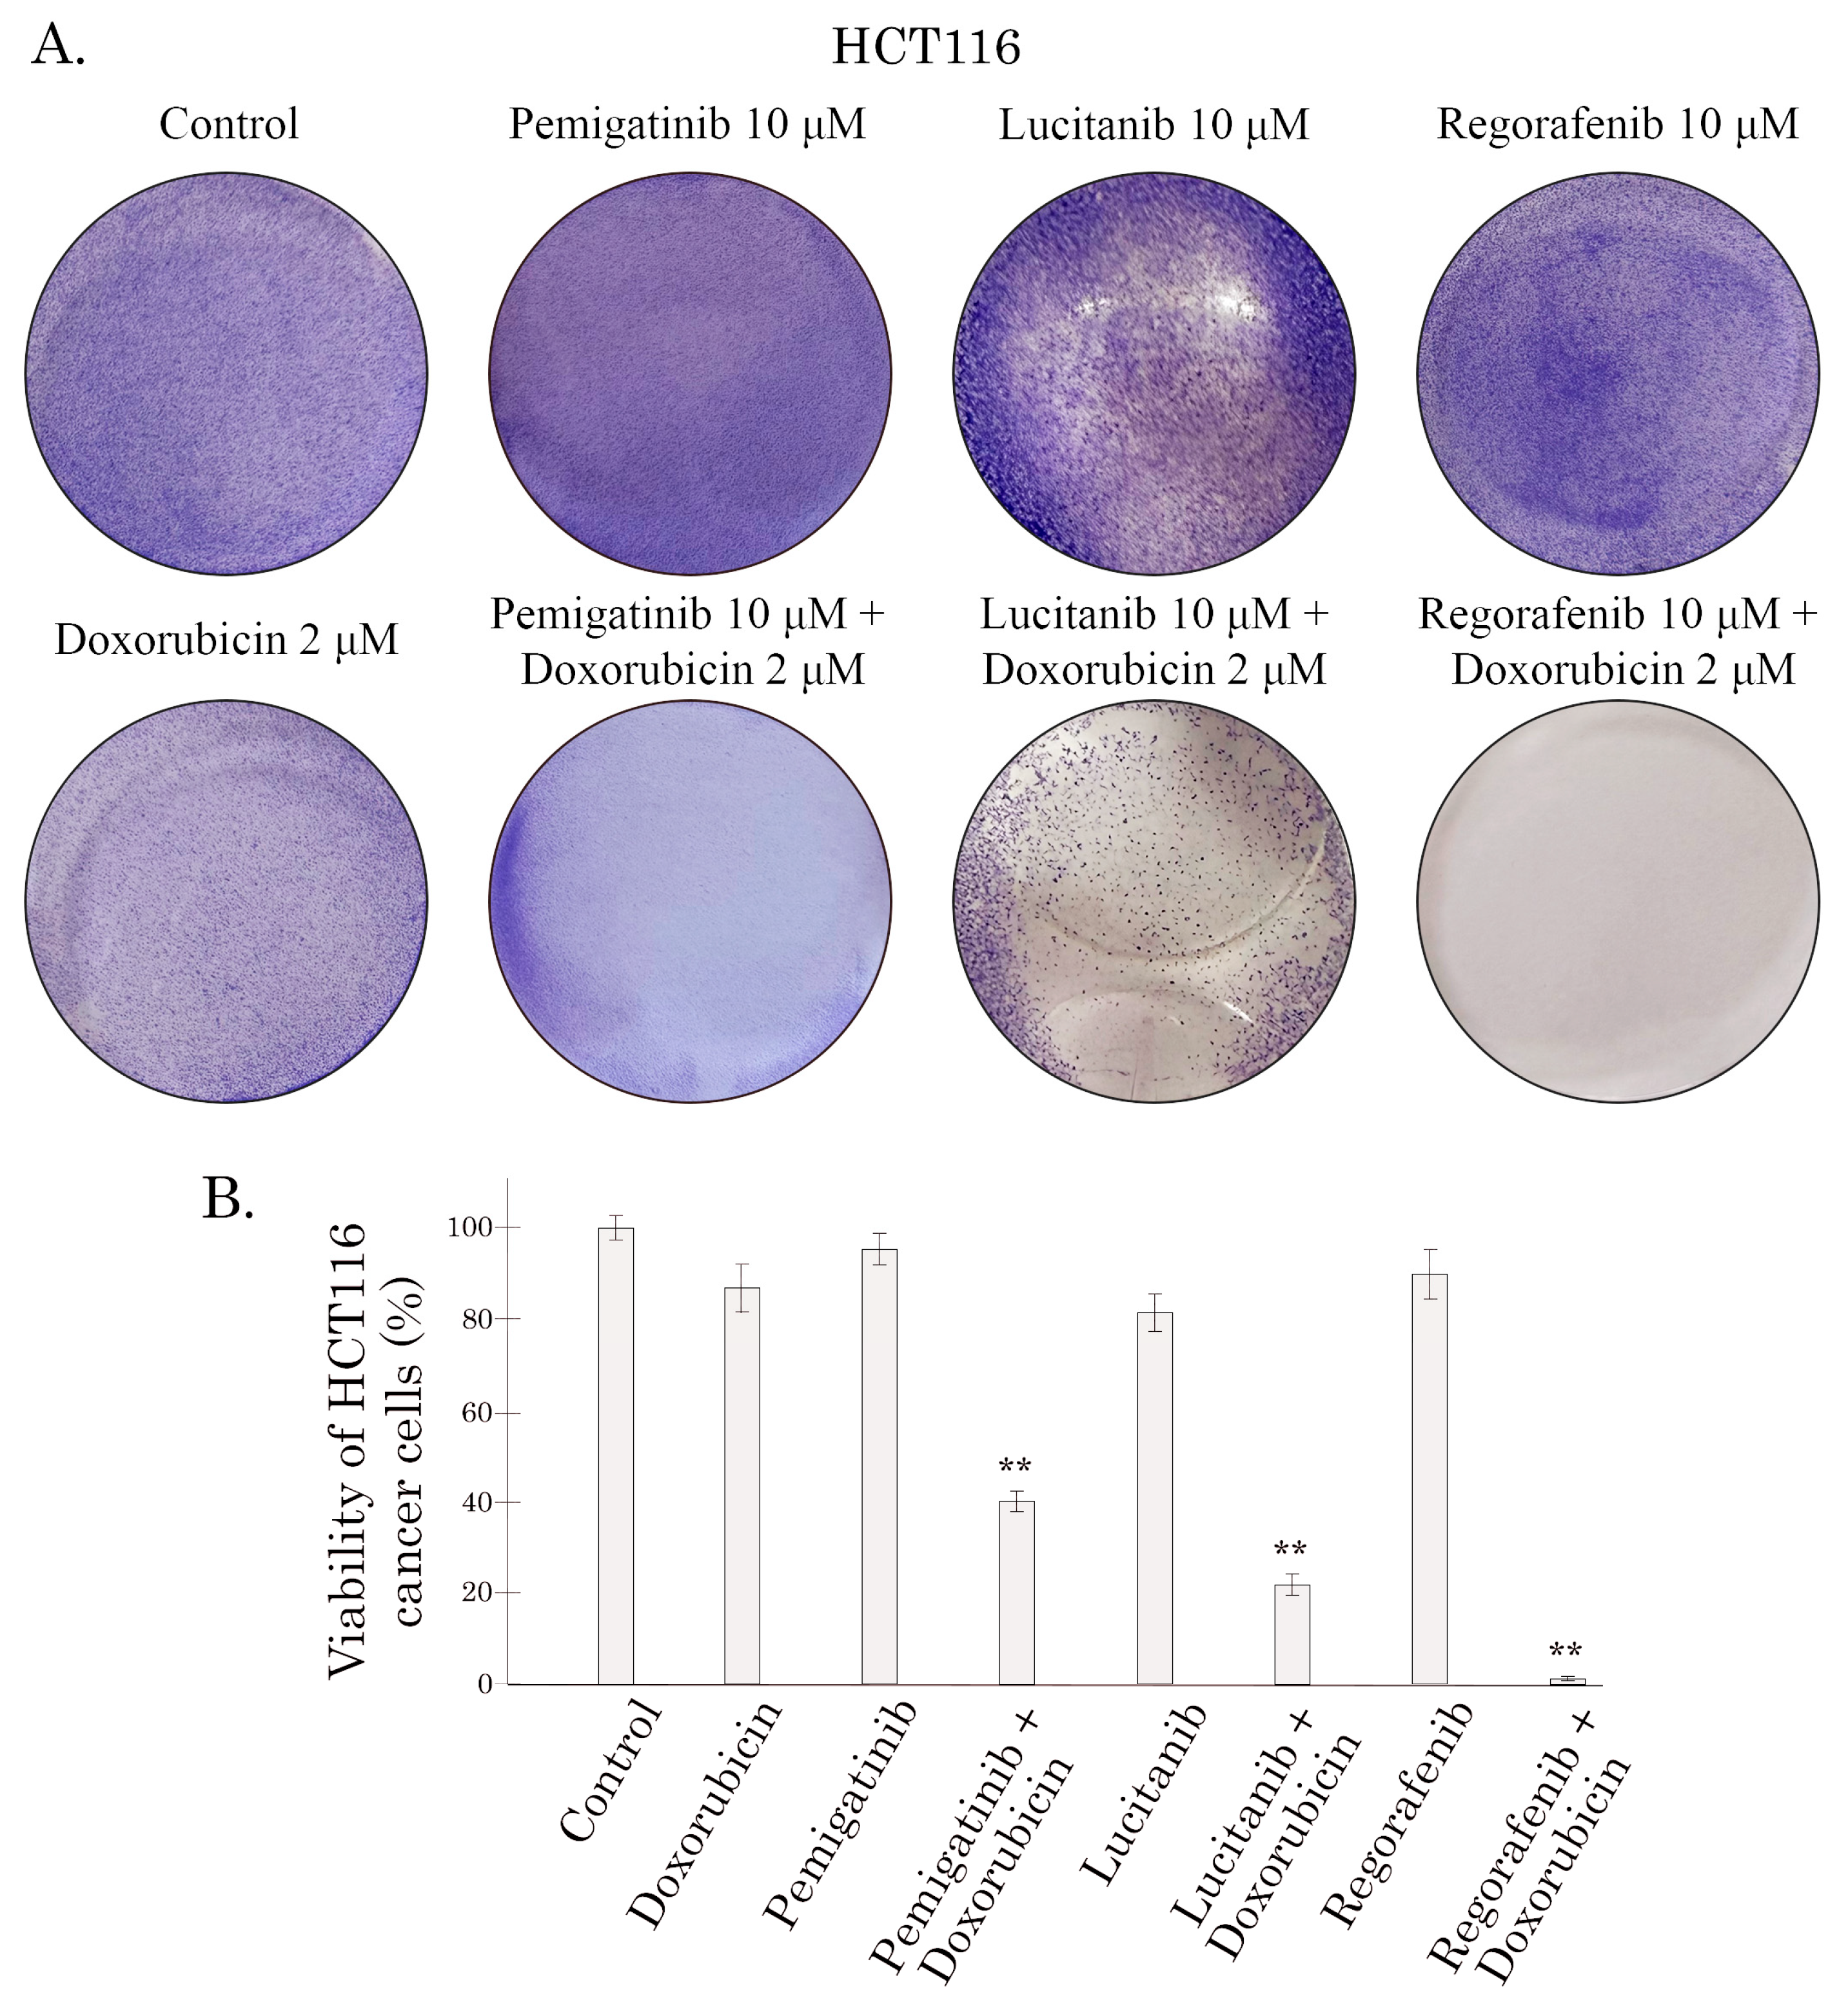
Figure 5.
Analysis of synergy between Doxorubicin and Pemigatinib in HCT116 (A-D) and between Doxorubicin and Infigratinib in Colon-26 cells (E-H). CRC cells were treated with increasing concentrations of the aforementioned RTKI, Doxorubicin, and their combinations to assess synergistic, additive, or antagonistic effects using the online SynergyFinder tool. (A, E) Single-agent curves demonstrating a dose-dependent cytotoxic effect in CRC cells treated with RTKIs and Doxorubicin. The data represent the mean of three independent experiments. (B, F) Dose-dependent matrices of RTKI and Doxorubicin combinations to show the maximal cytotoxicity of both drugs used at higher concentrations. (C, G) Two-dimensional synergy maps illustrate robust synergism between RTKI and Doxorubicin, with HSA scores of 10.03 for HCT116 cells and 17.16 for Colon-26 cells. (D, H) Three-dimensional HSA synergy landscapes illustrating high HSA scores and confirming the combinational benefit of RTKI and Doxorubicin in CRC cells.
Figure 5.
Analysis of synergy between Doxorubicin and Pemigatinib in HCT116 (A-D) and between Doxorubicin and Infigratinib in Colon-26 cells (E-H). CRC cells were treated with increasing concentrations of the aforementioned RTKI, Doxorubicin, and their combinations to assess synergistic, additive, or antagonistic effects using the online SynergyFinder tool. (A, E) Single-agent curves demonstrating a dose-dependent cytotoxic effect in CRC cells treated with RTKIs and Doxorubicin. The data represent the mean of three independent experiments. (B, F) Dose-dependent matrices of RTKI and Doxorubicin combinations to show the maximal cytotoxicity of both drugs used at higher concentrations. (C, G) Two-dimensional synergy maps illustrate robust synergism between RTKI and Doxorubicin, with HSA scores of 10.03 for HCT116 cells and 17.16 for Colon-26 cells. (D, H) Three-dimensional HSA synergy landscapes illustrating high HSA scores and confirming the combinational benefit of RTKI and Doxorubicin in CRC cells.
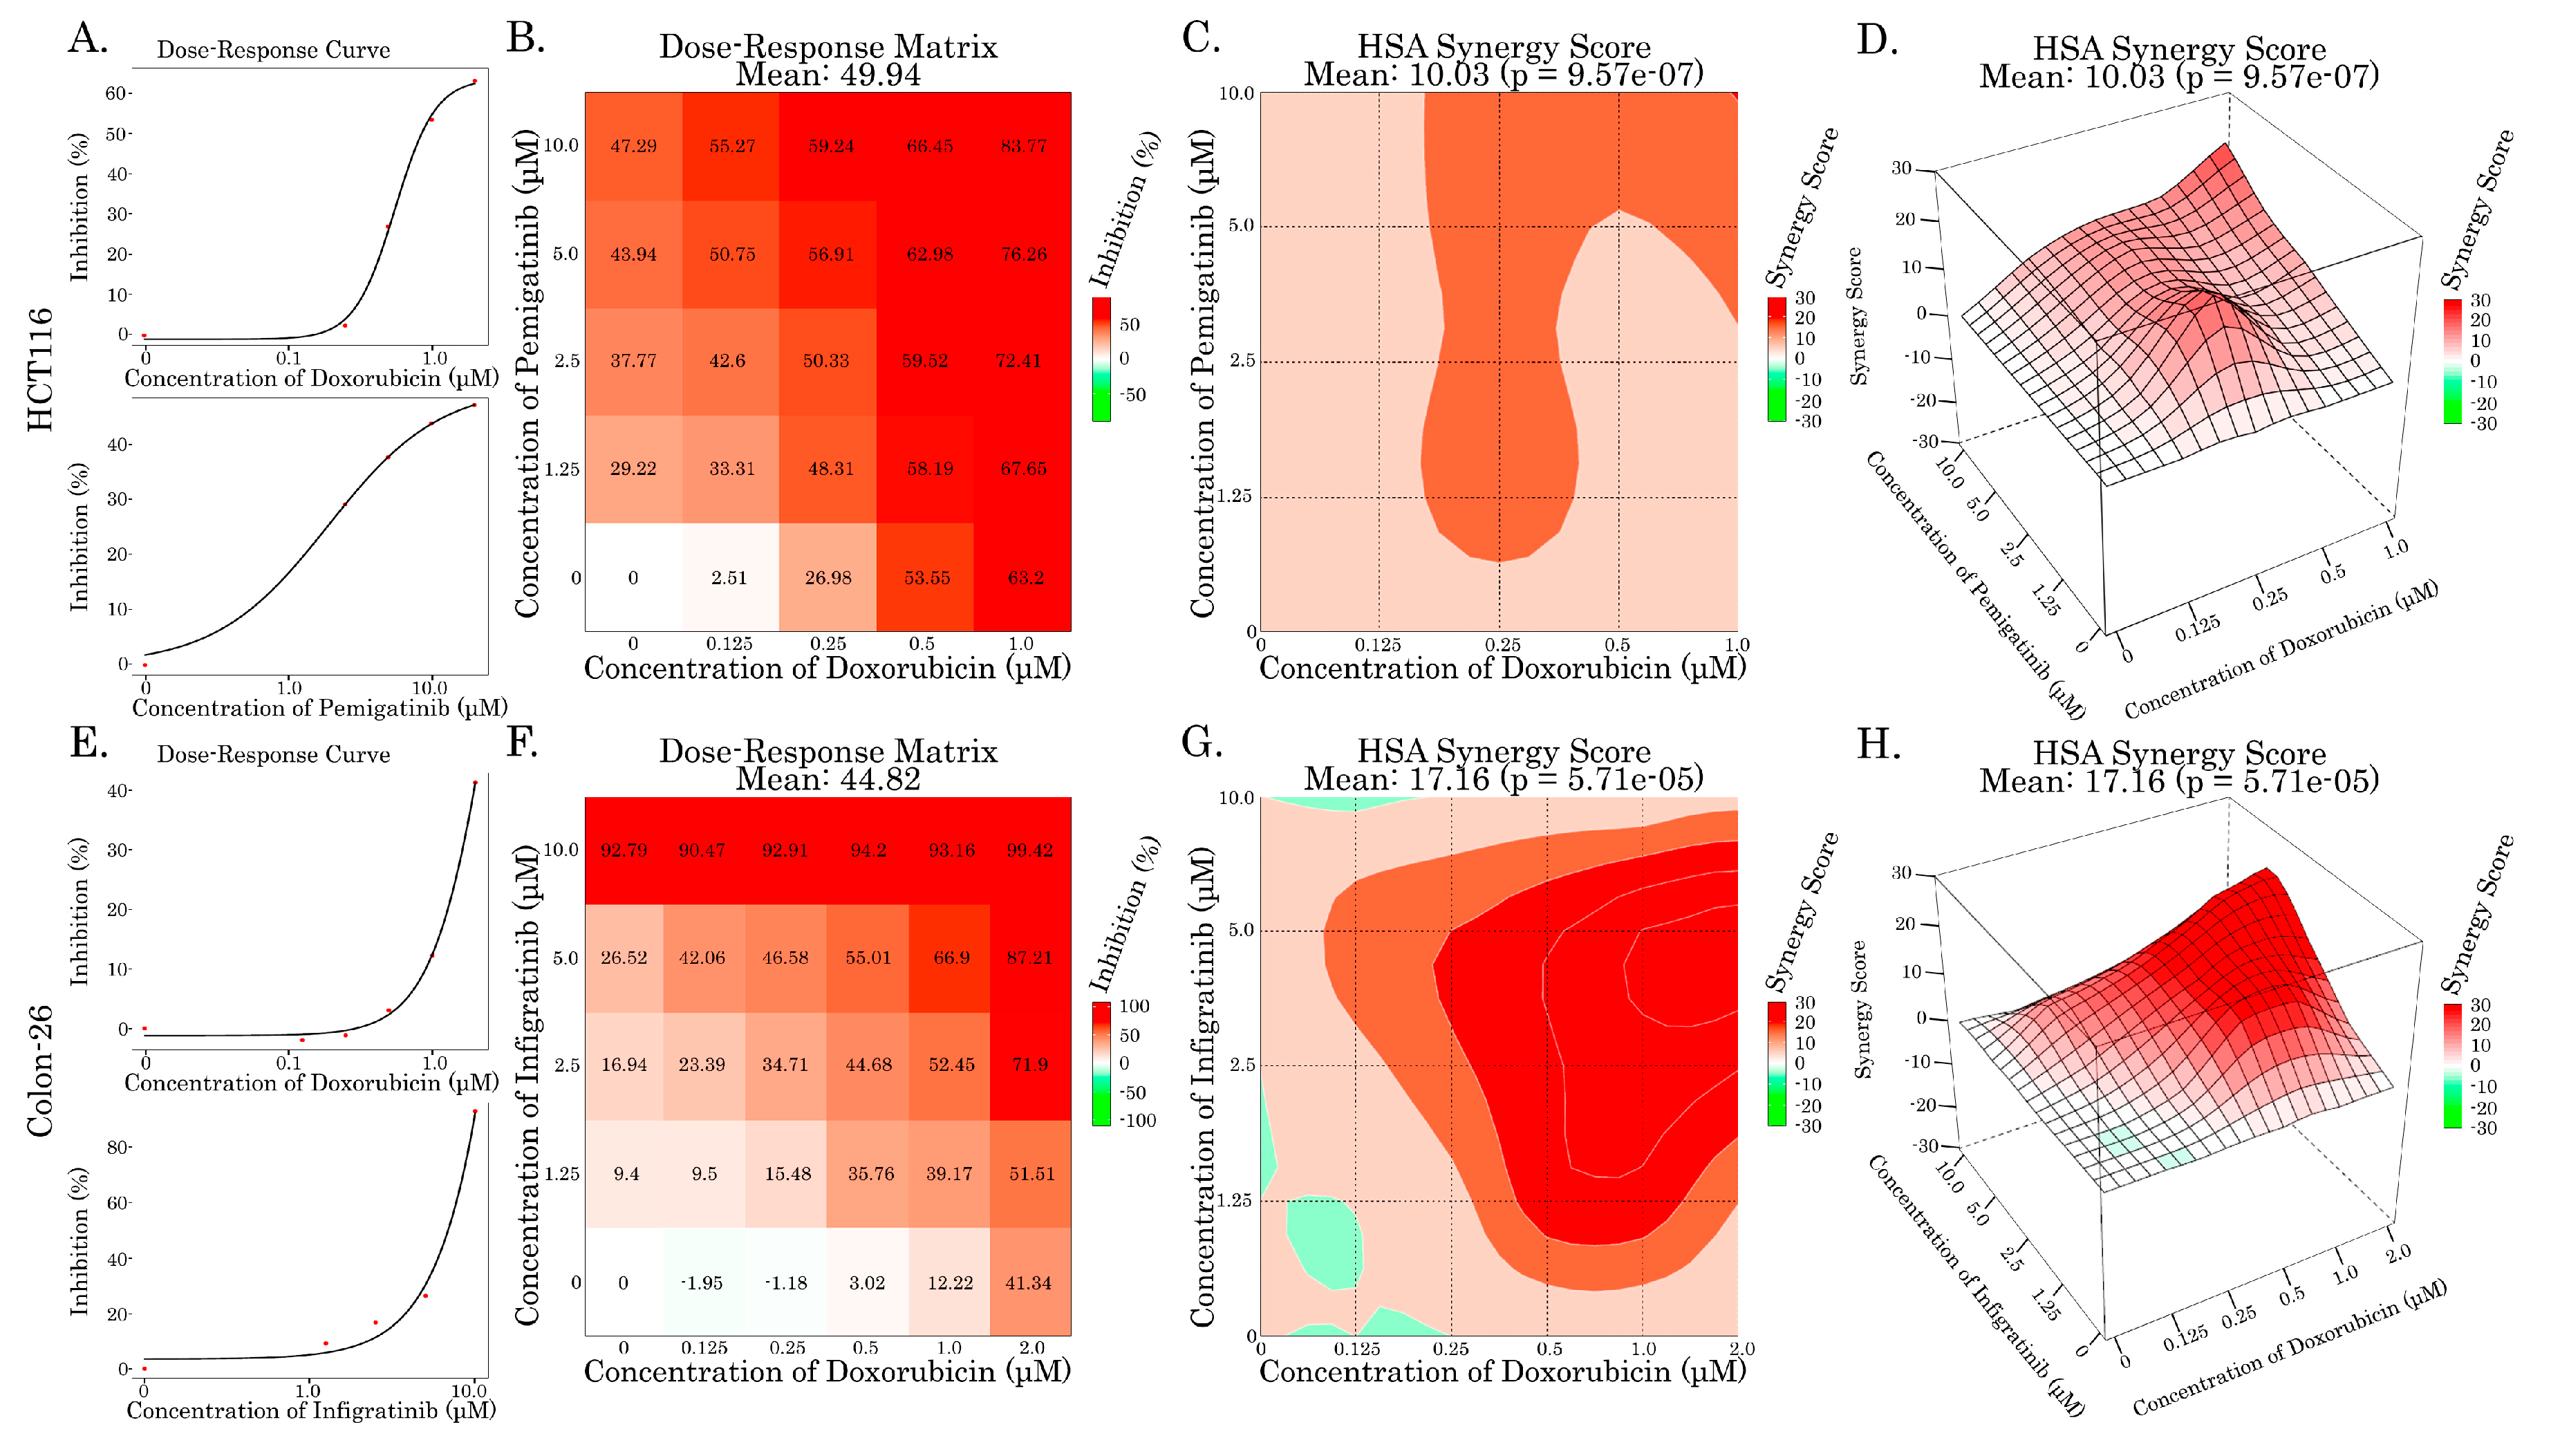
Figure 6.
Pro-apoptotic activity of RTKIs, Doxorubicin alone, and in combination in CRC cell lines. HCT116 (A) and Colon-26 (B) cells were treated with Doxorubicin (1 µM or 2 µM in HCT116 and Colon-26 cells, respectively), Pemigatinib, Lucitanib, Regorafenib, Cabozatinib, Infigratinib (10 µM) alone or in combination for 72 h and subjected to Western blot analysis to examine the expression of apoptotic markers, including cleaved poly-(ADP)-ribose-polymerase (PARP) and caspase-3. Actin staining was used to show the comparable amounts of protein loaded into each sample.
Figure 6.
Pro-apoptotic activity of RTKIs, Doxorubicin alone, and in combination in CRC cell lines. HCT116 (A) and Colon-26 (B) cells were treated with Doxorubicin (1 µM or 2 µM in HCT116 and Colon-26 cells, respectively), Pemigatinib, Lucitanib, Regorafenib, Cabozatinib, Infigratinib (10 µM) alone or in combination for 72 h and subjected to Western blot analysis to examine the expression of apoptotic markers, including cleaved poly-(ADP)-ribose-polymerase (PARP) and caspase-3. Actin staining was used to show the comparable amounts of protein loaded into each sample.
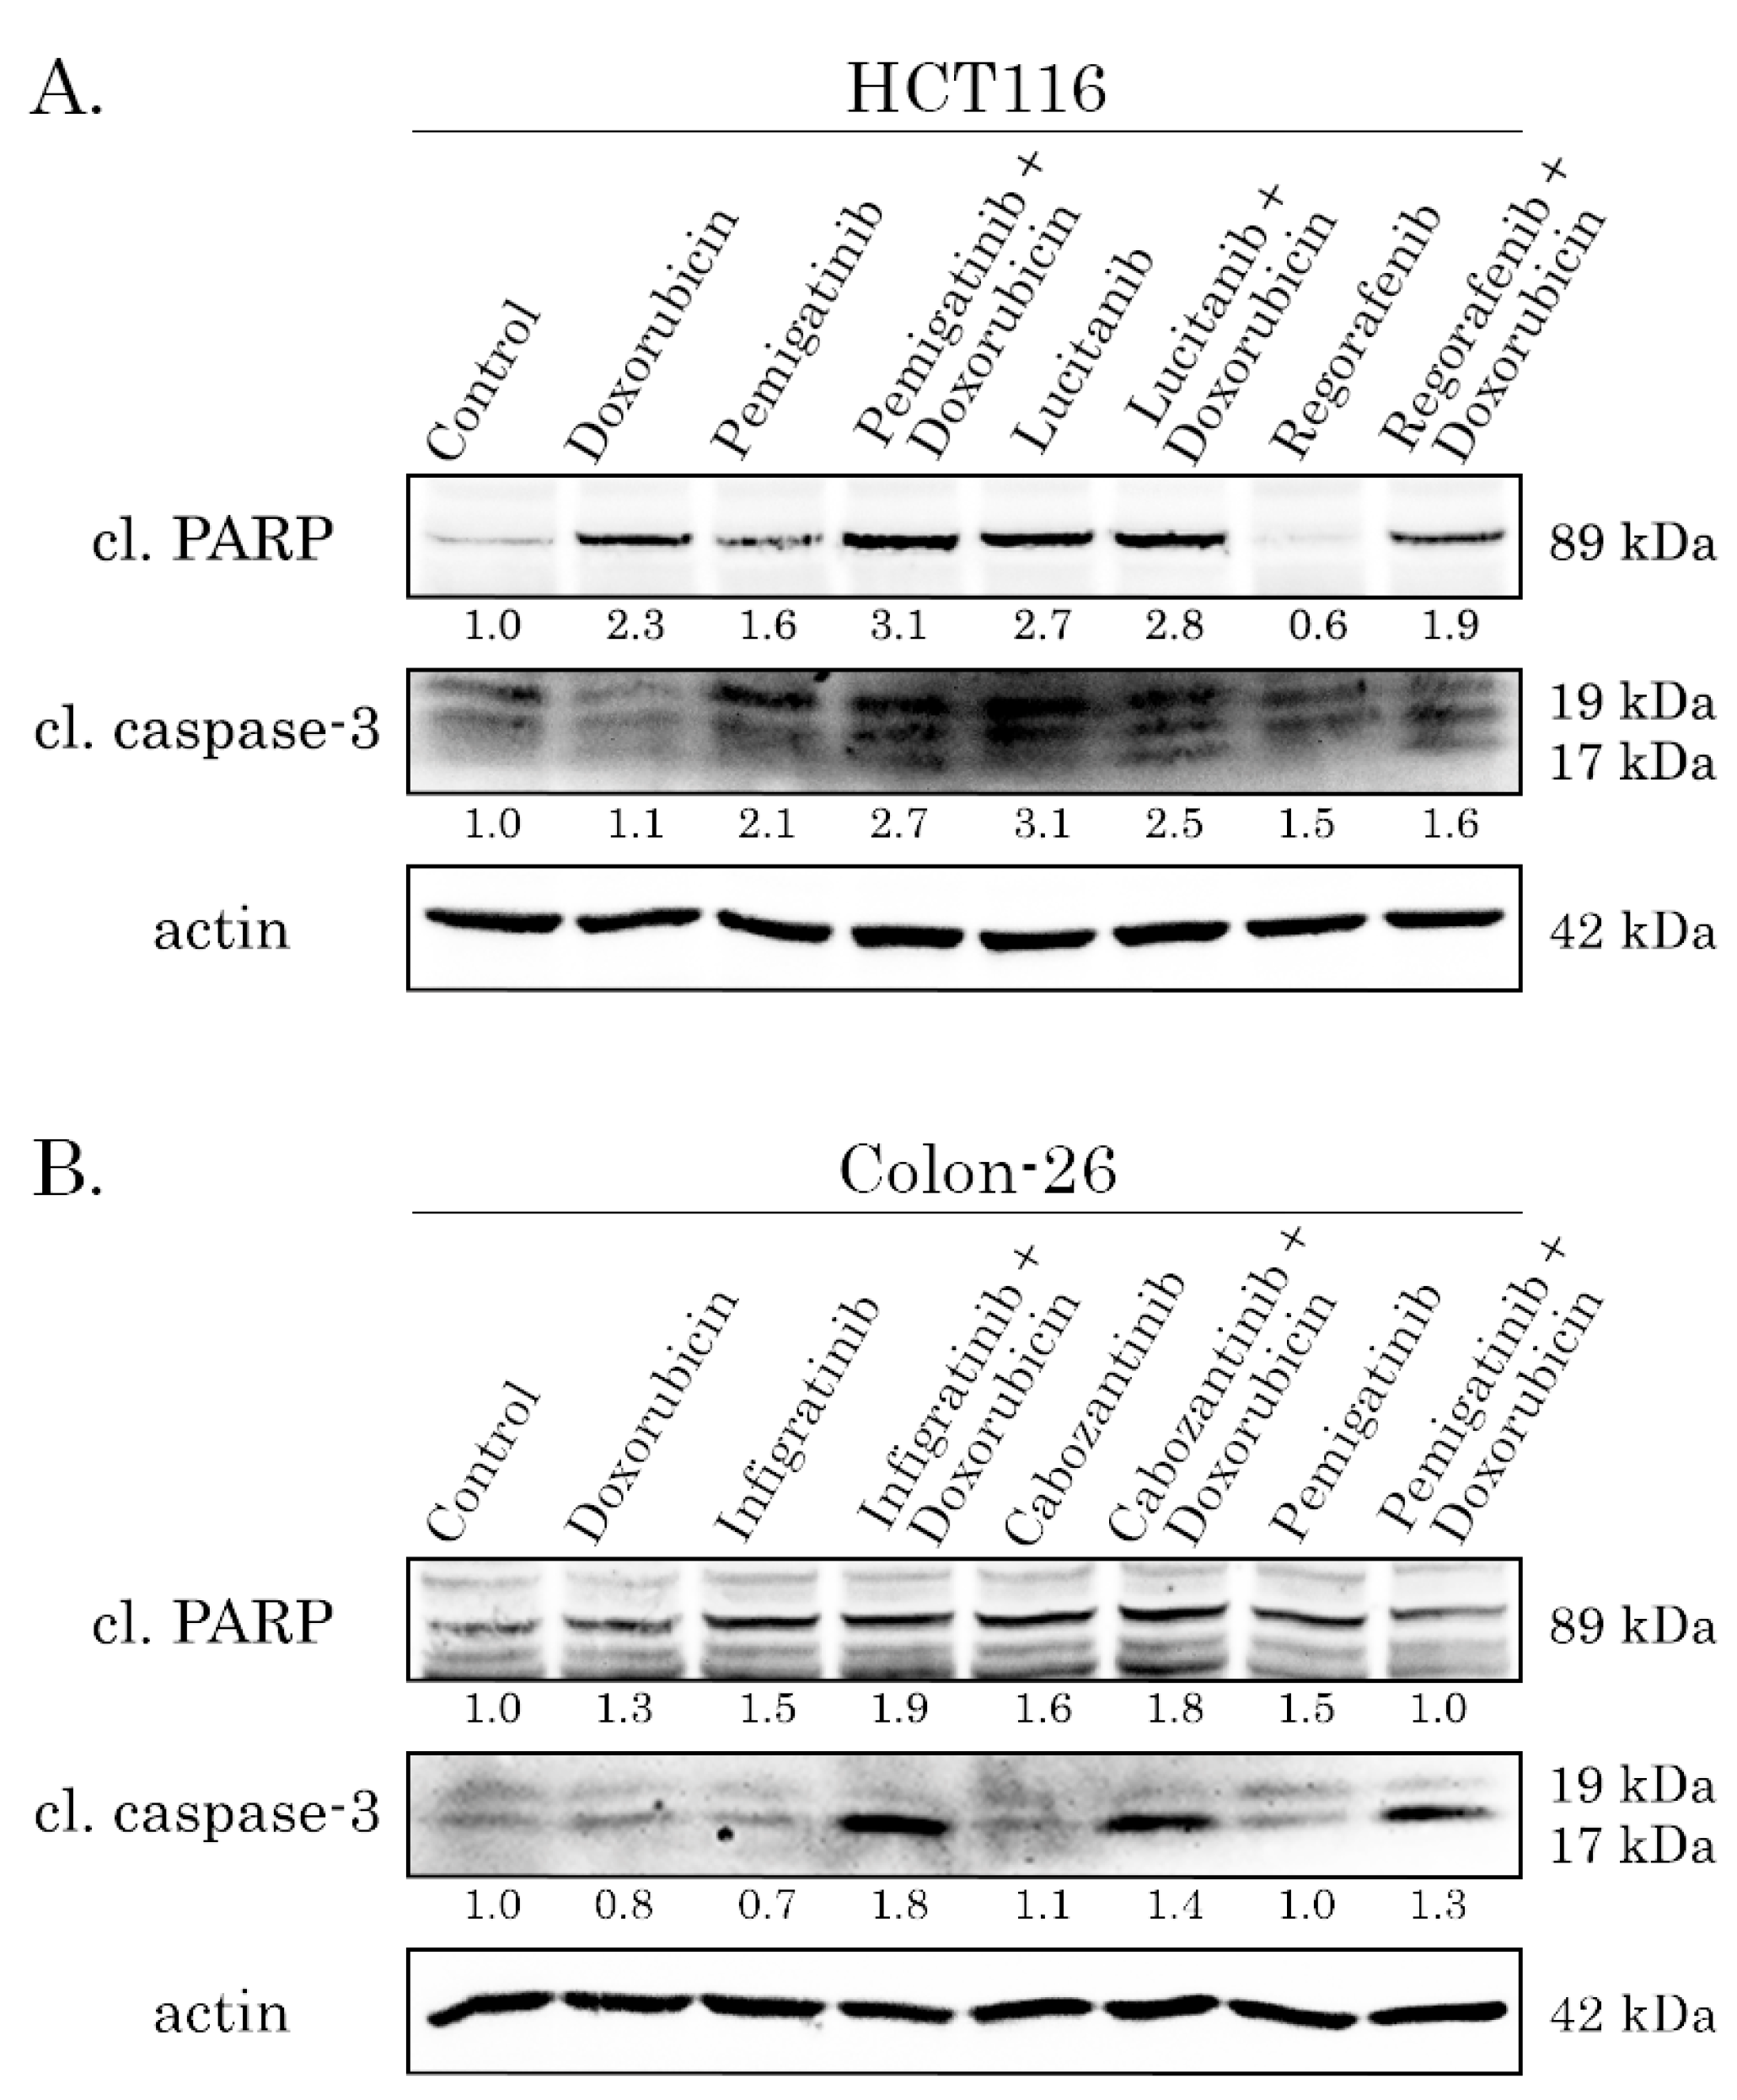
Figure 7.
Anti-proliferative effects of RTKIs used alone or in combination with Doxorubicin in the HCT116 colon cancer cell line. Changes in the growth kinetics of cancer cells treated with the solvent DMSO (control), Doxorubicin, Pemigatinib (A), Lucitanib (B), and Regorafenib (C), alone or in combination. Cells (0.5 × 10⁵/ml) were seeded into the wells of an E-Plate L8 PET cassette and installed in the iCELLigence cell growth kinetics system (ACEA Biosciences, San Diego, CA, USA). Cells were allowed to attach and grow for the following 24 h. Afterward, RTKI, Doxorubicin, or DMSO was introduced into the cell culture. Cell proliferation index values were recorded every hour throughout the experiment. RTCA Software version 1.0 (ACEA Biosciences, Inc., San Diego, CA, USA) was used to analyze the data.
Figure 7.
Anti-proliferative effects of RTKIs used alone or in combination with Doxorubicin in the HCT116 colon cancer cell line. Changes in the growth kinetics of cancer cells treated with the solvent DMSO (control), Doxorubicin, Pemigatinib (A), Lucitanib (B), and Regorafenib (C), alone or in combination. Cells (0.5 × 10⁵/ml) were seeded into the wells of an E-Plate L8 PET cassette and installed in the iCELLigence cell growth kinetics system (ACEA Biosciences, San Diego, CA, USA). Cells were allowed to attach and grow for the following 24 h. Afterward, RTKI, Doxorubicin, or DMSO was introduced into the cell culture. Cell proliferation index values were recorded every hour throughout the experiment. RTCA Software version 1.0 (ACEA Biosciences, Inc., San Diego, CA, USA) was used to analyze the data.
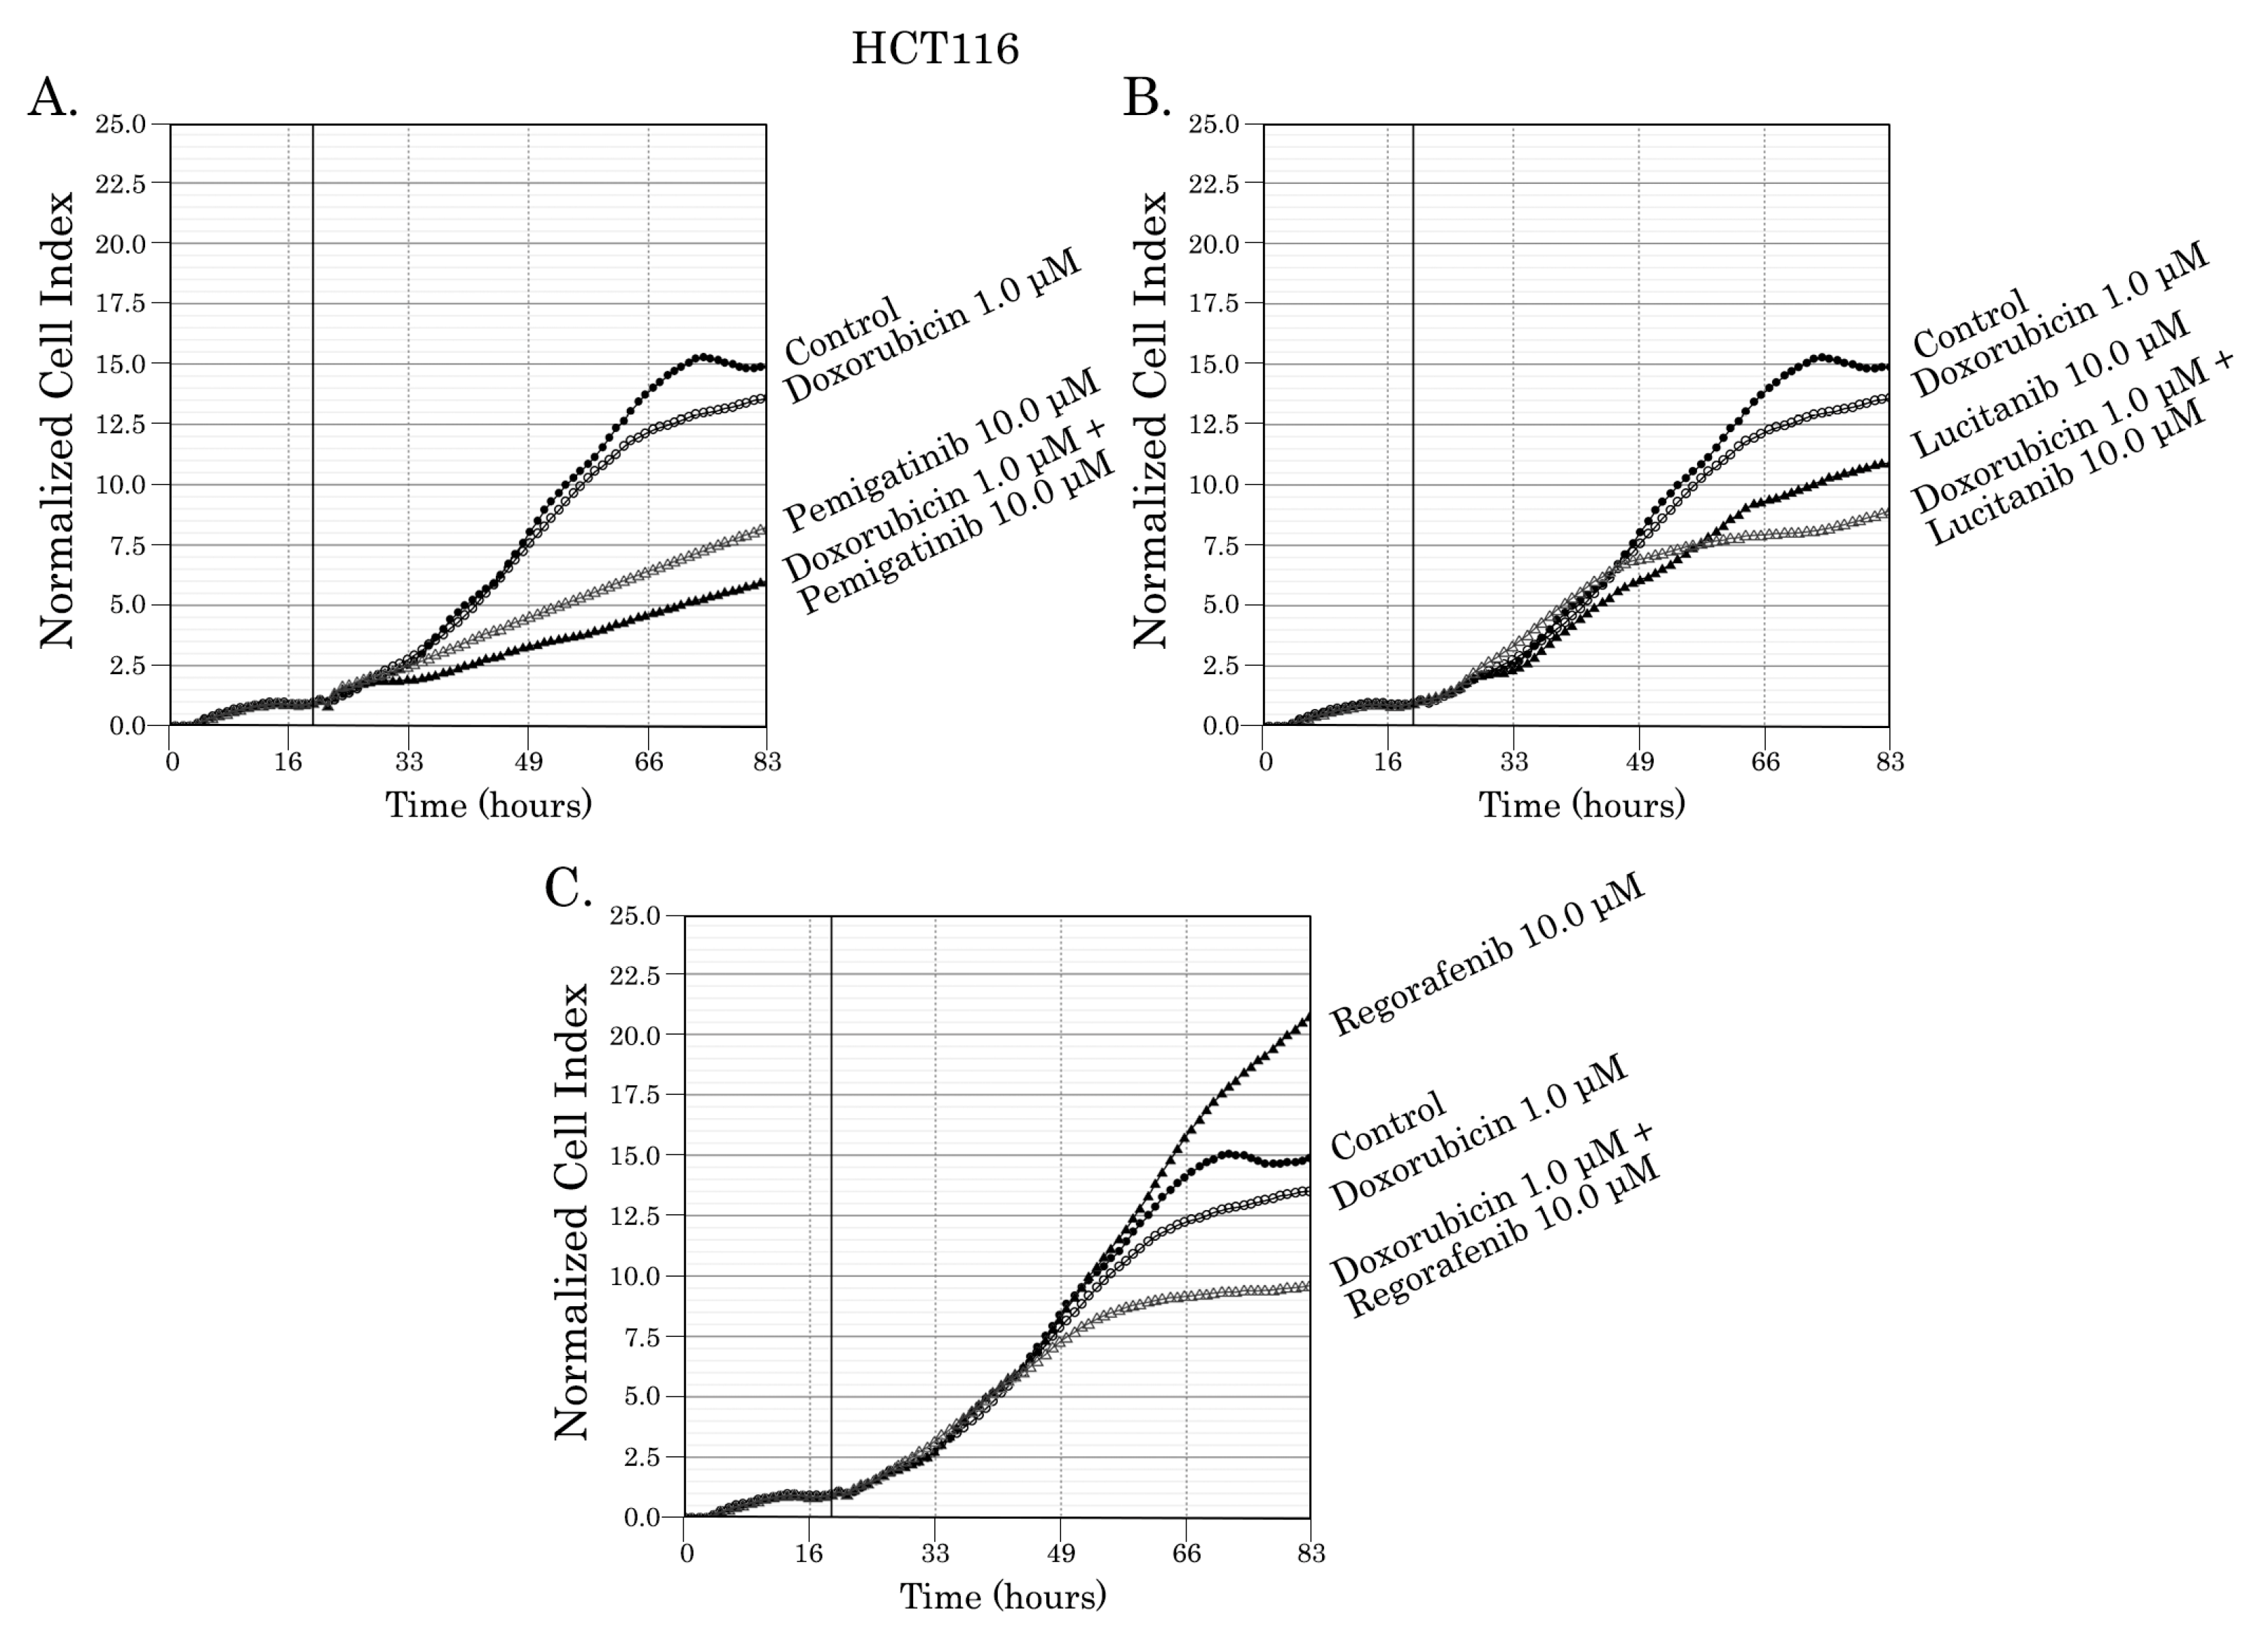
Figure 8.
An impact of RTKI (Pemigatinib, Lucitanib and Regorafenib) on FGFR and VEGFR signaling pathways in the HCT116 cancer cell line. Changes in expression of total and phosphorylated forms of FGFR and VEGFR signaling proteins (A and B, respectively) in HCT116 cells in response to RTKI (10 µM) for 72 h. Actin stain was used as a loading control for all experiments shown in A and B.
Figure 8.
An impact of RTKI (Pemigatinib, Lucitanib and Regorafenib) on FGFR and VEGFR signaling pathways in the HCT116 cancer cell line. Changes in expression of total and phosphorylated forms of FGFR and VEGFR signaling proteins (A and B, respectively) in HCT116 cells in response to RTKI (10 µM) for 72 h. Actin stain was used as a loading control for all experiments shown in A and B.
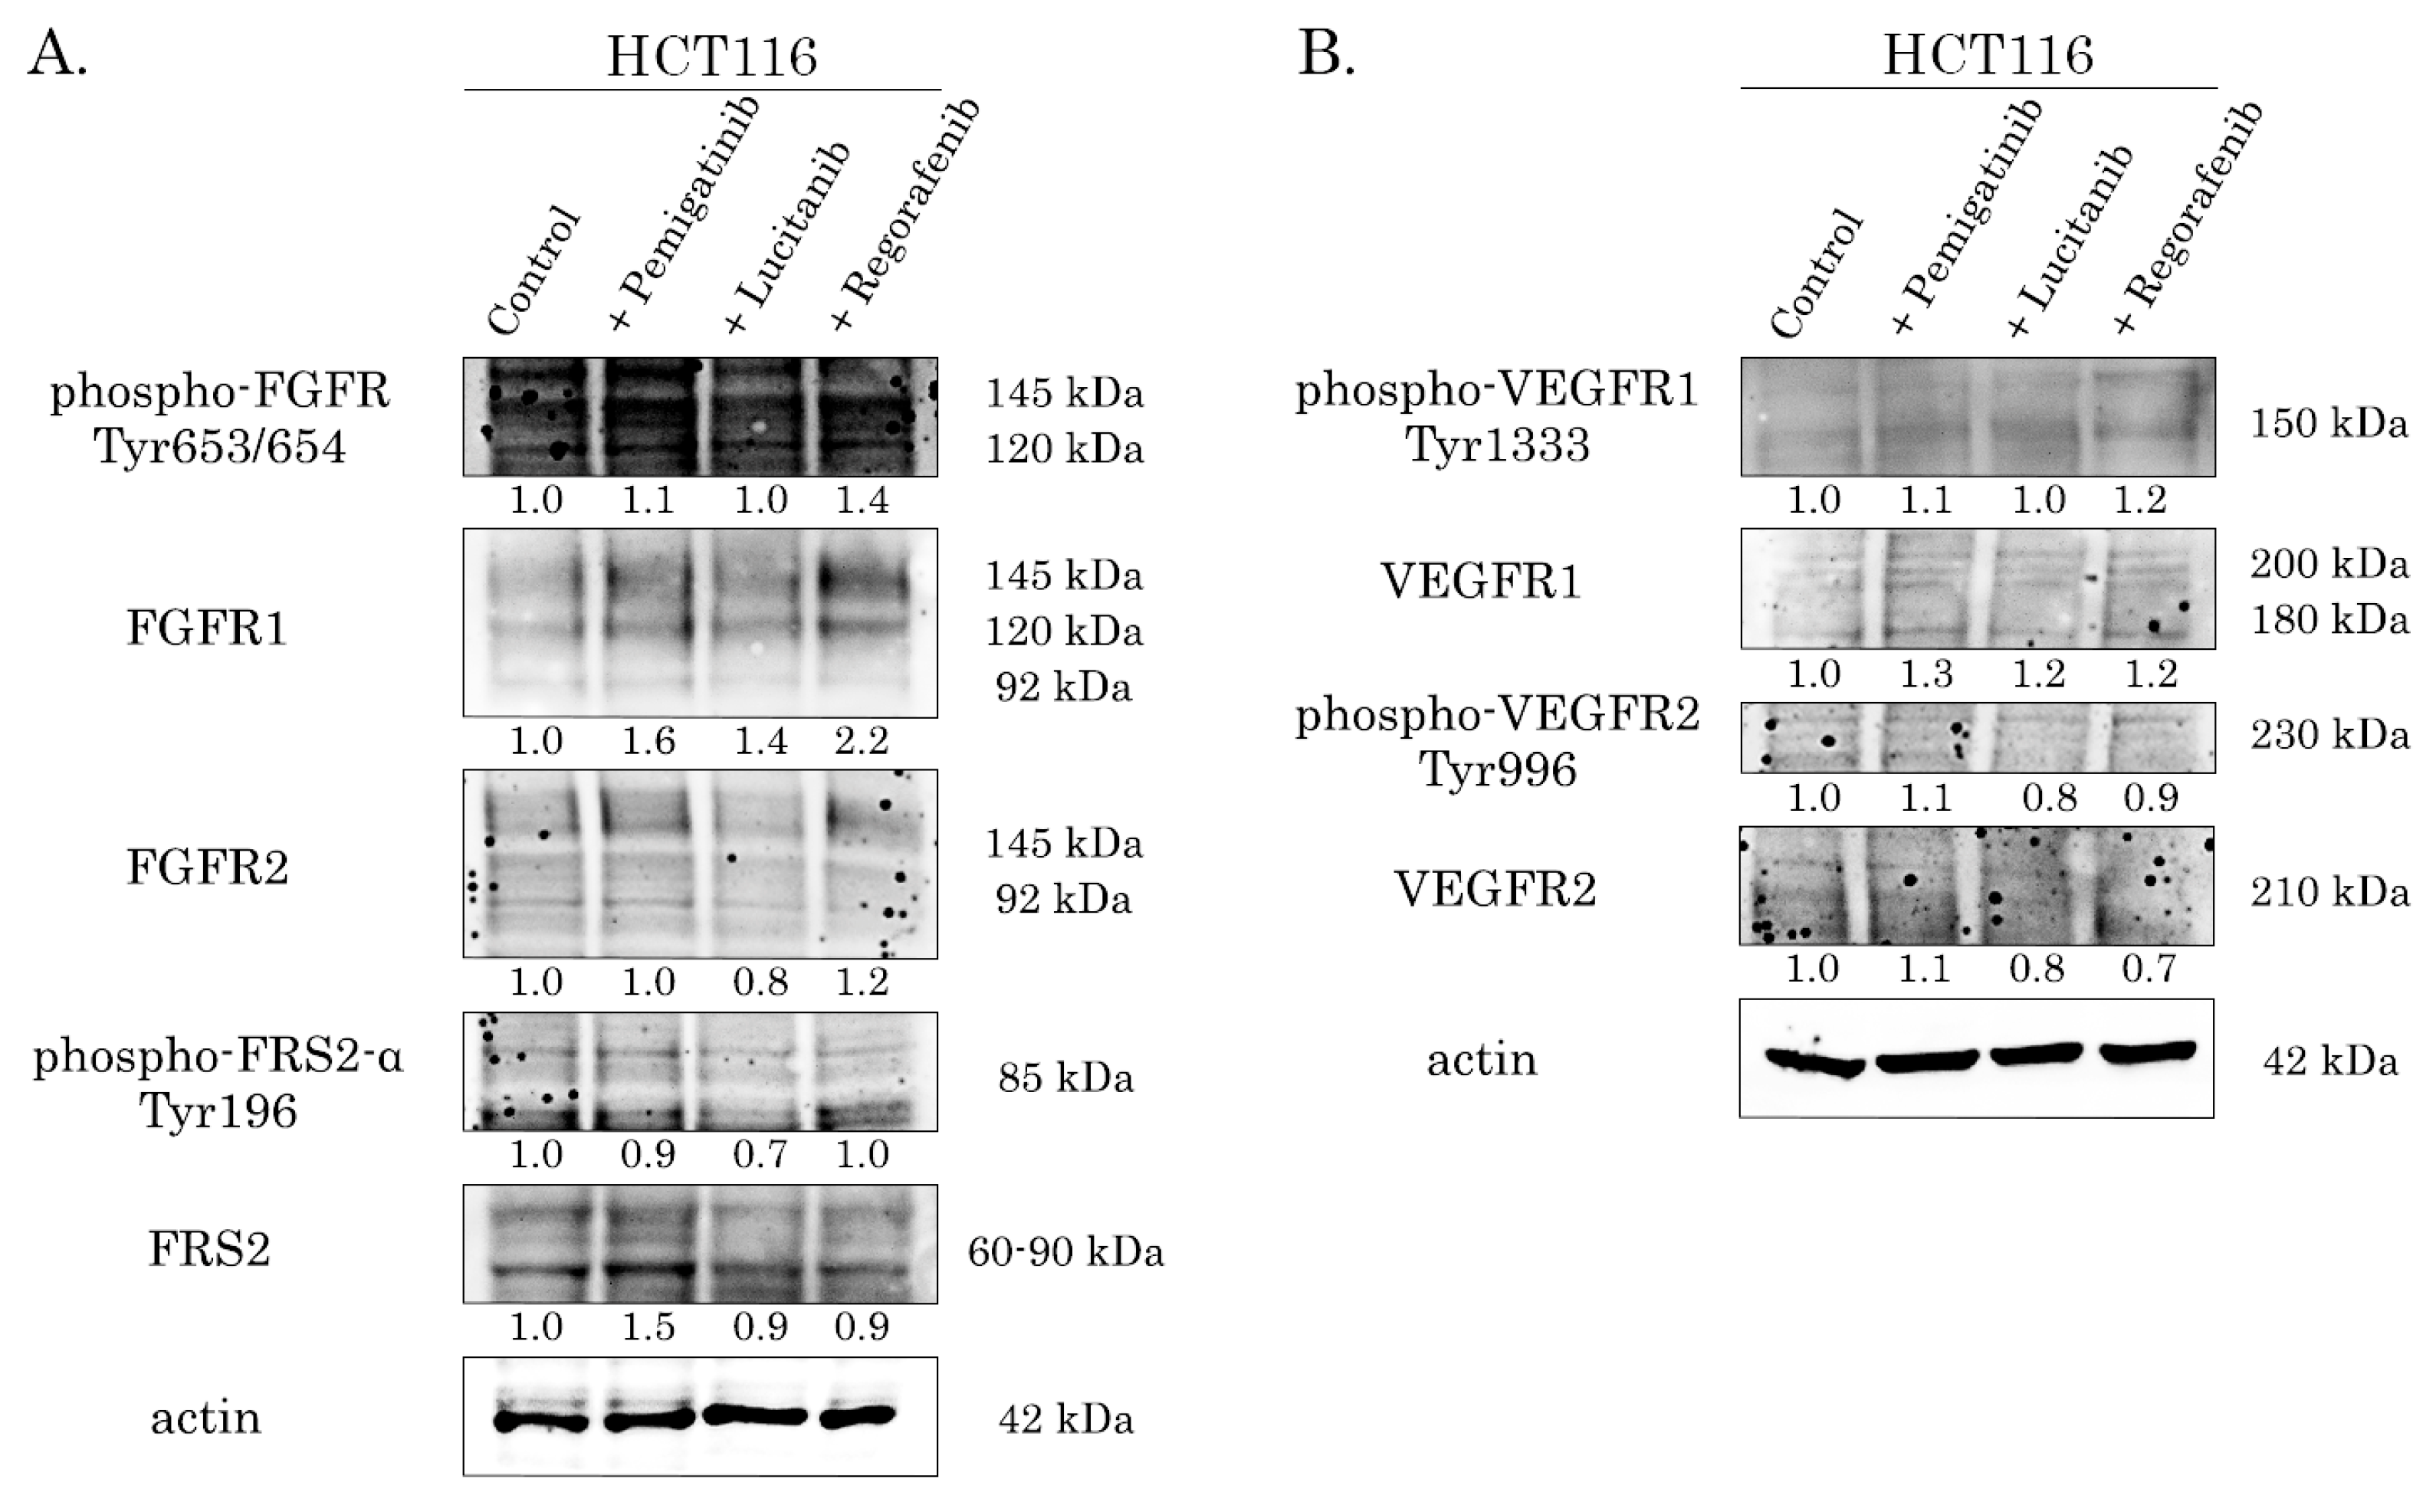
Figure 9.
The expression of ABC transporters (MDR1, MRP-1, and BCRP1) in Colon-26, HCT116, and RKO colorectal cancer cells. Chemoresistant SaOS-2 (e.g., SaOS-2 DoxR) osteosarcoma cells and HCC1806 triple-negative breast cancer cells (HCC1806 Tx-R) were used as positive controls for elevated ABC-transporter levels, whereas their parental cell lines (SaOS-2 and HCC1806) served as negative controls. Actin stain was used as a marker for equal protein loading.
Figure 9.
The expression of ABC transporters (MDR1, MRP-1, and BCRP1) in Colon-26, HCT116, and RKO colorectal cancer cells. Chemoresistant SaOS-2 (e.g., SaOS-2 DoxR) osteosarcoma cells and HCC1806 triple-negative breast cancer cells (HCC1806 Tx-R) were used as positive controls for elevated ABC-transporter levels, whereas their parental cell lines (SaOS-2 and HCC1806) served as negative controls. Actin stain was used as a marker for equal protein loading.
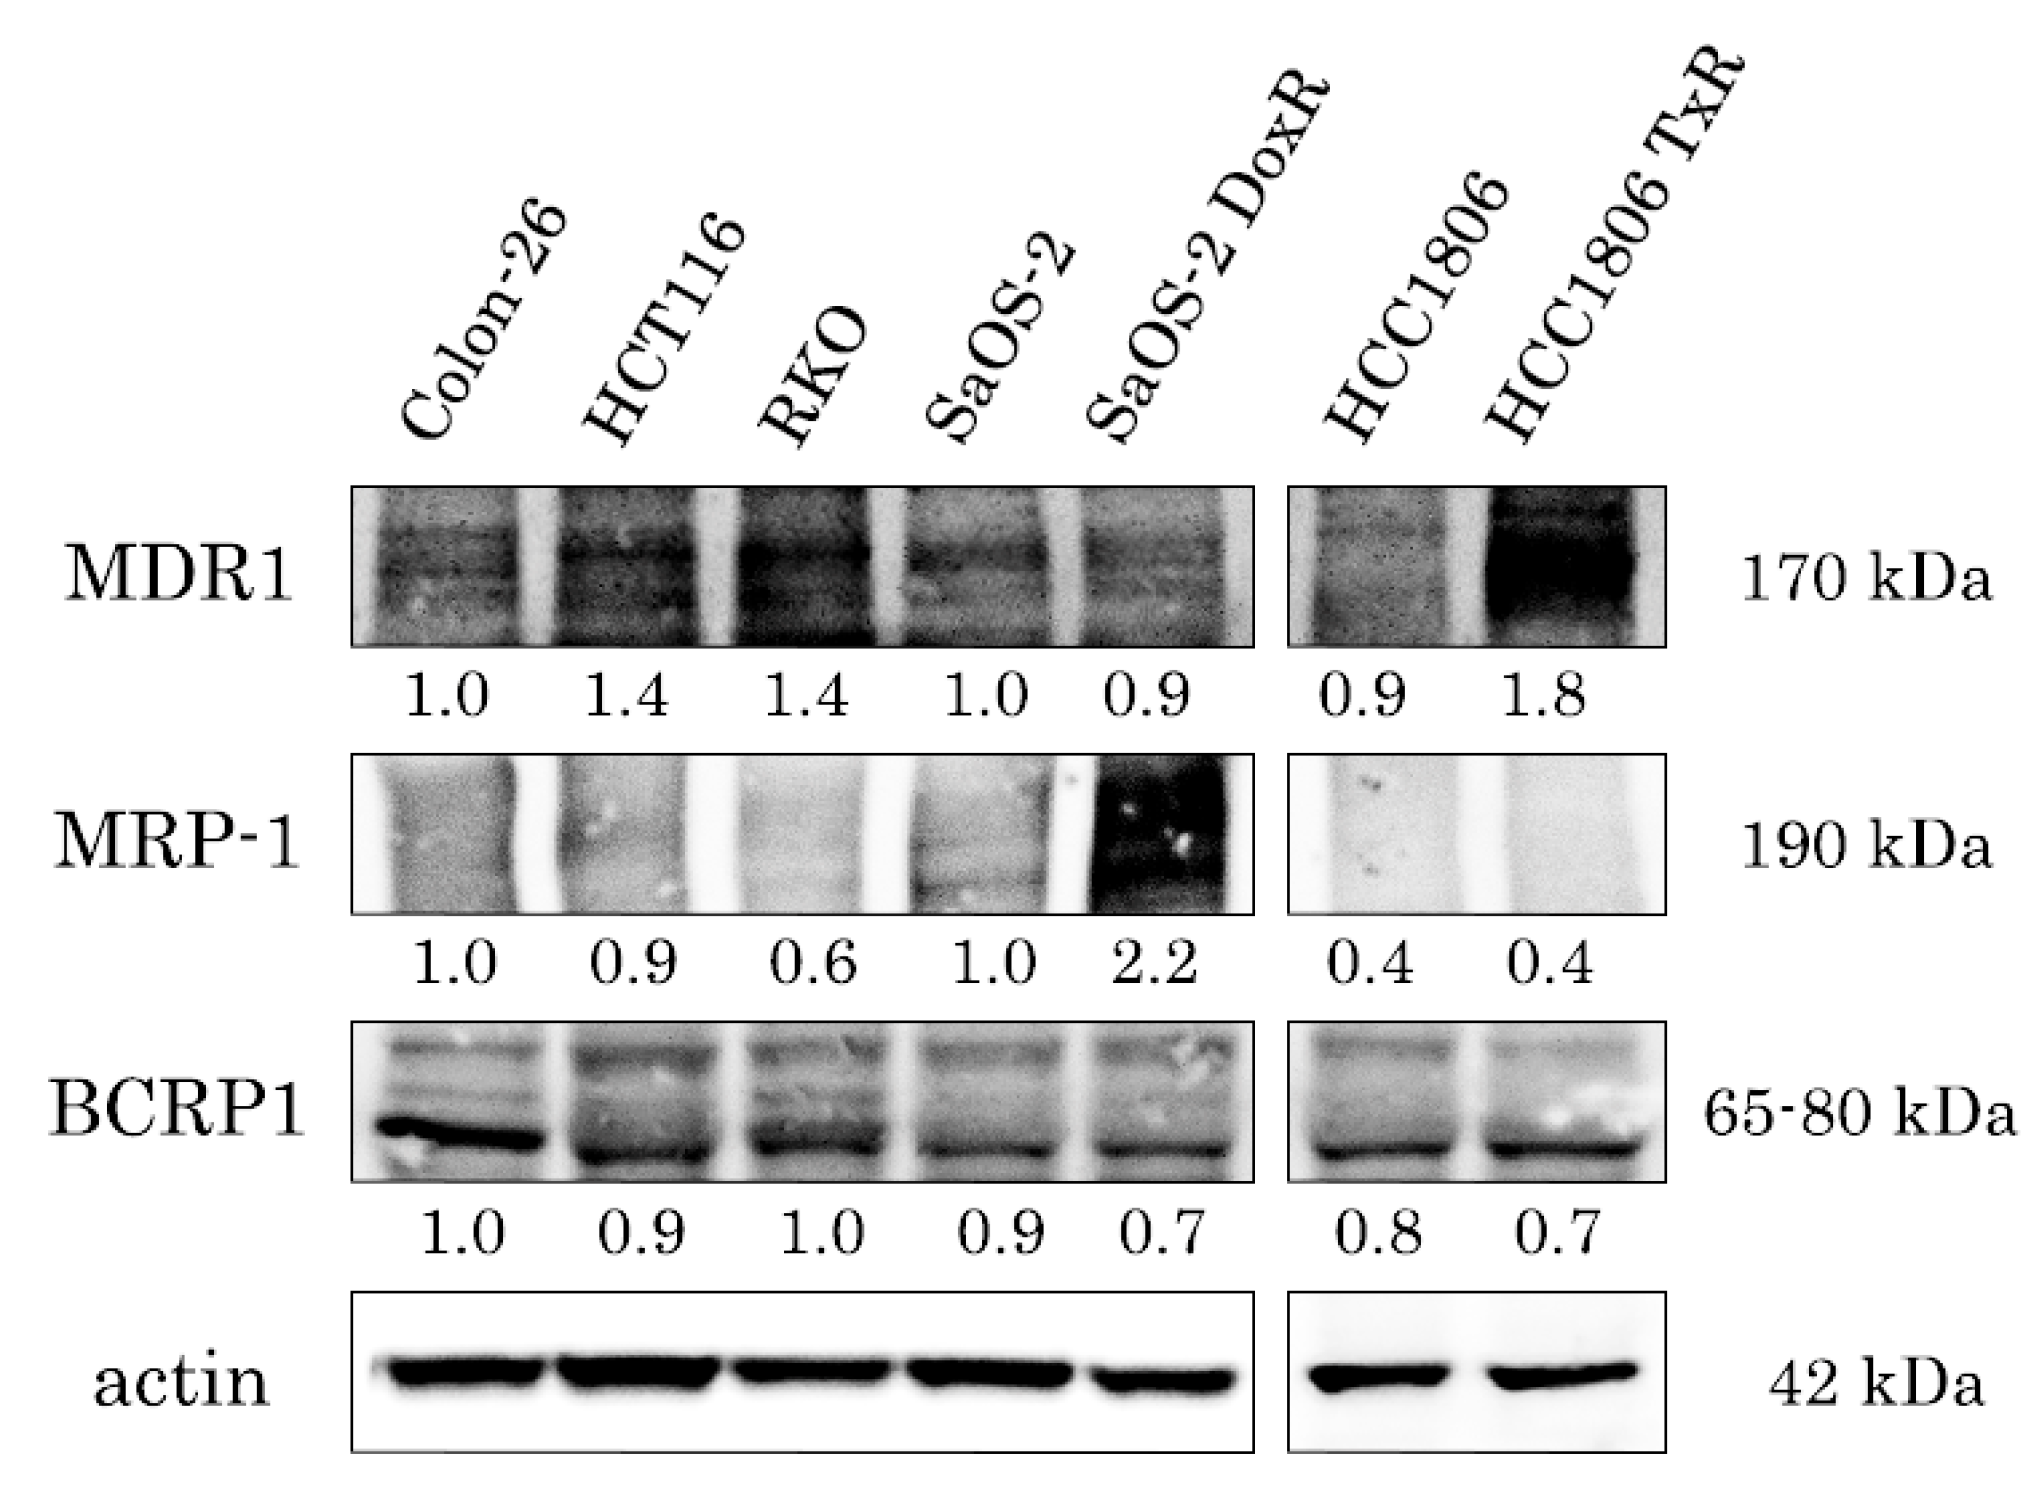
Figure 10.
Expression of ABC transporters in HCT116 and Colon-26 colon cancer cells treated with RTKI. Western blot data show no effect of RTKI (e.g., Infigratinib, Cabozantinib, Pemigatinib, Lucitanib, or Regorafenib) on the expression of MDR-related proteins (MDR1, MRP-1, and BCRP1) in HCT116 and Colon-26 cells treated with the aforementioned RTKIs (10 µM) for 72 h. Actin stain was used as a loading control.
Figure 10.
Expression of ABC transporters in HCT116 and Colon-26 colon cancer cells treated with RTKI. Western blot data show no effect of RTKI (e.g., Infigratinib, Cabozantinib, Pemigatinib, Lucitanib, or Regorafenib) on the expression of MDR-related proteins (MDR1, MRP-1, and BCRP1) in HCT116 and Colon-26 cells treated with the aforementioned RTKIs (10 µM) for 72 h. Actin stain was used as a loading control.
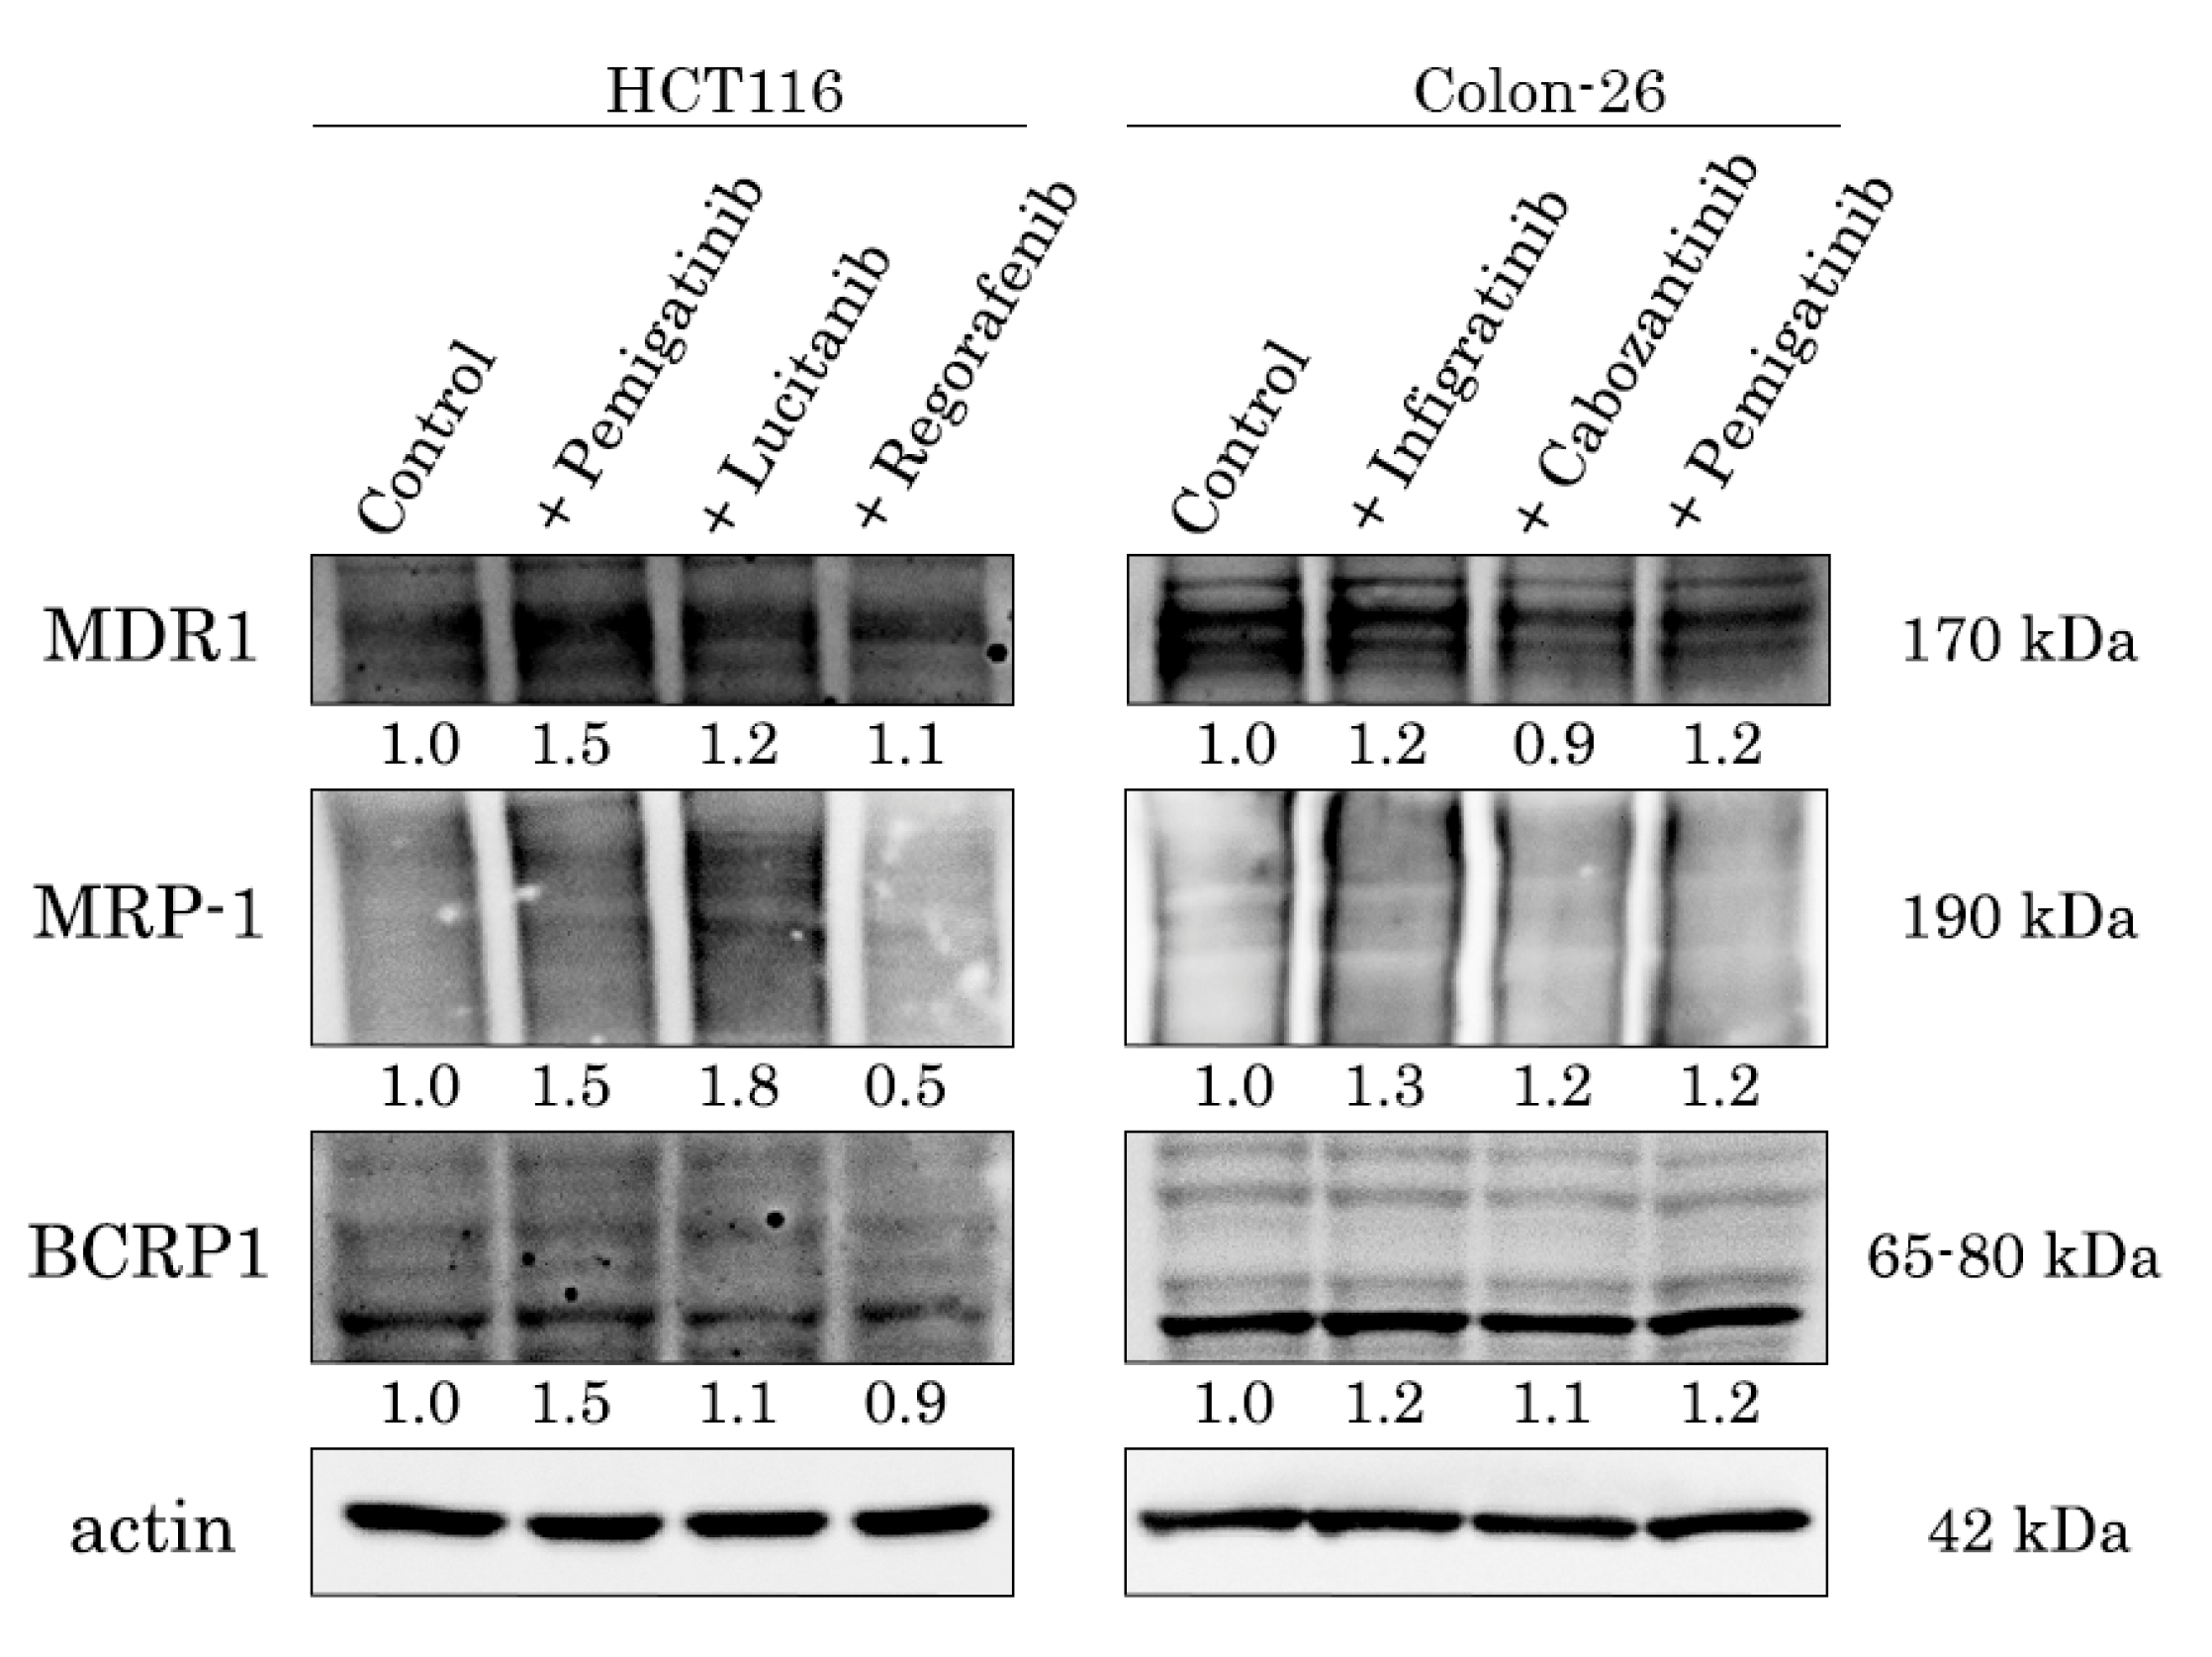
Figure 11.
RTKIs did not influence the subcellular localization of MDR1 (A), MRP-1 (B), and BCRP1 (C) in HCT116 cells. Representative immunofluorescence images of HCT116 cancer cells incubated with DMSO (control) or Pemigatinib, Lucitanib, and Regorafenib at 10 µM for 24 h are shown. Cell nuclei were outlined by staining with DAPI. Magnification 100x, scale bars 20 μm.
Figure 11.
RTKIs did not influence the subcellular localization of MDR1 (A), MRP-1 (B), and BCRP1 (C) in HCT116 cells. Representative immunofluorescence images of HCT116 cancer cells incubated with DMSO (control) or Pemigatinib, Lucitanib, and Regorafenib at 10 µM for 24 h are shown. Cell nuclei were outlined by staining with DAPI. Magnification 100x, scale bars 20 μm.
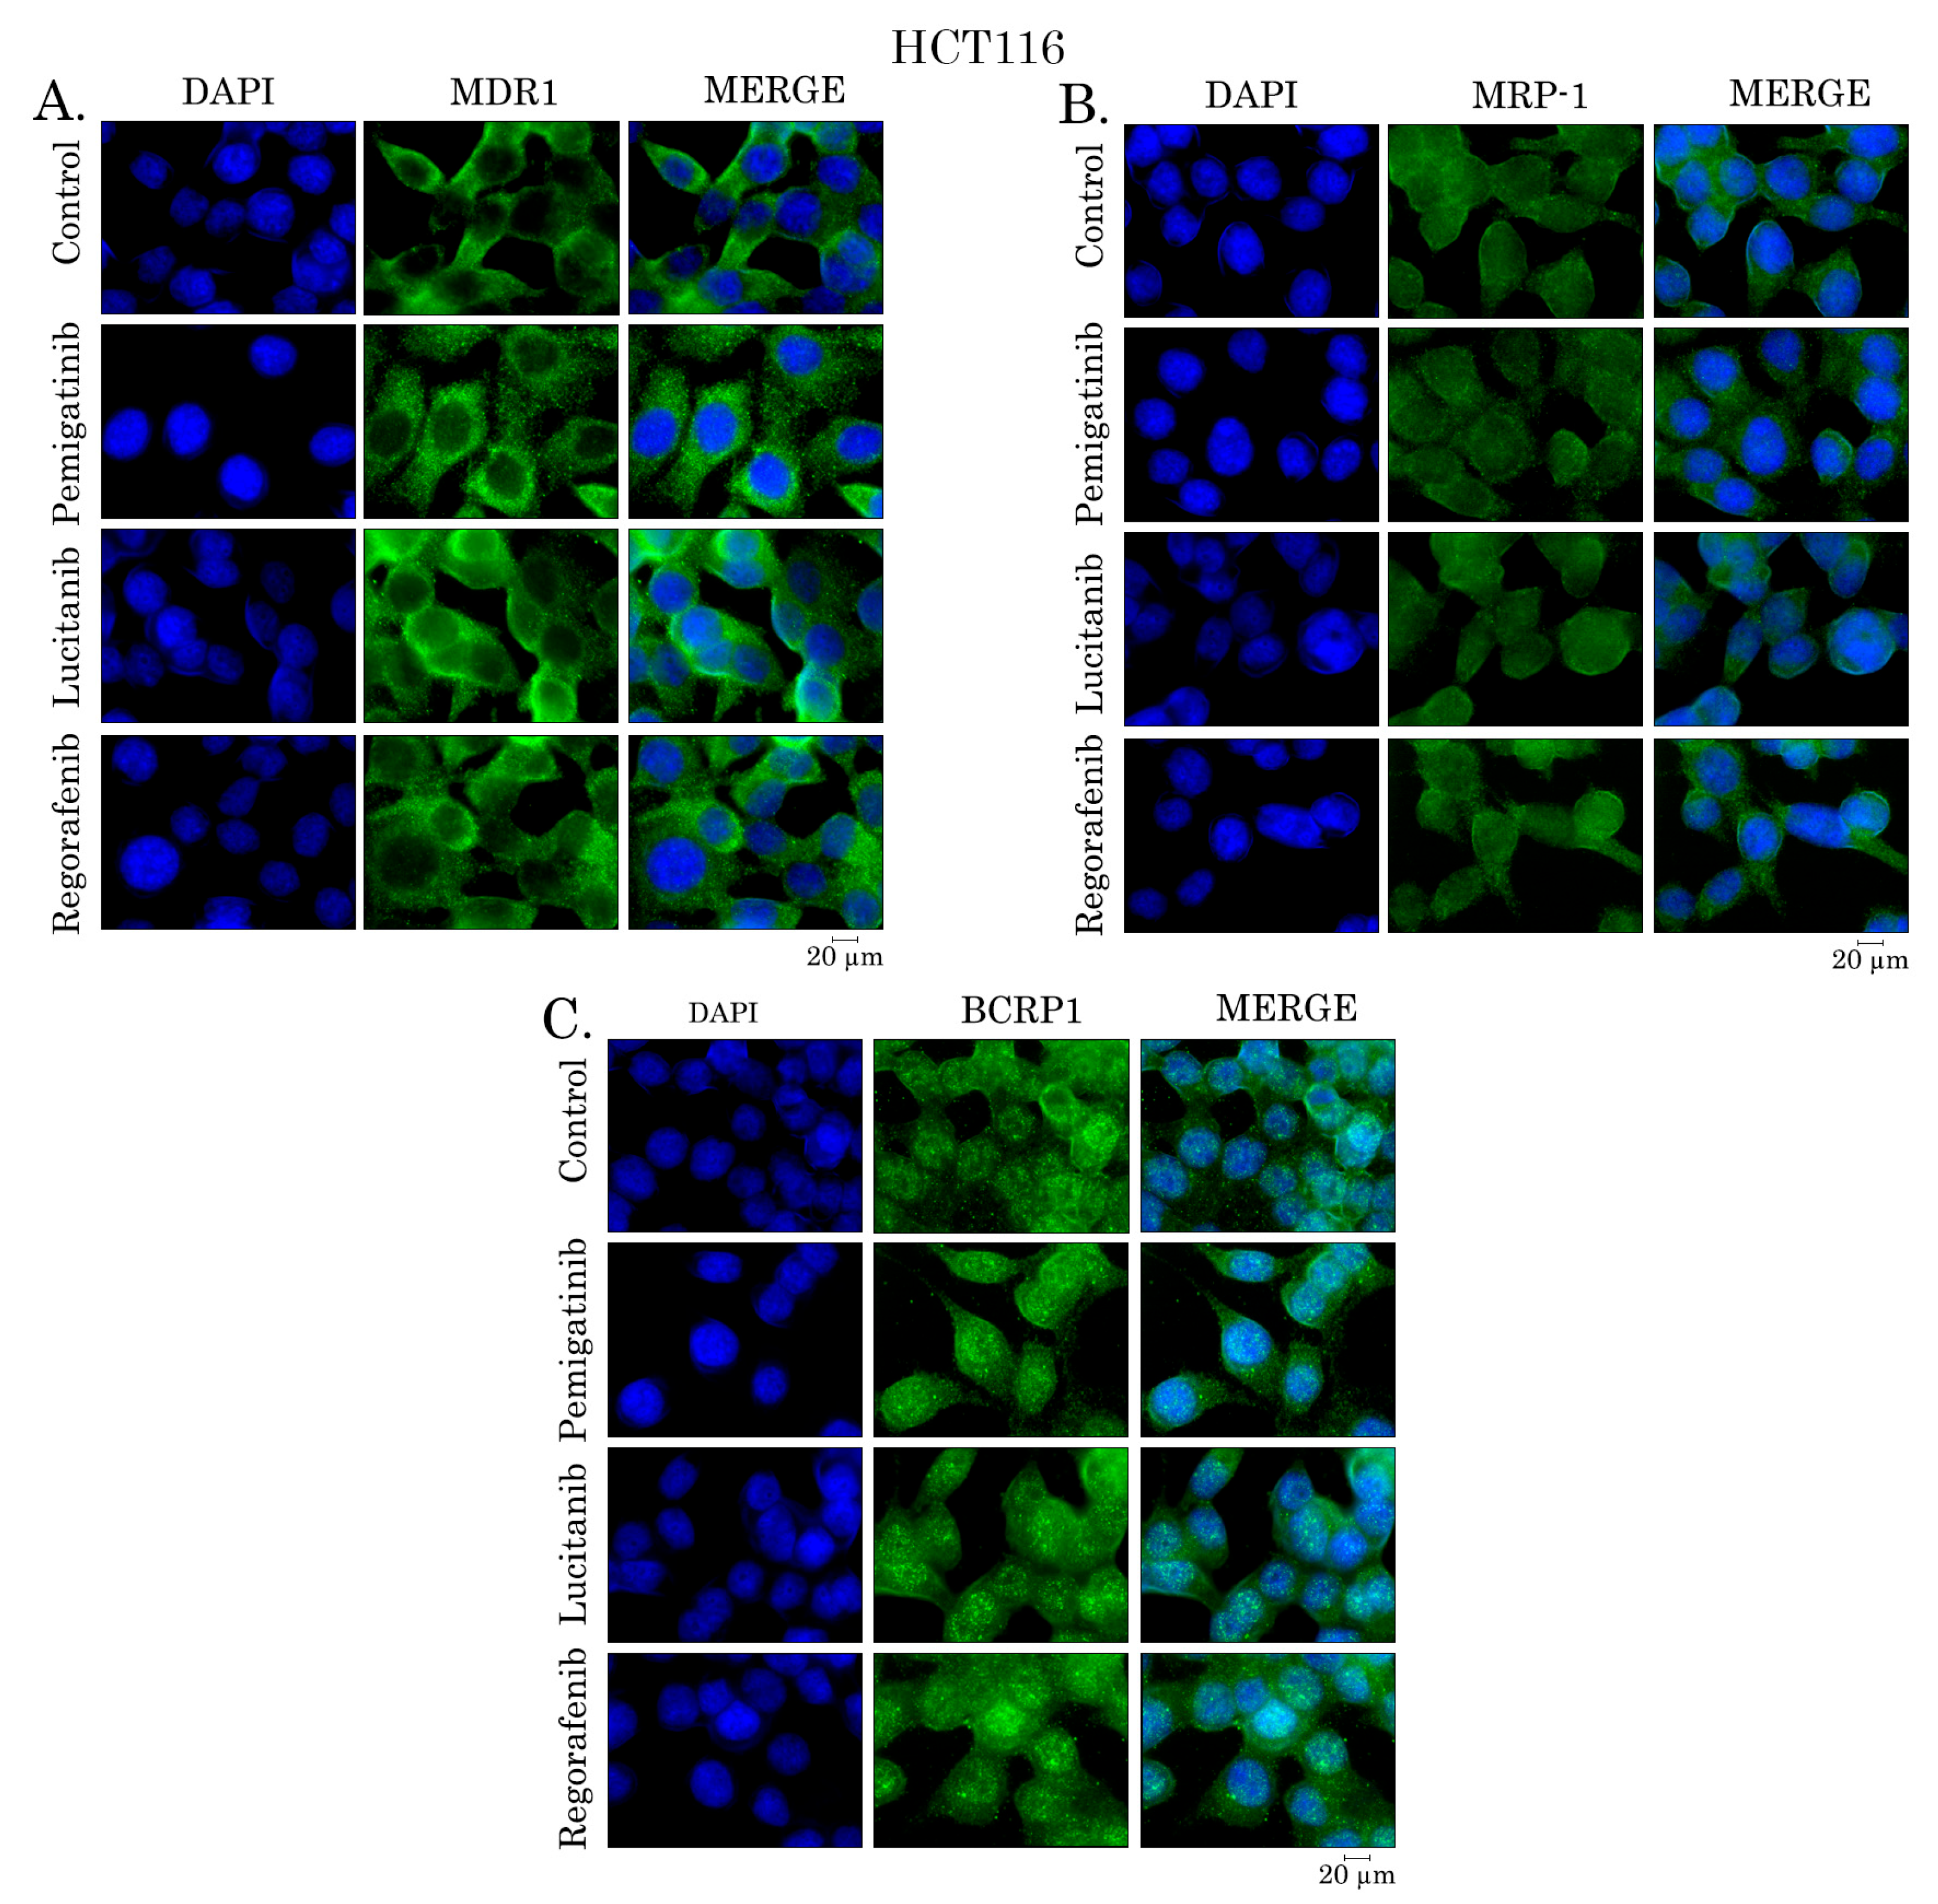
Figure 12.
RTKIs increase the intracellular accumulation of Doxorubicin in HCT116 (A) and Colon-26 (B) cancer cell lines. The intracellular accumulation of Doxorubicin in combination with ABC transporters inhibitors (Tariquidar, Ko-143, and Mk-571) and RTKIs (Pemigatinib, Lucitanib, and Regorafenib for HCT116 cells and Infigratinib, Cabozantinib for Colon-26 cells). The cells were treated with 40 µM of Doxorubicin alone or with pre- and post-incubation with 20 µM of the aforementioned inhibitors. Representative histograms of at least 3 independent experiments are shown.
Figure 12.
RTKIs increase the intracellular accumulation of Doxorubicin in HCT116 (A) and Colon-26 (B) cancer cell lines. The intracellular accumulation of Doxorubicin in combination with ABC transporters inhibitors (Tariquidar, Ko-143, and Mk-571) and RTKIs (Pemigatinib, Lucitanib, and Regorafenib for HCT116 cells and Infigratinib, Cabozantinib for Colon-26 cells). The cells were treated with 40 µM of Doxorubicin alone or with pre- and post-incubation with 20 µM of the aforementioned inhibitors. Representative histograms of at least 3 independent experiments are shown.
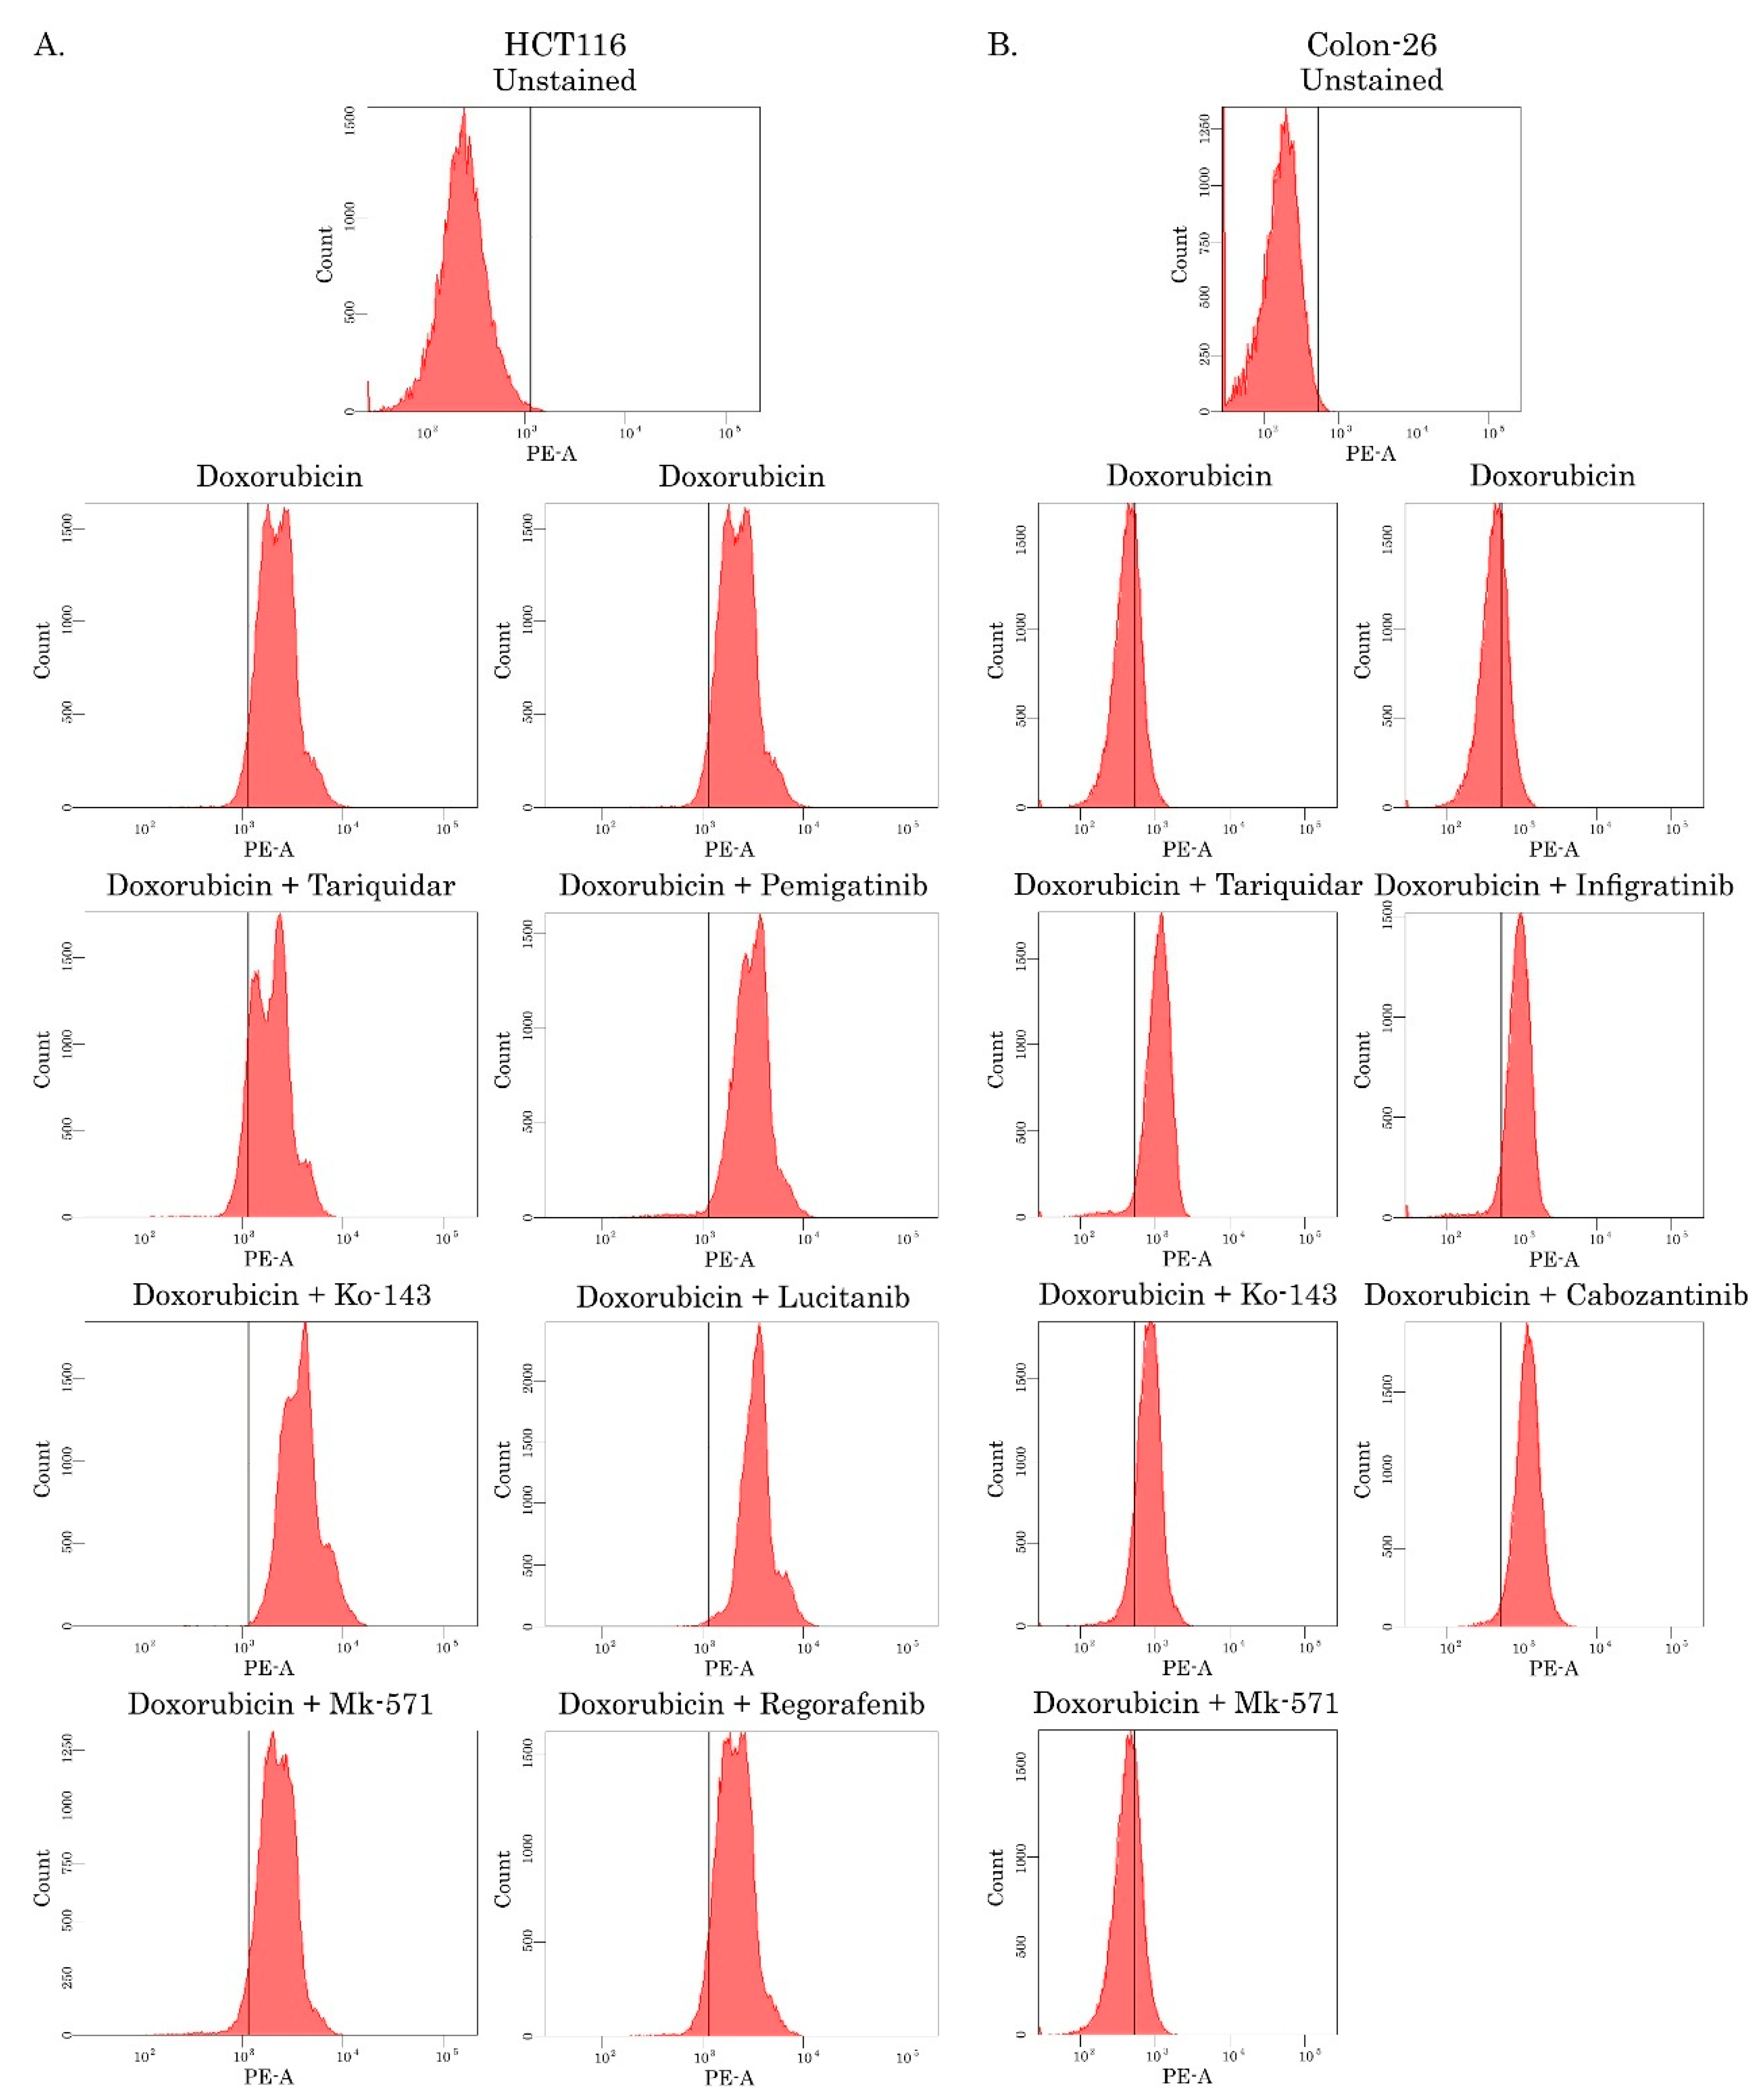
Figure 13.
Antitumor effect of the combination (Infigratinib and Doxorubicin) on an allograft tumor model. After the subcutaneous inoculation of Colon-26 cells (day 14), Balb-c mice were randomized into four groups (n = 4). They administered i.p. 100 μL of vehicle (negative control), Infigratinib (10 mg/kg), Doxorubicin (10 mg/kg), or a combination 3 times a week for 3 weeks. Tumor volume (A) and tumor weight (B) of Colon-26 allografts at the end point of the experiment (3 weeks post-treatment) for each experimental group. (C) Changes in tumor tissue morphology in mice treated with the combination of Infigratinib and Doxorubicin. Hematoxylin and eosin staining (H&E) (20x) (upper panel) and immunohistochemical detection (40x) of the cleaved caspase-3 apoptotic marker (middle panel) and the Ki-67 proliferative marker (bottom panel) in Colon-26 allografts obtained from mice of the control group and mice treated with Infigratinib, Doxorubicin, and their combination.
Figure 13.
Antitumor effect of the combination (Infigratinib and Doxorubicin) on an allograft tumor model. After the subcutaneous inoculation of Colon-26 cells (day 14), Balb-c mice were randomized into four groups (n = 4). They administered i.p. 100 μL of vehicle (negative control), Infigratinib (10 mg/kg), Doxorubicin (10 mg/kg), or a combination 3 times a week for 3 weeks. Tumor volume (A) and tumor weight (B) of Colon-26 allografts at the end point of the experiment (3 weeks post-treatment) for each experimental group. (C) Changes in tumor tissue morphology in mice treated with the combination of Infigratinib and Doxorubicin. Hematoxylin and eosin staining (H&E) (20x) (upper panel) and immunohistochemical detection (40x) of the cleaved caspase-3 apoptotic marker (middle panel) and the Ki-67 proliferative marker (bottom panel) in Colon-26 allografts obtained from mice of the control group and mice treated with Infigratinib, Doxorubicin, and their combination.
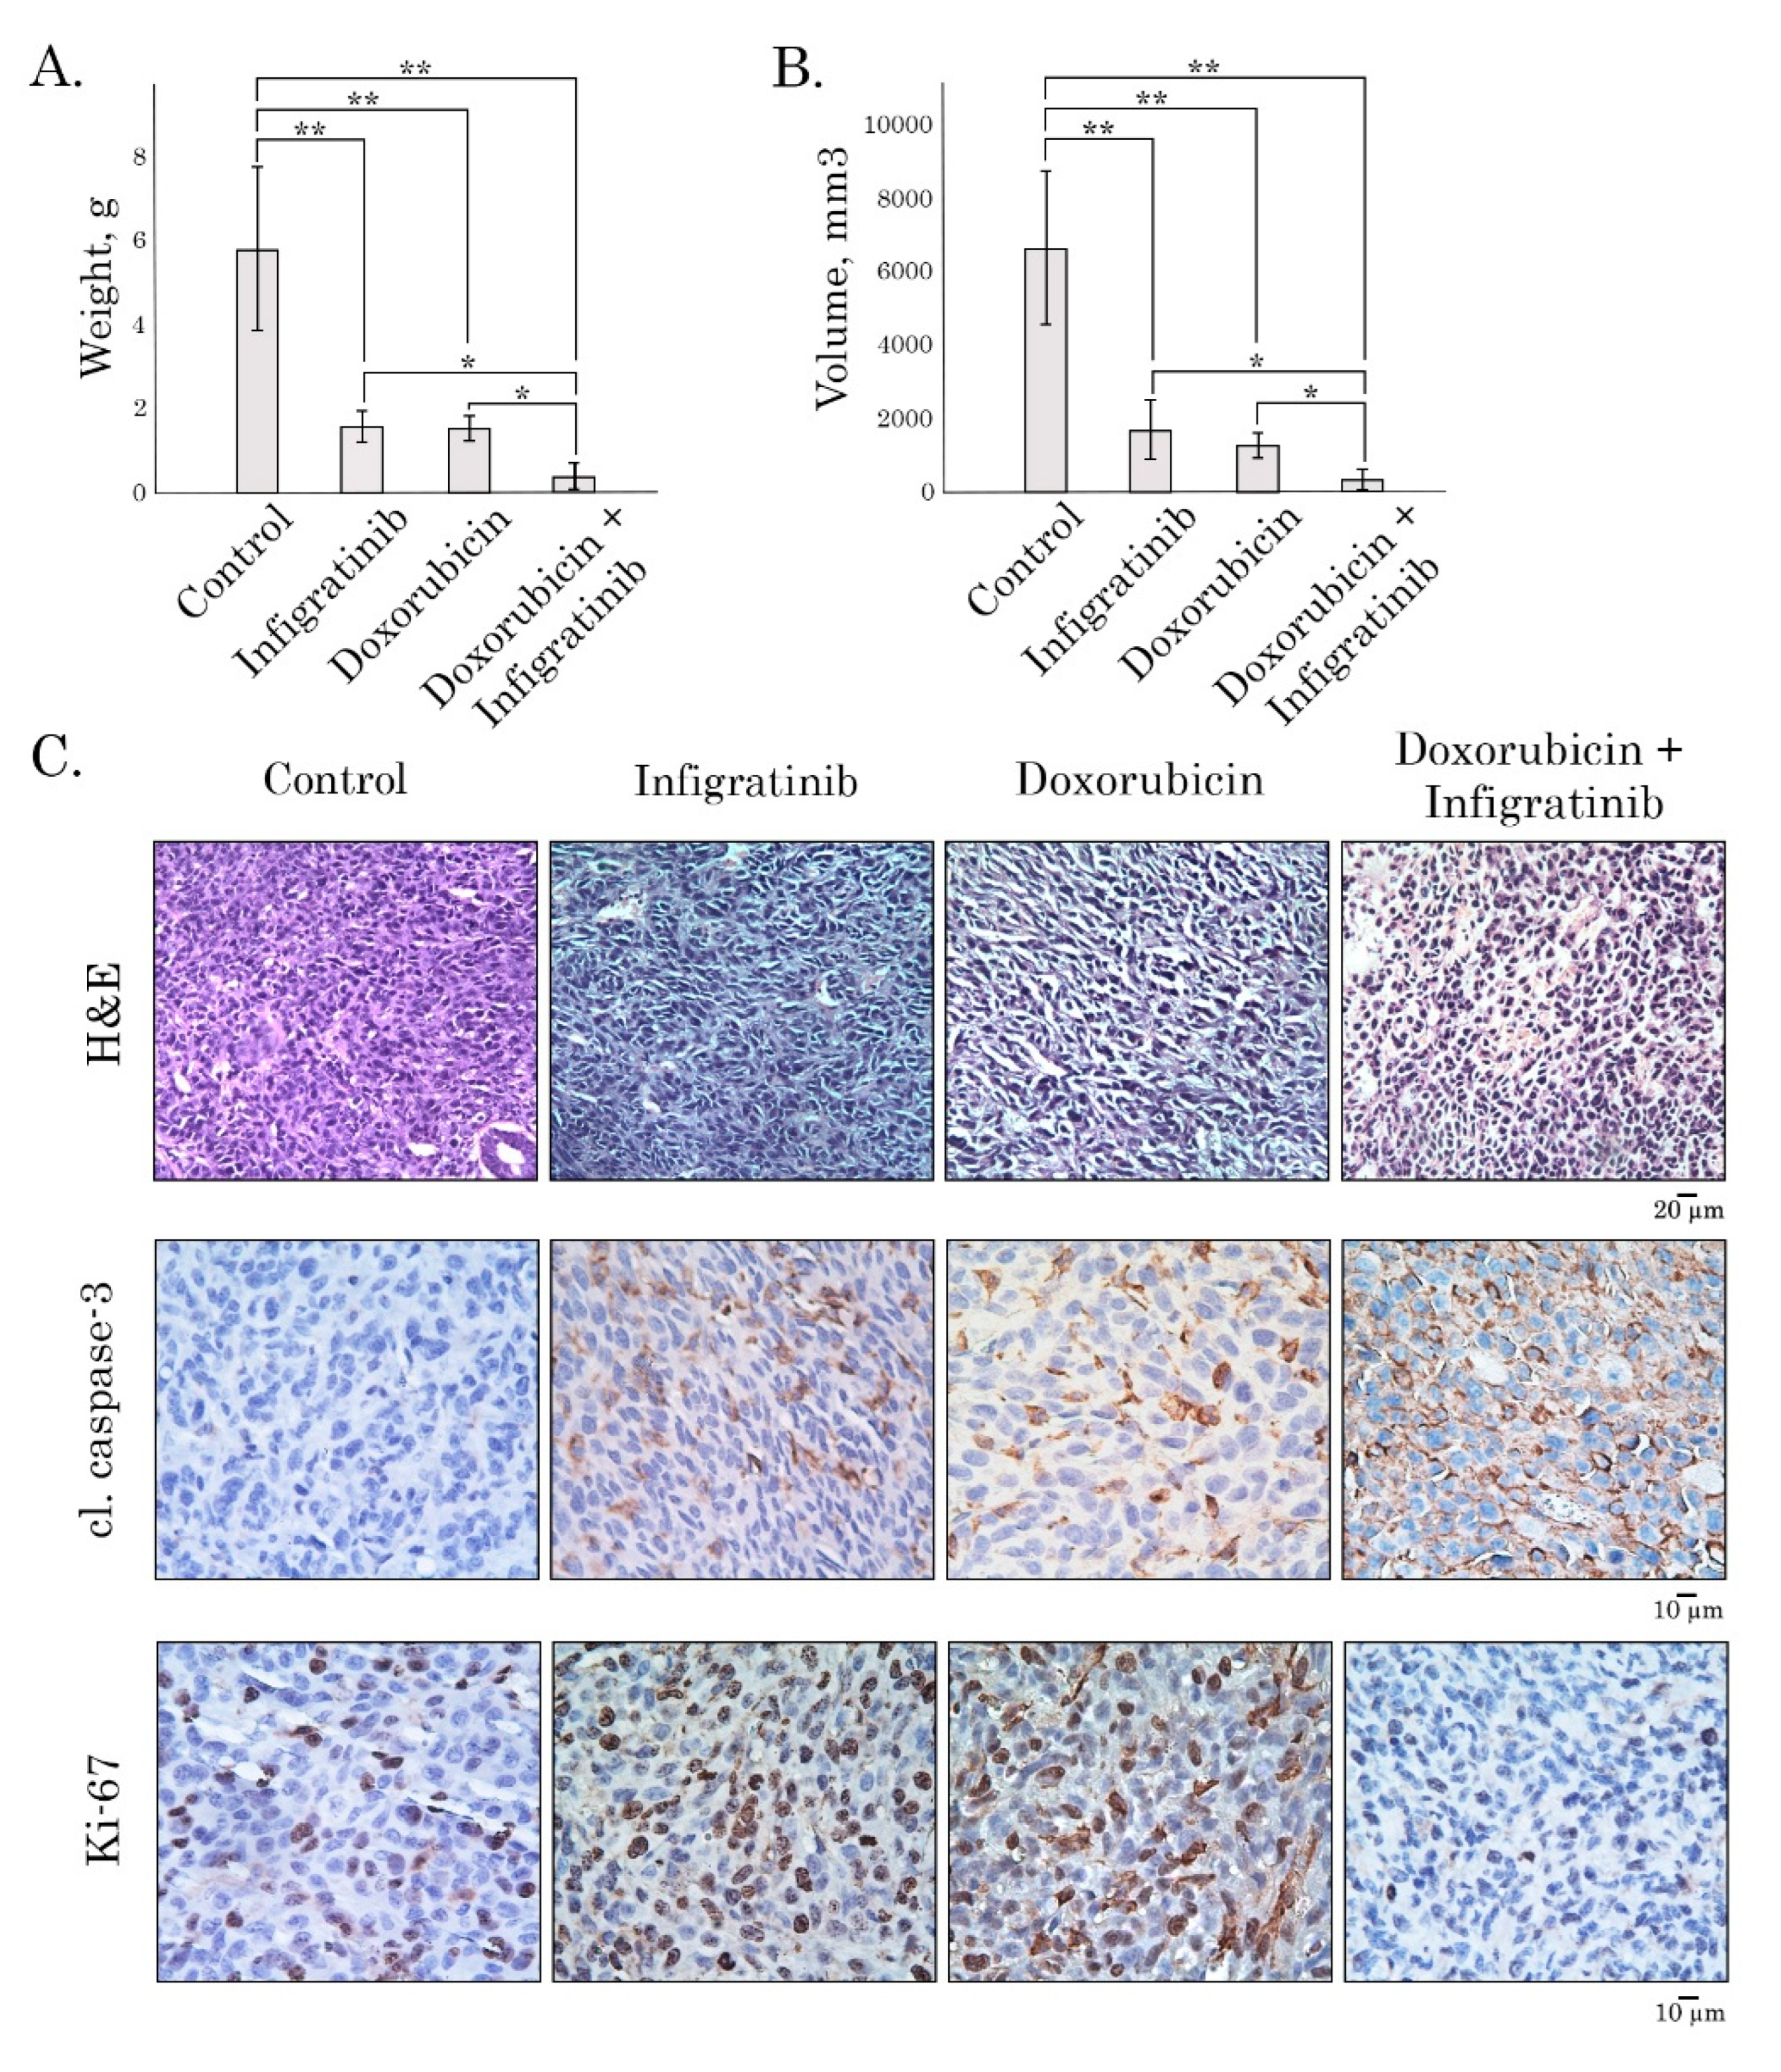
Figure 14.
The three- and two-dimensional molecular interactions of Infigratinib (A) and Cabozantinib (B) with the ABCB1 transporter.
Figure 14.
The three- and two-dimensional molecular interactions of Infigratinib (A) and Cabozantinib (B) with the ABCB1 transporter.
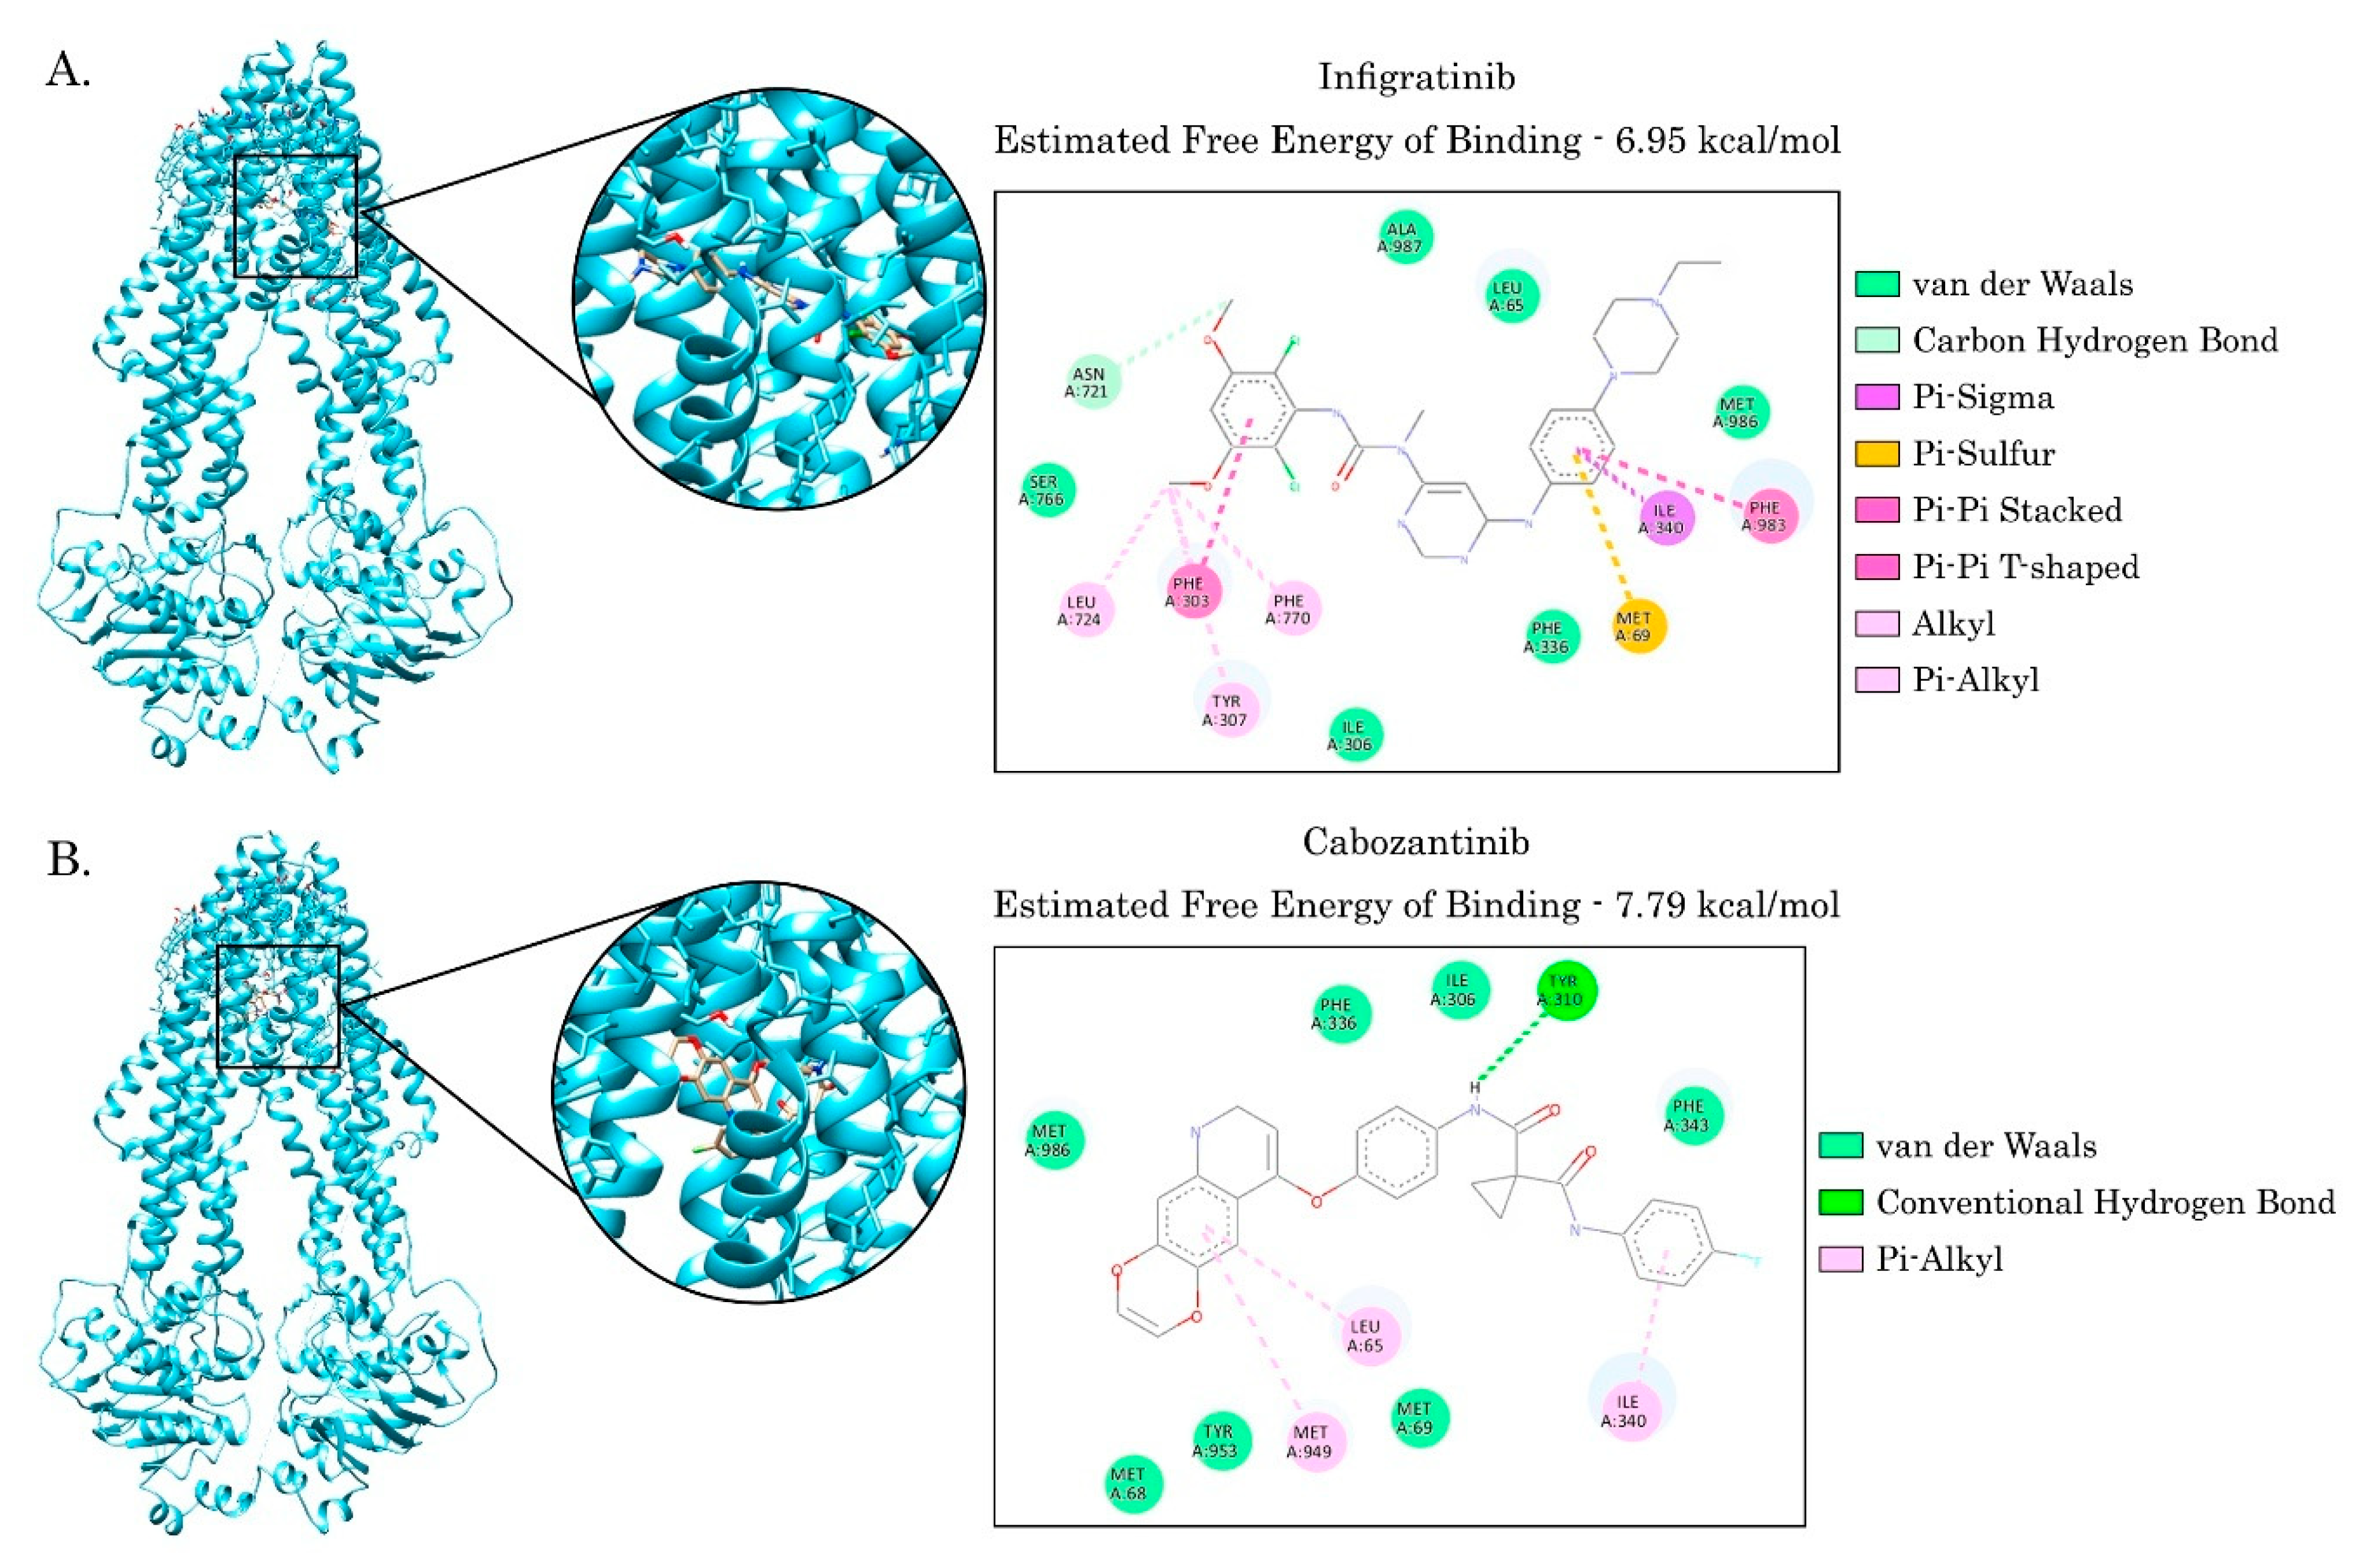
Figure 15.
The three- and two-dimensional molecular interactions of Cabozantinib (A), Lucitanib (B), and Pemigatib (C) with the ABCG2 transporter.
Figure 15.
The three- and two-dimensional molecular interactions of Cabozantinib (A), Lucitanib (B), and Pemigatib (C) with the ABCG2 transporter.
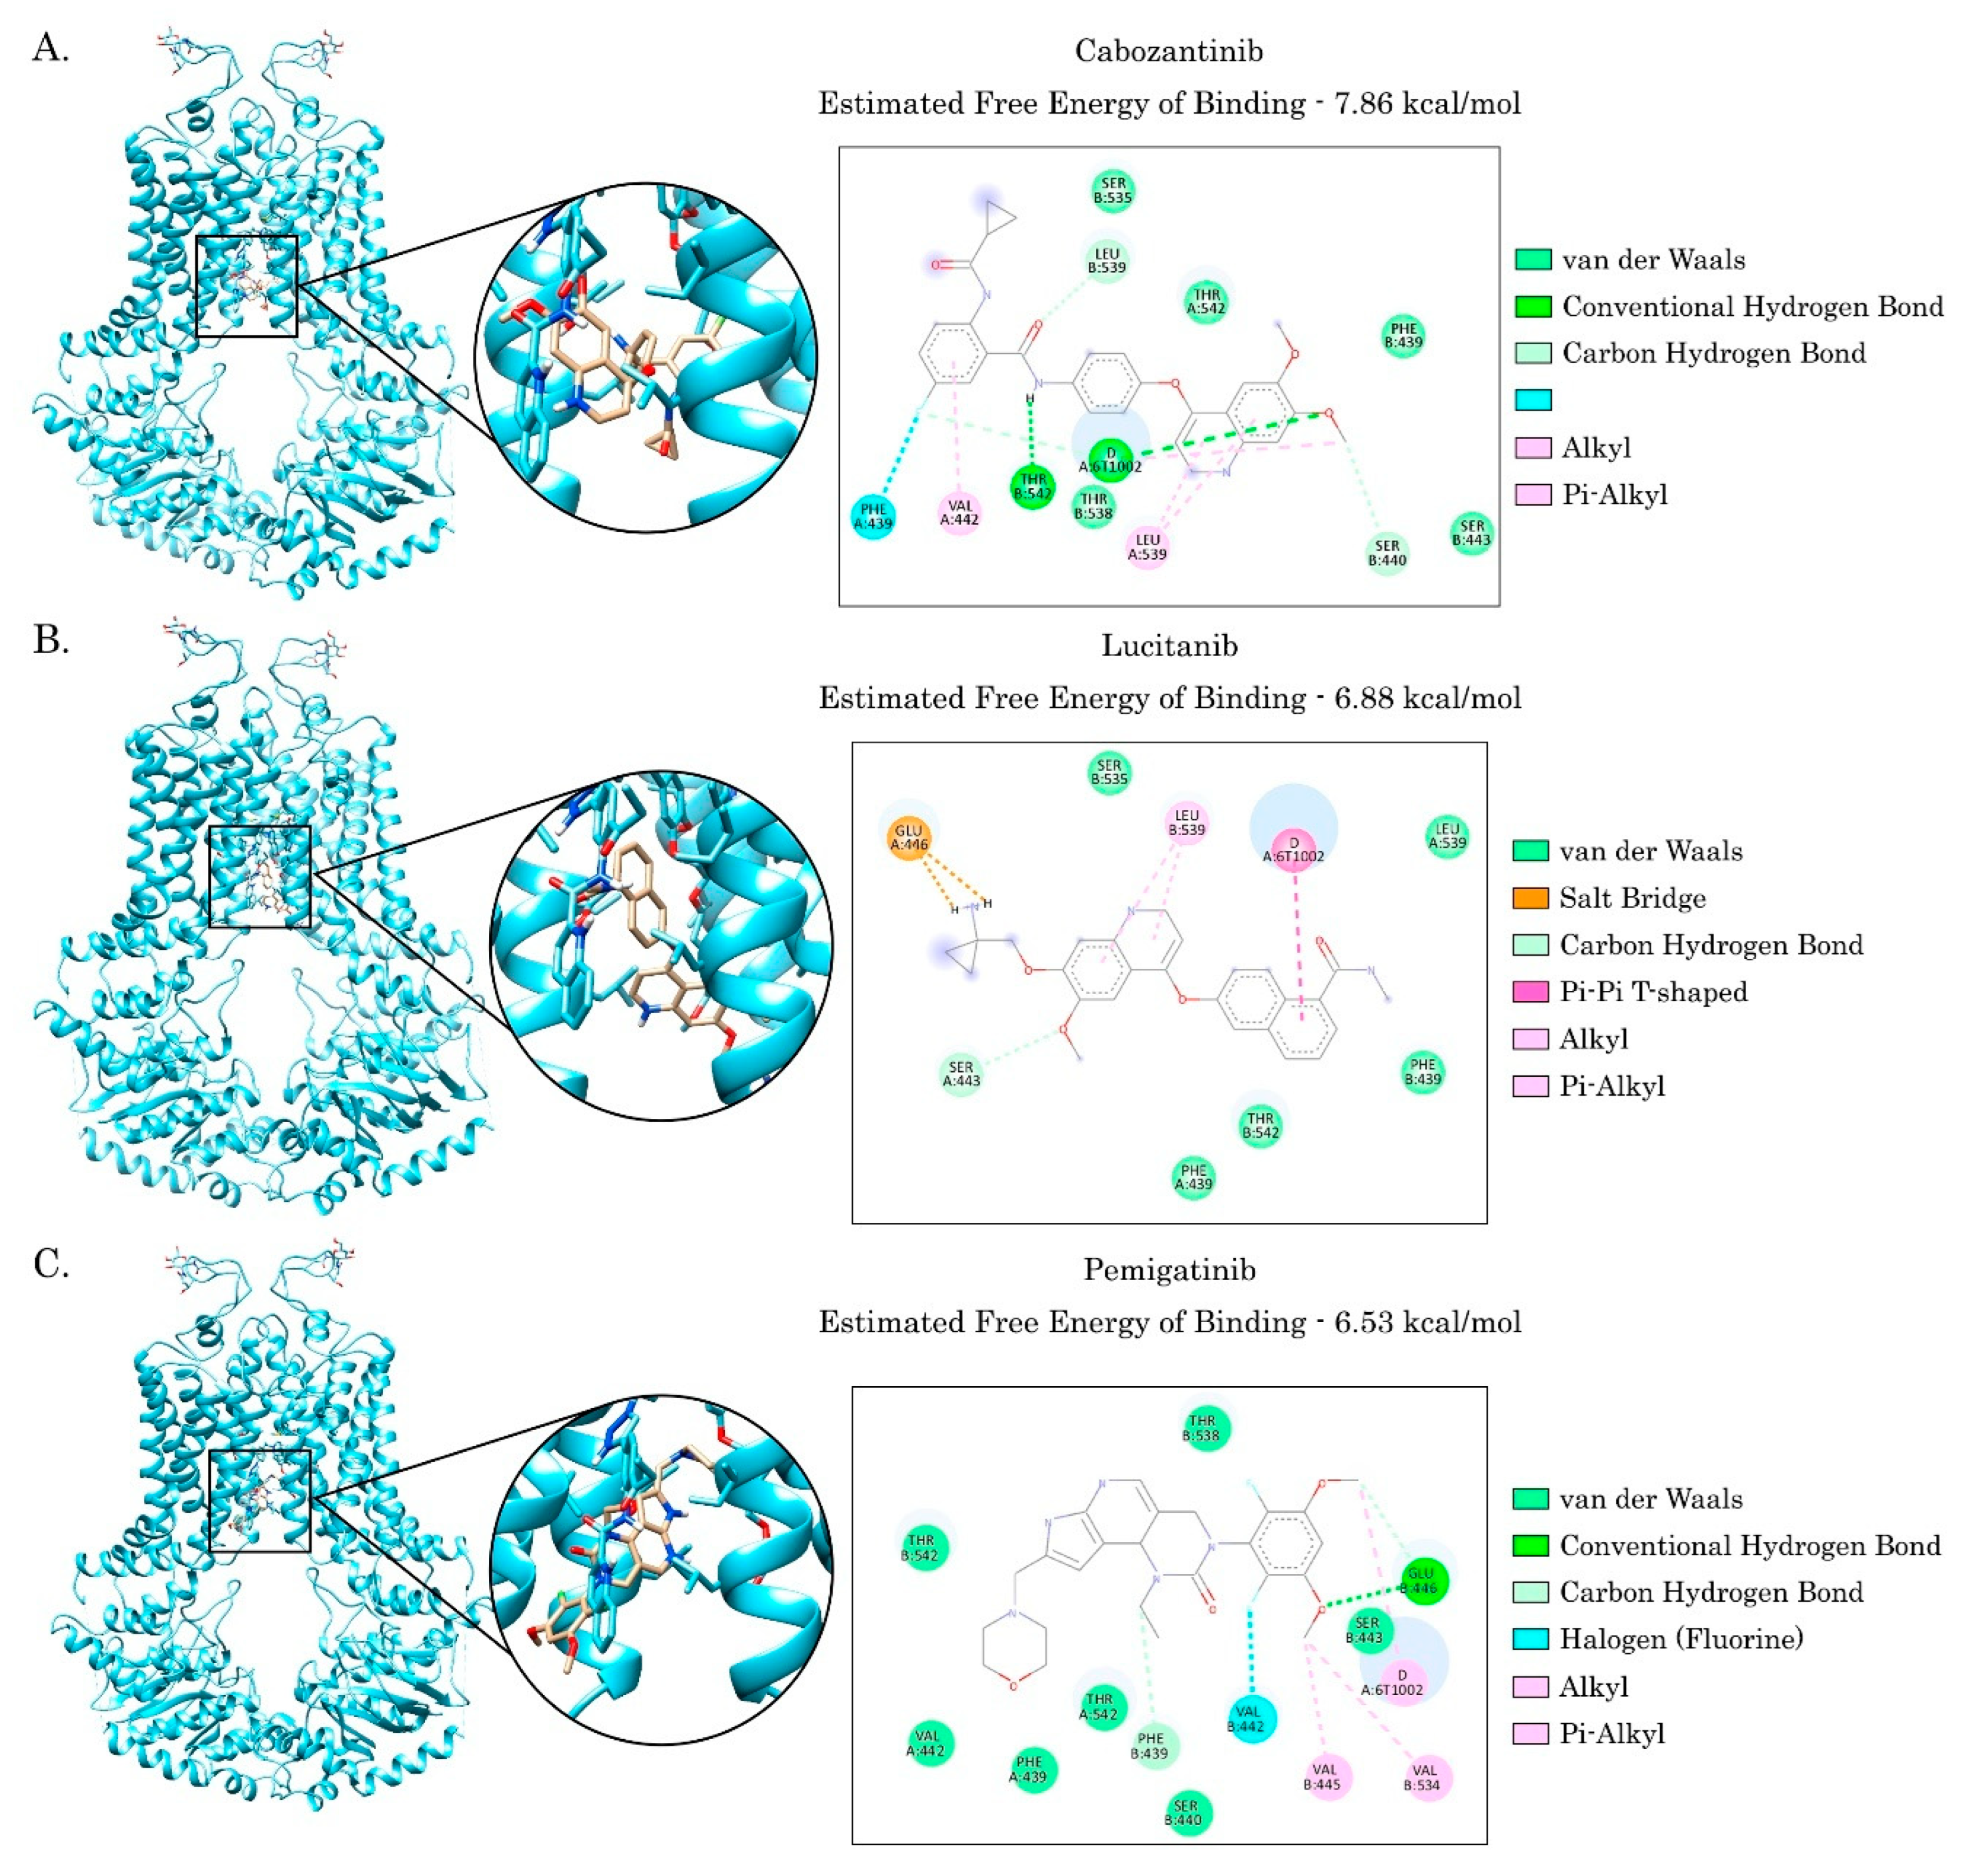

Table 1.
Combined therapy with 10 µM RTKI decreases the IC50 values for Doxorubicin and 5-Fluorouracil in CRC cell lines. IC50 (µM) for Doxorubicin, 5-Fluorouracil and receptor tyrosine kinase inhibitors alone and in combination.
Table 1.
Combined therapy with 10 µM RTKI decreases the IC50 values for Doxorubicin and 5-Fluorouracil in CRC cell lines. IC50 (µM) for Doxorubicin, 5-Fluorouracil and receptor tyrosine kinase inhibitors alone and in combination.
| Colon-26 | HCT116 | RKO | |||||||
| — | Doxorubicin | 5-Fluorouracil | — | Doxorubicin | 5-Fluorouracil | — | Doxorubicin | 5-Fluorouracil | |
| — | — | 9.83 ± 1.04 | 0.70 ± 0.15 | — | 1.14 ± 0.14 | 3.33 ± 0.24 | — | < 0.5 | 3.78 ± 0.38 |
| Selective inhibitors of the FGFR signaling pathway | |||||||||
| Infigratinib | > 100 | < 0.5 | < 0.5 | 12.15 ± 0.41 | < 0.5 | 1.47 ± 0.24 | 5.99 ± 0.23 | < 0.5 | < 0.5 |
| Pemigatinib | > 100 | < 0.5 | < 0.5 | 35.58 ± 5.64 | < 0.5 | < 0.5 | > 100 | < 0.5 | < 0.5 |
| Alofanib | > 100 | 24.34 ± 2.57 | < 0.5 | > 100 | 2.16 ± 0.62 | 2.47 ± 0.17 | > 100 | < 0.5 | 4.65 ± 0.72 |
| Non-selective RTKI targeting FGFR and/or VEGFR signaling pathways | |||||||||
| Lucitanib | 25.98 ± 0.88 | 4.96 ± 0.63 | < 0.5 | 17.46 ± 2.79 | < 0.5 | 3.61 ± 0.33 | 5.05 ± 0.51 | < 0.5 | < 0.5 |
| Axitinib | > 100 | 14.28 ± 1.73 | 0.84 ± 0.03 | > 100 | < 0.5 | 2.06 ± 0.35 | > 100 | < 0.5 | 3.43 ± 0.73 |
| Cabozantinib | > 100 | 1.58 ± 0.16 | 0.91 ± 0.11 | > 100 | 0.78 ± 0.43 | 1.86 ± 0.27 | 15.21 ± 1.14 | < 0.5 | < 0.5 |
| Regorafenib | > 100 | 9.08 ± 0.85 | < 0.5 | 27.95 ± 4.90 | < 0.5 | 14.46 ± 1.60 | 9.74 ± 1.88 | < 0.5 | 1.79 ± 0.68 |
| Sunitinib | 15.63 ± 1.26 | 2.89 ± 0.09 | < 0.5 | 5.36 ± 1.11 | < 0.5 | 3.58 ± 0.55 | 8.39 ± 0.57 | < 0.5 | 9.51 ± 1.16 |
Table 2.
CRC cells’ viability (%) treated with Doxorubicin, 5-Fluorouracil, or 10 µM of RTKI alone or in combination (72 h).
Table 2.
CRC cells’ viability (%) treated with Doxorubicin, 5-Fluorouracil, or 10 µM of RTKI alone or in combination (72 h).
| Colon-26 | HCT116 | RKO | |||||||
| — | Doxorubicin 1 µM |
5-Fluorouracil 1 µM |
— | Doxorubicin 2 µM |
5-Fluorouracil 4 µM |
— | Doxorubicin 1 µM |
5-Fluorouracil 2 µM |
|
| — | 100.0 ± 5.1 | 100.5 ± 5.9 | 51.4 ± 9.0 | 100.0 ± 3.6 | 87.3 ± 3.3 | 85.5 ± 1.2 | 100.0 ± 6.7 | 61.7 ± 1.3 | 97.3 ± 1.7 |
| Selective inhibitors of the FGFR signaling pathway | |||||||||
| Infigratinib | 79.4 ± 4.3 | 52.0 ± 3.2 | 30.1 ± 2.6 | 85.5 ± 2.8 | 54.6 ± 1.8 | 85.7 ± 0.5 | 85.8 ± 1.5 | 48.4 ± 0.5 | 78.9 ± 1.8 |
| Pemigatinib | 52.0 ± 3.2 | 41.7 ± 1.7 | 24.7 ± 2.7 | 95.5 ± 2.8 | 40.8 ± 1.3 | 65.9 ± 1.2 | 91.6 ± 2.3 | 57.5 ± 2.4 | 57.1 ± 0.3 |
| Alofanib | 40.1 ± 2.6 | 51.8 ± 1.8 | 40.0 ± 0.2 | 85.5 ± 2.8 | 54.6 ± 1.8 | 81.2 ± 1.2 | 88.7 ± 0.4 | 37.5 ± 1.8 | 77.3 ± 8.4 |
| Non-selective RTKI targeting FGFR and/or VEGFR signaling pathways | |||||||||
| Lucitanib | 93.5 ± 0.5 | 58.2 ± 2.5 | 31.8 ± 3.4 | 81.0 ± 1.8 | 22.1 ± 0.7 | 91.3 ± 4.8 | 43.6 ± 1.4 | 46.6 ± 1.5 | 33.7 ± 2.1 |
| Axitinib | 87.2 ± 0.1 | 65.0 ± 0.1 | 39.9 ± 0.5 | 91.0 ± 1.2 | 56.5 ± 1.3 | 85.1 ± 1.5 | 98.2 ± 0.9 | 51.1 ± 0.7 | 61.2 ± 1.4 |
| Cabozantinib | 100.1 ± 8.7 | 30.5 ± 1.5 | 43.9 ± 1.3 | 105.1 ± 5.0 | 73.1 ± 3.6 | 79.3 ± 1.0 | 87.7 ± 1.8 | 45.5 ± 2.9 | 54.3 ± 1.1 |
| Regorafenib | 87.0 ± 8.6 | 49.6 ± 1.6 | 45.5 ± 1.1 | 89.8 ± 2.0 | 1.9 ± 0.01 | 74.6 ± 0.3 | 91.8 ± 0.8 | 49.1 ± 0.8 | 79.6 ± 3.2 |
| Sunitinib | 95.2 ± 1.2 | 63.9 ± 0.8 | 59.7 ± 8.2 | 82.2 ± 3.1 | 80.0 ± 0.2 | 61.8 ± 0.4 | 91.0 ± 1.5 | 63.7 ± 2.8 | 84.7 ± 3.3 |
Table 3.
Synergy scores (HSA model) between the most potent RTKI and Doxorubicin or 5-Fluorouracil in colorectal cancer cell lines.
Table 3.
Synergy scores (HSA model) between the most potent RTKI and Doxorubicin or 5-Fluorouracil in colorectal cancer cell lines.
| Colon-26 | HCT116 | RKO | |||
|---|---|---|---|---|---|
| Doxorubicin + Infigratinib |
17.16 | Doxorubicin + Pemigatinib |
10.03 | Doxorubicin + Cabozantinib |
10.38 |
| Doxorubicin + Cabozantinib |
16.5 | Doxorubicin + Lucitanib |
7.26 | Doxorubicin + Infigratinib |
2.57 |
| Doxorubicin + Pemigatinib |
15.08 | Doxorubicin + Regorafenib |
8.35 | Doxorubicin + Alofanib |
-0.73 |
| 5-Fluorouracil + Pemigatinib | 1.42 | 5-Fluorouracil + Sunitinib | 1.11 | 5-Fluorouracil + Lucitanib | 7.76 |
| 5-Fluorouracil + Infigratinib | 0.59 | 5-Fluorouracil + Pemigatinib | -1.05 | 5-Fluorouracil + Cabozantinib | 7.21 |
| 5-Fluorouracil + Lucitanib | -0.35 | 5-Fluorouracil + Regorafenib | -2.56 | 5-Fluorouracil + Pemigatinib | -1.85 |
Table 4.
The expression of MDR1, MRP-1, and ABCG2 mRNA in CRC cells when compared with chemosensitive HCC1806 triple-negative breast cancer cell line. Values are averages of 3 experiments. Significance level * p<0.01, ** p<0.001, *** p<0.0001.
Table 4.
The expression of MDR1, MRP-1, and ABCG2 mRNA in CRC cells when compared with chemosensitive HCC1806 triple-negative breast cancer cell line. Values are averages of 3 experiments. Significance level * p<0.01, ** p<0.001, *** p<0.0001.
| Genes | MDR1 | MRP1 | ABCG2 |
|---|---|---|---|
| HCC1806 TxR | 26,50*** | 1,15 | 4,01*** |
| HCT116 | 7,94** | 6,61*** | 4,82*** |
| RKO | 23,44*** | 22,25*** | 1,05 |
| Colon-26 | 22,20*** | 115,30*** | - |
Table 5.
The expression of MDR1, MRP-1, and ABCG2 mRNA in CRC cells when compared with chemosensitive SaOS-2 osteosarcoma cancer cell line. Values are averages of 3 experiments. Significance level * p<0.01, ** p<0.001, *** p<0.0001.
Table 5.
The expression of MDR1, MRP-1, and ABCG2 mRNA in CRC cells when compared with chemosensitive SaOS-2 osteosarcoma cancer cell line. Values are averages of 3 experiments. Significance level * p<0.01, ** p<0.001, *** p<0.0001.
| Genes | MDR1 | MRP1 | ABCG2 |
|---|---|---|---|
| SaOS-2 DoxR | 2,88* | 1,36 | 0,96 |
| HCT116 | 18,57* | 22,22*** | 15,73*** |
| RKO | 54,79*** | 74,83*** | 3,43* |
| Colon-26 | 51,88*** | 387,89*** | - |
Table 6.
The Mean Fluorescence Intensity (MFI) of Doxorubicin in HCT116 and Colon-26 cells was determined from 3 independent experiments. The intracellular accumulation of Doxorubicin alone and with pre- and post-incubation with ABC transporter inhibitors (Tariquidar, Ko-143, and MK-571) and RTKIs (Pemigatinib, Lucitanib, Regorafenib for HCT116, and Infigratinib, Cabozantinib for Colon-26). Significance level * p<0.05, ** p<0.01.
Table 6.
The Mean Fluorescence Intensity (MFI) of Doxorubicin in HCT116 and Colon-26 cells was determined from 3 independent experiments. The intracellular accumulation of Doxorubicin alone and with pre- and post-incubation with ABC transporter inhibitors (Tariquidar, Ko-143, and MK-571) and RTKIs (Pemigatinib, Lucitanib, Regorafenib for HCT116, and Infigratinib, Cabozantinib for Colon-26). Significance level * p<0.05, ** p<0.01.
| HCT116 | Colon-26 | ||
|---|---|---|---|
| Doxorubicin | 2407 ± 163 | Doxorubicin | 432 ± 46 |
| Doxorubicin + Tariquidar |
4129 ± 345 ** | Doxorubicin + Tariquidar |
1069 ± 158 ** |
| Doxorubicin + Ko-143 |
3068 ± 210 * | Doxorubicin + Ko-143 |
822 ± 103 ** |
| Doxorubicin + Mk-571 |
2329 ± 116 | Doxorubicin + MK-571 |
446 ± 52 |
| Doxorubicin + Pemigatinib |
3187 ± 370 * | Doxorubicin + Infigratinib |
891 ± 94 ** |
| Doxorubicin + Lucitanib |
3677 ± 494 ** | Doxorubicin + Cabozantinib |
1211 ± 125 ** |
| Doxorubicin + Regorafenib |
2188 ± 204 | ||
Table 7.
The competition assay was used to assess synergy between Infigratinib and Tariquidar or Ko-143, based on the enhancement of fluorescence intensity of Doxorubicin and Mitoxantrone. The Mean Fluorescence Intensity (MFI) of Doxorubicin and Mitoxantrone in Colon-26 cells was determined from 3 independent experiments. Significance level * p<0.05, ** p<0.01.
Table 7.
The competition assay was used to assess synergy between Infigratinib and Tariquidar or Ko-143, based on the enhancement of fluorescence intensity of Doxorubicin and Mitoxantrone. The Mean Fluorescence Intensity (MFI) of Doxorubicin and Mitoxantrone in Colon-26 cells was determined from 3 independent experiments. Significance level * p<0.05, ** p<0.01.
| Colon-26 | |||
|---|---|---|---|
| Doxorubicin | 419 ± 26 | Mitoxantrone | 8811 ± 532 |
| Doxorubicin + Infigratinib |
881 ± 32 | Mitoxantrone + Infigratinib |
15827 ± 956 |
| Doxorubicin + Tariquidar |
934 ± 51 | Mitoxantrone + Tariquidar |
15067 ± 917 |
| Doxorubicin + Tariquidar + Infigratinib |
883 ± 39 | Mitoxantrone + Tariquidar + Infigratinib |
16300 ± 1038 |
| Doxorubicin + Ko-143 |
471 ± 22 | Mitoxantrone + Ko-143 |
10668 ± 741 |
| Doxorubicin + Ko-143 + Infigratinib |
907 ± 35 ** | Mitoxantrone + Ko-143 + Infigratinib |
14130 ± 907 ** |
Table 8.
Estimated Free Energy of Binding of the specific ABC transporter inhibitors and RTKI with ABCB1 and ABCG2.
Table 8.
Estimated Free Energy of Binding of the specific ABC transporter inhibitors and RTKI with ABCB1 and ABCG2.
| ABCB1 | ABCG2 | |
|---|---|---|
| Selective ABC transporters inhibitors | ||
| Tariquidar | - 8.34 kcal/mol | - 7.60 kcal/mol |
| Ko-143 | - 7.50 kcal/mol | - 6.52 kcal/mol |
| Selective inhibitors of the FGFR signaling pathway | ||
| Infigratinib | - 6.95 kcal/mol | - 6.35 kcal/mol |
| Pemigatinib | - 6.24 kcal/mol | - 6.53 kcal/mol |
| Alofanib | - 6.30 kcal/mol | - 6.18 kcal/mol |
| Non-selective RTKI targeting FGFR and/or VEGFR signaling pathways | ||
| Lucitanib | - 6.28 kcal/mol | - 6.88 kcal/mol |
| Axitinib | - 6.45 kcal/mol | - 6.41 kcal/mol |
| Cabozantinib | - 7.86 kcal/mol | - 7.29 kcal/mol |
| Regorafenib | - 6.83 kcal/mol | - 6.15 kcal/mol |
| Sunitinib | - 5.84 kcal/mol | - 6.17 kcal/mol |
Table 9.
Important drug-binding cavity residues for RTKI interactions with ABCB1 and ABCG2. Amino acids involved in interaction with 3 or more inhibitors are underlined.
Table 9.
Important drug-binding cavity residues for RTKI interactions with ABCB1 and ABCG2. Amino acids involved in interaction with 3 or more inhibitors are underlined.
| ABCB1 | ABCG2 | |
|---|---|---|
| Selective ABC transporters inhibitors | ||
| Tariquidar | MET69, ILE306, TYR307, TYR310, PHE336, ILE340, PHE343, PHE728, PHE983 | Chain A: PHE439, SER440, VAL442, SER443, GLU446, SER535, LEU539 Chain B: PHE439 |
| Ko-143 | PHE303, ALA336, ASN721, LEU724, PHE732, PHE770, SER979, ALA987 | Chain A: PHE439, VAL442, SER443, THR538, LEU539, THR542 Chain B: PHE439, SER440, VAL442, SER443, THR538, LEU539, THR542 |
| Selective inhibitors of the FGFR signaling pathway | ||
| Infigratinib | LEU65, MET69, PHE303, ILE306, TYR307, PHE336, ILE340, ASN721, LEU724, SER766, PHE770, PHE983, MET986, ALA987 | Chain A: PHE439, VAL442, SER443, GLU446 Chain B: PHE439, SER440, VAL442, SER443 |
| Pemigatinib | PHE239, PHE770, GLN773, PHE777, LYS826, SER831, GLN838, VAL991, PHE994 | Chain A: PHE439, VAL442, THR542 Chain B: PHE439, SER440, VAL442, SER443, VAL445, GLU446, VAL534, THR538, THR542 |
| Alofanib | HIS61, LEU65, MET68, MET69, VAL125, ILE340, GLU875, PHE942, GLN946, MET949, TYR950, TYR953, MET986 | Chain A: PHE439, LEU539, THR538, THR542 Chain B: PHE439, THR538, LEU539, THR542 |
| Non-selective RTKI targeting FGFR and/or VEGFR signaling pathways | ||
| Lucitanib | TRP232, LEU236, PHE239, ILE299, ALA302, PHE303, ILE306, PHE343, GLN990, PHE994 | Chain A: PHE439, SER535, VAL536, LEU539, THR542 Chain B: PHE439, VAL442, SER443, GLU446 |
| Axitinib | LEU65, PHE336, ILE340, PHE343, PHE732, TYR953, PHE983 | Chain A: SER440, VAL442, THR538, LEU539, THR542 Chain B: PHE439, VAL442, THR542 |
| Cabozantinib | LEU65, TYR310, PHE336, ILE340, GLN725, PHE728, PHE732, GLN946, MET949, TER950, TYR953, PHE978, SER979, PHE983, MET986 | Chain A: PHE439, VAL442, LEU539, THR542 Chain B: PHE439, SER440, SER443, SER535, THR538, LEU539, THR542 |
| Regorafenib | TRP232, LEU236, ILE299, ALA302, PHE303, ILE306, PHE770, GLN773, GLN838, VAL991, PHE994, ALA995 | Chain A: PHE439, VAL442, SER443, GLU446, THR538, THR542 Chain B: PHE439, SER440, SER443 |
| Sunitinib | PHE336, ASN721, GLN725, ASN839, ASN842, PHE983, ALA987, VAL991 | Chain A: PHE439, SER440, VAL442, SER443, GLU446, THR542 Chain B: PHE439, THR542 |
Disclaimer/Publisher’s Note: The statements, opinions and data contained in all publications are solely those of the individual author(s) and contributor(s) and not of MDPI and/or the editor(s). MDPI and/or the editor(s) disclaim responsibility for any injury to people or property resulting from any ideas, methods, instructions or products referred to in the content. |
© 2026 by the authors. Licensee MDPI, Basel, Switzerland. This article is an open access article distributed under the terms and conditions of the Creative Commons Attribution (CC BY) license.
Copyright: This open access article is published under a Creative Commons CC BY 4.0 license, which permit the free download, distribution, and reuse, provided that the author and preprint are cited in any reuse.


