

Submitted:
31 July 2026
Posted:
31 July 2026
You are already at the latest version
Abstract
The scarcity of high-fidelity, real-world datasets capturing photovoltaic failures in tropical environments remains a significant barrier to the development of robust predictive maintenance models. This article presents a specialized experimental methodology and the resulting multivariate dataset, PV-Fault-DS226, collected from a dual-panel outdoor testbed in Douala, Cameroon (4.0511° N, 9.7679° E). The approach focuses on capturing the non-linear dynamics of solar systems under extreme hot and humid operational stress, providing a rigorous foundation for fault diagnosis and prognosis research. Faults including progressive degradation, open-circuit, short-circuit, and partial shading were physically induced using precision potentiometers, circuit breakers, and manual shading, rather than numerical simulation, to capture authentic non-linear failure signatures. A 16-bit acquisition framework was designed to preserve signal integrity and resolve subtle electrical transients under extreme equatorial climate stress, synchronously logging current, voltage, irradiance, and temperature across both photovoltaic subsystems. After cleaning and multi-rate temporal synchronization, the resulting dataset comprises 226,175 labelled, high-frequency observations spanning five operational states, whose physical separability was confirmed through statistical distribution and three-dimensional clustering analyses. PV-Fault-DS226 thus provides an authentic, tropical, hardware-in-the-loop ground truth for developing and benchmarking photovoltaic fault diagnosis and prognosis models under real degradation trajectories rather than synthetic approximations.
Keywords:
photovoltaic fault dataset
; tropical climate
; physical fault induction
1. Summary (required)
The accelerated deployment of solar infrastructure across Sub-Saharan Africa is increasingly hindered by concerns regarding long-term operational durability and system reliability. Although photovoltaic (PV) modules are designed for robustness, their performance within the tropical coastal corridors of the Gulf of Guinea undergoes severe attrition due to intense thermal stress, persistent humidity, and high-frequency irradiance volatility [1]. Understanding how these atmospheric stressors catalyze hardware degradation is fundamental for transitioning from reactive repair strategies to proactive Prognostics and Health Manage-ment (PHM).
A primary obstacle in this field is that established public datasets for PV fault diagnosis are largely de-rived from temperate geographic zones or utilize software-driven numerical simulations to emulate failure states [2]. As highlighted in recent literature, these synthetic models often lack the fidelity required to rep-licate the intricate, non-linear transients and stochastic behaviors characteristic of physical degradation in the field [2,3]. Consequently, a critical shortage of “ground truth” data exists regarding the physical tran-sition from nominal to degraded states in tropical climates, a gap that severely restricts the diagnostic pre-cision and generalizability of current algorithms.
To mitigate these limitations, a specialized experimental testbed was engineered to produce a high-fidelity empirical resource: the PV-Fault-DS226. Moving beyond the constraints of theoretical modeling, this is achieved using Schneider Easy9 MCB 10A circuit breakers and two Mexico Bourns 3090S-2-501L 500-ohm precision potentiometers assigned to the NJR-120P-36 and Win Bright YB-156P36-120 panels. Deg-radation is emulated through a sequential process: first, aging (contact corrosion or oxidation) is simulated via a series configuration, followed by a parallel reconfiguration to replicate insulation failure (earth leak-age). This hardware-in-the-loop approach captures the authentic non-linear signatures of both degradation modes under tropical operational stress, consistent with established degradation-modeling principles [4], facilitating the capture of authentic degradation trajectories rather than isolated, static snapshots.
Ultimately, this research establishes an empirical foundation contributing toward Remaining Useful Life (RUL) estimation research for solar assets, primarily by providing physically authentic, multi-class fault signatures rather than a direct measurement of long-term natural degradation. By aggregating 226,175 synchronized observations, the resulting dataset supports the development of deep-learning architectures for instantaneous multi-class fault diagnosis and early-stage transition detection in tropical urban envi-ronments. This work follows a growing tradition of solar-energy Data Descriptors published in this journal that document field measurements from underrepresented regions of the Global South [5], underscoring the continued need for high-fidelity, regionally representative photovoltaic data. No external funding was received for its collection.
Beyond its geographic novelty, the dataset offers several benefits to the research community. Collected in Douala, Cameroon (4.0511° N, 9.7679° E), a region characterized by extreme humidity and high ambient temperatures, it allows researchers to study the specific impact of tropical stressors on PV performance, a gap left open by most publicly available datasets, which are derived from temperate or arid climates. The installation itself was precisely calibrated using a Garmin GPSMAP 64S and a professional clinometer, with modules fixed at a 10° tilt angle and oriented True South to optimize solar capture and promote natu-ral self-cleaning through tropical rainfall, while energy flow was managed by a Victron Energy MPPT 100/30 controller to ensure high reproducibility and stability of the recorded measurements.
The dataset further captures rapid environmental transients and subtle electrical variations in current (I1, I2), voltage (V1, V2), irradiance (Irr), and temperature (T1, T2), at a density achieved through high-frequency sampling and 16-bit resolution (ADS1115 ADC) that is crucial for advanced time-series analyses and deep-learning architectures, and required to detect complex degradation patterns often invisible in sparser datasets. Its central value, however, lies in the capture of real physical fault trajectories rather than math-ematical models: concrete degradations (corrosion and insulation loss), open circuits, short circuits, and shading scenarios were emulated using Bourns 3090S-2-501L precision potentiometers, Schneider Easy9 MCB circuit breakers, and plywood, providing a reliable ground truth for training and benchmarking diag-nostic algorithms such as random forest classifiers [6], deep residual networks [7], and CNN-GRU archi-tectures [8], as well as online monitoring frameworks [9], under dynamic real-world conditions. By further configuring these potentiometers as current and voltage dividers to physically simulate progressive aging effects and connectivity defects over the course of the campaign, the dataset also offers a physically grounded starting point for exploratory Remaining Useful Life (RUL) estimation and reinforcement-learning research, documenting the induced evolution of system states from healthy conditions to defined stages of degradation over the 11-day acquisition window, rather than naturally occurring, multi-year deg-radation trajectories.
2. Data Description (Required)
The PV-Fault-DS226 dataset consists of high-resolution multivariate time-series data stored in synchro-nized CSV format. The data reflect the dynamic operational behavior of two 120 W polycrystalline mod-ules: NJR Corporation (NJR-120P-36) and Win Bright (YB-156P36-120) installed in Douala, Cameroon (4.0511° N, 9.7679° E). The modules were fixed at a 10° tilt angle with a True South orientation to opti-mize solar capture and ensure environmental consistency.
2.1. Subsection
The dataset is provided as two CSV (comma-separated values, UTF-8 encoded) files, both deposited under the PV-Fault-DS226 record (total archive size 77.7 MB): df_ia_raw_acquisition.csv, the synchronized multivariate acquisition record (226,175 rows), prior to fault-label assignment; and PV_Diagnostic_Final_Labels.csv, the labelled dataset in which each observation has been assigned one of five ground-truth operating states. Each record is a timestamped measurement capturing the interaction between environmental stressors and electrical output. To support the physical interpretation of the rec-orded voltage and current values, Table 1 summarizes the nominal electrical characteristics of the two photovoltaic modules under Standard Test Conditions (STC: 1000 W/m2, 25 °C, AM 1.5), against which the operating values in the dataset can be referenced.
2.2. Figures, Tables and Schemes
Columns Timestamp through P1/P2 are present in df_ia_raw_acquisition.csv; all columns, including the four label fields, are present in PV_Diagnostic_Final_Labels.csv. Note that each of the two photovoltaic subsystems (S1, S2) is labelled independently, as faults were not always induced simultaneously on both panels.

Table 2.
Column structure of the PV-Fault-DS226 dataset.
| Column Name | Variable | Unit | Sensor/Source |
|---|---|---|---|
| Timestamp | Date and time | YYYY-MM-DD HH:MM:SS | Raspberry Pi 3 internal clock |
| Irr | Solar irradiance | W/m2 | RS-RA-N01-AL-EX pyranometer |
| T1, T2 | Module temperature | °C | Pt100 RTD (NJR/Win Bright) |
| V1, V2 | Voltage | V | Precision voltage sensor (0–25 V) |
| I1, I2 | Current | A | ACS712 (NJR/Win Bright) |
| P1, P2 | Instantaneous power | W | Included in the raw file (P = V × I) |
| Label_Num_S1, Label_Num_S2 | Numeric state code (per subsystem) | Integer (1-5) | Hardware-specific diagnostic logic (Table 3) |
| Label_S1, Label_S2 | State name (per subsystem) | String | Hardware-specific diagnostic logic (Table 3) |
2.3. Fault Labeling
To facilitate multi-class classification and prognosis research, observations are categorized into five distinct operational states, labelled independently for each of two photovoltaic subsystems (Label_S1 and Label_S2), since faults were not always induced simultaneously on both panels. The degradation states (formerly separate labels for series and parallel resistance) have been consolidated to represent the continuous evolution of module health. These conditions were physically induced using Schneider Easy9 MCBs and Mexico Bourns 3090S-2-501L precision potentiometers:
- ▪ Label 1 (Normal): baseline operation under clear and cloudy sky conditions, characterized by a stable operating point at nominal connection.
- ▪ Label 2 (Short-Circuit): direct bypass induced via circuit breakers (low-impedance bypass), electrically manifesting as V→0 with I ≈ Isc, high current with near-zero voltage.
- ▪ Label 3 (Open Circuit): total disconnection of the module string via Schneider Easy9 MCB circuit breakers, electrically manifesting as I→0 with V ≈ Voc, complete interruption of current flow.
- ▪ Label 4 (Degradation): this consolidated label captures both aging effects and insulation loss, induced via precision wirewound potentiometers producing adjustable series resistance (Rs) and shunt resistance (Rsh). It includes series resistance/corrosion (induced via a series-circuit current divider to emulate oxidized connectivity) and parallel resistance/insulation loss (induced via a parallel voltage divider to emulate earth leakage and encapsulation defects), electrically manifesting as simultaneous variations in I/Irr and V-T behavior.
- ▪ Label 5 (Shading): controlled physical masking of the panel surfaces at various intervals to replicate localized shading, electrically manifesting as reduced photocurrent, a decrease in I/Irr.
As shown in Figure 1, the class distribution is markedly imbalanced across both subsystems: Degradation dominates the dataset (103,885 observations for S1; 105,672 for S2), followed by Open Circuit and Normal operation, while Short Circuit is a rare event (53 observations for S1; 133 for S2), reflecting its intentionally brief induction duration during the campaign. This imbalance should be taken into account when designing classification experiments, for example through class-weighted loss functions or stratified sampling.
2.4. Diagnostic Logic and Label Assignment Criteria
To ensure the dataset is fully interpretable and reproducible by downstream users, the hardware-specific decision logic used to assign each fault label is reported explicitly in Table 3. Labeling relies on a hierarchical combination of instantaneous voltage (V, in volts) and the current-to-irradiance ratio (I/Irr, in A·m2/W), which normalizes the electrical response against the prevailing irradiance and thereby prevents cloud-driven current fluctuations from being misclassified as faults. Thresholds were calibrated against the nominal short-circuit currents of the two subsystems (Table 1), with the healthy operation boundary set at approximately 85% of peak STC capacity.
Table 3.
Hardware-specific diagnostic logic used for fault-label assignment.
| Fault Category | Hardware Logic Condition | Diagnostic Implication |
|---|---|---|
| Open Circuit | V > 17.5 AND I < 0.2 | Total continuity break |
| Short Circuit | V < 1.0 AND I/Irr > 0.0065 | Shunted cell or wiring short |
| Shading | 6.0 ≤ V ≤ 14.0 AND I < 1.0 | Localized obstruction (bypass-diode activation) |
| Degradation | (7 ≤ V < 12 AND I/Irr > 0.0065) or (V ≥ 14 AND I/Irr < 0.0055) | Combined state: cell aging or insulation leakage |
| Normal Operation | I/Irr ≥ 0.0065 AND V ≥ 14.0 | Optimal performance (>85% STC) |
This hierarchical threshold structure was specifically calibrated to avoid the “dead zone” phenomenon observed with generic, non-hardware-specific thresholds, whereby moderate power degradation (up to approximately 35%) can otherwise be erroneously classified as normal operation. Label 4 (Degradation) is deliberately defined as a disjunction of two physical regimes: a moderate-voltage, current-dominant branch, and a near-nominal-voltage, current-deficient branch reflecting the two distinct hardware mechanisms (series-resistance corrosion and parallel-resistance insulation loss) described in the Methods section. A small fraction of observations (<1.4%) fall within narrow transition regions not explicitly covered by the conditions above, an expected consequence of empirically calibrated thresholds under real outdoor variability; these regions are addressed in detail in User Notes.
2.5. Graphical Representation and Data Visualization
Multivariate relationships and temporal structure
The correlation matrix (Figure 2) confirms the expected physical couplings between channels: current and power are almost perfectly correlated within each subsystem (I1, P1: 0.95; I2, P2: 0.97), irradiance and temperature are strongly coupled (Irr, T1: 0.74; Irr, T2: 0.82), and the two module temperatures track each other closely (T1, T2: 0.92), consistent with their shared exposure to ambient conditions. Voltage shows only weak correlation with current (|r| < 0.08), reflecting the fact that voltage collapses are driven by induced faults rather than by irradiance-driven power generation, an important property for downstream feature engineering.
A short temporal window (Figure 3) illustrates the synchronized, high-frequency character of the acquisition: irradiance follows the expected smooth diurnal envelope with cloud-driven fluctuations, while voltage and current exhibit abrupt step transitions corresponding to Hardware-in-the-Loop fault injections superimposed on the underlying environmental signal. This synchronization between slowly varying environmental channels and rapidly switching electrical channels is a defining feature of the dataset and a key requirement for training temporal models capable of disentangling environmental variability from genuine fault transients.
Granular raw sensor analysis
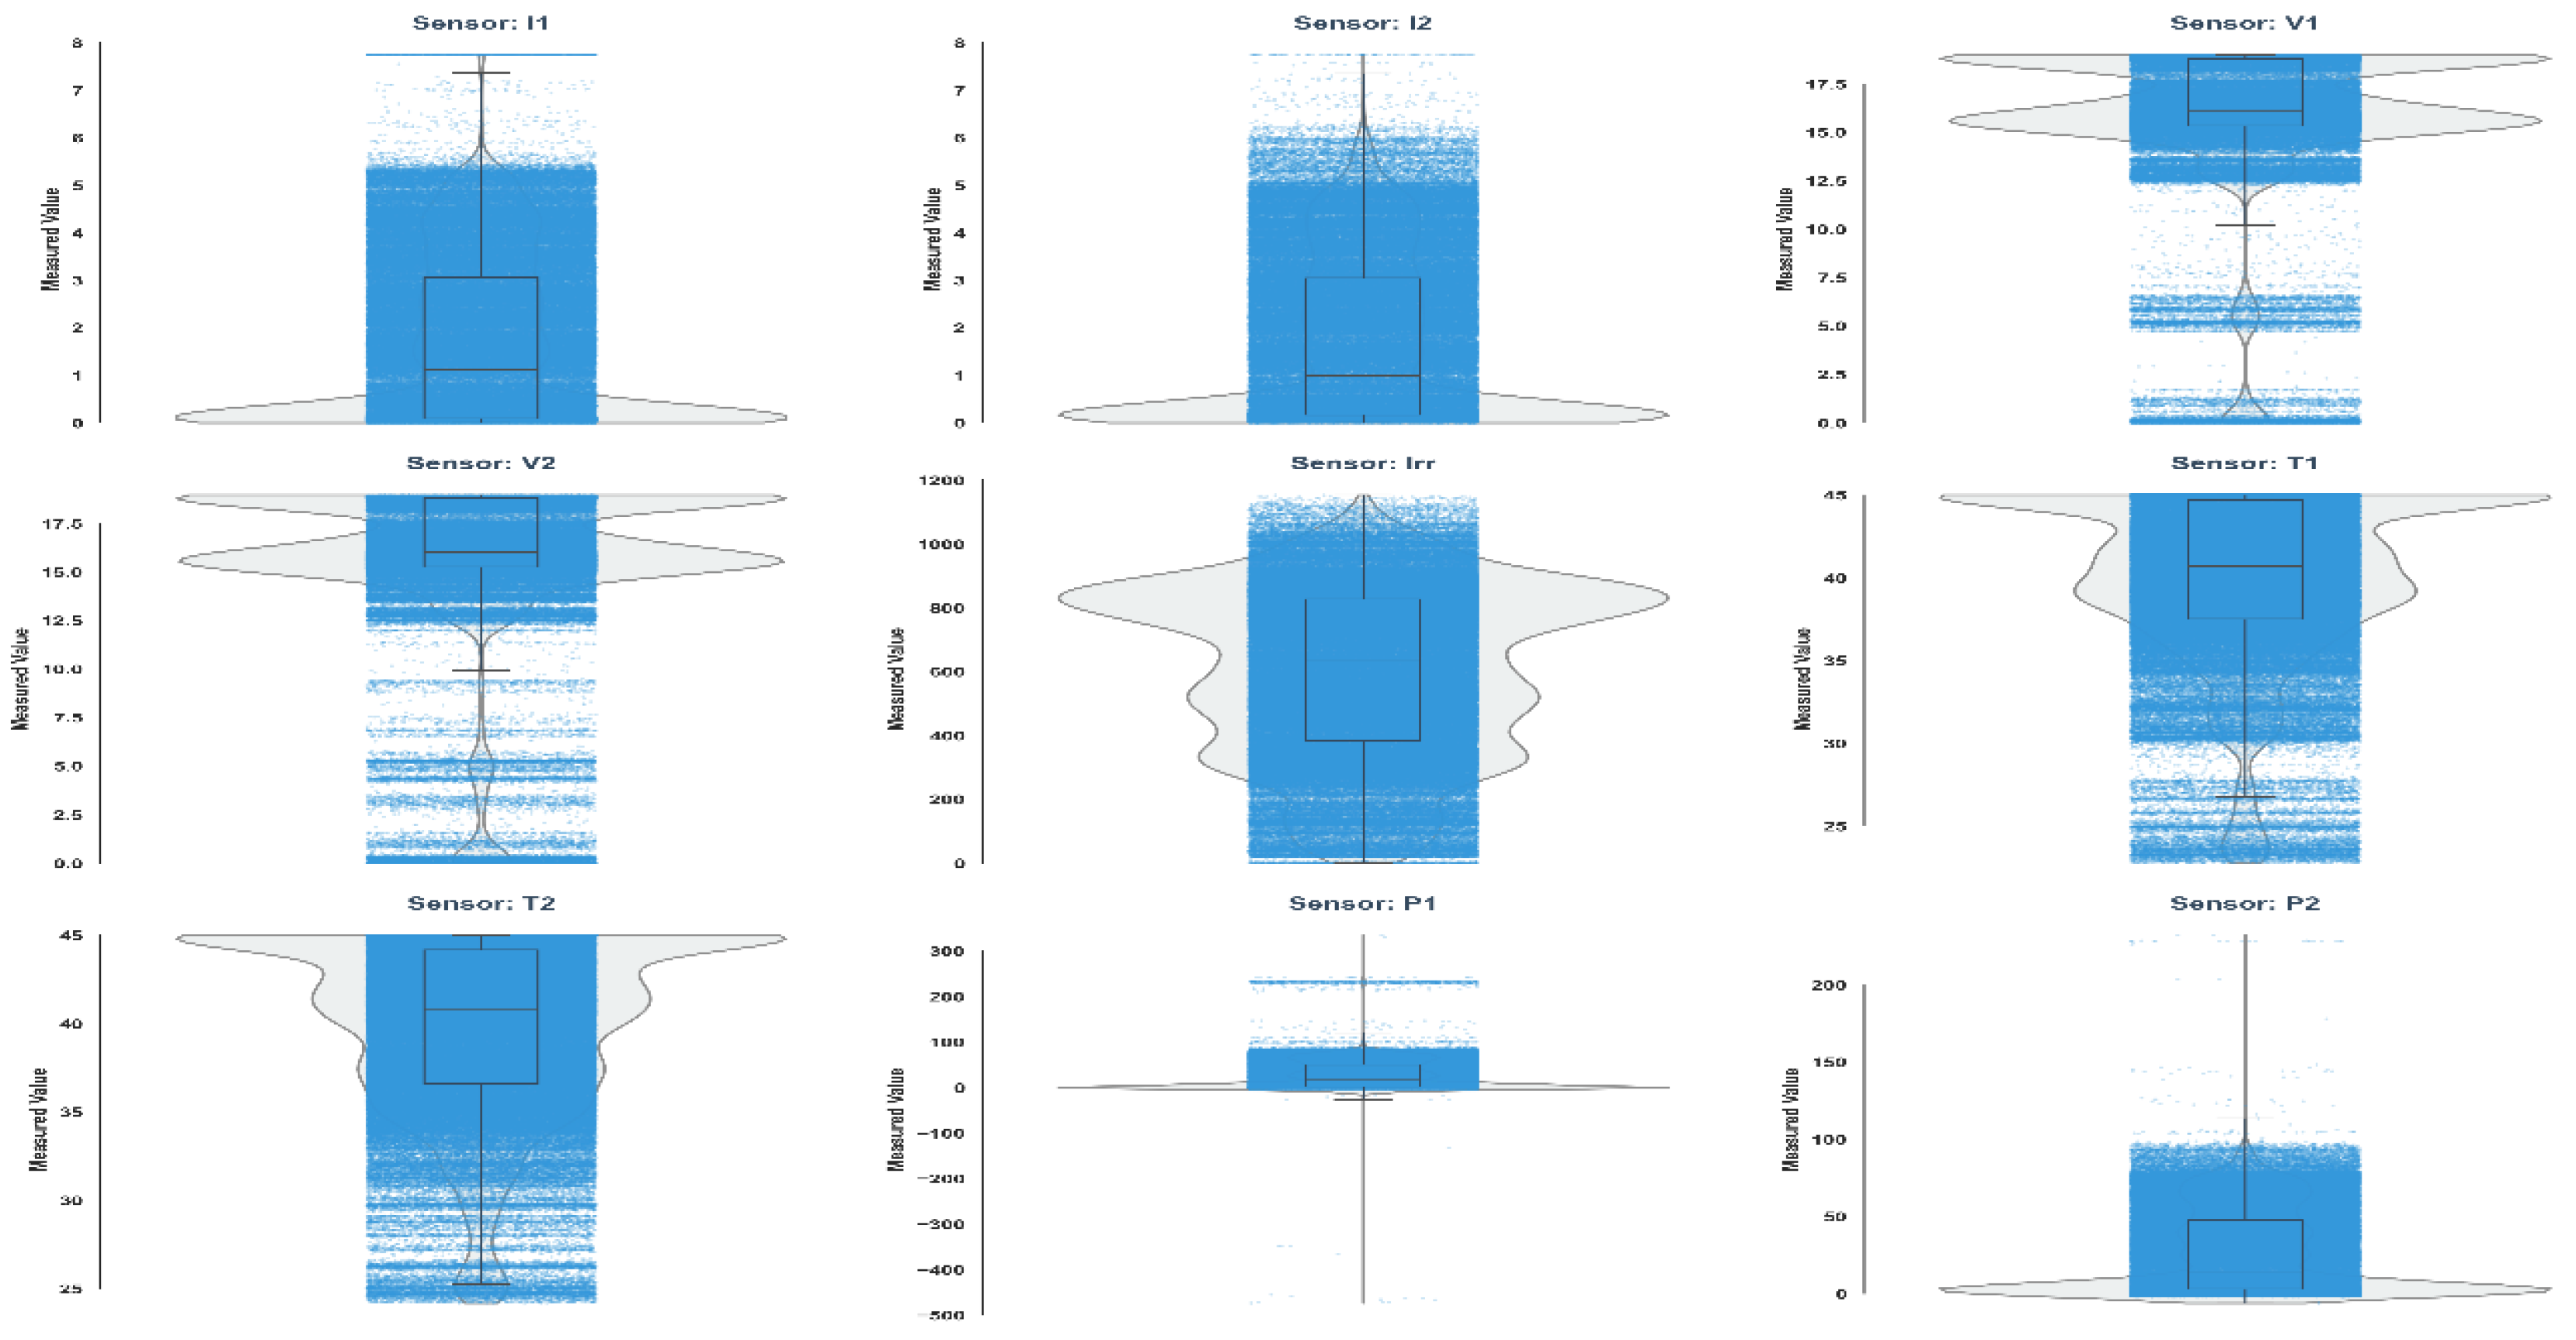
The raincloud plots for V1 and V2 exhibit a distinct bimodal distribution. The density concentration at the upper bound (>15 V) signifies the Maximum Power Point (MPP) during healthy operational states. Conversely, the high-density “rain” streaks and secondary density peaks at lower intervals (0 V to 10 V) quantify the occurrence of intentional fault injections. The power profiles (P1, P2) mirror this behavior but demonstrate a higher sensitivity to irradiance fluctuations, as evidenced by the broader, more dispersed distribution compared to the relatively stable voltage peaks.
The irradiance distribution follows a quasi-normal density profile, peaking between 600 and 900 W/m2. This ensures the dataset is not biased toward low-light conditions, providing robust training data for high-output scenarios. Thermal sensors (T1, T2) show a “top-heavy” distribution, with a high density of observations between 35 °C and 45 °C. The presence of outliers extending toward 25 °C likely represents the initial system warm-up phases or cooling periods during intermittent cloud cover, confirming that the sensors captured the full thermodynamic cycle of the PV modules.
Figure 4.
Raincloud plots representing the stochastic distribution and density of raw sensor measurements for the dual PV acquisition systems.
Figure 4.
Raincloud plots representing the stochastic distribution and density of raw sensor measurements for the dual PV acquisition systems.
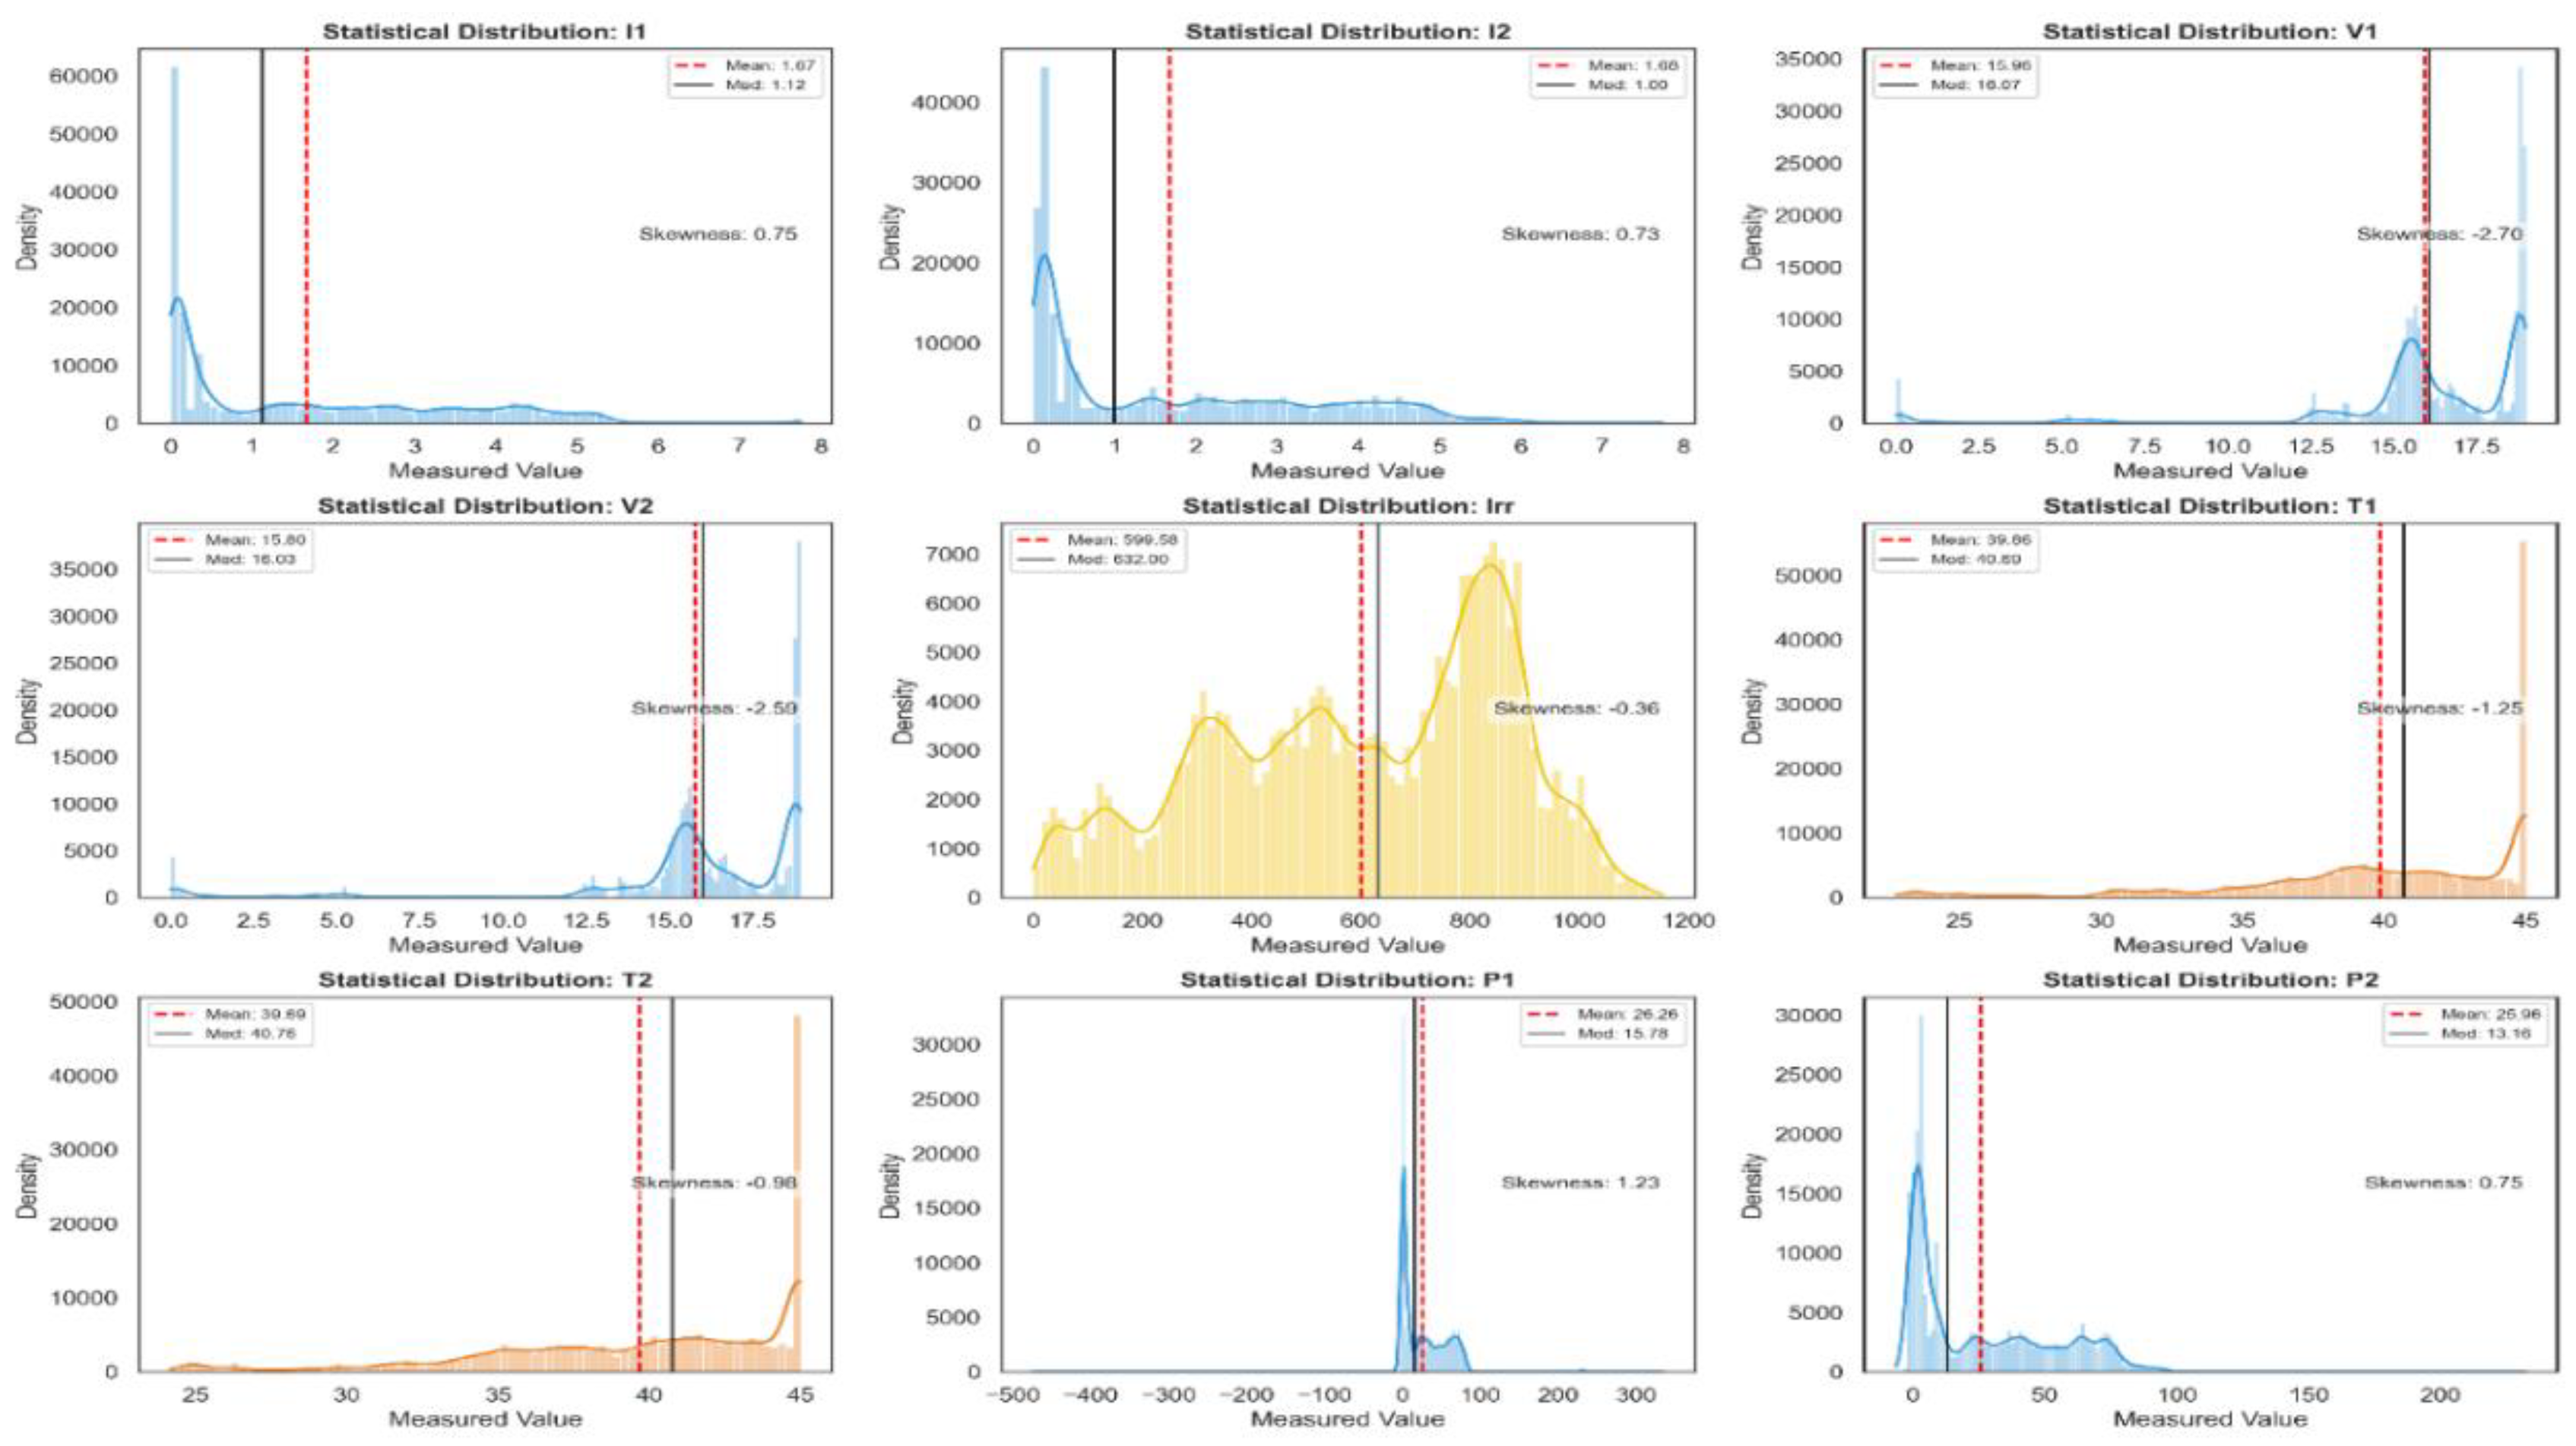
Density plots reveal a fundamentally non-linear, non-Gaussian dataset: the electrical variables (I1, I2, P1, and P2) show a right-skewed profile (skewness 0.73-1.23), reflecting intermittent solar generation, while voltage distributions (V1, V2) are strongly left-skewed (≈ −2.70), reflecting sharp drops associated with short-circuit or shading events. Mean and median indicators remain tightly clustered despite this skewness, indicating the dataset is free from significant data drift. Irradiance and temperature distributions act as environmental ground truth, capturing distinct operational phases from morning transitions to peak-hour saturation, while the Open-Circuit and Short-Circuit classes occupy the extreme tails of the distribution.
Figure 5.
Distribution plots of the electrical and environmental variables.
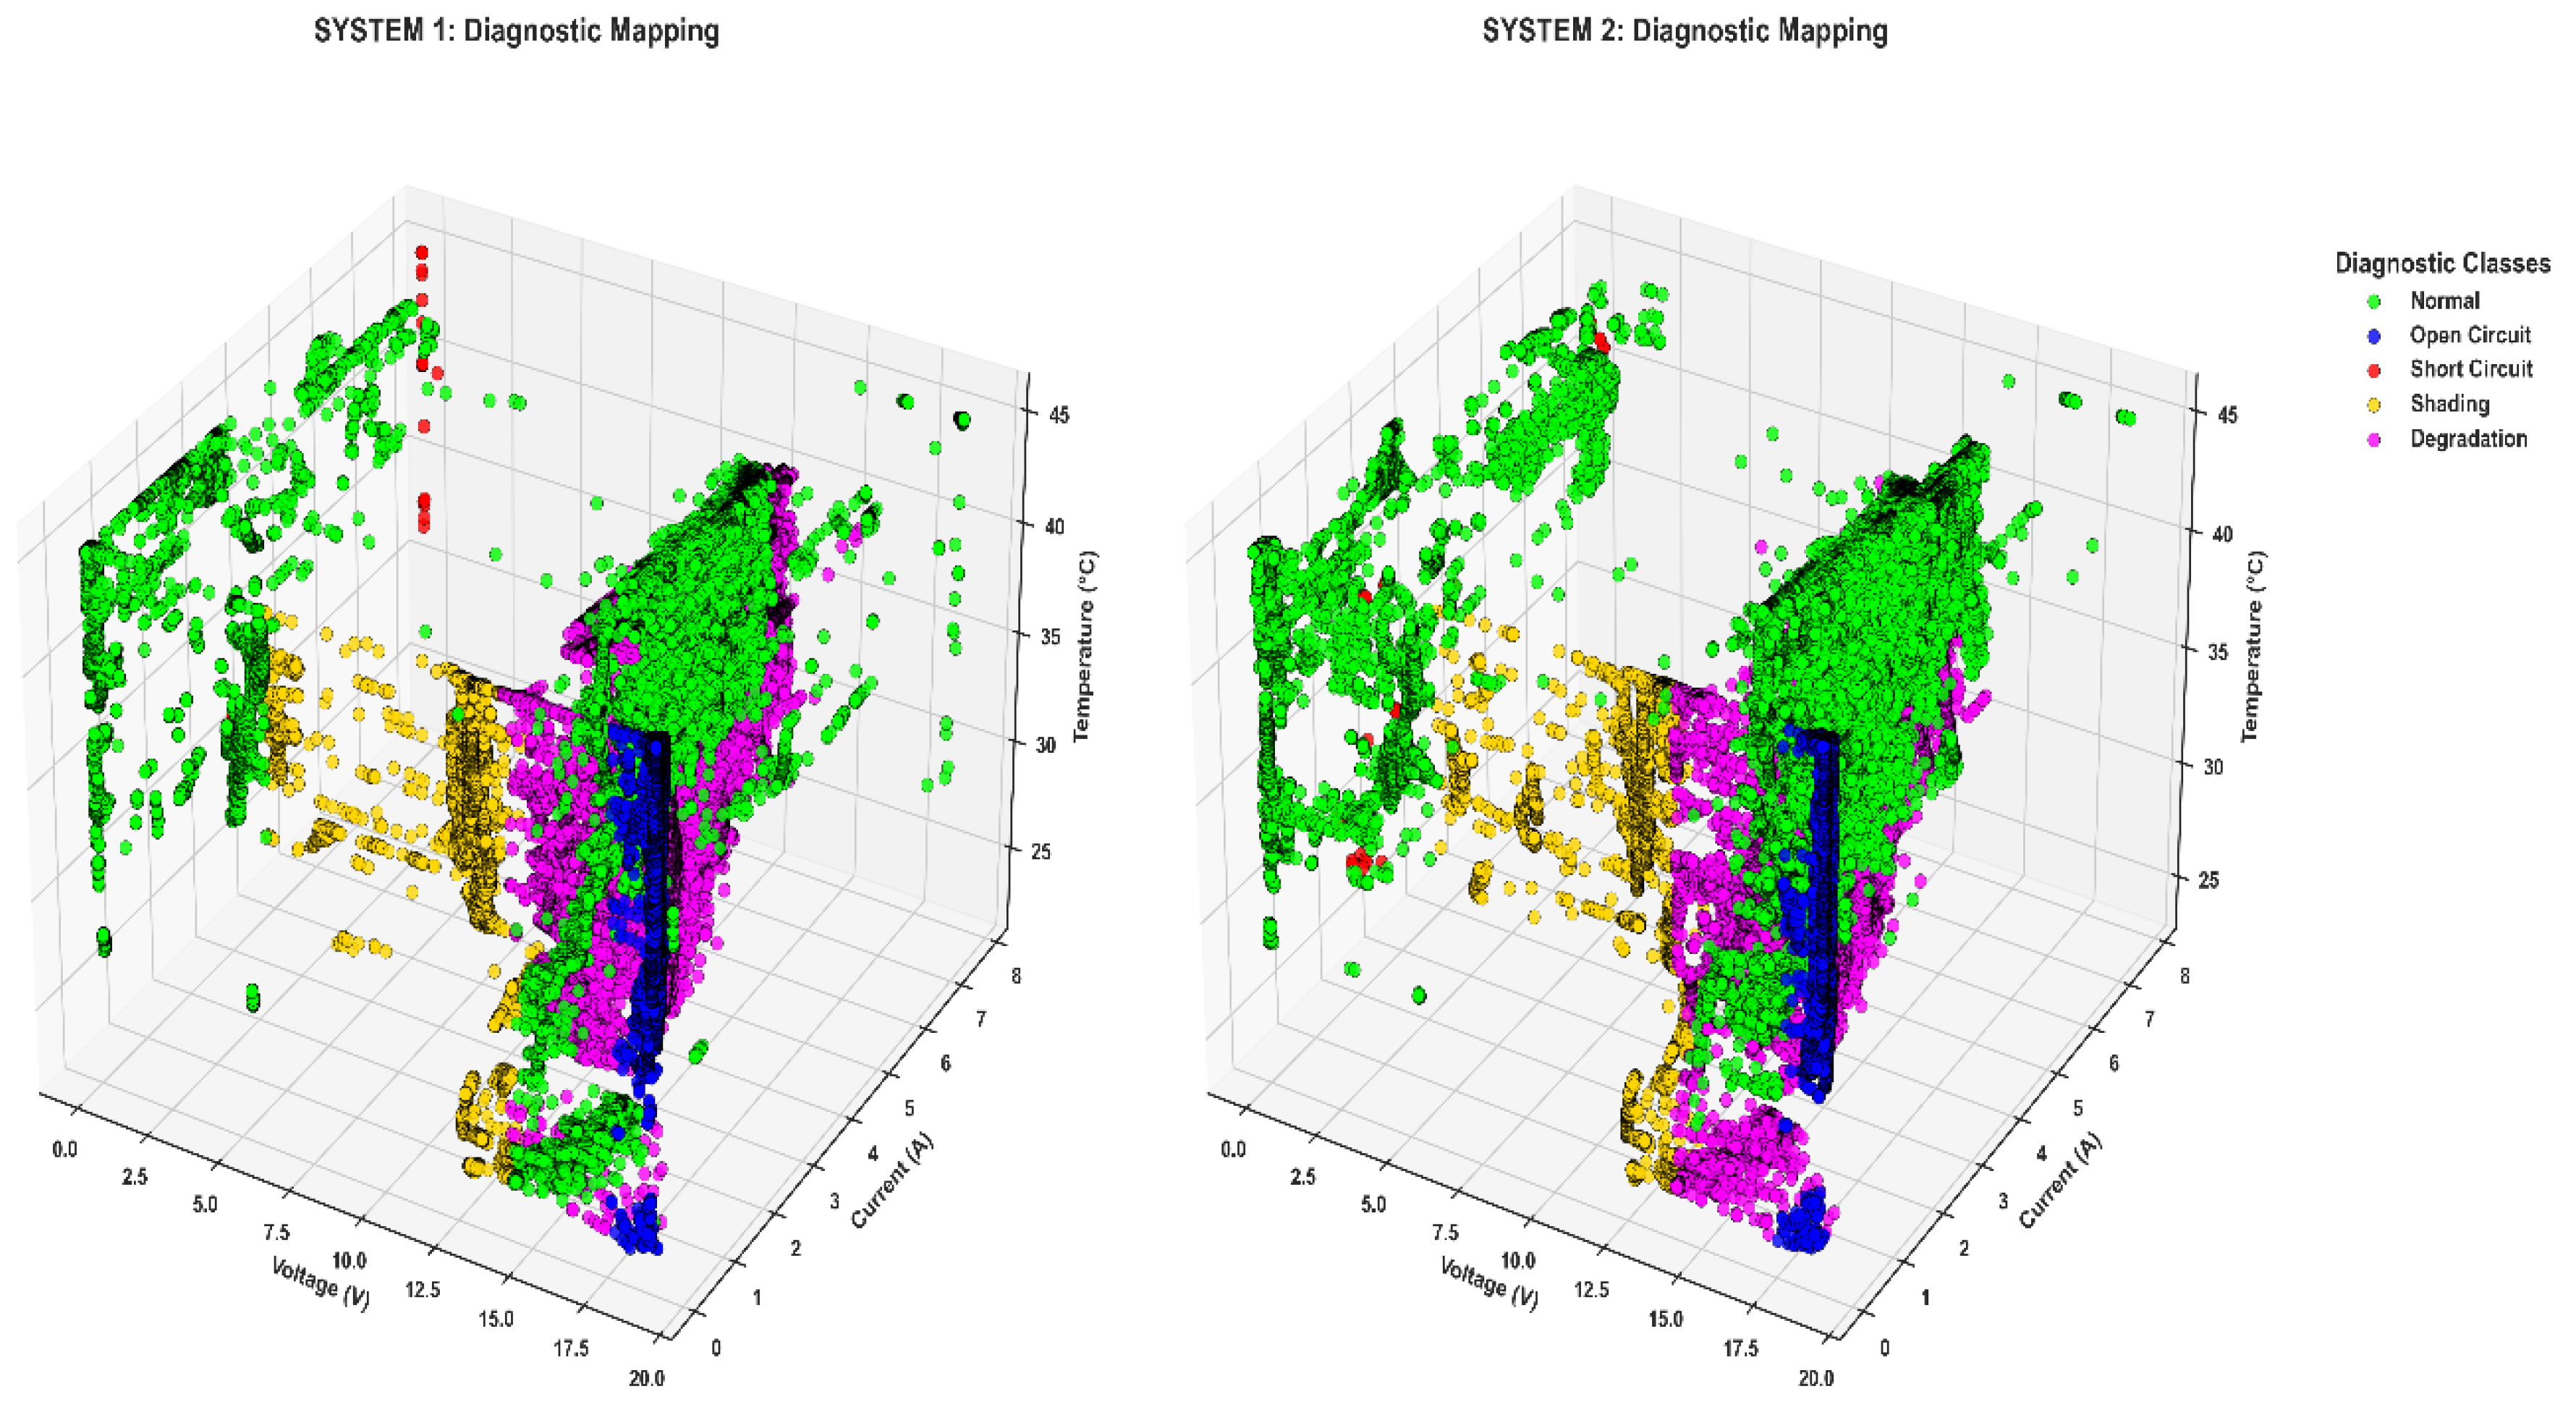
A three-dimensional Voltage-Current-Temperature mapping of the 226,175 observations empirically validates the physical separability of the fault classes. Open-Circuit points cluster at the maximum-voltage boundary (≈20 V) with near-zero current; Short-Circuit points concentrate at the zero-voltage floor while maintaining measurable current; and Shading events form discrete steps at lower voltage-current intersections corresponding to bypass-diode activation. The Degradation cluster remains distinct from Shading and Normal zones across the 25-45 °C temperature range, confirming that feature engineering successfully decouples thermal-induced variance from true electrical anomalies and that the dataset is sufficiently discriminatory for prognostic forecasting.
Figure 6.
Three-dimensional Voltage-Current-Temperature fault signatures mapping.
2.6. Descriptive Statistics
Table 4 reports summary statistics for the seven primary sensor channels across the full 226,175 observations dataset, providing a quantitative complement to the distribution plots above.
2.7. Class Imbalance and Recommended Mitigation Strategies
As introduced in the fault labeling section, the five operating states are markedly imbalanced across both subsystems. Table 5 reports the exact class ratios, expressed as a percentage of the total 226,175 observations.
The extreme rarity of the Short-Circuit class (0.02-0.06% of observations) reflects its intentionally brief induction duration during the experimental campaign: this fault condition was applied only transiently to avoid sustained stress on the hardware and to limit the risk of component damage during repeated testing cycles, rather than being under-sampled at the data-processing stage. Users intending to train multi-class classifiers on PV-Fault-DS226 should therefore explicitly account for this imbalance, rather than relying on raw classification accuracy, which can be misleadingly high even when the minority class is never correctly predicted.
Three complementary mitigation strategies are commonly applicable to this class distribution:
- ▪
- Class weighting: assigning inversely proportional weights to each class in the loss function (e.g., weighted categorical cross-entropy) penalizes misclassification of the minority Short-Circuit class more heavily, without altering the underlying data distribution.
- ▪
- Focal loss: down-weighting the contribution of easily classified majority-class examples (Degradation, Open Circuit) allows the learning signal to concentrate on harder, underrepresented examples such as Short-Circuit, and has shown strong empirical performance on comparably skewed distributions in the fault-diagnosis literature.
- ▪
- Synthetic Minority Over-sampling (SMOTE) and its variants: generating synthetic Short-Circuit samples by interpolating between existing minority-class observations in feature space can rebalance the training set, although this should be applied with caution given the very small number of original Short-Circuit observations (53-133), which limits the diversity of interpolation anchors.
Given the small absolute number of Short-Circuit observations, we recommend that users report per-class precision, recall, and F1-score rather than global accuracy alone when benchmarking classifiers on this dataset, consistent with standard practice for imbalanced multi-class problems.
3. Methods
3.1. Photovoltaic Power Unit and Energy Management
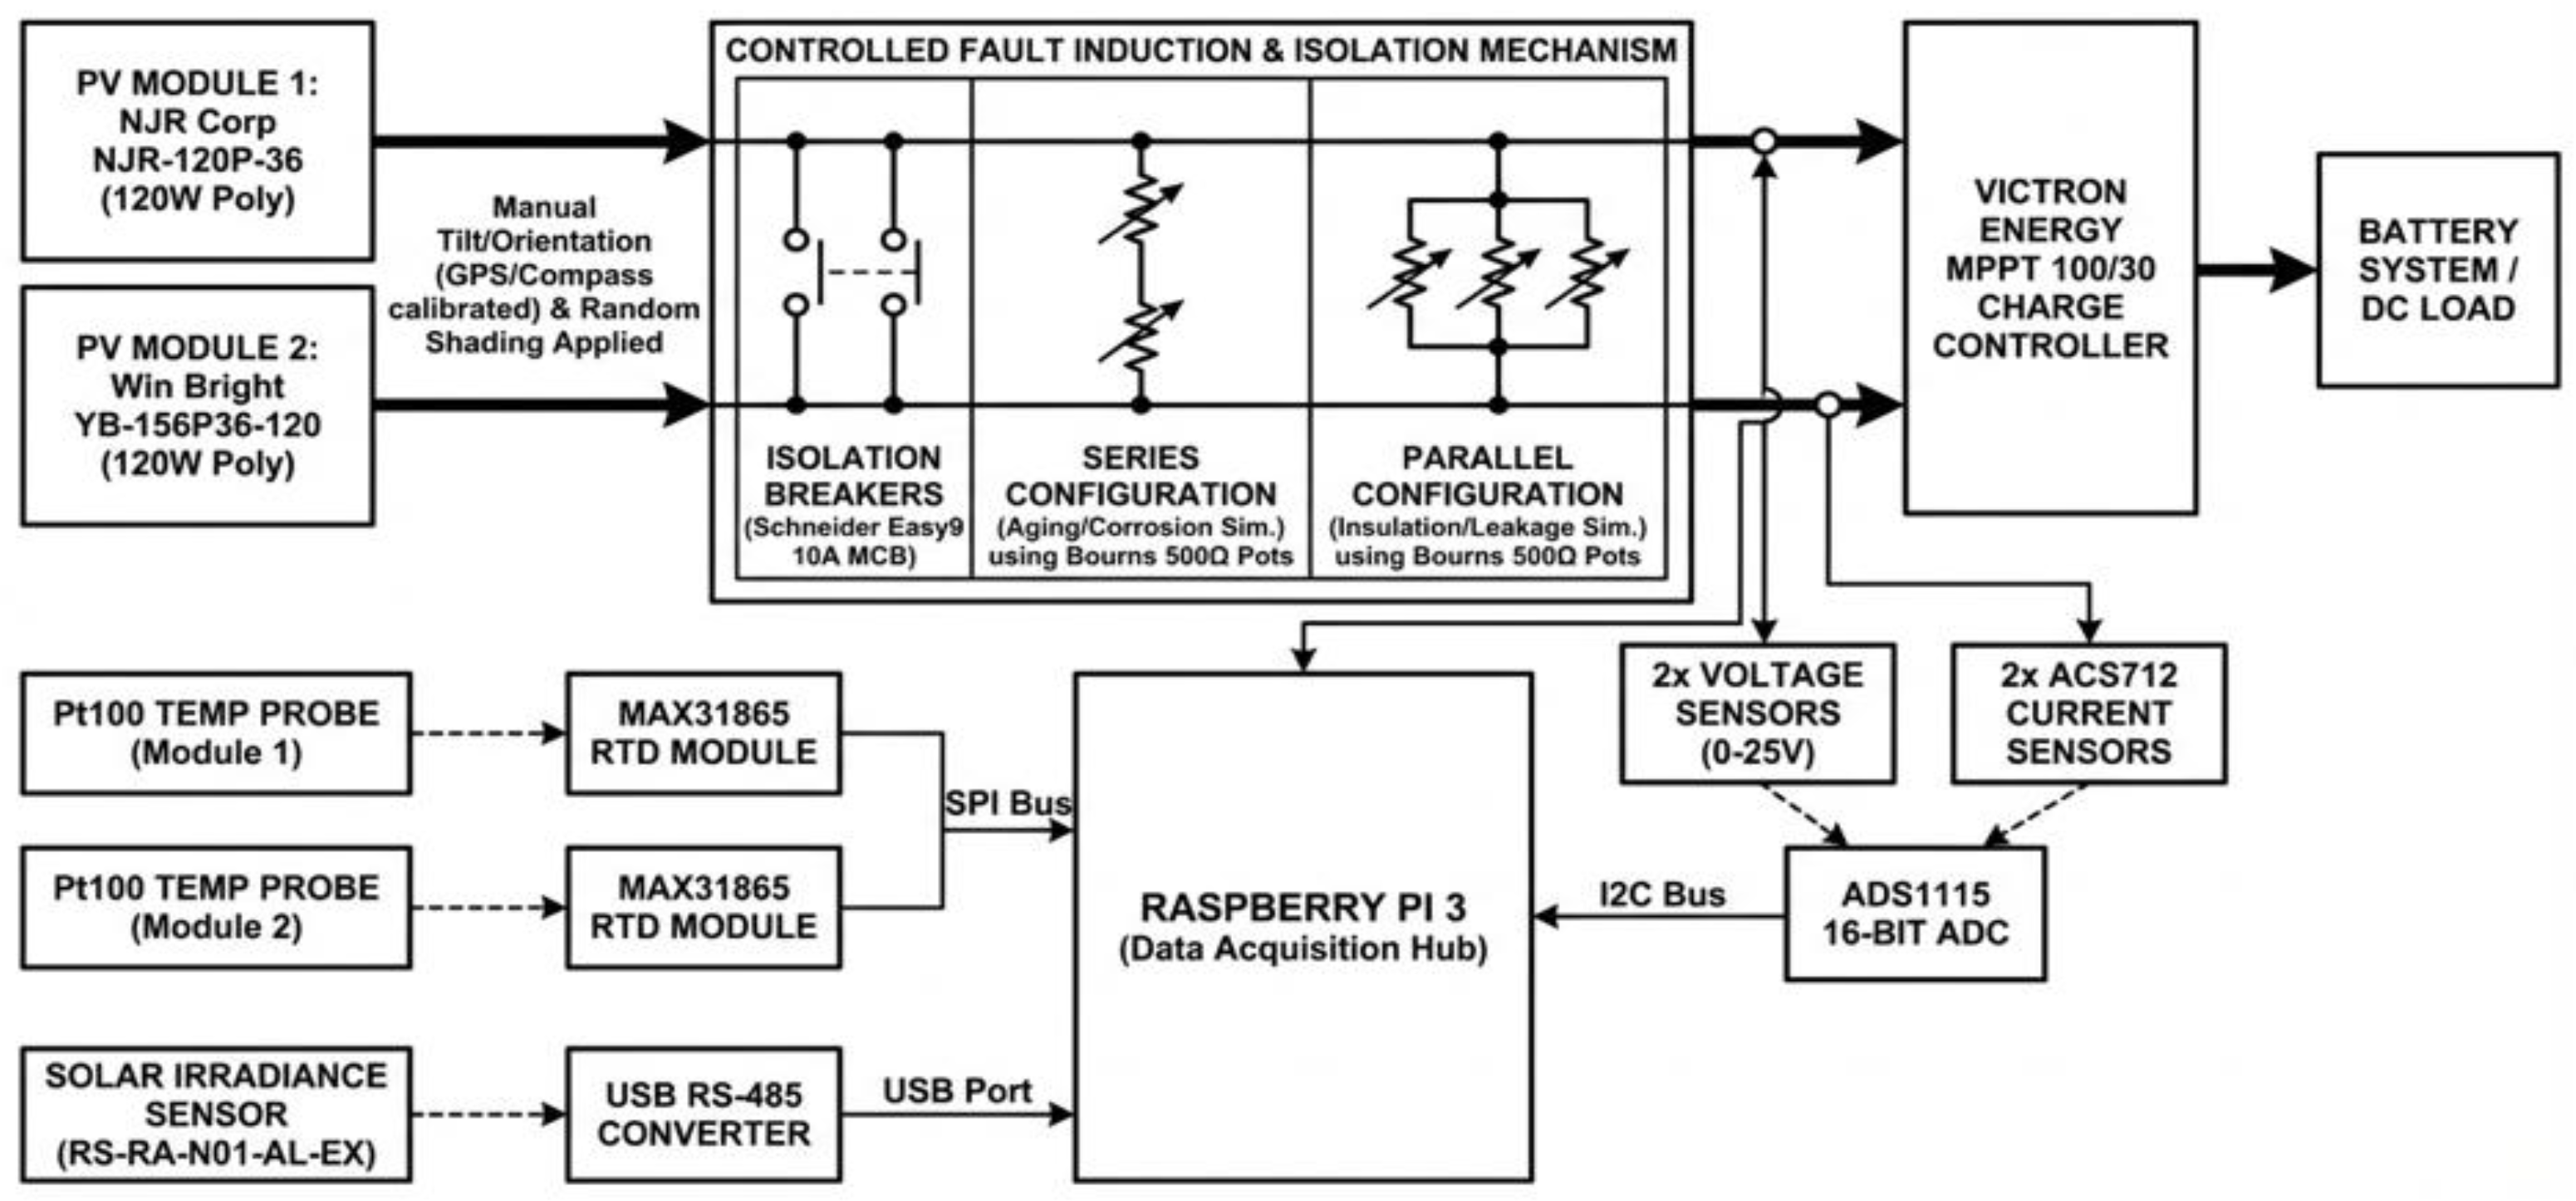
The power-generation unit is built around two distinct polycrystalline solar modules, chosen to enable comparative performance and robustness analysis for diagnostic models. Subsystem S1 uses an NJR-120P-36 module (peak power 120 W, Vmpp=17.2 V, Impp=6.97 A); subsystem S2 uses a Win Bright YB-156P36-120 module (peak power 120 W, Vmpp=18 V, Impp=6.66 A). Energy management and the charging of a 12 V/150 Ah Euronet gel battery are regulated by a Victron Energy MPPT 100/30 IP43 controller, ensuring precise Maximum Power Point Tracking throughout the acquisition phase in accordance with industry-standard conversion protocols.
3.2. Acquisition System and IoT Architecture
The monitoring architecture is centered on a Raspberry Pi 3 hub, which serves as the primary engine for the sensor network and IoT-based data logging. All analog signals (current and voltage) are digitized by a 16-bit ADS1115 analog-to-digital converter (ADC) over the I2C bus, providing the signal integrity required to capture subtle electrical transients for fault fingerprinting. The electrical sensing suite integrates two ACS712 current sensors and two 0-25 V voltage-sensor modules to monitor both panels simultaneously. A USB RS-485 (Modbus protocol) converter transmits data from the environmental sensors to the central hub, while module temperature is tracked by two Pt100 probes interfaced through MAX31865 RTD-to-digital modules.
Figure 7.
Synoptic diagram of the experimental PV testbed and data-acquisition architecture.
3.3. Controlled Fault Induction and Geospatial Calibration
A defining feature of the testbed is the controlled physical fault-induction mechanism engineered for prognosis research. Degradation is reproduced using Schneider Easy9 MCB 10A circuit breakers and two Mexico Bourns 3090S-2-501L 500-ohm precision potentiometers connected to the NJR-120P-36 and Win Bright YB-156P36-120 panels. Aging is emulated through a series configuration (reproducing corrosion and contact oxidation) followed by a parallel reconfiguration (reproducing insulation failure and earth leakage); this sequential hardware-in-the-loop approach captures authentic non-linear signatures of both degradation modes under tropical operational stress. Schneider Easy9 MCB 10A breakers isolate circuits for open-circuit and short-circuit emulation, and partial shading is manually induced by covering sections of the panel surfaces at variable intervals to replicate real-world obstructions. Geospatial accuracy in Douala, Cameroon, was validated with a Garmin GPSMAP 64S and a professional clinometer, confirming coordinates of 4.0511° N, 9.7679° E, a True South orientation, and a fixed 10° tilt angle optimized for the intertropical zone.
3.4. Data Pre-Processing and Feature Engineering
Raw telemetry harvested via the Raspberry Pi 3 underwent a multi-stage pre-processing sequence to produce a high-fidelity foundation for multivariate time-series analysis, transforming noisy, asynchronous signals into a synchronized, structured dataset suitable for predictive modeling.
Data cleaning and outlier mitigation: transient artefacts associated with sensor warm-up intervals and intermittent signal dropouts were removed, and statistical anomalies were identified and neutralized using Z-score thresholding (|Z| > 3, corresponding to the conventional three-sigma rule, under which approximately 99.7% of normally distributed observations are expected to fall within bounds), refining the dataset from 285,504 raw entries to 226,175 high-quality observations, a retention rate of 79.2%.
Multi-rate temporal synchronization: the acquisition protocol used heterogeneous sampling frequencies: a 1s period (1 Hz) for electrical parameters (current and voltage) and a 2s period (0.5 Hz) for environmental metrics (irradiance and temperature). To resolve this disparity while preserving the dimensionality required for multivariate deep learning, a 1s master clock was used as the reference index, and gaps in the 2s environmental streams were filled by linear interpolation (equivalent to pandas.DataFrame.interpolate (method=‘linear’) in the Python data-analysis ecosystem), synthesizing a uniform temporal grid that preserves causal integrity without discarding higher-frequency electrical data.
4. User Notes
While PV-Fault-DS226 offers high-fidelity, granular measurements and authentic physical failure signatures, several constraints should be considered before extrapolation or model training:
- ▪
- Seasonal and climatic scope: acquisition was restricted to January, which in Douala corresponds to the dry season under the influence of the northeast monsoon and Harmattan winds. Recorded irradiance and thermal profiles may therefore not fully represent rainy-season dynamics (persistent cloud cover, attenuated solar flux, and lower ambient temperatures).
- ▪
- Geographic and environmental context: the testbed is located in a tropical coastal urban environment, so recorded fault signatures are linked to high relative humidity and urban particulate deposition (soiling). Applications to arid or temperate climates may require a recalibration phase.
- ▪
- Technology specificity: the study used exclusively polycrystalline silicon modules (NJR and Win Bright). Although faults were induced via external hardware, degradation slopes and transient responses may differ for monocrystalline or thin-film technologies owing to distinct fill factors and thermal coefficients.
- ▪
- Manual shading emulation: partial-shading events were generated manually at stochastic intervals; the precise intensity and duration of shading on individual cells were not monitored by localized micro-sensors but are instead characterized indirectly through fluctuations in I1, I2, V1, and V2.
- ▪
- Diagnostic threshold boundary: because Table 3 reflects thresholds empirically calibrated from real outdoor measurements rather than theoretically idealized boundaries, two narrow transition regions exist between adjacent operating states: at (i) V ≥ 14 V and 0.0055 ≤ I/Irr < 0.0065 A.m2/W, and (ii) at 12 V ≤ V < 14 V combined with I ≥ 1.0 A. This is an expected consequence of deriving discrete class boundaries from continuous physical measurements under real, variable outdoor conditions, rather than from simulated or idealized data. Observations within these narrow bands were resolved by fallback assignment step in the labeling pipeline. Users applying alternative or stricter labeling schemes should be aware of these transition regions when re-deriving fault labels from the raw acquisition file.
- ▪
- Temporal scope for prognosis: the 11-day monitoring window captures short-term progression of induced (accelerated) faults, sufficient for training deep-learning architectures to identify fault patterns, but it does not reflect long-term natural aging mechanisms such as EVA yellowing or UV-induced browning, which occur over decadal scales.
Taken together, these constraints do not diminish the dataset’s core contribution: an authentic, hardware-induced, tropical-climate ground truth that fills a well-documented gap in the photovoltaic fault-diagnosis literature. Researchers are encouraged to combine PV-Fault-DS226 with complementary datasets covering other climates, seasons, or module technologies to build diagnostic and prognostic models that generalize beyond the specific conditions captured here.
Author Contributions
Conceptualization, Wangkake TAIWE, Richard NASSO TOUMBA and Noel DJONGYANG; methodology, Wangkake TAIWE and Richard NASSO TOUMBA; software, Richard NASSO TOUMBA; validation, Wangkake TAIWE and Richard NASSO TOUMBA; formal analysis, Wangkake TAIWE, Richard NASSO TOUMBA and Noel DJONGYANG; investigation, Wangkake TAIWE, Richard NASSO TOUMBA and Noel DJONGYANG; data curation, Noel DJONGYANG; writing original draft preparation, Wangkake TAIWE and Richard NASSO TOUMBA; writing review and editing, Noel DJONGYANG; visualization, Wangkake TAIWE All authors have read and agreed to the published version of the manuscript.
Funding
This research received no external funding.
Institutional Review Board Statement
Not applicable. This research involved no human participants, human data, or animal experimentation; all measurements were obtained from an automated, non-intrusive experimental PV testbed.
Informed Consent Statement
Not applicable.
Data Availability Statement
The data presented in this study are openly available in Zenodo at https://doi.org/10.5281/zenodo.19259504.
Acknowledgments
The authors thank La Catho Saint Jérôme University Institute for providing the physical site required for the installation of the experimental setup. The technical environment and infrastructure facilitated by the institution were essential to the successful execution of the data-acquisition protocols described in this study.
Conflicts of Interest
The authors declare no conflicts of interest.
References
- Afonso, D.; Mesbahi, O.; Bouich, A.; Tlemçani, M. Influence of Long-Term and Short-Term Solar Ra-diation and Temperature Exposure on the Material Properties and Performance of Photovoltaic Panels: A Comprehensive Review. Energies 2025, 18, 5072. [Google Scholar] [CrossRef]
- Sepúlveda-Oviedo, E.H.; Estibals, B. Framework for effective PV system instrumentation focused on fault diagnosis. Sol. Energy Adv. 2025, 5, 100112. [Google Scholar] [CrossRef]
- Quiles-Cucarella, E.; Sánchez-Roca, P.; Agustí-Mercader, I. Performance Optimization of Machine-Learning Algorithms for Fault Detection and Diagnosis in PV Systems. Electronics 2025, 14, 1709. [Google Scholar] [CrossRef]
- Köntges, M.; Lin, J.; Virtuani, A.; Eder, G.C.; Zhu, J.; Oreski, G.; Hacke, P.; Stein, J.S.; Bruckman, L.; Gebhardt, P.; et al. Degradation and Failure Modes in New Photovoltaic Cell and Module Technologies; IEA PVPS Task 13 Report T13-30:2025. International Energy Agency Photovoltaic Power Systems Pro-gramme (IEA-PVPS), 2025.
- Mucomole, F.V.; Silva, C.A.S.; Magaia, L.L. Experimental Parametric Forecast of Solar Energy over Time: Sample Data Descriptor. Data 2025, 10, 37. [Google Scholar] [CrossRef]
- Chen, Z.; Han, F.; Wu, L.; Yu, J.; Cheng, S.; Lin, P.; Chen, H. Random forest based intelligent fault diagnosis for PV arrays using array voltage and string currents. Energy Convers. Manag. 2018, 178, 250–264. [Google Scholar] [CrossRef]
- Chen, Z.; Chen, Y.; Wu, L.; Cheng, S.; Lin, P. Deep residual network based fault detection and diagno-sis of photovoltaic arrays using current-voltage curves and ambient conditions. Energy Convers. Manag. 2019, 198, 111793. [Google Scholar] [CrossRef]
- Gao, W.; Wai, R.-J. A novel fault identification method for photovoltaic array via convolutional neural network and residual gated recurrent unit. IEEE Access 2020, 8, 159449–159461. [Google Scholar] [CrossRef]
- Lazzaretti, A.E.; Costa, C.H.; Rodrigues, M.P.; Yamada, G.D.; de Oliveira, G.L.; Lima, L.L.; Canciglie-ri Junior, O. A Monitoring System for Online Fault Detection and Classification in Photovoltaic Plants. Sensors 2020, 20, 4688. [Google Scholar] [CrossRef] [PubMed]
Figure 1.
Class distribution per subsystem for the PV-Fault-DS226 dataset.
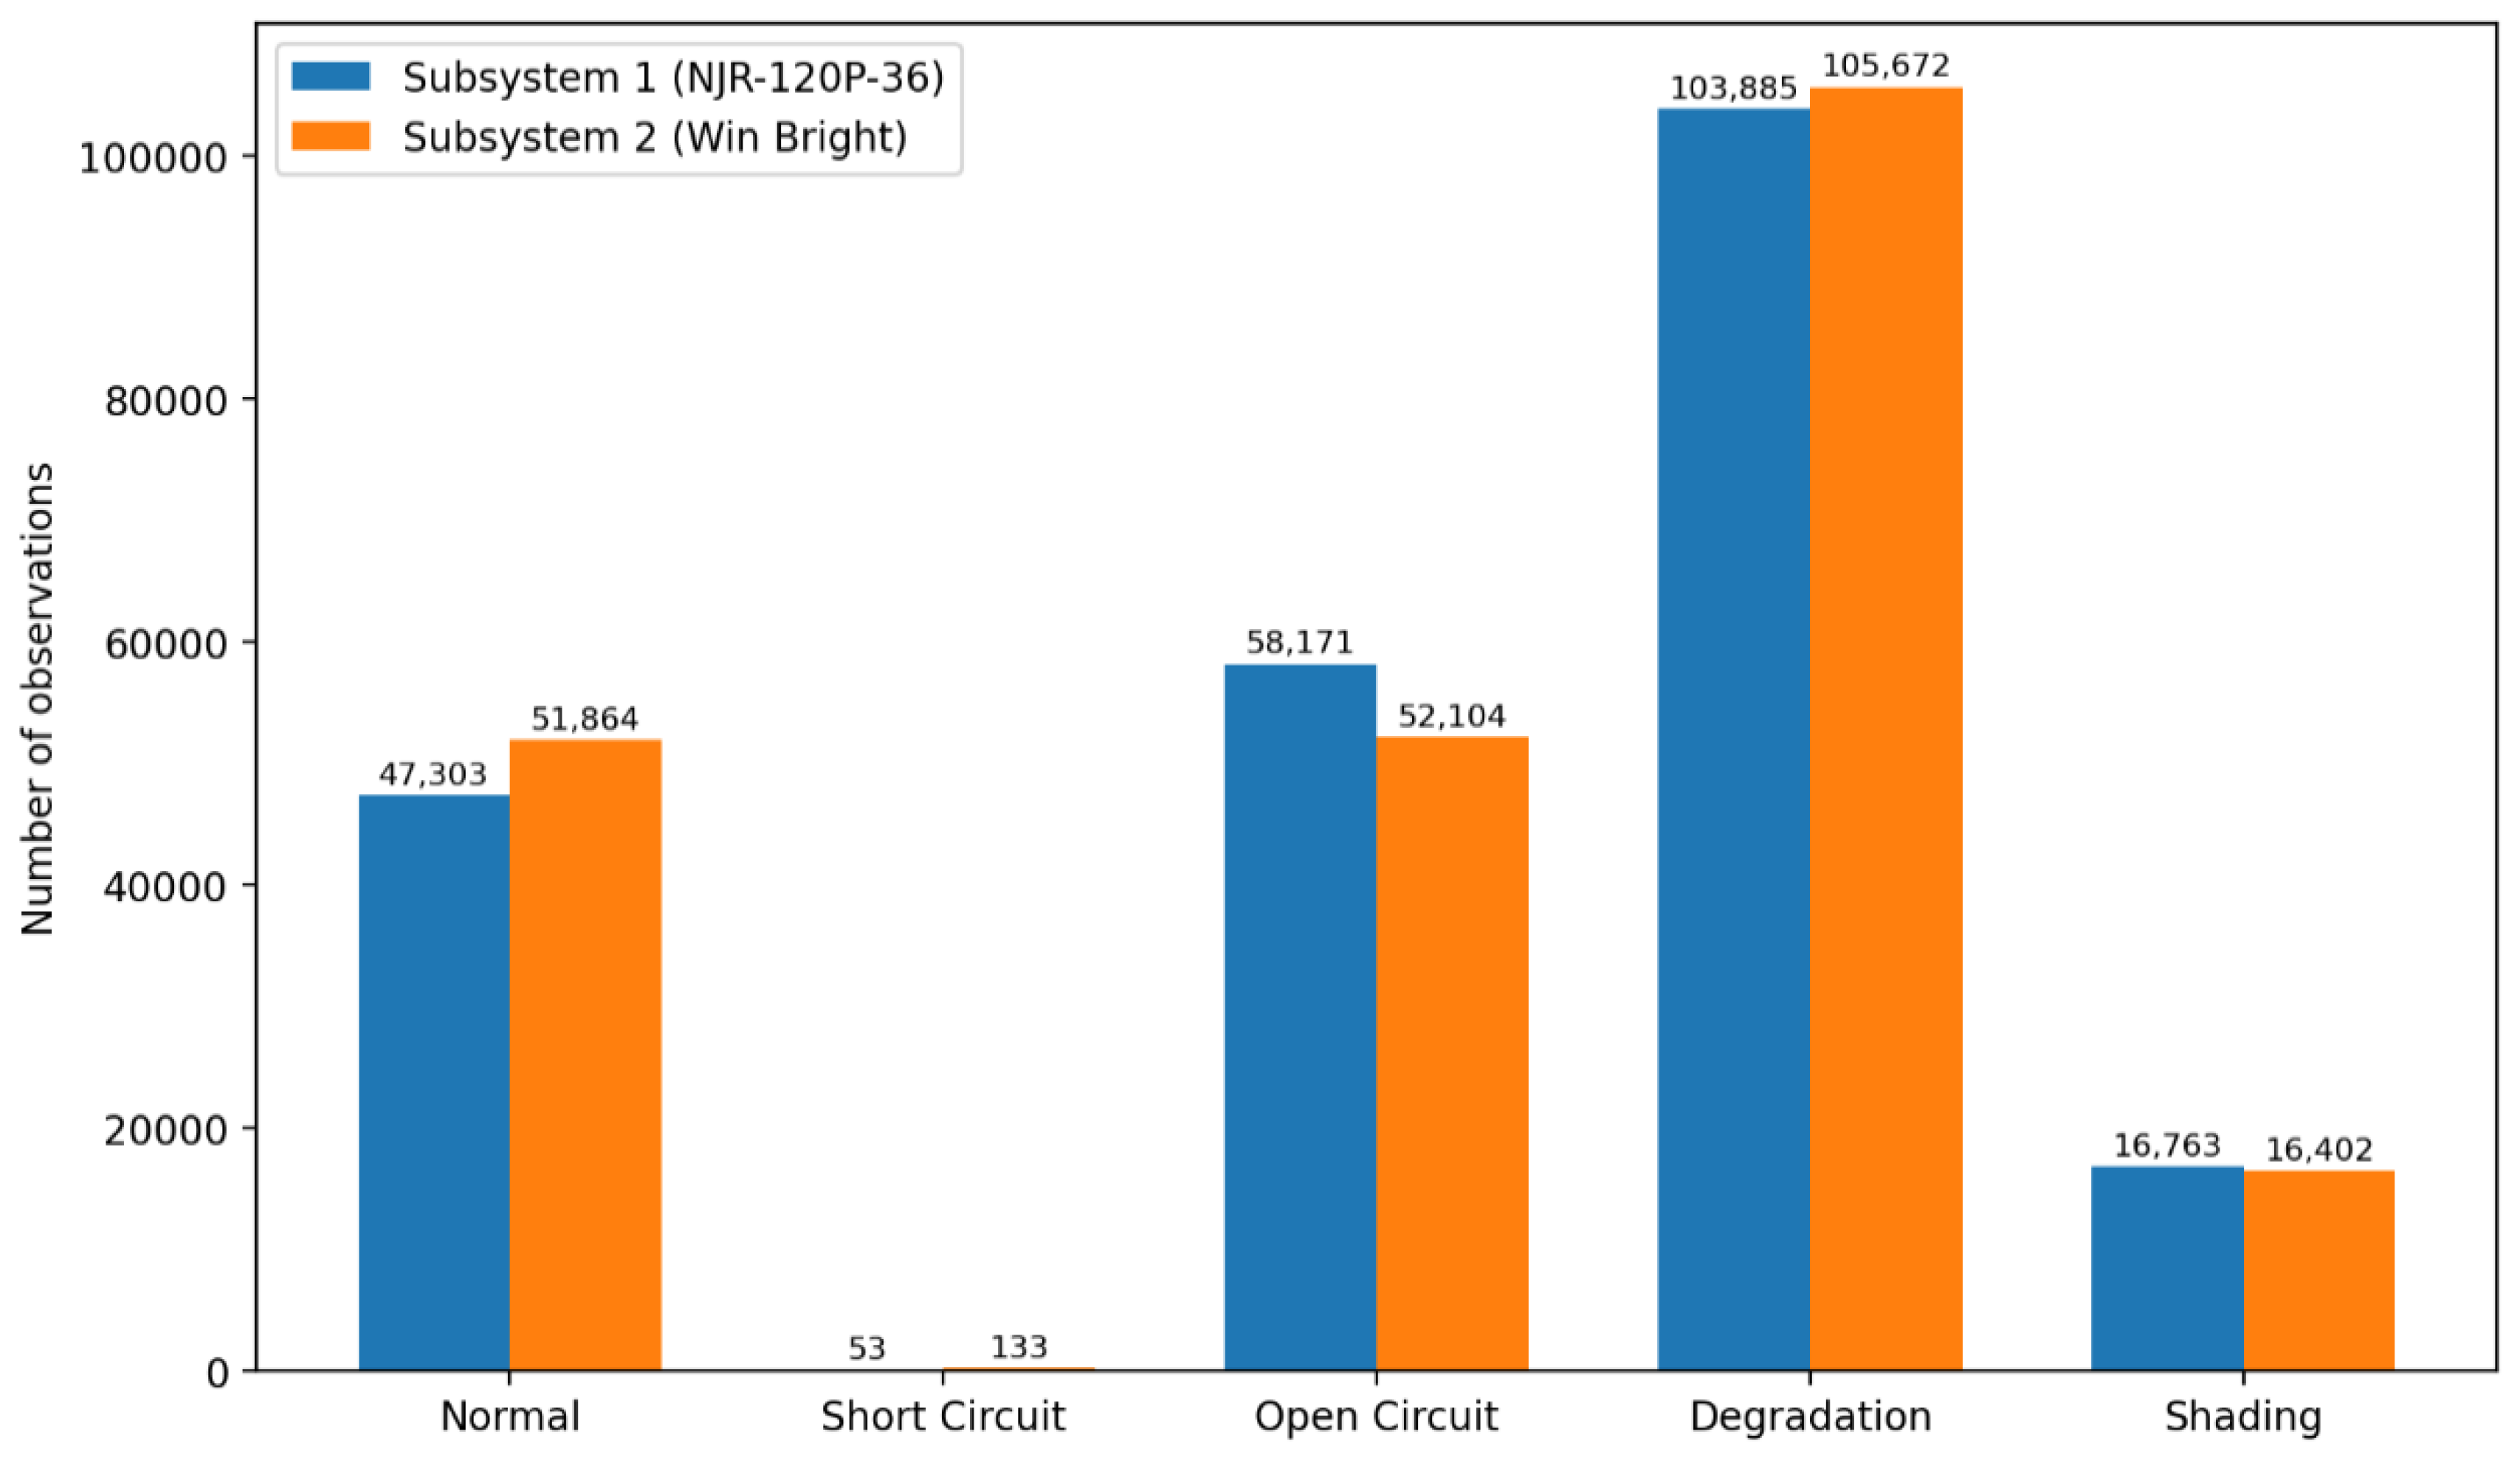
Figure 2.
Correlation matrix of the nine numerical variables in the PV-Fault-DS226 dataset.
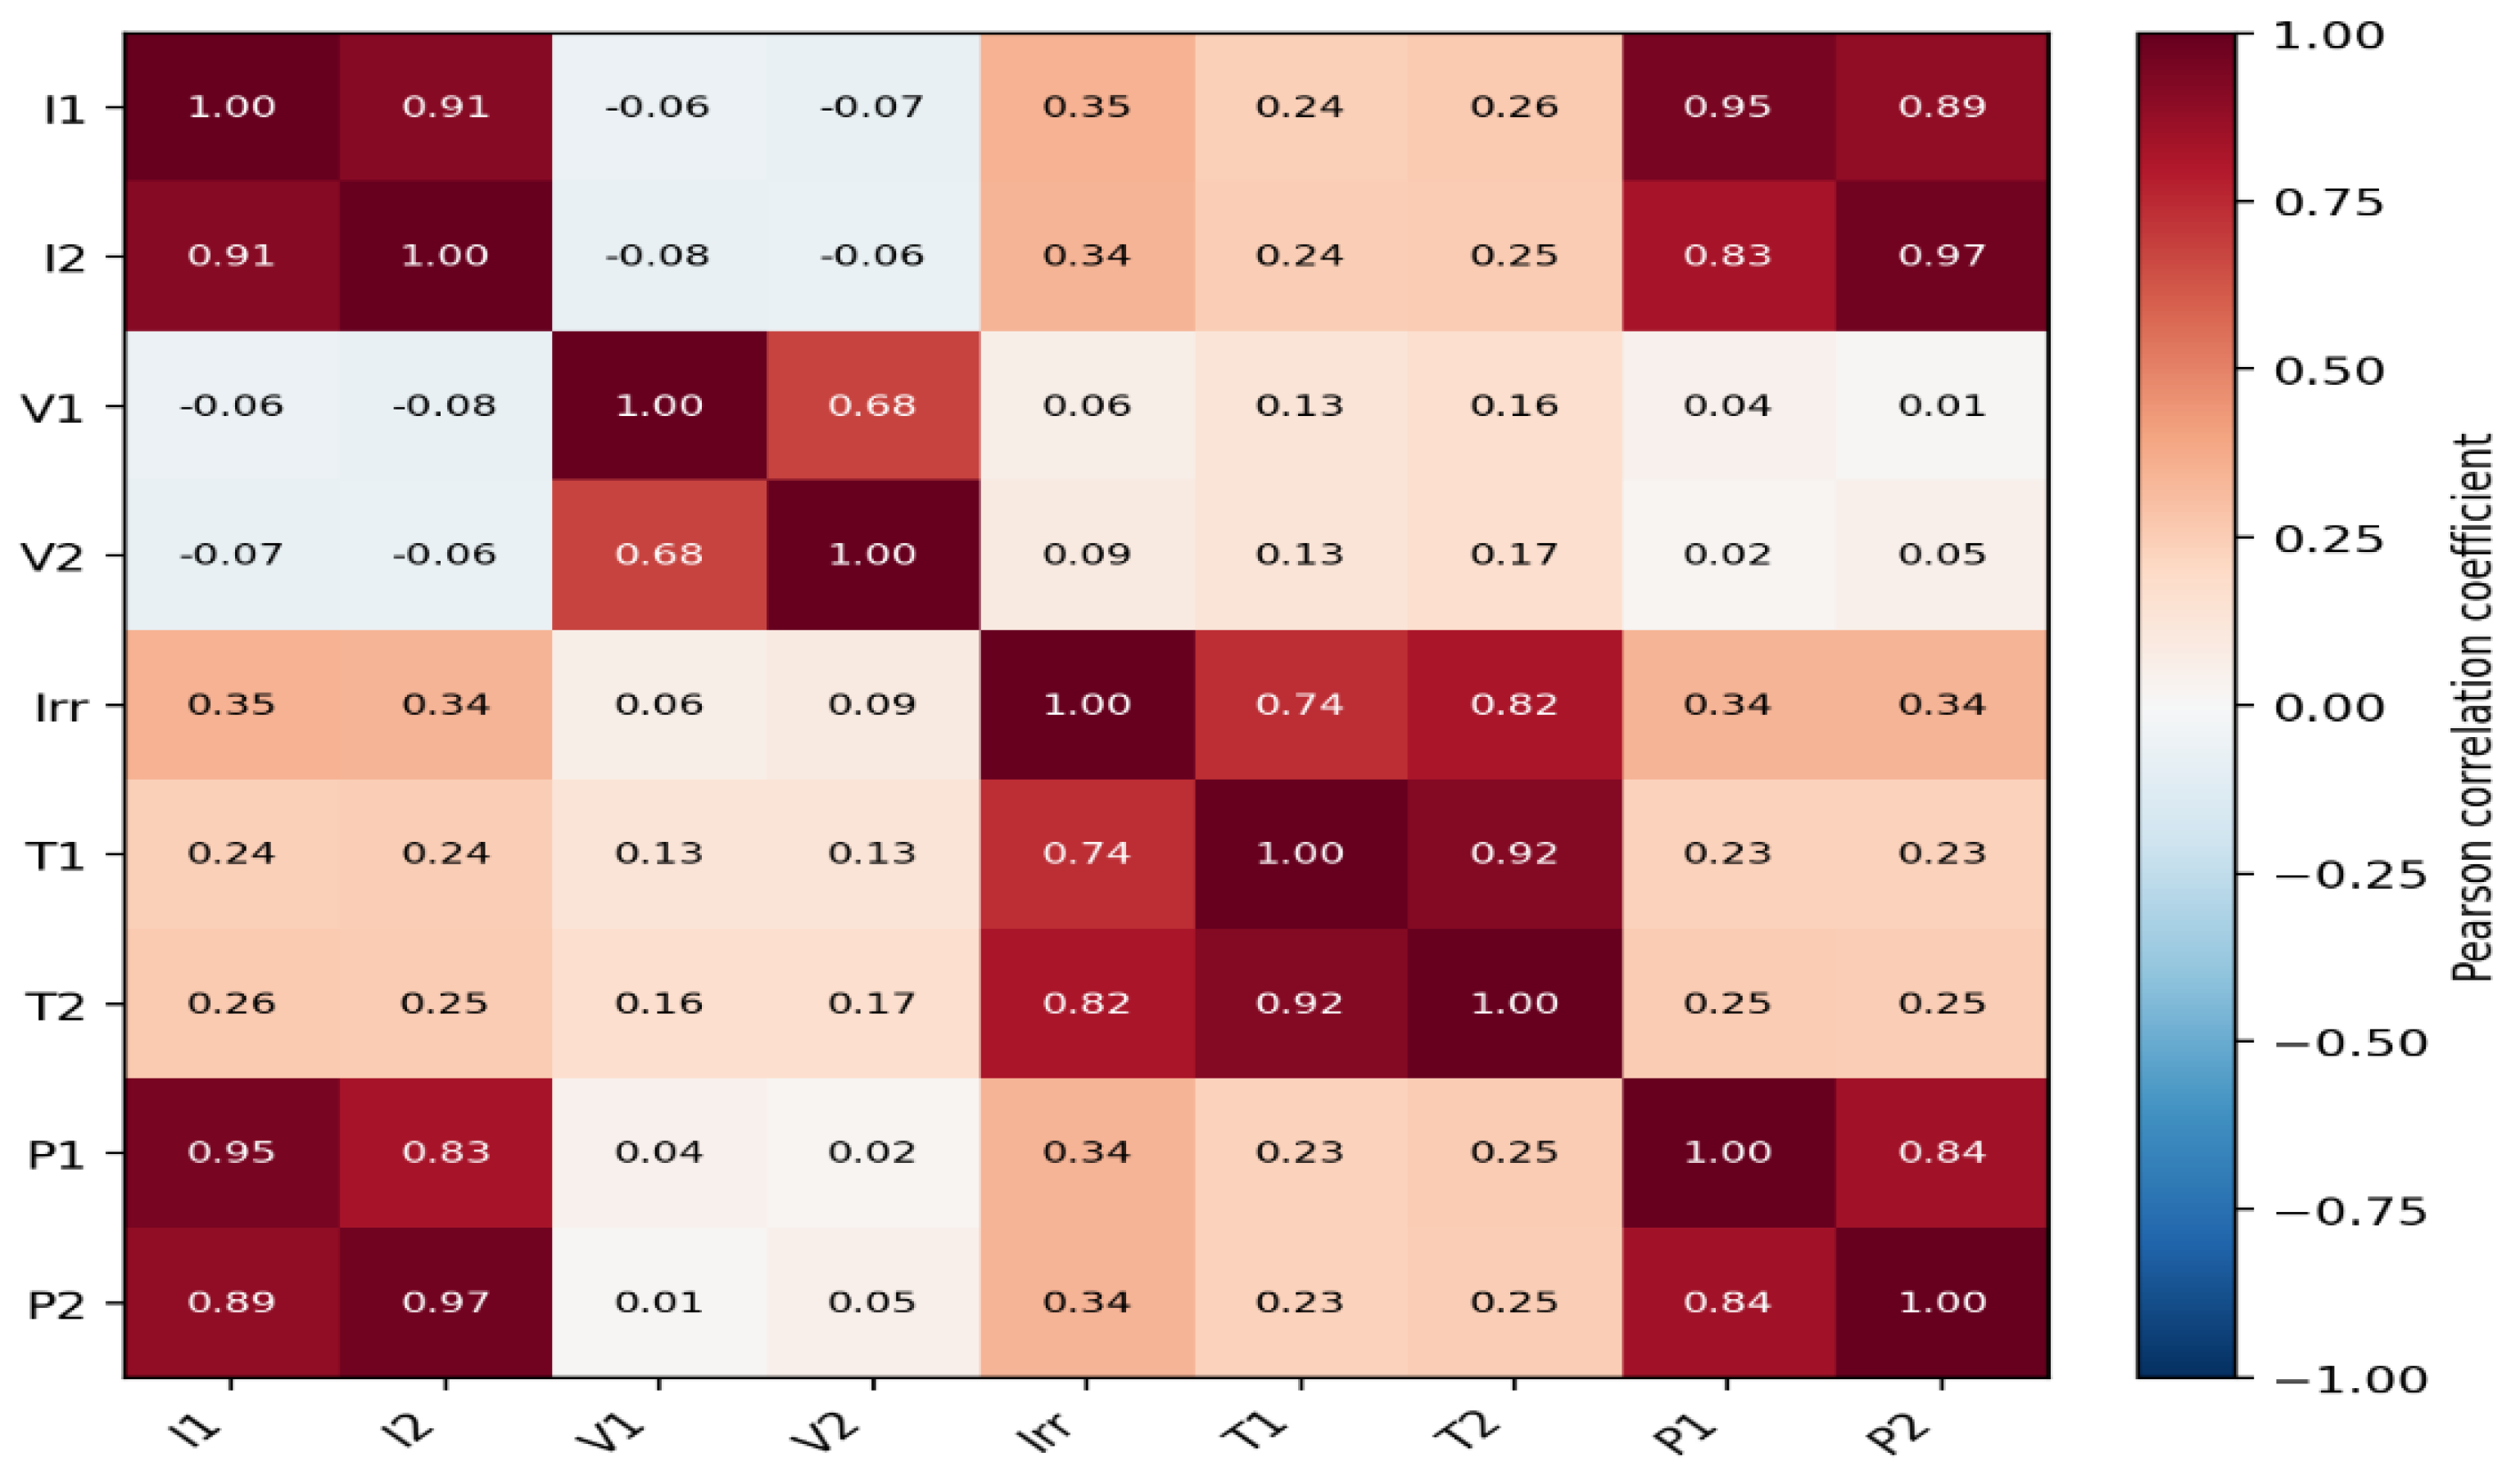
Figure 3.
Three-hour temporal snapshot of the seven synchronized acquisition channels.
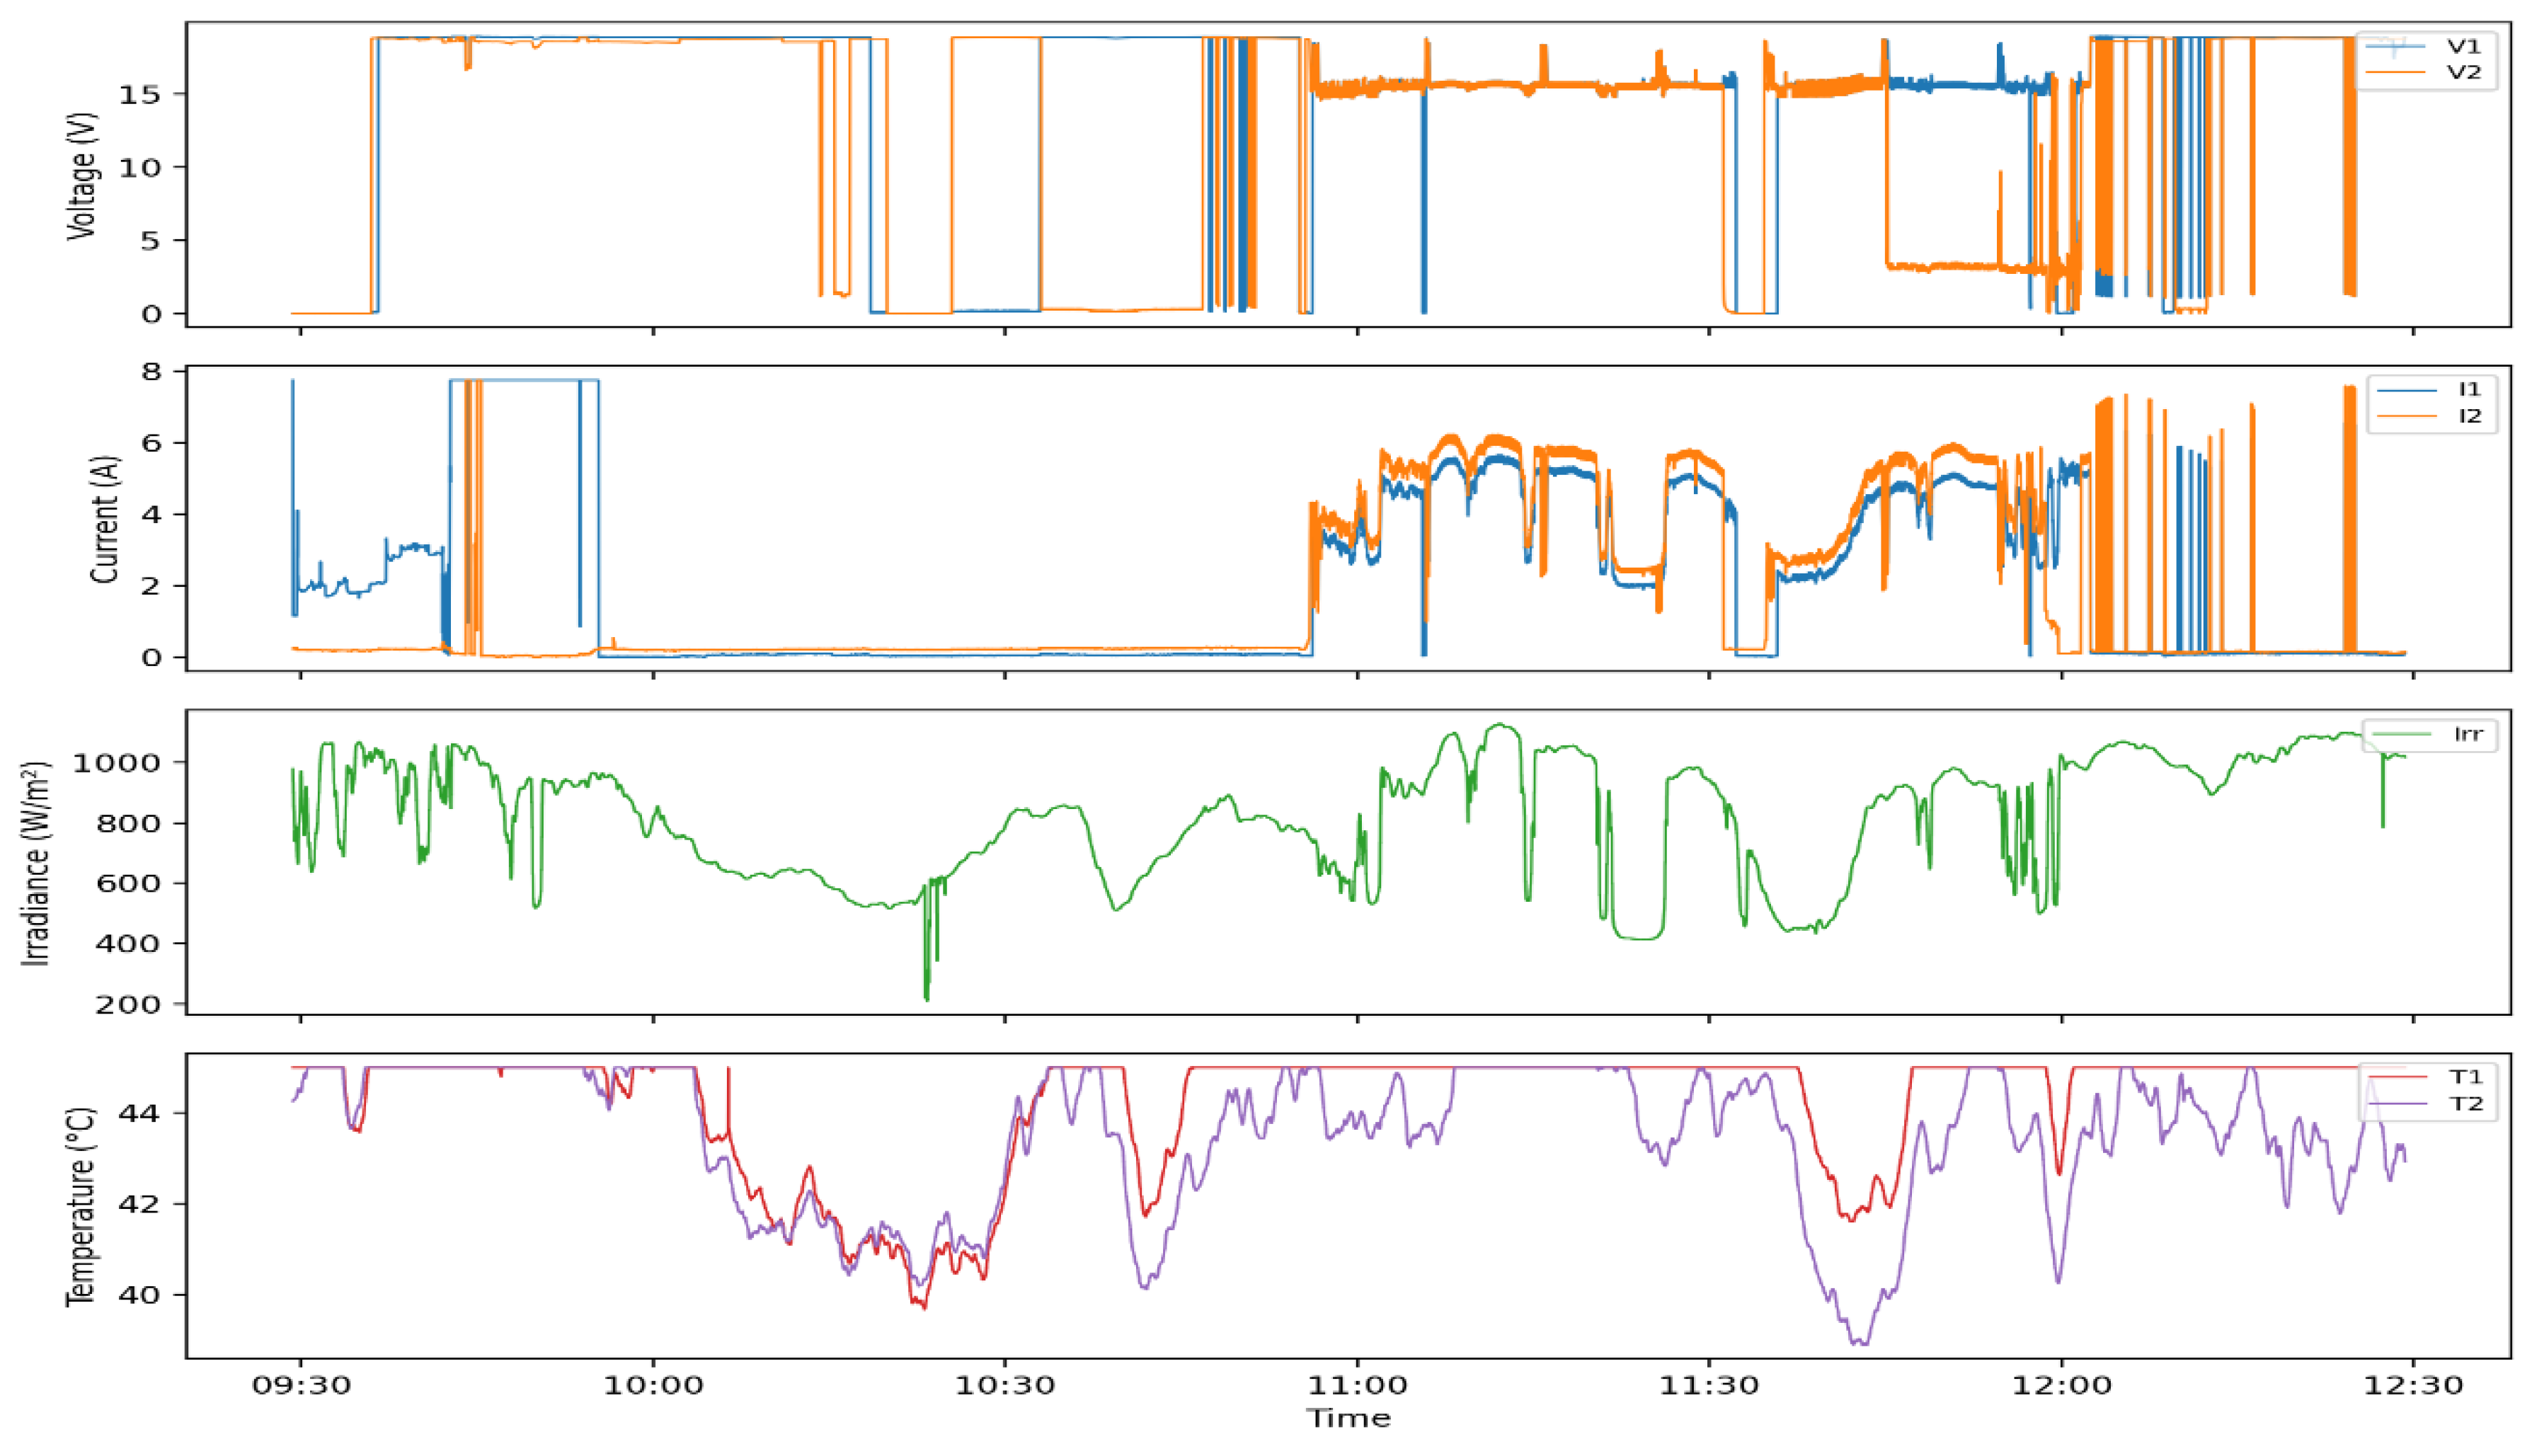
Table 1.
Nominal electrical characteristics of the two photovoltaic subsystems under Standard Test Conditions.
Table 1.
Nominal electrical characteristics of the two photovoltaic subsystems under Standard Test Conditions.
| Parameter (STC) | Symbol | PV1 (NJR-120P-36) | PV2 (Win Bright YB-156P36-120) |
|---|---|---|---|
| Rated power | Pmp | 120 W | 120 W |
| Open-circuit voltage | Voc | 21.8 V | 22.0 V |
| Short-circuit current | Isc | 7.75 A | 7.01 A |
| Max.-power voltage | Vmp | 17.2 V | 18.0 V |
| Max.-power current | Imp | 6.97 A | 6.66 A |
Table 4.
Descriptive statistics of the seven primary sensor channels.
| Variable | Mean | Std. Dev. | Min | Max |
|---|---|---|---|---|
| Irr (W/m2) | 599.58 | 266.94 | 0.00 | 1154.00 |
| V1 (V) | 15.96 | 3.73 | 0.00 | 19.00 |
| V2 (V) | 15.80 | 3.98 | 0.00 | 18.97 |
| I1 (A) | 1.67 | 1.73 | 0.00 | 7.75 |
| I2 (A) | 1.68 | 1.71 | 0.00 | 7.75 |
| T1 (°C) | 39.86 | 5.10 | 22.76 | 45.00 |
| T2 (°C) | 39.69 | 4.99 | 24.18 | 45.00 |
Table 5.
Class distribution per system.
| Class | Subsystem 1 (n, %) | Subsystem 2 (n, %) |
|---|---|---|
| Degradation | 103,885 (45.93%) | 105,672 (46.72%) |
| Open Circuit | 58,171 (25.72%) | 52,104 (23.04%) |
| Normal | 47,303 (20.91%) | 51,864 (22.93%) |
| Shading | 16,763 (7.41%) | 16,402 (7.25%) |
| Short Circuit | 53 (0.02%) | 133 (0.06%) |
Disclaimer/Publisher’s Note: The statements, opinions and data contained in all publications are solely those of the individual author(s) and contributor(s) and not of MDPI and/or the editor(s). MDPI and/or the editor(s) disclaim responsibility for any injury to people or property resulting from any ideas, methods, instructions or products referred to in the content. |
© 2026 by the authors. Licensee MDPI, Basel, Switzerland. This article is an open access article distributed under the terms and conditions of the Creative Commons Attribution (CC BY) license (http://creativecommons.org/licenses/by/4.0/).
Copyright: This open access article is published under a Creative Commons CC BY 4.0 license, which permit the free download, distribution, and reuse, provided that the author and preprint are cited in any reuse.