

Submitted:
31 July 2026
Posted:
31 July 2026
You are already at the latest version
Abstract
Portable, noninvasive analysis of biofluids demands methods that couple chemical specificity with low cost and minimal instrumentation. We report a self-powered triboelectric spectrometry platform based on an aqueous-analyte triboelectric nanogenerator (LS-TENG) that converts the motion of a single droplet into an electrode-ordered sequence of transferred charge, forming a “triboelectric spectrum.” A 16-electrode copper array on a PMMA substrate, overlaid with FEP, encodes the droplet’s passage and enables spatially resolved signal acquisition. Across eight metabolite-relevant solutions (NaCl, KCl, CaCl₂, NH₄Cl, glucose, urea, lactic acid, uric acid), three-dimensional Q–position–concentration maps (5–30 mM) reveal concentration-dependent modulation of the response: ionic solutions show attenuation at higher concentration consistent with interfacial site saturation and electrostatic screening, whereas polar non-ionic solutes exhibit divergent trends (growth for glucose/urea; suppression for lactic/uric acid) attributable to interfacial orientation, double-layer formation, and hydronium-mediated screening. To decouple classification from amplitude–concentration collinearity, we train exclusively on 5 mM data. After standardized preprocessing and pulse segmentation, a three-convolution CNN operating on time-by-electrode tensors achieves 95.3% five-fold cross-validated accuracy with diagonal-dominant confusion matrices and stable learning curves. The LS-TENG platform is self-powered, structurally simple, and supports sub-second, single-droplet measurements, yielding generalizable composition fingerprints suitable for rapid home- or field-based identification and offering a practical route toward portable, point-of-care chemical sensing.
Keywords:
triboelectric spectroscopy
; machine learning
; metabolite analysis
; signal processing
Introduction
The growing emphasis on global health management and early disease screening has established biofluid analysis as a cornerstone of smart healthcare, personalized therapy, and home-based health monitoring. This is particularly evident in the real-time tracking of biomarkers within metabolic fluids like urine and sweat—such as sodium ions, glucose, urea, and lactic acid—serve not only as indicators of renal function and metabolic status but also as potential early warning signs for neurological disorders [1,2,3,4]. Despite the high sensitivity offered by established analytical techniques (e.g., spectroscopy, electrochemistry, and chromatography) in laboratory environments, their dependence on costly instrumentation, complex operational protocols, and reagent-intensive procedures hinders their applicability for routine, portable, and non-invasive testing [5,6,7]. This limitation is especially pronounced in scenarios requiring rapid diagnostics and personalized health management. Consequently, there is a pressing demand for the development of novel, cost-effective, and efficient detection technologies to address the evolving needs of modern healthcare.
Amid growing demand for intelligent health monitoring, triboelectric nanogenerator (TENG)-based sensors have attracted considerable research interest. These self-powered devices are characterized by their structural simplicity, cost-effectiveness, and independence from external power sources, making them highly suitable for a wide range of applications [8,9,10]. These include environmental monitoring [11,12,13], wearable systems [14,15,16], and biomedical sensing [17,18,19], where their unique attributes offer distinct advantages over conventional sensing technologies [20,21]. The triboelectric effect, orginiates from contact and separation at material interfaces, faciliting electrostatic induction and charge transfer; Specifically, at the liquid–solid interface, this process involves both electron transfer and ion adsorption, yielding measurable and quantifiable electrical signals [22,23,24,25]. A representative case occurs when a water droplet traverses a fluorinated ethylene propylene (FEP) surface: electrons transfer from the water to FEP, imparting a negative charge to the FEP and leaving the droplet positively charged, while cations within the droplet may become electrostatically adsorbed at the interface [24,26,27]. These interfacial phenomena establish a physical foundation for sensing modalities that enable sensitive, cost-effective, and non-invasive real-time monitoring of the biofluids. Capitalizing on this principle, triboelectric spectrometry (TES) has emerged as a facile, but effecitve approach to chemical, biological, and envionmental analysis. TES captures the charge-transfer spectra generated by droplets sliding over a surface and leverages fluid-specific chemical characteristics to perform both qualitative and quantitative analyses [28,29,30,31,32]. Recent advances in liquid–solid triboelectric sensing have extended droplet-based TENG/TES concepts to urine and other biofluids, enabling noninvasive monitoring of electrolyte- and metabolite-relevant biomarkers and facilitating integration with intelligent health-monitoring platforms [33,34]. Meanwhile, systematic droplet-TENG/TES studies have shown that interfacial charge generation and electrostatic induction are strongly governed by liquid chemistry (e.g., ion identity, concentration, and acid–base state), and that electrode-resolved measurements during droplet sliding can yield analyte-dependent charge-transfer signatures for in situ discrimination [28]. Accordingly, in this work we define TES as the electrode-indexed transferred-charge sequence produced by a single droplet transit and use it as a composition-dependent fingerprint for subsequent quantification and CNN-assisted classification [35,36]. Compared with conventional methods, TES requires minimal sample preparation and offers high sensitivity and straightforward manipuility, highlighting its considerable potential in biofluid analysis and environmental monitoring [37,38,39].
Here, we propose a low-cost, efficient, and portable biofluid analysis method leveraging the princple of TES, assisted with a liquid-solid TENG sensing array platform. The biofluid analysis sensing platform consists of 16 copper electrode array patterned on a polymethyl methacrylate (PMMA) substrate and encapsulated with a highly electronegative FEP film, constructing the main component of the triboelectric sensing and electrostatic spectrometry. As droplets of metabolite solutions—spanning various concentrations of glucose, lactic acid, urea, uric acid, sodium chloride, and related analytes—traversed the electrode array, the resultant triboelectric sensing signals were recorded and systematically analyzed. Due to analyte-specific interfacial charge-transfer dynamics, the metabolite analytes can induce a series of distinct signals in real-time when flowing through each sensing electrode. By incorporating a convolutional neural network (CNN) for machine-learning-assisted classification, the system demonstrated a high identification accuracy exceeding 95% in distinguishing different solution types. This integrated approach not only provides a practical route for sophisticated biofluid analysis but also shows significant promise for application in on-site and point-of-care health monitoring.
Results and Discussion
Figure 1 presents the core design of a self-powered platform for metabolite biomarker analysis utilizing an LS-TENG sensing array assisting TES. This platform exploits the triboelectric signals produced by different analyte droplets sliding across the FEP film to construct distinctive triboelectric spectra, thereby enabling label-free identification of solutions with different chemical compositions. As depicted in Figure 1a, the operational workflow begins when droplets containing specific chemical components—in this study, solutions of glucose, lactic acid, urea, uric acid, sodium chloride, potassium chloride, calcium chloride, and ammonium chloride solutions—traverse an inclined FEP surface. The LS-TENG sensing array can readily capture the interfical triboelectrification properties induced by electron transfer and ion adsoprtion and represent this process with specific temporal electrical signals, which are closely related to the analyte species. A high-precision multichannel electrometer (NI PXIe-8880) is utilized to continuously record the transferred electrostaic charge Q from each sensing electrode as the target analyte droplet sequentially traverses the 16 electrically isolated copper electrodes. Due to inherent differences in interfacial triboelectrification, solutions of varying chemical composition generate distinct and characteristic spatial-temporal distribution curves of Q, i.e., the representative TES for different analytes. These spectral profiles form the foundational dataset for subsequent chemical/biomolecular identification and quantification. The structural schematic of the LS-TENG sensing array for TES is presented in Figure 1b. The device employs a multilayer architecture: a PMMA plate serves as the supporting substrate; a patterned 16-copper-electrode array fabricated on this substrate serves to electrostatically sense the charge variations induced by the passing droplets; and a top layer of FEP film, which constitutes the critical liquid–solid interface for the triboelectric charge generation. The interelectrode spacing is optimized to 0.5 cm to effectively minimize electrical crosstalk between adjacent electrodes (Figure S1). By processing the acquired triboelectric spectral data with a convolutional neural network (CNN), as outlined in Figure 1c, the system achieves accurate classification of the eight distinct biofluid analytes. This integrated approach not only facilitates single-droplet diagnostics but also exhibits significant potential for extension to complex physiological biofluid analysis and for the development of scalable, self-powered biofluid sensing networks.
The biofluid analysis platform employs a FEP film as the triboelectric dielectric overlayer. This layer electrically isolates the droplet from the metal electrodes, so that the readout is governed primarily by electrostatic induction through the dielectric. When an analyte droplet slides on the FEP surface, charge separation at the liquid/FEP interface generates interfacial charges and a localized electric field. As the droplet advances along the array, the field distribution evolves with its position as it approaches, covers, and then departs from successive electrode regions. The resulting time-varying field couples capacitively to the underlying copper strip electrodes and drives transient redistribution of induced charge on each channel, producing electrode-resolved electrical signals. By recording these induced charge variations with the multichannel acquisition system and indexing them by electrode order, a spatiotemporally resolved response map can be constructed, defined here as the triboelectric spectrum (TES) of a single droplet transit. Figure 2a shows a magnified view of a deionized (DI) water droplet sliding across the FEP-covered electrode array, highlighting the dielectric isolation and the liquid–solid interface that underpin the induction-based signal generation. The upper panel of Figure 2a further illustrates the temporal evolution at defined electrode coordinates: as the DI water droplet sequentially traverses the copper strips, distinct pulse waveforms arise on individual channels, as exemplified by the signals from the first three electrodes. In this manner, continuous droplet motion is converted into a sequence of 16 spatially indexed pulses, establishing a comprehensive triboelectric profile for the fluid sample. The selection of FEP film as the triboelectric layer is primarily attributed to its superior surface properties. Its strong hydrophobicity facilitates rapid and stable droplet motion, while its pronounced electron affinity enhances interfacial charge transfer between the droplet and the surface, thereby amplifying the strength of the resulting triboelectric signal (Figure S3). Figure 2b shows representative high-speed images of droplets sliding on the FEP film. The corresponding video (Video S1, Supporting Information) is provided to visually document the continuous sliding process along the device. The static contact angle on FEP is also characterized to be 96.75˚, serving as further confirmation of its excellent hydrophobicity and the controllability of droplet motion.
During the experiments, the analyte droplets (≈30 μL per drop) were dispensed at a constant flow rate from a grounded stainless-steel needle using a syringe pump. The needle was positioned approximately 1 cm above the FEP surface. As these droplets slid along the FEP film inclined at 50°, the transferred electrostatic charges Q at different time points synchronously lead to the inducted charges on the underlying copper-electrode array and recorded in real time with the multichanel electrometer. Using DI water as a representative case, the entire detection time—from droplet release to complete traversal of the FEP surface—was completed in less than 1 second. The transferred charge at each electrode position was calculated from the acquired current signals. Based on 20 independent experimental trials of the liquid-solid sliding process (Figure S4), a representative TES was established as shown in Figure 2c. The TES of DI water is dominated by three prominent characteristic peaks, located at approximately 6 cm, 11 cm, and 14 cm along the sliding path. These local maxima are not random artifacts but correspond to specific hydrodynamic stages of the droplet’s motion. The first peak (≈ 6 cm) arises from the initial capillary-inertial oscillation, where the droplet undergoes its first major deformation cycle upon acceleration, temporarily maximizing the contact area. Subsequently, the signal evolves into a broader, double-humped structure comprising the second (≈ 11 cm) and third (≈ 14 cm) peaks. This region represents the stable sliding phase, where the droplet achieves kinetic equilibrium. The global maximum at 14 cm specifically signifies the point of charge saturation, attributed to the optimal spreading of the droplet and the fully established electric double layer at the interface. The discernible dip between 11 cm and 14 cm likely reflects a periodic contraction of the droplet shape, further confirming the high sensitivity of the TES to dynamic fluid behaviors.
To elucidate the sensing mechanism underlying the electrode-resolved TES, Figure 2d (I–IV) illustrates a representative process as the droplet (DI water) passes over the triboelectric sensing electrodes (taking the first four electrodes as the examples). Driven by gravity, the droplet slides along the FEP surface, successively transvers each electrode. Owing to the strong electron affinity of FEP, contact electrification occurs immediately upon intial contact, resulting in electron transfer from water molecules to the FEP surface. This processs renders the FEP negatively charged and the droplet positively charged. During this interaction, a fraction of water molecules ionize to form H2O+, which rapidly converts to H3O+. These cations migrate within the droplet and actively participate in the interfacial charge dynamics. When the droplet reaches the first copper electrode, the electric field established by the positively charged droplet and negatively charged FEP drives H3O+ migration toward the electrode surface. This ion migration, coupled with charge transfer through the electrode and external circuit, establishes a potential difference and results in a measurable transferred-charge signal. As the droplet advances to the second electrode, repeated contact-electrification effect and contact-separation process promote further charge partitioning, accumulation, and redistribution between adjacent electrodes. Each discrete contact–separation cycle between the droplet and one electrode modifies the overall charge distribution, yielding a corresponding transferred-charge signal on each successive electrode. To quantitatively characterize the charge-transfer dynamics during droplet motion, an electrostatic potential model was implemented using the COMSOL Multiphysics finite-element platform. Figure 2e displays the simulated potential distributions, whch correspond to the experimental stages depicted in Figure 2d I–IV. The close agreement between simulation and experiment is evident, with cross-sectional potential maps clearly delineating the dynamic evolution of potential differences across the electrode array.
Based on the foregoing discussion of the system design and signal acquisition, this section systematically elucidates the triboelectric response behaviors and governing mechanisms of representative cationic and non-ionic solutions on the LS-TENG based TES sensing platform. Figure 3a–d dispaly the transferred-charge distributions—that is, the triboelectric signals induced at different positions as a droplet slides along the electrode array—for K⁺, NH₄⁺, Na⁺, and Ca²⁺ solutions at an identical concentration (5 mM). Although all four solutions share the same anion (Cl⁻), their triboelectric spectra exhibit pronounced differences, indicating that the physicochemical properties of the cation predominantly dictate charge-transfer behavior at the liquid–solid interface. During the triboelectrification process, immediate electron transfer occurs from water molecules to FEP surface upon initial droplet contact, rendering the FEP negatively charged and the droplet positively charged [40,41]. Subsequently, cations within the droplet are electrostatically attracted to and adsorb on the negatively charged FEP, significantly modulating charge induction [38,42]. The overall interfacial charge-transfer dynamics can be approximated by:
where denotes the contribution from electron transfer, and represents that contribution from ion adsorption and desorption [43]. Consequently, differences in interfacial mobility and adsorption kinetics among various ions directly shape the resulatnt TES profiles. Figure 3e presents a schematic illustration of this ion adsorption–desorption mechanism. As the droplet traverses the FEP surface, a portion of cations is captured by the FEP, while another fraction is carried away by the moving droplet, thereby generating localized charge variations. The magnitude and temporal characteristics of the charge transfer depend not only on cation mobility but also on the stability of the “ion atmosphere” surrounding each ion in proximity to the interface [44]. In bulk solution, a cation is typically enveloped by a spherically symmetric, negatively charged cloud to maintain electroneutrality. However, near the negatively charged FEP surface, the interfacial electric field perturbs this arrangement, partially separating anions from cations and altering the migration pathway and velocity of the central ion. The continuous rupture and reformation of this ion atmosphere dynamically regulate the triboelectric signal output.
Figure 3f–g systematically analyze the influence of ionic structural parameters on the triboelectric response. The hydrodynamic radius, atomic mass, and valence of each ion collectively determine its interfacial migration efficiency, which in turn governs the onset time and amplitude of characteristic features in the TES. For instance, K+ and NH4+, which possess relatively small hydrodynamic radii (~1.296 Å and 1.25 Å, respectively), display higher interfacial mobility, and consequently exhibit earlier signal onset, with their characteristic peaks appearing closer to the initial electrodes. Although Ca²⁺ is divalent and experiences stronger electrostatic attraction toward the negatively charged surface, its more complex hydration structure substantially limits its migration speed, resulting in response signals that slightly lag behind those of K+ and NH4+. In contrast, Na⁺, with the largest hydrodynamic radius among the four ions (≈1.84 Å), encounters the greatest migrational resistance and thus requires more time to reach and interact effectively with the FEP interface; its corresponding charge peaks therefore emerge markedly later, reflecting the slowest overall response. These experimental observations indicate that triboelectric response is not solely determined by ionic valence states but is strongly governed by interfacial migration kinetics, particularly the decisive effect of hydrodynamic size on adsorption rates. Accordingly, the cation’s specific size, mass, and associated hydration properties cooperatively regulate its migration and adsorption dynamics at the FEP interface, ultimately dictating the peak positions, response speeds, and magnitudes of transferred charge observed in the triboelectric spectra across different ionic species.
For polar (non-ionic) solutions, Figure 3h–k compares the triboelectric responses of glucose, urea, lactic acid, and uric acid under identical conditions (5 mM concentration with matched sliding profiles). All four analytes exhibit a characteristic signal profile comprising an initial rapid rise, a brief or extended plateau, and a subsequent slow decay. Crucially, the timing of the first detectable peak follows a distinct and reproducible sequence: glucose → urea → lactic acid → uric acid. This ordering is determined not by variations in signal amplitude but prmarily by the interplay between the adsorption kinetics of polar functional groups and the formation rate of electrical double-layer (EDL) at the interface. Upon contact and separation from the FEP surface, charge separation occurs at the liquid–solid interface. This process, involving selective adsorption of ions or molecular dipoles, imparts a negative charge to the FEP and a corresponding positive charge to the droplet. The result is a train of transferred-charge pulses that propagates sequentially along the electrode array [45]. For glucose solutions, the abundance of hydroxyl (–OH) groups facilitates the formation of dense hydrogen-bond networks with interfacial water molecules, promoting rapid molecular orientation, This establishs an efficient, high-throughput interfacial charge-transfer pathway during the initial contact and early sliding phases, leading to the early emergence of the first peak. As adsorption progresses and the nascent EDL develops, charge injection is gradually attenuated, giving rise to the observed plateau and late-stage decay [38,46]. Urea, though highly polar due to its carbonyl (C=O) and amine (–NH₂) groups, must undergo a reorientation from its bulk-favored configuration to an interface-favored one to establish a stable hydrogen-bond network and achieve optimal dipole alignment. This requisite reorientation delays its initial response, shifting the first peak to a later position than that of glucose; the plateau region thereafter reflects a dynamic equilibrium between ongoing charge injection and increasing electrostatic screening from the EDL. Lactic acid partially dissociates in solution, thereby increasing the local ionic strength at the interface and accelerating EDL formation. This early development of the EDL, coupled with competitive adsorption at the surface, suppresses the initial electron/ion transfer kinetics, thereby shifting the first peak further downstream and limiting its overall growth. Uric acid, featuring multiple hydrogen-bond donor/acceptor sites and a tendency for intermolecular association, forms a particular dense interfacial adsorbate layer. The slower dynamics of interfacial reorganization and molecular desolvation, combined with stronger screening effects, result in the least efficient early-stage charge injection. Consequently, its first peak emerges at the latest position, accompanied by a more gradual signal transition (Figure S5). To capitalize on these distinct kinetic signatures in the subsequent machine-learning analysis, we standardized all sample concentrations to 5 mM. This normalization decouples the signal from amplitude–concentration linearity, ensuring that variations in ‘first-peak timing’ serve as robust indicators of intrinsic molecular composition and interfacial kinetics, rather than confounding concentration effects.
To quantitatively analyze concentration gradients from the characterized triboelectric signals, we employ three-dimensional (3D) waterfall plots to visualize the evolution of the droplet-generated response as a function of solute concentration during sliding. As shown in Figure 4a, a tri-axial data framework is constructed, plotting the transferred charge Q along the x-axis, the electrode position within the array along the y-axis, and the solution concentration along the z-axis. This approach generates a volumetric triboelectric spectral map that facilitates metabolite identification with concentration-resolved resolution. As the droplet traverses and sequentially activates the electrode array, the generated triboelectric response trajectory simultaneously captures information on both the interfacial charge transfer and the concentration-dependent interfacial chemistry. This dual encoding produces a distinctive “concentration-sensitive” triboelectric signature for analytical discrimination.
Figure 4b–e present 3D waterfall plots for four ionic solutions (NaCl, KCl, CaCl₂, NH₄Cl) across a range of concentrations, revealing a systematic, monotonic decrease in transferred charge Q with increasing solute concentration. This trend indicates that solute concentration directly modulates the strength of interfacial triboelectrification, highlighting the close coupling between solute loading and electrical output. At low concentrations, cations (Na⁺, K⁺, Ca²⁺, NH₄⁺) can adsorb relatively uniformly onto the negatively charged FEP surface, establishing a robust interfacial electrical field that results in a larger measured Q. However, as the concentration increases, surface adsorption gradually approaches saturation; the rate of increase in Q progressively slows and eventually plateaus. This is because the available adsorption sites become largely occupied and charge-transfer efficiency reach its limit. With further elevation in concentration, a reduction in Q is observed, which is consistent with the onset of electrostatic screening effects: a denser interfacial adsorption layer weakens the potential difference between the FEP and the droplet, thereby suppressing electron transfer and reducing the detectable charge signal.
In contrast to the consistent trend observed with ionic solutions, the non-ionic (polar) solutions—namely glucose, urea, lactic acid, and uric acid—exhibit distinct concentration-dependent behaviors (Figure 4f–i). For glucose and urea, the transferred charge Q increases with rising concentration. Although these molecules carry no net charge, their polar functional groups engage in strong interactions with the FEP interface, thereby facilitating electron transfer. At elevated concentrations, a greater number of molecules are recruited to participate in these interfacial processes, which enhances the overall triboelectric signal output. In comparison, lactic acid and uric acid demonstrate the inverse dependence: Q decreases as concentration increases. This contrasting behavior can be attributed to acidity-induced variations in hydronium (H₃O⁺) concentration and the consequent redistribution of interfacial charge. Under conditions of increased concentration, the heightened presence of H₃O⁺ intensifies electrostatic screening and introduces competitive adsorption at the interface. These factors collectively reduce the efficiency of electron transfer, leading to the observed decline in measurable charge. Collectively, these results establish that the LS-TENG output is determined not simply by analyte concentration, but by a complex interplay of chemical composition, the kinetics of ion adsorption and desorption, and local gradients in H₃O⁺ concentration. These parameters jointly determine the amplitude and spatiotemporal evolution of the resultant triboelectric spectra.
In scenarios requiring home- or field-deployable rapid testing, the transferred-charge sequences generated by different metabolite-related solutions under identical conditions are often visually indistinguishable Subtle discriminative features are further obscured by non-stationary fluctuations stemming from droplet velocity perturbations, wetting hysteresis, contact-line pinning, and residual static charge. To circumvent the confounding effect of amplitude–concentration collinearity on classification, the concentration of all samples used for machine learning was standardized at 5 mM. This deliberate design choice focuses the model exclusively on fine-grained temporal structure, which is intrinsically governed by the chemical composition of each analyte.
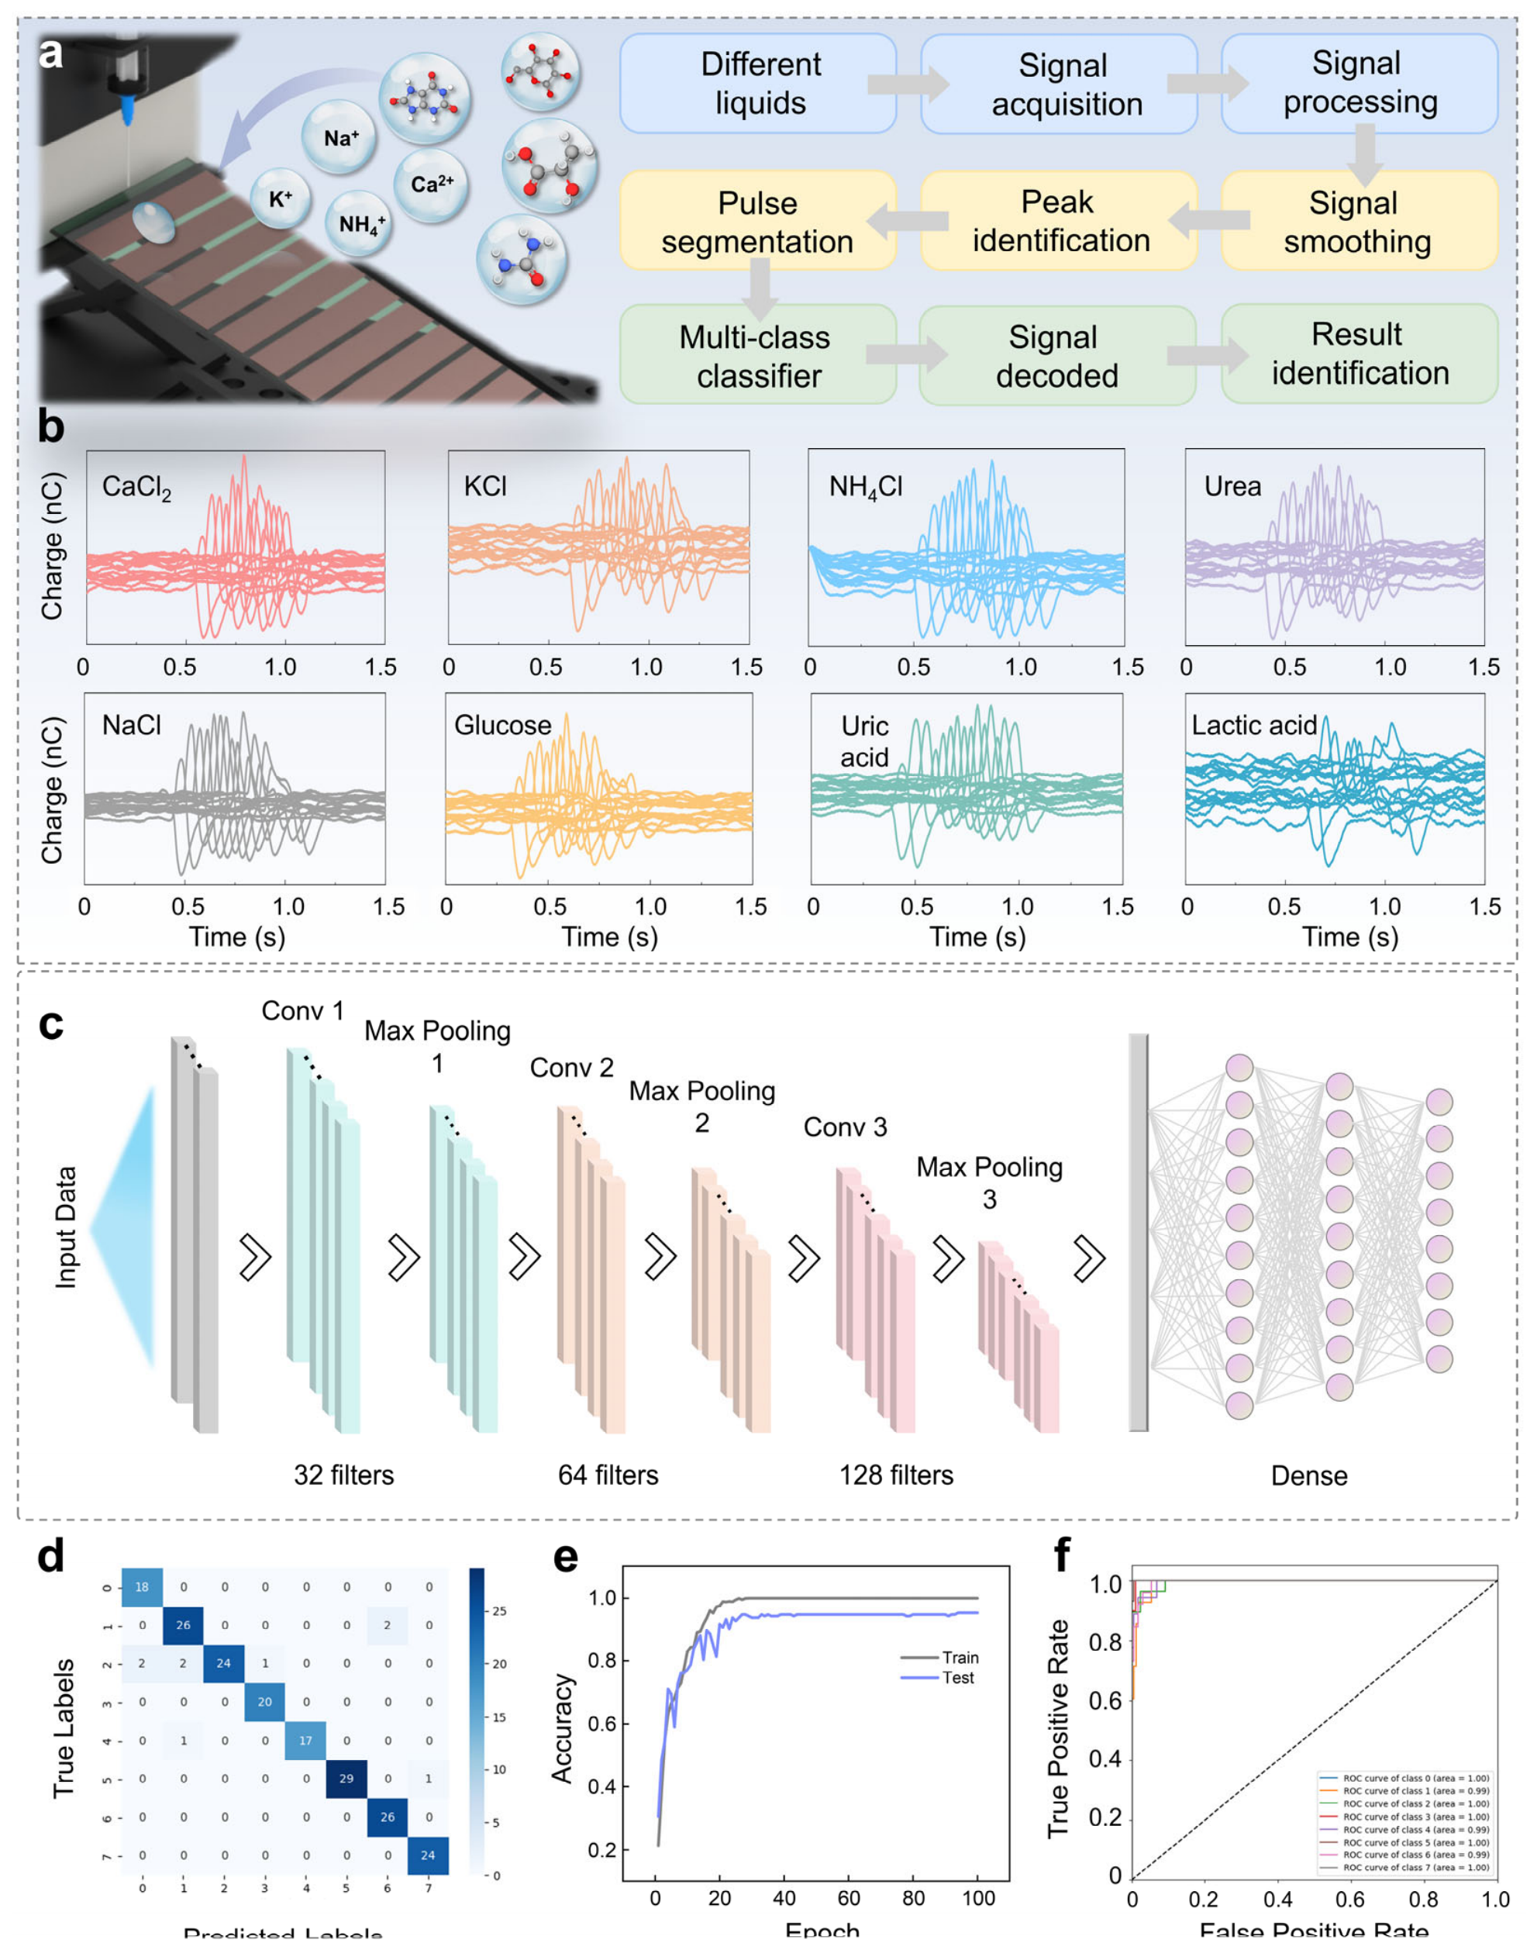
Figure 5 systematically presents the complete data processing pipeline—from the raw LS-TENG time series to multi-class discrimination—under uniform concentration (5 mM) and identical operating conditions, along with the corresponding quantitative evaluation results. To avoid the confounding effect of amplitude–concentration collinearity on classification performance, all samples used for modeling and evaluation were standardized at this concentration. The overall workflow, depicted in Figure 5a, initiates as a droplet sweeps sequentially across the over 16 equally sized copper electrodes beneath the FEP overlayer. Each contact-separation event induces a measurable transferred charge at the corresponding electrode location. These electrical signals are acquired in real time by an NI PXIe-8880 data acquisition system before being passed to subsequent preprocessing and event extraction modules. Preprocessing consists of baseline correction (to remove slow drift and DC offset), band-pass denoising and smoothing (to suppress both low-frequency undulations and high-frequency noise spikes), followed by precise peak detection and pulse segmentation using a threshold–slope joint criterion, with temporal alignment enforced by the known electrode sequence. Figure 5b displays representative time-domain signal overlays for eight investigated solutions (NaCl, KCl, CaCl₂, NH₄Cl, glucose, urea, uric acid, lactic acid) under identical sliding dynamics. While signals within the same class demonstrate stable consistency in the timing of the first-peak, pulse duration, and overall envelope morphology, the most discriminative inter-class differences reside precisely in these subtle spatiotemporal patterns. This characteristic makes visual differentiation highly unreliable, thereby necessitating the adoption of a statistical learning methodology. To explicitly retain the spatial ordering information across electrodes, the segmented and temporally aligned signal trajectories are transformed into a 2D input sensor with dimensions “time × electrode-segment” (size 639×15×1). Feature learning is performed by a three-layer convolutional neural network, which applies convolutional filters and hierarchical pooling operations to this structured input. The detailed network architecture and the corresponding tensor size evolution are illustrated in Figure 5c: Conv2D (32 filters, 3×3 kernel, same padding, ReLU) → MaxPool (2×2 window) yields 320×8×32; Conv2D (64 filters, 3×3 kernel, same padding, ReLU) → MaxPool (2×1 window) yields 160×8×64; Conv2D (128 filters, 3×3 kernel, same padding, ReLU) → MaxPool (2×1 window) yields 80×8×128; then Flatten (81920 units) → Dense (256 units, ReLU) → Dense (8 units, softmax) produces the final eight class labels. It should be noted that the “8” along the electrode axis in the diagram arises from the first pooling operation (15→8) and is not related to the number of input channels. Key hyperparameters—including kernel size, pooling window dimensions, stride values, and the width of the fully connected layer—were jointly optimized via Bayesian optimization (300 iterations) over a predefined search space. This approach was designed to balance the effective receptive field, total parameter count, and model generalization capability. The architecture of the final layer and the detailed parameter breakdown are provided in Figure S7, with the network containing a total of 21 066 504 trainable parameters. Using this optimized configuration, five-fold cross-validation was performed. The resulting confusion matrix (Figure 5d) is predominantly diagonal, with misclassifications concentrated among the most spectrally similar class pairs. The training/validation accuracy curves rise synchronously and begin to plateau after approximately 30–40 epochs (Figure 5e), demonstrating stable convergence without significant signs of overfitting or high variance. The overall mean classification accuracy reaches 95.3% (Figure S6). Furthermore, the receiver operating characteristic (ROC) curves (Figure 5f), characterized by false-positive rate (FPR) versus true-positive rate (TPR), cluster tightly in the upper-left quadrant. This pattern signifies that the model achieves a high recall rate at a minimal false-positive cost, thereby facilitating application-specific threshold tuning for practical deployment. In sum, the integrated analytical framework—encompassing “uniform-concentration control → standardized preprocessing and pulse segmentation → a three-layer CNN with controlled pooling → Bayesian hyperparameter optimization → cross-validation-based performance assessment—can successfully extract generalizable compositional fingerprints from the TES-assisted LS-TENG transferred-charge time series, even in the presence of realistic perturbations and highly similar waveforms, achieving robust discrimination among the eight different solution classes.
Conclusions
We developed a self-powered liquid-analysis platform based on an SL-TENG: a 16-electrode array integrated on PMMA and overlaid with FEP encodes the transferred charge of a sliding droplet into a triboelectric spectrum. For eight metabolite-relevant solutions (NaCl, KCl, CaCl₂, NH₄Cl, glucose, urea, lactic acid, uric acid), reproducible spectral patterns were obtained; across 5–30 mM we mapped 3D waterfall plots of Q–position–concentration, revealing modulation by ionic strength and interfacial adsorption/screening. To avoid amplitude–concentration collinearity, the classification task used only 5 mM data; after standardized preprocessing and pulse segmentation, a three-convolution CNN achieved 95.3% five-fold cross-validated accuracy with stable training/validation curves and favorable ROC characteristics. Ablation results show a pronounced dependence on data-scale–model-capacity matching: when the sample count increased from 100 to 150 groups, the three-layer network outperformed a two-layer counterpart. The platform is self-powered, structurally simple, and supports sub-second single-droplet measurements, enabling extraction of generalizable “composition fingerprints” under uniform conditions for rapid home/field liquid identification. Future efforts will target higher electrode counts/multi-channel and microfluidic integration, together with validation on real biofluids and edge deployment.
Experimental section
Materials and Reagents
Polymethyl methacrylate (PMMA) plates; conductive copper electrode tape; fluorinated ethylene propylene (FEP) films. Glucose, lactic acid, urea, uric acid, sodium chloride (NaCl), potassium chloride (KCl), calcium chloride (CaCl₂), and ammonium chloride (NH₄Cl) were analytical grade. Ionic solutions were prepared from the corresponding chloride salts; among the non-ionic solutes, only lactic acid was supplied as an analytical-grade liquid, whereas glucose, urea, and uric acid were powders. DI water (18.2 MΩ·cm) was used. Unless otherwise noted, all solutions were freshly prepared in DI water at target concentrations of 5, 10, 15, 20, 25, and 30 mM; pH was not further adjusted.
Device Fabrication (SL-TENG, 16 Electrodes)
PMMA substrates were cut into 300 mm × 100 mm rectangles. 16 equal-sized copper electrodes (100 mm × 15 mm) were affixed along the sliding direction with a center-to-center spacing of 0.5 cm (Figure S2); each electrode was connected to the acquisition end via a fine lead wire. An FEP film was laminated as the top layer. Prior to lamination, PMMA and copper surfaces were sequentially cleaned with isopropanol and DI water and blown dry to improve interfacial cleanliness and reproducibility.
Experimental Setup and Environmental Conditions
The device was mounted on an adjustable tilt stage at 50° relative to the horizontal. At the upper end, a grounded stainless-steel needle dispensed droplets via a syringe pump at a constant rate (≈30 μL per drop; release height ≈1 cm above the FEP surface). Unless otherwise specified, experiments were conducted at 22–25 °C and ~20% relative humidity. Contact angles were measured with a contact-angle goniometer (static sessile-drop method); representative images and statistics for DI water on FEP and ETFE are shown in Figure S3. Droplet motion was recorded by a high-speed camera (2000 fps).
Signal Acquisition and Construction of the Triboelectric Spectrum (TES)
Signals from the 16 electrodes were routed via leads to an NI PXIe-8880 platform (equipped with charge/current acquisition modules with fixed gain and range) and sampled at 200 Hz with 20-bit digital resolution to record raw transferred-charge/induced-current traces. For each solution at each concentration, measurements were independently repeated n=20 under identical conditions; one complete transit of the droplet from the first to the last electrode was counted as a valid acquisition. For each trace, the transferred charge Q at every electrode was computed and aggregated over spatial position to obtain a Q–position distribution curve, defined as the “triboelectric spectrum” of that solution on this platform.
References
- Mahato, K., et al., Hybrid multimodal wearable sensors for comprehensive health monitoring. Nature Electronics, 2024. 7(9): p. 735-750. [CrossRef]
- Ren, Y., et al., Wearable bioelectronics based on emerging nanomaterials for telehealth applications. Device, 2025. 3(1): p. 100676. [CrossRef]
- Sempionatto, J.R., et al., Wearable chemical sensors for biomarker discovery in the omics era. Nature Reviews Chemistry, 2022. 6(12): p. 899-915. [CrossRef]
- Kim, J., et al., Wearable biosensors for healthcare monitoring. Nature Biotechnology, 2019. 37(4): p. 389-406. [CrossRef]
- Fan, P., et al., Three-dimensional micro- and nanomanufacturing techniques for high-fidelity wearable bioelectronics. Nature Reviews Electrical Engineering, 2025. 2(6): p. 390-406. [CrossRef]
- Brasier, N., et al., Applied body-fluid analysis by wearable devices. Nature, 2024. 636(8041): p. 57-68. [CrossRef]
- Wu, J., et al., Device integration of electrochemical biosensors. Nature Reviews Bioengineering, 2023. 1(5): p. 346-360. [CrossRef]
- Xiang, H., et al., Triboelectric nanogenerator for high-entropy energy, self-powered sensors, and popular education. Science Advances. 10(48): p. eads2291. [CrossRef]
- Wang, S., L. Lin, and Z.L. Wang, Triboelectric nanogenerators as self-powered active sensors. Nano Energy, 2015. 11: p. 436-462. [CrossRef]
- Zhou, Q., et al., Triboelectric Nanogenerator-Based Sensor Systems for Chemical or Biological Detection. Advanced Materials, 2021. 33(35): p. 2008276. [CrossRef]
- Zhang, H., et al., Real-time data visual monitoring of triboelectric nanogenerators enabled by Deep learning. Nano Energy, 2024. 130: p. 110186. [CrossRef]
- Krishnan, S. and A. Giwa, Advances in real-time water quality monitoring using triboelectric nanosensors. Journal of Materials Chemistry A, 2025. [CrossRef]
- Wang, Y., et al., TENG-Boosted Smart Sports with Energy Autonomy and Digital Intelligence. Nano-Micro Letters, 2025. 17(1): p. 265. [CrossRef]
- Seo, M.-K., et al., Highly Flexible, Breathable, and User-Comfortable All-Porous Polymeric Triboelectric Sensors for Wearable Sign Language Interpretation. ACS Sensors, 2025. 10(8): p. 5981-5988. [CrossRef]
- Zhang, C., et al., Tensile-responsive triboelectric yarn based on Janus tubular braided structure for wearable sensing. Nano Energy, 2024. 131: p. 110208. [CrossRef]
- Johns, M., et al., A fully wearable conductive yarn-based sweat sensor powered by shoe insole-based TENG. Sensors and Actuators B: Chemical, 2025: p. 138166. [CrossRef]
- Zhang, M., et al., Self-Powered Hybrid Motion and Health Sensing System Based on Triboelectric Nanogenerators. Small, 2024. 20(40): p. 2402452. [CrossRef]
- Tat, T., et al., Advances in triboelectric nanogenerators for biomedical sensing. Biosensors and Bioelectronics, 2021. 171: p. 112714. [CrossRef]
- Wu, Y., Z. Liu, and Y. Fan, Biomedical Applications of Bioresorbable Mechanical Sensors. Advanced Functional Materials, 2025. n/a(n/a): p. e13422. [CrossRef]
- Pu, X., C. Zhang, and Z.L. Wang, Triboelectric nanogenerators as wearable power sources and self-powered sensors. National Science Review, 2023. 10(1): p. nwac170. [CrossRef]
- Wang, Z.L., Triboelectric Nanogenerator (TENG)—Sparking an Energy and Sensor Revolution. Advanced Energy Materials, 2020. 10(17): p. 2000137. [CrossRef]
- Zhao, Z., et al., Selection rules of triboelectric materials for direct-current triboelectric nanogenerator. Nature Communications, 2021. 12(1): p. 4686. [CrossRef]
- Lin, S., et al., Quantifying electron-transfer in liquid-solid contact electrification and the formation of electric double-layer. Nature Communications, 2020. 11(1): p. 399. [CrossRef]
- Zhan, F., et al., Electron Transfer as a Liquid Droplet Contacting a Polymer Surface. ACS Nano, 2020. 14(12): p. 17565-17573. [CrossRef]
- Lin, S., et al., Effects of Surface Functional Groups on Electron Transfer at Liquid-Solid Interfacial Contact Electrification. ACS Nano, 2020. 14(8): p. 10733-10741. [CrossRef]
- Wang, Z., et al., Contact-electro-catalysis for the degradation of organic pollutants using pristine dielectric powders. Nature Communications, 2022. 13(1): p. 130. [CrossRef]
- Xie, L., et al., Mechanical–electric dual characteristics solid–liquid interfacing sensor for accurate liquid identification. Nature Communications, 2025. 16(1): p. 7069. [CrossRef]
- Zhang, J., et al., Triboelectric Spectroscopy for In Situ Chemical Analysis of Liquids. J Am Chem Soc, 2024. 146(9): p. 6125-6133. [CrossRef]
- Zhang, J., S. Lin, and Z.L. Wang, Triboelectric Nanogenerator Array as a Probe for In Situ Dynamic Mapping of Interface Charge Transfer at a Liquid-Solid Contacting. ACS Nano, 2023. [CrossRef]
- Zhang, J., et al., Triboelectric Nanogenerator as a Probe for Measuring the Charge Transfer between Liquid and Solid Surfaces. ACS Nano, 2021. 15(9): p. 14830-14837. [CrossRef]
- Liu, X., et al., Charge accumulation kinetics at a liquid–solid interface depend on liquid chemistry. Journal of Materials Chemistry A, 2023. 11(35): p. 18964-18971. [CrossRef]
- Wang, X., et al., Studying the droplet sliding velocity and charge transfer at a liquid–solid interface. Journal of Materials Chemistry A, 2023. 11(11): p. 5696-5702. [CrossRef]
- Mondal, I., et al., Self-Sustaining Triboelectric Nanosensors for Real-Time Urine Analysis in Smart Toilets. Small, 2024. 20(42): p. 2403385. [CrossRef]
- Zhang, Z., et al., Artificial intelligence of toilet (AI-Toilet) for an integrated health monitoring system (IHMS) using smart triboelectric pressure sensors and image sensor. Nano Energy, 2021. 90: p. 106517. [CrossRef]
- Huang, T., et al., Detection of Microplastics Based on a Liquid-Solid Triboelectric Nanogenerator and a Deep Learning Method. ACS Appl Mater Interfaces, 2023. 15(29): p. 35014-35023. [CrossRef]
- Yu, J., et al., Monitoring on triboelectric nanogenerator and deep learning method. Nano Energy, 2022. 92: p. 106698. [CrossRef]
- Bao, C., et al., A direct current droplet-based triboelectric nanogenerator with a suspended probe and an exposed lower electrode. Nano Energy, 2025. 145: p. 111451. [CrossRef]
- Wei, Y., et al., Probing electrical double layer via triboelectric charge transfer. Nature Communications, 2025. [CrossRef]
- Zeng, Y., et al., Self-powered rain droplet sensor based on a liquid-solid triboelectric nanogenerator. Nano Energy, 2022. 98: p. 107316. [CrossRef]
- Jin, Y., et al., How liquids charge the superhydrophobic surfaces. Nature Communications, 2024. 15(1): p. 4762. [CrossRef]
- Jimidar, I.S., et al., Influence of wettability and geometry on contact electrification between nonionic insulators. ACS applied materials & interfaces, 2023. 15(35): p. 42004-42014. [CrossRef]
- Nauruzbayeva, J., et al., Electrification at water-hydrophobe interfaces. Nat Commun, 2020. 11(1): p. 5285. [CrossRef]
- Nie, J., et al., Probing Contact-Electrification-Induced Electron and Ion Transfers at a Liquid-Solid Interface. Adv Mater, 2020. 32(2): p. e1905696. [CrossRef]
- Berthoumieux, H., V. Démery, and A.C. Maggs, Nonlinear conductivity of aqueous electrolytes: Beyond the first Wien effect. The Journal of Chemical Physics, 2024. 161(18). [CrossRef]
- Xu, Y., et al., Bionic e-skin with precise multi-directional droplet sliding sensing for enhanced robotic perception. Nature Communications, 2024. 15(1): p. 6022. [CrossRef]
- Wu, J., et al., Liquid-solid contact electrification and its effect on the formation of electric double layer: An atomic-level investigation. Nano Energy, 2023. 111: p. 108442. [CrossRef]
Figure 1.
Perspective view of the LS-TENG–enabled self-powered metabolite biomarker analysis platform. (a) The LS-TENG efficiently harvests energy from droplets of ionic and non-ionic solutions; the transferred-charge output generated as droplets slide over the device—measured by an NI PXIe-8880 electrometer—serves as a sensing signature of human biofluid composition and ultimately yields triboelectric spectral maps of metabolites. (b) Schematic of the LS-TENG device structure, comprising 16 copper electrodes, a PMMA substrate, and an FEP film. (c) By collecting triboelectric data measured by NI and building a database, a machine-learning-assisted approach enables precise classification and identification of eight solutions.
Figure 1.
Perspective view of the LS-TENG–enabled self-powered metabolite biomarker analysis platform. (a) The LS-TENG efficiently harvests energy from droplets of ionic and non-ionic solutions; the transferred-charge output generated as droplets slide over the device—measured by an NI PXIe-8880 electrometer—serves as a sensing signature of human biofluid composition and ultimately yields triboelectric spectral maps of metabolites. (b) Schematic of the LS-TENG device structure, comprising 16 copper electrodes, a PMMA substrate, and an FEP film. (c) By collecting triboelectric data measured by NI and building a database, a machine-learning-assisted approach enables precise classification and identification of eight solutions.
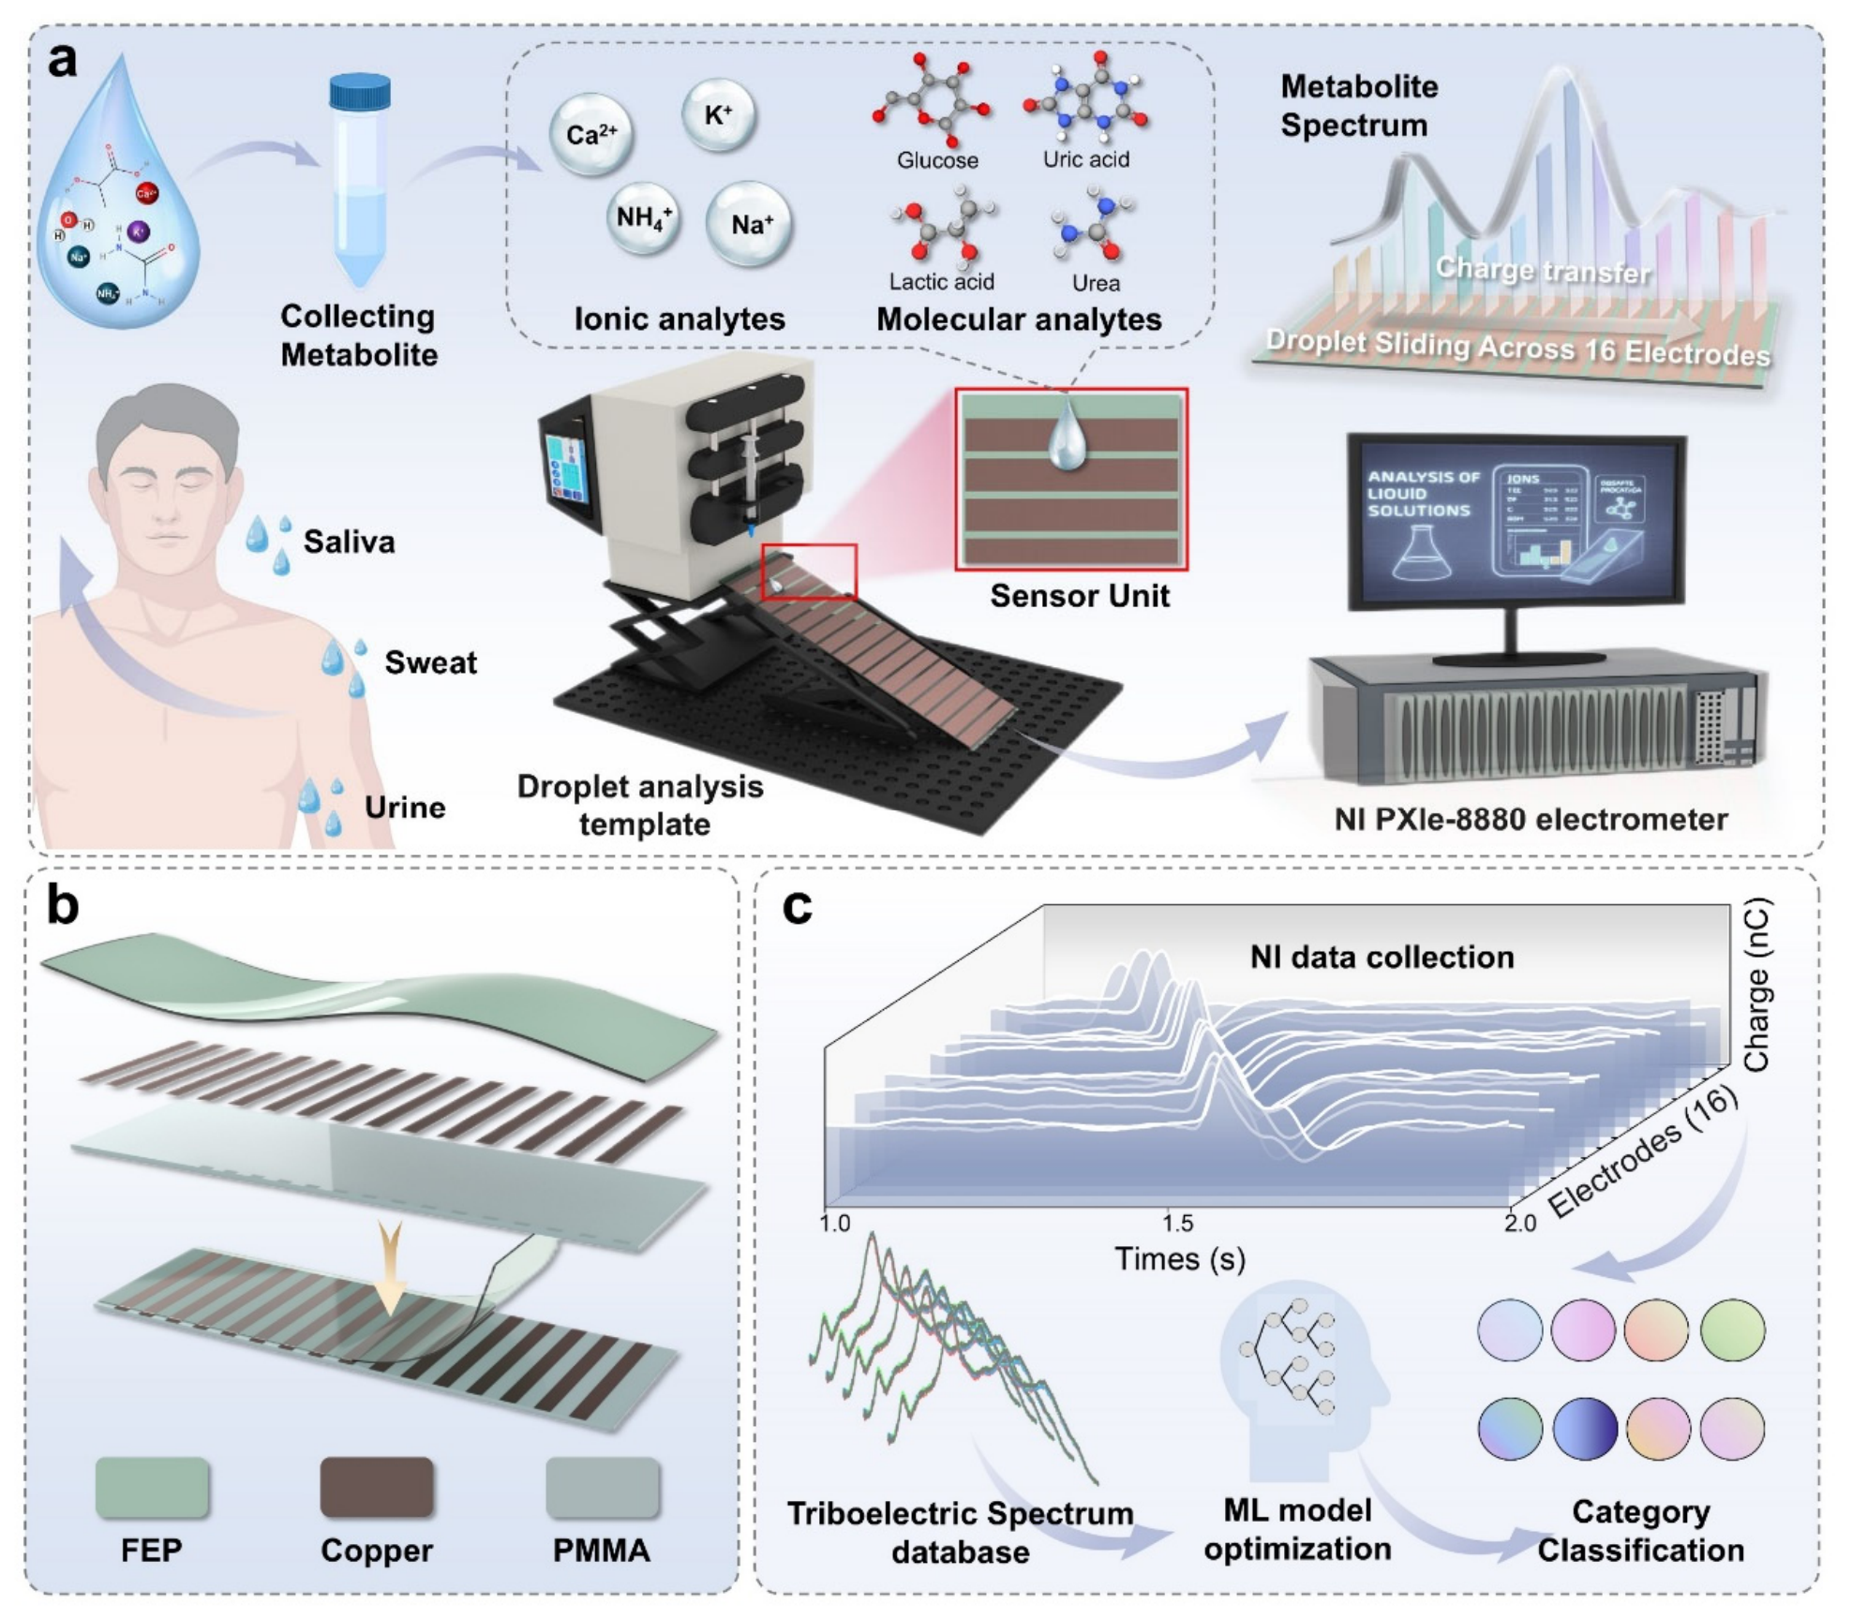
Figure 2.
Working principle and characterization of the LS-TENG sensing array for TES-based metabolite analysis. (a) Schematic of the FEP dielectric overlayer laminated on a copper strip–electrode array patterned on a PMMA substrate. Interfacial charging at the liquid/FEP interface induces transient charge pulses on successive electrodes during droplet sliding. The upper panel shows representative pulses recorded from the 1st–3rd electrodes during a single DI-water transit. (b) High-speed camera images of a water droplet sliding on the FEP film and the droplet–FEP contact angle. (c) TES signal generated by DI water sliding on the SL-TENG; the abscissa denotes sliding distance (the topmost electrode position is defined as 0), and the ordinate denotes transferred charge. The gray curve represents the mean of 20 independent experiments, and the colored squares are the individual results from the 20 experiments. (d–e) Operating principle of the LS-TENG and COMSOL simulations. Yellow and blue squares represent the copper electrodes and the FEP film, respectively.
Figure 2.
Working principle and characterization of the LS-TENG sensing array for TES-based metabolite analysis. (a) Schematic of the FEP dielectric overlayer laminated on a copper strip–electrode array patterned on a PMMA substrate. Interfacial charging at the liquid/FEP interface induces transient charge pulses on successive electrodes during droplet sliding. The upper panel shows representative pulses recorded from the 1st–3rd electrodes during a single DI-water transit. (b) High-speed camera images of a water droplet sliding on the FEP film and the droplet–FEP contact angle. (c) TES signal generated by DI water sliding on the SL-TENG; the abscissa denotes sliding distance (the topmost electrode position is defined as 0), and the ordinate denotes transferred charge. The gray curve represents the mean of 20 independent experiments, and the colored squares are the individual results from the 20 experiments. (d–e) Operating principle of the LS-TENG and COMSOL simulations. Yellow and blue squares represent the copper electrodes and the FEP film, respectively.
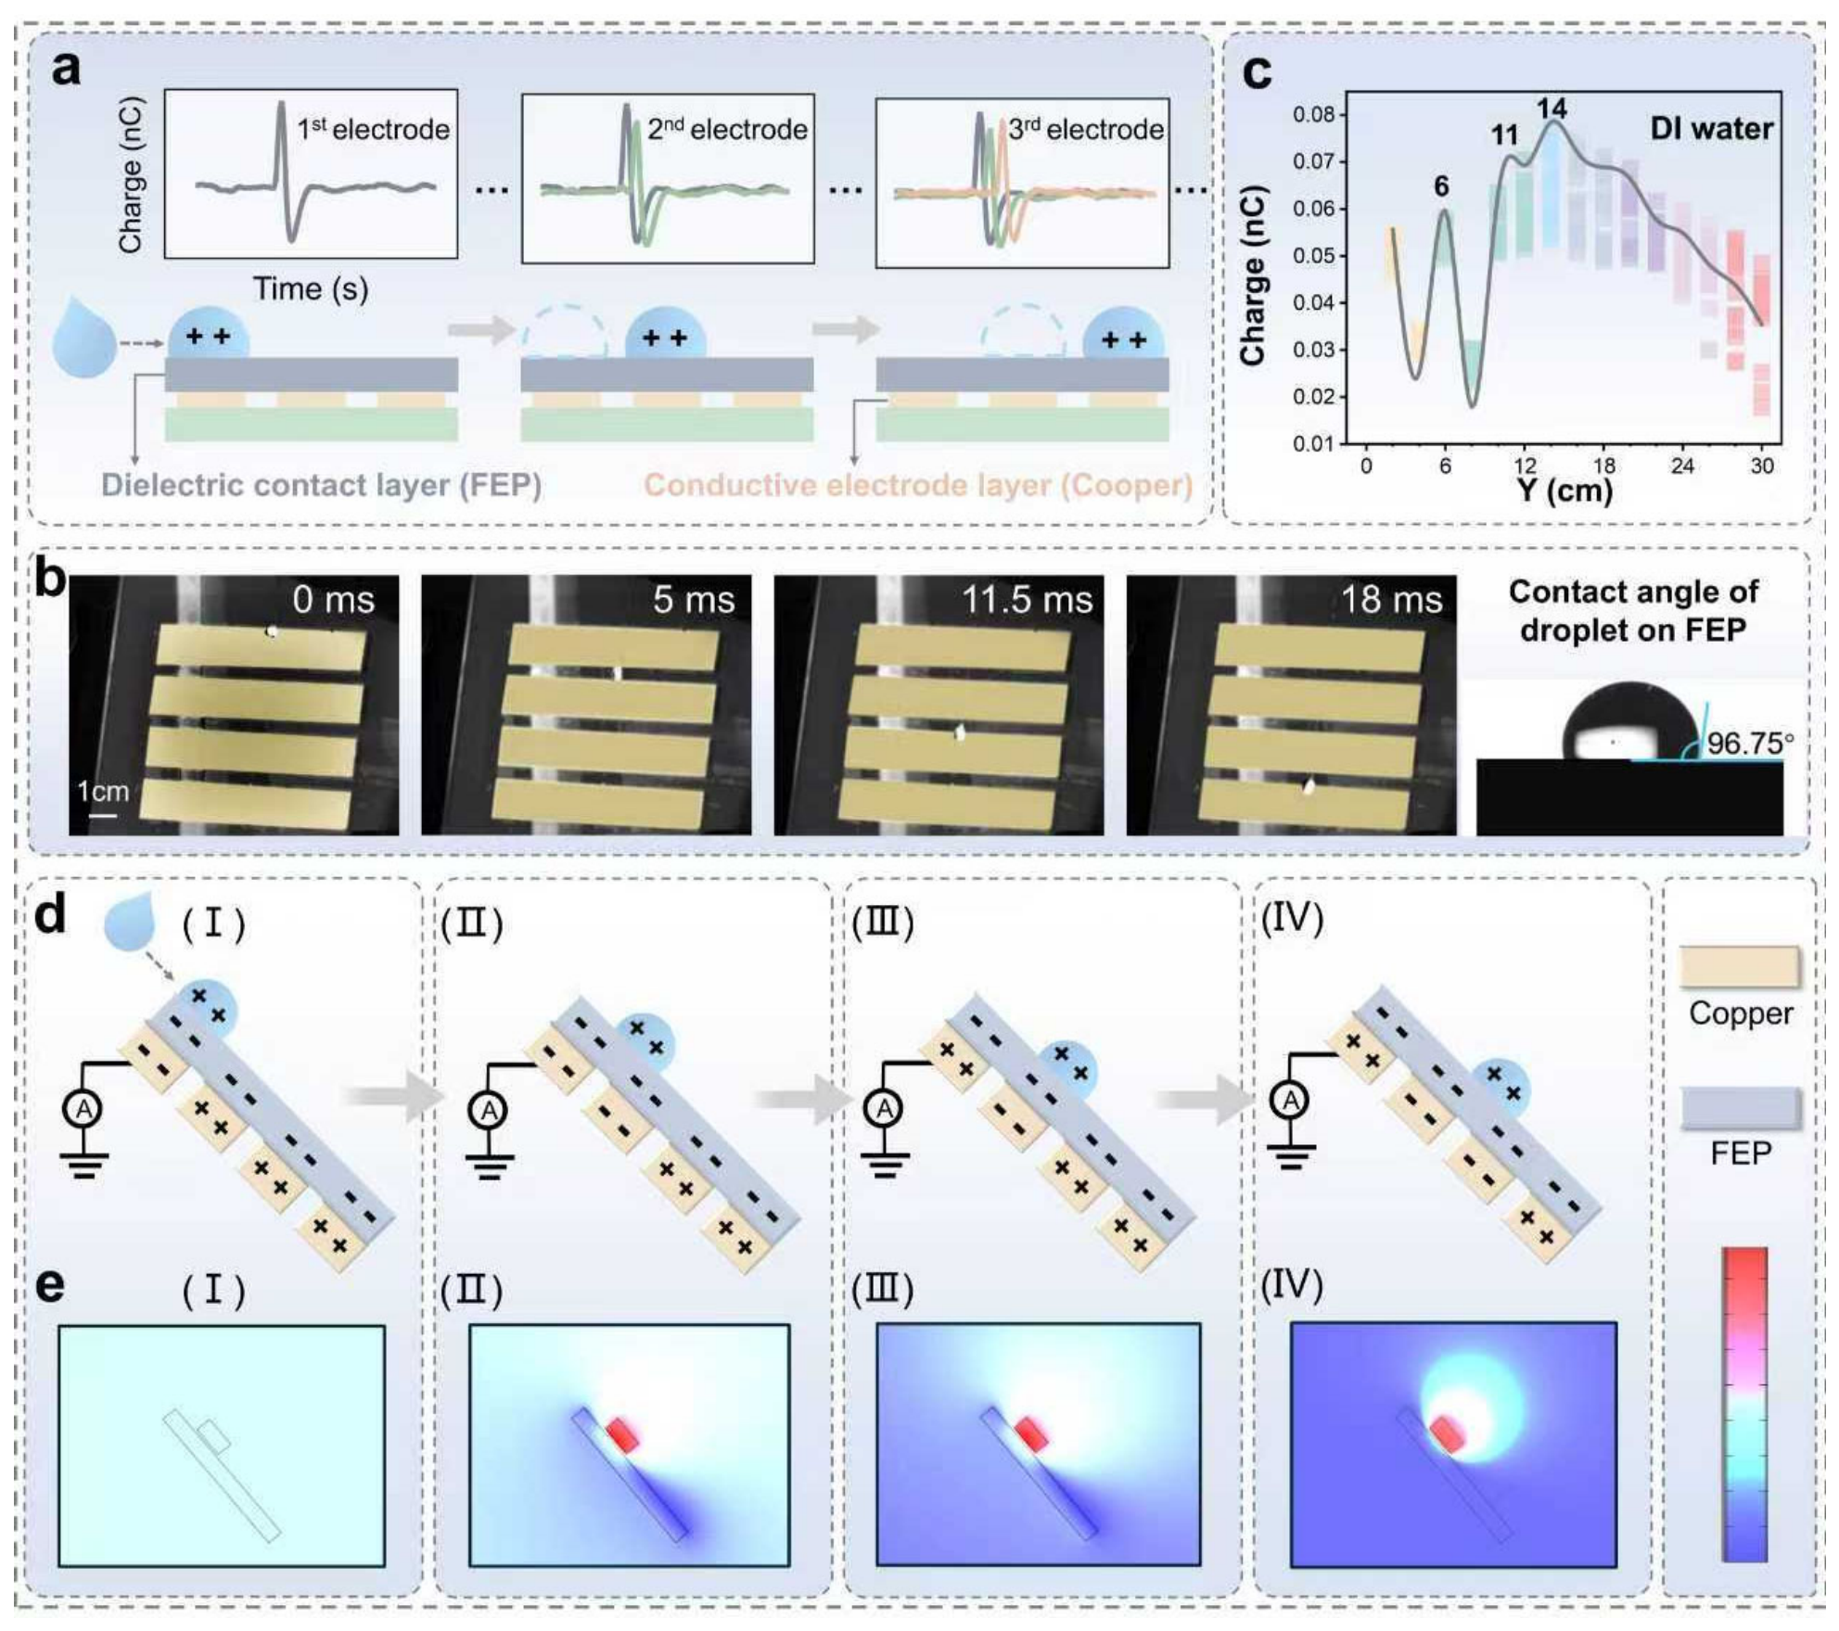
Figure 3.
Triboelectric response mechanisms and characteristic spectra of ionic and organic solutions. (a) K⁺, (b) NH4+, (c) Na+, (d) Ca²⁺ ion solutions: transferred-charge (Q) profiles as droplets slide across the electrode array (concentration: 5 mM). (e) Schematic of competitive adsorption and desorption of cations on the FEP surface. (f) Ionic radii and atomic masses for K⁺, NH4+, Na⁺, and Ca²⁺. (g) Hydrodynamic radii of the respective ions. (h) Glucose, (i) uric acid, (j) urea, (k) lactic acid: responses of non-ionic solutions.
Figure 3.
Triboelectric response mechanisms and characteristic spectra of ionic and organic solutions. (a) K⁺, (b) NH4+, (c) Na+, (d) Ca²⁺ ion solutions: transferred-charge (Q) profiles as droplets slide across the electrode array (concentration: 5 mM). (e) Schematic of competitive adsorption and desorption of cations on the FEP surface. (f) Ionic radii and atomic masses for K⁺, NH4+, Na⁺, and Ca²⁺. (g) Hydrodynamic radii of the respective ions. (h) Glucose, (i) uric acid, (j) urea, (k) lactic acid: responses of non-ionic solutions.
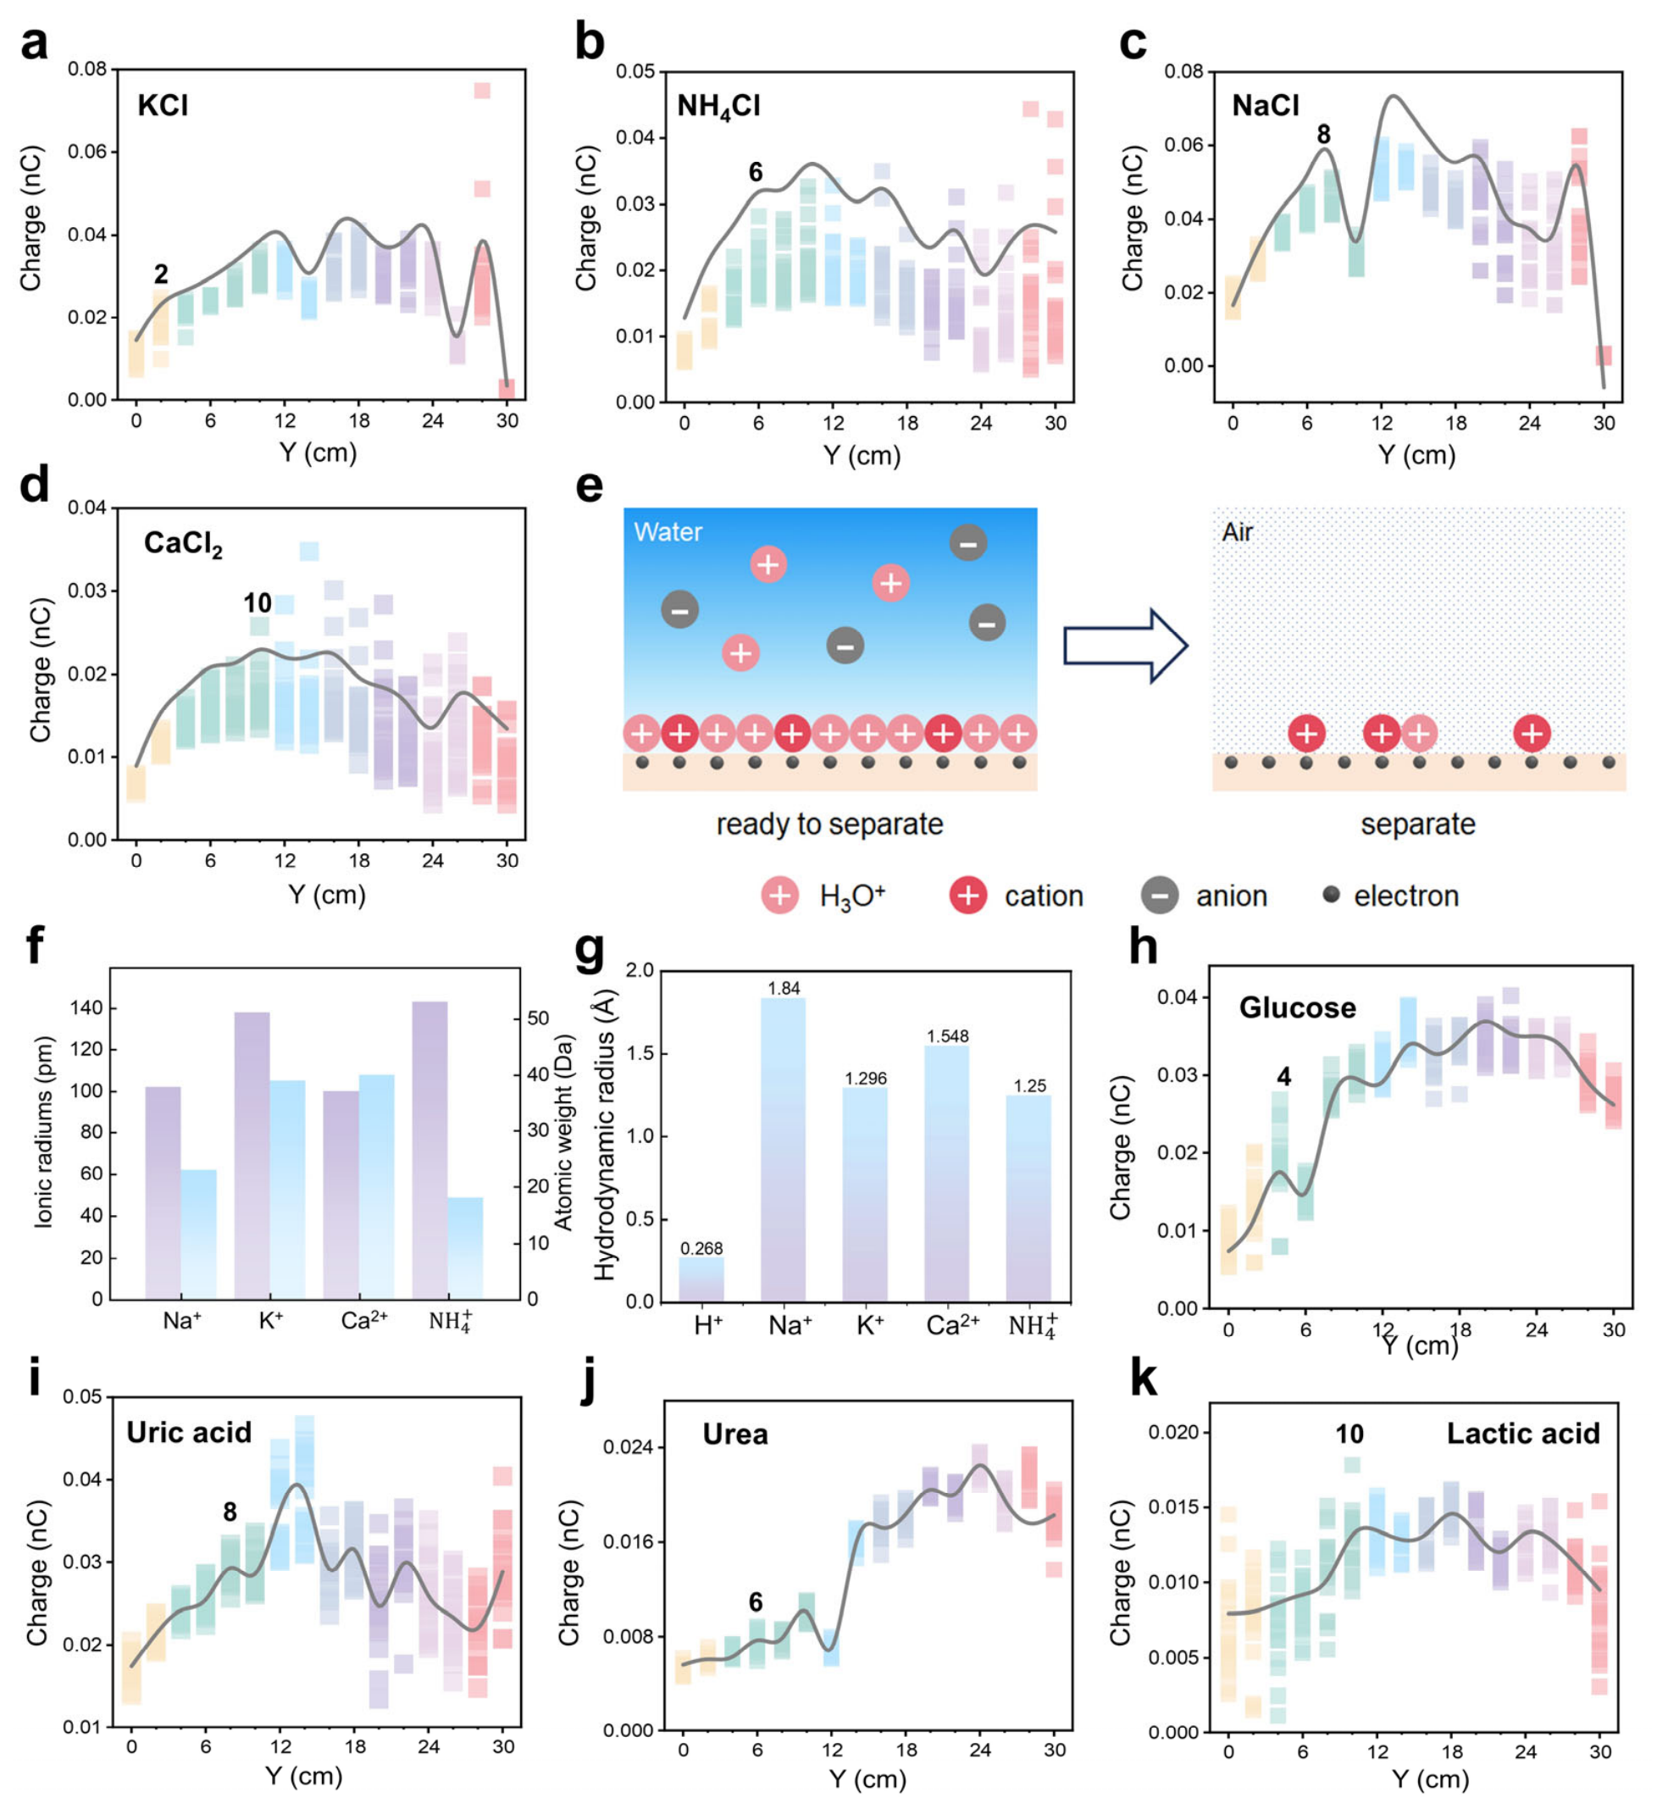
Figure 4.
Quantitative analysis of triboelectric response versus solution concentration (a) Schematic showing the distribution of triboelectric signals generated by the LS-TENG during droplet sliding; a tri-axial data map is constructed from transferred charge (Q), electrode position, and solution concentration (X-axis: Q; Y-axis: electrode position; Z-axis: concentration gradient), enabling quantitative detection of eight solutions (NaCl, KCl, CaCl₂, NH₄Cl, glucose, lactic acid, urea, uric acid). (b–i) 3D response plots for the eight ionic and non-ionic solutions under identical concentration gradients.
Figure 4.
Quantitative analysis of triboelectric response versus solution concentration (a) Schematic showing the distribution of triboelectric signals generated by the LS-TENG during droplet sliding; a tri-axial data map is constructed from transferred charge (Q), electrode position, and solution concentration (X-axis: Q; Y-axis: electrode position; Z-axis: concentration gradient), enabling quantitative detection of eight solutions (NaCl, KCl, CaCl₂, NH₄Cl, glucose, lactic acid, urea, uric acid). (b–i) 3D response plots for the eight ionic and non-ionic solutions under identical concentration gradients.
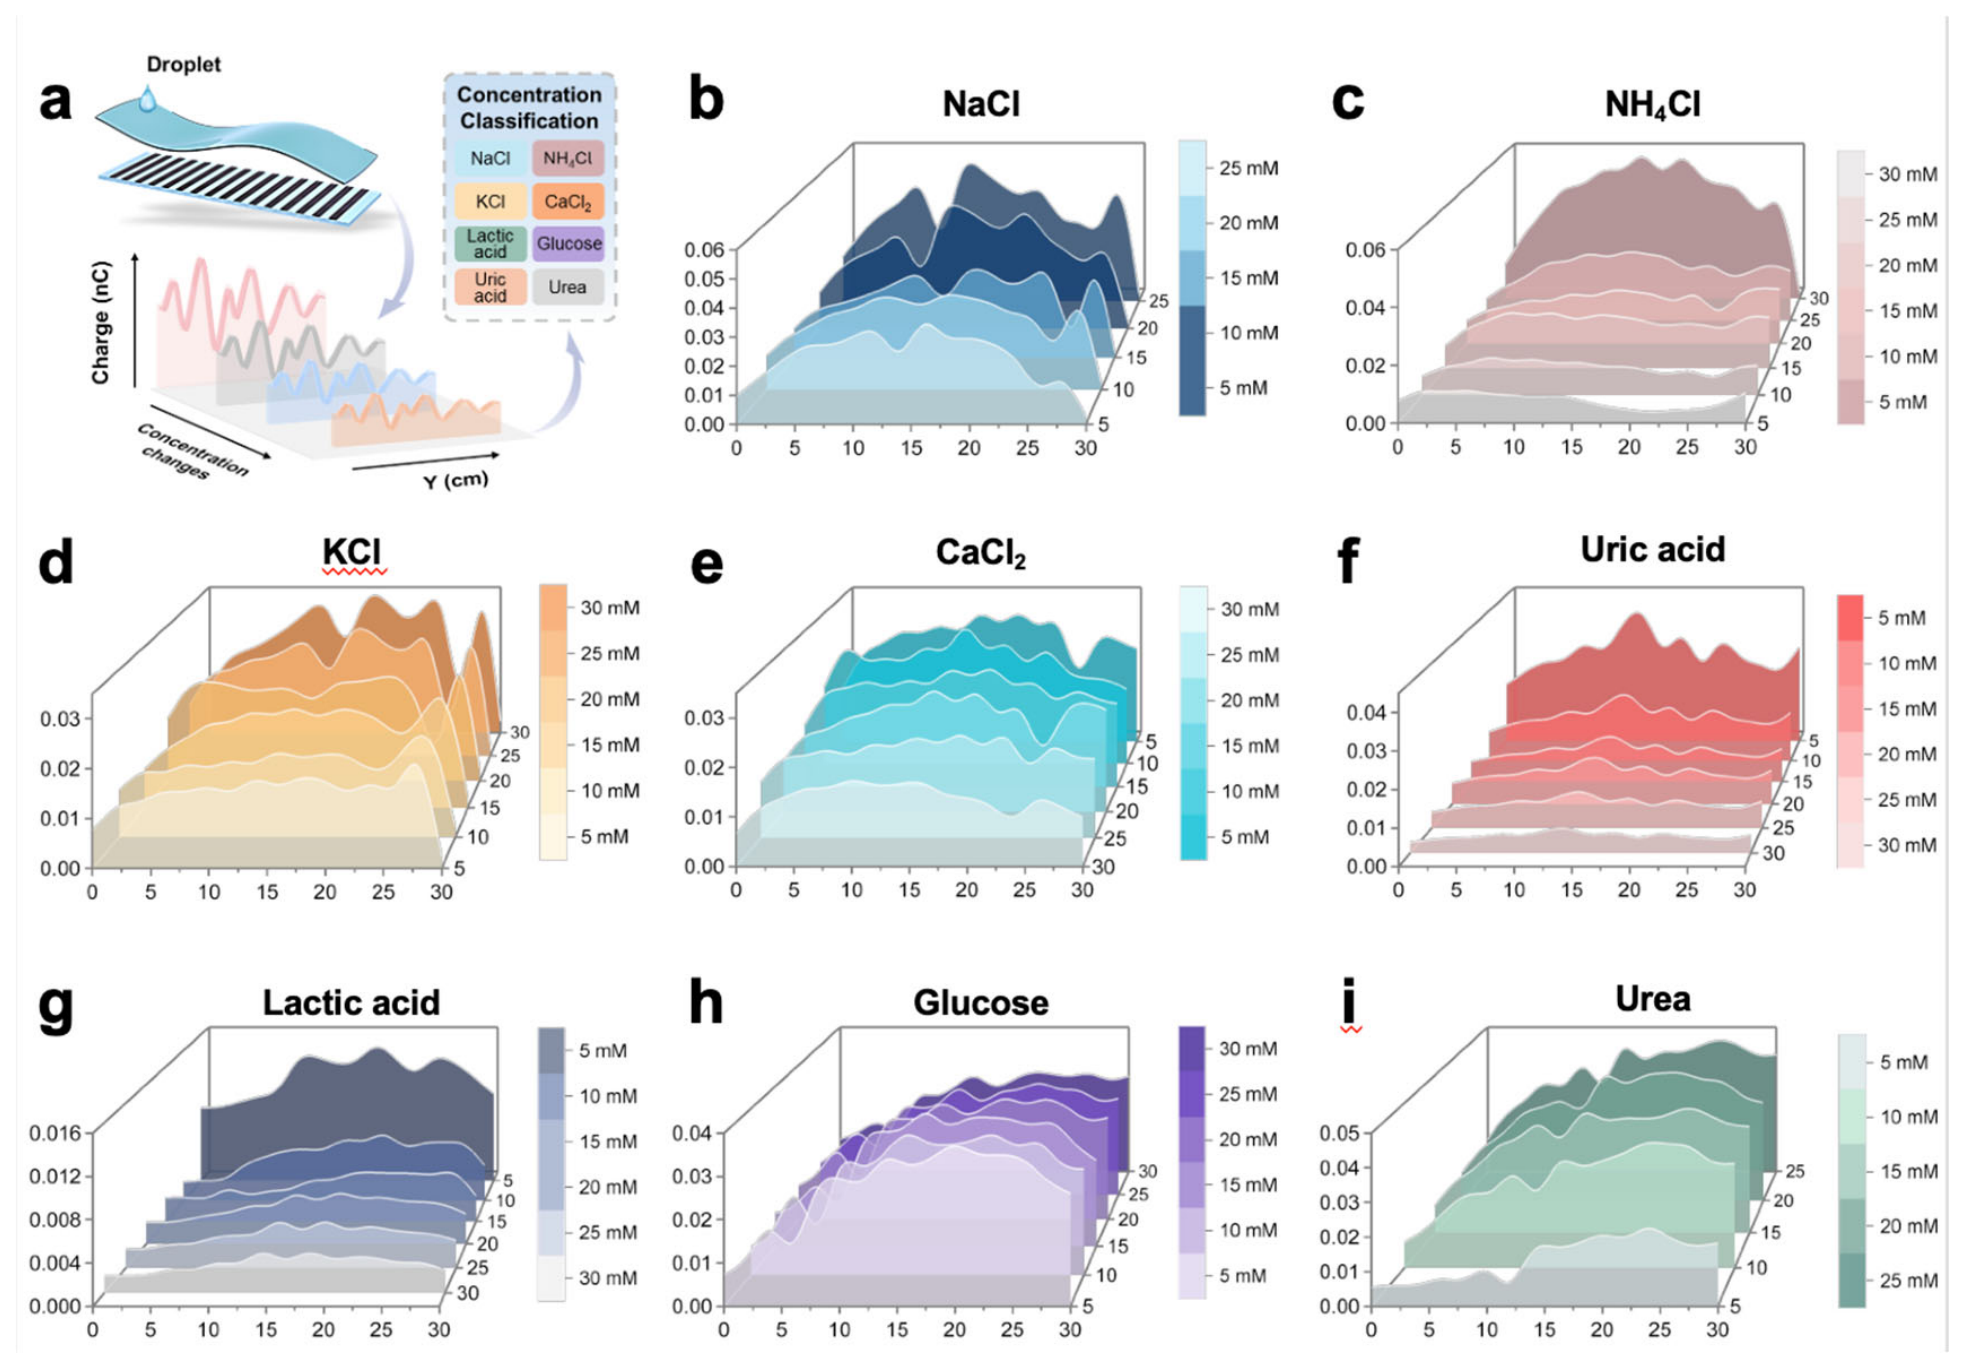
Figure 5.
Deep convolutional neural network (CNN) for automated identification of eight solution types from triboelectric spectral signatures. (a) End-to-end workflow: droplets traverse an FEP surface and sequentially contact 16 copper electrodes to generate charge transfer; signals are routed to an NI PXIe-8880–based data-acquisition system to form an electrode-ordered raw time series; preprocessing comprises baseline correction, band-pass filtering, and amplitude/time normalization; pulse segmentation is performed according to the electrode cadence, and the resulting units are assembled into a standardized tensor that preserves cross-electrode temporal correspondence for classification. (b) Representative raw trace segment and the corresponding standardized pulse units. (c) Schematic of the CNN design workflow and model configuration. (d) Confusion matrix of the classification results. (e) Training and validation curves showing synchronous convergence across epochs without evident overfitting. (f) Receiver-operating-characteristic performance (true-positive rate versus false-positive rate), indicating favorable trade-offs and supporting threshold selection for deployment.
Figure 5.
Deep convolutional neural network (CNN) for automated identification of eight solution types from triboelectric spectral signatures. (a) End-to-end workflow: droplets traverse an FEP surface and sequentially contact 16 copper electrodes to generate charge transfer; signals are routed to an NI PXIe-8880–based data-acquisition system to form an electrode-ordered raw time series; preprocessing comprises baseline correction, band-pass filtering, and amplitude/time normalization; pulse segmentation is performed according to the electrode cadence, and the resulting units are assembled into a standardized tensor that preserves cross-electrode temporal correspondence for classification. (b) Representative raw trace segment and the corresponding standardized pulse units. (c) Schematic of the CNN design workflow and model configuration. (d) Confusion matrix of the classification results. (e) Training and validation curves showing synchronous convergence across epochs without evident overfitting. (f) Receiver-operating-characteristic performance (true-positive rate versus false-positive rate), indicating favorable trade-offs and supporting threshold selection for deployment.
Disclaimer/Publisher’s Note: The statements, opinions and data contained in all publications are solely those of the individual author(s) and contributor(s) and not of MDPI and/or the editor(s). MDPI and/or the editor(s) disclaim responsibility for any injury to people or property resulting from any ideas, methods, instructions or products referred to in the content. |
© 2026 by the authors. Licensee MDPI, Basel, Switzerland. This article is an open access article distributed under the terms and conditions of the Creative Commons Attribution (CC BY) license (http://creativecommons.org/licenses/by/4.0/).
Copyright: This open access article is published under a Creative Commons CC BY 4.0 license, which permit the free download, distribution, and reuse, provided that the author and preprint are cited in any reuse.


