

Submitted:
30 July 2026
Posted:
31 July 2026
You are already at the latest version
Abstract
Process optimization can improve the environmental and economic performance of biorefineries, yet its social consequences remain largely unexamined. In this study, we apply a prospective, screening-level social life cycle assessment (S-LCA) to a thermal-extractive avocado oil biorefinery. We compare a baseline configuration (S0) with three optimization scenarios, namely green chemistry (S1), heat integration (S2), and water integration (S3). The assessment relies on the Social Impact Weighting Method, and it uses SOCA v3 and PSILCA v3.1.1 background data on the ecoinvent 3.10 structure in openLCA 2.3. Results are expressed as medium-risk worker-hour equivalents per 1 kg of avocado oil under a cradle-to-gate boundary. In total, five indicators (fair salary, weekly hours of work, unemployment, contribution to economic development, and promoting social responsibility) are covered across four stakeholder groups, together with a 1000-iteration Monte Carlo analysis. In most configurations, the oil-processing stage was the leading social hotspot, because it embeds the extraction solvent and the other reagents. Of the three levers, only green chemistry worsened the social profile. It raised every worker-hour indicator by 24% to 92% relative to the baseline, most markedly for unemployment, since the substituted solvent supply chain adds upstream worker-hours. Heat integration and water integration, by contrast, both reduced the social risk, by 15% to 29% and by 10% to 31%, respectively. In addition, the Monte Carlo analysis showed that green chemistry was clearly separated from the other configurations. When these findings are read together with the environmental and economic assessment of the same system, heat integration and water integration appear to improve all three sustainability pillars at once. Green chemistry is therefore the single strategy in which an environmental motivation conflicts with the social dimension, which underlines the value of adding the social pillar to biorefinery optimization.
Keywords:
social life cycle assessment
; avocado biorefinery
; PSILCA
; SOCA
; worker hours
; process optimization
; social risk
; circular bioeconomy
; Colombia
1. Introduction
Agricultural side streams are increasingly regarded as strategic feedstocks for the circular bioeconomy. They allow additional biomass to be valorized without dedicated land, and they reduce the volume of unmanaged organic waste. Within this context, the non-edible fractions of avocado (Persea americana), such as peels, seeds, and pulp residues, are being turned into oil, antioxidants, biochar, and other products. As a result, avocado processing has emerged as a promising agro-industrial biorefinery platform [1,2]. Avocado oil has attracted particular attention, thanks to its favorable fatty-acid profile and its industrial applicability, and this interest has supported the development of extractive and thermochemical avocado oil biorefineries [3,4]. In Colombia, moreover, where Hass avocado production has expanded rapidly, these developments reach beyond environmental and economic performance and touch on rural employment, income distribution, and regional development [2].
The reference thermal-extractive avocado oil biorefinery converts non-edible avocado side streams into avocado oil, along with biochar, treated peel, and other co-products. It has already been characterized through process simulation, techno-economic assessment, and environmental life cycle assessment [5]. Building on that baseline, three optimization levers are commonly proposed to improve resource efficiency, namely green-solvent substitution, heat integration, and water integration [6,7,8]. Sustainability, however, rests on three pillars, and changes that improve the environmental and economic indicators do not necessarily bring social gains along the value chain. For this reason, the social dimension has to be assessed as well, so that trade-offs can be detected in which a gain in one pillar is simply offset by a burden shifted onto another [9,10].
Social life cycle assessment (S-LCA) is the established framework for quantifying the potential social risks and benefits of product systems along their life cycle. It follows the UNEP guidelines [11,12] and the principles and framework of ISO 14040 and 14044 [13,14]. Compared with environmental LCA, however, S-LCA is still less mature, and it faces recurring challenges in indicator selection, stakeholder coverage, data quality, and the interpretation of worker-hour activity variables [9,15]. In practice, the method is applied through database-driven approaches. The main examples are the Product Social Impact Life Cycle Assessment (PSILCA) database and its ecoinvent-linked extension, the Social Impact Weighting add-on (SOCA). Both express social risk as medium-risk worker-hour equivalents, which are derived from country- and sector-specific risk profiles [16,17]. These worker-hour methods have already supported comparative assessments of agro-industrial and bioenergy systems, including bioethanol, olive oil, chocolate, and fertilizers [18,19,20,21], and they have been recommended for screening the social hotspots of raw-material supply chains [22].
For avocado-based systems, however, the social evidence is still scarce and fragmented. A few studies have combined environmental LCA with social impact assessment for small-scale rural avocado biorefineries [23]. More recently, a screening and prospective S-LCA characterized the social risk profile of the baseline thermal-extractive avocado oil biorefinery in Colombia with the SOCA and PSILCA framework, and it pointed to worker-related indicators and to the upstream agricultural stages as the dominant social hotspots [24]. Together, these contributions establish a social baseline for avocado oil production. Yet they each evaluate a single process configuration, and they do not examine how targeted optimization strategies would change the social risk profile.
This gap matters because the three levers change the physical inventory of the biorefinery, and with it the worker-hours embedded in solvents, utilities, chemicals, and water supply. Depending on the case, these changes may lower the social risk or simply move it from one stakeholder group to another. So far, no harmonized comparison has tested whether these optimization pathways, which have already been assessed on the environmental and economic side, also improve or worsen the social performance of the same avocado oil biorefinery under a common functional unit, boundary, and impact-assessment method. In other words, it remains an open question for avocado and similar agro-industrial biorefineries whether a process change that lowers environmental impact and cost also lowers social risk, or whether it merely shifts worker-hour exposure between supply-chain stages [23,24].
To address this gap, the present study compares the social performance of three optimization strategies for an avocado oil biorefinery, namely green chemistry (S1), heat integration (S2), and water integration (S3), against the previously characterized thermal-extractive reference scenario (S0). The comparison uses a harmonized SOCA and PSILCA social life cycle assessment. The contribution of the work is threefold. First, it applies a consistent worker-hour inventory and impact-assessment procedure to the baseline and to the three optimized configurations, all under a common functional unit and a cradle-to-gate boundary. Second, rather than reducing the comparison to a single ranking, it organizes the results around social impact profiles, stakeholder-level hotspots, social burden shifting, allocation sensitivity, and uncertainty. Third, it reads the results as social trade-offs that complement the earlier environmental and economic evaluation of the same optimization pathways.
2. Materials and Methods
2.1. Reference Process and Optimization Scenarios
The reference configuration (S0) corresponds to the thermal-extractive avocado oil biorefinery reported for Northern Colombia [5,25], which valorizes non-edible avocado side streams at a processing capacity of approximately 10,605 t y−1 of avocado biomass and generates avocado oil together with biochar, treated peel, pulp without fat, and a chlorophyll-rich extract. The main operations comprise feedstock conditioning, pulp extraction and dehydration, solvent extraction and oil purification, chlorophyll recovery from peels, and thermochemical (pyrolysis) conversion of seeds. The harmonized process boundary and scenario framework used in this study are summarized in Figure 1.
Three optimized alternatives were derived from this baseline while preserving the same nominal processing capacity, functional unit, main product, and co-product portfolio, so that inter-scenario differences reflect the targeted optimization rather than changes in plant scale or product slate (Table 1). In the green chemistry scenario (S1), the conventional hexane extraction solvent is replaced with isopropanol (modeled with a market isopropanol dataset as a conservative proxy, with a reported extraction efficiency near 98% relative to hexane), and the fossil ethanol used for chlorophyll recovery is replaced with the Colombian market (corn-stover) ethanol [6,26]. In the heat integration scenario (S2), a pinch analysis (pinch temperature 37 °C) and heat-exchanger-network synthesis reduce external utilities: cooling water from 9067.00 to 3956.76 kg h−1, refrigerant from 67.83 to 23.17 kg h−1, steam from 976.75 to 18.08 kg h−1, and natural gas from 1012.00 to 20.87 MJ h−1 [7]. In the water integration scenario (S3), a water-reuse and recycling network reduces the freshwater requirement from 2778.65 to 359.51 kg h−1 (about 87%) and wastewater generation from 3374.57 to 284.91 kg h−1 (about 92%) [8]. The four configurations were each modeled independently from their process-simulation inventories. All of them, including S3, keep hexane as the extraction solvent. As a result, the water-integration scenario differs from the baseline only in its water-network inputs, and not in the solvent.
2.2. Goal, Functional Unit, and System Boundary
The goal of the assessment was to compare the potential social performance of the reference and optimized avocado oil biorefinery configurations. The functional unit was defined as 1 kg of avocado oil produced at the biorefinery gate, consistent with the environmental and economic assessments of the same system. A cradle-to-gate system boundary was adopted, comprising the production of the material and energy inputs, the transportation of raw materials to the production gate, and the biorefinery processing up to avocado oil at the factory gate [24]. Following the same modeling basis as the environmental assessment, a recycled-content (cut-off) rule was applied to the avocado side streams: the cultivation burdens are allocated entirely to the avocado produced for human consumption, so the side streams enter the biorefinery free of upstream cultivation impacts and only their collection, transport, and processing are included. Consequently, the supply-chain stage labelled “avocado production” in the openLCA model (a name used for the avocado-oil production activity) enters under the cut-off rule with zero cultivation flow, and it therefore carries no avocado-cultivation burden. Its non-zero social contribution instead reflects the worker-hours embedded in the collection, handling, and conditioning of the avocado side streams, together with their associated background inputs, rather than primary fruit production. The Consumers stakeholder group was not assessed, for two reasons. First, the cradle-to-gate boundary excludes the consumer-facing stages, that is downstream formulation, retail, and use. Second, the functional unit is an intermediate business-to-business product, namely crude avocado oil at the factory gate, for which the consumer-related subcategories are not populated in the foreground system.
2.3. Social Life Cycle Inventory
The social life cycle inventory combined foreground process-simulation data with background country–sector risk profiles. The activity variable was worker-hours, obtained by scaling plant-level labor requirements to the functional unit through the simulated production rate. The direct-labor requirement was approximately 0.0251 worker-hours per kilogram of avocado oil, corresponding to a staffing of about 2.5 operators applied consistently across all scenario models [24]. Foreground worker-hours were then linked to the sectoral labor intensities embedded in the SOCA and PSILCA background datasets, which represent country- and sector-specific socio-economic conditions. For the foreground operations, Colombia was used as the reference geography [17]. The number of on-site workers was assumed constant across the baseline and the optimized scenarios, so that inter-scenario differences in the social results arise from the changes in the material and energy inputs and their embedded background worker-hours rather than from changes in on-site staffing.
The foreground life cycle inventory that differentiates the scenarios is summarized in Table 2. It is expressed on the process basis (per hour) used in the shared process simulation, and normalization to the functional unit then uses the avocado oil production rate of 103.50 kg h−1. The inventory is identical across scenarios except for the targeted lever: S1 substitutes the extraction solvent (hexane → isopropanol) and the ethanol background dataset; S2 reduces the utilities (cooling water, refrigerant, steam, and natural gas); and S3 reduces the freshwater intake and wastewater through a water-reuse and recycling network. All configurations, including S3, retain hexane as the extraction solvent, so the inter-scenario social differences arise from the utility, solvent, and water-network inputs rather than from a solvent change in S3.
Background processes were matched automatically to the ecoinvent 3.10 structure through the SOCA v3 add-on (PSILCA v3.1.1), with Colombia as the reference geography for the foreground operations.
2.4. Stakeholder Categories and Indicator Selection
Indicator selection followed a materiality-screening procedure aligned with the UNEP/SETAC guidelines [11]. Five stakeholder groups were considered at the scoping stage (Workers, Local Community, Society, Consumers, and Value Chain Actors); after materiality screening and given the cradle-to-gate boundary, four groups were retained (Workers, Local Community, Society, and Value Chain Actors). Five social indicators were assessed, one to two per retained stakeholder group: fair salary (FS) and weekly hours of work (WH) for Workers; unemployment (U) for Local Community; contribution of the sector to economic development (CE) for Society; and promoting social responsibility (PSR) for Value Chain Actors [24]. These indicators were selected to match those adopted in the baseline social study of the same biorefinery, ensuring comparability, and correspond to the subcategories identified as most material for an intermediate, business-to-business bio-based product with a labor-intensive upstream chemical supply chain. Indicators were interpreted against the national statistics and living-wage benchmarks for Colombia reported in the base social study of the same biorefinery [24]. Consistent with the risk–opportunity framing of the method, FS, WH, U, and PSR are risk indicators (higher medium-risk worker-hours denote higher potential social risk), whereas CE is an opportunity indicator (higher values denote a larger potential contribution to economic development); this distinction is retained throughout the interpretation.
2.5. Social Impact Assessment
Social impacts were quantified with the Social Impact Weighting Method (SIWM), which expresses results as medium-risk worker-hour equivalents [24]. The assessment was implemented in openLCA version 2.3 using the SOCA v3 add-on, which links PSILCA v3.1.1 social risk data to the ecoinvent 3.10 process structure [17]. For each scenario, the total social result per indicator and the contribution of each supply-chain stage (avocado oil processing, avocado production, and transportation of raw materials) were extracted for the interpretation of hotspots.
2.6. Allocation and Interpretation
Multifunctionality was handled through subdivision as the main allocation approach, with mass and economic allocation evaluated in sensitivity, mirroring the allocation strategy of the environmental assessment of the same biorefinery. Because allocation acts as a linear multiplier on the worker-hour results, the three allocation choices were compared to test the robustness of the scenario ranking rather than to redefine the main results. Following the ISO 14044 interpretation phase [14], the results were examined for the significance and consistency of the differences between scenarios: percentage changes relative to the baseline were computed for every indicator, the contribution of each supply-chain stage was analyzed to identify hotspots, and the sensitivity of the conclusions to allocation and background-data uncertainty was assessed before drawing comparative claims.
2.7. Uncertainty Analysis
Parameter uncertainty in the background social risk data was propagated through Monte Carlo simulation implemented in openLCA version 2.3, with 1000 iterations per scenario, sampling the background database according to the openLCA uncertainty settings [24]. The mean of each resulting distribution is reported as the central value in Section 3.1, and the 5–95th percentile interval quantifies the spread used to assess whether the differences between scenarios are robust.
3. Results and Discussion
The results move from the social impact profile to hotspot contributions, social burden shifting, allocation sensitivity, and uncertainty. Results are reported as medium-risk worker-hour equivalents per 1 kg of avocado oil, using the mean of the openLCA Monte Carlo runs as the central value for each scenario.
Central values are the openLCA deterministic results under subdivision allocation, taken as the main case; the Monte Carlo analysis (Section 3.5) provides the corresponding uncertainty. Consistent with the risk–opportunity framing of the method, higher values denote higher potential social risk for FS, WH, U, and PSR, and a larger potential contribution to economic development for CE.
3.1. Social Impact Profile of the Baseline and Optimized Scenarios
Table 3 and Figure 2 summarize the social impact profile of the baseline (S0) and the three optimized configurations across the five selected indicators, reported as the mean result of the openLCA SIWM assessment per functional unit. The five indicators differ in magnitude by more than an order of magnitude, from contribution to economic development (CE, below 3 med-risk hours) to fair salary (FS, the largest indicator), reflecting the different worker-hour intensities of the underlying social sub-categories.
Green chemistry (S1) is the only lever that increases the worker-hour social risk relative to the baseline, and it does so for all five indicators (by roughly 24% to 92%). The largest rise is in unemployment, which grows from 5.60 to 10.77 med-risk h. This increase reflects the larger upstream economic activity, and therefore the additional embedded worker-hours, of the substituted solvent supply chain. Both heat integration (S2) and water integration (S3), by contrast, reduce the social profile. Heat integration lowers every indicator by 15% to 29%, for example fair salary from 26.57 to 18.83 med-risk h, because it cuts the external utility demand. Water integration lowers the indicators by 10% to 31%, for example fair salary to 23.97 med-risk h, because a smaller freshwater and wastewater flow removes worker-hours from the upstream water supply chain and does not add a labor-intensive material input. For fair salary the resulting order is S1 > S0 > S3 > S2. Both S2 and S3 stay clearly below the baseline for every indicator, although their relative order changes from one indicator to another.
3.2. Hotspot and Contribution Analysis by Supply-Chain Stage
Figure 3 decomposes each indicator into the three foreground supply-chain stages: oil processing, avocado production, and transport of raw materials. In the baseline (S0, Figure 3a), oil processing is the leading contributor for most indicators (62–81% for CE, FS, PSR, and WH), whereas the unemployment indicator (U) is distributed more evenly across oil processing (∼40%), avocado production (∼31%), and transport (∼29%), reflecting the higher unemployment-risk intensity of the agricultural and logistics sectors. In green chemistry (S1, Figure 3b) the oil-processing stage remains the leading contributor (68–73% across all indicators), because the substituted solvent supply chain is embedded in that stage, while the avocado-side-stream stage rises to 16–28%. In heat integration (S2, Figure 3c) the pattern shifts toward avocado production, which becomes the largest contributor for FS (48%), U (38%), and WH (47%): lowering the utility demand reduces the processing-stage worker-hours and leaves the agricultural stage relatively more prominent. In water integration (S3, Figure 3d), oil processing leads for most indicators (48–59%) but the avocado-side-stream stage becomes more prominent than in green chemistry (28–45%) and, for unemployment, slightly exceeds oil processing (38% versus 34%). Taken together, these contributions identify the oil-processing stage as the primary social hotspot in the baseline and green-chemistry configurations, and for most indicators of water integration. In heat integration, however, and also for the unemployment indicator of water integration, the avocado-side-stream (“avocado production”) stage becomes comparable to or larger than oil processing. Oil processing is therefore not the leading stage in every case. It should be noted that the three broad stages resolved here (oil processing, avocado-side-stream handling, and transport) do not, on their own, isolate the solvent and reagent supply chains. Their prominence within the oil-processing stage is instead inferred from the inventory change between scenarios, rather than resolved directly in Figure 3. This pattern agrees with worker-hour S-LCA studies of other product systems. In a comparative assessment of battery technologies, for example, most social risk was concentrated in the raw-material extraction and chemical-supply sectors, and Workers were identified as the most affected stakeholder group [27]. Likewise, a hotspot analysis of hydrogen value chains showed that the leading social hotspots depend strongly on the specific indicator and on the length and complexity of the upstream supply chain [28]. The concentration of avocado oil social risk in the solvent- and reagent-intensive processing stage is therefore in line with the wider evidence that chemical-supply and upstream sectors dominate worker-hour social profiles. The complete stage contributions for all indicators and scenarios are reported in Table A1 (Appendix A).
3.3. Social Burden Shifting Relative to the Baseline
Table 4 and Figure 4 express the results as the percentage change relative to the baseline, with positive values denoting an increase and negative values a reduction in the indicator. For the risk indicators (FS, WH, U, PSR) an increase is unfavorable, whereas for the opportunity indicator (CE) an increase denotes a larger potential contribution to economic development.
The burden-shifting profile clearly separates green chemistry from the other two levers. Green chemistry (S1) increases every indicator relative to the baseline, most markedly unemployment (+92.1%) and fair salary (+36.1%). This pattern indicates that the solvent substitution pushes additional worker-hour exposure into the upstream supply chain. Heat integration (S2) and water integration (S3), by contrast, both reduce the indicators, by 15% to 29% and by 10% to 31%, respectively. In short, of the three optimization levers, only green chemistry worsens the social profile, whereas the utility- and water-focused levers improve it.
3.4. Allocation Sensitivity
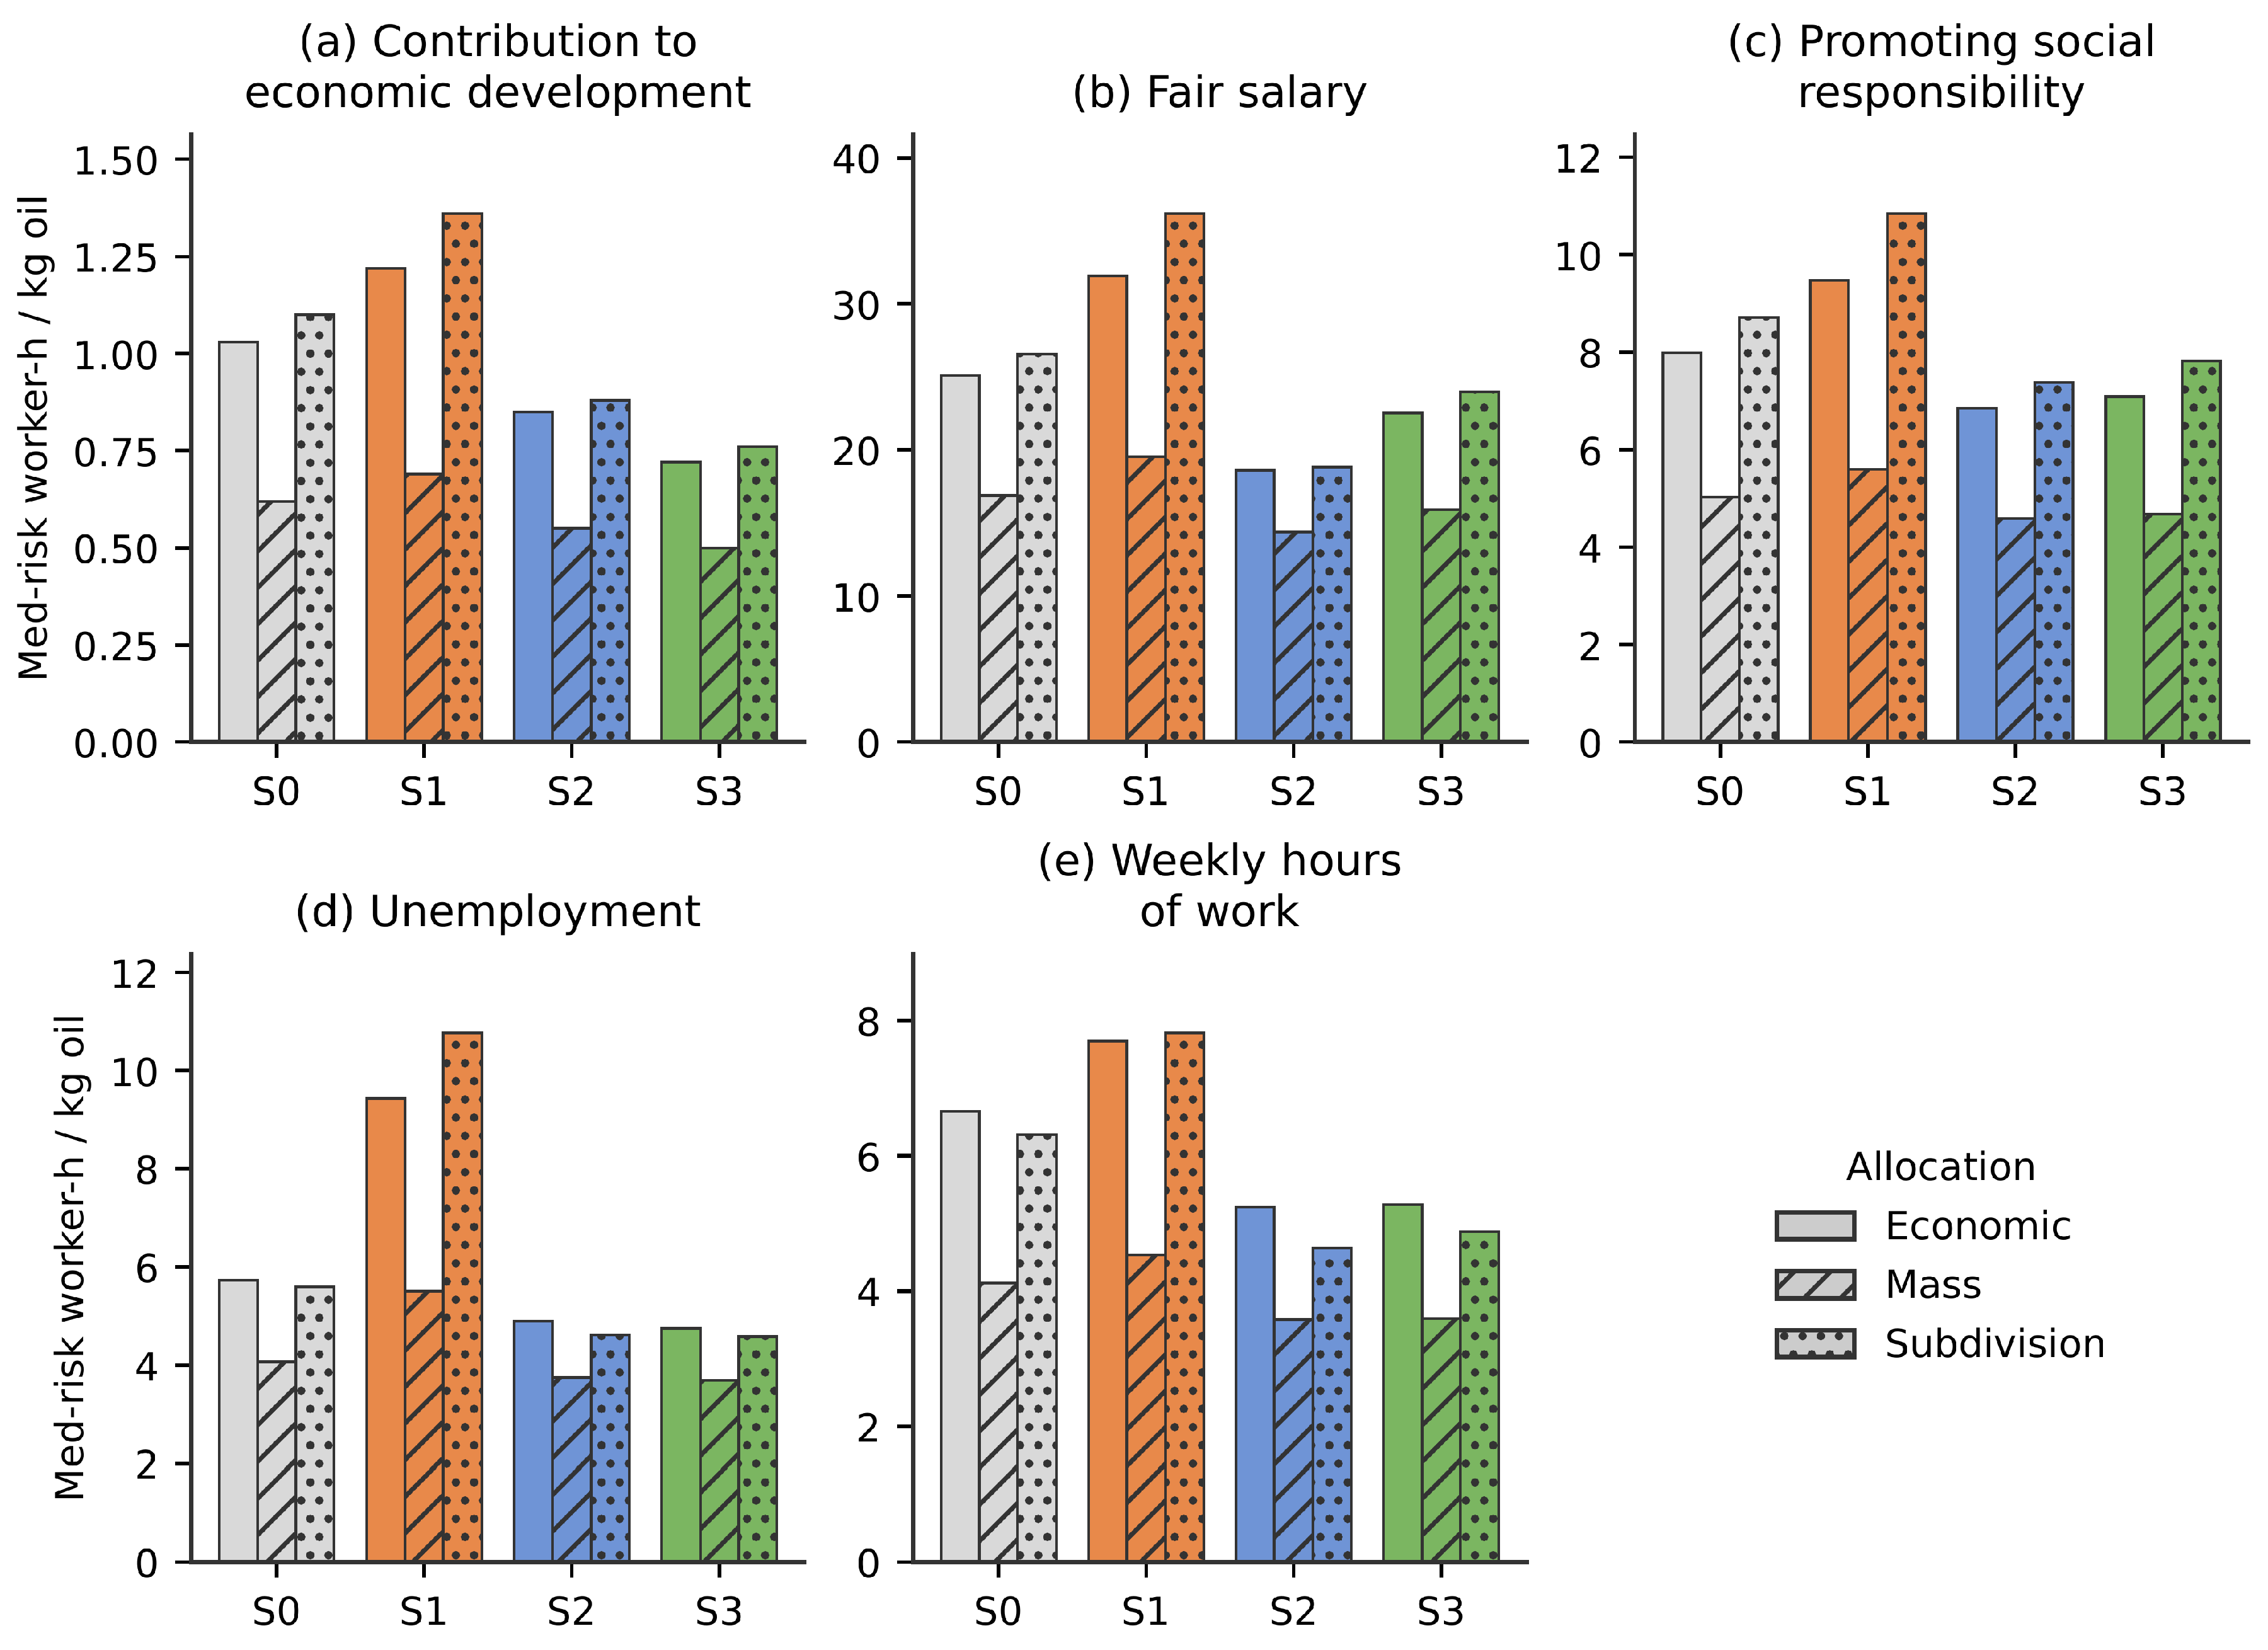
Because the biorefinery is a multi-output system, the choice of allocation rule affects how the upstream worker-hours are shared out to the avocado oil functional unit. Subdivision was adopted as the main case, and economic and mass allocation were examined in sensitivity, mirroring the environmental assessment of the same system. Table A2 and Figure A1 (Appendix A) report the results under the three rules. Green chemistry (S1) remains the highest-risk configuration for every indicator under all three allocations. Moreover, both heat integration (S2) and water integration (S3) stay below the baseline (S0) under all three rules. The central conclusion, namely that green chemistry is the only lever that worsens the social profile, is therefore robust to the allocation choice. Mass allocation gives the lowest absolute values throughout and subdivision the highest, so the subdivision main case can be read as a conservative, upper estimate of the worker-hour burden. Finally, the relative order of S2 and S3 depends on the indicator rather than on the allocation rule (S3 is lower for fair salary, and S2 for the economic-development and unemployment indicators), and this order stays the same across the three allocations.
3.5. Uncertainty Analysis
Figure 5 presents the Monte Carlo means and the 5th-to-95th percentile intervals for each indicator and scenario (1000 iterations; full statistics in Table A3, Appendix A). Green chemistry (S1) lies above all other configurations for every indicator, and its interval is separated from that of heat integration (S2) for all five. The elevated social risk of green chemistry is therefore robust to the propagated background-data uncertainty. The baseline (S0), water integration (S3), and heat integration (S2) sit closer together, and their intervals partly overlap for several indicators. For this reason, the reductions of S2 and S3 relative to the baseline are best read as consistent trends rather than as fully separated distributions. The width of the interval ranged from roughly 15% to 45% of the mean. The Monte Carlo means shown here lie slightly above the subdivision point values of Table 3, because the background risk distributions are right-skewed. Those point values still fall within the reported intervals, so the two descriptions remain mutually consistent for all four scenarios.
3.6. Integrated Interpretation and Trade-Offs
When the social results are read together with the environmental and economic assessment of the same biorefinery, only green chemistry (S1) turns out to carry a social penalty. Substituting the extraction solvent raises every social-risk indicator by 24% to 92%, so the environmental motivation of that lever is partly offset by a shift of worker-hour exposure into the upstream chemical supply chain. Heat integration (S2) and water integration (S3), which the companion LCA-TEA study linked to climate, eutrophication, and water-use benefits and to favorable economics, in addition reduce the social risk, by 15% to 29% and by 10% to 31%, respectively. For these two utility- and water-focused levers the three sustainability pillars therefore align, and environmental, economic, and social performance improve together. Green chemistry, by contrast, is the single strategy in which an environmental motivation conflicts with the social dimension. Taken together, these results show that reducing on-site environmental burdens can reduce social risk, but does not always do so, and that the outcome is lever-specific. The worker-hour indicators are nonetheless two-sided. A larger number of medium-risk worker-hours signals greater potential exposure to unfavorable working conditions, yet it also reflects greater upstream economic activity and employment, which the contribution-to-economic-development indicator captures as a potential benefit (CE rises by 24% for S1). A complete sustainability judgement should therefore weigh the higher risk exposure of green chemistry against its larger economic-activity footprint and its environmental advantages, instead of treating the worker-hour increase as simply negative. These trade-offs echo a broader observation, namely that the social dimension of the bioeconomy is still less developed than its environmental and economic counterparts and needs to be embedded in a life cycle sustainability perspective, so that supply-chain effects are not overlooked [29]. They also match evidence that the social performance of energy and product systems is highly sensitive to configuration and sourcing choices, for example to on-site versus off-site (imported) hydrogen production [28]. This reinforces the idea that process-design choices should be screened for their social consequences, and not only for their environmental and economic outcomes.
3.7. Comparison with Previous Social Assessments of Biorefineries
The present results can be placed in the context of the still-scarce literature on the social dimension of biorefineries. A recent systematic review confirms that social aspects remain markedly under-represented in biorefinery life cycle assessment, which is still dominated by environmental and economic impacts, and calls for standardized social indicators and greater stakeholder coverage [30]. Within that small body of work, Workers consistently emerge as the priority stakeholder group. For instance, the screening S-LCA of microalgae biorefineries by Pérez-López et al. prioritized Workers and Local Communities, and it traced the main social risks to upstream activities such as basic-chemicals production and anaerobic digestion, with the geographical distribution of the supply chain governing the outcome [31]. In a similar spirit, dedicated sugarcane-biorefinery studies have developed worker-centered methods to capture human-development effects [32]. This convergence on Workers, and on the upstream, chemical-intensive stages, is consistent with our own findings. The worker-related indicators are prominent in the avocado oil system, and the oil-processing stage, which embeds the solvent and reagent inputs, is the leading social hotspot in most configurations. A formal claim that the Workers stakeholder group is dominant would require aggregation of the indicators by stakeholder rather than the five individual indicators reported here, and is therefore not asserted.
A second recurring theme is that the choice of process technology, or of process design, clearly changes the social profile. Cadena et al. showed that S-LCA can discriminate between alternative production-process designs of a biorefinery [33], and Souza et al. found distinct social performances for first- and second-generation ethanol technologies [34]. Our results extend this evidence in two ways. First, under a harmonized functional unit and boundary, they quantify how three specific optimization levers reshape the social profile of a single biorefinery. Second, they show that an environmentally motivated change, namely green-solvent substitution, can substantially increase social risk instead of reducing it. For the avocado system in particular, this study complements the combined environmental and social impact assessment of small-scale rural avocado biorefineries [23] and the baseline social characterization of the thermal-extractive configuration [24]. In doing so, it moves from a single-configuration description to a comparative, burden-shifting analysis across optimization scenarios.
Table 5 summarizes these comparable studies. A direct numerical benchmarking of worker-hour values across studies is not meaningful, because the functional units, product systems, databases (PSILCA versions, SOCA, or subcategory approaches), and impact-assessment methods differ substantially; the comparison is therefore structured qualitatively around system, method, social focus, and main finding.
3.8. Methodological Limitations
Several limitations should be kept in mind when the results are interpreted. First, the assessment is cradle-to-gate, so it leaves out the consumer-facing stages and the Consumers stakeholder group. A cradle-to-grave extension would be needed to capture the social aspects of the use and end-of-life stages. Second, the study is prospective and screening-level. The background social data are country- and sector-level risk profiles from the PSILCA and SOCA database at a macro resolution, so they describe the sectors that supply the biorefinery rather than site-specific working conditions. Third, the activity variable is worker-hours, which scales with the economic throughput of each input. Scenarios that increase the volume or value of upstream inputs therefore raise the worker-hour totals almost mechanically, and, in addition, the on-site staffing was held constant across configurations. Fourth, the social inventory was built in openLCA with SOCA and PSILCA, whereas the companion environmental model used a different database and software. The comparison across dimensions is therefore qualitative rather than a strict numerical coupling. Finally, the central values reported here are the openLCA deterministic results under subdivision allocation, and the Monte Carlo analysis provides the uncertainty. The Monte Carlo means lie slightly above the deterministic point estimates, because the background risk distributions are right-skewed, but the two descriptions remain mutually consistent, since the deterministic values fall within the reported intervals.
4. Conclusions
This study compared the potential social performance of a baseline thermal-extractive avocado oil biorefinery with three optimization strategies, namely green chemistry, heat integration, and water integration. The comparison relied on a prospective, screening-level, cradle-to-gate social life cycle assessment, expressed in medium-risk worker-hour equivalents per kilogram of avocado oil. Of the three levers, only green chemistry worsened the social profile. Substituting the extraction solvent increased every social-risk indicator by 24% to 92% relative to the baseline, most markedly unemployment, because it displaces additional worker-hour exposure into the upstream chemical supply chain. Heat integration and water integration, by contrast, both reduced the social risk, by 15% to 29% and by 10% to 31%, respectively, because they lower the worker-hours embedded in the upstream utility and water supply chains. The Monte Carlo analysis further confirmed that green chemistry is clearly separated from the other configurations, with the order S1 > S0 > S3 > S2 for fair salary. In the companion environmental and economic assessment of the same system, heat integration and water integration were also the most favorable options for climate and eutrophication mitigation and for profitability. Read alongside those results, the social findings reinforce these two levers as strategies that improve all three sustainability pillars at once. Green chemistry, on the other hand, remains the single strategy in which an environmental motivation conflicts with the social dimension. Because the worker-hour indicators reflect both risk exposure and economic activity, they should be interpreted together, and not as unambiguous burdens. Future work should extend the boundary to the use and end-of-life stages, add site-specific primary social data, and bring the social and environmental inventories together within a common life cycle sustainability assessment framework.
Author Contributions
Conceptualization, A.A.-M., S.M., and A.D.G.-D.; methodology, A.A.-M., S.M., and A.D.G.-D.; software, A.A.-M. and S.M.; validation, A.A.-M., S.M., and A.D.G.-D.; formal analysis, A.A.-M. and S.M.; investigation, A.A.-M. and S.M.; resources, A.A.-M. and S.M.; data curation, A.A.-M. and S.M.; writing—original draft preparation, A.A.-M. and S.M.; writing—review and editing, A.A.-M., S.M., and A.D.G.-D.; visualization, A.A.-M. and S.M.; supervision, A.A.-M., S.M., and A.D.G.-D. All authors have read and agreed to the published version of the manuscript.
Funding
This research was funded by the Colombian Ministry of Science, Technology and Innovation MINCIENCIAS through the project “Sustainable Use of Avocado (Laurus persea L.) Produced in the Montes de María to obtain Value Added Products under the Biorefinery Concept in the Department of Bolívar” and “Evaluation of the sustainability of a cascade biorefinery topology for the use of Hass avocado seeds cultivated in the Amazon region”, Codes BPIN 2020000100325.
Institutional Review Board Statement
Not applicable.
Informed Consent Statement
Not applicable.
Data Availability Statement
The processed results supporting the figures and tables are reported in the article and its appendices. The foreground life cycle inventory, the openLCA/SOCA models, and the full Monte Carlo outputs are not included in the article; they are available from the corresponding author upon reasonable request, subject to the licensing restrictions of the PSILCA/SOCA databases.
Acknowledgments
During the preparation of this manuscript, the authors used Claude 4.8 for final language polishing, including typographical, wording, and grammatical revisions. The authors reviewed and edited the output and take full responsibility for the content of this publication.
Conflicts of Interest
The authors declare no conflicts of interest.
Appendix A. Supporting Social LCA Data
Appendix A compiles the supply-chain-stage contribution, allocation, and Monte Carlo evidence that supports the main-text figures. Values are medium-risk worker-hour equivalents per 1 kg of avocado oil unless stated otherwise.

Table A1.
Contribution of the foreground supply-chain stages to each social indicator (% of the scenario total).
Table A1.
Contribution of the foreground supply-chain stages to each social indicator (% of the scenario total).
| Scenario | Stage | CE | FS | PSR | U | WH |
| Oil processing | 81.4 | 62.0 | 65.6 | 39.7 | 61.4 | |
| S0 (baseline) | Avocado production | 13.5 | 25.5 | 23.7 | 31.4 | 35.5 |
| Transport | 5.1 | 12.5 | 10.6 | 28.9 | 3.1 | |
| Oil processing | 73.2 | 67.6 | 70.8 | 71.9 | 67.6 | |
| S1 (green chem.) | Avocado production | 22.5 | 24.8 | 20.2 | 16.2 | 28.2 |
| Transport | 4.3 | 7.6 | 9.0 | 11.9 | 4.2 | |
| Oil processing | 58.5 | 37.7 | 57.0 | 34.3 | 45.4 | |
| S2 (heat integ.) | Avocado production | 34.8 | 47.7 | 29.7 | 37.8 | 47.5 |
| Transport | 6.7 | 14.6 | 13.3 | 27.9 | 7.1 | |
| Oil processing | 52.2 | 51.0 | 59.4 | 33.9 | 48.1 | |
| S3 (water integ.) | Avocado production | 40.1 | 37.5 | 28.0 | 38.0 | 45.2 |
| Transport | 7.7 | 11.5 | 12.6 | 28.1 | 6.7 |
Table A2.
Social impact results under economic, mass, and subdivision allocation for the baseline and optimized scenarios (medium-risk worker-hours per kg of avocado oil).
Table A2.
Social impact results under economic, mass, and subdivision allocation for the baseline and optimized scenarios (medium-risk worker-hours per kg of avocado oil).
| Indicator | Allocation | S0 | S1 | S2 | S3 |
| Economic | 1.03 | 1.22 | 0.85 | 0.72 | |
| CE | Mass | 0.62 | 0.69 | 0.55 | 0.50 |
| Subdivision | 1.10 | 1.36 | 0.88 | 0.76 | |
| Economic | 25.12 | 31.91 | 18.61 | 22.52 | |
| FS | Mass | 16.90 | 19.52 | 14.39 | 15.90 |
| Subdivision | 26.57 | 36.17 | 18.83 | 23.97 | |
| Economic | 7.98 | 9.47 | 6.85 | 7.09 | |
| PSR | Mass | 5.03 | 5.60 | 4.59 | 4.68 |
| Subdivision | 8.71 | 10.84 | 7.38 | 7.82 | |
| Economic | 5.73 | 9.44 | 4.89 | 4.75 | |
| U | Mass | 4.07 | 5.50 | 3.75 | 3.69 |
| Subdivision | 5.60 | 10.77 | 4.61 | 4.58 | |
| Economic | 6.66 | 7.70 | 5.24 | 5.28 | |
| WH | Mass | 4.12 | 4.53 | 3.58 | 3.59 |
| Subdivision | 6.32 | 7.82 | 4.64 | 4.88 |
Table A3.
Monte Carlo statistics (1000 iterations): mean and 5–95th percentile interval per indicator and scenario. The Monte Carlo means lie slightly above the subdivision point estimates of Table 3 because the background distributions are right-skewed.
Table A3.
Monte Carlo statistics (1000 iterations): mean and 5–95th percentile interval per indicator and scenario. The Monte Carlo means lie slightly above the subdivision point estimates of Table 3 because the background distributions are right-skewed.
| Indicator | S0 | S1 | S2 | S3 |
| CE | 1.28 [1.07–1.45] | 1.58 [1.33–1.80] | 0.95 [0.84–1.19] | 0.87 [0.73–1.08] |
| FS | 31.00 [25.92–35.15] | 41.58 [35.34–46.45] | 20.58 [17.96–26.49] | 26.44 [23.21–31.63] |
| PSR | 9.51 [8.54–10.33] | 11.81 [10.70–12.64] | 7.77 [7.15–8.85] | 8.31 [7.64–9.25] |
| U | 6.56 [4.93–7.60] | 11.98 [9.59–13.45] | 4.64 [3.97–6.46] | 4.84 [4.07–6.10] |
| WH | 6.95 [5.73–8.46] | 8.47 [7.23–9.92] | 5.07 [4.00–6.61] | 5.27 [4.62–6.08] |
Figure A1.
Social impact results under economic (solid), mass (hatched), and subdivision (dotted) allocation for (a) contribution to economic development; (b) fair salary; (c) promoting social responsibility; (d) unemployment; and (e) weekly hours of work across the four scenarios. Green chemistry (S1) remains the highest under all three rules; the ordering of the reduced scenarios (S0, S2, S3) is largely preserved.
Figure A1.
Social impact results under economic (solid), mass (hatched), and subdivision (dotted) allocation for (a) contribution to economic development; (b) fair salary; (c) promoting social responsibility; (d) unemployment; and (e) weekly hours of work across the four scenarios. Green chemistry (S1) remains the highest under all three rules; the ordering of the reduced scenarios (S0, S2, S3) is largely preserved.
References
- Mora-Sandí, A.; Ramírez-González, A.; Castillo-Henríquez, L.; Lopretti-Correa, M.; Vega-Baudrit, J.R. Persea americana agro-industrial waste biorefinery for sustainable high-value-added products. Polymers 2021, 13, 1727. [Google Scholar] [CrossRef] [PubMed]
- García, J.S.A.; Hurtado-Salazar, A.; Ceballos-Aguirre, N. Current overview of Hass avocado in Colombia. Challenges and opportunities: A review. Cienc. Rural 2021, 51, e20200903. [Google Scholar] [CrossRef]
- Flores, M.; Saravia, C.; Vergara, C.E.; Ávila, F.; Valdés, H.; Ortiz-Viedma, J. Avocado oil: Characteristics, properties, and applications. Molecules 2019, 24, 2172. [Google Scholar] [CrossRef] [PubMed]
- Solarte-Toro, J.C.; Ortiz-Sanchez, M.; Restrepo-Serna, D.L.; Peroza Piñeres, P.; Pérez Cordero, A.; Cardona Alzate, C.A. Influence of products portfolio and process contextualization on the economic performance of small- and large-scale avocado biorefineries. Bioresour. Technol. 2021, 342, 126060. [Google Scholar] [CrossRef] [PubMed]
- Meramo, S.; Herrera-Rodríguez, T.; González-Delgado, Á.D. Economic and environmental hotspots of new thermal-extractive avocado biorefinery. Biomass Bioenergy 2026, 207, 108724. [Google Scholar] [CrossRef]
- Chemat, F.; Abert Vian, M.; Ravi, H.K.; Khadhraoui, B.; Hilali, S.; Perino, S. Review of alternative solvents for green extraction of food and natural products: Panorama, principles, applications and prospects. Molecules 2019, 24, 3007. [Google Scholar] [CrossRef] [PubMed]
- Klemeš, J.J.; Varbanov, P.S.; Walmsley, T.G.; Jia, X. New directions in the implementation of pinch methodology. Renew. Sustain. Energy Rev. 2018, 98, 439–468. [Google Scholar] [CrossRef]
- Foo, D.C.Y. State-of-the-art review of pinch analysis techniques for water network synthesis. Ind. Eng. Chem. Res. 2009, 48, 5125–5159. [Google Scholar] [CrossRef]
- Pollok, L.; Spierling, S.; Endres, H.J.; Grote, U. Social life cycle assessments: A review on past development, advances and methodological challenges. Sustainability 2021, 13, 10286. [Google Scholar] [CrossRef]
- Huertas-Valdivia, I.; Ferrari, A.M.; Settembre-Blundo, D.; García-Muiña, F.E. Social life-cycle assessment: A review by bibliometric analysis. Sustainability 2020, 12, 6211. [Google Scholar] [CrossRef]
- United Nations Environment Programme (UNEP). Guidelines for Social Life Cycle Assessment of Products and Organizations 2020; UNEP: Nairobi, Kenya, 2020. [Google Scholar]
- Sala, S.; Vasta, A.; Mancini, L.; Dewulf, J.; Rosenbaum, E. Social Life Cycle Assessment: State of the Art and Challenges for Supporting Product Policies; European Commission Joint Research Centre: Ispra, Italy, 2015. [Google Scholar]
- International Organization for Standardization. ISO 14040:2006; Environmental Management—Life Cycle Assessment—Principles and Framework. ISO: Geneva, Switzerland, 2006.
- International Organization for Standardization. ISO 14044:2006 Environmental Management—Life Cycle Assessment—Requirements and Guidelines; ISO. Geneva, Switzerland, 2006.
- van Haaster, B.; Ciroth, A.; Fontes, J.; Wood, R.; Ramirez, A. Development of a methodological framework for social life-cycle assessment of novel technologies. Int. J. Life Cycle Assess. 2017, 22, 423–440. [Google Scholar] [CrossRef]
- Tragnone, B.M.; Serreli, M.; Arzoumanidis, I.; Pelino, C.A.; Petti, L. Using the Product Social Impact Life Cycle Assessment (PSILCA) database for product comparison: Confetti case study. Int. J. Life Cycle Assess. 2023, 28, 1031–1053. [Google Scholar] [CrossRef]
- GreenDelta GmbH. Soca v.2 Add-On—Adding Social Impact Information to Ecoinvent; GreenDelta GmbH: Berlin, Germany, 2021. [Google Scholar]
- Papong, S.; Rewlay-ngoen, C.; Itsubo, N.; Malakul, P. Environmental life cycle assessment and social impacts of bioethanol production in Thailand. J. Clean. Prod. 2017, 157, 254–266. [Google Scholar] [CrossRef]
- Safeie-Noghlbari, B.; Amiri, Z.; Allahyari, M.S.; Nikkhah, A.; Ben Hassen, T.; Bacenetti, J. Social life cycle assessment of the olive oil industry: A case study in Guilan Province, Iran. Environ. Dev. Sustain. 2024, 27, 14553–14599. [Google Scholar] [CrossRef]
- Luna Ostos, L.M.; Roche, L.; Coroama, V.; Finkbeiner, M. Social life cycle assessment in the chocolate industry: A Colombian case study with Luker Chocolate. Int. J. Life Cycle Assess. 2024, 29, 929–951. [Google Scholar] [CrossRef]
- Martínez-Blanco, J.; Lehmann, A.; Muñoz, P.; Antón, A.; Traverso, M.; Rieradevall, J.; Finkbeiner, M. Application challenges for the social life cycle assessment of fertilizers within life cycle sustainability assessment. J. Clean. Prod. 2014, 69, 34–48. [Google Scholar] [CrossRef]
- Mancini, L.; Eynard, U.; Eisfeldt, F.; Ciroth, A.; Blengini, G.A.; Pennington, D.W. Social Assessment of Raw Materials Supply Chains: A Life-Cycle-Based Analysis; Publications Office of the European Union: Luxembourg, 2018. [Google Scholar]
- Solarte-Toro, J.C.; Ortiz-Sanchez, M.; Cardona Alzate, C.A. Environmental life cycle assessment (E-LCA) and social impact assessment (SIA) of small-scale biorefineries implemented in rural zones: The avocado (Persea americana var. Americana) case in Colombia. Environ. Sci. Pollut. Res. 2022, 30, 8790–8808. [Google Scholar] [CrossRef] [PubMed]
- Meramo, S.; Herrera-Rodriguez, T.; González-Delgado, Á.D. Social implications of valorizing avocado residues through thermochemical biorefinery pathways. Sustainability 2026, 18, 6885. [Google Scholar] [CrossRef]
- Herrera, T.; Parejo, V.; González-Delgado, Á. Quality of energy conservation in an avocado oil extraction process via exergy analysis. Chem. Eng. Trans. 2022, 91, 241–246. [Google Scholar] [CrossRef]
- Clarke, C.J.; Tu, W.-C.; Levers, O.; Bröhl, A.; Hallett, J.P. Green and sustainable solvents in chemical processes. Chem. Rev. 2018, 118, 747–800. [Google Scholar] [CrossRef] [PubMed]
- Koese, M.; Blanco, C.F.; Vert, V.B.; Vijver, M.G. A social life cycle assessment of vanadium redox flow and lithium-ion batteries for energy storage. J. Ind. Ecol. 2022, 27, 223–237. [Google Scholar] [CrossRef]
- Martín-Gamboa, M.; Mancini, L.; Eynard, U.; Arrigoni, A.; Valente, A.; Weidner, E.; Mathieux, F. Social life cycle hotspot analysis of future hydrogen use in the EU. Int. J. Life Cycle Assess. 2025, 30, 1379–1396. [Google Scholar] [CrossRef]
- Rebolledo-Leiva, R.; Moreira, M.T.; González-García, S. Progress of social assessment in the framework of bioeconomy under a life cycle perspective. Renew. Sustain. Energy Rev. 2023, 175, 113162. [Google Scholar] [CrossRef]
- Ortigueira, J.; Lopes, T.F. Bridging gaps in biorefineries: The unexplored role of social dimension in life cycle assessment research. Sustain. Futur. 2025, 9, 100818. [Google Scholar] [CrossRef]
- Pérez-López, P.; Rajaonison, A.; Zebian, B.; Bouallou, C.; González-Fernández, C.; Greses, S.; Gómez-Serrano, C.; Acién, F.G. Exploiting outcomes of life cycle costing to conduct coherent screening social life cycle assessments of emerging systems: A case study of microalgae biorefineries. Int. J. Life Cycle Assess. 2025, 30, 770–791. [Google Scholar] [CrossRef]
- Souza, A.; Watanabe, M.D.B.; Cavalett, O.; Cunha, M.P.; Ugaya, C.M.L.; Bonomi, A. A novel social life cycle assessment method for determining workers’ human development: A case study of the sugarcane biorefineries in Brazil. Int. J. Life Cycle Assess. 2021, 26, 2072–2084. [Google Scholar] [CrossRef]
- Cadena, E.; Rocca, F.; Gutiérrez, J.A.; Carvalho, A. Social life cycle assessment methodology for evaluating production process design: Biorefinery case study. J. Clean. Prod. 2019, 238, 117718. [Google Scholar] [CrossRef]
- Souza, A.; Watanabe, M.D.B.; Cavalett, O.; Ugaya, C.M.L.; Bonomi, A. Social life cycle assessment of first and second-generation ethanol production technologies in Brazil. Int. J. Life Cycle Assess. 2018, 23, 617–628. [Google Scholar] [CrossRef]
Figure 1.
Cradle-to-gate social system boundary and scenario framework. (a) Foreground inputs (including transport of raw materials to the gate), biorefinery process routes, products, the worker-hour activity variable linked to the SOCA/PSILCA background, the assessed stakeholder groups, functional unit, allocation basis, and exclusions; (b) scenarios S0 (baseline), S1 (green chemistry), S2 (heat integration), and S3 (water integration, modeled with the hexane baseline).
Figure 1.
Cradle-to-gate social system boundary and scenario framework. (a) Foreground inputs (including transport of raw materials to the gate), biorefinery process routes, products, the worker-hour activity variable linked to the SOCA/PSILCA background, the assessed stakeholder groups, functional unit, allocation basis, and exclusions; (b) scenarios S0 (baseline), S1 (green chemistry), S2 (heat integration), and S3 (water integration, modeled with the hexane baseline).
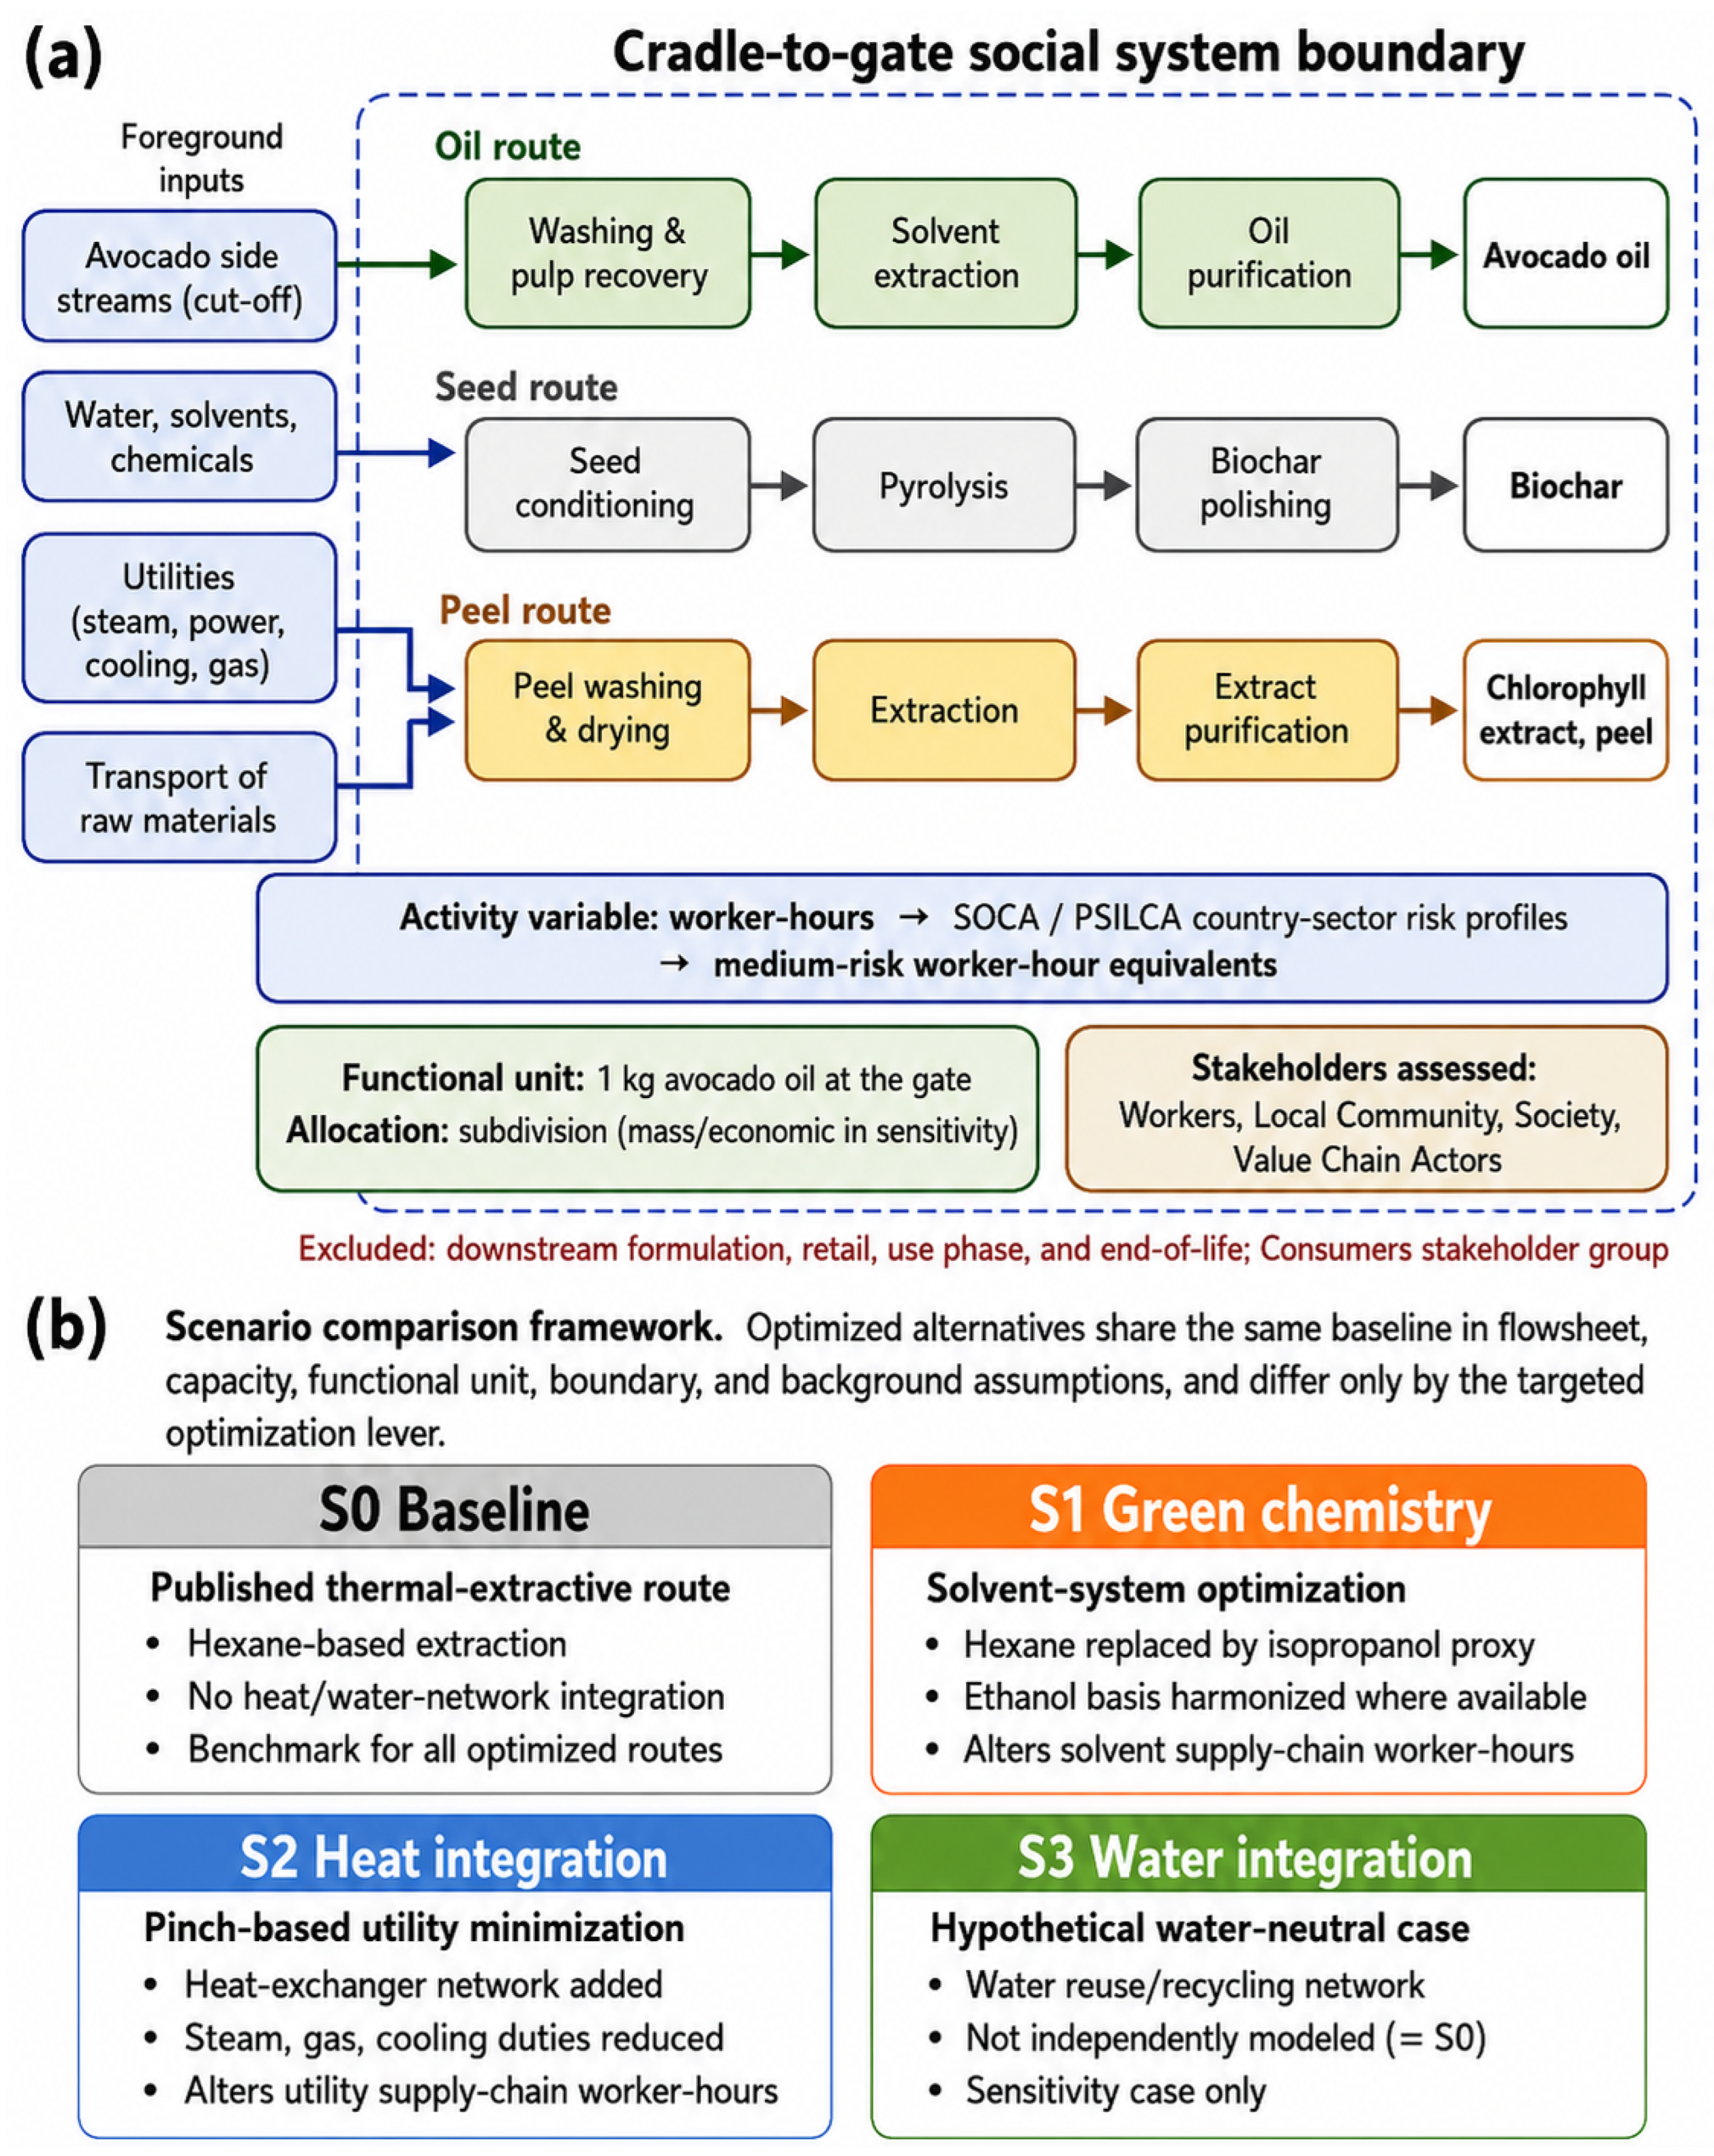
Figure 2.
Mean social impact profile of the baseline (S0) and the green chemistry (S1), heat integration (S2), and water integration (S3) scenarios: (a) contribution to economic development; (b) fair salary; (c) promoting social responsibility; (d) unemployment; and (e) weekly hours of work. Results are medium-risk worker-hour equivalents per 1 kg of avocado oil (openLCA SIWM mean). Water integration (S3) is a modeled hexane-based scenario, not a neutral case.
Figure 2.
Mean social impact profile of the baseline (S0) and the green chemistry (S1), heat integration (S2), and water integration (S3) scenarios: (a) contribution to economic development; (b) fair salary; (c) promoting social responsibility; (d) unemployment; and (e) weekly hours of work. Results are medium-risk worker-hour equivalents per 1 kg of avocado oil (openLCA SIWM mean). Water integration (S3) is a modeled hexane-based scenario, not a neutral case.
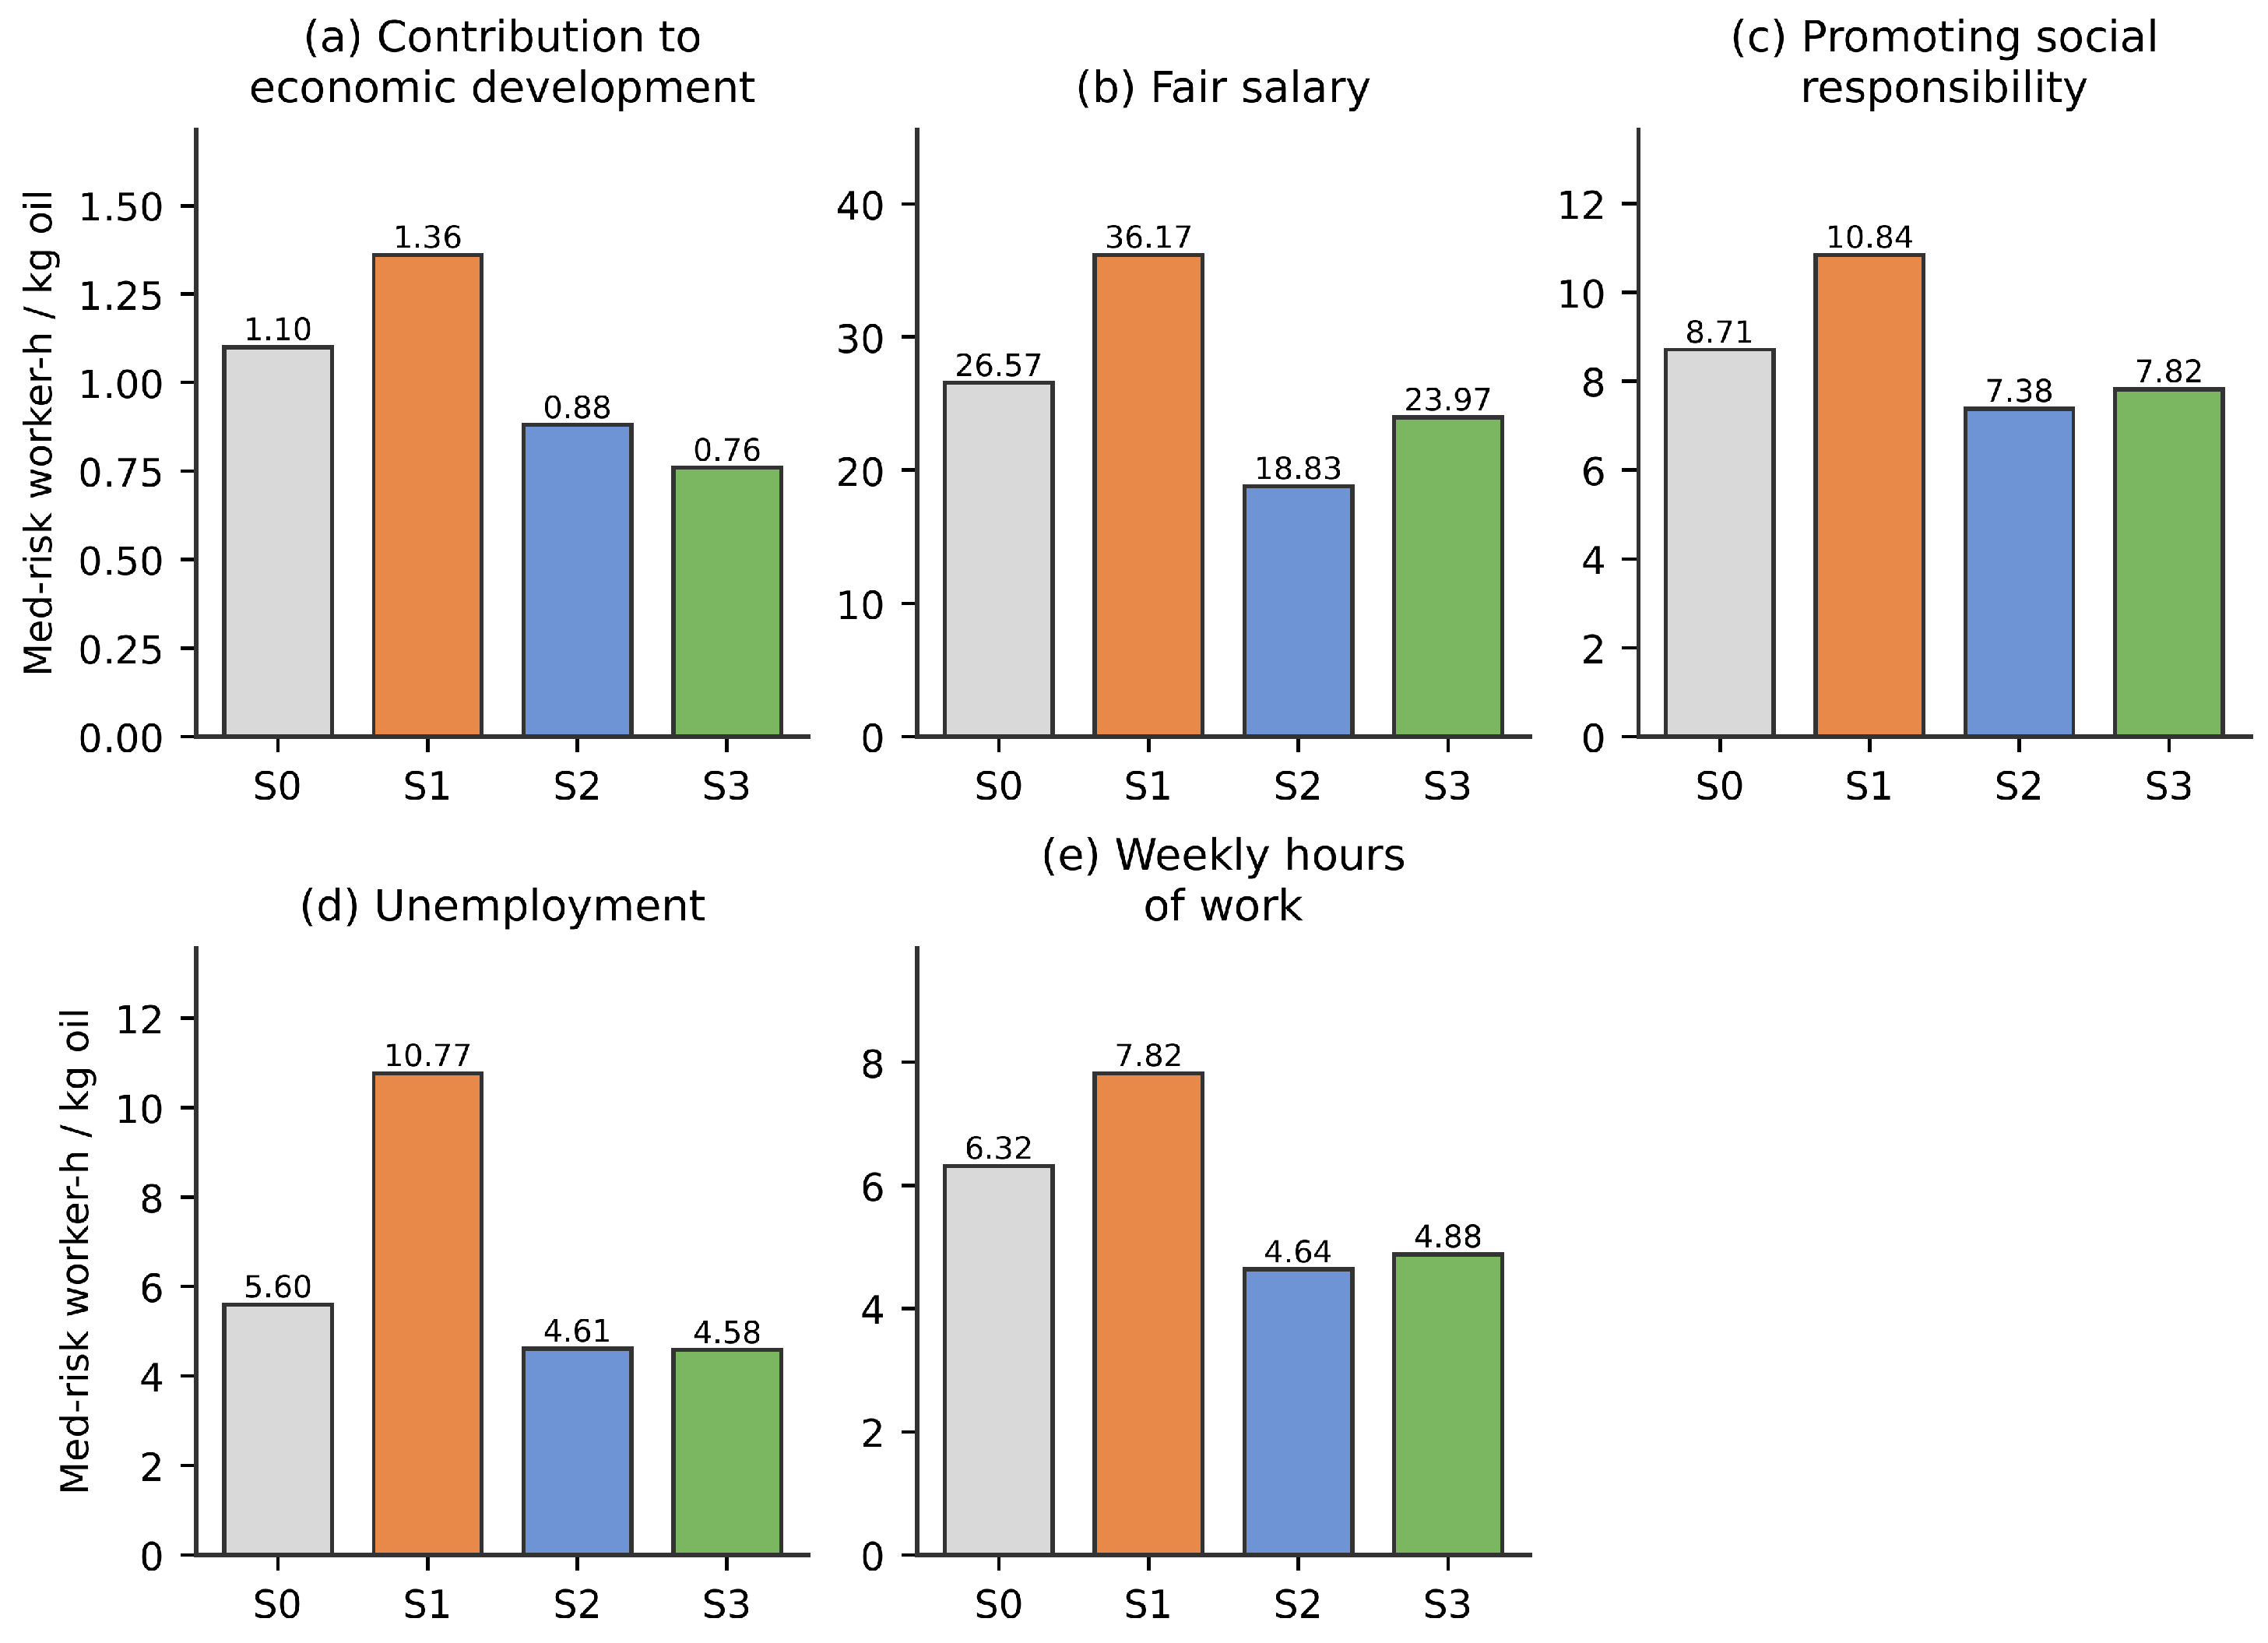
Figure 3.
Contribution of the foreground supply-chain stages (oil processing, avocado production, and transport of raw materials) to each social indicator for (a) the baseline (S0), (b) green chemistry (S1), (c) heat integration (S2), and (d) water integration (S3).
Figure 3.
Contribution of the foreground supply-chain stages (oil processing, avocado production, and transport of raw materials) to each social indicator for (a) the baseline (S0), (b) green chemistry (S1), (c) heat integration (S2), and (d) water integration (S3).
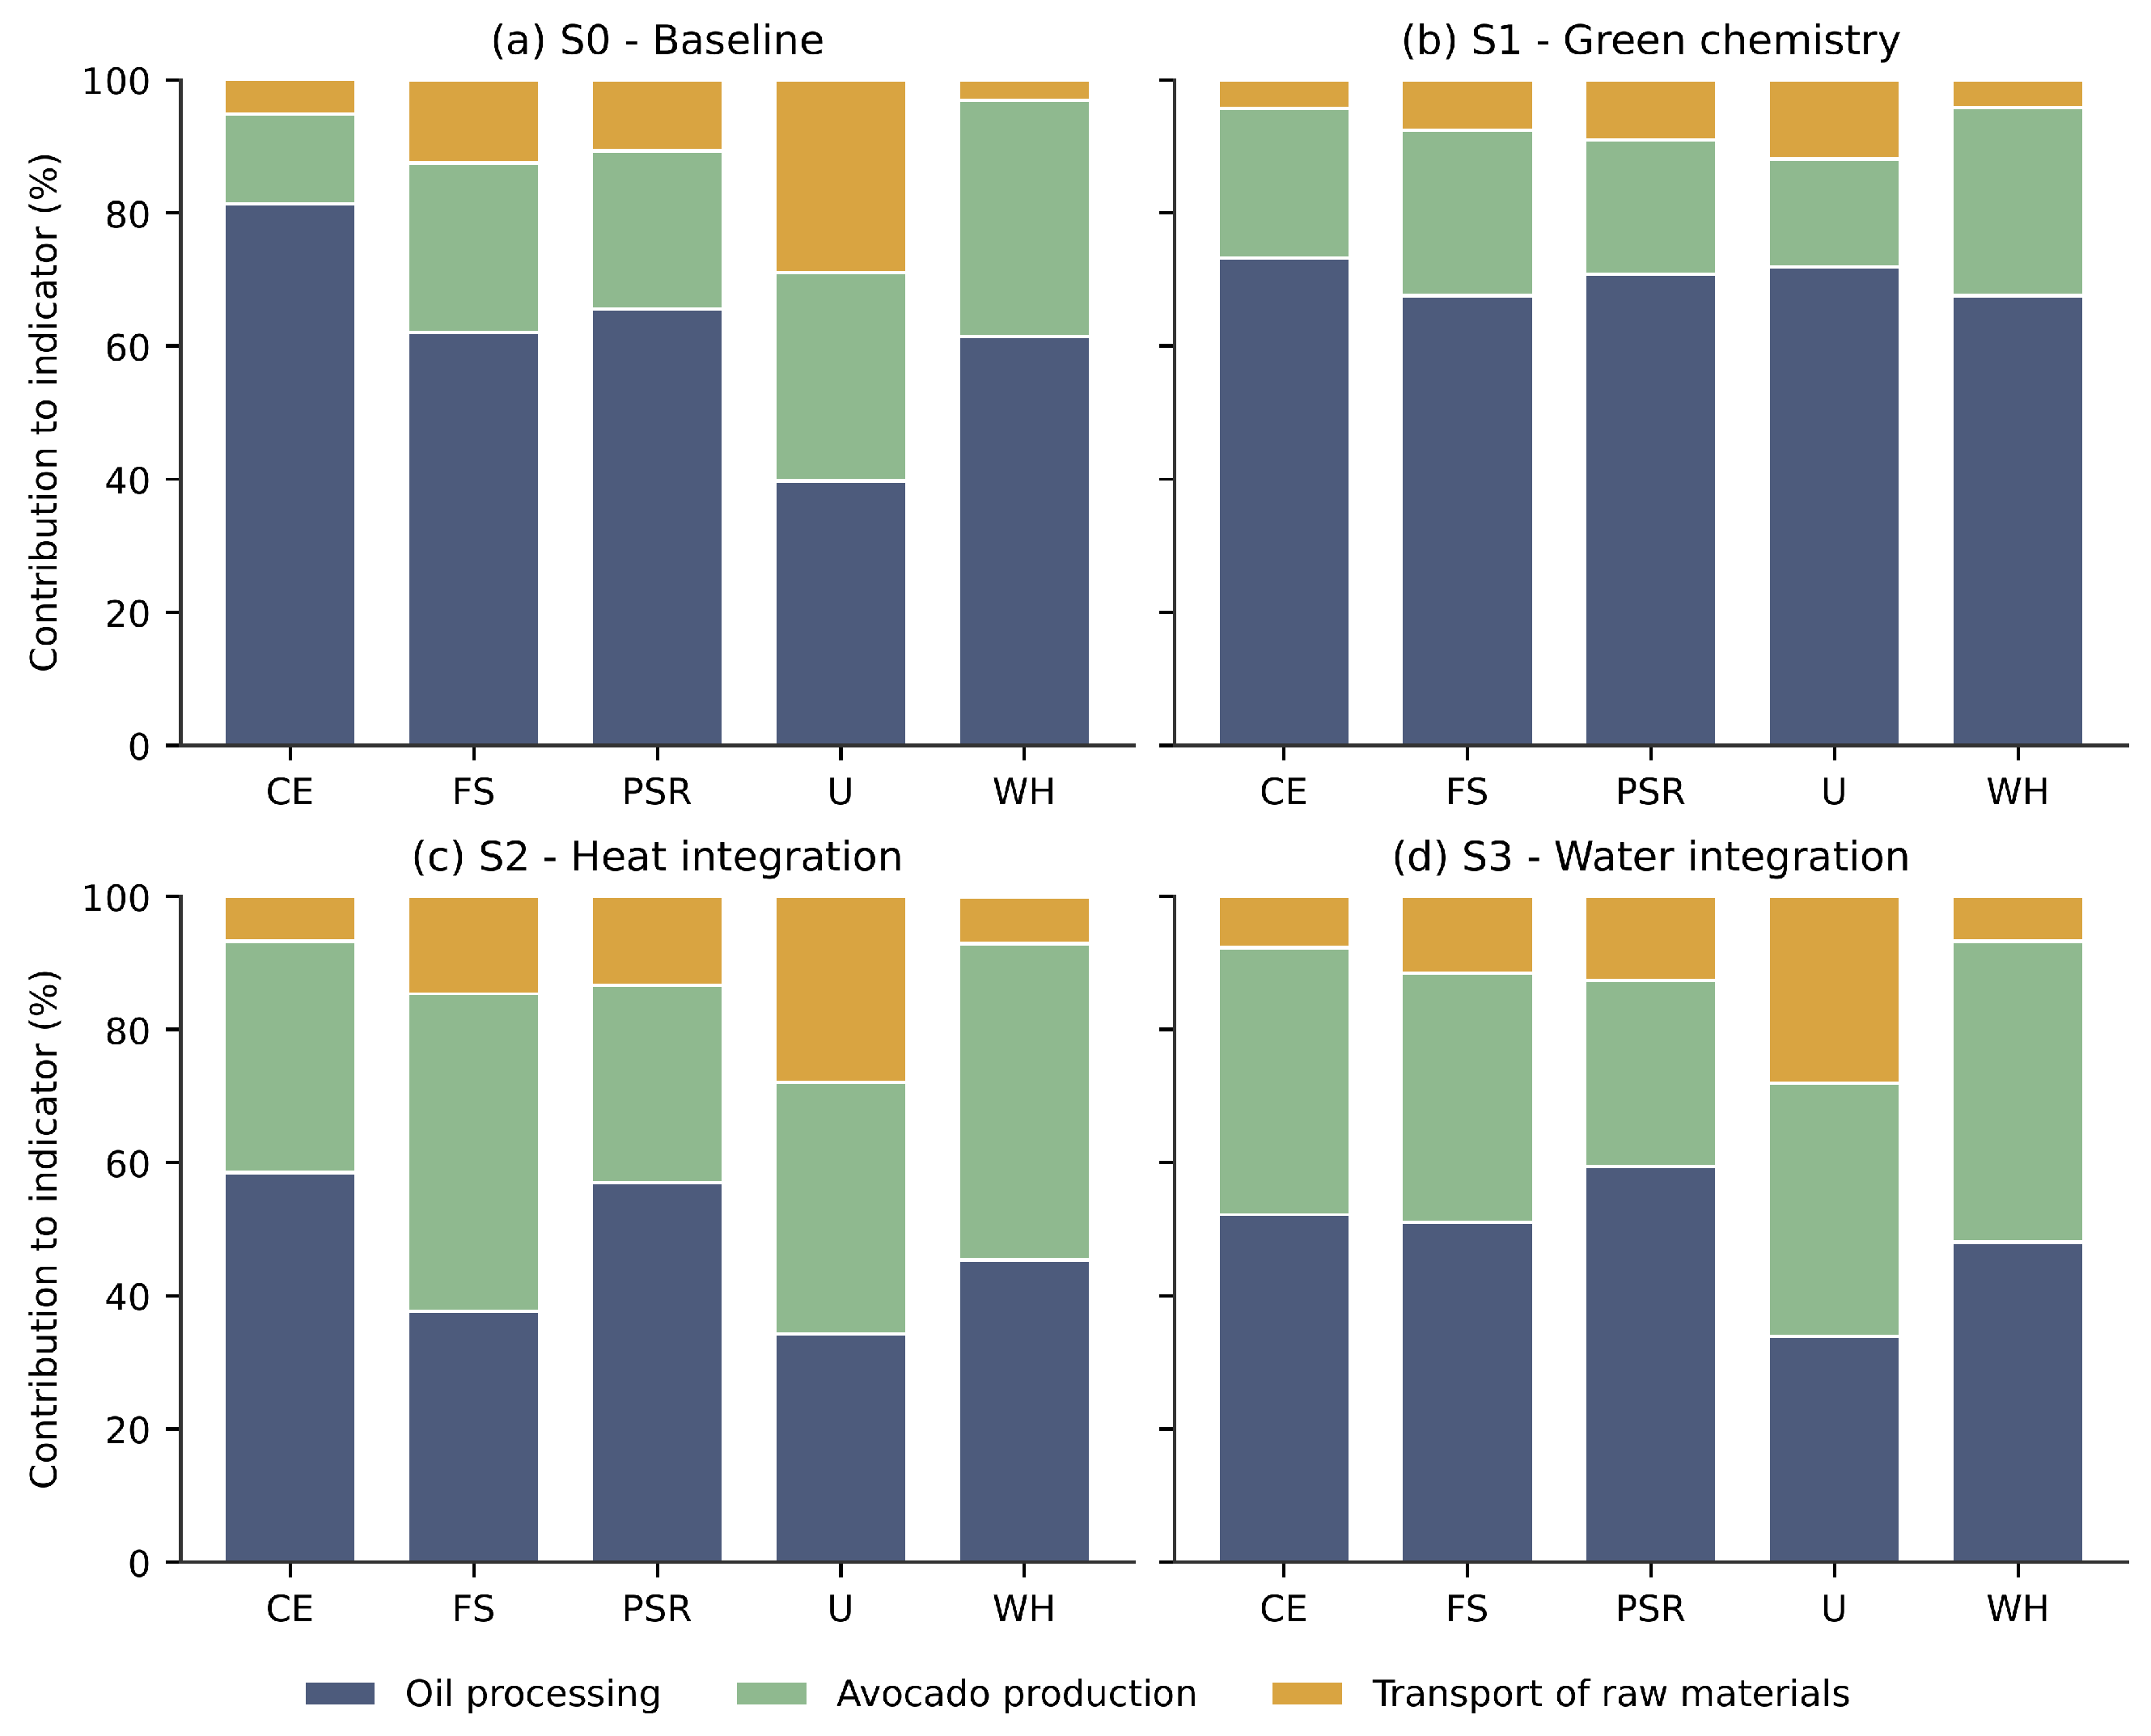
Figure 4.
Social burden shifting of the optimized scenarios relative to the baseline (percentage change vs S0). Positive values denote an increase in the indicator; for the risk indicators (FS, WH, U, PSR) an increase is unfavorable, whereas for the opportunity indicator (CE) it denotes a larger potential contribution to economic development. Green chemistry (S1) and water integration (S3) increase the indicators, whereas heat integration (S2) reduces them.
Figure 4.
Social burden shifting of the optimized scenarios relative to the baseline (percentage change vs S0). Positive values denote an increase in the indicator; for the risk indicators (FS, WH, U, PSR) an increase is unfavorable, whereas for the opportunity indicator (CE) it denotes a larger potential contribution to economic development. Green chemistry (S1) and water integration (S3) increase the indicators, whereas heat integration (S2) reduces them.
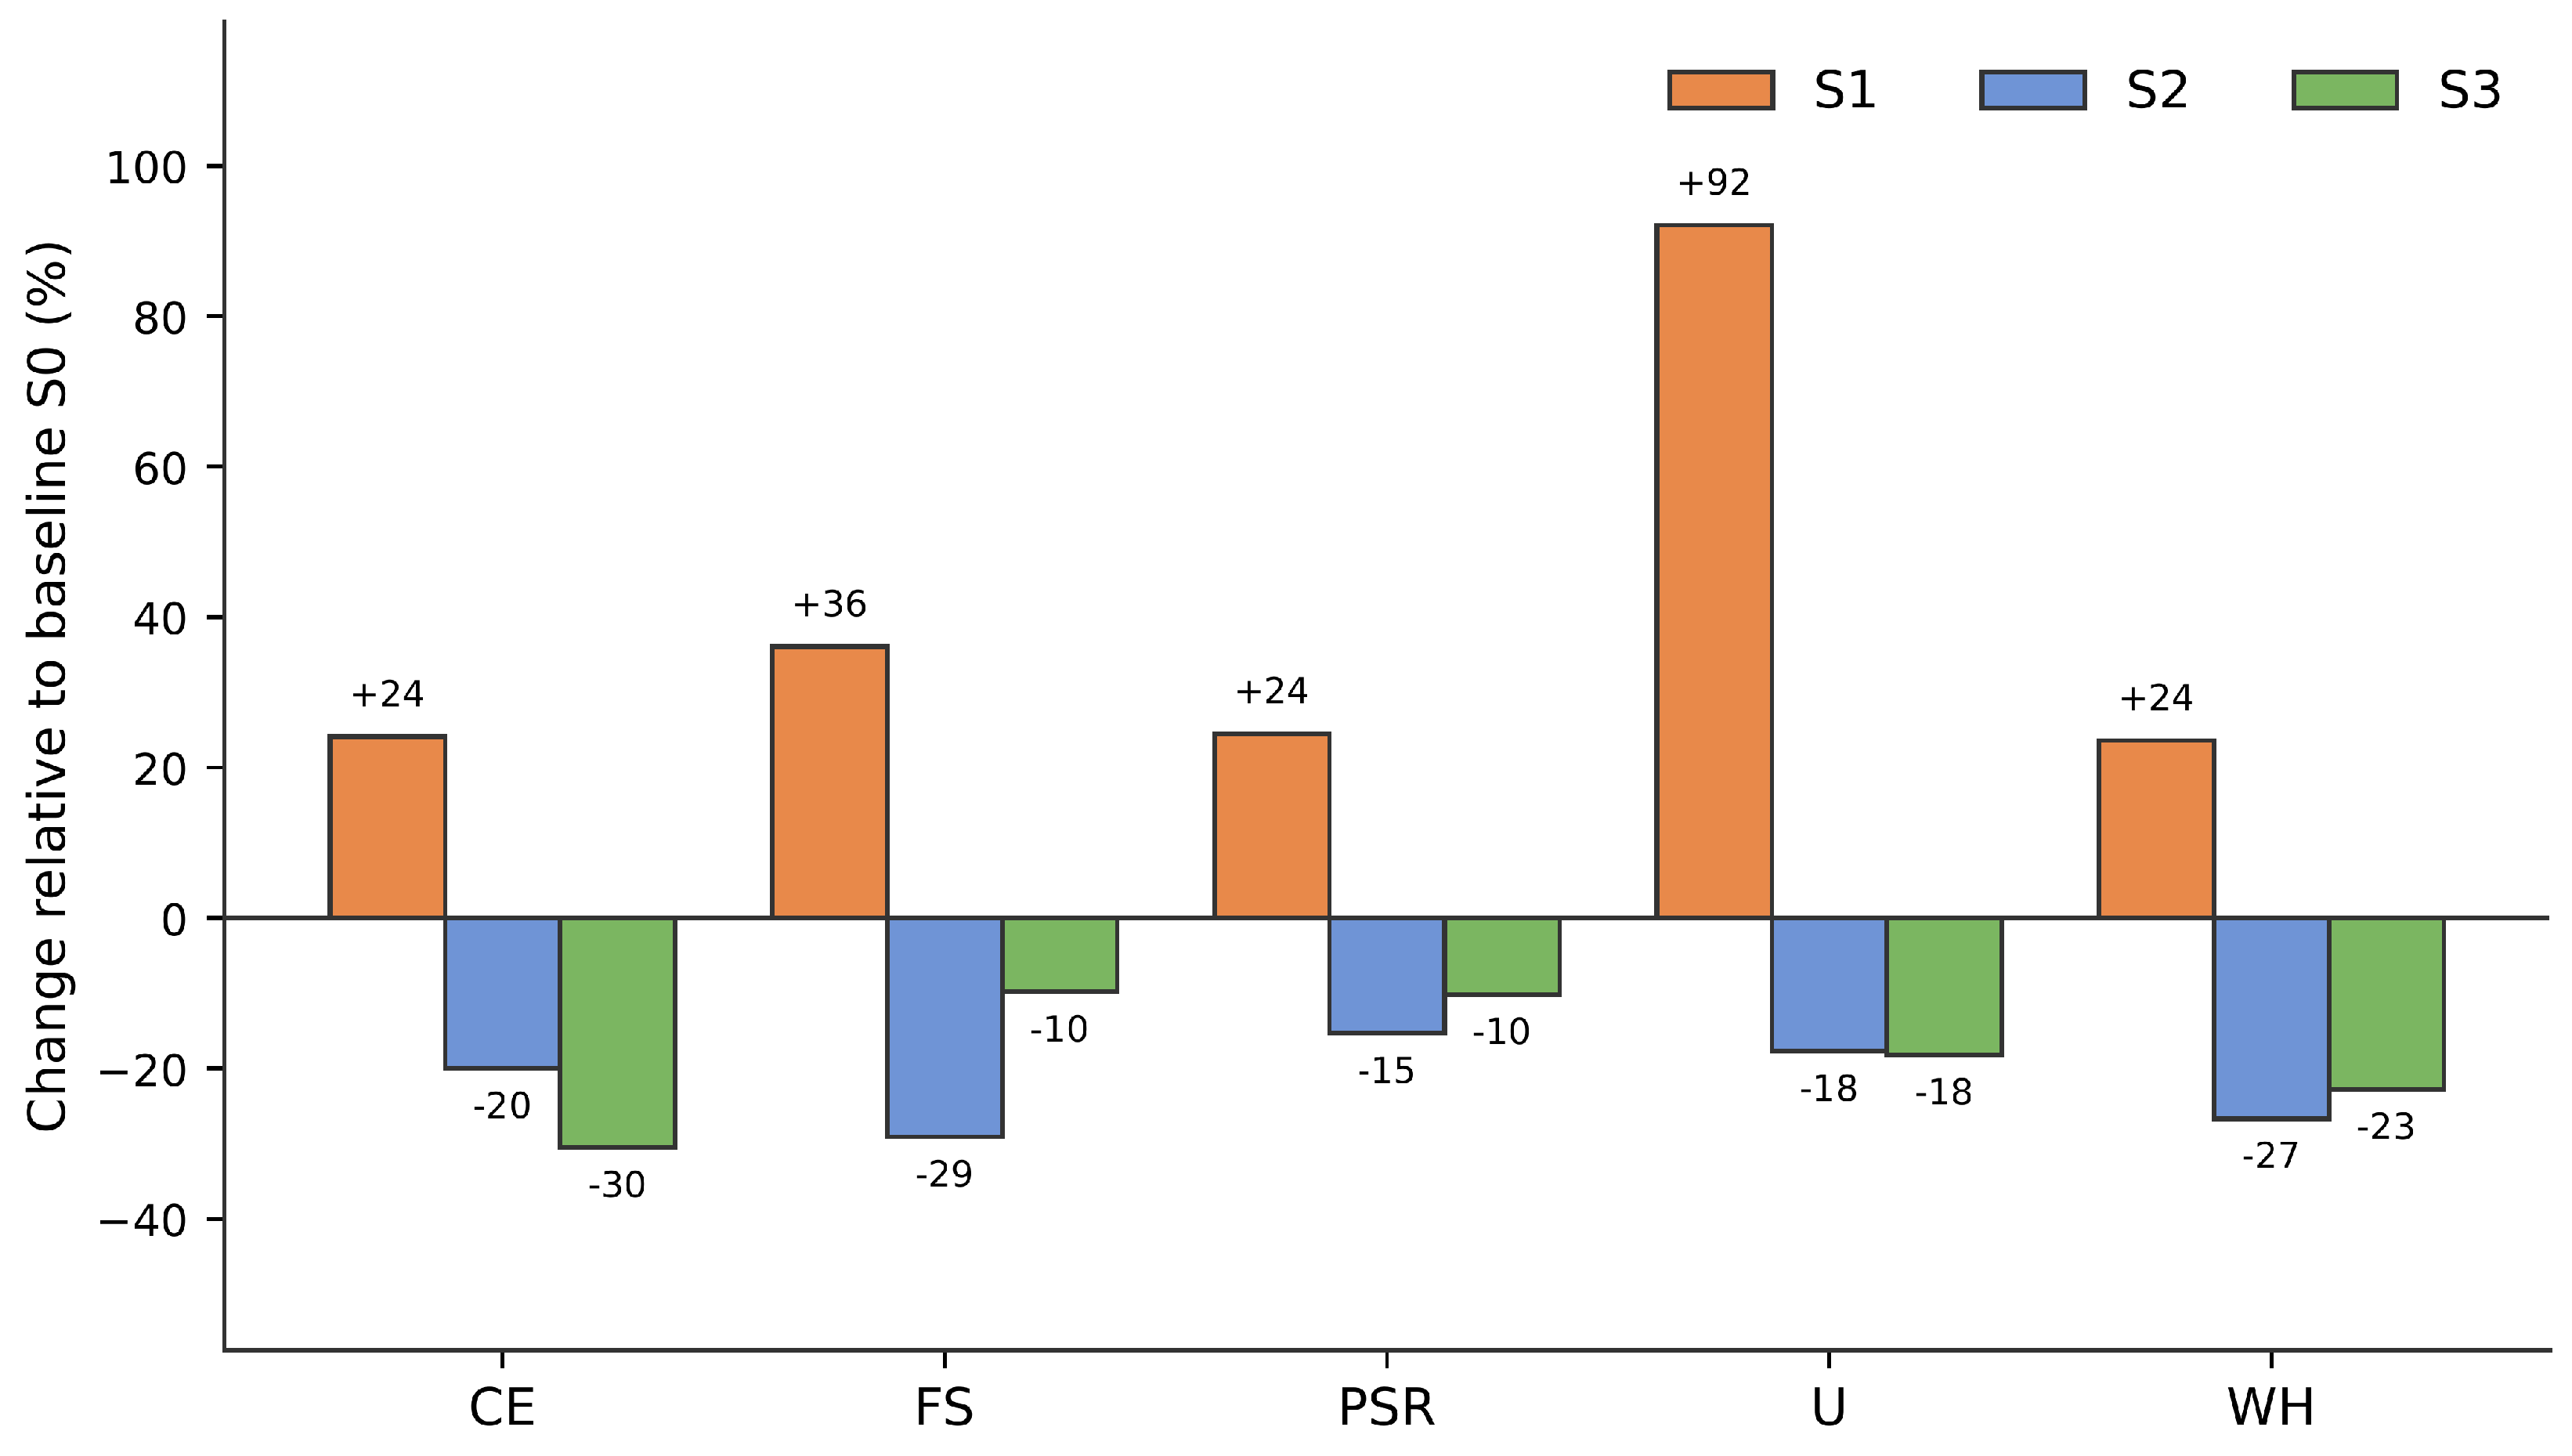
Figure 5.
Monte Carlo means (markers) and 5–95th percentile intervals (error bars) for (a) contribution to economic development; (b) fair salary; (c) promoting social responsibility; (d) unemployment; and (e) weekly hours of work across the four scenarios (1000 iterations). Green chemistry (S1) is the highest and is clearly separated from heat integration (S2); the baseline (S0), water integration (S3), and heat integration (S2) are closer and partly overlap for several indicators.
Figure 5.
Monte Carlo means (markers) and 5–95th percentile intervals (error bars) for (a) contribution to economic development; (b) fair salary; (c) promoting social responsibility; (d) unemployment; and (e) weekly hours of work across the four scenarios (1000 iterations). Green chemistry (S1) is the highest and is clearly separated from heat integration (S2); the baseline (S0), water integration (S3), and heat integration (S2) are closer and partly overlap for several indicators.
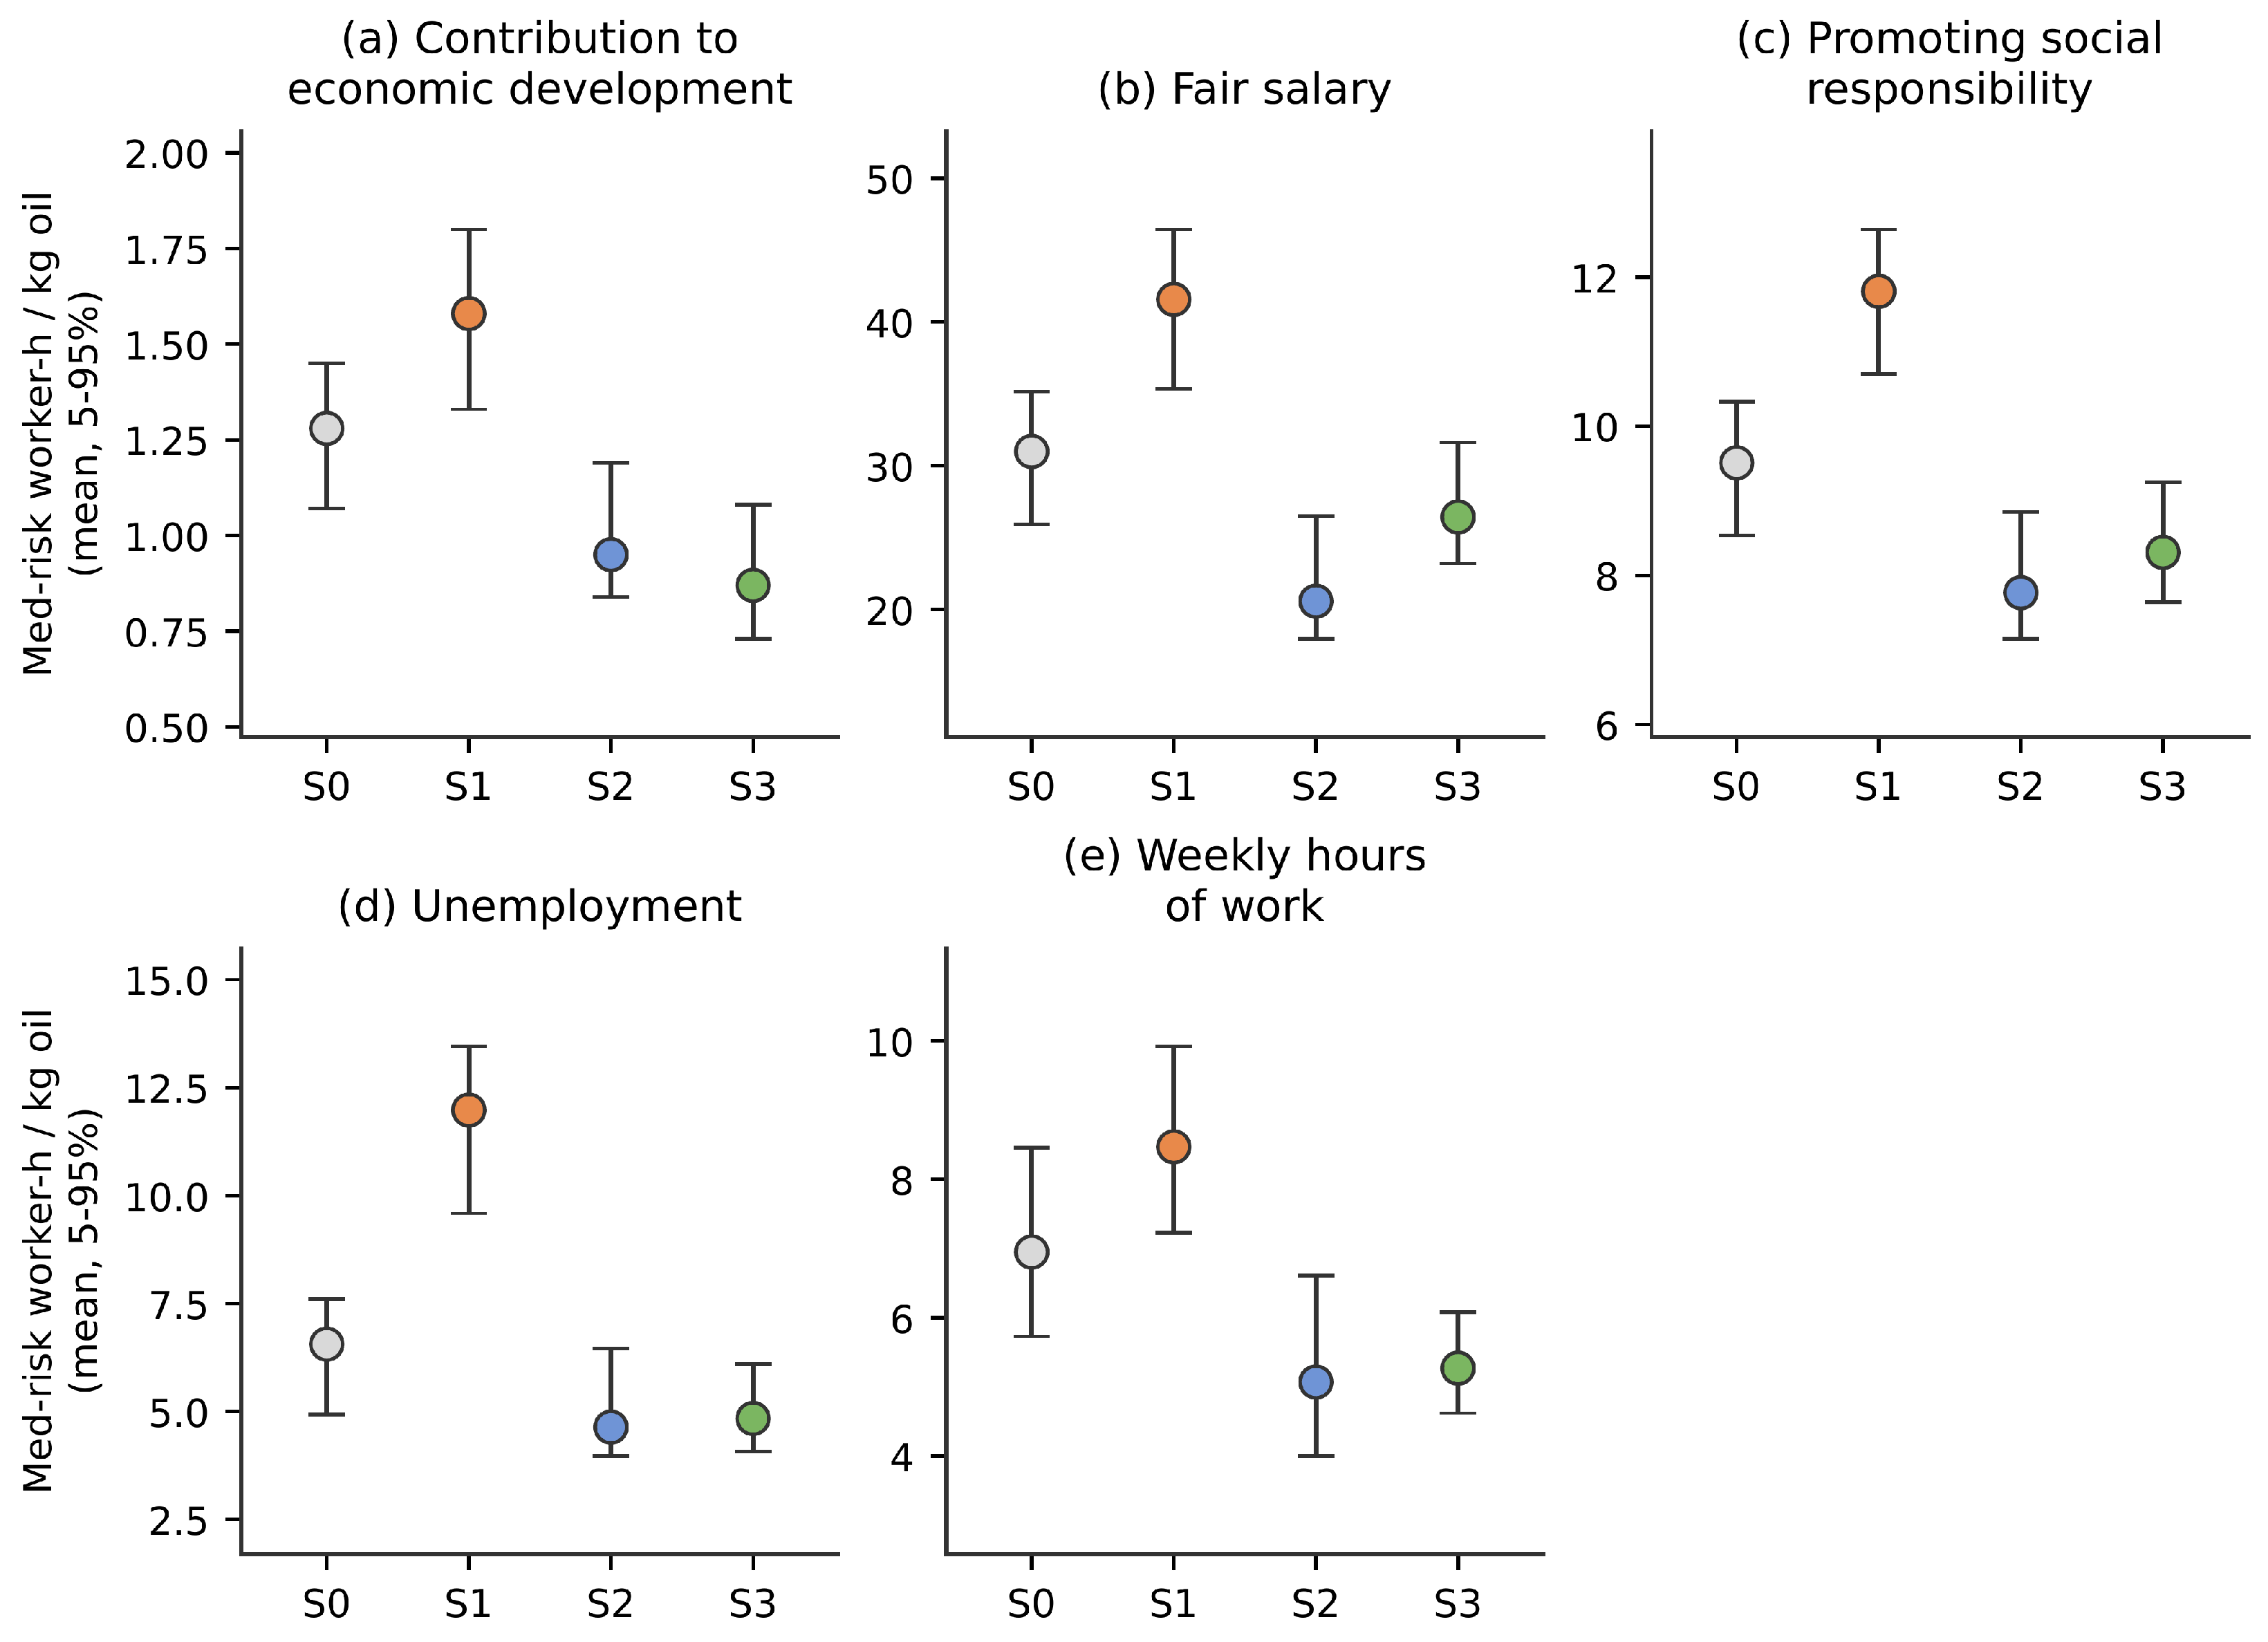
Table 1.
Scenario definitions and controlled comparison rules for the social assessment.
| Scenario | Optimization lever | Main process change | Controlled basis |
| S0 | Reference | Thermal-extractive avocado oil biorefinery (hexane extraction). | Same capacity, FU, boundary, allocation main case, and product portfolio. |
| S1 | Green chemistry | Hexane replaced with isopropanol (market proxy); fossil ethanol replaced with Colombian market ethanol. | No change in nominal capacity or product yields. |
| S2 | Heat integration | Pinch-based heat recovery and heat-exchanger-network synthesis reducing steam, gas, and cooling duties. | No change in nominal capacity or product yields. |
| S3 | Water integration | Water-reuse/recycling network reducing freshwater intake and wastewater (hexane retained as solvent). | No change in nominal capacity or product yields. |
Table 2.
Foreground life cycle inventory differentiating the scenarios (process basis, per hour; the reference product is 103.50 kg h−1 of avocado oil). Flows common to all scenarios are listed once.
Table 2.
Foreground life cycle inventory differentiating the scenarios (process basis, per hour; the reference product is 103.50 kg h−1 of avocado oil). Flows common to all scenarios are listed once.
| Flow | Unit | S0 | S1 | S2 | S3 |
| Avocado side streams (feedstock) | kg h−1 | 1097.49 | 1097.49 | 1097.50 | 1097.49 |
| Extraction solvent | kg h−1 | Hexane 32.00 | i-PrOH 32.00 | Hexane 32.00 | Hexane 32.00 |
| Ethanol (chlorophyll recovery) | kg h−1 | 32.16 | 32.16 a | 32.16 | 32.16 |
| Sodium hypochlorite | kg h−1 | 0.45 | 0.45 | 0.45 | 0.45 |
| Freshwater | kg h−1 | 2778.65 | 2778.65 | 2779.09 | 359.51 |
| Electricity | kW | 76.30 | 76.30 | 76.30 | 76.30 |
| Cooling water | kg h−1 | 9067.00 | 9067.00 | 3956.76 | 9067.00 |
| Refrigerant | kg h−1 | 67.83 | 67.83 | 23.17 | 67.83 |
| Steam | kg h−1 | 976.75 | 976.75 | 18.08 | 976.75 |
| Natural gas | MJ h−1 | 1012.00 | 1012.00 | 20.87 | 1012.00 |
| Nitrogen | kg h−1 | 9.72 | 9.72 | 9.72 | 9.72 |
| Transport of raw materials | — | Included as farms-to-city freight (common to all scenarios) | |||
| Wastewater | kg h−1 | 3374.57 | 3374.57 | 2704.78 | 284.91 |
a Same quantity; in S1 the fossil ethanol background dataset is replaced with the Colombian market (corn-stover) ethanol. i-PrOH: isopropanol.
Table 3.
Social impact results for the baseline and optimized avocado oil biorefinery configurations under subdivision allocation, in medium-risk worker-hour equivalents per 1 kg of avocado oil (openLCA SIWM assessment).
Table 3.
Social impact results for the baseline and optimized avocado oil biorefinery configurations under subdivision allocation, in medium-risk worker-hour equivalents per 1 kg of avocado oil (openLCA SIWM assessment).
| Indicator | Unit | S0 | S1 | S2 | S3 |
| Contribution to economic development (CE) | med-risk h | 1.10 | 1.36 | 0.88 | 0.76 |
| Fair salary (FS) | med-risk h | 26.57 | 36.17 | 18.83 | 23.97 |
| Promoting social responsibility (PSR) | med-risk h | 8.71 | 10.84 | 7.38 | 7.82 |
| Unemployment (U) | med-risk h | 5.60 | 10.77 | 4.61 | 4.58 |
| Weekly hours of work (WH) | med-risk h | 6.32 | 7.82 | 4.64 | 4.88 |
Table 4.
Social burden shifting of the optimized scenarios relative to the baseline (% change vs S0; positive = increase, negative = reduction).
Table 4.
Social burden shifting of the optimized scenarios relative to the baseline (% change vs S0; positive = increase, negative = reduction).
| Indicator | S1 | S2 | S3 |
| Contribution to economic development (CE) | +24.1 | -20.0 | -30.5 |
| Fair salary (FS) | +36.1 | -29.1 | -9.8 |
| Promoting social responsibility (PSR) | +24.5 | -15.3 | -10.2 |
| Unemployment (U) | +92.1 | -17.7 | -18.2 |
| Weekly hours of work (WH) | +23.6 | -26.7 | -22.8 |
Table 5.
Comparison of the present work with previous social life cycle assessments of biorefineries and bio-based systems.
Table 5.
Comparison of the present work with previous social life cycle assessments of biorefineries and bio-based systems.
| Study | System / feedstock | S-LCA approach | Main social focus / finding |
| This study | Avocado oil biorefinery; baseline + 3 optimization levers | SIWM with SOCA/PSILCA in openLCA; worker-hours; cradle-to-gate | Green chemistry raises social risk (+24–92%); heat integration and water integration lower it (-15–29% and -10–31%); explicit burden shifting |
| Meramo et al. [24] | Thermal-extractive avocado oil biorefinery (baseline) | SOCA/PSILCA in openLCA; worker-hours | Baseline social profile; worker- and upstream-related indicators as main hotspots |
| Solarte-Toro et al. [23] | Small-scale rural avocado biorefineries (Colombia) | Environmental LCA combined with social impact assessment | Rural employment and community effects of small-scale valorization |
| Cadena et al. [33] | Biorefinery production-process design | S-LCA for process-design evaluation | Social performance discriminates between alternative process designs |
| Souza et al. [34] | First- vs second-generation ethanol (Brazil) | Comparative S-LCA of technologies | Technology generation changes the social outcome |
| Souza et al. [32] | Sugarcane biorefineries (Brazil) | Worker human-development S-LCA method | Worker-centered human-development effects |
| Pérez-López et al. [31] | Microalgae biorefineries | Screening S-LCA coupled with LCC; PSILCA v2.0/openLCA | Workers and Local Communities prioritized; upstream chemicals and geography drive risk |
Disclaimer/Publisher’s Note: The statements, opinions and data contained in all publications are solely those of the individual author(s) and contributor(s) and not of MDPI and/or the editor(s). MDPI and/or the editor(s) disclaim responsibility for any injury to people or property resulting from any ideas, methods, instructions or products referred to in the content. |
© 2026 by the authors. Licensee MDPI, Basel, Switzerland. This article is an open access article distributed under the terms and conditions of the Creative Commons Attribution (CC BY) license.
Copyright: This open access article is published under a Creative Commons CC BY 4.0 license, which permit the free download, distribution, and reuse, provided that the author and preprint are cited in any reuse.


