
Submitted:
28 July 2026
Posted:
30 July 2026
You are already at the latest version
Abstract
Measurement of Mycobacterium avium subsp. paratuberculosis (MAP) load within macrophages using a mycobacterial growth inhibition assay (MGIA) is an accurate indicator of host immune control of MAP infection. Real-time fluorescent microscopy allows the continuous analysis of infected cells and the quantification of fluorescence intensity, which directly correlates with concentration of fluorescent bacteria. However, this method has not yet been evaluated for real-time quantification of free MAP bacilli or MAP-infected macrophages. The objective of this study was to develop an assay based on automated and real-time live-cell imaging (IncuCyte®) for quantifying green fluorescence protein (GFP)-expressing MAP and to monitor MAP growth within infected macrophages. The fluorescence of serially diluted free MAP–GFP bacilli was quantified using the IncuCyte® demonstrating that the fluorescence signal of 3 × 10⁷ CFU was significantly different from lowest MAP concentrations. Significant differences between uninfected and infected BOMAC cells (MOI; 1:10) in DMEM-F12, DMEM-F12 supplemented with fetal bovine serum (FBS), and RPMI-1640 supplemented with FBS were observed, indicating the suitability of these culture media for measuring MAP-GFP-host cell interaction in the IncuCyte®. For the optimization of the MOI and cell density; bovine monocyte-derived macrophages (MDMs) and the BOMAC cells were seeded at different cell densities, infected with MAP-GFP at different MOIs, and after 2 h p.i. the fluorescence was quantified in the IncuCyte® at different times p.i. Our results demonstrated that MAP phagocytosis is pathogen number and cell density dependent. Overall, the results showed that infection of 1 × 10⁶ cells at an MOI of 1:10 maintained a stable fluorescence signal of approximately 400 to 500 GCU⋅μm2/image" across 2 h to 4 days p.i.. In addition, good correlations between MAP-GFP (logCFUs) estimated in the BACTEC MGIT™ 960 system and fluorescence intensity measured in the IncuCyte® were observed for free MAP-GFP bacilli and from MAP-GFP within infected BOMAC cells; r2 = 0.79 and r2 = 0.78, respectively. In conclusion, real-time fluorescent microscopy is a reliable method for quantifying fluorescent MAP and enables continuous monitoring of bacterial load within infected macrophages.
Keywords:
Mycobacterium avium subsp. paratuberculosis
; real-time fluorescent microscopy
; mycobacterial growth inhibition assay (MGIA)
1. Introduction
Bovine paratuberculosis (PTB) or Johne´s disease is a chronic enteritis that affects domestic and wild ruminants and is caused by Mycobacterium avium subsp. paratuberculosis (MAP) infection. PTB is a major problem for animal health that compromises animal welfare and causes important economic losses to the dairy industry (Rasmussen et al., 2021, 2024). PTB is an endemic disease in dairy cattle in Europe and North America, with herd prevalence estimates higher than 50 % (Nielsen & Toft, 2009). Animals are usually infected early in life through the fecal-oral route, but clinical signs including diarrhea and losses in milk production tend to appear when animals are 18 months or older. Once ingested, MAP reaches the ileum and crosses the intestinal mucosa through enterocytes or by binding to fibronectin β1 receptors present on M cells located in Peyer's patches (Alonso-Hearn et al., 2009; Momotani et al., 1988; Sweeney, 2011). In the submucosa, MAP is phagocytized by sub-epithelial macrophages. MAP has developed several survival mechanisms that allow it to survive inside macrophages, such as preventing the maturation and acidification of the phagosome and its fusion with the lysosome or preventing the presentation of antigens to the immune system (Bermudez et al., 2010). PTB is a multifactorial disease, whose outcomes are the result of the interaction between genetic, environmental, and microbial factors.
A major challenge to PTB vaccine development is the lack of a validated immune correlate of protection. Measurement of MAP load within macrophages using a mycobacterial growth inhibition assay (MGIA) is an accurate indicator of host immune control of MAP infection in vitro. MGIAs can be used to compare the virulence of different MAP strains, to understand the role of specific genetic mutations or candidate genes in macrophage function, and to evaluate de efficacy of vaccines or therapeutics by providing a relevant measured of immunogenicity and protection (Abendaño et al., 2012; Badia-Bringué et al., 2023; Canive et al., 2022; Juste et al., 2016). MGIAs represent an alternative to single markers based on predefined immune parameters. Instead MGIAs offer a functional measure of the ability of post-vaccination whole blood or cell samples to control MAP growth ex vivo. MAP survival index can be calculated by infecting bovine macrophages with MAP in vitro and by measuring MAP load at 2 hours and 7 days post infection (p.i.) in the BACTEC MGIT™ 960 automatic liquid culture system (Abendaño et al., 2012). Although the BACTEC MGIT™ 960 system has several advantages over traditional colony counting, this method is expensive and requires at least 42 days of incubation to detect positive samples. Novel imaging platforms allow for the real-time monitoring of macrophages and the study of cellular and bacterial dynamics in real-time. By capturing and analyzing live cells directly and by collecting both phase contrast and fluorescence images in a high throughput format, live-cells imaging platforms reduce the risk of variations introduced by other methods. For instance, the IncuCyte® system is an advanced, automated imaging platform used for real-time analysis of live cells and microorganisms. When applied to fluorescent microorganisms, the IncuCyte® provides a non-invasive method to quantify fluorescence intensity, which correlates directly with microorganism concentration. Additionally, it allows for the monitoring of intracellular bacteria concentration within infected cells over time without the need of a lysis step or the use of additional steps for bacteria quantification. By analyzing the total integrated fluorescence intensity, the InCucyte® offers a precise, reproducible means of quantifying fluorescent bacteria, making it a powerful tool for drug and vaccine testing. Furthermore, the IncuCyte® system allows for the measurement of several 24 or 96 well plates simultaneously which makes it an invaluable tool for high-throughput studies. The use of the IncuCyte® system has been tested for the quantification of Mycobacterium tuberculosis (Andersson et al., 2020) or for the evaluation of antimycobacterial drugs (Kalsum et al., 2021). Additionally, a recent publication by Blay-Benach et al. suggested that this system could also be used to evaluate in vitro macrophage phagocytosis of Mycobacterium fortuitum by caprine alveolar macrophages (Blay-Benach et al., 2026). However, this method has not yet been evaluated for real-time quantification of free MAP bacilli or MAP-infected macrophages. The objective of the current study was, therefore, to develop a real-time method for quantifying MAP-GFP within infected macrophages which could serve as an estimate of the host ability to control MAP infection. Optimization of several parameters including multiplicity of infection (MOI), cell number, cell culture medium, and time pois-infection (p.i.) was conducted. To our knowledge, this is the first study to propose the use of a real-time fluorescent platform to quantify MAP and evaluate macrophage performance.
2. Materials and Methods
2.1. Ethic Statement
The study is reported in accordance with ARRIVE guidelines (https://arriveguidelines.org). Blood samples were collected by trained personnel and in accordance with good veterinary practices and following the European Guidelines for the Care and Use of Animals for Research Purposes (2012/63/EU). Because the study includes blood extraction, classified as mild, ethical approval for this study was not required by national laws (Article 31 of Royal Decree 53/2013) and was granted exemption from the Ethics Committee of Animal Experimentation of NEIKER. Furthermore, the cattle included in this study were not submitted to any in vivo experimentation; therefore, no specific ethic authorization was needed.
2.2. Bacterial Strains and Cell Line
The K10 strain of MAP, a sequenced and laboratory-adapted isolate recovered from a clinical case of PTB, was obtained from the American Type Culture Collection (ATCC, Manassas, VA). The MAP K10 strain expressing GFP (MAP-GFP) was kindly provided from Dr. Barletta (University of Nebraska, US). The BOMAC cell line, an SV-40 transformed bovine peritoneal macrophage cell line, was kindly provided from Dr. Stabel (USDA, Ames, IA, US) and maintained in RPMI-1640 medium with 20 mM L-glutamine (Corning, NY, USA) supplemented with 10% heat-inactivated bovine serum (FBS) (Corning, NY, USA) and 1% Penicillin/Streptomycin (Corning, NY, USA) as previously described (Stabel & Stabel, 1995).
2.3. Bacterial Culture and Preparation of Bacterial Suspensions
MAP K10 and MAP-GFP strains were grown in T25 tissue culture flasks at 37 ± 1◦C in 10 ml of Middlebrook 7H9 broth (Difco Laboratories, Detroit, MI) supplemented with 10% (v/v) oleic acid-albumin-dextrose-catalase (Becton, Dickinson and Company, Franklin Lakes, NJ), 0.05% (v/v) Tween-80 (Sigma-Aldrich, St Louis, MO) and 2 mg l−1 of Mycobactin J (Allied Monitor Inc., Fayette, MO) for 3 weeks at 37 ◦C ± 1°C. Kanamycin (Sigma-Aldrich, St. Louis, MO, USA) was added to the media at 50 μg/ml for growing the MAP-GFP strain as previously described (Harris et al., 2002). Bacterial cells were harvested by centrifugation at 2000 × g for 20 min in a Beckman Coulter Allegra X-12 centrifuge. Bacterial pellets were washed three times with sterile Hank’s balanced salt solution (HBSS), resuspended in 2 ml of HBSS, and the resultant suspension was passed 20 times through a 27-gauge needle, and large aggregates were allowed to settle. After 5 min, an aliquot was taken from the top half of the bacterial suspension and diluted in HBSS to a McFarland standard of 1 (3 × 10⁸ CFUs/ml) with a Densimat (bioMerieux, Marcy l’Étoile, France).
2.4. Preparation of MAP-GFP Dilutions and IncuCyte® Fluorescence Quantification
Serial 10-fold dilutions of a suspensions of MAP-GFP bacilli (McFarland standard of 1) were prepared in HBSS with vortexing between dilution steps. Then, 100 μl of each dilution (3 × 10⁷, 3 × 10⁶, 3 × 10⁵, 3 × 10⁴, 3 × 10³, 3 × 10² CFUs) were added to a 24-well plate and fluorescence was recorded in the IncuCyte® SX1 (Sartorius, Göttingen, Germany), housed inside an incubator at 37ºC with 5% CO2. Twenty-five images per well from three replicates were taken and analyzed using the adherent cell-by-cell module of the IncuCyte® Basic Software. Green channel acquisition time was 300 ms, and phase contrast was left as default. Green channel background noise was subtracted with the Top-Hat method of background non-uniformity correction with a radius of 10 μm, a threshold of 1 green calibrated unit (GCU), and an edge sensitivity of -30. The mean count of fluorescent units per image was used as a measure of fluorescence quantification.
2.5. Bovine Monocyte-Derived Macrophages (MDMs)
MDMs were prepared as previously described (Badia-Bringué et al., 2023). Briefly, fifteen milliliters of peripheral blood were drawn from the tail vein of three adult healthy Holstein cows from the same farm in Alava (Basque Country, Spain) into heparinized Vacutainer tubes (Becton, Dickinson and Company, Sparks, MD, USA) and diluted 1:2 in Hanks balanced salt solution (HBSS). Leucosep tubes were filled with 15 ml of Ficoll-Paque (1.084 g/cm3) (GE Healthcare, Uppsala, Sweden) and centrifuged at 1,000 rpm for 30 seconds at room temperature. Subsequently, the diluted blood was overlaid on the top of the Ficoll-Paque and centrifuged at 800 g for 15 minutes at room temperature. The plasma layer was removed and the cell interphase containing peripheral blood mononuclear cells (PBMCs) was collected and transferred to a clean tube. PBMCs were washed twice in HBSS and centrifuged at 400 g for 10 minutes to remove platelets. Supernatants were aspirated and the purified PBMCs were resuspended in RPMI-1640 supplemented with 20 mM Lglutamine, 10% heat-inactivated bovine serum (Lonza, Spain), 100 U ml-1 penicillin G, and 100 mg ml-1 streptomycin sulfate (Lonza, Spain). PBMCs were cultured by triplicate at a concentration of 1 x 10⁶ cells/ml into 24-well flat clear bottom tissue-culture treated plates and incubated at 37°C in a humidified 5% CO2 incubator at 37 ºC for 2 h. Non-adherent cells were removed by washing, and adherent cells were incubated in fresh medium for 7 days at 37 ºC to allow differentiation to MDMs.
2.6. Optimization of Culture Media for IncuCyte® Live-Cell Imaging of MAP Within BOMAC Cells
BOMAC cells were seeded at a concentration of 106 cells/ml into 24-well plates and infected with a single-cell suspension of MAP-GFP at MOI of 1:10. After 2h, the supernatant was removed, and uninfected and MAP-GFP-infected BOMAC cells were washed with HBSS. Phosphate-buffered saline (PBS), fetal bovire serum (FBS) (Cytiva, Marlborough, MA, USA), RPMI-1640 (Corning, Waltham, MA, USA), RPMI-1640 supplemented with 10 % FBS, RPMI-1640 without phenol red (w/o PR), RPMI-1640 w/o PR supplemented with 10 % FBS, DMEM/F12 (Cytiva, Marlborough, MA, USA), and DMEM/F12 supplemented with 10 % FBS were added to MAP-GFP-infected and uninfected cells. The plates were transferred into the IncuCyte® system which was housed inside an incubator at 37 ºC. Fluorescence was subsequently quantified as described above, with total integrated intensity () serving as a measure of intracellular MAP load.
2.7. Optimization of MOI for IncuCyte® Live-Cell Imaging of MAP-GFP-Infected BOMAC Cells and MDMs
BOMAC cells and MDMs were seeded by triplicate at a concentration of 106 cells/ml into 24-well plates and incubated at 37ºC in an incubator with 5% CO2. The following day, the BOMAC cells were infected with MAP-GFP at various MOI (1:10, 1:1, 1:0.1, 1:0.01, 1.0.001, 1:0.0001, 1:0.00001). Bovine MDMs were infected at MOIs of 1:100, 1.50, 1:10, 1:5, 1:0.1, and 1:005. After 2h, the supernatant was removed, the cells were washed with HBSS and the fluorescence was read in the IncuCyte® system as described above. Total integrated intensity of green objects per image () was used as a measure of intracellular MAP concentration.
2.8. Optimization of Cell Concentration and Time Course Quantification of MAP-GFP Fluorescence Within Infected BOMAC Cells
BOMAC cells were seeded in triplicate in 24-well plates at a concentration of 106, 105 and 5 × 10 4 cells/ml into 24-well plates and were infected with MAP-GFP at MOI of 1:10 and 1:100. At 2h post infection, the supernatant was removed, the cells were washed with HBSS and fresh RPMI-1640 supplemented with 10 % FBS was added to the cells. Then, the plate was placed in the IncuCyte® and incubated at 37 ºC with 5 % CO2. Fluorescence signal was measured at 2 h p.i. and every day for 7 days in the IncuCyte® as described above and expressed as total integrated intensity of green objects per image ().
2.9. A comparative Analysis of the IncuCyte® Platform and BACTEC MGIT™ 960 Liquid Culture System for MAP Quantification
Serial 10-fold dilutions of a suspensions of MAP-GFP bacilli (McFarland standard of 1) were prepared in HBSS with vortexing between dilution steps. Then, 100 μl of each dilution were added to a 24-well plate (3 × 10⁷, 3 × 10⁶, 3 × 10⁵, 3 × 10⁴, 3 × 10³, 3 × 10² CFUs) in triplicate and fluorescence was recorded in the IncuCyte® (Sartorius, Göttingen, Germany). In addition, 100 μl of each dilution were quantified in the BACTEC MGIT™ 960 system as previously described (Abendaño et al., 2012, 2013). BOMAC cells were seeded in triplicate at a concentration of 106 cells/ml into 24-well plates. The following day, the cells were infected with MAP-GFP at several MOIs (1:100, 1:50, 1:10, 1:5, 1:1, 1: 0.1, 1:1, and 1: 0.05). At 2 h post infection, the supernatant was removed, the cells were washed with HBSS and fresh RPMI-1640 supplemented with 10% FBS was added. One of the plates was placed inside the IncuCyte® and the fluorescence was recorded as total integrated intensity. The duplicate plate was lysed at 2 h p.i. by vigorous pipetting with 0.5 ml of 0.1% Triton X-100 (Sigma-Aldrich, St. Louis, MO, USA) in sterile water for 5 min. Supplemented Mycobacteria Growth Indicator tubes (MGIT) (Becton, Dickinson, and Company, Sparks, MD) were inoculated 0.5 ml of the cell lysates and the tubes were incubated at 37 ºC ± 2°C for up to 42 days in a BACTEC MGIT™ 960 instrument (Becton, Dickinson, and Company). The earliest instrumental indicator of positivity (time to detection, TTD) for each tube was recorded. The predicted number of bacteria in each positive tube was calculated using standard curves that relate TTD (in days) to the estimated log CFUs as previously described (Abendaño et al., 2012; Alonso-Hearn et al., 2019). Briefly, a ten-fold dilution series of a MAP K10 strain cellular suspension (McFarland = 1) were prepared and the TTDs of 100 µl of each dilution in the BACTEC MGIT™ 960 system were recorded. MAP load (log CFUs) was plotted versus TTDs (in days) and the mathematical equation was used to determine the estimated log CFUs for each sample.
2.10. Statistical Analysis
Differences in fluorescence between cells infected with different MOIs were evaluated by ANOVA test considering adjusted P-values ≤ 0.05 as significant. Correlations between log CFUs estimated in the BACTEC MGIT™ 960 system and fluorescence signal measured in the IncuCyte® were assessed by Pearson correlation test.
3. Results
3.1. Concentration-Dependent Detection of MAP-GFP Fluorescence in the IncuCyte®
To evaluate the detection efficiency and linearity of the IncuCyte®, fluorescence from ten-fold serial dilutions of MAP-GFP ranging from to CFUs were quantified (Figure 1). Quantitative analysis of the images revealed a concentration-dependent decline in the mean count per image (Figure 1A). The highest concentration tested () yielded the maximum detection rate, with a mean count of per image. A sharp reduction in detected fluorescence was observed upon the first ten-fold dilution to , which exhibited a mean count of Further dilutions to and CFUs resulted in minimal signal detection, averaging and , respectively. Signal detection was entirely lost at the lowest dilution thresholds of and . Statistical analysis confirmed that the mean counts at the maximum concentration () were significantly higher than all subsequent dilutions (). Microscopic evaluation qualitatively validated the quantitative findings (Figure 1B) with well-distributed green, fluorescent signals at the highest concentration (top-left panel). In agreement with the numerical data, a sequential reduction in fluorescent spots was observed across the imaged fields, culminating in a complete absence of visible signal in the lowest concentration panels (bottom panels).
3.2. Optimization of Culture Media for IncuCyte® Live-Cell Imaging of MAP-GFP Within BOMAC Cells
BOMAC cells (106 cells/ml) were infected with a single-cell suspension of MAP-GFP at a multiplicity of infection (MOI) of 1:10. After a 2 h incubation, the uninfected and infected cells were replenished with one of the following media: PBS, FBS, RPMI-1640, RPMI-1640 without phenol red, and DMEM/F12 with and without 10% FBS supplementation. Subsequently, fluorescence was quantified using the IncuCyte® system, and the total integrated intensity () was utilized as a measure of intracellular MAP load. Among all media tested, only DMEM/F12, DMEM/F12 supplemented with FBS, and FBS-supplemented RPMI-1640 yielded significant differences between infected and uninfected cells (P = 0.035, P = 0.034, P = 0.029, respectively) (Figure 2). RPMI-1640 supplemented with FBS was selected for future experiments as it is the recommended media for BOMAC growth and because the highest significant differences in fluorescence were observed between uninfected and infected BOMAC cells in this medium.
3.3. Optimization of MOI for IncuCyte® Live-Cell Imaging of MAP-GFP with MDMs and BOMAC Cells
To evaluate the relationship between bacterial concentration and fluorescence quantification, MDMs and BOMAC cells were inoculated by triplicate with varying MOIs and after 2 h of infection the resulting total integrated intensity () was measured in the IncuCyte® system (Figure 3). In MDMs, the highest fluorescence signal was observed at a with mean total integrated intensity of approximately 49.2 units (Figure 3A). A marked reduction in fluorescence was observed at a (53.7 units), while further dilutions ranging from down to resulted in a complete loss of detectable fluorescence signal. Statistical analysis confirmed that the fluorescence at the was significantly elevated compared to all lower MOI conditions (). This quantitative trend was visually corroborated by representative fluorescence microscopy images (Figure 3B). MDMs infected at MOI 1:10 exhibited robust green fluorescent signal (top-left panel). A clear reduction in the intensity of fluorescent was observed with the MOI of 1:1 (top-right panel), culminating in a total absence of green fluorescence signal at the lowest MOI of 1:0.1 and 1.0.01 (bottom panels).
A refined MOI gradient was assessed in BOMAC cells ranging from down to , alongside an uninfected control (Figure 3C). Maximum fluorescence was detected at the highest tested MOI of , producing a mean integrated intensity of fluorescence of approximately . The signal intensity decreased as the MOI was diluted to ( ) and (327 ). Below the MOI of , fluorescence maintained low baseline levels () that closely mirrored the background signal observed in the uninfected control group (). Comparatively, the uninfected control exhibited a statistically significant reduction in total integrated intensity when measured against experimental MOIs from down to (). Collectively, these results suggested that green fluorescence intensity directly correlates with the MOI across both MDMs and BOMAC cells after 2 hours of infection. In MDMs and BOMAC cells, green fluorescence intensity similarly peaked at the highest tested MOI (1:10 and 1:100, respectively) and progressively decreased as the bacterial concentration was diluted.
3.4. Optimization of Cell Concentration and Time-Course Quantification of MAP-GFP Fluorescence Within Infected BOMAC Cells
To illustrate the IncuCyte® platform ability to carry out long-term imaging, total integrated fluorescence intensity was tracked over 7 days across varying cell densities (, , and cells) and MOIs (1:10 and 1:100) (figure 4). As shown in figure 4A, when 106 cells were infected at a MOI 1:100 (blue line), the fluorescence signal increased significantly starting day 4 reaching its maximum by day 7 ( . Microscopic observation revealed that this increase in fluorescence was accompanied by a sudden dispersion of localized GFP signal reflecting host cell death at this high MOI. In contrast, fluorescence in lower cells density conditions and cells) infected at a MOI 1:100 remained near baseline throughout the 7-day period. Rescaling the y-axis by excluding MOI 1:100 (106 cells/ml) revealed a stable fluorescence signal from 2 h to 4 days p.i. for 106 cells infected with a MOI of 1:10 (figure 4B). Figure 4C shows early kinetics. Cells a MOI 100 (blue line) displays a steady, gradual increase in fluorescence from 2h () up to Day 3 (), before beginning its sharp increase at Day 4 () reflecting cell death. However, infection of BOMAC cells MOI 1:10 (pink line) maintained a stable baseline of across days 0 to 4 suggesting that these might be the optimal assay conditions. All other conditions remain flat near baseline during these initial 4 days.
3.5. A Comparative Analysis of the IncuCyte® Platform and BACTEC MGIT™960 Liquid Culture System for MAP Quantification
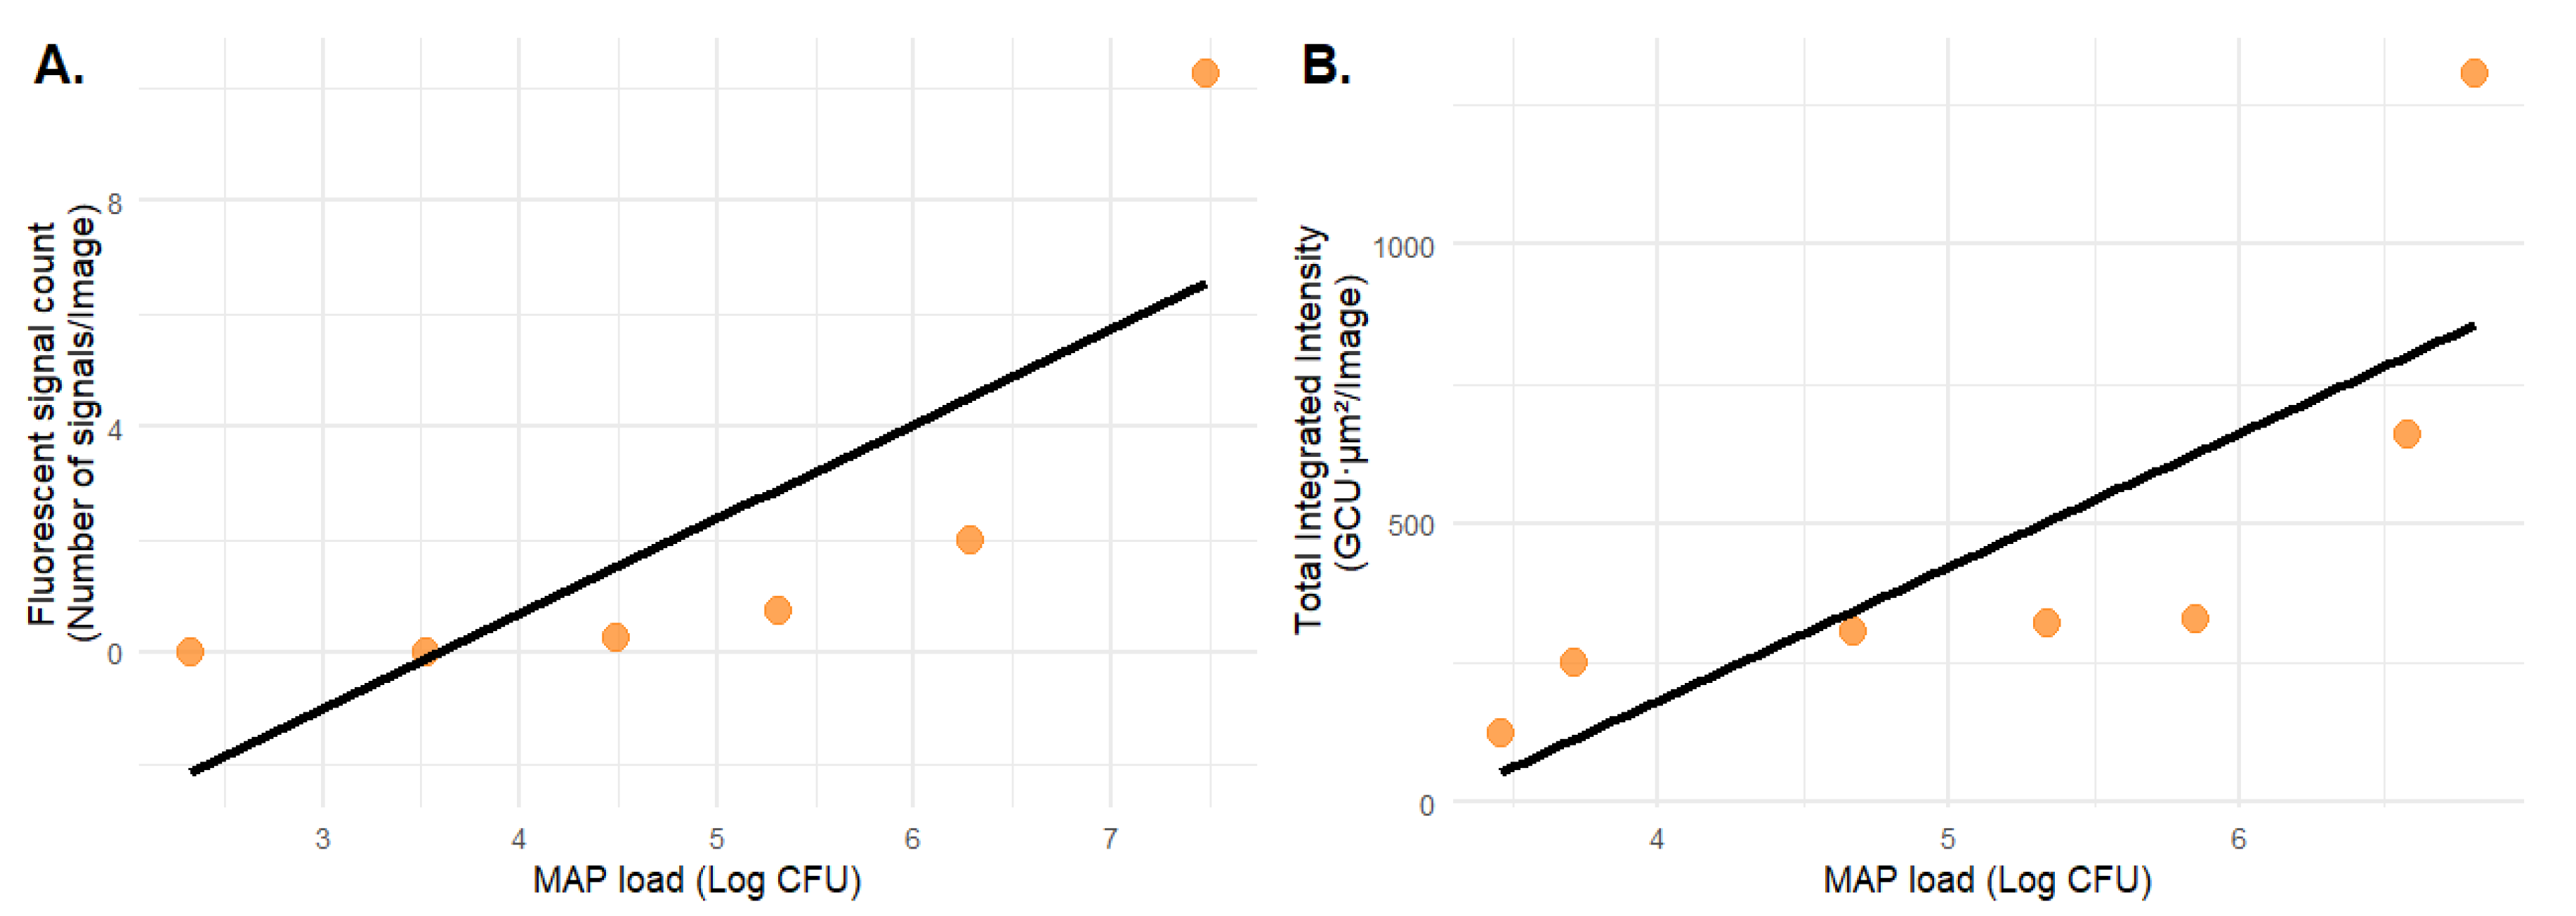
To examine whether MAP-GFP fluorescence is a valid measure of MAP CFU numbers, we compared MAP fluorescence versus log CFUs. Serial 10-fold dilutions of a suspension of MAP-GFP bacilli (McFarland standard of 1) were quantified by triplicate in the IncuCyte® and in the BACTEC-MGIT™ 960 system (Figure 5A). We found a good correlation between fluorescence signal counts obtained in the IncuCyte® and logCFUs calculated with BACTEC MGIT™ 960 system (r2 = 0.79) with an incremental increase in fluorescence translating to an increase in the number of bacilli. In addition, fluorescence of BOMAC cells (106 cells/ml) infected with MAP-GFP at several MOIs (1:100, 1:50, 1:10, 1:5, 1:1, 1: 0.1, 1:1, and 1: 0.05) in triplicate was quantified in the IncuCyte® and compared to estimated logCFUs calculated in the BACTEC MGIT™ 960 system. There was also a good correlation between fluorescence integrated intensity measured in the IncuCyte® and logCFUs estimated in the BACTEC MGIT™ 960 system (r2 = 0.78, Figure 5B).
4. Discussion
As macrophages are the primary cellular targets of MAP, quantification of viable intracellular bacterial load can be used as a measure of macrophage performance and as a marker of resistance or susceptibility to MAP infection (Badia-Bringué et al., 2023). Researchers have used a variety of assays to study MAP phagocytosis; including plate counting, light and confocal microscopy, flow cytometry, and spectrofluorometry. However, technical and practical limitations are associated with all these methods such as low throughput, single end point readouts, and often subjective quantification. Microscopy and flow cytometry techniques have been used to visualize and quantify phagocytosis of E. coli bioparticles by non-adherent phagocytic cells or macrophage cell lines (Yan et al., 2012). However, primary macrophages can be stressed when detached from a plate to be run on a flow or imaging flow cytometer and the analysis is of low throughput and potentially open to operator bias. In addition, these methods require a cell fixation step, which can potentially disrupt macrophages. Moreover, estimating MAP bacterial load is challenging due to the organism's slow growth rate (24+ hour generation time) and heavy clumping. Bacteriological culture in Herrold’s Egg Yolk Medium (HEYM) or Middlebrook 7H10/7H11 supplemented with mycobactin J requires 4–16 weeks for visible colonies to form and cell clumping often underestimates actual cell counts. Automated liquid culture systems such as the BACTEC MGIT™ 960 system tracks oxygen consumption over time in liquid media, is faster than solid agar and can be used for MAP quantification as the TTD in the BACTEC MGIT™ 960 system inversely correlates with initial viable bacterial load. However, the BACTEC MGIT™ 960 system requires up to 42 days of incubation to yield results, cannot track intracellular bacterial loads within host macrophages in real-time, and requires a host cell lysis step. By using real-time and live-cell optical assays with fluorescently labelled MAP strains (MAP-GFP), fluorescence intensity can be tracked directly and continuously using automated live-cell imaging platforms such as the IncuCyte® system. This approach enables high-throughput, non-destructive, automatic and direct real-time monitoring of intracellular bacterial load within host macrophages.
To our knowledge, this study is the first to perform real-time quantification of MAP load using live cell fluorescence microscopy. Fist, we determined that the lower limit of detection for free MAP-GFP in the IncuCyte® system was 3 × 10⁴ CFUs. Statistical analysis confirmed that the mean counts at the maximum concentration () was significantly higher than all subsequent dilutions of MAP-GFP. In this assay, fluorescence unit counts were used instead of total integrated intensity because bacterial morphology differs from host cell morphology.
Selecting an appropriate culture medium is crucial for minimizing background signal and ensuring reliable fluorescent data. In this study, RPMI-1640 supplemented with FBS was selected because it yielded the greatest significant difference in fluorescence between uninfected and MAP-infected BOMAC cells. Although this medium contains phenol red, previous studies have shown that phenol red's spectral properties do not overlap with GFP emission, thereby avoiding interference with MAP-GFP signal quantification (Sundarakrishnan et al., 2016). Our study demonstrated that MAP phagocytosis is pathogen number and cell density dependent. Infecting BOMAC cells () with MAP-GFP at an MOI of 1:10 () yielded stable fluorescence in the IncuCyte® system over the first 4 days p.i. This aligns with previous live-cell imaging studies utilizing the IncuCyte® system, which established that low MOIs (e.g., 1:10) maintained host cell integrity and avoided fluorescence spikes caused by high infection doses of Mycobacterium tuberculosis (Mtb) such as a MOI 1:100 (Mahamed et al., 2017). Our results are also consistent with previous studies showing that MAP is cytotoxic to macrophages at high doses. While MAP survives much longer in in vitro macrophages than other species of mycobacteria, there remains a significant decrease in viability over time (Kuehnel et al., 2001). Evaluations of intracellular viability by electronic microscopy indicated a reduction in viable MAP cell counts after 95 hours of infection (~4 days) over a period of seven days (Bannantine & Stabel, 2002). Consequently, a MOI of 1:10 provides an optimal signal-to-noise ratio for tracking early intracellular bacterial kinetics without causing host cytotoxicity. Although previous studies used cell densities of 104 or 105 cells per well (Andersson et al., 2020; Blay-Benach et al., 2026), our study demonstrated that the infection of BOMAC cells (106 cells/ml) with MAP-GFP at a MOI 1:10 gave consistent results over 4 days pi. Furthermore, the IncuCyte® system could detect differences in bacterial load in BOMAC cells infected with different concentrations of MAP-GFP, like the BACTEC MGIT™ 960system. Other studies have evaluated phagocytosis of Mycobacterium fortuitum by alveolar macrophages using pH-dependent dye and obtained also good correlation values between fluorescence quantification and TTDs obtained from the BACTEC MGIT™ 960 system (Blay-Benach et al., 2026).
In conclusion, we developed an optimized an automated live-cell imaging assay to quantify free MAP-GFP bacilli and monitor real-time bacterial load dynamics within infected bovine macrophages; MDMs and BOMAC cells. Our key findings demonstrated: 1. Phagocytosis and intracellular MAP survival are dependent on cell density MOI. 2. A stable fluorescence signal (~400–500 GCU) can be maintained in 1 × 10⁶ cells at an MOI of 1:10 across 2 hours to 4 days p.i. 3. IncuCyte® fluorescence intensity strongly correlates with traditional BACTEC MGIT™ 960 system CFU estimations (r2 = 0.79 for free bacilli; r2 = 0.78 for intracellular bacilli), establishing real-time live-cell microscopy as a highly reliable method for monitoring mycobacterial infection dynamics. The real-time imaging system showed higher throughput and simpler workflow, making it suitable for large-scale studies. Given that macrophages are the main MAP target cells, this system represents a feasible and fast way to quantify macrophage phagocytosis with a high degree of sensitivity and to test the efficacy of novel therapeutics, and vaccines and probiotics aimed at enhancing innate immunity.
Author Contributions
GB-B and AP-L performed in vitro experiments and the statistical analysis of the data. MA-H was the principal investigator of the project and participated in project management, experimental design, and data analysis. All authors read and approved the submitted version of the manuscript.
Funding
Financial support for this study was provided by a grant funded by MCIN/AEI/10.13039/501100011033, and FEDER, UE (PID2021-122197OR-C21). Arrate Prado-López is the recipient of a predoctoral contract funded by the Department of Economic Development, Sustainability and Environment of the Basque Government (IKERTALENT Scholarship Program 2024). The funding bodies have not been involved in the design of the study and collection, analysis, and interpretation of data and in writing the manuscript.
Data Availability Statement
The original contributions presented in the study are included in the article/Supplementary Material, further inquiries can be directed to the corresponding author.
Acknowledgments
The authors wish to thank Eduardo Flamini and Emilia Mayo from Sartorius for advice and technical support with the IncuCyte SX1 that was fully funded by NEIKER.
Conflicts of Interest
The author(s) declared that this work was conducted in the absence of any commercial or financial relationships that could be construed as a potential conflict of interest.
References
- Abendaño, N., I. A. Sevilla, J. M. Prieto, J. M. Garrido, R. A. Juste, and M. Alonso-Hearn. 2013. Mycobacterium avium subspecies paratuberculosis isolates from sheep and goats show reduced persistence in bovine macrophages than cattle, bison, deer and wild boar strains regardless of genotype. Veterinary Microbiology 163, 3–4: 325–334. [Google Scholar] [CrossRef] [PubMed]
- Abendaño, N., I. Sevilla, J. M. Prieto, J. M. Garrido, R. A. Juste, and M. Alonso-Hearn. 2012. Quantification of Mycobacterium avium subsp. paratuberculosis strains representing distinct genotypes and isolated from domestic and wildlife animal species by use of an automatic liquid culture system. Journal of Clinical Microbiology 50, 8: 2609–2617. [Google Scholar] [CrossRef] [PubMed]
- Alonso-Hearn, M., G. Magombedze, N. Abendaño, M. Landin, and R. A. Juste. 2019. Deciphering the virulence of Mycobacterium avium subsp. paratuberculosis isolates in animal macrophages using mathematical models. Journal of Theoretical Biology 468: 82–91. [Google Scholar] [CrossRef] [PubMed]
- Alonso-Hearn, M., E. Molina, M. Geijo, P. Vazquez, I. Sevilla, J. M. Garrido, and R. A. Juste. 2009. Isolation of Mycobacterium avium subsp. paratuberculosis from Muscle Tissue of Naturally Infected Cattle. Foodborne Pathogens and Disease 6, 4: 513–518. [Google Scholar] [CrossRef] [PubMed]
- Andersson, B., M. J. Nordvall, A. Welin, M. Lerm, and T. Schön. 2020. A novel mycobacterial growth inhibition assay employing live-cell imaging of virulent M. tuberculosis and monitoring of host cell viability. Tuberculosis 124: 101977. [Google Scholar] [CrossRef] [PubMed]
- Badia-Bringué, G., M. Canive, and M. Alonso-Hearn. 2023. Control of Mycobacterium avium subsp. paratuberculosis load within infected bovine monocyte-derived macrophages is associated with host genetics. Frontiers in Immunology 14. [Google Scholar] [CrossRef] [PubMed]
- Bannantine, J. P., and J. R. Stabel. 2002. Killing of Mycobacterium avium subspecies paratuberculosis within macrophages. BMC Microbiology 2, 1: 2. [Google Scholar] [CrossRef] [PubMed]
- Bermudez, L. E., M. Petrofsky, S. Sommer, and R. G. Barletta. 2010. Peyer’s Patch-Deficient Mice Demonstrate That Mycobacterium avium subsp. paratuberculosis Translocates across the Mucosal Barrier via both M Cells and Enterocytes but Has Inefficient Dissemination. Infection and Immunity 78, 8: 3570–3577. [Google Scholar] [CrossRef] [PubMed]
- Blay-Benach, M., P. Cuenca-Lara, J. Repullés, Z. Cervera, and B. Pérez de Val. 2026. Phagocytosis of Mycobacterium fortuitum by Caprine Alveolar Macrophages Is Associated with iNOS and Pro-Inflammatory Markers Expression. International Journal of Molecular Sciences 27, 3: 1529. [Google Scholar] [CrossRef] [PubMed]
- Canive, M., G. Badia-Bringué, and M. Alonso-Hearn. 2022. The Upregulation of Cathepsin G Is Associated with Resistance to Bovine Paratuberculosis. Animals 12, 21: 1–12. [Google Scholar] [CrossRef] [PubMed]
- Harris, N. B., D. K. Zinniel, M. K. Hsieh, J. D. Cirillo, and R. G. Barletta. 2002. Cell Sorting of Formalin-Treated Pathogenic Mycobacterium paratuberculosis Expressing GFP. BioTechniques 32, 3: 522–527. [Google Scholar] [CrossRef] [PubMed]
- Juste, R. A., M. Alonso-Hearn, J.M. Garrido, N. Abendaño, I. A. Sevilla, C. Gortazar, J. de la Fuente, and L. Dominguez. 2016. Increased Lytic Efficiency of Bovine Macrophages Trained with Killed Mycobacteria. Plos One 11, 11: e0165607. [Google Scholar]
- Kalsum, S., B. Andersson, J. Das, T. Schön, and M. Lerm. 2021. A high-throughput screening assay based on automated microscopy for monitoring antibiotic susceptibility of Mycobacterium tuberculosis phenotypes. BMC Microbiology 21, 1: 167. [Google Scholar] [CrossRef] [PubMed]
- Kuehnel, M. P., R. Goethe, A. Habermann, E. Mueller, M. Rohde, G. Griffiths, and P. Valentin-Weigand. 2001. Characterization of the intracellular survival of Mycobacterium avium ssp. paratuberculosis: phagosomal pH and fusogenicity in J774 macrophages compared with other mycobacteria. Cellular Microbiology 3, 8: 551–566. [Google Scholar] [CrossRef] [PubMed]
- Mahamed, D., M. Boulle, Y. Ganga, C. Mc Arthur, S. Skroch, L. Oom, O. Catinas, K. Pillay, M. Naicker, S. Rampersad, C. Mathonsi, J. Hunter, E. B. Wong, M. Suleman, G. Sreejit, A. S. Pym, G. Lustig, and A. Sigal. 2017. Intracellular growth of Mycobacterium tuberculosis after macrophage cell death leads to serial killing of host cells. ELife 6. [Google Scholar] [CrossRef] [PubMed]
- Momotani, E., D. L. Whipple, A. B. Thiermann, and N. F. Cheville. 1988. Role of M Cells and Macrophages in the Entrance of Mycobacterium paratuberculosis into Domes of Ileal Peyer’s Patches in Calves. Veterinary Pathology 25, 2: 131–137. [Google Scholar] [CrossRef] [PubMed]
- Nielsen, S. S., and N. Toft. 2009. A review of prevalences of paratuberculosis in farmed animals in Europe. Preventive Veterinary Medicine 88, 1: 1–14. [Google Scholar] [CrossRef] [PubMed]
- Rasmussen, P., H. W. Barkema, S. Mason, E. Beaulieu, and D. C. Hall. 2021. Economic losses due to Johne’s disease (paratuberculosis) in dairy cattle. Journal of Dairy Science 104, 3: 3123–3143. [Google Scholar] [CrossRef] [PubMed]
- Rasmussen, P., H. W. Barkema, P. P. Osei, J. Taylor, A. P. Shaw, B. Conrady, G. Chaters, V. Muñoz, D. C. Hall, O. O. Apenteng, J. Rushton, and P. R. Torgerson. 2024. Global losses due to dairy cattle diseases: A comorbidity-adjusted economic analysis. Journal of Dairy Science. [Google Scholar] [CrossRef] [PubMed]
- Stabel, J. R., and T. J. Stabel. 1995. Immortalization and characterization of bovine peritoneal macrophages transfected with SV40 plasmid DNA. Veterinary Immunology and Immunopathology 45, 3–4: 211–220. [Google Scholar] [CrossRef] [PubMed]
- Sundarakrishnan, A., E. Herrero Acero, J. Coburn, K. Chwalek, B. Partlow, and D. L. Kaplan. 2016. Phenol red-silk tyrosine cross-linked hydrogels. Acta Biomaterialia 42: 102–113. [Google Scholar] [CrossRef] [PubMed]
- Sweeney, R. W. 2011. Pathogenesis of Paratuberculosis. Veterinary Clinics of North America: Food Animal Practice 27, 3: 537–546. [Google Scholar] [CrossRef] [PubMed]
- Jing, Y., X. Meng, L.M. Wancket, K. Lintner, D. Leif, L.D. Nelin, B. Chen, K. P. Francis, C.V. Smith, L. K. Rogers, and Y. Liu. 2012. Glutathione Reductase Facilitates Host Defense by Sustaining Phagocytic Oxidative Burst and Promoting the Development of Neutrophil Extracellular Traps. J Immunol 188, 5: 2316–2327. [Google Scholar] [CrossRef]
Figure 1.
Quantification of MAP-GFP bacilli in the IncuCyte®. (A) Histogram representing fluorescence values (mean count per image) of each dilution of MAP-GFP. Each bar and whisker represents the mean and the standard error, respectively. Significant differences are indicated by an asterisk. (B) Phase contrast images (20 x) of MAP-GFP at concentration 3 107, 3 106, 3 105, 3 104 CFUs, from left to right, up to down. Images are from one representative of three independent experiments.
Figure 1.
Quantification of MAP-GFP bacilli in the IncuCyte®. (A) Histogram representing fluorescence values (mean count per image) of each dilution of MAP-GFP. Each bar and whisker represents the mean and the standard error, respectively. Significant differences are indicated by an asterisk. (B) Phase contrast images (20 x) of MAP-GFP at concentration 3 107, 3 106, 3 105, 3 104 CFUs, from left to right, up to down. Images are from one representative of three independent experiments.
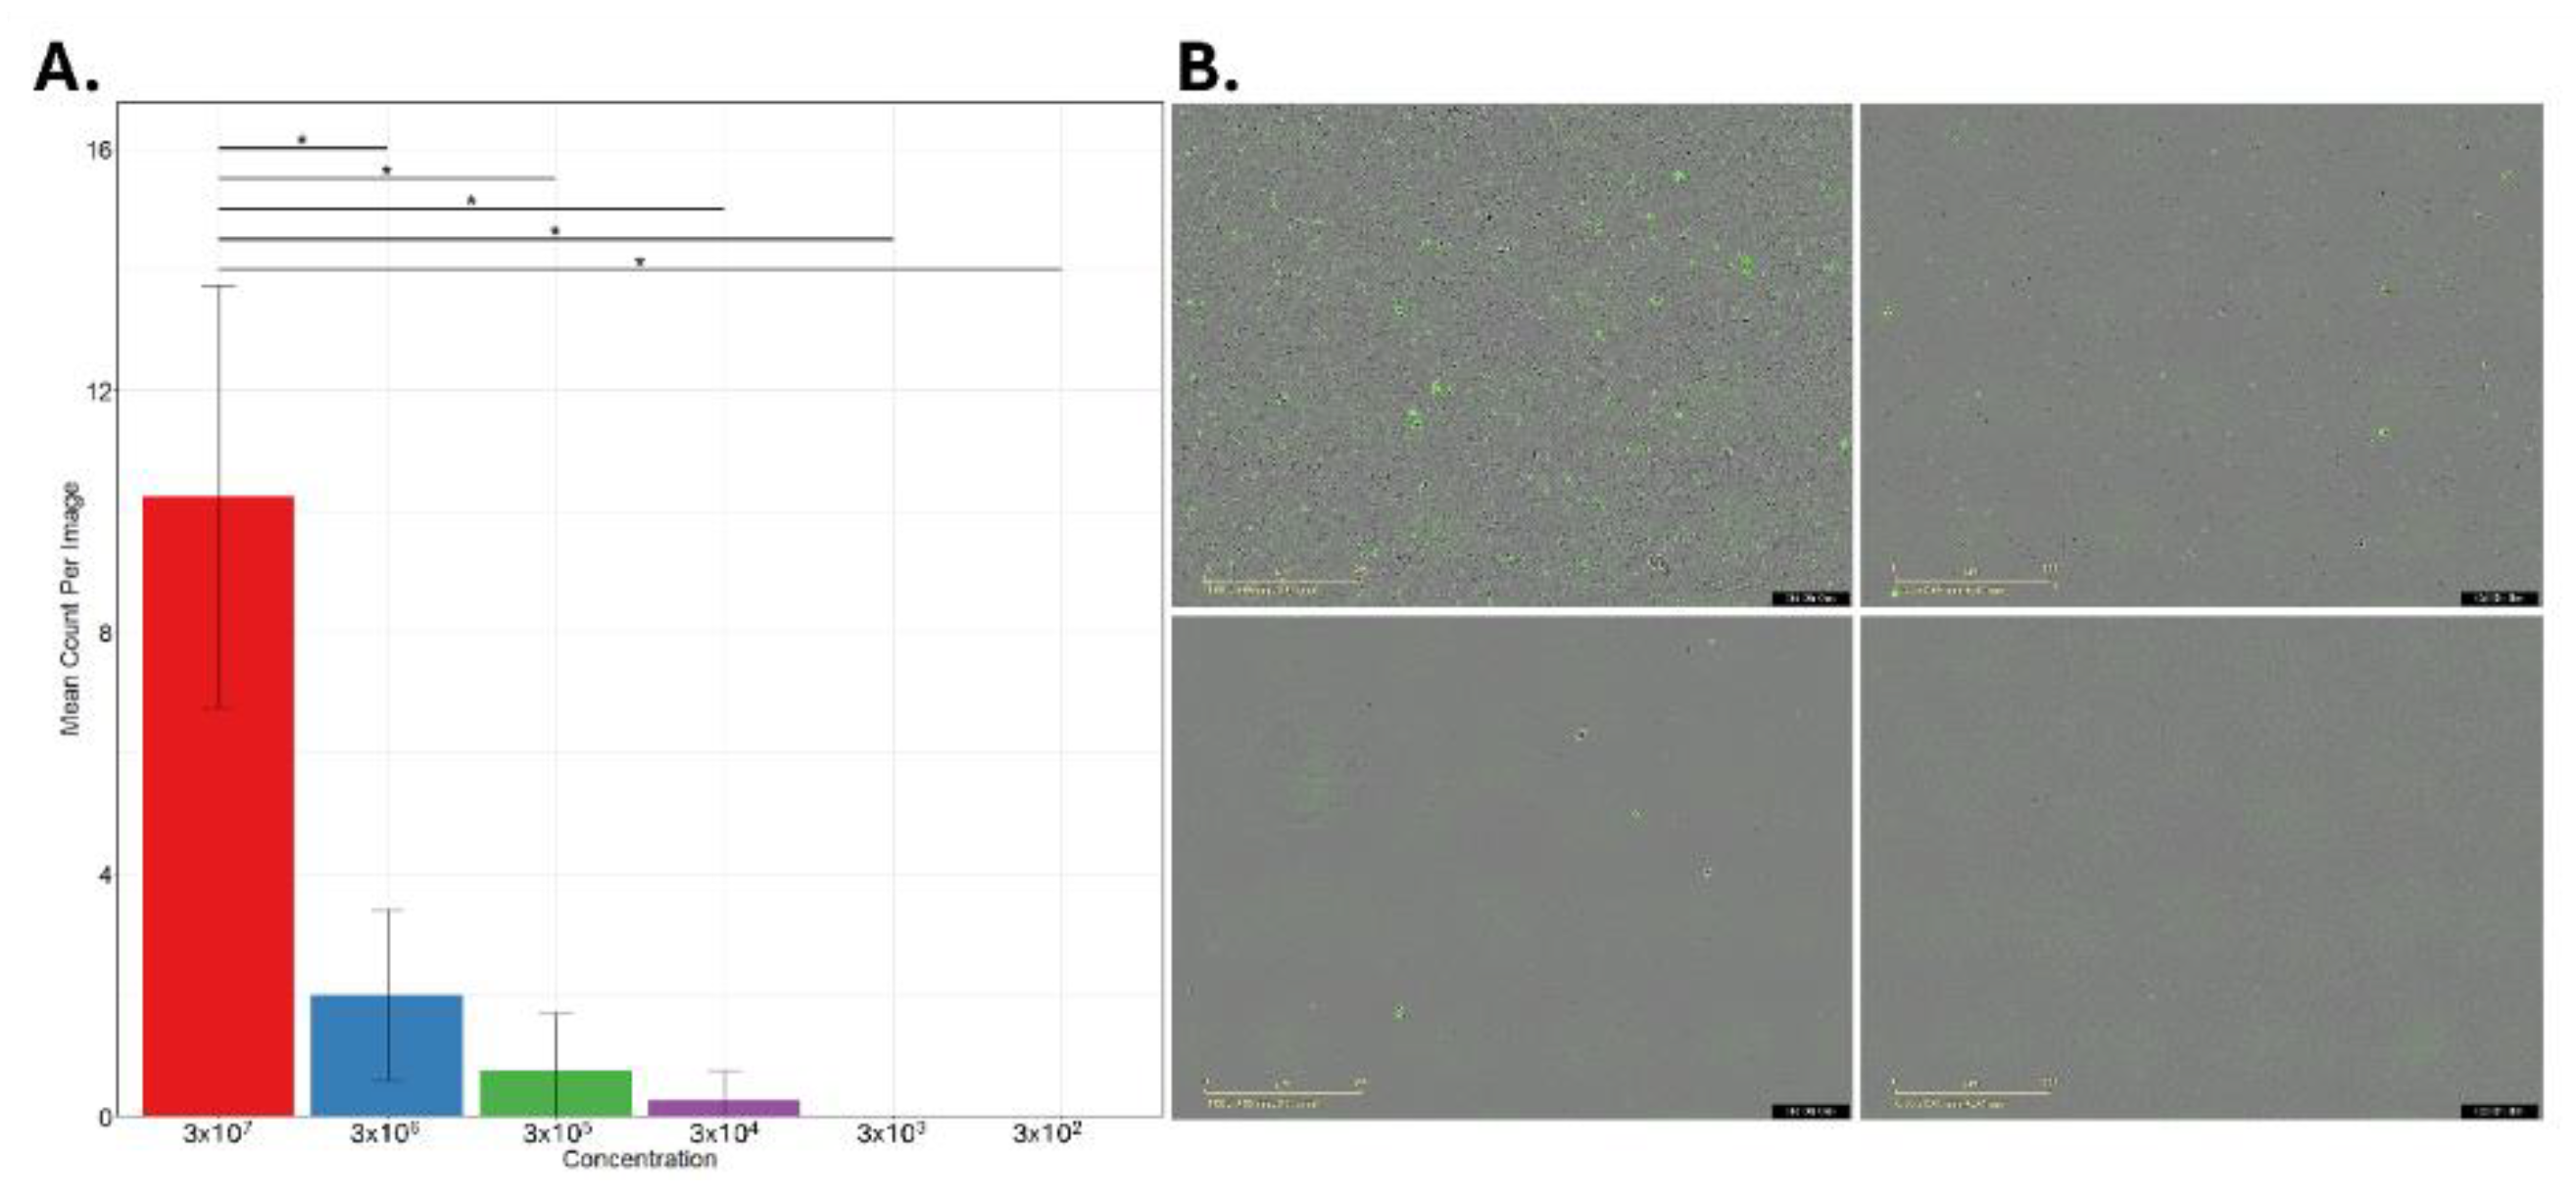
Figure 2.
Effect of different culture media and supplements on total integrated fluorescence intensity of MAP-GFP within BOMAC cells. Comparison of total integrated green fluorescence intensity () between uninfected controls (-) and MAP-GFP–infected BOMAC cells (+) across various media, including PBS, HBSS, FBS, RPMI-1640 (with and without FBS/Phenol Red [PR]), DMEM F12, and DMEM F12 supplemented with FBS. Significant differences between uninfected and infected conditions were observed in RPMI + FBS, DMEM F12, and DMEM F12 + FBS (). Data are presented as total integrated intensity () standard deviation (SD).
Figure 2.
Effect of different culture media and supplements on total integrated fluorescence intensity of MAP-GFP within BOMAC cells. Comparison of total integrated green fluorescence intensity () between uninfected controls (-) and MAP-GFP–infected BOMAC cells (+) across various media, including PBS, HBSS, FBS, RPMI-1640 (with and without FBS/Phenol Red [PR]), DMEM F12, and DMEM F12 supplemented with FBS. Significant differences between uninfected and infected conditions were observed in RPMI + FBS, DMEM F12, and DMEM F12 + FBS (). Data are presented as total integrated intensity () standard deviation (SD).
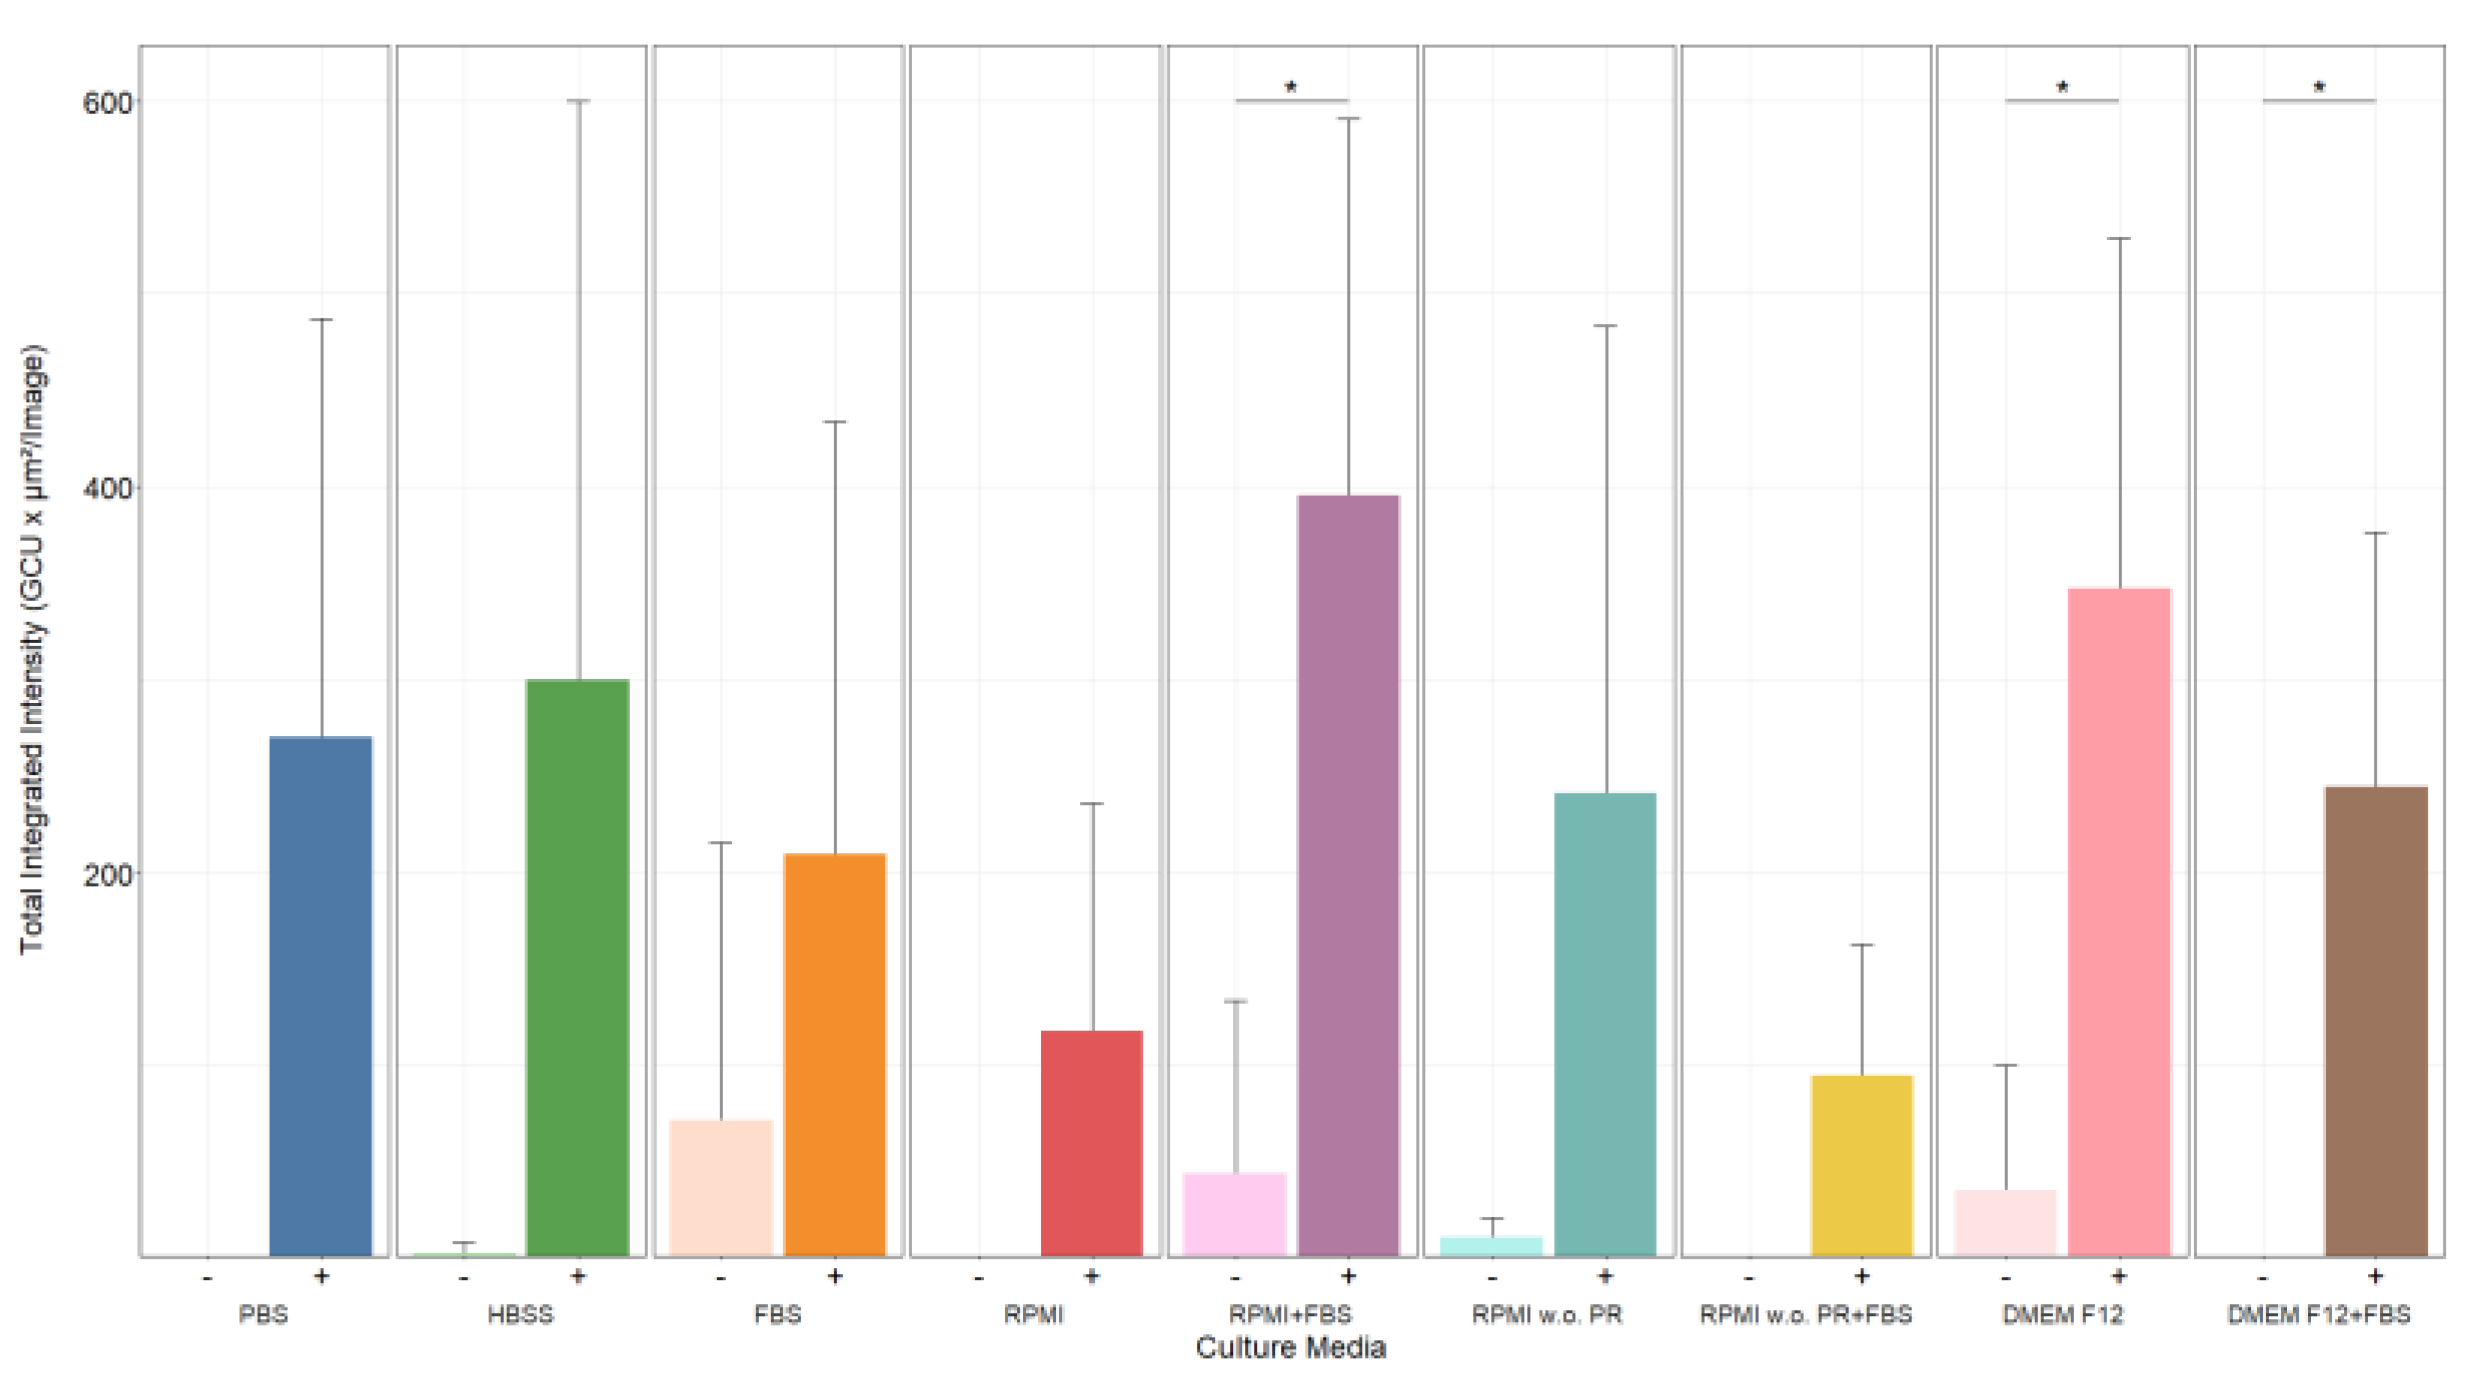
Figure 3.
Quantification of fluorescence at 2 h p.i. in MDMs and BOMAC cells infected at different MOIs. (A) Histogram representing total integrated fluorescence values in mean GCU·μm2/image of MDMs infected with MAP-GFP at different MOI (1:10, 1:1, 1:0.1, 1:0.01, 1:0.001, 1:0.0001, 1:0.00001). Each bar and whisker represents the mean and the SD, respectively. Significant differences between MOI 1:10 and lowest concentrations are indicated by an asterisk. (B) Phase contrast images (20x) of MDMs infected with MAP-GFP at MOIs 1:10, 1:1, 1:0.1, and 1:0.01, from left to right, up to down. (C) BOMAC cells infected with MAP-GFP at different MOIs (1.100, 1:50, 1:10, 1:5, 1:1, 1:0.1, 1:0.05). Each bar represents the median total integrated intensity of each MOI. Asterisks represent significant differences between each MOI and the control.
Figure 3.
Quantification of fluorescence at 2 h p.i. in MDMs and BOMAC cells infected at different MOIs. (A) Histogram representing total integrated fluorescence values in mean GCU·μm2/image of MDMs infected with MAP-GFP at different MOI (1:10, 1:1, 1:0.1, 1:0.01, 1:0.001, 1:0.0001, 1:0.00001). Each bar and whisker represents the mean and the SD, respectively. Significant differences between MOI 1:10 and lowest concentrations are indicated by an asterisk. (B) Phase contrast images (20x) of MDMs infected with MAP-GFP at MOIs 1:10, 1:1, 1:0.1, and 1:0.01, from left to right, up to down. (C) BOMAC cells infected with MAP-GFP at different MOIs (1.100, 1:50, 1:10, 1:5, 1:1, 1:0.1, 1:0.05). Each bar represents the median total integrated intensity of each MOI. Asterisks represent significant differences between each MOI and the control.
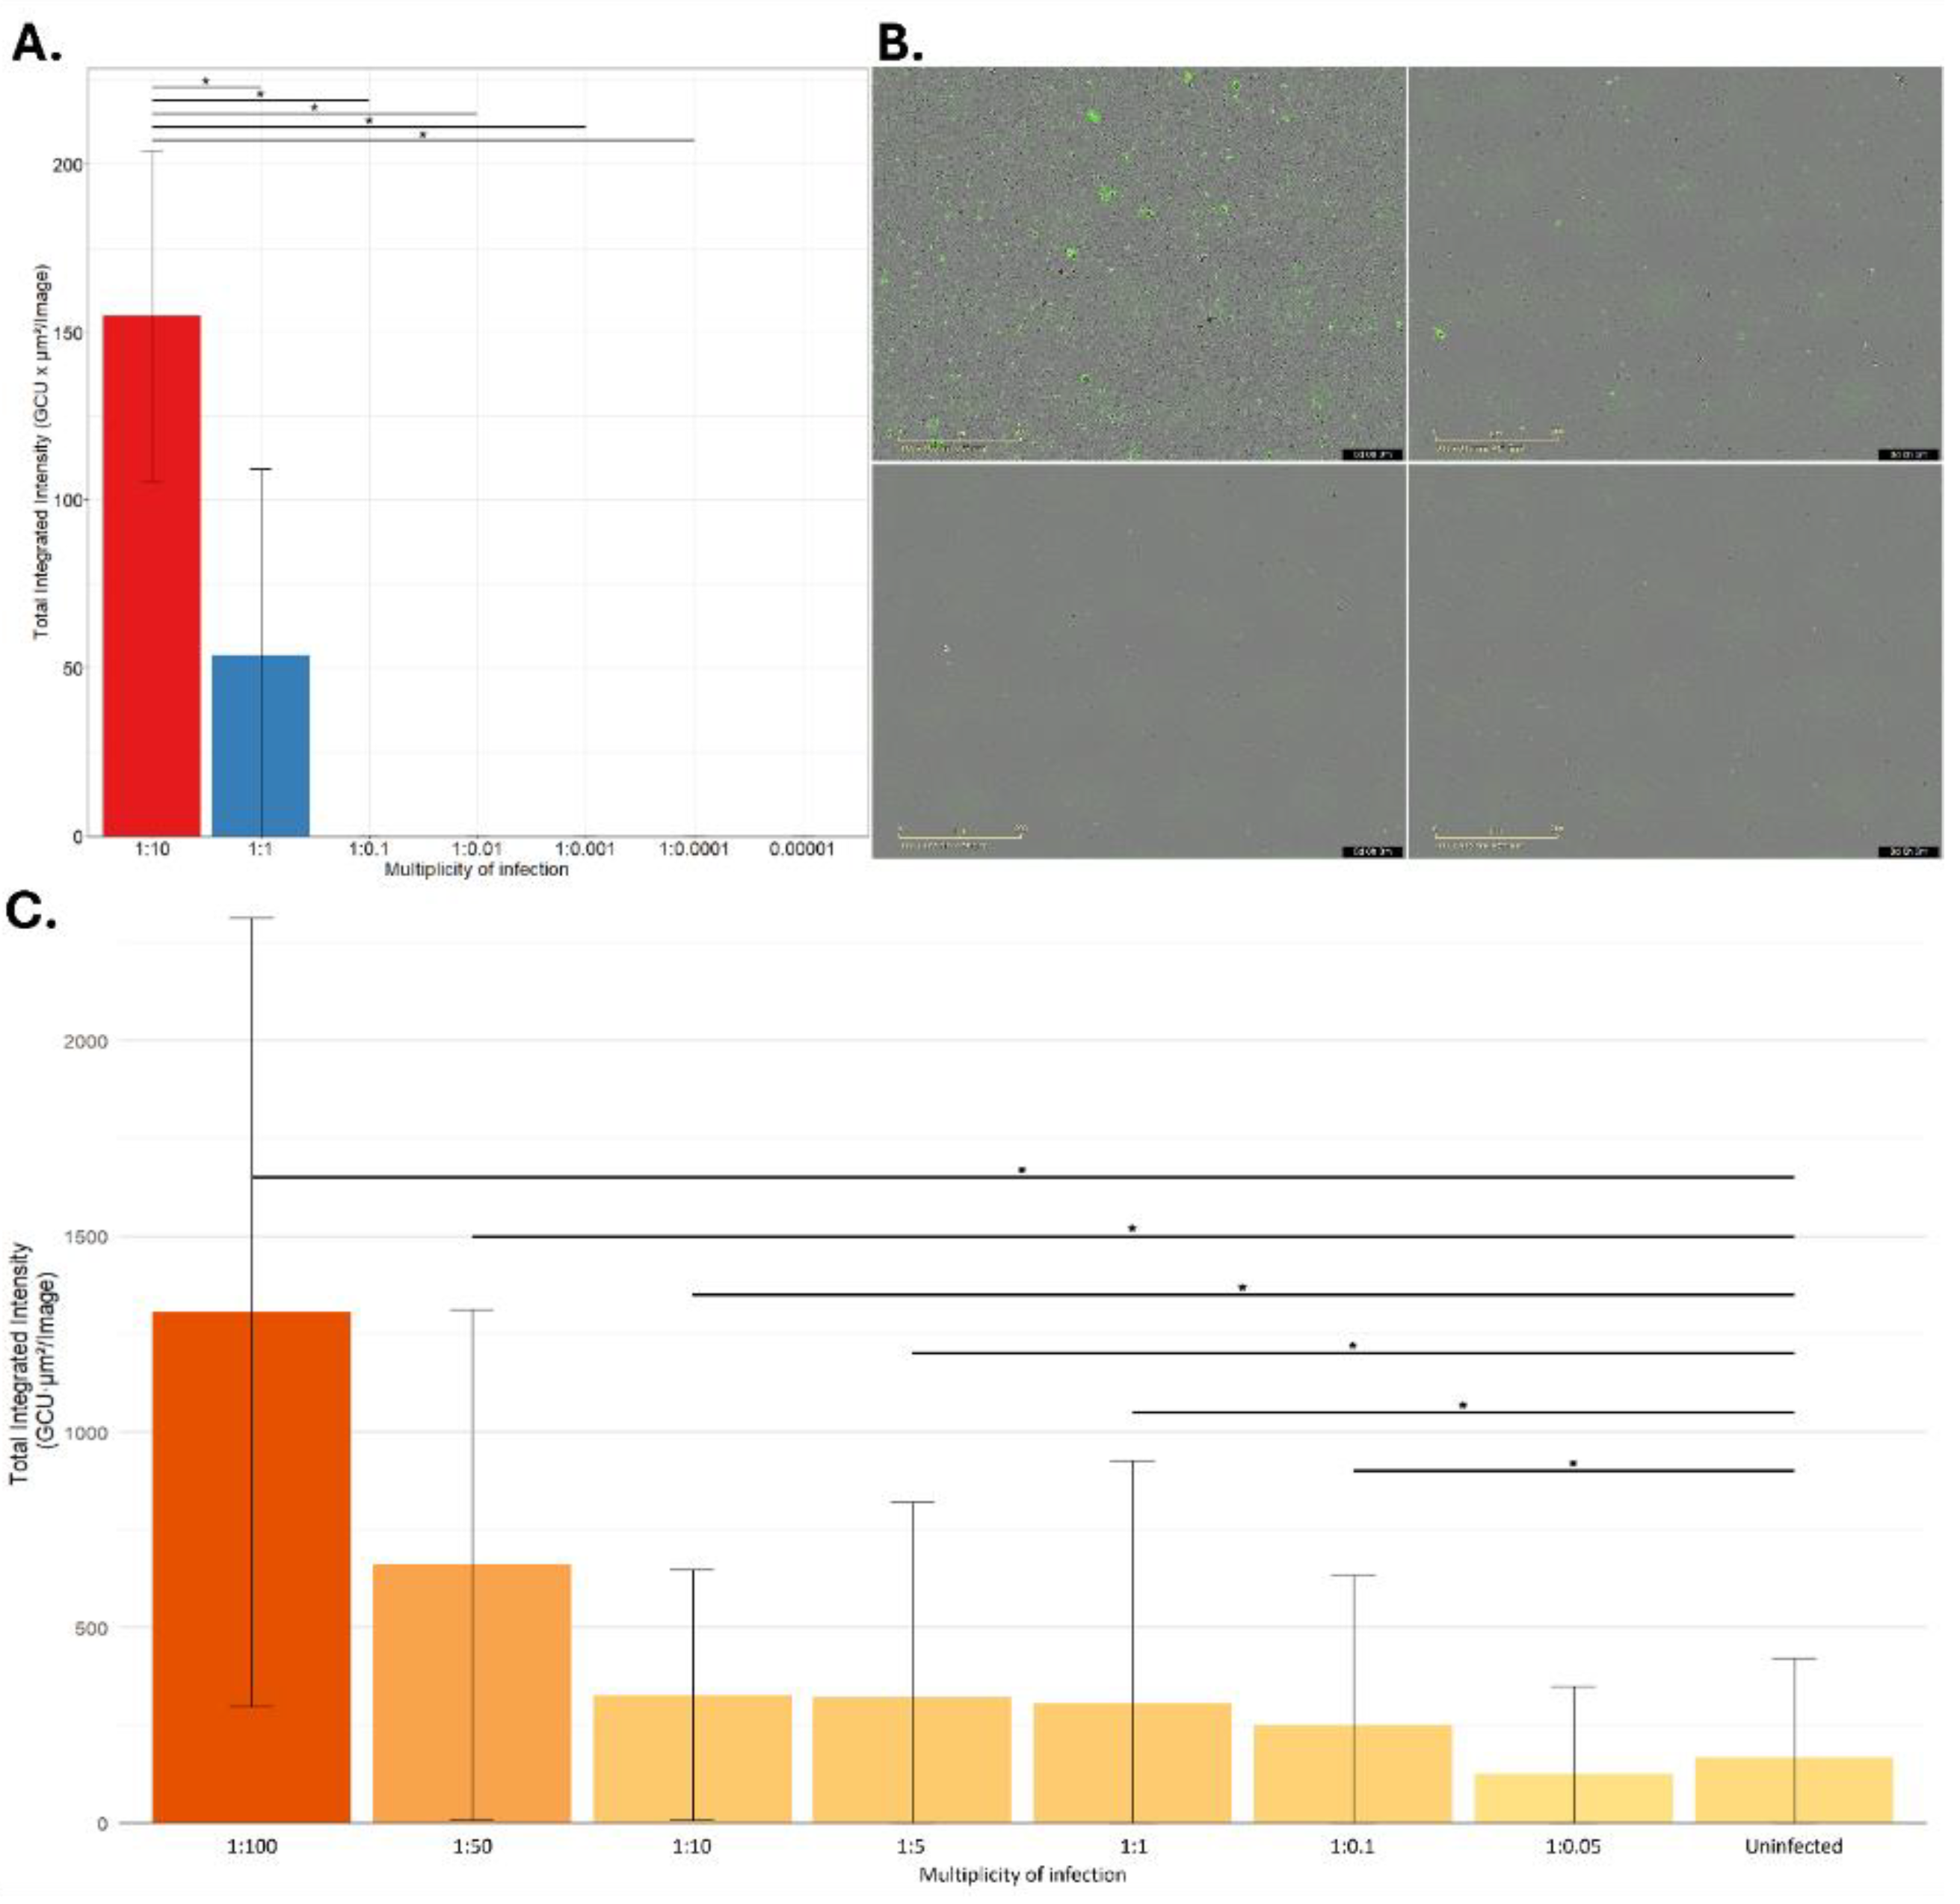
Figure 4.
Longitudinal kinetics of MAP-GFP infection in BOMAC cells across different cell densities (106, 105, 5 104 cells) and MOIs (1:10 and 1:100) over 7 days p.i. A. Total integrated green fluorescence intensity () measured over 7 days post-infection. A strong signal surge was observed at day 4 in the high-density/high-MOI condition (; blue line) due to host cell lysis. B. Rescaled view of the 7-day kinetic profile excluding MOI 1:100 with Conditions including (pink line) and (blue line) showed signal increases starting after day 4 and 5 suggesting host cell lysis. C. Focused kinetic evaluation of the early post-infection period (2 hours to 4 days). Infection of at an MOI of 1:10 (pink line) maintained a stable baseline (), representing the optimal window for assessing intracellular bacterial load prior to significant host cell destruction.
Figure 4.
Longitudinal kinetics of MAP-GFP infection in BOMAC cells across different cell densities (106, 105, 5 104 cells) and MOIs (1:10 and 1:100) over 7 days p.i. A. Total integrated green fluorescence intensity () measured over 7 days post-infection. A strong signal surge was observed at day 4 in the high-density/high-MOI condition (; blue line) due to host cell lysis. B. Rescaled view of the 7-day kinetic profile excluding MOI 1:100 with Conditions including (pink line) and (blue line) showed signal increases starting after day 4 and 5 suggesting host cell lysis. C. Focused kinetic evaluation of the early post-infection period (2 hours to 4 days). Infection of at an MOI of 1:10 (pink line) maintained a stable baseline (), representing the optimal window for assessing intracellular bacterial load prior to significant host cell destruction.
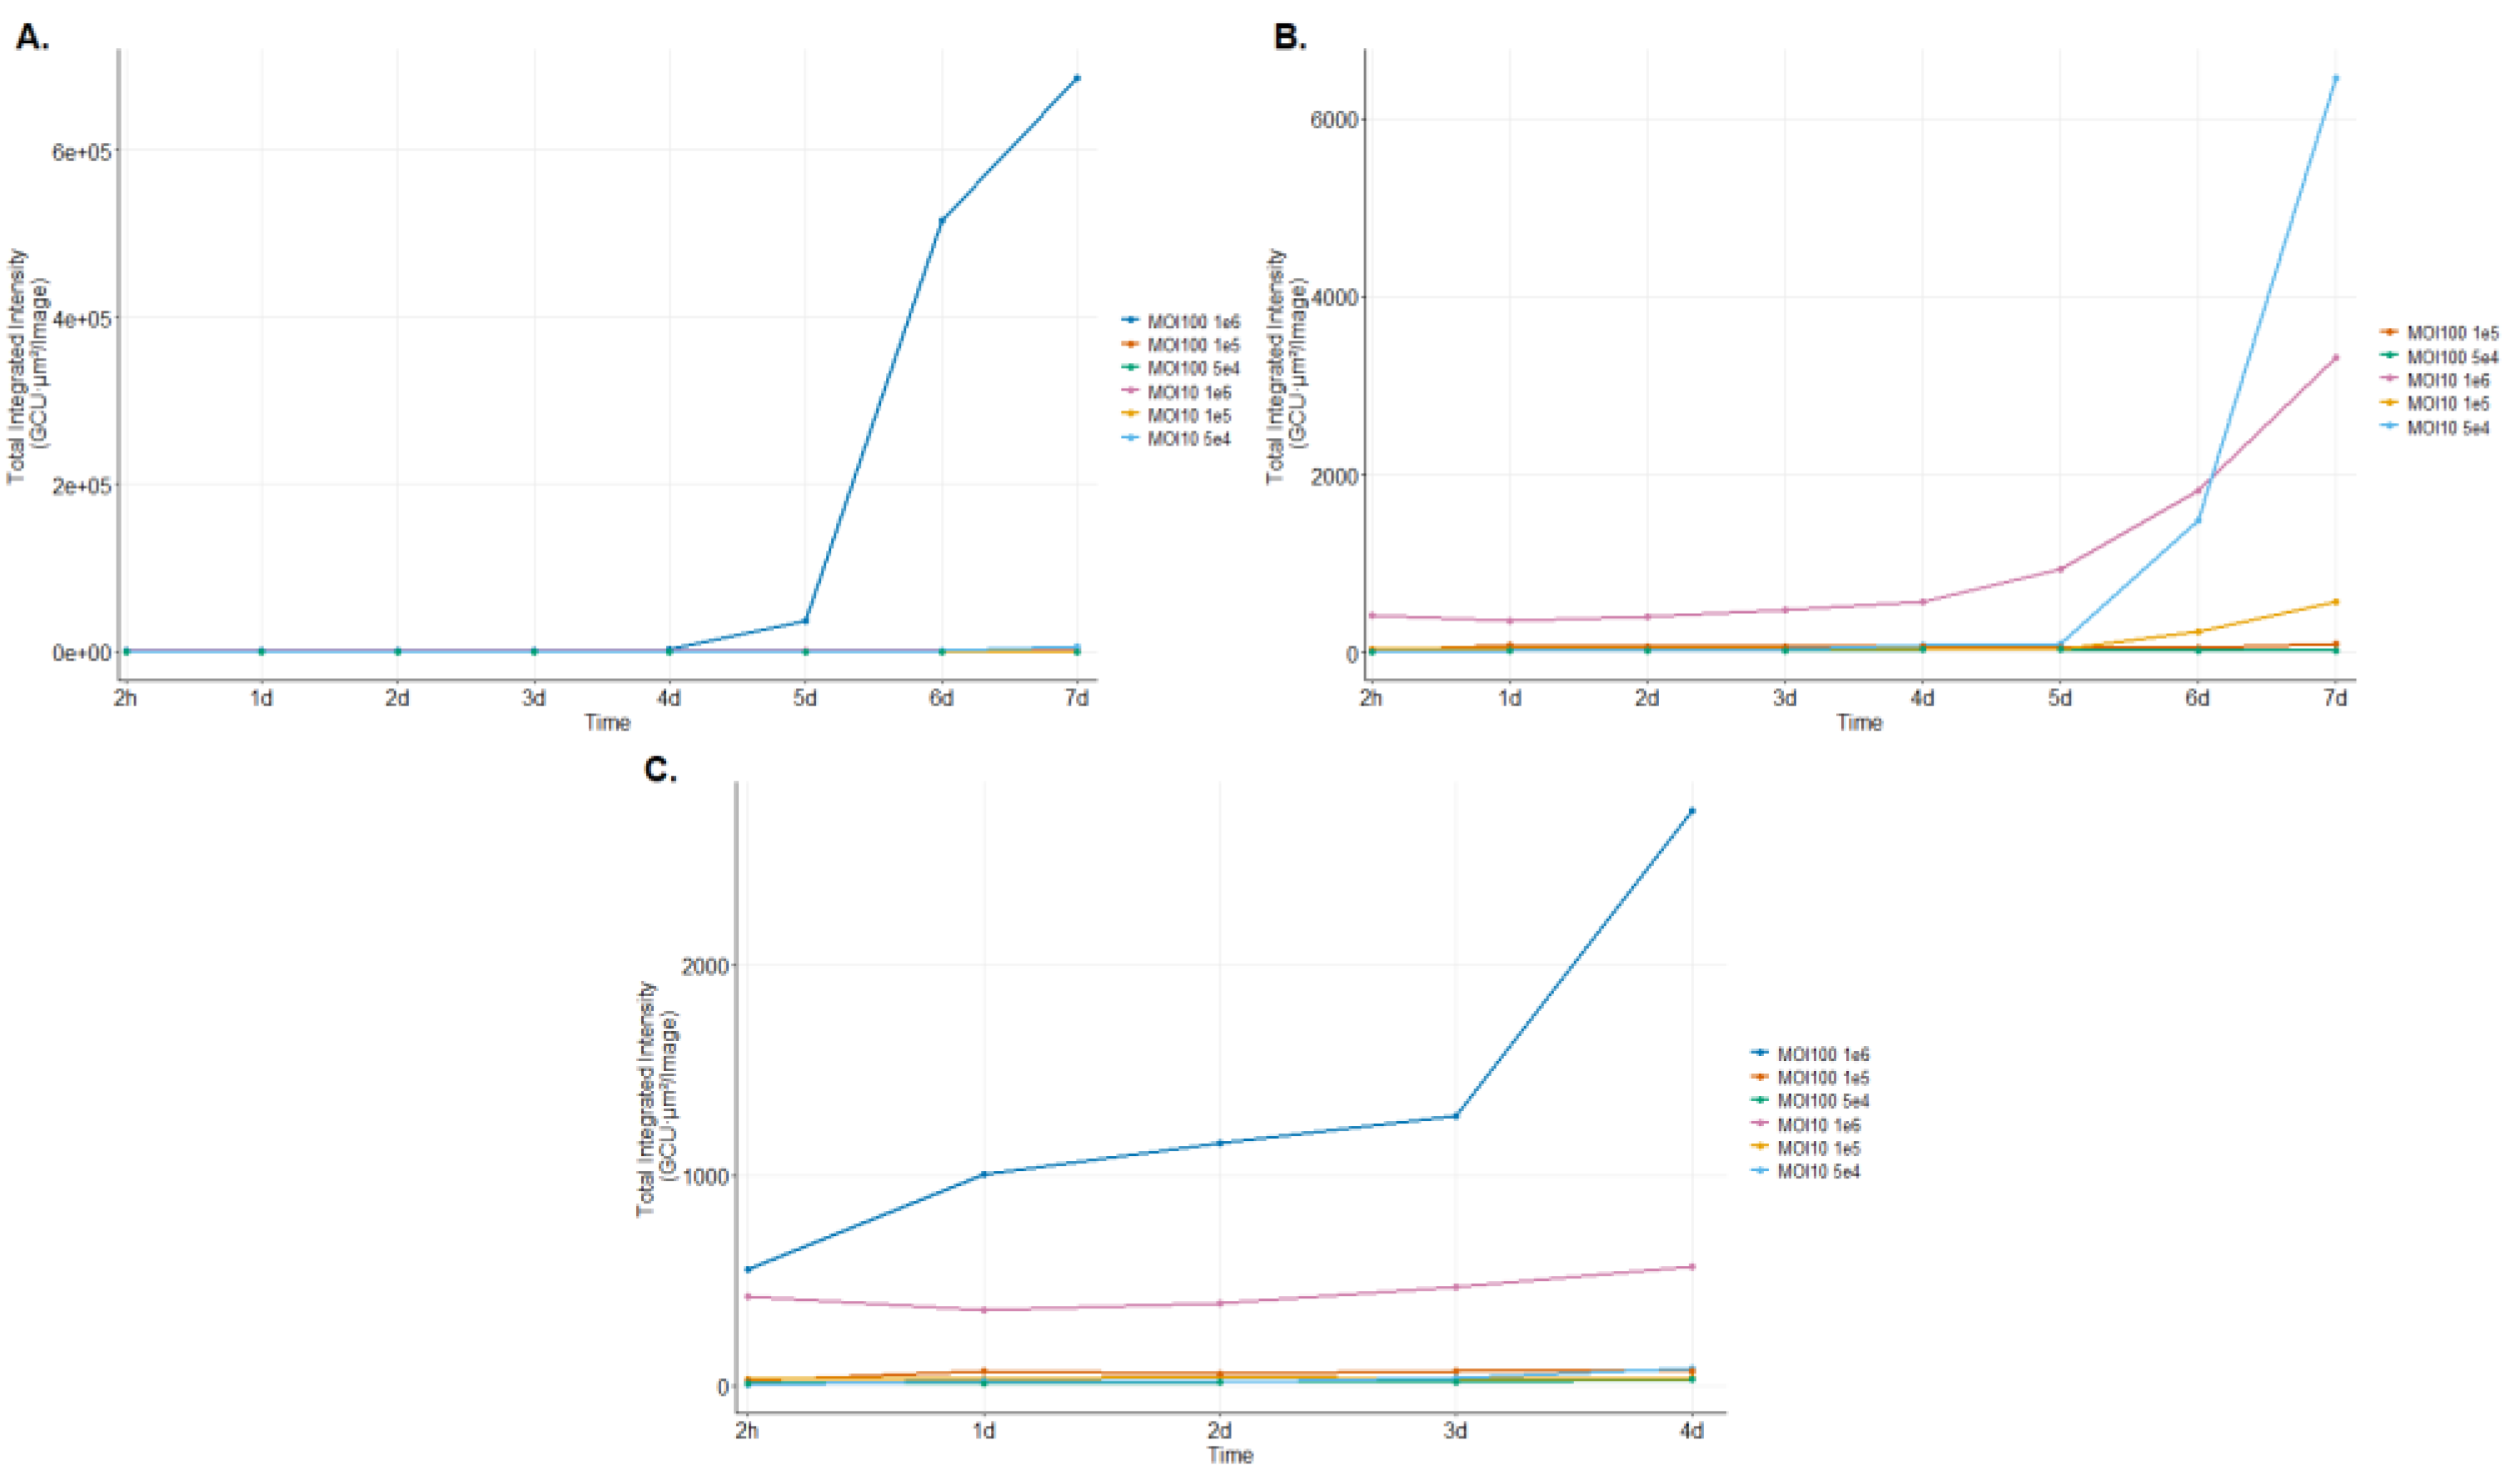
Figure 5.
Correlation between quantification of MAP-GFP measured by live-cell imaging and logCFUs calculated with the BACTEC MGIT™ 960 system. A. Serial 10-fold dilutions of a suspensions of MAP-GFP bacilli (McFarland standard of 1) were quantified by triplicate in the IncuCyte® and BACTEC-MGIT™ 960 system. A good correlation between fluorescence signal counts obtained in the IncuCyte® and CFUs calculated with BACTEC-MGIT™ 960 systems (r2 = 0.79) was obtained. B. Fluorescence of BOMAC cells (106 cells) infected with MAP-GFP at several MOIs (1:100, 1:50, 1:10, 1:5, 1:1, 1: 0.1, 1:1, and 1: 0.05) in triplicate were compared to logCFUs calculated with the BACTEC MGIT™ 960 system. A good correlation between fluorescence integrated intensity () measured in the IncuCyte® and logCFUs estimated in the BACTEC MGIT™ 960 system was obtained (r2 = 0.78).
Figure 5.
Correlation between quantification of MAP-GFP measured by live-cell imaging and logCFUs calculated with the BACTEC MGIT™ 960 system. A. Serial 10-fold dilutions of a suspensions of MAP-GFP bacilli (McFarland standard of 1) were quantified by triplicate in the IncuCyte® and BACTEC-MGIT™ 960 system. A good correlation between fluorescence signal counts obtained in the IncuCyte® and CFUs calculated with BACTEC-MGIT™ 960 systems (r2 = 0.79) was obtained. B. Fluorescence of BOMAC cells (106 cells) infected with MAP-GFP at several MOIs (1:100, 1:50, 1:10, 1:5, 1:1, 1: 0.1, 1:1, and 1: 0.05) in triplicate were compared to logCFUs calculated with the BACTEC MGIT™ 960 system. A good correlation between fluorescence integrated intensity () measured in the IncuCyte® and logCFUs estimated in the BACTEC MGIT™ 960 system was obtained (r2 = 0.78).
Disclaimer/Publisher’s Note: The statements, opinions and data contained in all publications are solely those of the individual author(s) and contributor(s) and not of MDPI and/or the editor(s). MDPI and/or the editor(s) disclaim responsibility for any injury to people or property resulting from any ideas, methods, instructions or products referred to in the content. |
© 2026 by the authors. Licensee MDPI, Basel, Switzerland. This article is an open access article distributed under the terms and conditions of the Creative Commons Attribution (CC BY) license (http://creativecommons.org/licenses/by/4.0/).
Copyright: This open access article is published under a Creative Commons CC BY 4.0 license, which permit the free download, distribution, and reuse, provided that the author and preprint are cited in any reuse.


