

Submitted:
29 July 2026
Posted:
30 July 2026
You are already at the latest version
Abstract
Microsatellite-stable (MSS) cancers comprise ~70% of patients but lack biomarkers to guide prognosis or therapy. Current metrics—TMB, CNV, and MSI—measure genomic instability quantity but discard sequence-context information encoding repair pathway activity. We developed the Trinucleotide Mutation Spectrum (TMS), a metric of mutation spectrum quality based on the proportional distribution of mutations across 192 trinucleotide pathways. Across 2,197 patients from four independent cohorts (TCGA-UCEC, COADREAD, STAD, and Chinese SYSUCC), TMS stratified MSS patients with hazard ratios of 7–17 in a cross-validated framework (200 iterations of 80/20 splits), ensuring that pathway selection and prognostic evaluation were performed on independent data splits. In colorectal and gastric cancers, TMS captured prognostic information beyond total mutation count and global CNV burden; in endometrial cancer, TMS primarily served as a sensitive readout of CNV-driven instability—demonstrating TMS's cancer-adaptive sensing properties. TMS-High and MSI-H were mutually exclusive (0–6.5% overlap), consistent with TMS weighting pathway-specific imbalances as risk signals and the near-uniform mutational landscape of MSI-H tumors, defining distinct CIN and MMR axes. TMS-High tumors exhibited differential chemotherapy resistance (5-FU 29× vs oxaliplatin 14×), suggesting clinical utility. TMS is computable from standard sequencing data at zero additional cost, offering an immediately deployable biomarker for MSS cancer stratification.
Keywords:
prognosis
; microsatellite-stable
; cancer
; trinucleotide mutation spectrum
Introduction
Genomic instability is a hallmark of cancer that drives tumor initiation, progression, and therapeutic resistance through diverse mechanisms including chromosomal instability (CIN), mismatch repair deficiency (MMR-d), and replication stress [1,2,3]. Yet despite its biological complexity, clinical measurement of genomic instability has been reduced to a handful of single-number metrics. Microsatellite instability (MSI) testing identifies MMR deficiency but applies to only 15–30% of patients depending on cancer type [4,5]. Tumor mutational burden (TMB) quantifies mutation count but discards the sequence context that encodes repair pathway activity [6,7]. Copy number variation (CNV) burden quantifies large-scale chromosomal alterations but is insensitive to the repair deficiencies that may precede or drive them [8]. These metrics share a fundamental limitation: they measure how much instability is present, not what kind of instability it is—and critically, whether the repair ecosystem is balanced or imbalanced. This limitation is most consequential in microsatellite-stable (MSS) cancers, comprising ~70% of patients across tumor types, where none of these biomarkers provides meaningful prognostic guidance [9,10].
The distribution of somatic mutations across trinucleotide sequence contexts is not random—it reflects the interplay between DNA damage processes and the efficiency of distinct repair pathways [11,12]. When a repair pathway is imbalanced—whether through deficiency, hyperactivation, or compensatory upregulation—mutations accumulate preferentially at the trinucleotide contexts it normally services, leaving a detectable footprint in the mutational spectrum [13,14]. Thus, the proportional distribution of point mutations across the 192 possible trinucleotide-by-base-change pathways—which we term the Trinucleotide Mutation Spectrum (TMS)—quantitatively reflects the functional state of the repair ecosystem. Unlike TMB, which collapses mutations into a single count and treats all mutations as equivalent, TMS preserves the sequence-context information that distinguishes repair pathway activity. Unlike CNV, which measures downstream chromosomal consequences, TMS reads the upstream repair state from the mutational record itself.
This distinction raises a fundamental question: If TMS can read repair ecosystem state from mutational patterns, does it capture dimensions of genomic instability that TMB and CNV miss? And how does a TMS-defined instability state relate to the well-established MSI-H phenotype—the one instance where a genomic instability biomarker has entered clinical practice? To answer these questions, we developed a framework to derive a prognostic index from TMS and tested it across three cancer types with substantial MSI-H fractions—endometrial (UCEC), colorectal (COADREAD), and gastric (STAD)—because MSI-H provides a known reference point for calibrating what TMS measures. We further validated our findings in an independent Chinese colorectal cohort (SYSUCC, N = 692).
We then asked: (1) Does TMS identify prognostic subgroups in MSS patients that are invisible to TMB and CNV? (2) What is the relationship between TMS-defined instability and the MSI-H reference point? and (3) What molecular features—repair proteome and immune microenvironment—distinguish TMS-defined groups, and are these features conserved or cancer-specific?
Results
TMS-Low and TMS-High Are Genomically Indistinguishable by TMB and CNV in Colorectal and Gastric Cancers
We computed TMS scores for each patient and divided them into Low, Medium, and High risk groups based on the tertiles of the TMS score distribution. We began by asking whether TMS-defined risk groups could be distinguished by existing quantity-based metrics of genomic instability—TMB and CNV burden. In MSS patients from TCGA-COADREAD and TCGA-STAD, TMS-Low and TMS-High groups showed extensive overlap in both TMB and CNV distributions (Figure 1a-b). In COADREAD, the standardized mean difference (SMD) between TMS-High and TMS-Low was 0.35 for TMB (fold-change = 1.19×) and 0.00 for CNV (fold-change = 1.11×) (Figure 1c-d). In STAD, the corresponding SMD values were 0.06 for TMB (fold-change = 1.26×) and −0.03 for CNV (fold-change = 0.98×). All effect sizes were below or near the conventional threshold for clinically meaningful difference (SMD < 0.2), with the exception of COADREAD TMB (SMD = 0.35), which nonetheless represented only a 1.19-fold difference in median TMB—a magnitude with no clinical relevance. MSI-H tumors, shown as reference, occupied a distinct genomic space characterized by high indel burden and low CNV, confirming that the assay had sufficient resolution to detect genomic differences when they existed.
Despite this genomic overlap, the prognostic separation between TMS-Low and TMS-High was dramatic. In COADREAD MSS patients, TMS-High had a 3-year event rate of 46.8% compared to 2.5% for TMS-Low (18.7-fold difference; HR = 17.64, 95% CI: 7.58–41.04, P = 2.75 × 10⁻¹¹; Figure 1e). In STAD MSS patients, the corresponding rates were 77.7% versus 20.1% (3.9-fold difference; HR = 7.30, 95% CI: 3.62–14.71, P = 2.66 × 10⁻⁸; Figure 1f). TMS-Medium patients showed intermediate event rates in both cohorts (COADREAD: 14.6%; STAD: 48.2%), establishing a clear gradient of risk across TMS tertiles (log-rank P for trend < 0.0001 for both). These data demonstrate that in colorectal and gastric cancers, TMS captures a quality dimension of genomic instability—defined by the balance of mutations across trinucleotide pathways—that is invisible to quantity-based metrics, and that this quality dimension has profound prognostic implications.
Notably, this dissociation between TMS-defined risk groups and CNV/TMB burden was specific to colorectal and gastric cancers. In endometrial cancer (UCEC), where chromosomal instability is the dominant driver of genomic instability, TMS-High was strongly associated with elevated CNV burden (SMD = 1.52) and reduced TMB (SMD = −0.93; Figure S1a–d), consistent with TMS primarily sensing CIN in this context. This cancer-specific behavior—TMS functioning as a flexible sensor that reads different dimensions of genomic instability depending on tissue context—was further explored in subsequent analyses.
To guard against overfitting and ensure generalizability, all TMS model training and evaluation were performed within a 200-iteration 80/20 stratified cross-validation framework, with complete model rebuilding (pathway selection, coefficient estimation, and tertile cutoff determination) on each training set and performance assessment on held-out test sets. This design ensured that the prognostic associations reported here reflect genuine signals rather than overfitting to the discovery cohorts.
TMS Provides Prognostic Information Beyond Total Mutation Count and Global CNV Burden
The cancer specificity of TMS pathway selection was evident when comparing the trinucleotide pathways selected across the three TCGA cohorts. Of 127 unique pathways selected, only 7 (5.5%) were shared across all three cancer types (Figure 2a). Pairwise Spearman correlations of pathway coefficients were low (UCEC-COAD: ρ = 0.090; UCEC-STAD: ρ = 0.255; COAD-STAD: ρ = 0.439), and directional concordance was approximately 50%—no better than random. This cancer specificity is not a limitation but a feature: TMS functions as an adaptive sensor, prioritizing the repair pathway imbalances most relevant to prognosis in each tissue context.
To test whether TMS captures prognostic information beyond total mutation quantity and global CNV burden—two established metrics of genomic instability—we performed multivariable Cox regression in each cohort, adjusting for TMB and CNV as covariates. In COADREAD MSS patients, TMS-High remained the strongest independent prognostic factor (HR = 8.77, 95% CI: 5.57–13.80, P = 5.94 × 10⁻²¹) after adjustment for age, sex, TMB, and CNV burden, while CNV and TMB were not independently prognostic (both P > 0.3; Figure 2b). When modeled as a continuous variable (per standard deviation), TMS remained independently prognostic across all four cohorts after adjustment for CNV, TMB, MSI status, and age: COADREAD (HR = 3.65, 95% CI: 2.93–4.55, P = 4.42 × 10⁻⁴⁴), UCEC (HR = 3.56, 95% CI: 2.38–5.31, P = 5.57 × 10⁻¹⁰), SYSUCC (HR = 2.76, 95% CI: 2.32–3.29, P = 5.05 × 10⁻³⁰), and STAD (HR = 2.10, 95% CI: 1.78–2.48, P = 3.72 × 10⁻¹⁸; Figure 2c). CNV lost independent prognostic significance after TMS adjustment in all cohorts (P > 0.15 for all). These results demonstrate that TMS captures prognostic information beyond total mutation count and global CNV burden. While TMS, TMB, and CNV are derived from the same sequencing data and reflect overlapping aspects of genomic instability, the multivariable analyses show that the mutational distribution—not just its quantity—contributes independently to prognosis. The larger HR for TMS-High (8.77) reflects the comparison between extreme tertiles (High vs Low), whereas the per-SD HR (3.65) represents the incremental risk per standard deviation increase in TMS score—a more conservative estimate; both were highly statistically significant.
To further test whether TMS provides information beyond mutation quantity, we evaluated TMS within TMB-Low patients—those in the lowest tertile of TMB, where TMB offers no discriminatory value. In COADREAD TMB-Low patients, TMS retained strong prognostic stratification (N = 162, events = 34, HR = 20.48, 95% CI: 4.82–87.05, P = 4.33 × 10⁻⁵; Figure 2d). Similarly, in STAD TMB-Low patients, TMS showed robust stratification (N = 108, events = 53, HR = 22.10, 95% CI: 6.57–74.35, P = 5.71 × 10⁻⁷; Figure 2e). The consistency of TMS's prognostic performance across TMB-Low subgroups confirms that TMS captures a quality dimension of genomic instability that operates independently of mutation quantity.
Consistent with these findings, TMS alone consistently outperformed CNV and TMB in model discrimination across all four cohorts (Figure 2f). In COADREAD, TMS achieved a C-index of 0.826, compared to 0.510 for CNV and 0.426 for TMB. In SYSUCC, TMS achieved 0.767, compared to 0.466 for CNV and 0.441 for TMB. The combined model (TMS + CNV + TMB + age) provided minimal incremental improvement over TMS alone (ΔC-index = 0.002–0.011), suggesting that the prognostic information captured by TMS is largely complementary to, and not redundant with, these quantity-based metrics.
TMS-High and MSI-H Define Two Mutually Exclusive Axes of Genomic Instability
The observation that TMS-High tumors in endometrial cancer were exclusively MSS prompted us to test whether this mutual exclusivity is conserved across cancer types. Across all three TCGA cohorts, TMS-High tumors were almost exclusively MSS: 0% MSI-H in UCEC, 0% in STAD, and 6.5% in COADREAD. This near-complete separation is primarily driven by the supervised nature of TMS modeling. TMS weights pathway-specific imbalances as risk signals associated with poor prognosis. MSI-H tumors, which carry favorable prognosis, exhibit near-uniform distribution of mutations across trinucleotide pathways—a consequence of genome-wide MMR deficiency—rather than the pathway-specific imbalances that TMS weights as risk signals. Consequently, MSI-H tumors are not assigned to TMS-High by the model. This methodological separation is consistent with the known dichotomy between CIN-driven and MMR-deficient instability programs [15,16,17], though it does not by itself prove biological incompatibility.
The mutational profiles of TMS-High and MSI-H tumors further distinguished these programs. MSI-H tumors showed dramatically elevated indel counts across all cohorts (median: COADREAD 266, STAD 302, UCEC 146, SYSUCC 171) compared to TMS-High (median: 3–4) and TMS-Low (median: 4–11), representing 36- to 100-fold higher indel burdens (Figure 3b; Wilcoxon P < 0.001 for MSI-H vs TMS-High in all cohorts). In contrast, TMS-High and TMS-Low showed overlapping indel distributions in COADREAD and STAD (P = 0.57 and P = 0.79, respectively), confirming that TMS-High is not a mild form of MMR deficiency but a fundamentally distinct genomic state.
The missense burden further separated these programs. MSI-H tumors exhibited 9- to 21-fold higher median missense counts compared to TMS-High (COADREAD: 781 vs 78, STAD: 718 vs 74, UCEC: 422 vs 45, SYSUCC: 719 vs 34; Figure 3c; all P < 0.001). TMS-High and TMS-Low showed overlapping missense distributions in COADREAD and STAD, consistent with the notion that TMS captures spectrum quality rather than mutation quantity. In the missense-indel landscape, TMS-High tumors clustered in the low-missense, low-indel region, while MSI-H tumors occupied the high-indel, low-missense region—a near-complete separation that confirms these two groups represent distinct mutational mechanisms (Figure 3d).
The prognostic contrast between these two programs was striking. Despite having much higher mutation burden, MSI-H patients had significantly better prognosis than TMS-High MSS patients in both COADREAD (3-year event rate: 21.0% vs 44.7%; Figure 3e) and STAD (35.8% vs 62.6%; Figure 3f). Taken together, these data establish a two-axis model of genomic instability (Figure 3g): the MMR axis (MSI-H), defined by indel-dominant hypermutation, low CNV, immune-hot tumors, and favorable prognosis; and the CIN/quality axis (TMS-High), defined by low mutation quantity but imbalanced mutation spectrum quality, high CNV (particularly in UCEC), immune-cold tumors, and poor prognosis. These axes are not merely distinct but biologically incompatible, reflecting synthetic lethal constraints during tumor evolution.
TMS-High and MSI-H Exhibit Divergent Repair Proteome and Immune Microenvironment Phenotypes with Cancer-Specific Patterns
The mutual exclusivity of TMS-High and MSI-H prompted us to investigate their molecular phenotypes. At the protein level, TMS-High and MSI-H showed divergent repair proteome patterns that varied by cancer type (Figure 4a-c). In COADREAD, TMS-High showed minimal differences from TMS-Low across most repair proteins, while MSI-H showed global MMR protein downregulation (MLH1, MSH2, MSH6, PMS2; all Z-score < −1.0) with compensatory HR upregulation (RAD51 Z-score = +1.13). In UCEC, TMS-High showed a distinct pattern: MMR proteins were upregulated (MSH2 Z-score = +1.15, MSH6 = +1.14), while HR proteins (BRCA2) and replication markers (PCNA) showed mixed patterns. MSI-H in UCEC showed the opposite pattern—MMR protein downregulation with KU80 upregulation—consistent with the known biology of MMR deficiency. STAD showed intermediate patterns, with TMS-High exhibiting MSH2 upregulation and 53BP1 downregulation. These data indicate that TMS-High is associated with cancer-specific repair proteome shifts rather than a universal DDR signature.
The immune microenvironment showed even more striking divergence. In COADREAD, a clear gradient emerged: MSI-H (hottest) > TMS-Low > TMS-High (coldest) across all immune signatures, including CD8+ T cells, cytolytic activity, IFN-γ response, checkpoints, NK cells, and T cells (Figure 4d). TMS-High showed the lowest scores across all immune measures, with the concurrent reduction of CD8+ T cells and checkpoint receptors (PDCD1, CTLA4) and unchanged PD-L1 (CD274)—a pattern consistent with T cell exclusion (immune desert) rather than T cell exhaustion [18].
In STAD, MSI-H remained the hottest across 6 of 7 immune signatures, consistent with the COADREAD pattern. However, TMS-High showed elevated CD8+ T cell signature (Z-score = +1.03), while TMS-Low showed the highest MHC-I expression (Z-score = +0.94; Figure 4e). This CD8+ T cell enrichment in STAD TMS-High tumors suggests that tissue context modulates the immune consequences of TMS-High. The difference between COADREAD and STAD was further illustrated by key immune markers: in COADREAD, TMS-High showed the lowest CD8A and PDCD1 expression with unchanged CD274; in STAD, these differences were less pronounced (Figure 4f). The immune-cold phenotype of TMS-High in COADREAD and UCEC has direct therapeutic implications: checkpoint inhibitors, which require pre-existing T cells, may be ineffective in these tumors, whereas DDR-targeted agents that could alleviate replication stress and potentially reverse immune exclusion may be more appropriate.
TMS-High Associates with Differential Chemotherapy Resistance and Defines a Clinically Actionable Axis in MSS Colorectal Cancer
In MSS patients who were candidates for adjuvant chemotherapy based on clinical guideline recommendations (SYSUCC Stage III–IV; TCGA-COAD Stage III), TMS-High had markedly elevated 3-year event rates compared to TMS-Low in both SYSUCC Stage III–IV patients (26.9% vs 3.4%, 7.9-fold difference) and TCGA-COAD Stage III patients (45.6% vs 3.2%, 14.4-fold difference; Figure 5a). TMS-Medium patients showed intermediate event rates (SYSUCC: 11.5%; TCGA-COAD: 14.5%), establishing a dose-response relationship between TMS score and chemotherapy failure.
To investigate the mechanistic basis of this resistance, we screened 273 compounds in 46 CRC cell lines from the GDSC2 database (; a summary of clinically relevant compounds is provided in Supplementary Table S10a). Spearman correlations between TMS score and IC50 exceeded 0.80 for all three drugs (5-FU: ρ = 0.928; oxaliplatin: ρ = 0.851; cisplatin: ρ = 0.809; Figure 5b), and Wilcoxon rank-sum tests confirmed significantly higher IC50 in TMS-High versus TMS-Low cells for all three drugs (5-FU: FC = 28.7×, P = 8.7×10⁻⁹; oxaliplatin: FC = 14.1×, P = 1.1×10⁻⁷; cisplatin: FC = 17.4×, P = 7.5×10⁻⁷; Figure 5c). Clinically relevant agents showed a clear hierarchy of resistance across the 273-compound screen: antimetabolites exhibited the highest resistance (gemcitabine 121×, 5-fluorouracil 28.7×), while platinum agents, while still showing significant resistance (14.1× for oxaliplatin, 17.4× for cisplatin), exhibited the least pronounced resistance among standard-of-care CRC agents, suggesting a potential relative benefit for platinum-based regimens in TMS-High patients (Figure 5d). Topoisomerase inhibitors (irinotecan 25.4×) and microtubule-targeting agents (docetaxel 60.5×, paclitaxel 27.1×) showed intermediate resistance. The drug-specific TMS models for 5-fluorouracil, oxaliplatin, and cisplatin each selected 8–13 trinucleotide pathways, with distinct pathway weight patterns between the antimetabolite and platinum agents (Supplementary Table S11). The full resistance spectrum across all 273 compounds is provided in . Due to the limited sample size (N=41–46 cell lines) and the exploratory nature of the cell line screen, these findings should be interpreted as hypothesis-generating and warrant prospective validation in larger panels or clinical cohorts.
Based on these findings, we propose a clinical decision pathway for MSS colorectal cancer patients (Figure 5e). TMS-Low patients—who have 3-year event rates below 5% with standard FOLFOX—may be candidates for treatment de-escalation to reduce toxicity. TMS-High patients—who have 3-year event rates of 27–46% with standard therapy—should be considered for intensified regimens (platinum-augmented) or enrollment in clinical trials of DDR-targeted agents. TMS is computable from existing whole-exome sequencing data at no additional cost, tissue consumption, or turnaround time, making it immediately deployable in the era of routine genomic profiling.
Discussion
This study establishes TMS as a systems-level sensor of genomic instability in MSS cancers across multiple tumor types. By capturing mutation spectrum quality—the proportional balance of mutations across trinucleotide pathways—TMS reveals a prognostic axis that is invisible to CNV, TMB, and MSI in colorectal and gastric cancers. TMS-Low and TMS-High MSS patients in these cancers are genomically indistinguishable by TMB and CNV (SMD < 0.2 in most comparisons), yet have diametrically opposed prognoses (HR=7–17) and fundamentally different molecular phenotypes. This disconnection between quantity-based metrics and clinical outcomes is not a technical limitation—it is a biological reality: CNV and TMB measure certain aspects of genomic instability, but they do not measure the functional state of the DNA repair ecosystem. TMS, by contrast, does—and it is this functional readout that drives prognosis. Importantly, all TMS models were built and evaluated under a rigorous cross-validation framework (200 iterations of 80/20 splits with complete model rebuilding per training set), ensuring that the observed prognostic associations reflect genuine biological signals rather than overfitting to the training data. The retention of TMS prognostic stratification in TMB-Low patients—where total mutation counts are lowest and TMS estimation inherently has lower signal-to-noise ratio—further underscores the robustness of the quality metric and its independence from mutation quantity.
The relationship between TMS and CNV is cancer-specific. In endometrial cancer, where chromosomal instability (CIN) is a dominant driver of genomic instability, TMS strongly correlated with CNV burden (ρ=0.59, SMD=1.52) and showed inverse association with TMB (SMD=−0.93; Figure S1a), indicating that TMS in this context primarily serves as a sensitive readout of CIN. This is consistent with the known biology of endometrial cancer, where copy number alterations are widespread and prognostic. In colorectal and gastric cancers, by contrast, TMS and CNV showed minimal correlation (COAD: ρ=0.00; STAD: ρ=−0.03; Figure 1b,d). In these cancers, TMS captures a distinct dimension of genomic instability—a repair ecosystem imbalance that is not reflected in total CNV burden or mutation count. This cancer-specific adaptive sensing is a feature of TMS, not a limitation: the metric functions as a flexible sensor that reads the state of the repair ecosystem through the lens of each cancer type's dominant instability mechanism.
Whether TMS recapitulates or complements established mutational signatures, such as homologous recombination deficiency or APOBEC-associated signatures, remains an open question. However, unlike signature deconvolution—which decomposes spectra into etiologic components—TMS directly integrates survival-weighted pathway information into a single prognostic index, providing a clinically interpretable metric rather than multiple mechanistic exposures.
The near-complete separation of TMS-High and MSI-H (0–6.5% overlap across cancer types)—defining the CIN axis (quantified by TMS-High) and the MMR axis (MSI-H)—is primarily explained by the supervised nature of TMS modeling. Because TMS is a supervised model trained to identify mutation spectrum patterns associated with poor prognosis, it weights pathway-specific imbalances as risk signals. MSI-H tumors, which carry favorable prognosis, exhibit near-uniform distribution of mutations across the 192 trinucleotide pathways—a signature of genome-wide MMR deficiency—rather than the pathway-specific imbalances that TMS weights as risk signals. Consequently, MSI-H tumors are not assigned to TMS-High by the model, independent of any underlying biological incompatibility.
Beyond this methodological explanation, the near-complete separation also reflects a genuine biological distinction. MSI-H tumors are characterized by indel-dominant hypermutation and immune recognition, whereas TMS-High MSS tumors show low mutation burden, CNV-driven instability, and immune exclusion—representing fundamentally distinct genomic states. The uniform mutational landscape of MMR deficiency does not produce the pathway-specific repair imbalances that define the CIN/quality axis. Whether this biological distinction also reflects synthetic lethal constraints during tumor evolution—where simultaneous CIN and MMR deficiency would be catastrophic—remains a plausible but unproven hypothesis that warrants experimental investigation. Simultaneous CIN and MMR deficiency would likely be catastrophic: CIN generates DNA damage requiring repair, while MMR deficiency compromises the machinery needed to resolve it. Tumors are forced to choose between two viable evolutionary paths—tolerate CIN with DDR upregulation 17, or tolerate MMR deficiency without CIN.
The cancer-specific nature of TMS pathway selection—only 5.5% of pathways shared across cancer types—further supports the adaptive sensor model. TMS functions as an adaptive sensor, prioritizing the repair pathway imbalances most relevant to prognosis in each tissue context. This flexibility explains why TMS consistently outperforms CNV across all cancer types: it captures incipient or non-CNV repair dysfunction that precedes or operates independently of large-scale chromosomal alterations. In endometrial cancer, TMS primarily senses CIN (ρ=0.59 with CNV). In colorectal and gastric cancers, where TMS-CNV correlation is weaker, TMS captures additional dimensions of repair pathway imbalance—including HR downregulation, DDR kinase activation, and replication stress—that are not fully reflected in copy number alterations.
The immunological consequences of TMS-High are also cancer-specific. In colorectal and endometrial cancers, TMS-High tumors are immune-cold with T cell exclusion (reduced CD8A/B, PDCD1, CTLA4; unchanged CD274)—an immune desert phenotype with direct therapeutic implications: checkpoint inhibitors, which require pre-existing T cells, are unlikely to be effective, whereas DDR-targeted agents may be more appropriate based on the repair proteome alterations associated with TMS-High—a hypothesis that warrants prospective testing. In gastric cancer, TMS-High shows elevated CD8+ T cell signature, suggesting that tissue-specific factors (potentially EBV-associated immune activation) may override the TMS-High immune signal. This heterogeneity is not a limitation but a feature—it demonstrates that TMS is a flexible sensor that reads the functional state of the repair ecosystem through the lens of each cancer type's mutational and immunological landscape.
The clinical implications are direct. TMS is computable from existing whole-exome sequencing data at no additional cost, tissue consumption, or turnaround time. A practical workflow would be: (1) standard MSI testing identifies ~15–30% of patients as immunotherapy candidates; (2) for the MSS majority, TMS stratifies patients into low-risk (TMS-Low, potential for treatment de-escalation) and high-risk (TMS-High, candidates for intensified therapy or DDR inhibitor trials). This parallel, orthogonal use of TMS does not disrupt existing workflows and requires no additional infrastructure. In colorectal cancer, the differential resistance to 5-fluorouracil (29×) versus oxaliplatin (14×) suggests that TMS-High patients may benefit from platinum-intensified regimens (e.g., FOLFOXIRI) or non-antimetabolite-containing platinum doublets, a hypothesis that now warrants prospective testing.
Limitations
Several limitations should be acknowledged. First, all cohorts are retrospective; prospective validation in clinical trial cohorts is essential. TMS was trained to predict prognosis (survival) in retrospective cohorts, not to predict treatment response directly. While the drug sensitivity associations provide mechanistic support for differential chemotherapy sensitivity, prospective trials with treatment assignment are required to validate TMS as a predictive biomarker for therapy selection rather than a prognostic biomarker for natural history. Second, TMS was derived from whole-exome sequencing; whether whole-genome sequencing improves TMS performance remains to be determined. Third, while the SYSUCC cohort provides independent validation in a Chinese population, it is limited to colorectal cancer; cross-population validation in gastric and endometrial cancers is needed. Fourth, the functional consequences of TMS-associated repair alterations were inferred from expression data rather than directly measured; experimental perturbation studies are needed to establish causality. Fifth, the specific trinucleotide pathways and optimal P-thresholds varied across cohorts, reflecting both biological and technical differences; standardization of TMS training protocols will be important for clinical deployment. Sixth, the mechanistic interpretation of cancer-specific immune phenotypes remains speculative, and the drug sensitivity analyses were performed in a limited set of 46 colorectal cancer cell lines. The high Spearman correlations (ρ > 0.80) and significant IC50 differences (FC = 14–29×) support the association between TMS and drug sensitivity, but these findings should be interpreted as exploratory. Due to the limited sample size (N=41–46 cell lines), the drug-specific TMS models are underdetermined and require validation in larger cell line panels (e.g., PRISM, DepMap) or clinical cohorts before any therapeutic recommendations can be made. Seventh, TMS, TMB, and CNV are derived from the same whole-exome sequencing data and reflect overlapping aspects of genomic instability. The multivariable analyses presented here are intended to demonstrate that mutation spectrum quality provides prognostic information beyond total mutation count and CNV level, not to claim biological independence of these interrelated metrics. Eighth, while the mutual exclusivity of TMS-High and MSI-H is empirically robust, its primary driver is methodological: TMS is a supervised model that weights pathway-specific imbalances as risk signals, and MSI-H tumors—with their favorable prognosis and uniform mutational distributions—are not assigned to TMS-High by the model. Whether additional biological incompatibilities, such as synthetic lethal constraints between CIN and MMR deficiency, further contribute to this mutual exclusivity remains a secondary hypothesis requiring experimental testing rather than a proven mechanism.
Conclusions
TMS provides a cancer-adaptive framework for genomic instability in MSS cancers, functioning as a flexible sensor that reads distinct dimensions of genomic instability depending on tissue context: in colorectal and gastric cancers, TMS captures a quality dimension independent of CNV and TMB; in endometrial cancer, TMS primarily serves as a sensitive readout of CNV-driven CIN. Across cancer types, TMS defines two mutually exclusive axes—CIN-driven (TMS-High/CNV-High) and MMR-deficient (MSI-H)—with the separation driven in part by the supervised nature of TMS modeling and further reflecting divergent clinical outcomes. TMS fills the biomarker void in MSS disease, the majority population where no molecular biomarker currently guides therapy, and is immediately deployable from existing sequencing data. Prospective validation in biomarker-stratified trials is the essential next step toward clinical implementation.
Methods
- Study Design and Data Sources
This study employed a multi-cohort discovery-validation design to develop and validate the Trinucleotide Mutation Spectrum (TMS) as a prognostic biomarker across multiple cancer types. The discovery cohorts comprised three datasets from The Cancer Genome Atlas (TCGA): uterine corpus endometrial carcinoma (UCEC, N = 527), colon and rectal adenocarcinoma (COADREAD, N = 572), and stomach adenocarcinoma (STAD, N = 420). The validation cohort comprised 692 Chinese colorectal cancer patients from Sun Yat-sen University Cancer Center (SYSUCC). Whole-exome sequencing (WES), copy number variation (CNV), RNA-seq, and clinical data for TCGA cohorts were obtained from the NCI Genomic Data Commons (dbGaP Study Accession: phs000178). SYSUCC WES and clinical data were obtained from cBioPortal (crc_sysucc_2022). MSI status for TCGA cohorts was obtained from cBioPortal PanCancer Atlas clinical data (MSI_SCORE_MANTIS > 0.6 defined as MSI-H); for SYSUCC, MSI status was obtained from the original study's clinical annotations. All cohorts included patients with available WES data, survival outcomes, and MSI status. Patient characteristics are summarized in .
In vitro drug sensitivity validation was performed using 46 colorectal cancer cell lines from the Genomics of Drug Sensitivity in Cancer (GDSC2) database (https://www.cancerrxgene.org/), with somatic mutation data from the COSMIC Cell Lines Project and copy number data from WES-based PureCN analysis. Drug sensitivity screening covered 273 compounds across 46 CRC cell lines.
- TMS Matrix Construction and Score Calculation
- Pathway Definition
The Trinucleotide Mutation Spectrum (TMS) is defined as the proportional distribution of somatic missense mutations across 192 trinucleotide-by-base-change pathways. Each pathway is defined by the trinucleotide context (5′-flanking base, reference base, 3′-flanking base) and the specific base change (reference → alternative). For each patient, somatic missense mutations were extracted from WES data and assigned to one of 192 pathways. Pathway proportions were calculated as the percentage of total missense mutations assigned to each pathway per patient. Only patients with at least 10 missense mutations were included in the analysis to ensure reliable proportional estimation.
- Center Log-Ratio Transformation
To address the compositional nature of the data and accommodate pathways with zero observed mutations, we applied an epsilon-adjusted center log-ratio (CLR) transformation. A small constant (ε = 0.5) was added to all pathway counts before re-normalization to 100%. The CLR transformation was then applied:
where is the proportion of mutations in pathway , and is the geometric mean of all pathway proportions for that patient. This transformation maps the 192-dimensional compositional data from the simplex to unconstrained real space, enabling standard statistical methods including Cox regression.
- Model Training
For each cohort independently, we performed univariate Cox regression on each of the 192 CLR-transformed pathway proportions against the primary survival endpoint (PFS for UCEC, OS for COADREAD and STAD, DFS for SYSUCC). Pathways passing a pre-specified P-value threshold were selected via systematic sweep (P = 0.01 to P = 1.00, step 0.01), with the constraint that the number of selected features must not exceed half the number of events to limit overfitting. The optimal P-value threshold was determined by maximizing the concordance index (C-index) in the training cohort. TMS scores were calculated as the Cox coefficient-weighted sum of selected CLR-transformed pathway proportions:
where is the set of selected pathways, is the Cox regression coefficient for pathway , and is the proportion of mutations in pathway for patient . Patients were classified into Low, Medium, and High TMS groups by tertile of the TMS score distribution within each cohort. For the SYSUCC validation cohort, the TMS model was trained de novo using the identical supervised Cox regression framework, providing validation of the TMS methodology rather than a fixed set of cohort-specific parameters.
TMS scores are cohort-relative risk scores; their absolute values are not directly comparable across datasets. The TMS tertile classification (Low/Medium/High) is derived from the score distribution within each cohort, serving as a relative risk stratification tool rather than an absolute biological measurement. For cross-population validation, TMS models were trained de novo on each cohort using the identical supervised framework, validating the methodology rather than any fixed set of parameters.
- Drug-Specific TMS Models for GDSC
For each drug, features were selected from the 192 CLR-transformed pathways using either Lasso regression (lambda.min) or BIC stepwise regression, with the method that retained more features selected for each drug. Final TMS weights were estimated using Ridge regression (L2-penalized) with 5-fold cross-validated lambda selection. Cell lines were classified into three equal-sized groups by tertile of the drug-specific TMS score. Differences in LN_IC50 between the lowest and highest tertiles were assessed using two-sided Student's t-test.
- Copy Number Variation Analysis
For TCGA cohorts, GISTIC 2.0 discrete copy-number calls were obtained from cBioPortal. The fraction of genome altered (FGA) was calculated as the percentage of genes with copy number ≠ 2. For GDSC cell lines, WES-based PureCN total copy number data were used, and FGA was calculated analogously at the gene level. CNV burden was compared across TMS tertiles using one-way analysis of variance (ANOVA). For bidirectional analysis, CNV-High and CNV-Low groups were defined by median split of CNV burden, and TMS scores were compared between groups using two-sided Student's t-test.
- Indel and Missense Quantification
Indel counts were obtained from WES data by counting frameshift insertions, frameshift deletions, in-frame insertions, and in-frame deletions per patient. For the GDSC cell line analysis, missense and indel mutations were extracted from the COSMIC Cell Lines Project mutation data. Missense counts were calculated as the total number of missense mutations per patient or cell line. The Missense-Indel landscape was visualized as scatter plots of Missense counts versus Indel counts, with quadrants defined by median Missense and median Indel values.
- RNA-seq and Immune Signature Analysis
RNA-seq data (z-score normalized) were obtained from TCGA. For UCEC, RSEM-normalized counts were also used for independent validation of immune marker expression. DNA repair gene expression was analyzed for 17 key genes spanning mismatch repair (MLH1, MSH2, MSH6, PMS2), homologous recombination (BRCA1, BRCA2, RAD51), DNA damage response kinases (ATM, ATR, CHEK1, CHEK2, PRKDC), base excision repair (PARP1, XRCC1), and replication (PCNA). Immune signatures were calculated as the mean z-score of constituent genes for CD8 T cells (CD8A, CD8B), T cells (CD3D, CD3E, CD2), cytolytic activity (GZMA, GZMB, PRF1), IFN-γ response (IFNG, STAT1, CXCL9, CXCL10), checkpoints (PDCD1, CD274, CTLA4, LAG3, HAVCR2), MHC class I (HLA-A, HLA-B, HLA-C, B2M), MHC class II (HLA-DRA, HLA-DRB1, HLA-DPA1, HLA-DPB1), and NK cells (KLRK1, NCR1, NCR3). Group comparisons used Wilcoxon rank-sum test with Benjamini-Hochberg correction for multiple testing.
- RPPA
- Protein Analysis
Reverse-phase protein array (RPPA) data for TCGA cohorts were obtained from the NCI Genomic Data Commons. Protein abundance values for 15 DNA repair-related proteins were analyzed. Group comparisons of protein abundance between TMS-High, TMS-Low, and MSI-H groups used Wilcoxon rank-sum test. Proteins were grouped by functional pathways: MMR (MLH1, MSH2, MSH6, PMS2), homologous recombination (BRCA2, RAD51), DDR kinases (ATM, ATR, CHK1, CHK2), and replication/repair (PARP1, PCNA, RAD50, KU80, 53BP1).
- Pathway Overlap and Cross-Cancer Validation
The overlap of selected trinucleotide pathways across cancer types was assessed using Fisher's exact test against the null hypothesis of random selection from the 192 possible pathways. Spearman correlation of pathway coefficients between cancer pairs was calculated for all 192 pathways to assess cross-cancer concordance. For leave-one-cancer-out cross-validation, TMS models trained on one cancer type were applied to other cancer types using locked pathway weights and tertile cutoffs, with performance assessed by C-index and HR for TMS-High versus TMS-Low.
- Cross-Validation
Cross-validation was performed with 200 iterations of 80/20 stratified splits to assess the stability and reproducibility of the TMS modeling pipeline. Unlike approaches that apply fixed models to held-out data, our method evaluated the total uncertainty of the entire modeling framework. In each iteration, the cohort was randomly split into training (80%) and test (20%) sets, stratified by the gold standard TMS tertile classification. The complete TMS pipeline—including epsilon-adjusted CLR transformation, univariate Cox regression screening, optimal P-value threshold selection by systematic sweep (0.01–1.00, step 0.01, maximizing the C-index with the constraint that selected features must not exceed half the number of events), Cox coefficient estimation, TMS score calculation, and tertile cutoff determination—was rebuilt from scratch using only the training set. The trained model was then applied to the held-out test set to calculate hazard ratios (HR, High vs Low TMS tertile) and to predict TMS scores for each test set patient.
Extreme Risk Identification Accuracy (ERIA) was calculated on the test set as the proportion of patients in the gold standard extreme TMS tertiles (Low and High) that were correctly reclassified by the cross-validation model relative to the full-cohort gold standard classification:
where the gold standard was defined as the TMS tertile classification from the full-sample optimal model (trained on all patients with the same P-sweep optimization procedure). ERIA > 50% indicates better-than-random classification reproducibility.
TMS score reproducibility was assessed by the coefficient of determination (R²) between gold standard TMS scores (full-sample model) and cross-validation predicted TMS scores (test set predictions pooled across all iterations). R² > 0.5 was considered indicative of acceptable TMS score stability across data splits.
Overfitting was quantified as Δ = C-index_train - C-index_gold, where C-index_train is the mean concordance index on the training sets across all CV iterations and C-index_gold is the concordance index of the full-sample gold standard model. Δ < 0.03 was considered evidence of minimal overfitting. Δ values close to zero indicate that the model performs as well on training data as on the full dataset, confirming no overfitting. Positive Δ values (0.005–0.012) represent the minimal performance gap expected from sampling variability.
HR values exceeding 100 were filtered to avoid convergence artifacts from iterations where the TMS Low group in the test set had zero or near-zero events. The distributions of these metrics across the 200 iterations were used to assess model stability, with narrow distributions and high ERIA values indicating robust and reproducible performance.
- Statistical Analysis
All statistical analyses were performed in R v4.3.0 using the survival package for Cox proportional hazards regression, glmnet for regularized regression, and caret for stratified data partitioning. Center log-ratio transformation was implemented directly following Aitchison's formulation. Survival analyses used Kaplan-Meier estimates with log-rank tests for between-group comparisons and Cox proportional hazards regression for continuous and multivariate analyses. The proportional hazards assumption was verified using Schoenfeld residuals. Multivariate models included all specified covariates without stepwise selection. Model discrimination was assessed using Harrell's concordance index (C-index).
- Clinical Subgroup Definitions
- Chemotherapy-Treated Patients
For the SYSUCC cohort, patients with Stage III–IV disease were classified as the chemotherapy-treated group based on clinical guidelines recommending adjuvant chemotherapy for Stage III and palliative chemotherapy for Stage IV colorectal cancer. For the TCGA-COAD cohort, Stage III patients were classified as the chemotherapy-treated group based on guidelines recommending adjuvant FOLFOX for Stage III disease. All chemotherapy analyses were restricted to MSS patients to evaluate TMS performance in the biomarker-void population where MSI provides no discriminatory value. Actual chemotherapy receipt was inferred from stage rather than individual treatment records (a limitation of this retrospective analysis); future validation in cohorts with documented treatment records is needed.
- TMB and CNV Subgroups
TMB tertiles were defined within each cohort using the 33rd and 67th percentiles of the TMB distribution. CNV tertiles were similarly defined using the fraction of genome altered (FGA) distribution. Subgroup analyses were restricted to patients in the lowest tertile (TMB-Low or CNV-Low) to evaluate TMS performance in genomically stable tumors where existing biomarkers provide no discriminatory value.
- Data
- and Code Availability
All TCGA data are publicly available through the NCI Genomic Data Commons (https://portal.gdc.cancer.gov/). SYSUCC data are available through cBioPortal (https://www.cbioportal.org/study/summary?id=crc_sysucc_2022). GDSC2 data are available at https://www.cancerrxgene.org/. All analysis code and processed data are available at https://doi.org/10.6084/m9.figshare.33107129. The repository includes scripts for TMS construction, survival analysis, cross-validation, drug sensitivity analysis, CNV analysis, and figure generation.
- Ethics Approval
The SYSUCC cohort data were obtained from cBioPortal (crc_sysucc_2022), originally published by Wang et al. in Nature Communications (2022;13:2342). The original study was approved by the IRB of Sun Yat-sen University Cancer Center, with written informed consent from all patients. TCGA and CPTAC data are publicly available through the NCI Genomic Data Commons and exempt from additional ethics review. GDSC cell line data are from the Genomics of Drug Sensitivity in Cancer project; all cell lines are commercially available and do not require ethics approval.

Table 1.
Cohort characteristics *.
| Characteristic | TCGA-UCEC | TCGA-COADREAD | TCGA-STAD | SYSUCC-CRC |
|---|---|---|---|---|
| Patients (total) | 513 | 572 | 420 | 692 |
| Patients (MSS) | 398 | 452 | 325 | 627 |
| MSI-H (%) | 22.2% | 12.0% | 17.2% | 9.4% |
| Age (median) | 64 | 67 | 67 | — |
| OS events | 83 | 122 | 167 | — |
| DFS events | — | — | — | 140 |
| Endpoint | PFS | OS | OS | DFS |
| TMS C-index (MSS) | 0.733 | 0.816 | 0.726 | 0.767 |
| TMS features | 55 | 49 | 77 | 70 |
| Optimal P | 0.10 | 0.25 | 0.35 | 0.34 |
| Sequencing | WES | WES | WES | WES |
| Population | Western | Western | Western | Chinese |
* Cross-validation performance on full cohorts (including MSI-H patients) is reported in Supplementary Table S4.
Supplementary Materials
The following supporting information can be downloaded at the website of this paper posted on Preprints.org.
Author Contributions
C.X. conceived the study, developed the TMS methodology, performed all analyses, and wrote the manuscript. Y.X. contributed to software development and data processing. Both authors reviewed and approved the final manuscript.
Data Availability Statement
TCGA data (UCEC, COADREAD, STAD) are publicly available through the NCI Genomic Data Commons (https://portal.gdc.cancer.gov/). SYSUCC colorectal cancer data are available through cBioPortal (https://www.cbioportal.org/study/summary?id=crc_sysucc_2022). GDSC2 drug sensitivity data are available at https://www.cancerrxgene.org/. RPPA data for TCGA cohorts are available through the NCI Genomic Data Commons. All data analyzed in this study are from public sources and are fully described in the Methods. No new sequencing data were generated.
Conflicts of Interest
The authors declare no competing interests.
Acknowledgments
The authors thank the patients and investigators of The Cancer Genome Atlas (TCGA) Research Network, the Sun Yat-sen University Cancer Center (SYSUCC), and the Genomics of Drug Sensitivity in Cancer (GDSC) project for making their data publicly available. This research was conducted independently without specific funding.
Code Availability
All analysis code, including TMS construction, survival analysis, cross-validation, drug sensitivity analysis, CNV analysis, and figure generation, is available at https://doi.org/10.6084/m9.figshare.33107129. The repository includes detailed instructions for reproducing all analyses and figures.
Patent Application
The methods and systems described herein are the subject of a pending PCT international patent application (Application No.: PCT/CN2026/112587, filed on July 22, 2026).
Patent Application
This work is the subject of a PCT international patent application (Application No.: PCT/CN2026/112587, filed on July 22, 2026).
References
- Hanahan, D.; Weinberg, R. A. Hallmarks of cancer: the next generation. Cell 2011, 144, 646–674. [Google Scholar] [CrossRef] [PubMed]
- Negrini, S.; Gorgoulis, V. G.; Halazonetis, T. D. Genomic instability—an evolving hallmark of cancer. Nat. Rev. Mol. Cell Biol. 2010, 11, 220–228. [Google Scholar] [CrossRef] [PubMed]
- Macheret, M.; Halazonetis, T. D. DNA replication stress as a hallmark of cancer. Annu. Rev. Pathol. 2015, 10, 425–448. [Google Scholar] [CrossRef] [PubMed]
- Le, D. T.; et al. PD-1 blockade in tumors with mismatch-repair deficiency. N. Engl. J. Med. 2015, 372, 2509–2520. [Google Scholar] [CrossRef] [PubMed]
- Bonneville, R.; et al. Landscape of microsatellite instability across 39 cancer types. JCO Precis. Oncol. 2017, 1–15. [Google Scholar] [CrossRef] [PubMed]
- Samstein, R. M.; et al. Tumor mutational load predicts survival after immunotherapy across multiple cancer types. Nat. Genet. 2019, 51, 202–206. [Google Scholar] [CrossRef] [PubMed]
- Chan, T. A.; et al. Development of tumor mutation burden as an immunotherapy biomarker. Ann. Oncol. 2019, 30, 44–56. [Google Scholar] [CrossRef] [PubMed]
- Hieronymus, H.; et al. Tumor copy number alteration burden is a pan-cancer prognostic factor associated with recurrence and death. eLife 2018, 7, e37294. [Google Scholar] [CrossRef] [PubMed]
- Murali, R.; Soslow, R. A.; Weigelt, B. Evolving roles of histologic evaluation and molecular/genomic profiling in the management of endometrial cancer. J. Natl. Compr. Canc. Netw. 2018, 16, 201–209. [Google Scholar] [CrossRef] [PubMed]
- Dienstmann, R.; et al. Consensus molecular subtypes and the evolution of precision medicine in colorectal cancer. Nat. Rev. Cancer 2017, 17, 79–92. [Google Scholar] [CrossRef] [PubMed]
- Alexandrov, L. B.; et al. Signatures of mutational processes in human cancer. Nature 2013, 500, 415–421. [Google Scholar] [CrossRef] [PubMed]
- Helleday, T.; Eshtad, S.; Nik-Zainal, S. Mechanisms underlying mutational signatures in human cancers. Nat. Rev. Genet. 2014, 15, 585–598. [Google Scholar] [CrossRef] [PubMed]
- Alexandrov, L. B.; et al. The repertoire of mutational signatures in human cancer. Nature 2020, 578, 94–101. [Google Scholar] [CrossRef] [PubMed]
- Volkova, N. V.; et al. Mutational signatures are jointly shaped by DNA damage and repair. Nat. Commun. 2020, 11, 2169. [Google Scholar] [CrossRef] [PubMed]
- Brady, S. W.; Gout, A. M.; Zhang, J. Therapeutic and prognostic insights from the analysis of cancer mutational signatures. Trends Genet. 2022, 38, 137–151. [Google Scholar] [CrossRef] [PubMed]
- Vlachavas, E. I.; Pilalis, E.; Papadodima, O.; Kafatos, G. Molecular profiling and therapeutic implications of microsatellite-stable colorectal cancer. Mol. Oncol. 2025, 19, 1123–1141. [Google Scholar]
- Ma, J.; Shi, H.; Wang, Y. Mutational and copy number signatures in cancer: a comprehensive review. Comput. Struct. Biotechnol. J. 2024, 23, 1234–1247. [Google Scholar]
- Lu, Y.; Li, S.; Chen, J.; Wang, X. Prognostic and immunological differences between microsatellite instability-high and microsatellite-stable colorectal cancer. Oncol. Lett. 2024, 27, 215. [Google Scholar]
Figure 1.
TMS-Low and TMS-High Are Genomically Indistinguishable by TMB and CNV in Colorectal and Gastric Cancers. (a-b) Scatter plots of TMB (a) and CNV burden (FGA; b) versus indel count in MSS patients from TCGA-COADREAD and TCGA-STAD. TMS tertiles are shown in blue (Low), gray (Medium), and red (High), with sample sizes (n) annotated. TMS-Low, Medium, and High groups overlap extensively, indicating TMS-defined risk groups are not separable by mutation quantity or CNV burden. (c-d) Boxplots of TMB (c) and CNV (d) across TMS tertiles. Standardized mean differences (SMD) and fold-changes (FC) between TMS-High and TMS-Low are annotated. Negligible effect sizes (all SMD < 0.2, except COADREAD TMB SMD = 0.35) confirm that TMB and CNV do not explain TMS's prognostic separation. (e-f) Kaplan-Meier curves for COADREAD (e, N=447) and STAD (f, N=301) MSS patients. HR (High vs Low) and log-rank P are shown. Three-year event rates: COADREAD: Low 2.5%, Medium 14.6%, High 46.8%; STAD: Low 20.1%, Medium 48.2%, High 77.7%. TMS provides strong, graded prognostic stratification in both cancers.
Figure 1.
TMS-Low and TMS-High Are Genomically Indistinguishable by TMB and CNV in Colorectal and Gastric Cancers. (a-b) Scatter plots of TMB (a) and CNV burden (FGA; b) versus indel count in MSS patients from TCGA-COADREAD and TCGA-STAD. TMS tertiles are shown in blue (Low), gray (Medium), and red (High), with sample sizes (n) annotated. TMS-Low, Medium, and High groups overlap extensively, indicating TMS-defined risk groups are not separable by mutation quantity or CNV burden. (c-d) Boxplots of TMB (c) and CNV (d) across TMS tertiles. Standardized mean differences (SMD) and fold-changes (FC) between TMS-High and TMS-Low are annotated. Negligible effect sizes (all SMD < 0.2, except COADREAD TMB SMD = 0.35) confirm that TMB and CNV do not explain TMS's prognostic separation. (e-f) Kaplan-Meier curves for COADREAD (e, N=447) and STAD (f, N=301) MSS patients. HR (High vs Low) and log-rank P are shown. Three-year event rates: COADREAD: Low 2.5%, Medium 14.6%, High 46.8%; STAD: Low 20.1%, Medium 48.2%, High 77.7%. TMS provides strong, graded prognostic stratification in both cancers.
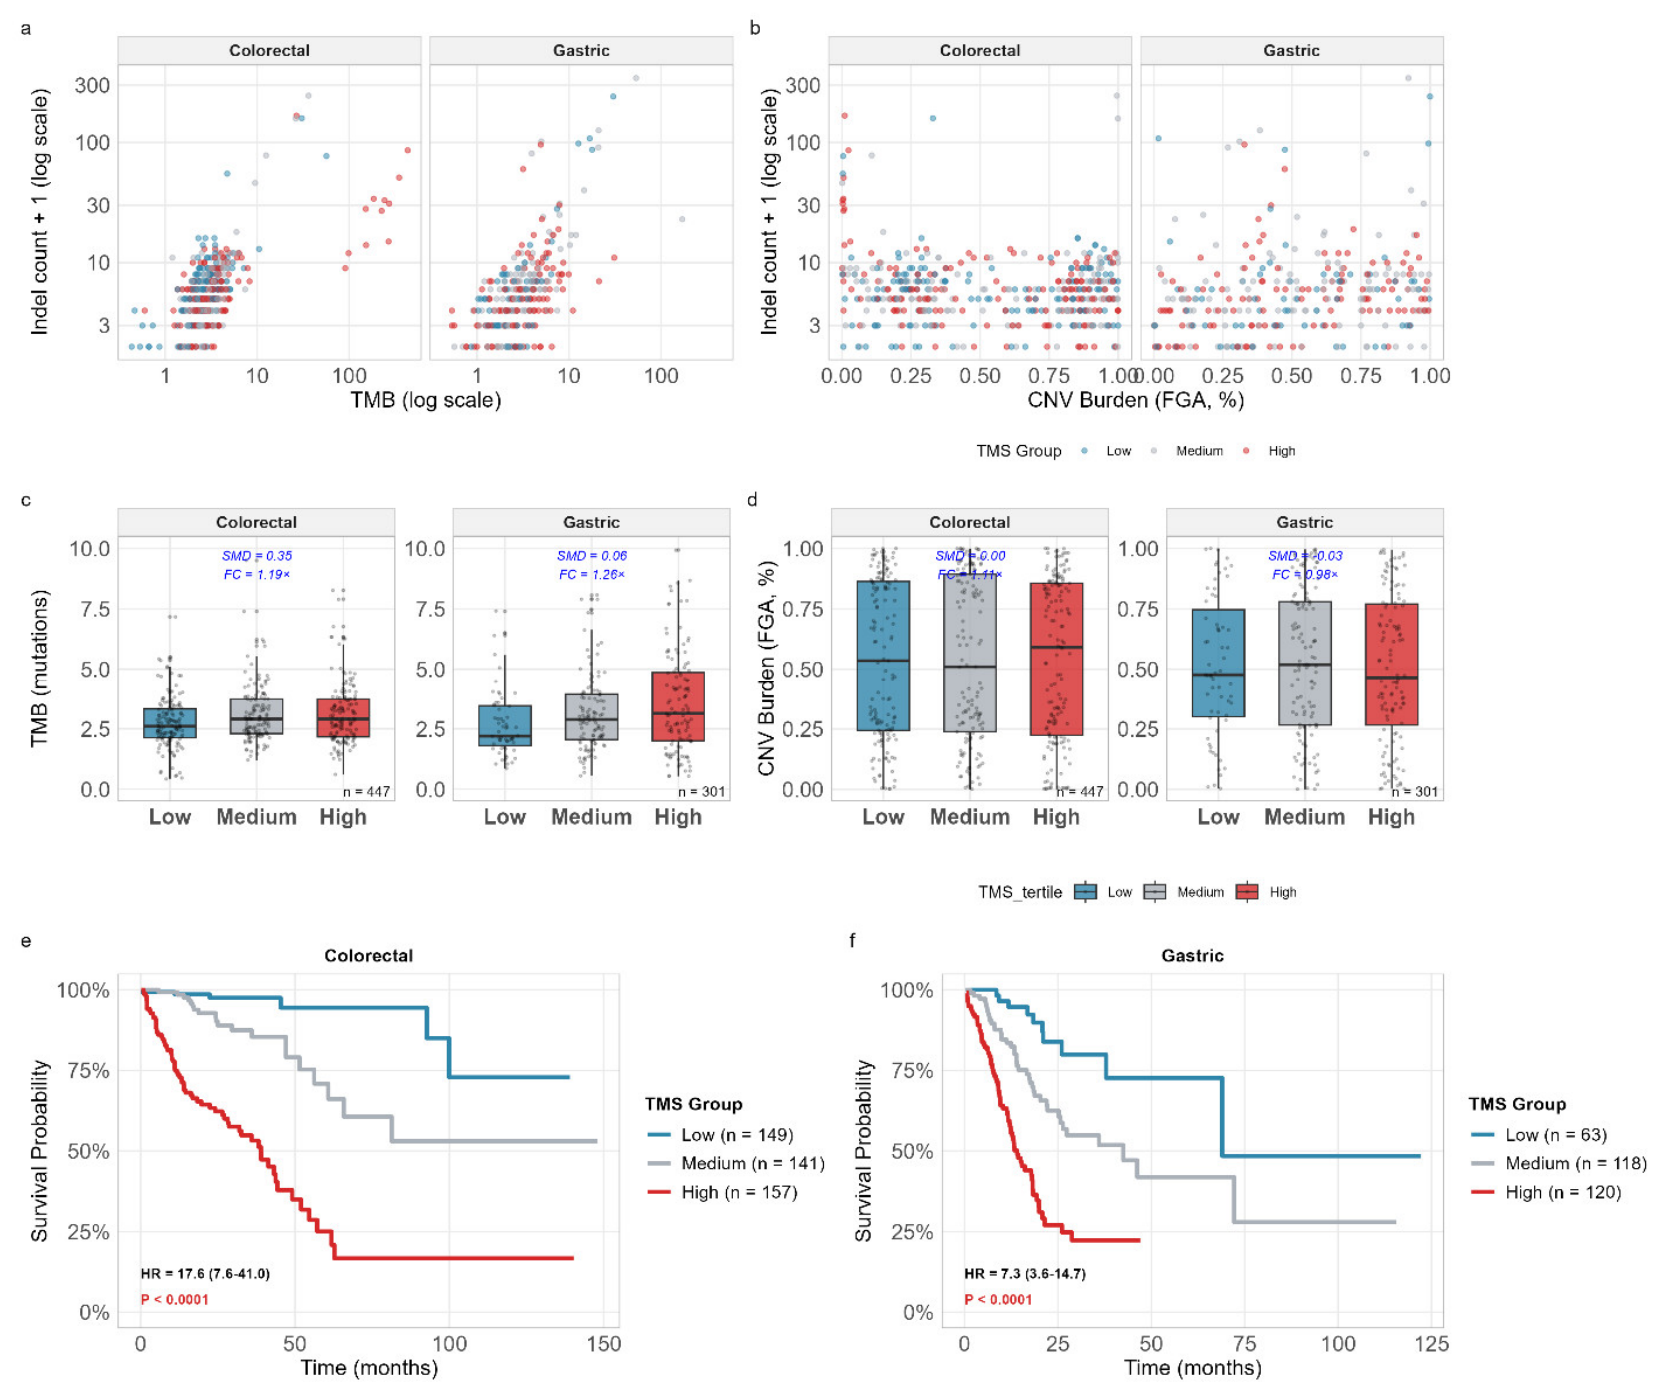
Figure 2.
TMS Defines a Cancer-Adaptive Prognostic Axis Beyond Total Mutation Count and CNV Burden. (a) Venn diagram showing the overlap of trinucleotide pathways selected by TMS in three TCGA cohorts (UCEC, COADREAD, and STAD). Only 7 of 127 unique pathways (5.5%) were shared across all three cancer types, demonstrating that TMS pathway selection is highly cancer-specific rather than universal. The small overlap indicates that TMS functions as a cancer-adaptive sensor, prioritizing different repair pathway imbalances in each tissue context. (b) Forest plot of multivariable Cox regression analysis in COADREAD MSS patients (n = 476, events = 103). Model adjusted for TMS-High (High vs Low), age, sex, TMB, and CNV burden (FGA). TMS-High was the strongest independent prognostic factor (HR = 8.77, 95% CI: 5.57–13.80, P < 0.0001), while other clinical and genomic variables showed no significant independent association with survival. Point size represents −log₁₀(P-value); error bars represent 95% confidence intervals. (c) Forest plot of TMS per standard deviation (SD) across four independent cohorts (COADREAD, STAD, UCEC, SYSUCC), adjusted for CNV, TMB, and age. TMS remained strongly prognostic in all cohorts with HRs ranging from 2.10 to 3.65 per SD after adjustment for TMB and CNV. This demonstrates that the mutational distribution captured by TMS provides prognostic information beyond what is reflected in total mutation count or global CNV burden. (d) Kaplan-Meier curves for COADREAD MSS patients in the TMB-Low subgroup (lowest tertile of TMB). Despite having low mutation burden, TMS tertiles (Low, Medium, High) show clear prognostic stratification with a significant gradient of risk. Hazard ratios (HR) for TMS-High versus TMS-Low and log-rank P-values are shown. This demonstrates that TMS provides prognostic information independent of TMB, even in patients with low mutation burden where TMB offers no discriminatory value. (e) Kaplan-Meier curves for STAD MSS patients in the TMB-Low subgroup (lowest tertile of TMB). Similar to COADREAD, TMS tertiles provide significant prognostic stratification in TMB-Low patients, confirming that TMS captures a quality dimension of genomic instability that is independent of mutation quantity. HR for TMS-High versus TMS-Low and log-rank P-values are shown. (f) Bar plot comparing model discrimination (C-index) across four cohorts for four models: TMS alone, CNV alone, TMB alone, and a combined model (TMS + CNV + TMB + Age). TMS alone showed stronger discrimination than CNV or TMB alone across all cohorts. The combined model (TMS + CNV + TMB) provided only modest improvement over TMS alone (ΔC-index = 0.002–0.011), suggesting that the prognostic information captured by TMS is largely complementary to these quantity-based metrics.
Figure 2.
TMS Defines a Cancer-Adaptive Prognostic Axis Beyond Total Mutation Count and CNV Burden. (a) Venn diagram showing the overlap of trinucleotide pathways selected by TMS in three TCGA cohorts (UCEC, COADREAD, and STAD). Only 7 of 127 unique pathways (5.5%) were shared across all three cancer types, demonstrating that TMS pathway selection is highly cancer-specific rather than universal. The small overlap indicates that TMS functions as a cancer-adaptive sensor, prioritizing different repair pathway imbalances in each tissue context. (b) Forest plot of multivariable Cox regression analysis in COADREAD MSS patients (n = 476, events = 103). Model adjusted for TMS-High (High vs Low), age, sex, TMB, and CNV burden (FGA). TMS-High was the strongest independent prognostic factor (HR = 8.77, 95% CI: 5.57–13.80, P < 0.0001), while other clinical and genomic variables showed no significant independent association with survival. Point size represents −log₁₀(P-value); error bars represent 95% confidence intervals. (c) Forest plot of TMS per standard deviation (SD) across four independent cohorts (COADREAD, STAD, UCEC, SYSUCC), adjusted for CNV, TMB, and age. TMS remained strongly prognostic in all cohorts with HRs ranging from 2.10 to 3.65 per SD after adjustment for TMB and CNV. This demonstrates that the mutational distribution captured by TMS provides prognostic information beyond what is reflected in total mutation count or global CNV burden. (d) Kaplan-Meier curves for COADREAD MSS patients in the TMB-Low subgroup (lowest tertile of TMB). Despite having low mutation burden, TMS tertiles (Low, Medium, High) show clear prognostic stratification with a significant gradient of risk. Hazard ratios (HR) for TMS-High versus TMS-Low and log-rank P-values are shown. This demonstrates that TMS provides prognostic information independent of TMB, even in patients with low mutation burden where TMB offers no discriminatory value. (e) Kaplan-Meier curves for STAD MSS patients in the TMB-Low subgroup (lowest tertile of TMB). Similar to COADREAD, TMS tertiles provide significant prognostic stratification in TMB-Low patients, confirming that TMS captures a quality dimension of genomic instability that is independent of mutation quantity. HR for TMS-High versus TMS-Low and log-rank P-values are shown. (f) Bar plot comparing model discrimination (C-index) across four cohorts for four models: TMS alone, CNV alone, TMB alone, and a combined model (TMS + CNV + TMB + Age). TMS alone showed stronger discrimination than CNV or TMB alone across all cohorts. The combined model (TMS + CNV + TMB) provided only modest improvement over TMS alone (ΔC-index = 0.002–0.011), suggesting that the prognostic information captured by TMS is largely complementary to these quantity-based metrics.
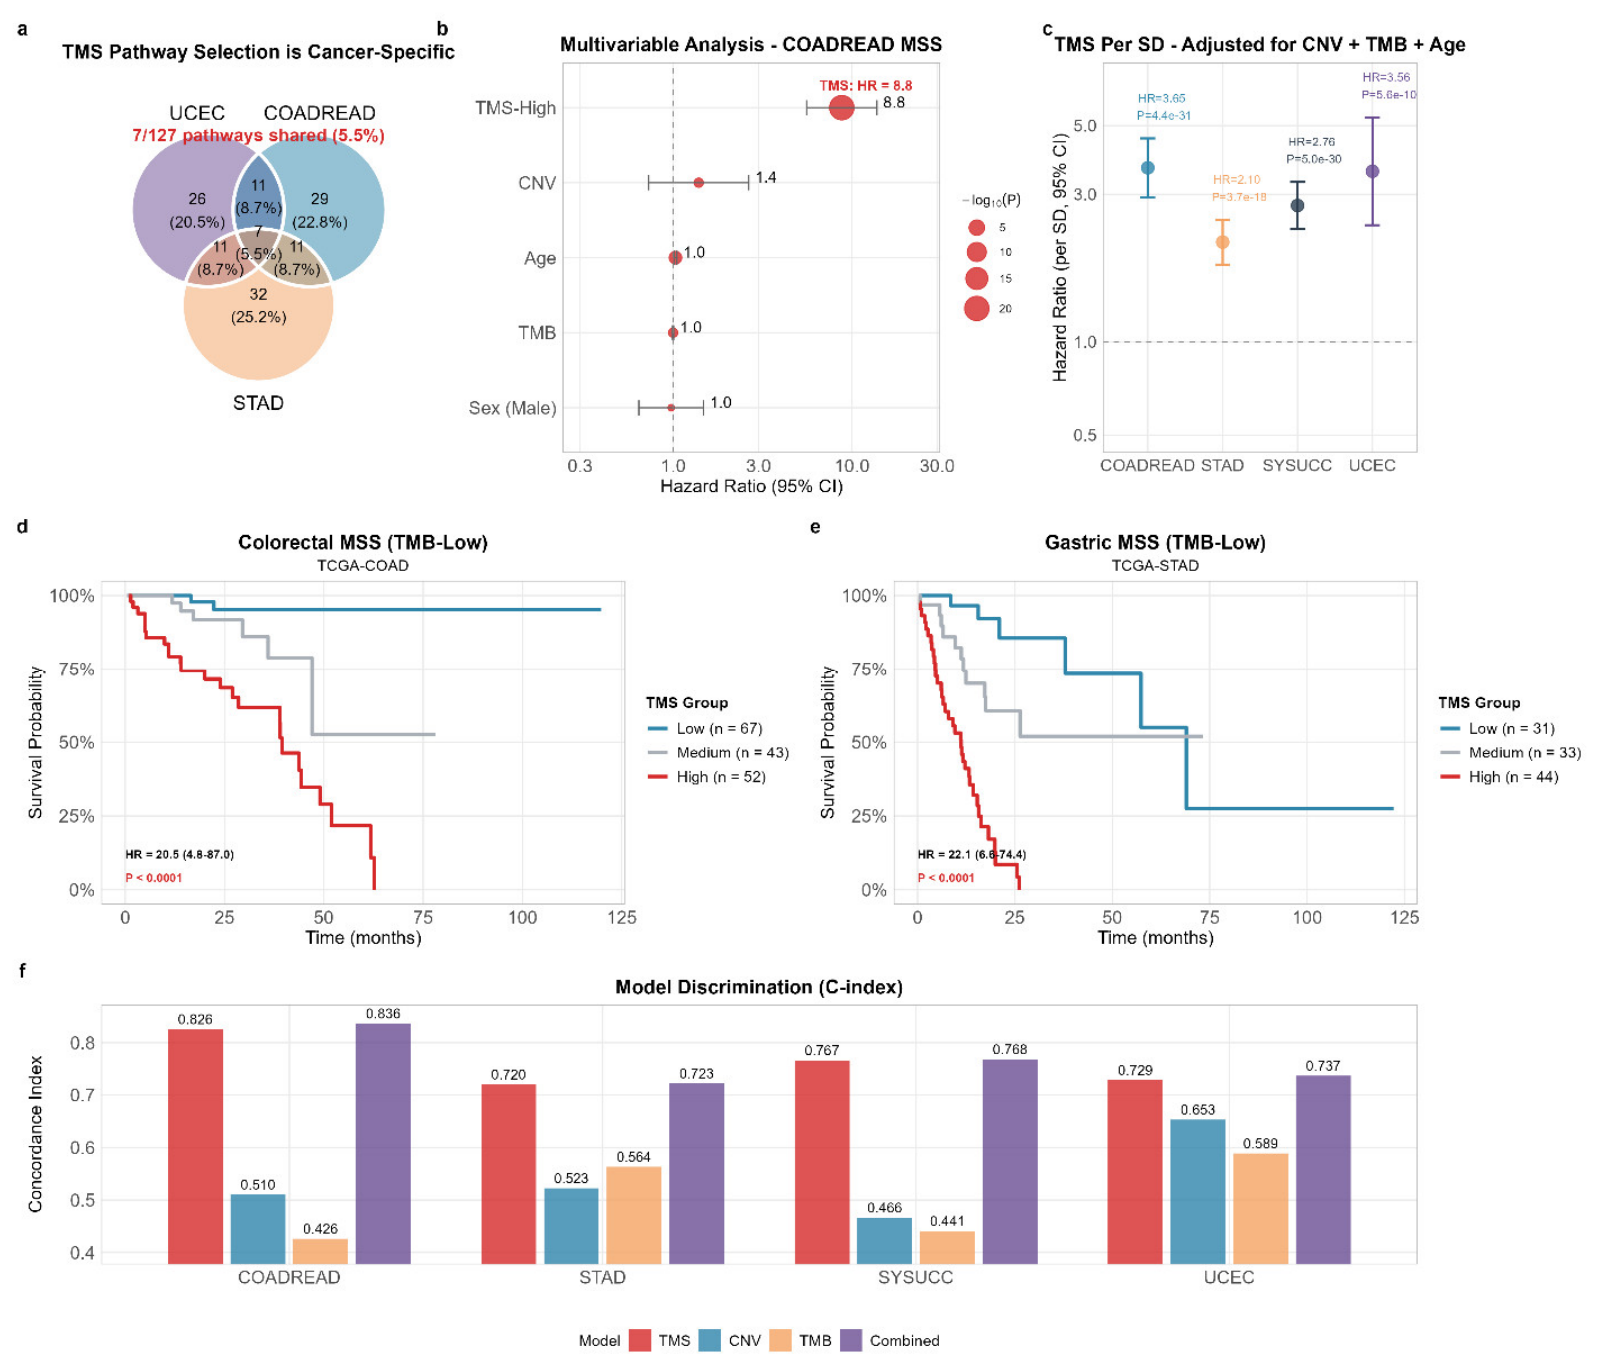
Figure 3.
TMS-High and MSI-H Define Two Mutually Exclusive Axes of Genomic Instability. (a) Cross-tabulation showing the distribution of MSI-H (red) and MSS (blue) patients across TMS tertiles (Low, Medium, High) in three TCGA cohorts (UCEC, COADREAD, and STAD). TMS-High tumors are almost exclusively MSS across all cancer types: UCEC (0% MSI-H), STAD (0% MSI-H), and COADREAD (6.5% MSI-H). Fisher's exact test P < 0.001 for all cohorts. Numbers within bars represent patient counts. This demonstrates that TMS-High and MSI-H are mutually exclusive genomic instability programs. (b) Boxplots comparing Indel burden (log scale) across three groups—MSI-H, TMS-High (MSS), and TMS-Low (MSS)—in four cohorts (UCEC, COADREAD, STAD, and SYSUCC). MSI-H tumors show dramatically elevated Indel counts compared to both TMS-High and TMS-Low, with 36- to 100-fold higher median Indel burdens (all P < 0.001). TMS-High and TMS-Low show overlapping Indel distributions (P = 0.57-0.79 for COADREAD and STAD), confirming that TMS-High is not a "mild" form of MMR deficiency but a fundamentally distinct genomic state. Sample sizes (n) are annotated above each box. (c) Boxplots comparing Missense burden (log scale) across the same three groups (MSI-H, TMS-High, TMS-Low) in four cohorts. MSI-H tumors exhibit 9- to 21-fold higher median Missense counts compared to TMS-High (P < 0.001 for all comparisons). TMS-High and TMS-Low show overlapping Missense distributions in most cohorts, further demonstrating that the TMS signal is not driven by mutation quantity. Sample sizes (n) are annotated above each box. (d) Kaplan-Meier curves comparing overall survival between MSI-H (red) and TMS-High (orange, MSS) patients in TCGA-COAD. MSI-H patients have significantly better prognosis (3-year event rate: 21.0%) compared to TMS-High MSS patients (3-year event rate: 44.7%). Hazard ratios (HR) and log-rank P-values are shown. Sample sizes are annotated: MSI-H n = 62, TMS-High n = 170. (e) Kaplan-Meier curves comparing overall survival between MSI-H (red) and TMS-High (orange, MSS) patients in TCGA-STAD. MSI-H patients have better prognosis (3-year event rate: 35.8%) compared to TMS-High MSS patients (3-year event rate: 62.6%). HR and log-rank P-values are shown. Sample sizes are annotated: MSI-H n = 67, TMS-High n = 131. (f) Conceptual two-axis model of genomic instability. The MMR axis (red, left/top) is defined by indel-dominant hypermutation, low CNV, immune-hot tumors, and favorable prognosis (MSI-H). The TMS axis (orange, right/bottom) is defined by low mutation quantity but imbalanced mutation spectrum quality, high CNV (particularly in UCEC), immune-cold tumors, and poor prognosis (TMS-High). The dashed line indicates that these two axes are mutually exclusive (0-7% overlap across cancer types), reflecting the distinct mutational mechanisms and repair states of the CIN axis (quantified by TMS-High) versus the MMR axis (MSI-H). MSI-H tumors exhibit uniform mutational distributions across trinucleotide pathways—which TMS does not weight as risk signals—whereas TMS-High tumors are characterized by pathway-specific imbalances associated with poor prognosis.
Figure 3.
TMS-High and MSI-H Define Two Mutually Exclusive Axes of Genomic Instability. (a) Cross-tabulation showing the distribution of MSI-H (red) and MSS (blue) patients across TMS tertiles (Low, Medium, High) in three TCGA cohorts (UCEC, COADREAD, and STAD). TMS-High tumors are almost exclusively MSS across all cancer types: UCEC (0% MSI-H), STAD (0% MSI-H), and COADREAD (6.5% MSI-H). Fisher's exact test P < 0.001 for all cohorts. Numbers within bars represent patient counts. This demonstrates that TMS-High and MSI-H are mutually exclusive genomic instability programs. (b) Boxplots comparing Indel burden (log scale) across three groups—MSI-H, TMS-High (MSS), and TMS-Low (MSS)—in four cohorts (UCEC, COADREAD, STAD, and SYSUCC). MSI-H tumors show dramatically elevated Indel counts compared to both TMS-High and TMS-Low, with 36- to 100-fold higher median Indel burdens (all P < 0.001). TMS-High and TMS-Low show overlapping Indel distributions (P = 0.57-0.79 for COADREAD and STAD), confirming that TMS-High is not a "mild" form of MMR deficiency but a fundamentally distinct genomic state. Sample sizes (n) are annotated above each box. (c) Boxplots comparing Missense burden (log scale) across the same three groups (MSI-H, TMS-High, TMS-Low) in four cohorts. MSI-H tumors exhibit 9- to 21-fold higher median Missense counts compared to TMS-High (P < 0.001 for all comparisons). TMS-High and TMS-Low show overlapping Missense distributions in most cohorts, further demonstrating that the TMS signal is not driven by mutation quantity. Sample sizes (n) are annotated above each box. (d) Kaplan-Meier curves comparing overall survival between MSI-H (red) and TMS-High (orange, MSS) patients in TCGA-COAD. MSI-H patients have significantly better prognosis (3-year event rate: 21.0%) compared to TMS-High MSS patients (3-year event rate: 44.7%). Hazard ratios (HR) and log-rank P-values are shown. Sample sizes are annotated: MSI-H n = 62, TMS-High n = 170. (e) Kaplan-Meier curves comparing overall survival between MSI-H (red) and TMS-High (orange, MSS) patients in TCGA-STAD. MSI-H patients have better prognosis (3-year event rate: 35.8%) compared to TMS-High MSS patients (3-year event rate: 62.6%). HR and log-rank P-values are shown. Sample sizes are annotated: MSI-H n = 67, TMS-High n = 131. (f) Conceptual two-axis model of genomic instability. The MMR axis (red, left/top) is defined by indel-dominant hypermutation, low CNV, immune-hot tumors, and favorable prognosis (MSI-H). The TMS axis (orange, right/bottom) is defined by low mutation quantity but imbalanced mutation spectrum quality, high CNV (particularly in UCEC), immune-cold tumors, and poor prognosis (TMS-High). The dashed line indicates that these two axes are mutually exclusive (0-7% overlap across cancer types), reflecting the distinct mutational mechanisms and repair states of the CIN axis (quantified by TMS-High) versus the MMR axis (MSI-H). MSI-H tumors exhibit uniform mutational distributions across trinucleotide pathways—which TMS does not weight as risk signals—whereas TMS-High tumors are characterized by pathway-specific imbalances associated with poor prognosis.
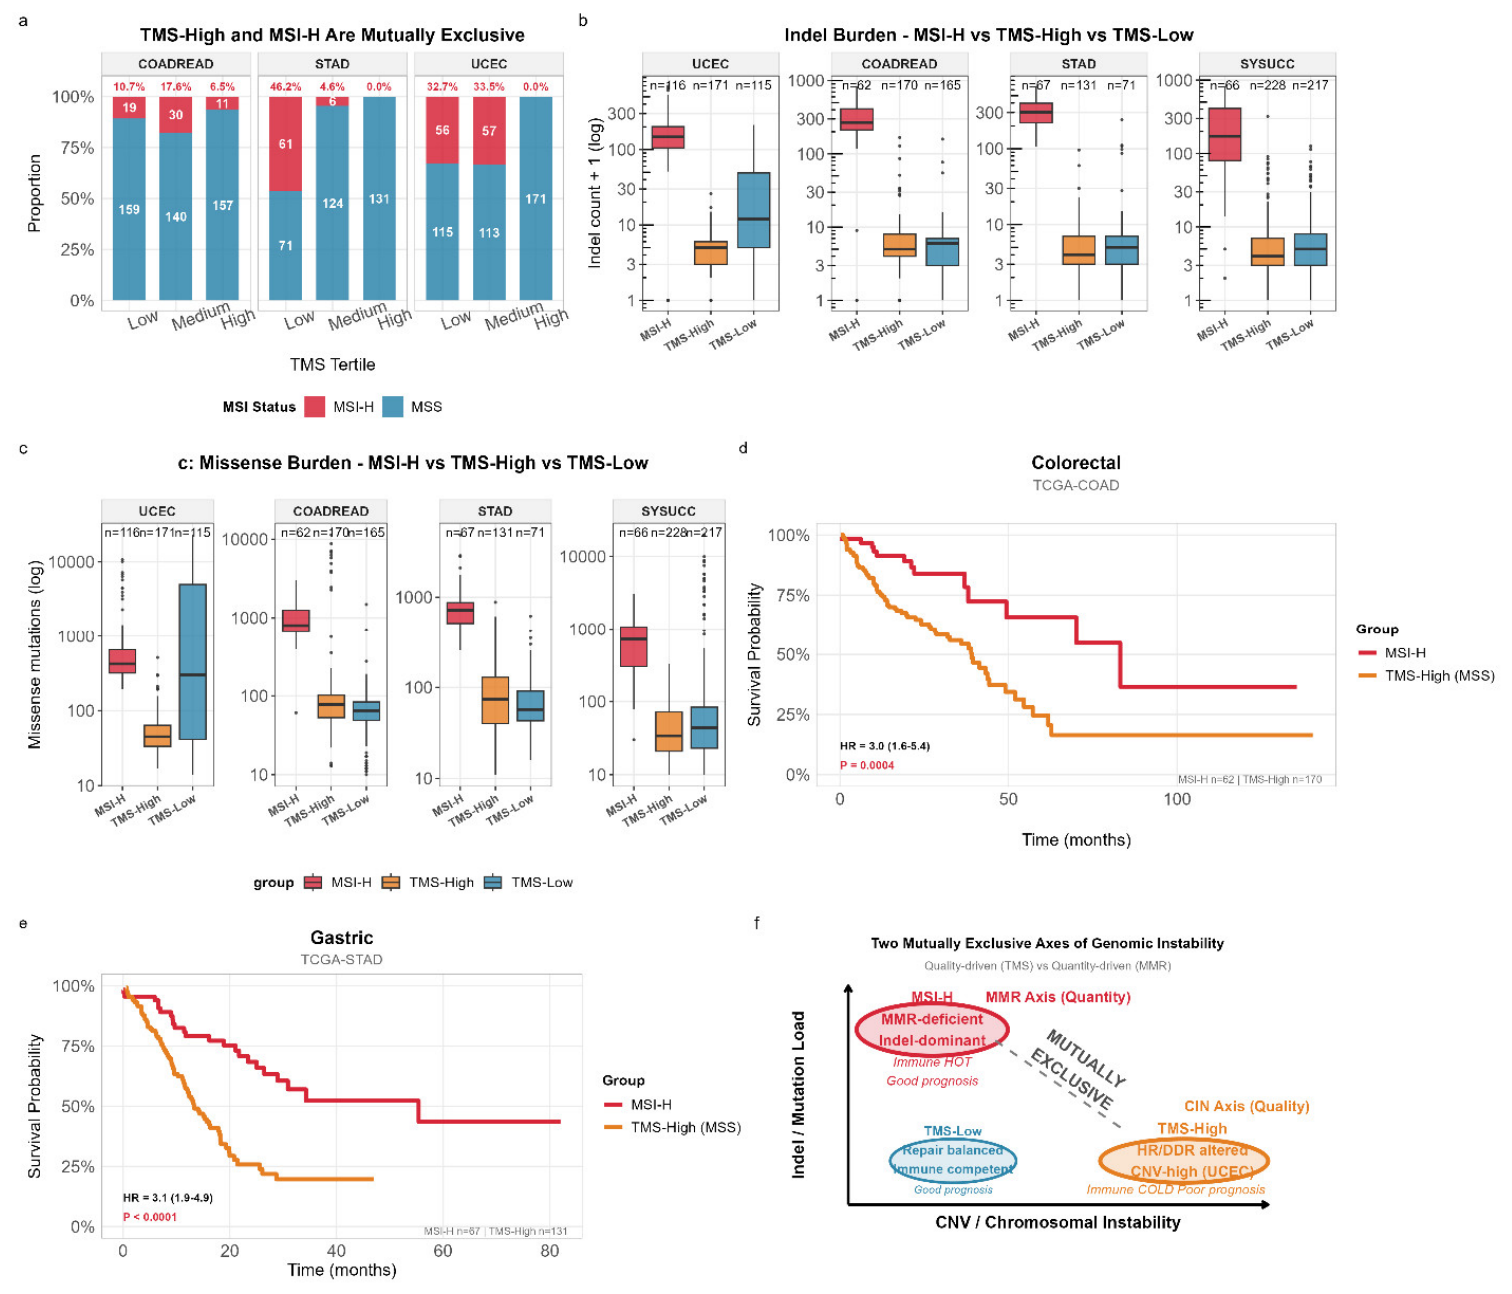
Figure 4.
TMS-High and MSI-H Exhibit Divergent Repair Proteome and Immune Microenvironment Phenotypes with Cancer-Specific Patterns. (a-c) Heatmaps of DNA repair protein abundance (RPPA) across three groups (MSI-H, TMS-High, TMS-Low) in (a) COADREAD, (b) STAD, and (c) UCEC. Proteins are grouped by functional pathways: MMR (MLH1, MSH2, MSH6, PMS2), HR (BRCA2, RAD51), DDR kinases (ATM, ATR, CHK1, CHK2), and replication/repair (PARP1, PCNA, RAD50, KU80, 53BP1). COADREAD shows minimal differences between TMS-High and TMS-Low, while MSI-H exhibits MMR downregulation. UCEC shows a distinct pattern with TMS-High associated with MMR upregulation and HR downregulation (consistent with CIN-driven instability). STAD shows intermediate patterns. (d-e) Heatmaps of immune signature scores across three groups in (d) COADREAD and (e) STAD. Immune signatures include CD8 T cells, T cells, cytolytic activity, IFN-γ response, checkpoints, MHC-I, and NK cells. In COADREAD (d), a clear gradient is observed: MSI-H (hottest) > TMS-Low > TMS-High (coldest) across all immune signatures, indicating that TMS-High tumors are immune-cold (immune desert phenotype). In STAD (e), MSI-H remains the hottest across 6 of 7 signatures (Cytolytic, IFN-γ, Checkpoints, NK_cells, T_cells). TMS-High shows elevated CD8+ T cell signature only, while TMS-Low shows the highest MHC-I expression. The overall pattern is similar to COAD, though the CD8+ T cell enrichment in TMS-High STAD tumors is notable and suggests cancer-specific modulation of immune infiltration. (f) Boxplots comparing key immune marker expression (CD8A, PDCD1, CD274) across three groups (MSI-H, TMS-High, TMS-Low) in COADREAD and STAD. In COADREAD, MSI-H shows the highest expression of CD8A, PDCD1, and CD274, while TMS-High shows the lowest expression (immune cold). In STAD, MSI-H shows the highest PDCD1 expression, while CD8A and CD274 show more modest variation across groups. The concurrent reduction of CD8+ T cells and checkpoint receptors in COADREAD TMS-High tumors indicates T cell exclusion (immune desert) rather than T cell exhaustion, with direct therapeutic implications for immunotherapy resistance.
Figure 4.
TMS-High and MSI-H Exhibit Divergent Repair Proteome and Immune Microenvironment Phenotypes with Cancer-Specific Patterns. (a-c) Heatmaps of DNA repair protein abundance (RPPA) across three groups (MSI-H, TMS-High, TMS-Low) in (a) COADREAD, (b) STAD, and (c) UCEC. Proteins are grouped by functional pathways: MMR (MLH1, MSH2, MSH6, PMS2), HR (BRCA2, RAD51), DDR kinases (ATM, ATR, CHK1, CHK2), and replication/repair (PARP1, PCNA, RAD50, KU80, 53BP1). COADREAD shows minimal differences between TMS-High and TMS-Low, while MSI-H exhibits MMR downregulation. UCEC shows a distinct pattern with TMS-High associated with MMR upregulation and HR downregulation (consistent with CIN-driven instability). STAD shows intermediate patterns. (d-e) Heatmaps of immune signature scores across three groups in (d) COADREAD and (e) STAD. Immune signatures include CD8 T cells, T cells, cytolytic activity, IFN-γ response, checkpoints, MHC-I, and NK cells. In COADREAD (d), a clear gradient is observed: MSI-H (hottest) > TMS-Low > TMS-High (coldest) across all immune signatures, indicating that TMS-High tumors are immune-cold (immune desert phenotype). In STAD (e), MSI-H remains the hottest across 6 of 7 signatures (Cytolytic, IFN-γ, Checkpoints, NK_cells, T_cells). TMS-High shows elevated CD8+ T cell signature only, while TMS-Low shows the highest MHC-I expression. The overall pattern is similar to COAD, though the CD8+ T cell enrichment in TMS-High STAD tumors is notable and suggests cancer-specific modulation of immune infiltration. (f) Boxplots comparing key immune marker expression (CD8A, PDCD1, CD274) across three groups (MSI-H, TMS-High, TMS-Low) in COADREAD and STAD. In COADREAD, MSI-H shows the highest expression of CD8A, PDCD1, and CD274, while TMS-High shows the lowest expression (immune cold). In STAD, MSI-H shows the highest PDCD1 expression, while CD8A and CD274 show more modest variation across groups. The concurrent reduction of CD8+ T cells and checkpoint receptors in COADREAD TMS-High tumors indicates T cell exclusion (immune desert) rather than T cell exhaustion, with direct therapeutic implications for immunotherapy resistance.
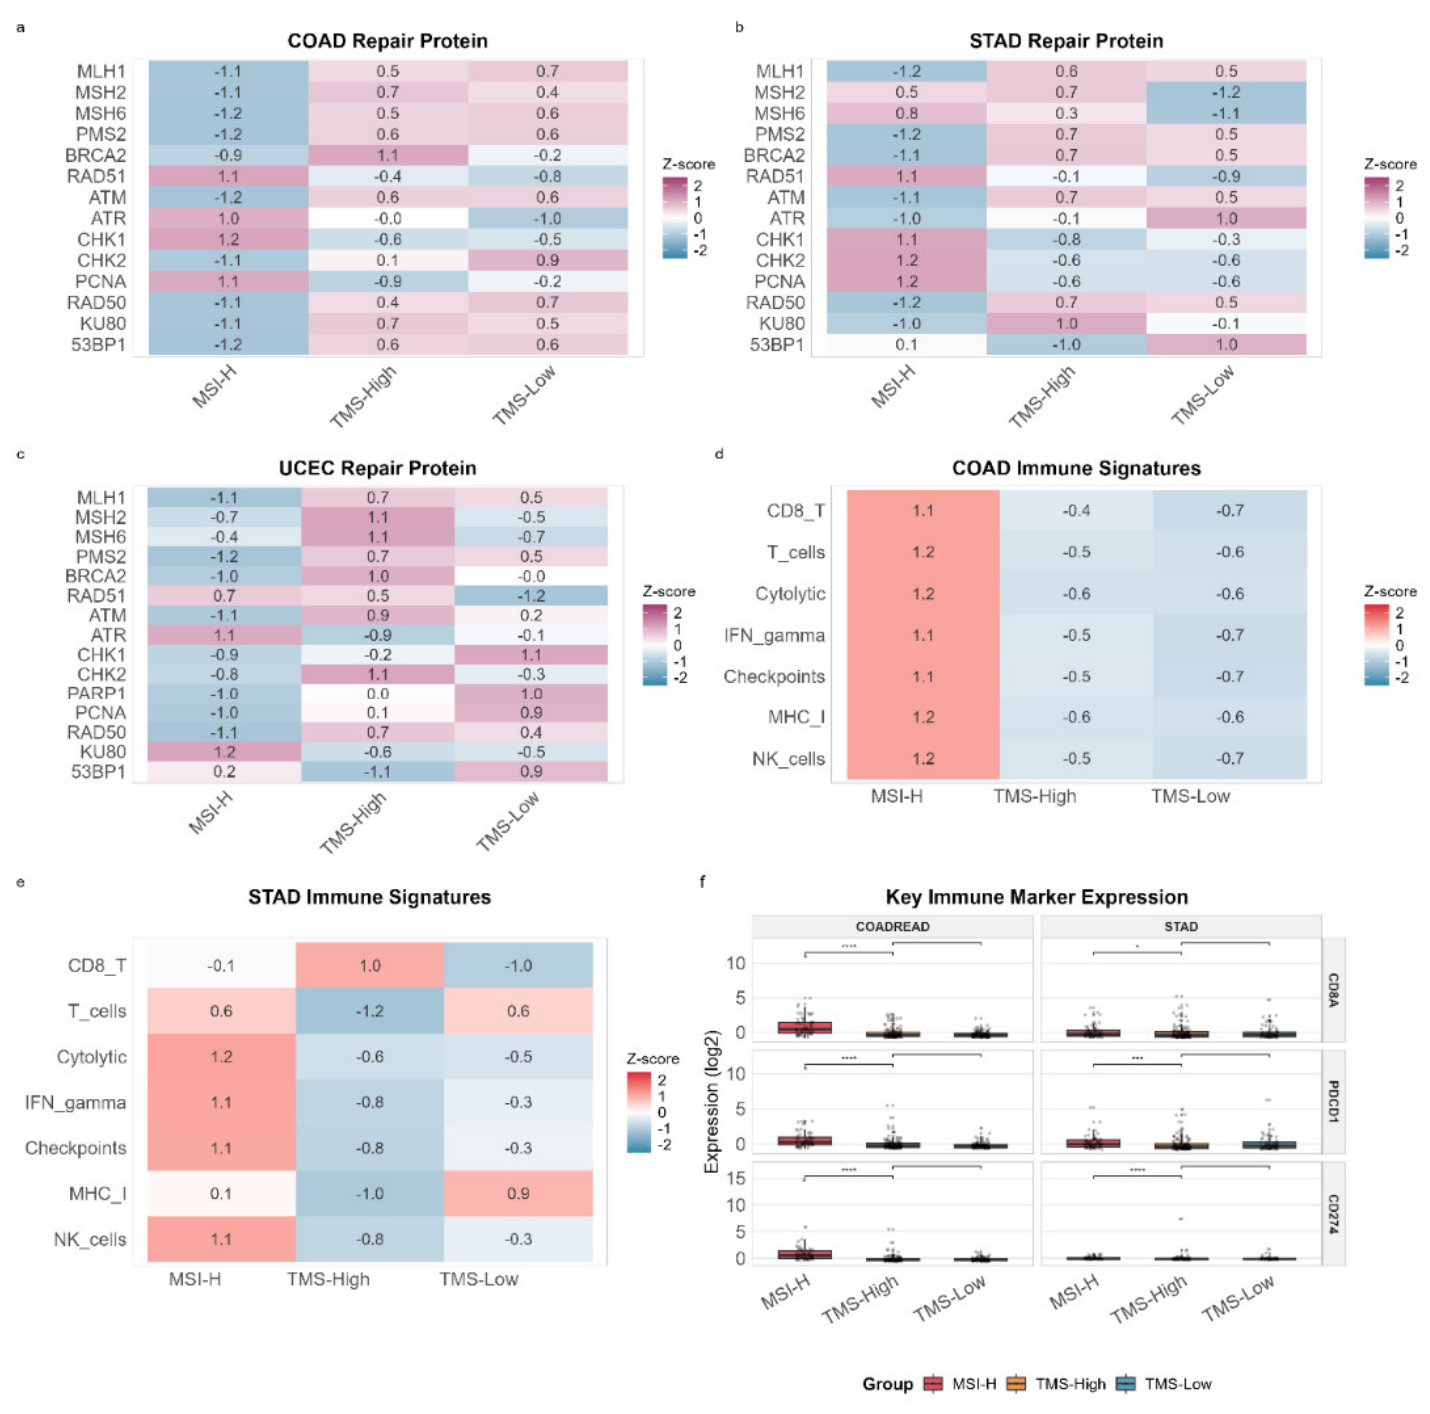
Figure 5.
TMS-High Associates with Differential Chemotherapy Resistance and Defines a Clinically Actionable Axis in MSS Colorectal Cancer. (a) Three-year event rates in MSS colorectal cancer patients who were candidates for adjuvant chemotherapy based on clinical guideline recommendations (SYSUCC Stage III–IV, N=627; TCGA-COAD Stage III, N=482). Bars show Kaplan-Meier estimated event rates with standard errors for TMS-Low, Medium, and High groups. TMS-High patients had markedly higher event rates than TMS-Low patients in both cohorts: SYSUCC 26.9% vs 3.4% (7.9-fold difference); TCGA-COAD 45.6% vs 3.2% (14.4-fold difference). TMS-Medium patients showed intermediate event rates (SYSUCC: 11.5%; TCGA-COAD: 14.5%), establishing a dose-response relationship between TMS score and chemotherapy failure. (b) Drug-specific TMS score versus natural log of half-maximal inhibitory concentration (LN_IC50) for 5-fluorouracil (5-FU), oxaliplatin, and cisplatin in GDSC2 colorectal cancer cell lines (COAD/READ, N=46 for 5-FU and oxaliplatin; N=41 for cisplatin). Each point represents one cell line, colored by TMS tertile (Low = blue, High = red). Linear regression fits with 95% confidence intervals (gray shading) and Spearman correlation coefficients (rho) with P-values are shown. All three drugs exhibit significant positive correlations between TMS score and IC50 (5-FU: rho=0.928, P=6.7×10⁻⁹; oxaliplatin: rho=0.851, P=3.0×10⁻⁷; cisplatin: rho=0.809, P=1.0×10⁻⁷), indicating a dose-response relationship between TMS and drug resistance. (c) LN_IC50 distributions for TMS-Low versus TMS-High tertiles. Boxplots show median, interquartile range, and 1.5×IQR whiskers with individual cell lines as jittered points. Fold change (FC) and P-values from two-sided Wilcoxon rank-sum tests are displayed. TMS-High cells show significantly elevated IC50 for all three drugs (5-FU: FC=28.7×, P=8.7×10⁻⁹; oxaliplatin: FC=14.1×, P=1.1×10⁻⁷; cisplatin: FC=17.4×, P=7.5×10⁻⁷), confirming that TMS-defined groups exhibit differential in vitro chemosensitivity. (d) Drug resistance spectrum across GDSC2 compounds. Bars show fold change in IC50 (TMS-High / TMS-Low) for the top 20 drugs ranked by FC. Drugs are colored by mechanism of action: antimetabolites (red), platinum compounds (blue), topoisomerase inhibitors (purple), and microtubule-targeting agents (orange). Significance levels from Wilcoxon tests are shown (****P<0.0001, ***P<0.001, **P<0.01, *P<0.05). The dashed line at FC=1 indicates no differential sensitivity. Antimetabolites (gemcitabine, FC=121.3×; 5-FU, FC=28.7×) and microtubule inhibitors (docetaxel, FC=60.5×; paclitaxel, FC=27.1×) show the strongest TMS-associated resistance, while platinum compounds (oxaliplatin, FC=14.1×; cisplatin, FC=17.4×) show relatively lower resistance among standard CRC chemotherapeutics, suggesting a potential therapeutic window for platinum-based regimens in TMS-High patients—though 14-fold resistance remains clinically significant. (e) Proposed clinical decision pathway for MSS colorectal cancer patients. Following TMS computation from whole-exome sequencing (WES) data, patients are stratified into TMS-Low and TMS-High groups. TMS-Low patients, who have favorable prognosis with standard FOLFOX chemotherapy (5-FU + oxaliplatin), would continue with the standard-of-care regimen. TMS-High patients, who exhibit poor outcomes on FOLFOX and show greater resistance to 5-FU (28.7×) than oxaliplatin (14.1×) in vitro, could be considered for platinum-intensified regimens or clinical trials evaluating DNA damage response (DDR) inhibitors. This framework provides a precision oncology approach to adjuvant therapy intensity based on tumor mutational signature. This proposed clinical decision pathway is based on retrospective analyses and requires prospective validation before clinical implementation.
Figure 5.
TMS-High Associates with Differential Chemotherapy Resistance and Defines a Clinically Actionable Axis in MSS Colorectal Cancer. (a) Three-year event rates in MSS colorectal cancer patients who were candidates for adjuvant chemotherapy based on clinical guideline recommendations (SYSUCC Stage III–IV, N=627; TCGA-COAD Stage III, N=482). Bars show Kaplan-Meier estimated event rates with standard errors for TMS-Low, Medium, and High groups. TMS-High patients had markedly higher event rates than TMS-Low patients in both cohorts: SYSUCC 26.9% vs 3.4% (7.9-fold difference); TCGA-COAD 45.6% vs 3.2% (14.4-fold difference). TMS-Medium patients showed intermediate event rates (SYSUCC: 11.5%; TCGA-COAD: 14.5%), establishing a dose-response relationship between TMS score and chemotherapy failure. (b) Drug-specific TMS score versus natural log of half-maximal inhibitory concentration (LN_IC50) for 5-fluorouracil (5-FU), oxaliplatin, and cisplatin in GDSC2 colorectal cancer cell lines (COAD/READ, N=46 for 5-FU and oxaliplatin; N=41 for cisplatin). Each point represents one cell line, colored by TMS tertile (Low = blue, High = red). Linear regression fits with 95% confidence intervals (gray shading) and Spearman correlation coefficients (rho) with P-values are shown. All three drugs exhibit significant positive correlations between TMS score and IC50 (5-FU: rho=0.928, P=6.7×10⁻⁹; oxaliplatin: rho=0.851, P=3.0×10⁻⁷; cisplatin: rho=0.809, P=1.0×10⁻⁷), indicating a dose-response relationship between TMS and drug resistance. (c) LN_IC50 distributions for TMS-Low versus TMS-High tertiles. Boxplots show median, interquartile range, and 1.5×IQR whiskers with individual cell lines as jittered points. Fold change (FC) and P-values from two-sided Wilcoxon rank-sum tests are displayed. TMS-High cells show significantly elevated IC50 for all three drugs (5-FU: FC=28.7×, P=8.7×10⁻⁹; oxaliplatin: FC=14.1×, P=1.1×10⁻⁷; cisplatin: FC=17.4×, P=7.5×10⁻⁷), confirming that TMS-defined groups exhibit differential in vitro chemosensitivity. (d) Drug resistance spectrum across GDSC2 compounds. Bars show fold change in IC50 (TMS-High / TMS-Low) for the top 20 drugs ranked by FC. Drugs are colored by mechanism of action: antimetabolites (red), platinum compounds (blue), topoisomerase inhibitors (purple), and microtubule-targeting agents (orange). Significance levels from Wilcoxon tests are shown (****P<0.0001, ***P<0.001, **P<0.01, *P<0.05). The dashed line at FC=1 indicates no differential sensitivity. Antimetabolites (gemcitabine, FC=121.3×; 5-FU, FC=28.7×) and microtubule inhibitors (docetaxel, FC=60.5×; paclitaxel, FC=27.1×) show the strongest TMS-associated resistance, while platinum compounds (oxaliplatin, FC=14.1×; cisplatin, FC=17.4×) show relatively lower resistance among standard CRC chemotherapeutics, suggesting a potential therapeutic window for platinum-based regimens in TMS-High patients—though 14-fold resistance remains clinically significant. (e) Proposed clinical decision pathway for MSS colorectal cancer patients. Following TMS computation from whole-exome sequencing (WES) data, patients are stratified into TMS-Low and TMS-High groups. TMS-Low patients, who have favorable prognosis with standard FOLFOX chemotherapy (5-FU + oxaliplatin), would continue with the standard-of-care regimen. TMS-High patients, who exhibit poor outcomes on FOLFOX and show greater resistance to 5-FU (28.7×) than oxaliplatin (14.1×) in vitro, could be considered for platinum-intensified regimens or clinical trials evaluating DNA damage response (DDR) inhibitors. This framework provides a precision oncology approach to adjuvant therapy intensity based on tumor mutational signature. This proposed clinical decision pathway is based on retrospective analyses and requires prospective validation before clinical implementation.
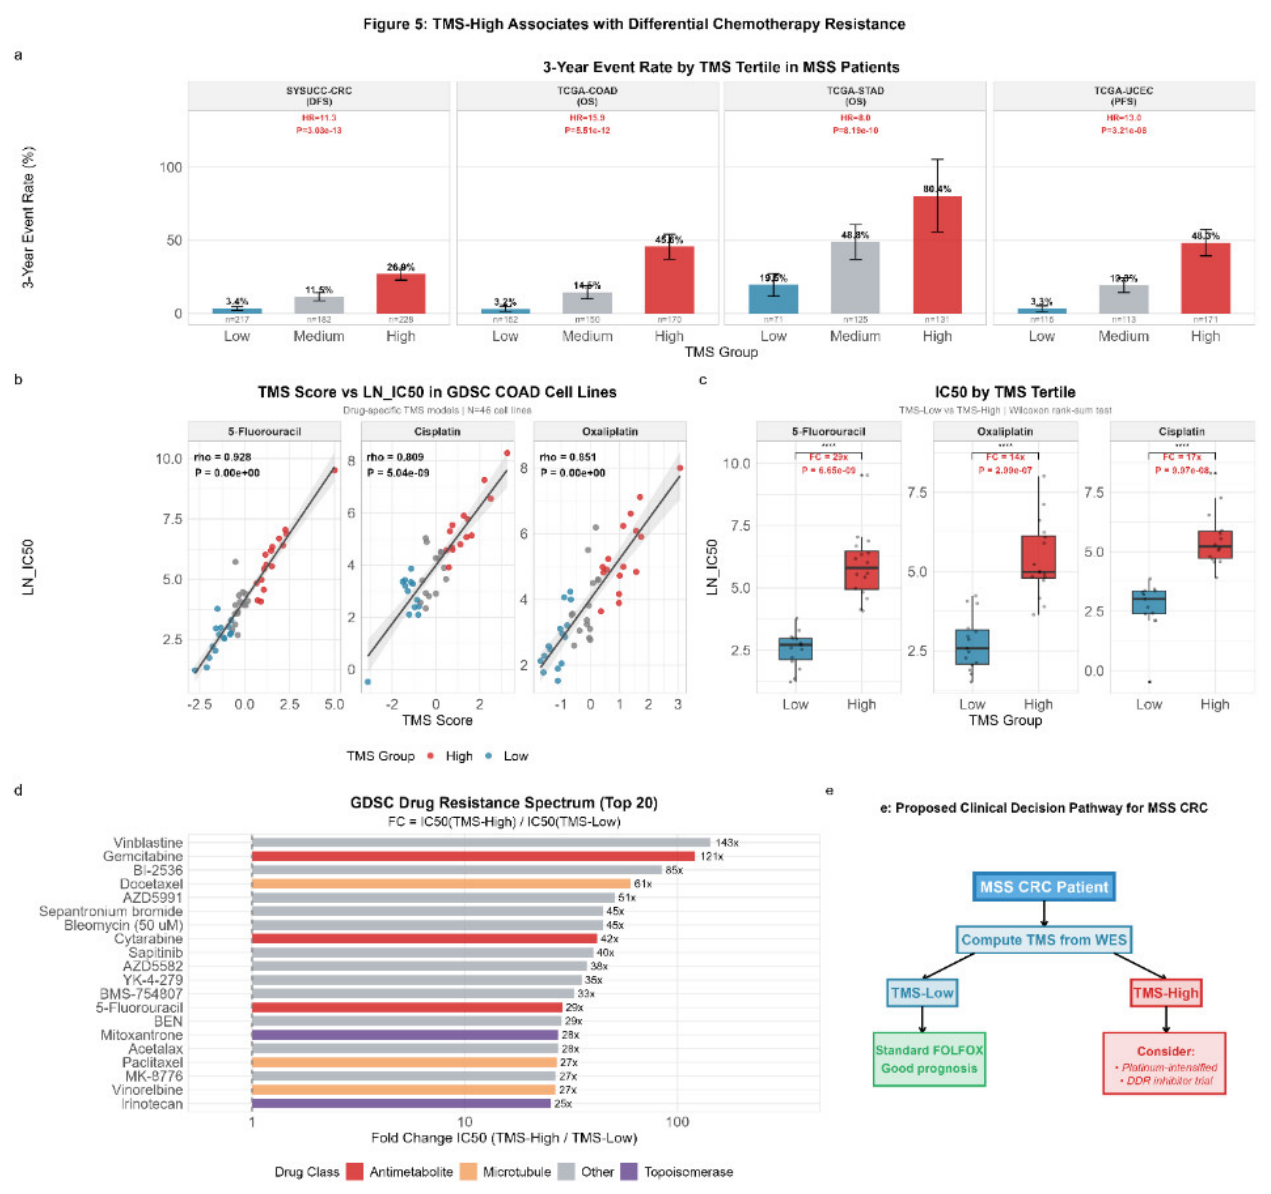
Disclaimer/Publisher’s Note: The statements, opinions and data contained in all publications are solely those of the individual author(s) and contributor(s) and not of MDPI and/or the editor(s). MDPI and/or the editor(s) disclaim responsibility for any injury to people or property resulting from any ideas, methods, instructions or products referred to in the content. |
© 2026 by the authors. Licensee MDPI, Basel, Switzerland. This article is an open access article distributed under the terms and conditions of the Creative Commons Attribution (CC BY) license (http://creativecommons.org/licenses/by/4.0/).
Copyright: This open access article is published under a Creative Commons CC BY 4.0 license, which permit the free download, distribution, and reuse, provided that the author and preprint are cited in any reuse.


