
Submitted:
26 July 2026
Posted:
27 July 2026
You are already at the latest version
Abstract
The genus Trichoderma comprises ecologically and biotechnologically important fungi widely used in agriculture, industrial biotechnology, and biological control. However, publicly available genomes have revealed substantial taxonomic inconsistencies across the genus. Here, we present a comprehensive phylogenomic and comparative genomic analysis integrating one of the largest Trichoderma genome collections analyzed to date. Phylogenomic reconstruction based on 920 conserved single-copy orthologous genes recovered four major evolutionary clades with strong statistical support and revealed widespread taxonomic misannotation affecting multiple species complexes, including T. harzianum, T. asperellum, T. viride, and T. longibrachiatum. Comparative analyses demonstrated marked clade-associated differences in genome size, GC content, repetitive DNA proportion, gene content, and whole-genome conservation patterns. Genome size correlated positively with repetitive element accumulation and gene counts, whereas GC content displayed a negative correlation with assembly size. Additionally, we describe a novel Colombian isolate clustering within a highly supported and divergent lineage with three inconsistently annotated public genomes. This lineage, provisionally designated Trichoderma sp. "CB2", formed a sister group to the Longibrachiatum complex, exhibiting strong internal genomic cohesion and clear divergence from neighboring lineages. Orthology-based analyses identified lineage-specific proteins associated with transcriptional regulation, plant biomass degradation, secondary metabolism, and detoxification pathways. This study provides a phylogenomic framework for the genus Trichoderma and highlights the extent of taxonomic inconsistencies in public genomic databases.
Keywords:
Trichoderma
; comparative genomics
; phylogenomic analysis
; evolution
; taxogenomics
1. Introduction
Species of the genus Trichoderma are among the most economically and biotechnologically important filamentous fungi, with applications spanning agriculture, biocontrol, enzyme production, and environmental biotechnology [1]. Despite this importance, the taxonomy of Trichoderma has historically been affected by extensive species misidentification and unstable classification frameworks [2]. The high morphological similarity among species, together with the historical reliance on low-resolution phenotypic traits and single-marker approaches, led to decades of taxonomic ambiguity, particularly within species-rich lineages such as the Harzianum, Viride, and Longibrachiatum species complexes [3]. Consequently, as observed in other fungi, numerous strains deposited in culture collections and genomic repositories have been incorrectly annotated, propagating inconsistencies across ecological, physiological, and industrial studies. These taxonomic inaccuracies have complicated comparative analyses, obscured species boundaries, and in several cases delayed the recognition of new species [4].
One of the most emblematic examples of this problem is Trichoderma reesei, currently regarded as a premier industrial workhorse due to its extraordinary cellulolytic capabilities. The type strain of T. reesei, QM6a, was isolated during World War II after United States military personnel stationed in the Solomon Islands observed the rapid degradation of cotton-based materials, such as tents and uniforms, under tropical conditions [5]. Investigation of this biodegradation process led to the isolation of a highly cellulolytic green filamentous fungus, which was subsequently transferred to the US Army Quartermaster Research and Development Center in Natick, Massachusetts, where the strain received the designation “QM6a” [6,7]. The fungus rapidly attracted attention because of its remarkable cellulase production capacity, eventually becoming a protagonist of modern industrial cellulase biotechnology. Indeed, most industrial cellulase-producing strains currently utilized in biorefineries and enzyme production platforms are hyper-secreting mutant derivatives obtained through successive rounds of random mutagenesis of this original isolate [8,9].
However, despite its industrial relevance, the taxonomic identity of QM6a remained uncertain for decades. Initially, the isolate was classified as Trichoderma viride based on superficial morphological similarities to existing taxa. Only in 1977 did Emory G. Simmons recognize that QM6a displayed consistent morphological and physiological differences from authentic T. viride strains, formally describing it as a new species, Trichoderma reesei, in honor of Elwyn T. Reese, one of the pioneering researchers involved in its physiological characterization. Subsequent phylogenetic and molecular fingerprinting analysis demonstrated that T. reesei corresponds to the anamorphic (asexual) stage of the pantropical ascomycete Hypocrea jecorina [10]. For many years, both names coexisted under the traditional dual nomenclature system used in fungal taxonomy, where sexual and asexual morphs were assigned separate scientific names. The subsequent adoption of the “one fungus, one name” convention by the International Botanical Congress eliminated this dual system, establishing Trichoderma reesei as the single, accepted species name [8].
The history of T. reesei illustrates how inaccurate or incomplete taxonomy can persist even in some of the most intensively studied fungal systems. Similar obstacles continue to affect multiple Trichoderma lineages, where cryptic diversity, strain cross-contamination, mixed assemblies, and inconsistent automated annotations remain common in publicly available datasets. The rapid expansion of whole-genome sequencing (WGS) now provides an unprecedented opportunity to resolve these long-standing inconsistencies through phylogenomics and comparative genomics [11]. Genome-scale analyses based on hundreds of conserved orthologous loci offer substantially greater discriminatory power than traditional single-locus barcode markers, enabling robust species delimitation and more accurate reconstruction of evolutionary relationships [12]. At the same time, the reliability of these macro-approaches depends critically on rigorous genome quality control, including the explicit detection of contaminant contigs, mixed-strain assemblies, and incorrectly assigned taxonomy in public repositories [13].
Recent large-scale comparative studies have further emphasized the remarkable ecological and evolutionary diversity within the genus Trichoderma. For example, a recent phenogenomic analysis integrating genomic data from 37 Trichoderma strains with more than 140 phenotypic traits demonstrated that the genus is both genetically cohesive and physiologically highly diverse, exhibiting extensive variation in metabolic versatility, stress tolerance, dispersal strategies, and ecological adaptation. The study additionally highlighted evidence of convergent evolution and ecological specialization across distant lineages, reinforcing the importance of robust phylogenomic frameworks for accurately interpreting the evolutionary and functional diversification of Trichoderma species in agricultural and environmental contexts [14].
Due to the central role of Trichoderma fungi in modern sustainable agriculture and their widespread implementation as biocontrol agents, biofertilizers, and industrial enzyme factories, establishing a reliable, standardized, and universally accessible species-level taxonomic framework has become paramount for both academic researchers and industrial applications [15]. Because public repositories, such as the NCBI databases, constitute the primary global infrastructure for genetic and genomic information used in strain identification, comparative genomics, and taxonomic reference, the structural and nomenclature accuracy of these archived records directly impacts downstream biological interpretation, metabolic profiling, and commercial product development and regulation [16]. Historically, Trichoderma classification has relied on an integrative polyphasic system combining micro-morphology with definitive multilocus diagnostic markers such as tef1 and rpb2 [2,17]. However, the exponential influx of high-throughput sequencing data has outpaced manual curation, occasionally leading to misannotated or unverified assemblies in public repositories that can propagate inaccuracies in downstream analyses. In this context, establishing a robust, curated phylogenomic framework represents a natural and necessary extension of traditional barcoding protocols. By anchoring genomic data to validated type-strain data and classical evolutionary lineages, such a framework serves as a common, high-resolution reference point for the broader mycological and industrial communities, improving the detection of historical misidentifications, facilitating precise strain classification, and providing a standardized foundation for the discovery of truly novel Trichoderma [18].
In this study, we pursued two principal objectives. First, we aimed to establish a reliable precision-taxogenomics framework for Trichoderma by applying a contamination-filtered phylogenomic pipeline to hundreds of public assemblies deposited in NCBI repositories. Utilizing this robust baseline, we systematically audited the prevalence of historical misannotations in public databases to determine whether ambiguously cataloged strains, alongside a novel Colombian isolate recovered from a rural agricultural environment, represent recognized species or correspond to entirely undocumented evolutionary lineages. Second, building upon this curated evolutionary foundation, we investigated macro-genomic structural variation across the genus, quantifying how genome size, GC content, repetitive DNA landscape, and predicted gene space co-vary and differentiate among the four major Trichoderma clades.
2. Results
2.1. Genome Contamination Screening and Quality Control
Genome quality control and contaminant screening were performed using CAT to identify non-Trichoderma contigs within the genome assemblies. Among the 191 genomes analyzed from the NCBI Datasets repository, 83 showed no detectable contaminant contigs. Of the remaining assemblies, 20 contained contigs assigned to bacterial taxa, whereas 103 contained contigs classified as non-Trichoderma fungal sequences. In most cases, contamination levels were low and limited to a small number of contigs. Following contaminant removal, only minor changes in assembly metrics were observed, with the median genome size decreasing by 1.79% (Supplementary Figure S1), indicating that the filtered assemblies retained their overall genomic integrity while improving taxonomic consistency for downstream phylogenomic analyses. The most frequently detected contaminant taxa corresponded to filamentous fungi commonly associated with soil and plant environments, including Fusarium, Metarhizium, Penicillium, Talaromyces, Ilyonectria, Pochonia, and Claviceps. Additional contaminants included bacterial genera such as Niallia, Achromobacter, and Stenotrophomonas, as well as occasional assignments to yeast (Maudiozyma) and plant (Oryza) sequences. The recurrent detection of environmental fungi suggests that low-level co-isolation or assembly carryover may be common in publicly available Trichoderma genome datasets.
In this study, we included a novel Colombian isolate that was sequenced, assembled, and filtered using the same methodology applied to the reference genomes. The isolate was designated CB2, and CAT contamination analysis revealed that the assembly contained only eight contaminant contigs, predominantly assigned to fungal taxa, which were removed prior to downstream analyses.
The filtered Trichoderma genome assemblies exhibited high overall completeness and contiguity. BUSCO completeness showed a median value of 99.4%, ranging from 83% to 99.7%, while the median proportion of single-copy BUSCO markers was 90.8% (74.5–93.3%). Multicopy BUSCOs presented a median value of 8.15%, whereas fragmented and missing BUSCOs remained low, with median values of 0.1% and 0.5%, respectively. All analyses were performed using the same set of 3,817 BUSCO markers. Assembly contiguity metrics indicated generally high-quality genomes, with a median N50 value of 1,207,943 bp, ranging from 40,231 bp to 8,263,504 bp. Repeat content, estimated as the percentage of masked bases using RepeatModeler and RepeatMasker, showed moderate variation across genomes, ranging from 3.92% to 17.0%, with a median of 6.39%. Structural annotation statistics revealed a median of 12,129.5 genes per genome. The median number of exons per transcript was 2.99, indicating relatively compact gene architectures across the analyzed assemblies. Median gene length was 1,409 bp, while mean intron and CDS lengths showed median values of 89.7 bp and 1,528 bp, respectively (Supplementary Table 1).
2.2. Phylogenomic Reconstruction Resolves Deep Lineages and Taxonomic Incongruencies in Trichoderma
The phylogenomic reconstruction, rooted with Trichoderma orchidacearum, resolved two major and strongly supported evolutionary lineages within the genus. The first lineage, here designated Clade 1, included species such as T. erinaceum, T. atroviride, T. viride, T. gamsii, T. palidulum, T. virilente, T. koningiopsis, T. evansii, T. hamatum, T. asperellum, and T. asperelloides, together with several additional species represented by fewer isolates. The second clade, which is more diverse, comprises species including T. arundinaceum, T. brevicompactum, T. citrinoviride, T. gracile, T. reesei, T. parareesei, T. longibrachiatum, T. virens, T. velitinum, T. aggressivum, T. amazonicum, T. afroharzianum, T. endophyticum, T. zeloharzianum, T. harzianum, and T. simmonsii, along with several additional recognized species represented by fewer genomes. This broader lineage was further subdivided into three principal subclades, here designated Clades 2A, 2B, and 2C, which are described in detail below (Figure 1).
A complete expanded representation of the phylogenomic tree is available in Supplementary Figure 2. In general, most recognized species included in the analysis formed monophyletic groups with strong support (SH-aLRT = 100 and UFBoot = 100). However, several incongruences suggest potential taxonomic inconsistencies within specific species complexes or limitations in our phylogenomic approach to resolve species boundaries within closely related species. Additionally, our phylogenomic approach failed to resolve certain relationships within the clade that encompasses velutinum+cerinum and the clade zeloharzianum+harzianum+endophyticum with a few nodes with low support (UFB ≤95). Phylogenomic reconstruction of Trichoderma Clade 1 recovered a highly resolved and strongly supported topology, with most species-level lineages receiving maximal branch support (100/100 SH-aLRT/UFBoot). The clade was structured into two principal monophyletic lineages in addition to a basal assemblage comprising Trichoderma minutisporum and Trichoderma polysporum. This basal lineage also included accession GCA_052570145, currently annotated as Trichoderma viride, which was phylogenetically distant from the core T. viride lineage and therefore likely represents a taxonomically misidentified genome (Figure 2).
The first major lineage encompassed the Trichoderma hamatum and Asperellum/Asperelloides complexes, including Trichoderma evansii, Trichoderma hamatum, Trichoderma asperellum, and Trichoderma asperelloides. The second principal lineage comprised species associated with the Viride, Atroviride, and Koningiopsis complexes, including Trichoderma austrokoningii, Trichoderma strigosellum, Trichoderma erinaceum, Trichoderma atroviride, Trichoderma viride, Trichoderma gamsii, Trichoderma palidulum, Trichoderma virilente, Trichoderma koningiopsis, and Trichoderma taiwanense. Overall, the topology recovered within Clade 1 was congruent with currently recognized species complexes and provided strong phylogenomic support for their evolutionary relationships.
Notably, the phylogeny revealed substantial taxonomic incongruence within the Trichoderma asperellum–Trichoderma asperelloides complex. All genomes belonging to the core T. asperellum lineage were consistently annotated in NCBI as T. asperellum and clustered with the reference strain CBS 433.97 (GCF_003025105). In contrast, several genomes currently annotated as T. asperellum, together with the misplaced Trichoderma viride strain Th4 (GCA_037893215), were robustly nested within the monophyletic T. asperelloides lineage. This clade included the reference strain GCA_026401225 Trichoderma asperelloides BJ152-42 and was clearly separated from the core T. asperellum lineage. Additionally, accession GCA_045838185, currently annotated as Trichoderma yunnanense, was also placed within the T. asperelloides clade with minimal phylogenetic divergence from the remaining members of this group (Figure 2).
Our analysis also revealed two additional noteworthy phylogenetic patterns. First, two accessions currently annotated as T. viride (GCA_052570055 and GCA_052570065) formed an independent sister clade to T. atroviride, representing a strongly supported monophyletic lineage (100/100 SH-aLRT/UFBoot) that is phylogenetically distinct from the core T. viride cluster. The marked divergence of this lineage suggests that these strains are likely misannotated in public repositories and may represent a distinct phylogenomic candidate lineage, here informally designated as Trichoderma sp. 1, pending future formal polyphasic characterization. Second, T. taiwanensis was nested within the T. koningiopsis aggregate species complex, forming a sister lineage to specific strains annotated as T. koningiopsis in MycoBank. This topology highlights an intimate evolutionary affinity between these taxa, corroborating previous reports of high genomic similarity, and underscores the value of integrated morpho-molecular analyses to definitively resolve taxonomic boundaries within this aggregate complex.
Phylogenomic analysis of Trichoderma Clade 2 revealed a complex evolutionary architecture encompassing several major lineages and species complexes, including the Harzianum, Virens, Longibrachiatum, Reesei–Parareesei, and Citrinoviride complexes. Overall, the global topology was reconstructed with robust statistical support, with most species-level lineages receiving maximal SH-aLRT and ultrafast bootstrap (UFBoot) values (100/100). Despite this broad stability, several localized regions of phylogenetic uncertainty were identified. In particular, T. lentiforme was reconstructed as nested within the T. endophyticum cluster, rendering the latter paraphyletic and challenging the reciprocal monophyly of these two sister taxa based on current genomic assemblies. Similarly, the T. velutinum–T. cerinum lineage displayed reduced nodal support (35.5/68) (Figure 3).
Clade 2 was anchored by a highly supported basal lineage (99.4/99) comprising T. cornu-damae, which formed a sister group to a subclade containing T. arundinaceum and T. brevicompactum (hereafter designated Clade 2A). A second major assemblage, designated Clade 2B, encompassed the Longibrachiatum, Reesei–Parareesei, and Citrinoviride complexes, alongside several allied lineages. Within this assemblage, the Reesei–Parareesei complex was resolved into two well-supported monophyletic groups corresponding to T. reesei and T. parareesei. Notably, our analysis clarified the taxonomic placement of Trichoderma sp. CBMAI-0711, nesting it cleanly within the T. parareesei lineage. Although the overall topology of the T. reesei clade remained stable, a single internal node exhibited lower support (25.4/56), indicating limited local phylogenetic resolution among these closely related strains. Finally, T. gracile was positioned as a distinct sister lineage to the broader Reesei–Parareesei complex.
A highly divergent and strongly supported lineage was also identified, comprising the Colombian isolate CB2 clustered together with three inconsistently annotated public accessions: T. harzianum ZL-811 (GCA_021186515) and the T. reesei strains 5029 and 5001 (GCA_026225705 and GCA_026225735, respectively). This distinct lineage formed a sister group to the Longibrachiatum complex and was clearly separated from the core T. reesei, T. parareesei, T. gracile, and T. citrinoviride reference clades. The deep phylogenetic divergence observed, combined with the conflicting historical taxonomic annotations within this cohort, suggests that these strains may constitute a previously unrecognized candidate species lineage, provisionally designated here as Trichoderma sp. "CB2", an observation that warrants future formal polyphasic evaluation.
The Citrinoviride species complex was recovered as a highly coherent monophyletic group with maximal support across all internal nodes. All analyzed accessions clustered according to their expected species assignments, indicating a comparatively stable taxonomic structure relative to other Trichoderma complexes evaluated in this study.
In contrast, the T. longibrachiatum species lineage revealed several prominent cases of taxonomic incongruence. Accession GCA_051820435 (strain T28), currently annotated as T. asperellum—a member of a distinct section of the genus—was deeply nested within the T. longibrachiatum clade. Likewise, T. koningii JCM-1883 (GCA_001950475) clustered within the core T. longibrachiatum lineage and exhibited minimal phylogenetic divergence relative to the reference strain CBS 115340.
Lastly, a large assemblage designated Clade 2C constituted a well-supported cohort encompassing the Harzianum sensu stricto (s. s.) and T. virens complexes, though several localized regions of phylogenetic instability and taxonomic incongruence were detected. Within the Harzianum complex, our phylogenomic reconstruction confirmed T. afroharzianum as a robustly supported monophyletic lineage. Multiple genomes currently cataloged under the broad umbrella name T. harzianum—including strains S12, S19, T4, T11, and PB4401—clustered unequivocally within the T. afroharzianum lineage.
In contrast, T. harzianum (s. s.) formed a distinct and strongly supported lineage containing the critical neotype strain CBS 226.95, alongside reference strains TR274 and B97. This lineage was further subdivided into two moderately differentiated sublineages: one containing the primary neotype strain and another encompassing accessions CBS 354.33 and CGMCC 20739. Notably, the reference genome of T. simmonsii (GH-Sj1) was nested within this latter T. harzianum sublineage, resulting in a lack of reciprocal monophyly between these two recognized sister taxa at the whole-genome scale. This topology suggests highly permeable or unresolved species boundaries and highlights the clear need for a targeted polyphasic reassessment within the Harzianum–Simmonsii complex.
Additional extensive taxonomic inconsistencies were identified among other genomes sharing the T. harzianum label. Accession T9 (GCA_049863215) clustered adjacent to the T. lentiforme–T. endophyticum assemblage, whereas accession Tr1 (GCA_002894145) grouped within the T. pleuroticola lineage. Similarly, accession BOL-12QD (GCA_044337915) clustered with Trichoderma sp. CBMAI-0179 and the T. breve/T. brevicrassum lineage rather than within the core Harzianum complex.
The T. virens lineage was reconstructed with maximal support but also exhibited evidence of historical nomenclature cross-contamination. Two genomes currently annotated as T. viride—strain Tv-1511 (GCA_007896495) and strain OSK-36 (GCA_036169675)—were both robustly nested within the T. virens monophyletic lineage.
2.3. Geographic Distribution of the Major Trichoderma Clades
We evaluated the geographic distribution of the four major phylogenomic clades identified in this study (Clades 1, 2A, 2B, and 2C) using strain provenance information obtained from public repositories, primarily NCBI BioSample records, and complemented with data from the corresponding scientific literature. Overall, the results reinforce the view of Trichoderma as a cosmopolitan fungal genus, with representatives detected across Africa, Asia, Europe, North America, South America, and Oceania. No records were identified from Antarctica.
At the clade level, Clades 1, 2B, and 2C exhibited broad geographic distributions spanning multiple continents. Clade 1 was the most widely distributed lineage, being detected in countries from all inhabited continents, including China, Turkey, Egypt, Italy, Poland, Costa Rica, the United States, Brazil, Australia, South Africa, and New Zealand, among others. Similarly, Clade 2C showed an extensive global distribution, with records from Europe, Asia, Africa, Oceania, and the Americas, including Denmark, Spain, Russia, India, Australia, Zimbabwe, Brazil, Argentina, Peru, and the United States. Clade 2B also displayed a broad intercontinental distribution, occurring in countries such as Colombia, Brazil, Mexico, China, Turkey, Ethiopia, Malaysia, Australia, Argentina, and the United Kingdom.
In contrast, Clade 2A exhibited a markedly more restricted geographic distribution. Representatives of this lineage were identified only in Europe and Asia, with genomes originating from Spain, Iran, and South Korea. However, the apparent restricted distribution of Clade 2A should be interpreted cautiously because this lineage was represented by a substantially smaller number of genomes than the other major clades. Consequently, its limited geographic range may partially reflect undersampling rather than a true ecological or biogeographic restriction (Figure 4).
2.4. Distinct Genomic Profiles and Feature Correlations across Trichoderma Clades
To investigate large-scale genomic diversification within the genus Trichoderma, we analyzed multiple genome-wide structural and compositional metrics across the major phylogenomic clades. The evaluated parameters included genome assembly size, GC content, predicted gene counts, and the proportion of repetitive genomic elements.
Genome assembly characteristics differed significantly among the analyzed clades (Kruskal–Wallis test, assembly size: χ² = 141.35, df = 3, p < 2.2 × 10⁻¹⁶; GC content: χ² = 98.96, df = 3, p < 2.2 × 10⁻¹⁶). Clade 2C contained the largest genomes, with a median assembly size of 39.7 Mb (range: 36.2–45.8 Mb), followed by Clade 2A with a median of 37.8 Mb (36.2–38.6 Mb) and Clade 1 with 36.9 Mb (31.6–48.7 Mb). In contrast, Clade 2B exhibited the smallest genomes, with a median assembly size of 32.4 Mb (31.6–37.7 Mb) (Figure 5, Panel A).
GC content also varied significantly among clades. Clade 2B displayed the highest GC content, with a median of 53.2% (range: 50.3–56.6%), clearly distinct from the remaining clades. Clade 2A showed a median GC content of 48.9% (43.9–50.1%), while Clade 2C and Clade 1 exhibited similar median values of 48.6% (43.1–50.5%) and 48.3% (46.3–52.3%), respectively (Figure 5, Panel B). To further evaluate genomic patterns across Trichoderma, we assessed the relationship between genome assembly size and several genomic features, including GC content, repetitive element content, BUSCO multicopy genes, and the number of predicted genes. Spearman correlation analyses revealed significant associations for all evaluated variables. Genome assembly size showed a strong negative correlation with GC content (Spearman’s ρ = −0.63, p < 2.2 × 10⁻¹⁶). In contrast, genome size was positively correlated with the proportion of repetitive elements (ρ = 0.47, p = 5.38 × 10⁻¹²), the percentage of BUSCO multicopy genes (ρ = 0.53, p = 3.14 × 10⁻¹⁵), and the number of predicted genes (ρ = 0.81, p < 2.2 × 10⁻¹⁶). Among these variables, gene count displayed the strongest correlation with assembly size, suggesting that genome expansion in Trichoderma is associated with both increased gene content and repetitive DNA accumulation (Figure 5, Panel C-F).
2.5. Genome Conservation within and between Major Trichoderma Clades
To evaluate the degree of genomic conservation across the genus, pairwise whole-genome alignments were performed among all analyzed assemblies. A strong contrast was observed between intra-clade and inter-clade genome conservation patterns. Comparisons between genomes belonging to the same major phylogenomic clade showed substantially higher proportions of aligned genomic regions, with aligned bases ranging from 12.5% to nearly complete genome (>98%), and a median aligned fraction of 75.7%. In contrast, comparisons between genomes from different major clades exhibited markedly reduced genomic conservation, with aligned fractions ranging from only 5.4% to 30.8% and a median of 11.3%. Similarly, nucleotide identity among aligned regions differed between intra- and inter-clade comparisons. Within-clade genome alignments displayed average nucleotide identities ranging from 84.7% to 99.9%, with a median identity of 88.5%. In contrast, inter-clade comparisons showed a narrower and slightly lower identity range, varying from 84.4% to 85.9%, with a median of 85.0%. However, these inter-clade identity values should be interpreted cautiously, as only a small fraction of the genomes could be aligned between distantly related clades. Consequently, the calculated nucleotide identity reflects only the most conserved genomic regions and likely overestimates the true overall genomic conservation among the major Trichoderma lineages (Figure 6).
When genome conservation was evaluated independently within each major phylogenomic clade, substantial differences in genomic cohesion were observed. Clade 2C exhibited the highest degree of genome conservation, with a median aligned genomic fraction of 79.2%. Concordantly, this clade also showed the highest median nucleotide identity among aligned regions (88.9%). Clade 2B displayed the second-highest internal conservation, with a median aligned genomic fraction of 60.4% and a median nucleotide identity of 87.7%. Clade 1 exhibited a lower genomic conservation, with a median aligned genomic fraction of 54.1% and a median nucleotide identity of 86.7%. Clade 2A, although represented by a limited number of pairwise comparisons, showed the lowest genomic conservation, with a median aligned fraction of 22.7% and a median nucleotide identity of 85.8% (Figure 7).
2.6. Trichoderma Core Proteome
To explore the proteome divergence among the major Trichoderma clades, we performed an orthology-based analysis to identify core proteome and main clade-specific proteins, defined as orthologous groups present in at least 80% of genomes within a given clade and completely absent from genomes outside that lineage. The core proteome was composed of 3,491 orthologous protein groups. Functional annotation using eggNOG-mapper yielded a total of 1,761 unique KEGG Orthology (KO) identifiers. Subsequent metabolic pathway reconstruction using KEGGDecoder revealed a highly robust and streamlined metabolic architecture, with several key pathways displaying maximum (100%) completeness across the core genome dataset. Characterization of these fully conserved pathways highlighted three primary functional thematic groups: Carbohydrate-Active Machinery and Mycoparasitic Determinants: The core proteome maintained complete (100%) enzymatic cascades for starch and glycogen degradation, including alpha-amylase, glucoamylase, and beta-glucosidase. Crucially, chitinase activity was resolved at 100% completeness across all core assemblies, reinforcing the preservation of chitinolytic cell-wall degrading machinery as a foundational ancestral trait within the Trichoderma lineage. Amino Acid Anabolism and Nutrient Assimilation: The core proteome exhibited complete metabolic self-sufficiency (prototrophy) for key structural and signaling amino acids. Biosynthetic pathways for serine, threonine, glutamine, glycine, lysine, aspartate, glutamate, and the aromatic amino acids phenylalanine and tyrosine all achieved 100% validation scores. This anabolic capacity was supported by a fully conserved sulfur assimilation pathway, indicating a stable infrastructure for organic sulfur processing. Energy Conservation and Homeostasis: In terms of central carbon catabolism and organic acid management, pathways governing mixed-acid fermentation—specifically acetate production and the conversion of ethanol/acetate to acetaldehyde—were entirely complete. Furthermore, cellular homeostasis and metal detoxification mechanisms were anchored by the absolute conservation of the copper transporter CopA.
Collectively, these KEGG profile findings indicate that while accessory genomes drive niche-specific adaptations and secondary metabolite specialization, the Trichoderma core proteome preserves a highly efficient, rigid metabolic foundation optimized for aggressive carbohydrate breakdown, basic amino acid biosynthesis, and fundamental environmental survival mechanisms.
2.7. Proteome Divergence in Secondary Metabolism Repertoires among Trichoderma Main Clades
To investigate whether the major phylogenomic clades of Trichoderma differ not only in genome architecture but also in lineage-specific functional innovation, we compared the repertoires of single-copy clade-specific orthologous proteins and their associated metabolic functions. Despite exhibiting the largest genome assemblies, Clade 2C did not show the highest number of clade-specific proteins, with only 23 unique proteins identified. In contrast, Clade 2A contained the largest repertoire of clade-specific proteins (n = 81), followed by Clade 1 (n = 26). Clade 2B, which exhibited the smallest genome assemblies, contained only 14 clade-specific proteins, none of which retrieved functional annotations from KO, COG, or GO databases. COG functional classification of clade-specific proteins in Clades 1, 2A, and 2C revealed that successfully annotated sequences were predominantly associated with metabolic processes, spanning both primary and secondary metabolism. However, the overall functional annotation rate across these lineage-exclusive proteins was low, leaving the majority uncharacterized or assigned to unknown functions. (Figure 8, Panel A).
To further investigate the evolutionary divergence of secondary metabolism (SM) capabilities across the analyzed lineages, clade-specific protein sets were screened for functional domains associated with the biosynthesis of antifungal compounds, including polyketides, non-ribosomal peptides, terpenoids, and alkaloids. Overall, the number of strictly clade-specific SM proteins was relatively low, suggesting that much of the secondary metabolism repertoire is conserved across the genus or shared among multiple clades. Among the identified targets, enzymes involved in SM tailoring and modification were the most frequently detected, indicating that lineage-specific diversification is likely driven more by modifications of existing metabolite scaffolds than by the acquisition of entirely novel biosynthetic backbone enzymes (Figure 8, Panel B).
Distinct patterns of SM-associated enrichment were observed among clades. Clade 2A displayed the highest diversity of unique SM-related proteins and was the only lineage containing clade-specific proteins associated with alkaloid and toxin biosynthesis (n = 2). This clade additionally encoded one unique non-ribosomal peptide synthetase (NRPS) and two SM tailoring enzymes. Clades 1 and 2C were both primarily characterized by unique SM tailoring enzymes (n = 3 each). However, Clade 1 additionally contained one lineage-specific NRPS, whereas Clade 2C uniquely encoded a protein associated with terpenoid biosynthesis (n = 1). In contrast, Clade 2B lacked clade-specific proteins associated with any evaluated secondary metabolism category, suggesting that its distinctive ecological or phenotypic traits may depend on alternative functional pathways rather than lineage-specific secondary metabolite innovation.
2.8. Phylogenomic Distinction and Cohesion of the Putative Trichoderma sp. 2 "CB2" Lineage
We sought to quantitatively evaluate the genome-wide divergence of the highly distinct lineage identified in this study, which comprises the Colombian isolate CB2 clustered alongside three inconsistently annotated public accessions: T. harzianum ZL-811 (GCA_021186515) and T. reesei strains 5029 and 5001 (GCA_026225705 and GCA_026225735, respectively). Within our global phylogenomic reconstruction, this cohort formed a robustly supported monophyletic sister group to the Longibrachiatum species complex, positioning itself entirely outside the core T. reesei, T. parareesei, and Citrinoviride reference clades. To test whether this topological divergence reflects true species-level isolation, we performed comprehensive pairwise whole-genome comparisons across the principal lineages of Clade 2B. The resulting taxogenomic metrics revealed a stark, unambiguous discontinuity between intra-lineage cohesion and inter-lineage divergence: i) Broad Clade 2B Inter-lineage Baseline: Pairwise comparisons among all major established lineages within Clade 2B yielded a global median aligned genomic fraction of 58.3% and a median nucleotide identity of 87.7%, illustrating the high baseline genomic diversity characterizing this clade. ii) Intra-lineage Cohesion: In sharp contrast, genomes compared within their respective assigned lineages displayed profound conservation, with aligned genomic fractions consistently spanning 94.3% to 98.8% and median nucleotide identities exceeding 94.0% across all configurations (Figure 9, Panels A and B).
A focused, high-resolution comparison between the T. longibrachiatum sensu stricto clade and the Trichoderma sp. 2 "CB2" cohort further substantiated this pattern of genetic segregation. Internal genomic consistency within both groups was exceptionally high; the T. longibrachiatum lineage exhibited a median aligned genomic fraction of 98.8% with a median nucleotide identity of 99.4%, while the Trichoderma sp. 2 "CB2" lineage maintained a median aligned fraction of 97.4% and a median nucleotide identity of 98.9%. Conversely, cross-comparison metrics between T. longibrachiatum and Trichoderma sp. 2 "CB2" dropped precipitously. The median aligned genomic fraction fell to 80.2%, and the cross-lineage median nucleotide identity decreased markedly to 92.2%. Because this inter-lineage identity value sits substantially below the widely recognized 95%–96% whole-genome species-delimitation threshold for filamentous fungi, these data provide compelling numerical evidence that the "CB2" cohort represents a distinct, internally cohesive, and evolutionarily independent candidate phylogenomic species that warrants future formal polyphasic description (Figure 9, Panels C and D).
2.9. Clade-Specific Functional Signatures of the Trichoderma sp. 2 "CB2" Lineage
To uncover the metabolic features distinguishing the candidate Trichoderma sp. “CB2” lineage from other members of Clade 2B and from the genus as a whole, we searched for orthologous proteins specifically conserved within this lineage. A total of 49 lineage-specific proteins, ranging from 67 to 494 amino acids in length, were identified. Functional annotation retrieved recognizable domains or database matches for only six proteins, whereas the remaining 43 proteins lacked detectable PFAM, COG, KO, GO, or EggNOG annotations, suggesting the presence of highly divergent or previously uncharacterized proteins. The annotated subset revealed a combination of transcriptional regulators, plant cell wall–degrading enzymes, and proteins associated with secondary metabolism and detoxification pathways.
The lineage-specific proteome resolved into four major functional categories. First, proteins associated with transcriptional regulation and genomic specialization were identified, including a lineage-specific Zn(II)2Cys6 fungal transcription factor containing a canonical GAL4-like zinc cluster DNA-binding domain (PFAM: Zn_clus). In filamentous fungi, these transcription factors are frequently associated with the regulation of specialized metabolic pathways and cryptic secondary metabolite biosynthetic gene clusters. This regulatory component was accompanied by a putative secretory pathway protein carrying a DUF1242 domain, suggesting potential adaptations in intracellular trafficking and protein sorting.
A second functional category was related to plant biomass degradation and carbohydrate metabolism. The lineage uniquely encoded a pectate lyase superfamily protein belonging to the PL3 family (PFAM: Pectate_lyase_3), an enzyme involved in the degradation of pectin through cleavage of α-(1,4)-linked galacturonosyl residues in plant cell walls. In addition, a lineage-specific nucleoside-diphosphate-sugar epimerase associated with nucleotide-sugar interconversion was identified. Together, these proteins suggest specialized carbohydrate-active enzyme adaptations potentially linked to plant biomass utilization or host-associated interactions.
The third functional category involved secondary metabolism and xenobiotic processing. A lineage-specific cytochrome P450 monooxygenase (PFAM: p450) was identified and assigned to COG categories associated with lipid metabolism and secondary metabolite biosynthesis (categories I and Q). Cytochrome P450 enzymes commonly function as tailoring enzymes within fungal biosynthetic gene clusters, contributing to the structural diversification of bioactive secondary metabolites. The exclusive presence of this enzyme in the CB2 lineage suggests lineage-specific metabolic capabilities potentially associated with ecological competition or chemical defense.
Lastly, the lineage encoded a versatile aldehyde dehydrogenase (ALDH) family protein (PFAM: Aldedh), assigned to COG category E (amino acid transport and metabolism). This protein was associated with both NAD+- and NAD(P)+-dependent aldehyde dehydrogenase activities (EC 1.2.1.3 and EC 1.2.1.5) and mapped to multiple KEGG metabolic pathways, including glycolysis/gluconeogenesis, pyruvate metabolism, fatty acid degradation, amino acid catabolism, and xenobiotic detoxification. The broad metabolic connectivity of this enzyme suggests an important role in metabolic flexibility and cellular detoxification within the CB2 lineage.
3. Discussion
By deploying a curated dataset of 920 single-copy orthologous loci, this study resolved a robust and highly supported phylogenomic backbone for the genus Trichoderma, defining two principal evolutionary radiations further subdivided into four major clades (Clades 1, 2A, 2B, and 2C). Beyond recovering a broader evolutionary structure of the genus, the phylogenomic framework also exposed widespread taxonomic incongruences across several species complexes. Importantly, the genome-scale approach allowed these inconsistencies to be resolved with strong statistical support, while simultaneously highlighting the extent of misannotations currently present in public repositories such as NCBI. This issue is particularly relevant because NCBI constitutes one of the primary global references for fungal genome data used by researchers, industry, and regulatory agencies, all of which frequently rely on deposited taxonomic assignments for downstream analyses, strain validation, and biotechnology applications [4].
One of the clearest examples involved the T. asperellum–T. asperelloides complex, where multiple genomes currently annotated as T. asperellum were robustly nested within the T. asperelloides lineage. This pattern highlights the recurrent limitations of legacy morphology-based classifications in resolving closely related sister taxa within Trichoderma. Similarly, within Clade 2C, strains broadly labeled as T. harzianum were distributed across multiple independent lineages, including T. afroharzianum and T. pleuroticola. Furthermore, the absence of reciprocal monophyly between T. harzianum sensu stricto and T. simmonsii at the whole-genome scale suggests the existence of an ongoing evolutionary radiation within this complex. Such phylogenomic patterns may reflect incomplete lineage sorting, historical hybridization events, or highly permeable species boundaries that are difficult to resolve using traditional multilocus taxonomic approaches alone [11].
This genome-scale framework not only recovered the macro-topology of historically recognized species complexes but also revealed clear large-scale patterns of genome evolution across the genus. Notably, the major clades exhibited contrasting genomic architectures. Clade 2B contained the most compact genomes within the genus, whereas Clade 2C displayed the largest assemblies. In Clade 2B, genome reduction was accompanied by significantly higher GC content, suggesting contraction through the loss of AT-rich genomic regions. In contrast, genome expansion in Clade 2C was associated with increased predicted gene numbers, higher proportions of multicopy BUSCO markers, and moderate accumulation of repetitive genomic elements, indicating that gene duplication and repetitive DNA expansion both contributed to genome enlargement. Across the genus, genome size showed moderate positive correlations with predicted gene content, multicopy BUSCO percentages, and repetitive element abundance, whereas a strong negative correlation was observed between genome size and GC content. Collectively, these results indicate that the major Trichoderma clades have followed distinct trajectories of genome evolution involving differential patterns of genome expansion, contraction, duplication, and repetitive sequence dynamics.
Interestingly, genome expansion in Clade 2C was not accompanied by the acquisition of a proportionally larger repertoire of lineage-specific proteins, as this clade contained only 23 clade-specific single copy orthologous protein groups. In contrast, Clade 2A, despite exhibiting intermediate genome sizes, possessed the highest number of clade-specific single-copy orthologous groups in the genus, with 81 lineage-specific protein families identified. This disparity suggests that genome expansion in Clade 2C is driven primarily by internal genomic duplication processes and repetitive sequence accumulation rather than by extensive acquisition of novel functional gene repertoires. Conversely, the elevated number of lineage-specific proteins in Clade 2A may reflect a stronger tendency toward functional innovation and ecological specialization despite maintaining comparatively moderate genome sizes.
Functional profiling of the Trichoderma core proteome, including both single-copy and multicopy orthologous groups, uncovered a remarkably rigid metabolic foundation. The absolute (100%) conservation of primary amino acid biosynthetic cascades, sulfur assimilation pathways, and central carbohydrate-active machinery indicates that the fundamental saprotrophic lifestyle of the genus is highly optimized and evolutionarily fixed. Most notably, the universal conservation of complete chitinolytic pathways is consistent with the hypothesis that cell wall degradation and mycoparasitism are ancestral, foundational traits of the genus rather than localized, lineage-derived innovations.
In contrast, adaptation to specific ecological niches is driven almost exclusively by the flexible accessory and lineage-specific proteomes. Our secondary metabolism (SM) analysis revealed that the primary antifungal and defensive arsenals of Trichoderma are anchored by stable, ancestral core biosynthetic backbones (such as Polyketide Synthases-PKSs and Non-Ribosomal Peptide Synthetases-NRPSs). Cladal diversification occurs primarily through variations in auxiliary tailoring enzymes (such as Cytochromes P450 and monooxygenases) [36] and localized regulatory fine-tuning. For example, the unique enrichment of alkaloid and toxin tailoring components in Clade 2A points to specialized chemical warfare adaptations [37], whereas Clade 2B likely relies on uncharacterized noncanonical genes or specialized regulatory shifting to secure its ecological niche.
The identification of the lineage Trichoderma sp. “CB2” provides additional evidence of hidden phylogenomic diversity within Clade 2B. This cohort forms a strongly supported monophyletic sister lineage to the Longibrachiatum complex, yet exhibits substantial whole-genome divergence relative to neighboring species groups. Although genomic cohesion within the “CB2” lineage remained exceptionally high (>98% nucleotide identity), pairwise comparisons against T. longibrachiatum showed a marked reduction in nucleotide identity, reaching a median value of 92.2%. Because this value falls below the commonly used 95%–96% whole-genome similarity thresholds frequently considered in filamentous fungal species delimitation, the observed divergence supports the hypothesis that the “CB2” lineage may represent an independent candidate phylogenomic species requiring future formal polyphasic evaluation [38,39].
Functional characterization of the lineage-specific proteome further supports the distinctiveness of the “CB2” cohort. Of the 49 proteins identified as exclusive to this lineage, 43 lacked detectable annotations in current databases, suggesting the presence of a substantial fraction of highly divergent or still uncharacterized proteins. The remaining annotated proteins revealed a coordinated set of functions potentially associated with regulatory specialization, plant biomass degradation, secondary metabolism, and metabolic detoxification. Among these, the presence of a lineage-specific Zn(II)2Cys6 transcription factor suggests potential specialization in the regulation of secondary metabolism or niche-associated pathways [40,41]. Likewise, the identification of a PL3-family pectate lyase and a nucleoside-diphosphate-sugar epimerase indicates possible adaptations related to cell wall degradation and carbohydrate processing [42,43,44]. In addition, the exclusive cytochrome P450 monooxygenase identified in this lineage may contribute to specialized secondary metabolite tailoring or xenobiotic processing [36], while the multifunctional aldehyde dehydrogenase points to broad metabolic flexibility linked to central carbon metabolism and detoxification pathways [45].
Taken together, these genomic and functional patterns suggest that the “CB2” lineage possesses a combination of evolutionary and metabolic characteristics distinct from neighboring lineages within Clade 2B. While additional ecological, morphological, and reproductive evidence will be necessary to formally resolve its taxonomic status, these results illustrate how integrated phylogenomics and comparative functional analyses can help uncover previously unrecognized diversity within Trichoderma and refine the evolutionary framework of this economically and ecologically important fungal genus.
4. Materials and Methods
4.1. Genomic Data Collection and Sequencing of the Colombian Trichoderma Isolate
All genomes classified as Trichoderma and available in the NCBI Datasets repository were systematically collected beginning in July 2023. The dataset was updated approximately every six months to incorporate newly released assemblies, with the final update performed in January 2026, resulting in a total of 237 accessions. Mutant derivatives, duplicated strains, and assemblies with poor quality metrics were excluded from downstream analyses. When both GCA and GCF accessions were available for the same strain, the RefSeq (GCF) assembly was preferentially selected. Species identities and reference lineages were validated through consultation of the MycoBank database (https://www.mycobank.org), confirming that the corresponding NCBI accessions were associated with validly recognized taxa and reference strains whenever possible. Multiple validated reference genomes were included for several species to improve lineage consistency and phylogenetic robustness. Genome accessions used in this study as well as general genomic statistics, are described in supplementary table 1.
Additionally, 16 genomes corresponding to Trichoderma species not yet available in the NCBI repository at the time of analysis were incorporated from the study of Steindorff et al. [14]. These assemblies were downloaded from the JGI MycoCosm portal (https://mycocosm.jgi.doe.gov) and included the following strains: Trichoderma minutisporum DAOM175931, T. strigosellum IQ191, T. taiwanense IQ11, T. effusum DAOM230007, T. flagellatum TUCIM3334, T. sinense DAOM230004, T. zeloharzianum TUCIM5505, T. inhamatum CBS273-78, T. amazonicum CBS121216, T. amazonicum IB52, T. aggressivum SzMC3109, T. alni TUCIM2657, T. cerinum TUCIM2977, T. strictipile CBS347-93, T. spirale MS79, and T. helicum DAOM230021.
A novel Colombian Trichoderma isolate, designated strain CB2, was recovered from soil collected in the Urabá region of the department of Antioquia, northwestern Colombia, in April 2023. Isolation was performed using a serial dilution–plating method on acidified potato dextrose agar (PDA) supplemented with chloramphenicol to selectively inhibit bacterial growth. Genomic DNA was extracted using the QIAGEN DNeasy PowerSoil kit and sequenced using Illumina NovaSeq technology, generating paired-end reads of 150 bp. Quality assessment showed that 94% of raw read bases presented Phred scores ≥ Q30. Raw reads were filtered at Q30 with Cutadapt v3.5 [19], and then de novo genome assembly was performed using SPAdes v3.13.1 [20] with the --careful option enabled and testing of k-mer sizes 55 and 77. Contaminant contigs were identified using the Contig Annotation Tool (CAT) [21] and then removed from the assembly. The final filtered assembly had an estimated average sequencing depth of 87×, a total genome size of 31.3 Mb, and comprised 233 scaffolds with an N50 value of 610,626 bp. Isolate CB2 genomic raw reads were deposited at the SRA database under bioproject “PENDING”.
4.2. Phylogenomic Inference
For phylogenomic reconstruction, conserved single-copy orthologous genes were identified among the analyzed Trichoderma genomes using BUSCO v5.2.2 [22] with the sordariomycetes_odb10 lineage dataset and the parameter AUGUSTUS species=chaetomium_globosum. BUSCO-derived single-copy proteomes were subsequently processed with SonicParanoid v1.3.5 [23] to perform an additional orthology validation step and exclude potential paralogous loci. After curation, a final dataset comprising 920 non-redundant single-copy CDSs was retained for phylogenomic analysis.
Each orthologous CDS was individually aligned using MAFFT v7.490 [24]. Individual alignments were subsequently concatenated into a partitioned supermatrix using CatSequences (https://github.com/ChrisCreevey/catsequences). Maximum-likelihood phylogenetic inference was performed with IQ-TREE v3 [25] using a partitioned approach, with the best-fit substitution model for each partition selected independently using ModelFinder [26]. To reduce partition complexity while preserving model fit, the -rcluster 10 option was enabled. Branch support was evaluated using 2,000 SH-aLRT replicates and 5,000 ultrafast bootstrap pseudoreplicates [27].
The final phylogeny was rooted using Trichoderma orchidacearum (GCA_023653515). Tree visualization and annotation were performed using FigTree v1.4.4 (https://tree.bio.ed.ac.uk/software/figtree/), and final figure editing was completed in Adobe Illustrator.
4.3. Strain Metadata and Geographic Distribution Analysis
To explore the geographic distribution of the major Trichoderma phylogenomic clades, strain provenance metadata were compiled for all genomes included in this study. Country of origin information was retrieved from the NCBI BioSample database and complemented, when necessary, through consultation of the original publications describing the strains or genome assemblies. Genomes lacking reliable geographic information were excluded from the spatial analyses. Country names were standardized according to ISO 3166-1 conventions to ensure consistency during downstream mapping procedures.
Geographic visualization was performed in R using the tidyverse, sf, rnaturalearth, and ggplot2 packages. World map geometries were obtained from the rnaturalearth database and converted into simple feature (sf) objects for spatial plotting. Antarctica was excluded from the final map because no strains included in this study originated from this region.
To minimize biases associated with uneven sampling intensity among countries, the dataset was transformed into a presence/absence matrix, recording only whether a given clade had been detected in each country regardless of the number of genomes available. Spatial distributions were then visualized independently for each major phylogenomic clade using faceted maps generated with ggplot2, allowing direct comparison of their global geographic ranges.
4.4. Genome Repetitive Elements Masking and Annotation
Prior to genome annotation, repetitive elements were identified and masked using RepeatMasker (version 4) in combination with a custom repeat library constructed with RepeatModeler (version 2.0.7) [28,29]. The repeat library was assembled by downloading fungal repeat sequences from the Dfam database (dfam_fungi.fa, accessed January 2026) and generating a de novo repeat library from the reference genome Trichoderma atroviride P1 (accession GCA_020647795) using RepeatModeler. Both libraries were subsequently concatenated into a combined fungal repeat library (combined_fungal_library.fasta). Soft-masking of all genome assemblies was performed using RepeatMasker with the combined library, generating GFF-format annotation outputs (RepeatMasker flags: -lib combined_fungal_library.fasta -pa 32 -gff -xsmall). Following repeat masking, potential contaminating sequences were detected and removed using CAT_pack (version 6.0.1). Each genome assembly was classified at the contig level against the CAT NR database (version 20241212_CAT_nr_website, downloaded January 2026), and taxonomic names were assigned to all classified contigs using the CAT_pack add_names module. Contigs not classified as belonging to the genus Trichoderma were subsequently excluded from further analysis using an in-house Python script, yielding a set of taxonomically filtered genome assemblies. Structural annotation of the filtered genome assemblies was performed using BRAKER (braker.pl version 3.0.8) [30] in fungal mode, leveraging a curated protein database as evidence. Reference protein sequences were obtained from UniProtKB for the genus Trichoderma (CDHIT_uniprotkb_Trichoderma_2026_02_03.faa, accessed February 2026), and gene models were predicted for each assembly using the parameters --fungus --species=Trichoderma alongside the soft-masked filtered contigs as genomic input. The completeness of each predicted proteome was assessed using BUSCO (version 6.0.0) against the Sordariomycetes lineage dataset (sordariomycetes_odb10) in protein mode (-m prot), providing a standardized benchmark of annotation quality across all genomes. Finally, orthologous gene families across all annotated proteomes were inferred using SonicParanoid (version 1.3.5), with all proteome files supplied as a directory input. The resulting orthogroup assignments formed the basis for subsequent comparative genomic analyses across the sampled Trichoderma genomes.
4.5. Correlation Analysis of Genomic Features
Genome assembly statistics and annotation metrics were analyzed in R using a tab-delimited dataset containing information on assembly size, GC content, repeat masking, BUSCO duplication, transcript number, and phylogenetic clade assignment. Assembly lengths were expressed in megabases (Mbp). Differences in assembly size and GC content among Trichoderma clades were evaluated using the non-parametric Kruskal–Wallis test. Associations between assembly size and GC content, the proportion of repeat-masked sequence, the percentage of multicopy BUSCO genes, and the number of annotated transcripts were assessed using Spearman rank correlation tests based on complete observations. For visualization, scatter plots were generated with linear regression lines and 95% confidence intervals. For each association, the Spearman correlation coefficient (ρ), statistical significance (p-value), and slope of the fitted linear model were reported. Boxplots displaying the median and distribution of genome assembly size and GC content across clades were complemented by jittered individual observations.
4.6. Genome-to-Genome Alignment Analysis
Whole-genome pairwise alignments were performed using the DNAdiff pipeline implemented in MUMmer v4 [31] to estimate genome-wide nucleotide identity and the proportion of conserved aligned regions between assemblies. For each pairwise comparison, the percentage of aligned bases and the corresponding average nucleotide identity were extracted and compiled into a comparative matrix. Genome pairs were subsequently classified according to the phylogenomic clade assignments inferred in this study, and redundant reciprocal comparisons were excluded from downstream analyses. To reduce redundancy and avoid overrepresentation of highly similar genomes, very closely related strains within the same species were filtered prior to comparative analyses. When multiple genomes representing the same species were available, priority was given to assemblies corresponding to validated reference strains or accessions recognized in MycoBank whenever possible. This strategy allowed the retention of representative genomic diversity while minimizing bias caused by the inclusion of numerous nearly identical strains.
4.7. Core Proteome
Orthology inference across the analyzed Trichoderma genomes was performed using OrthoFinder. A representative protein sequence for each orthogroup was selected using the proteome of Trichoderma hamatum (GCA_000331835) as the reference source whenever available. A total of 22,401 orthogroups were identified across all analyzed genomes, of which 3,491 corresponded to core orthogroups present in all 208 genomes, representing 15.6% of the total orthogroup diversity. KEGG annotation of the core proteome identified a total of 1,761 unique KEGG Orthology (KO) entries.
4.8. Clade-Specific Protein Analysis
To minimize interference from multicopy paralogous protein families, the clade-specific protein analysis was restricted to orthologous groups classified as single-copy by SonicParanoid v1.3.5. SonicParanoid was run using the proteomes from all 208 selected genomes, and the resulting single-copy orthologous groups were screened to identify proteins present in at least 80% of the genomes within a given clade and completely absent from genomes outside that lineage.
Clade-specific proteins were identified using a custom Python script designed to detect orthogroups fulfilling these presence/absence criteria across the phylogenomic clades. Functional annotation of predicted proteomes and clade-specific proteins was performed using eggNOG-mapper (EMAPPER) [32].
To evaluate the metabolic and functional capabilities of the Trichoderma core proteome, a targeted pathway completeness analysis was performed. Functional annotation of the representative core proteome sequences was initially conducted using eggNOG-mapper to assign KEGG Orthology (KO) identifiers. A custom Python script was utilized to parse the resulting annotations file, filtering out unassigned characters and extracting a non-redundant set of unique KO terms. To meet the precise syntax requirements of downstream profiling tools, these unique identifiers were formatted into a tab-separated vertical layout mapping distinct sequence placeholders to individual KO terms. High-level functional and metabolic module profiling was subsequently executed using KEGG-decoder [33]. Functional pathway completeness values (ranging from 0.0 to 1.0) were calculated across all standard database modules.
4.9. Statistical Analyses and Visualization
Statistical analyses of Trichoderma genomic features were conducted in R/RStudio for macOS v2025.05.0+496. Data manipulation and summary statistics were performed primarily using the tidyverse package collection [34], while graphical visualization and figure arrangement were generated using ggplot2 [35] and ggpubr. Differences among phylogenomic clades were evaluated using non-parametric Kruskal–Wallis tests due to the non-normal distribution of several genomic variables. Boxplots, scatterplots, and correlation analyses were generated to explore genome structural variation across the analyzed lineages.
Supplementary Materials
The following supporting information can be downloaded at the website of this paper posted on Preprints.org, Figure S1: Comparison of genome assembly metrics before and after filtering; Figure S2: Expanded phylogenomic reconstruction of the genus Trichoderma; Table S1: Genome accessions and general genomic statistics.
Author Contributions
Conceptualization, I.L. and J.F.A.; methodology, J.F.A.; software, F.C. and J.F.A.; validation, J.L.-J., M.P.R. and J.F.A.; formal analysis, F.C. and J.F.A.; investigation, F.C., I.L., M. P..R. and J.F.A.; resources, J.F.A.; data curation, F.C., J.L.-J., I.L. and J.F.A.; writing—original draft preparation, F. C., J.L.-J. and J.F.A.; writing—review and editing, F. C., J.L.-J., M.P.R., I.L. and J.F.A.; visualization, J.F.A.; supervision, F.C. and J.F.A.; project administration, J.F.A.; funding acquisition, J.F.A. All authors have read and agreed to the published version of the manuscript.
Funding
This research received no external funding.
Institutional Review Board Statement
Not applicable.
Informed Consent Statement
Not applicable.
Data Availability Statement
Genomic raw reads for the CB2 isolate were deposited at the SRA database under BioProject "PENDING".
Acknowledgments
The authors acknowledge Bioorigen (Grupo Greenland) for providing the Colombian Trichoderma isolate CB2 and the Centro Nacional de Secuenciación Genómica (CNSG) at the Universidad de Antioquia for providing computational infrastructure.
Conflicts of Interest
The authors declare no conflicts of interest.
References
- Singh, S.P.; Vandana; Jain, A.; Kumar, R.; Kumar, S.; Kumar, S.V.; et al. Trichoderma: a versatile microbe from basic to nanotechnology. Arch. Phytopathol. Plant Prot. 2026, 59, 675–698. [Google Scholar] [CrossRef]
- Cai, F.; Druzhinina, I.S. In honor of John Bissett: authoritative guidelines on molecular identification of Trichoderma. Fungal Divers. 2021, 107, 1–69. [Google Scholar] [CrossRef]
- Chaverri, P.; Branco-Rocha, F.; Jaklitsch, W.; Gazis, R.; Degenkolb, T.; Samuels, G.J. Systematics of the Trichoderma harzianum species complex and the re-identification of commercial biocontrol strains. Mycologia 2015, 107, 558–590. [Google Scholar] [CrossRef] [PubMed]
- Steenwyk, J.L.; Balamurugan, C.; Raja, H.A.; Gonçalves, C.; Li, N.; Martin, F.; et al. Phylogenomics reveals extensive misidentification of fungal strains from the genus Aspergillus. Microbiol. Spectr. 2024, 12, e03980-23. [Google Scholar] [CrossRef] [PubMed]
- Druzhinina, I.S.; Komoń-Zelazowska, M.; Atanasova, L.; Seidl, V.; Kubicek, C.P. Evolution and Ecophysiology of the Industrial Producer Hypocrea jecorina (Anamorph Trichoderma reesei) and a New Sympatric Agamospecies Related to It. PLoS ONE 2010, 5, e9191. [Google Scholar] [CrossRef] [PubMed]
- Martinez, D.; Berka, R.M.; Henrissat, B.; Saloheimo, M.; Arvas, M.; Baker, S.E.; et al. Genome sequencing and analysis of the biomass-degrading fungus Trichoderma reesei (syn. Hypocrea jecorina). Nat. Biotechnol. 2008, 26, 553–560. [Google Scholar] [CrossRef] [PubMed]
- Bischof, R.H.; Ramoni, J.; Seiboth, B. Cellulases and beyond: the first 70 years of the enzyme producer Trichoderma reesei. Microb. Cell Fact. 2016, 15, 106. [Google Scholar] [CrossRef] [PubMed]
- Hinterdobler, W.; Li, G.; Spiegel, K.; Basyouni-Khamis, S.; Gorfer, M.; Schmoll, M. Trichoderma reesei Isolated From Austrian Soil With High Potential for Biotechnological Application. Front. Microbiol. 2021, 12, 552301. [Google Scholar] [CrossRef] [PubMed]
- Harman, G.E.; Herrera-Estrella, A.H.; Horwitz, B.A.; Lorito, M. Special issue: Trichoderma – from Basic Biology to Biotechnology. Microbiology 2012, 158, 1–2. [Google Scholar] [CrossRef] [PubMed]
- Kuhls, K.; Lieckfeldt, E.; Samuels, G.J.; Kovacs, W.; Meyer, W.; Petrini, O.; et al. Molecular evidence that the asexual industrial fungus Trichoderma reesei is a clonal derivative of the ascomycete Hypocrea jecorina. Proc. Natl. Acad. Sci. USA 1996, 93, 7755–7760. [Google Scholar] [CrossRef] [PubMed]
- Menicucci, A.; Iacono, S.; Ramos, M.; Fiorenzani, C.; Peres, N.A.; Timmer, L.W.; et al. Can whole genome sequencing resolve taxonomic ambiguities in fungi? The case study of Colletotrichum associated with ferns. Front. Fungal Biol. 2025, 6, 1540469. [Google Scholar] [CrossRef] [PubMed]
- Kubicek, C.P.; Steindorff, A.S.; Chenthamara, K.; Manganiello, G.; Henrissat, B.; Zhang, J.; et al. Evolution and comparative genomics of the most common Trichoderma species. BMC Genom. 2019, 20, 485. [Google Scholar] [CrossRef] [PubMed]
- Lupo, V.; Van Vlierberghe, M.; Vanderschuren, H.; Kerff, F.; Baurain, D.; Cornet, L. Contamination in Reference Sequence Databases: Time for Divide-and-Rule Tactics. Front. Microbiol. 2021, 12, 755101. [Google Scholar] [CrossRef] [PubMed]
- Steindorff, A.S.; Cai, F.M.; Ding, M.; Jiang, S.; Atanasova, L.; Baker, S.E.; et al. Phenogenomics reveals the ecology and evolution of Trichoderma fungi for sustainable agriculture. Nat. Microbiol. 2026, 11, 815–831. [Google Scholar] [CrossRef] [PubMed]
- Druzhinina, I.S.; Seidl-Seiboth, V.; Herrera-Estrella, A.; Horwitz, B.A.; Kenerley, C.M.; Monte, E.; et al. Trichoderma: the genomics of opportunistic success. Nat. Rev. Microbiol. 2011, 9, 749–759. [Google Scholar] [CrossRef] [PubMed]
- Mohanta, T.K.; Al-Harrasi, A. Fungal genomes: suffering with functional annotation errors. IMA Fungus 2021, 12, 32. [Google Scholar] [CrossRef] [PubMed]
- Dou, K.; Lu, Z.; Wu, Q.; Ni, M.; Yu, C.; Wang, M.; et al. MIST: a Multilocus Identification System for Trichoderma. Appl. Environ. Microbiol. 2020, 86, e01532-20. [Google Scholar] [CrossRef] [PubMed]
- Letsch, H.; Greve, C.; Hundsdoerfer, A.K.; Irisarri, I.; Moore, J.M.; Espeland, M.; et al. Type Genomics: A Framework for Integrating Genomic Data into Biodiversity and Taxonomic Research. Syst. Biol. 2025, 74, 1029–1044. [Google Scholar] [CrossRef] [PubMed]
- Martin, M. Cutadapt removes adapter sequences from high-throughput sequencing reads. EMBnet. J. 2011, 17, 10. [Google Scholar] [CrossRef]
- Bankevich, A.; Nurk, S.; Antipov, D.; Gurevich, A.A.; Dvorkin, M.; Kulikov, A.S.; et al. SPAdes: A new genome assembly algorithm and its applications to single-cell sequencing. J. Comput. Biol. 2012, 19, 455–477. [Google Scholar] [CrossRef] [PubMed]
- Von Meijenfeldt, F.A.B.; Arkhipova, K.; Cambuy, D.D.; Coutinho, F.H.; Dutilh, B.E. Robust taxonomic classification of uncharted microbial sequences and bins with CAT and BAT. Genome Biol. 2019, 20, 217. [Google Scholar] [CrossRef] [PubMed]
- Simão, F.A.; Waterhouse, R.M.; Ioannidis, P.; Kriventseva, E.V.; Zdobnov, E.M. BUSCO: assessing genome assembly and annotation completeness with single-copy orthologs. Bioinformatics 2015, 31, 3210–3212. [Google Scholar] [CrossRef] [PubMed]
- Cosentino, S.; Iwasaki, W. SonicParanoid: fast, accurate and easy orthology inference. Bioinformatics 2019, 35, 149–151. [Google Scholar] [CrossRef] [PubMed]
- Katoh, K.; Standley, D.M. MAFFT Multiple Sequence Alignment Software Version 7: Improvements in Performance and Usability. Mol. Biol. Evol. 2013, 30, 772–780. [Google Scholar] [CrossRef] [PubMed]
- Minh, B.Q.; Schmidt, H.A.; Chernomor, O.; Schrempf, D.; Woodhams, M.D.; von Haeseler, A.; et al. IQ-TREE 2: New Models and Efficient Methods for Phylogenetic Inference in the Genomic Era. Mol. Biol. Evol. 2020, 37, 1530–1534. [Google Scholar] [CrossRef] [PubMed]
- Kalyaanamoorthy, S.; Minh, B.Q.; Wong, T.K.F.; Von Haeseler, A.; Jermiin, L.S. ModelFinder: fast model selection for accurate phylogenetic estimates. Nat. Methods 2017, 14, 587–589. [Google Scholar] [CrossRef] [PubMed]
- Hoang, D.T.; Chernomor, O.; Von Haeseler, A.; Minh, B.Q.; Vinh, L.S. UFBoot2: Improving the Ultrafast Bootstrap Approximation. Mol. Biol. Evol. 2018, 35, 518–522. [Google Scholar] [CrossRef] [PubMed]
- Flynn, J.M.; Hubley, R.; Goubert, C.; Rosen, J.; Clark, A.G.; Feschotte, C.; et al. RepeatModeler2 for automated genomic discovery of transposable element families. Proc. Natl. Acad. Sci. USA 2020, 117, 9451–9457. [Google Scholar] [CrossRef] [PubMed]
- Saha, S.; Bridges, S.; Magbanua, Z.V.; Peterson, D.G. Computational Approaches and Tools Used in Identification of Dispersed Repetitive DNA Sequences. Trop. Plant Biol. 2008, 1, 85–96. [Google Scholar] [CrossRef]
- Gabriel, L.; Brůna, T.; Hoff, K.J.; Ebel, M.; Lomsadze, A.; Borodovsky, M.; Stanke, M. BRAKER3: Fully automated genome annotation using RNA-seq and protein evidence with GeneMark-ETP, AUGUSTUS, and TSEBRA. Genome Res. 2024, 34, 769–777. [Google Scholar] [CrossRef] [PubMed]
- Marçais, G.; Delcher, A.L.; Phillippy, A.M.; Coston, R.; Salzberg, S.L.; Zimin, A. MUMmer4: A fast and versatile genome alignment system. PLoS Comput. Biol. 2018, 14, e1005944. [Google Scholar] [CrossRef] [PubMed]
- Cantalapiedra, C.P.; Hernández-Plaza, A.; Letunic, I.; Bork, P.; Huerta-Cepas, J. eggNOG-mapper v2: Functional Annotation, Orthology Assignments, and Domain Prediction at the Metagenomic Scale. Mol. Biol. Evol. 2021, 38, 5825–5829. [Google Scholar] [CrossRef] [PubMed]
- Graham, E.D.; Heidelberg, J.F.; Tully, B.J. Potential for primary productivity in a globally-distributed bacterial phototroph. ISME J. 2018, 12, 1861–1866. [Google Scholar] [CrossRef] [PubMed]
- Wickham, H.; Averick, M.; Bryan, J.; Chang, W.; McGowan, L.; François, R.; et al. Welcome to the Tidyverse. J. Open Source Softw. 2019, 4, 1686. [Google Scholar] [CrossRef]
- Wickham, H. ggplot2; Springer International Publishing: Cham, Switzerland, 2016. [Google Scholar] [CrossRef]
- Lin, H.-C.; Tsunematsu, Y.; Dhingra, S.; Xu, W.; Fukutomi, M.; Chooi, Y.-H.; et al. Generation of Complexity in Fungal Terpene Biosynthesis: Discovery of a Multifunctional Cytochrome P450 in the Fumagillin Pathway. J. Am. Chem. Soc. 2014, 136, 4426–4436. [Google Scholar] [CrossRef] [PubMed]
- Schardl, C.L.; Young, C.A.; Hesse, U.; Amyotte, S.G.; Andreeva, K.; Calie, P.J.; et al. Plant-Symbiotic Fungi as Chemical Engineers: Multi-Genome Analysis of the Clavicipitaceae Reveals Dynamics of Alkaloid Loci. PLoS Genet. 2013, 9, e1003323. [Google Scholar] [CrossRef] [PubMed]
- Matute, D.R.; Sepúlveda, V.E. Fungal species boundaries in the genomics era. Fungal Genet. Biol. 2019, 131, 103249. [Google Scholar] [CrossRef] [PubMed]
- Inderbitzin, P.; Robbertse, B.; Schoch, C.L. Species Identification in Plant-Associated Prokaryotes and Fungi Using DNA. Phytobiomes J. 2020, 4, 103–114. [Google Scholar] [CrossRef] [PubMed]
- Yin, W.; Keller, N.P. Transcriptional regulatory elements in fungal secondary metabolism. J. Microbiol. 2011, 49, 329–339. [Google Scholar] [CrossRef] [PubMed]
- Gonzalez Ramos, V.M.; Kowalczyk, J.E.; Maina, H.N.; Talag, J.; Ahrendt, S.; Lipzen, A.; et al. The Zn(II)2Cys6 transcription factor Ds Ace3 is a major activator of cellulases in the white-rot fungus Dichomitus squalens. Appl. Environ. Microbiol. 2026, 92, e01548-25. [Google Scholar] [CrossRef] [PubMed]
- Kadooka, C.; Yakabe, S.; Hira, D.; Futagami, T.; Goto, M.; Oka, T. Functional redundancy and divergence of UDP-glucose 4-epimerases in galactose metabolism and cell wall biosynthesis in Aspergillus nidulans. Fungal Genet. Biol. 2025, 177, 103972. [Google Scholar] [CrossRef] [PubMed]
- Atanasova, L.; Dubey, M.; Grujić, M.; Gudmundsson, M.; Lorenz, C.; Sandgren, M.; et al. Evolution and functional characterization of pectate lyase PEL12, a member of a highly expanded Clonostachys rosea polysaccharide lyase 1 family. BMC Microbiol. 2018, 18, 178. [Google Scholar] [CrossRef] [PubMed]
- Choi, J.; Kim, K.-T.; Jeon, J.; Lee, Y.-H. Fungal plant cell wall-degrading enzyme database: a platform for comparative and evolutionary genomics in fungi and Oomycetes. BMC Genom. 2013, 14, S7. [Google Scholar] [CrossRef] [PubMed]
- Lee, J.; Watanabe, T.; Kobayashi, N.; Kido, A.; Watanabe, T. Diversity of Aromatic Aldehyde Dehydrogenases in Ceriporiopsis subvermispora: Insights into Fungal Vanillin Metabolism. Appl. Biochem. Biotechnol. 2026, 198, 472–491. [Google Scholar] [CrossRef] [PubMed]
Figure 1.
Maximum-likelihood phylogenomic tree of Trichoderma reconstructed using IQ-TREE from a concatenated alignment of 920 conserved CDS partitions. Branch support was assessed using 2000 SH-aLRT replicates and 5000 ultrafast bootstrap (UFBoot) replicates. The tree was rooted using Trichoderma orchidacearum strain COAD-3006 (GCA_023653515) as outgroup. Major phylogenomic groups corresponding to Clade 1, Clade 2A, Clade 2B, and Clade 2C are highlighted with distinct colors. Black circles indicate nodes receiving maximal statistical support (100/100 SH-aLRT/UFBoot), whereas support values are explicitly shown for nodes with lower support.
Figure 1.
Maximum-likelihood phylogenomic tree of Trichoderma reconstructed using IQ-TREE from a concatenated alignment of 920 conserved CDS partitions. Branch support was assessed using 2000 SH-aLRT replicates and 5000 ultrafast bootstrap (UFBoot) replicates. The tree was rooted using Trichoderma orchidacearum strain COAD-3006 (GCA_023653515) as outgroup. Major phylogenomic groups corresponding to Clade 1, Clade 2A, Clade 2B, and Clade 2C are highlighted with distinct colors. Black circles indicate nodes receiving maximal statistical support (100/100 SH-aLRT/UFBoot), whereas support values are explicitly shown for nodes with lower support.
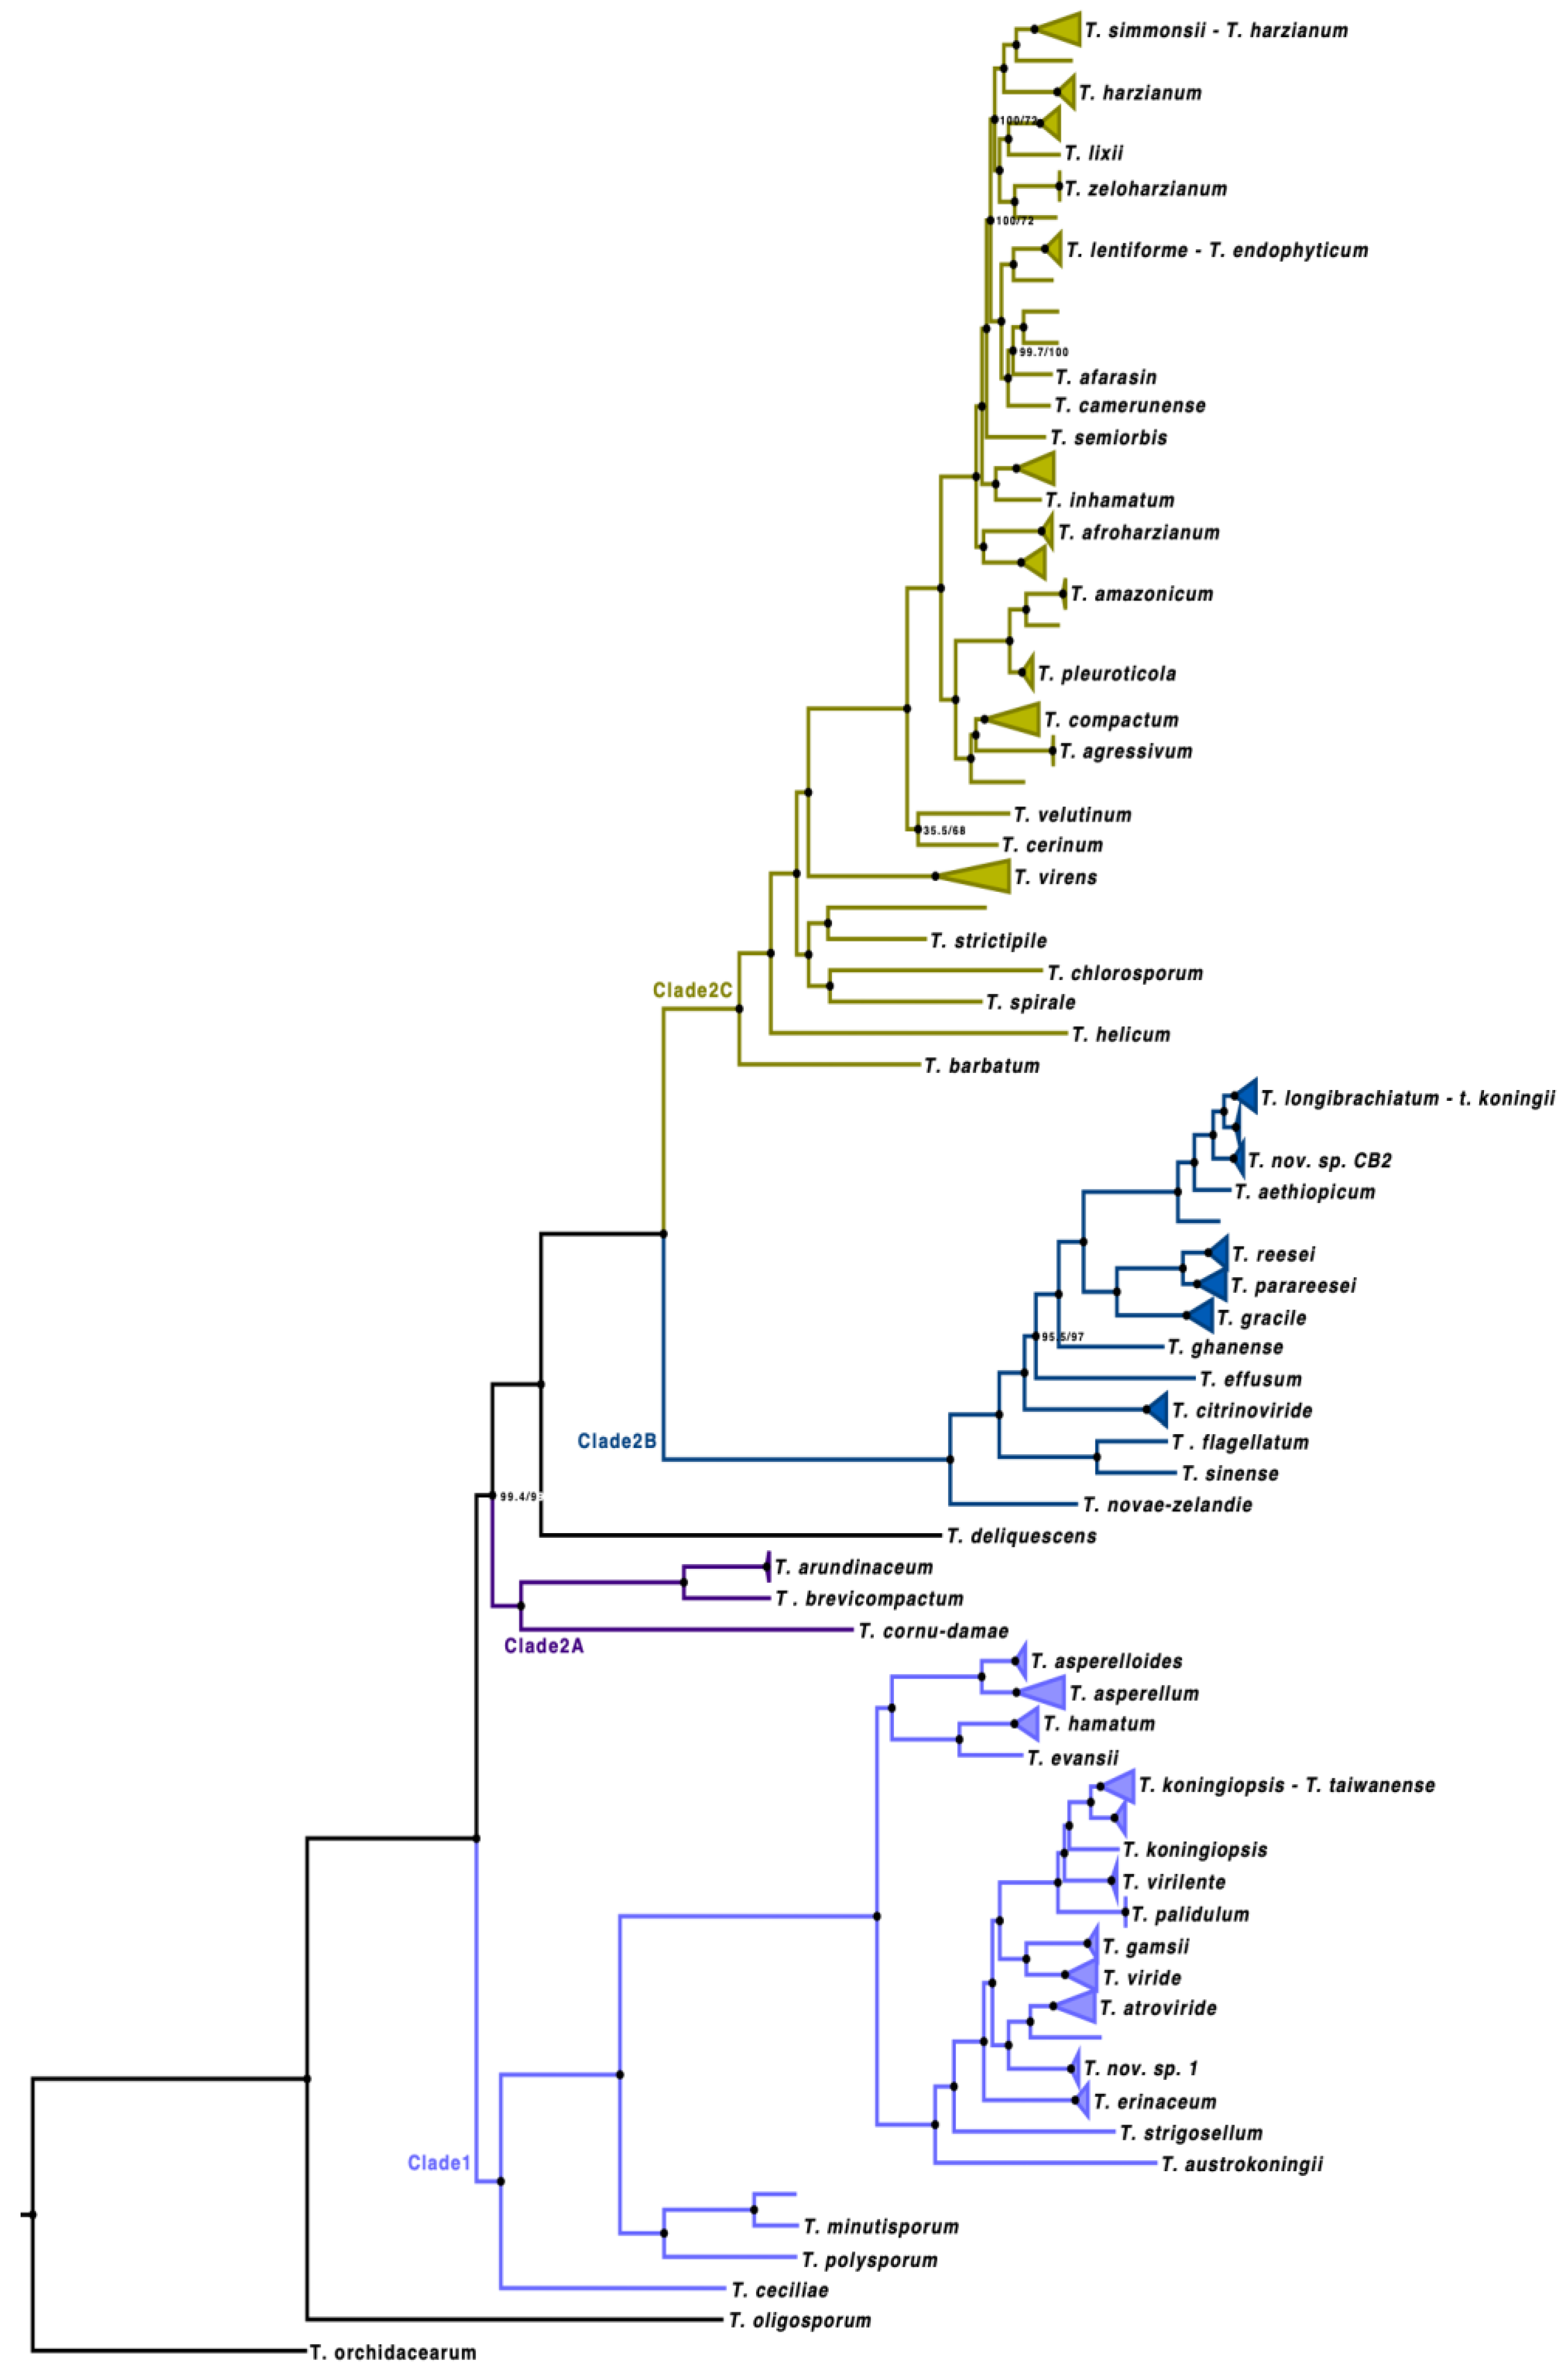
Figure 2.
Maximum-likelihood phylogenomic tree corresponding to Trichoderma Clade 1, reconstructed using IQ-TREE from the concatenated alignment of 920 conserved CDS partitions. This tree represents a detailed subtree extracted from the global phylogenomic reconstruction shown in Figure 1 and was rooted using Trichoderma ceciliae strain CBS 130010 (GCA_051819845). Branch support values correspond to SH-aLRT/UFBoot support obtained from 2000 SH-aLRT replicates and 5000 ultrafast bootstrap replicates and are indicated at each node. Species-level lineages are represented as collapsed cartoon clades to facilitate visualization of the overall phylogenetic structure within Clade 1.
Figure 2.
Maximum-likelihood phylogenomic tree corresponding to Trichoderma Clade 1, reconstructed using IQ-TREE from the concatenated alignment of 920 conserved CDS partitions. This tree represents a detailed subtree extracted from the global phylogenomic reconstruction shown in Figure 1 and was rooted using Trichoderma ceciliae strain CBS 130010 (GCA_051819845). Branch support values correspond to SH-aLRT/UFBoot support obtained from 2000 SH-aLRT replicates and 5000 ultrafast bootstrap replicates and are indicated at each node. Species-level lineages are represented as collapsed cartoon clades to facilitate visualization of the overall phylogenetic structure within Clade 1.
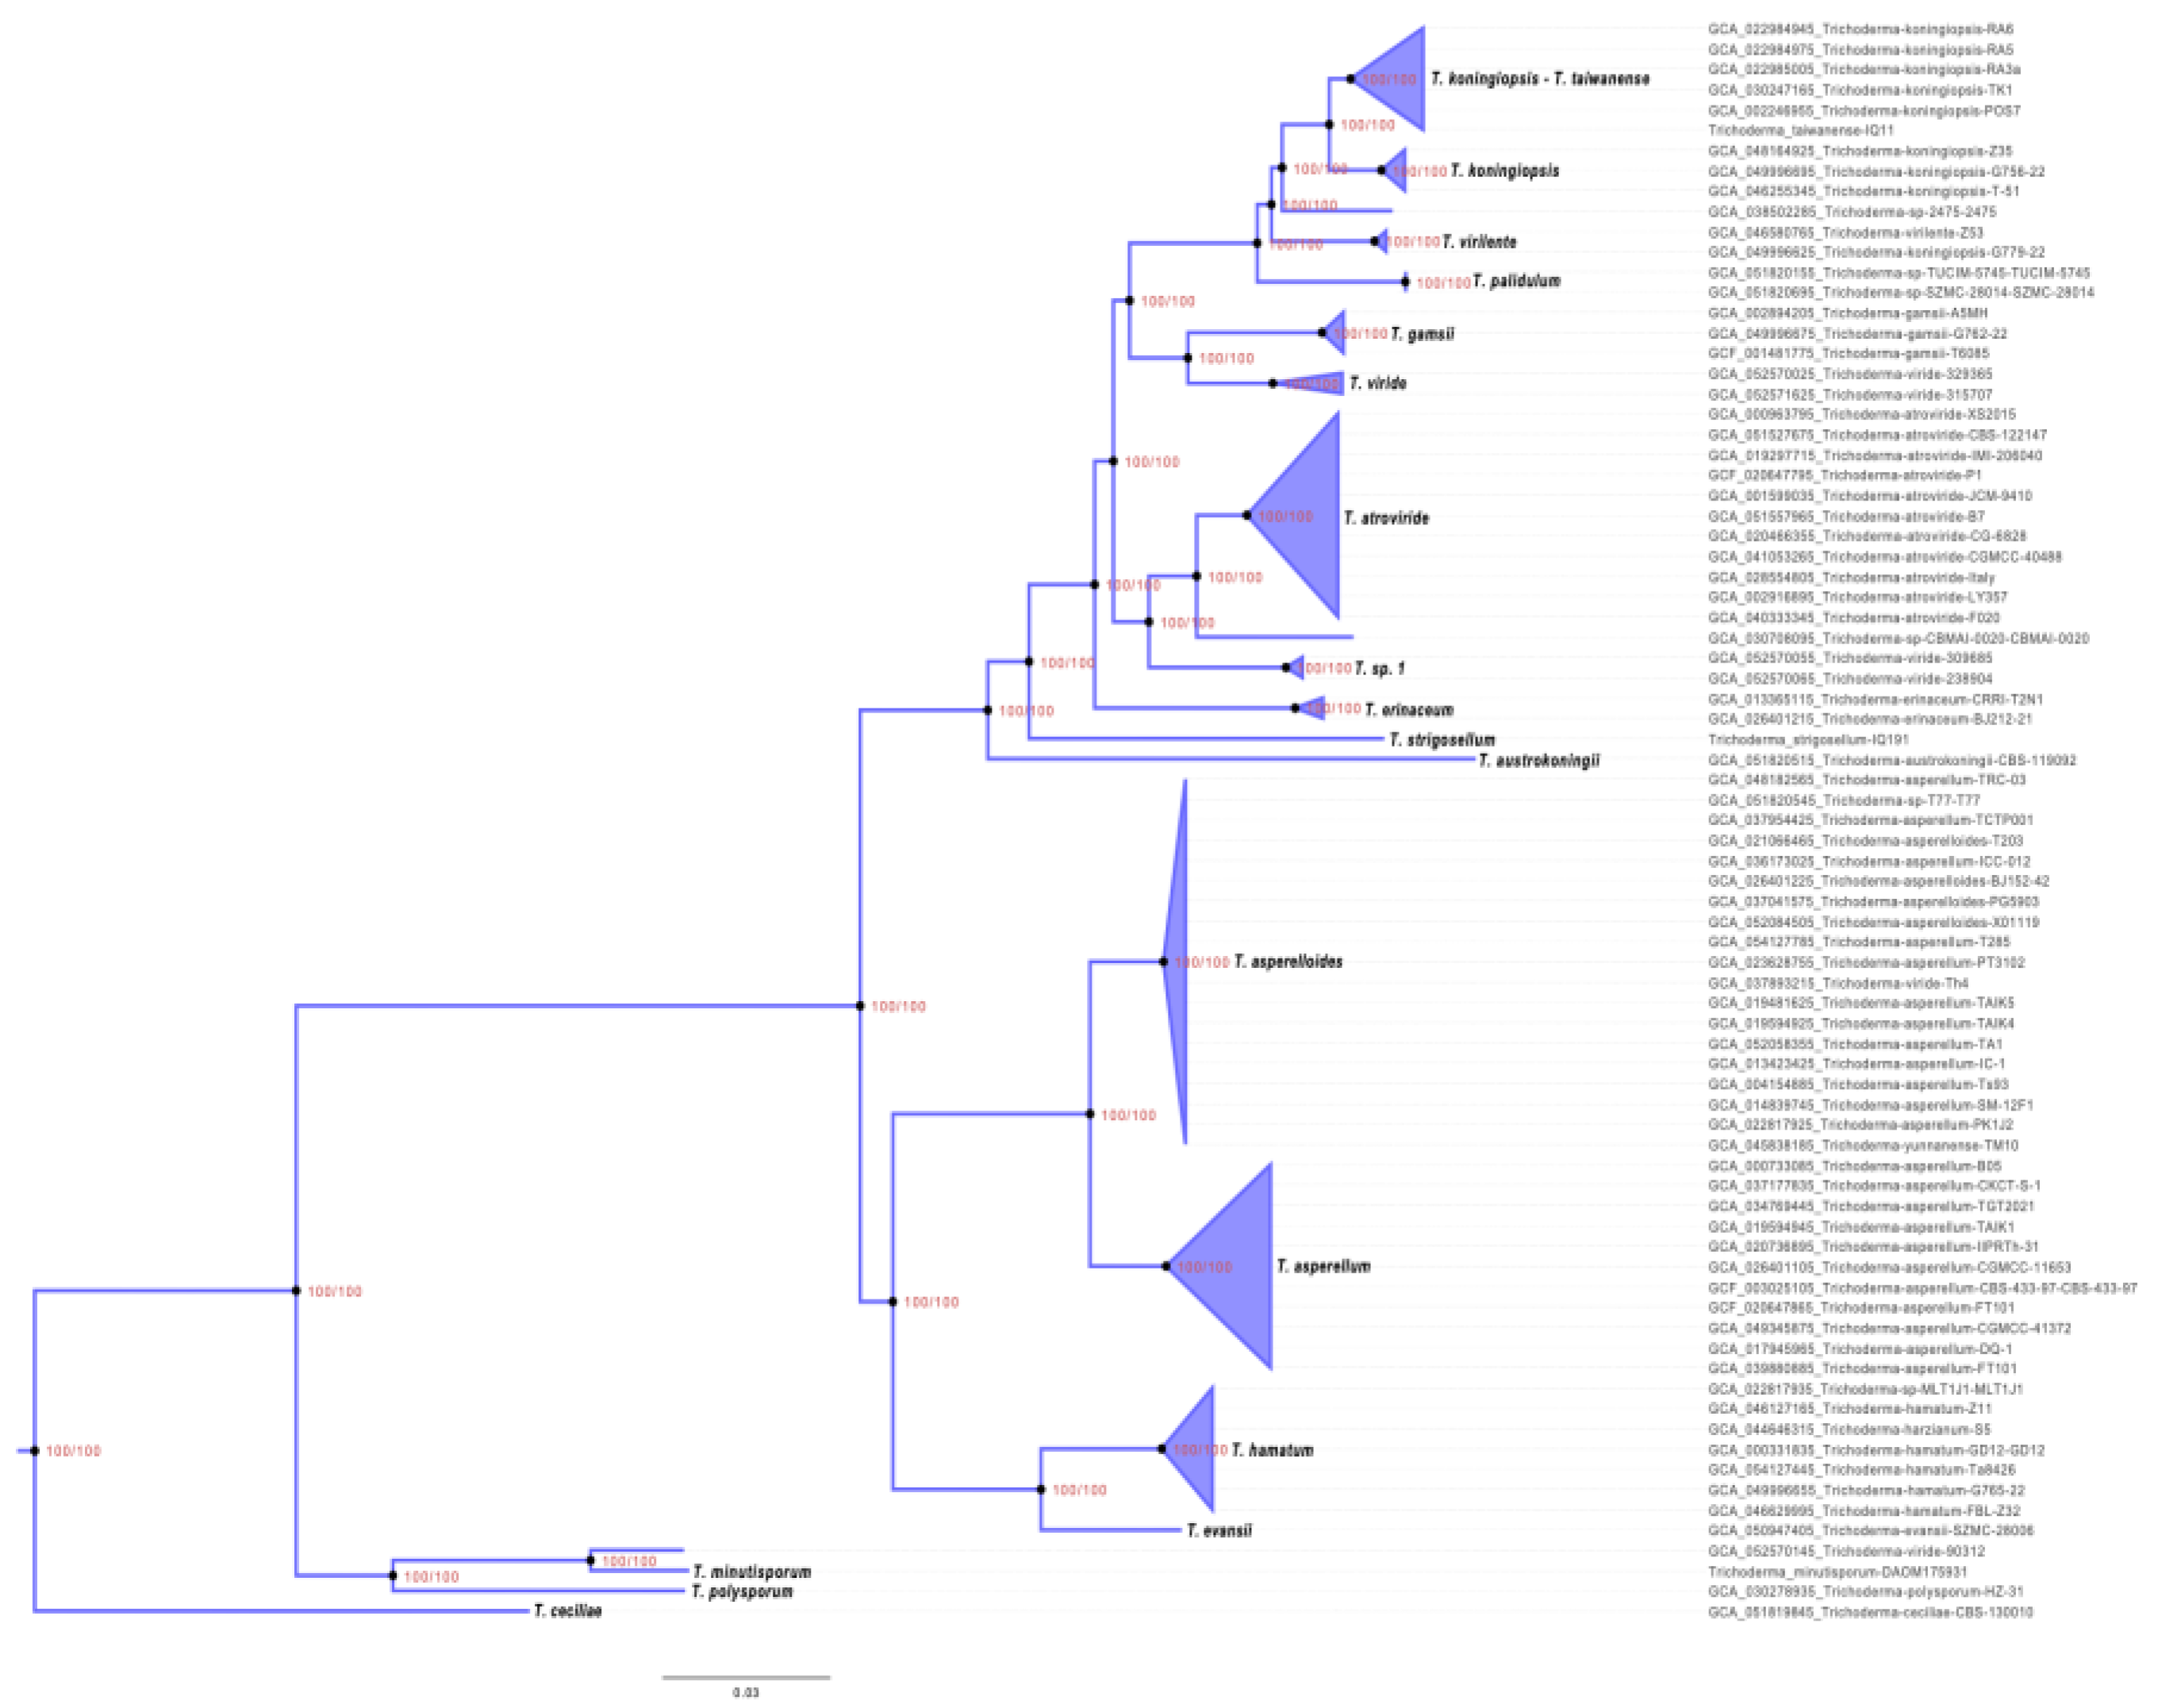
Figure 3.
Maximum-likelihood phylogenomic tree corresponding to Trichoderma Clade 2, reconstructed using IQ-TREE from the concatenated alignment of 920 conserved CDS partitions. This subtree was extracted from the global phylogenomic reconstruction shown in Figure 1 and encompasses the major lineages designated as Clade 2A, Clade 2B, and Clade 2C. Branch support values correspond to SH-aLRT/UFBoot support obtained from 2000 SH-aLRT replicates and 5000 ultrafast bootstrap replicates and are indicated at each node. Species-level lineages are represented as collapsed cartoon clades to facilitate visualization of the broader phylogenetic relationships.
Figure 3.
Maximum-likelihood phylogenomic tree corresponding to Trichoderma Clade 2, reconstructed using IQ-TREE from the concatenated alignment of 920 conserved CDS partitions. This subtree was extracted from the global phylogenomic reconstruction shown in Figure 1 and encompasses the major lineages designated as Clade 2A, Clade 2B, and Clade 2C. Branch support values correspond to SH-aLRT/UFBoot support obtained from 2000 SH-aLRT replicates and 5000 ultrafast bootstrap replicates and are indicated at each node. Species-level lineages are represented as collapsed cartoon clades to facilitate visualization of the broader phylogenetic relationships.
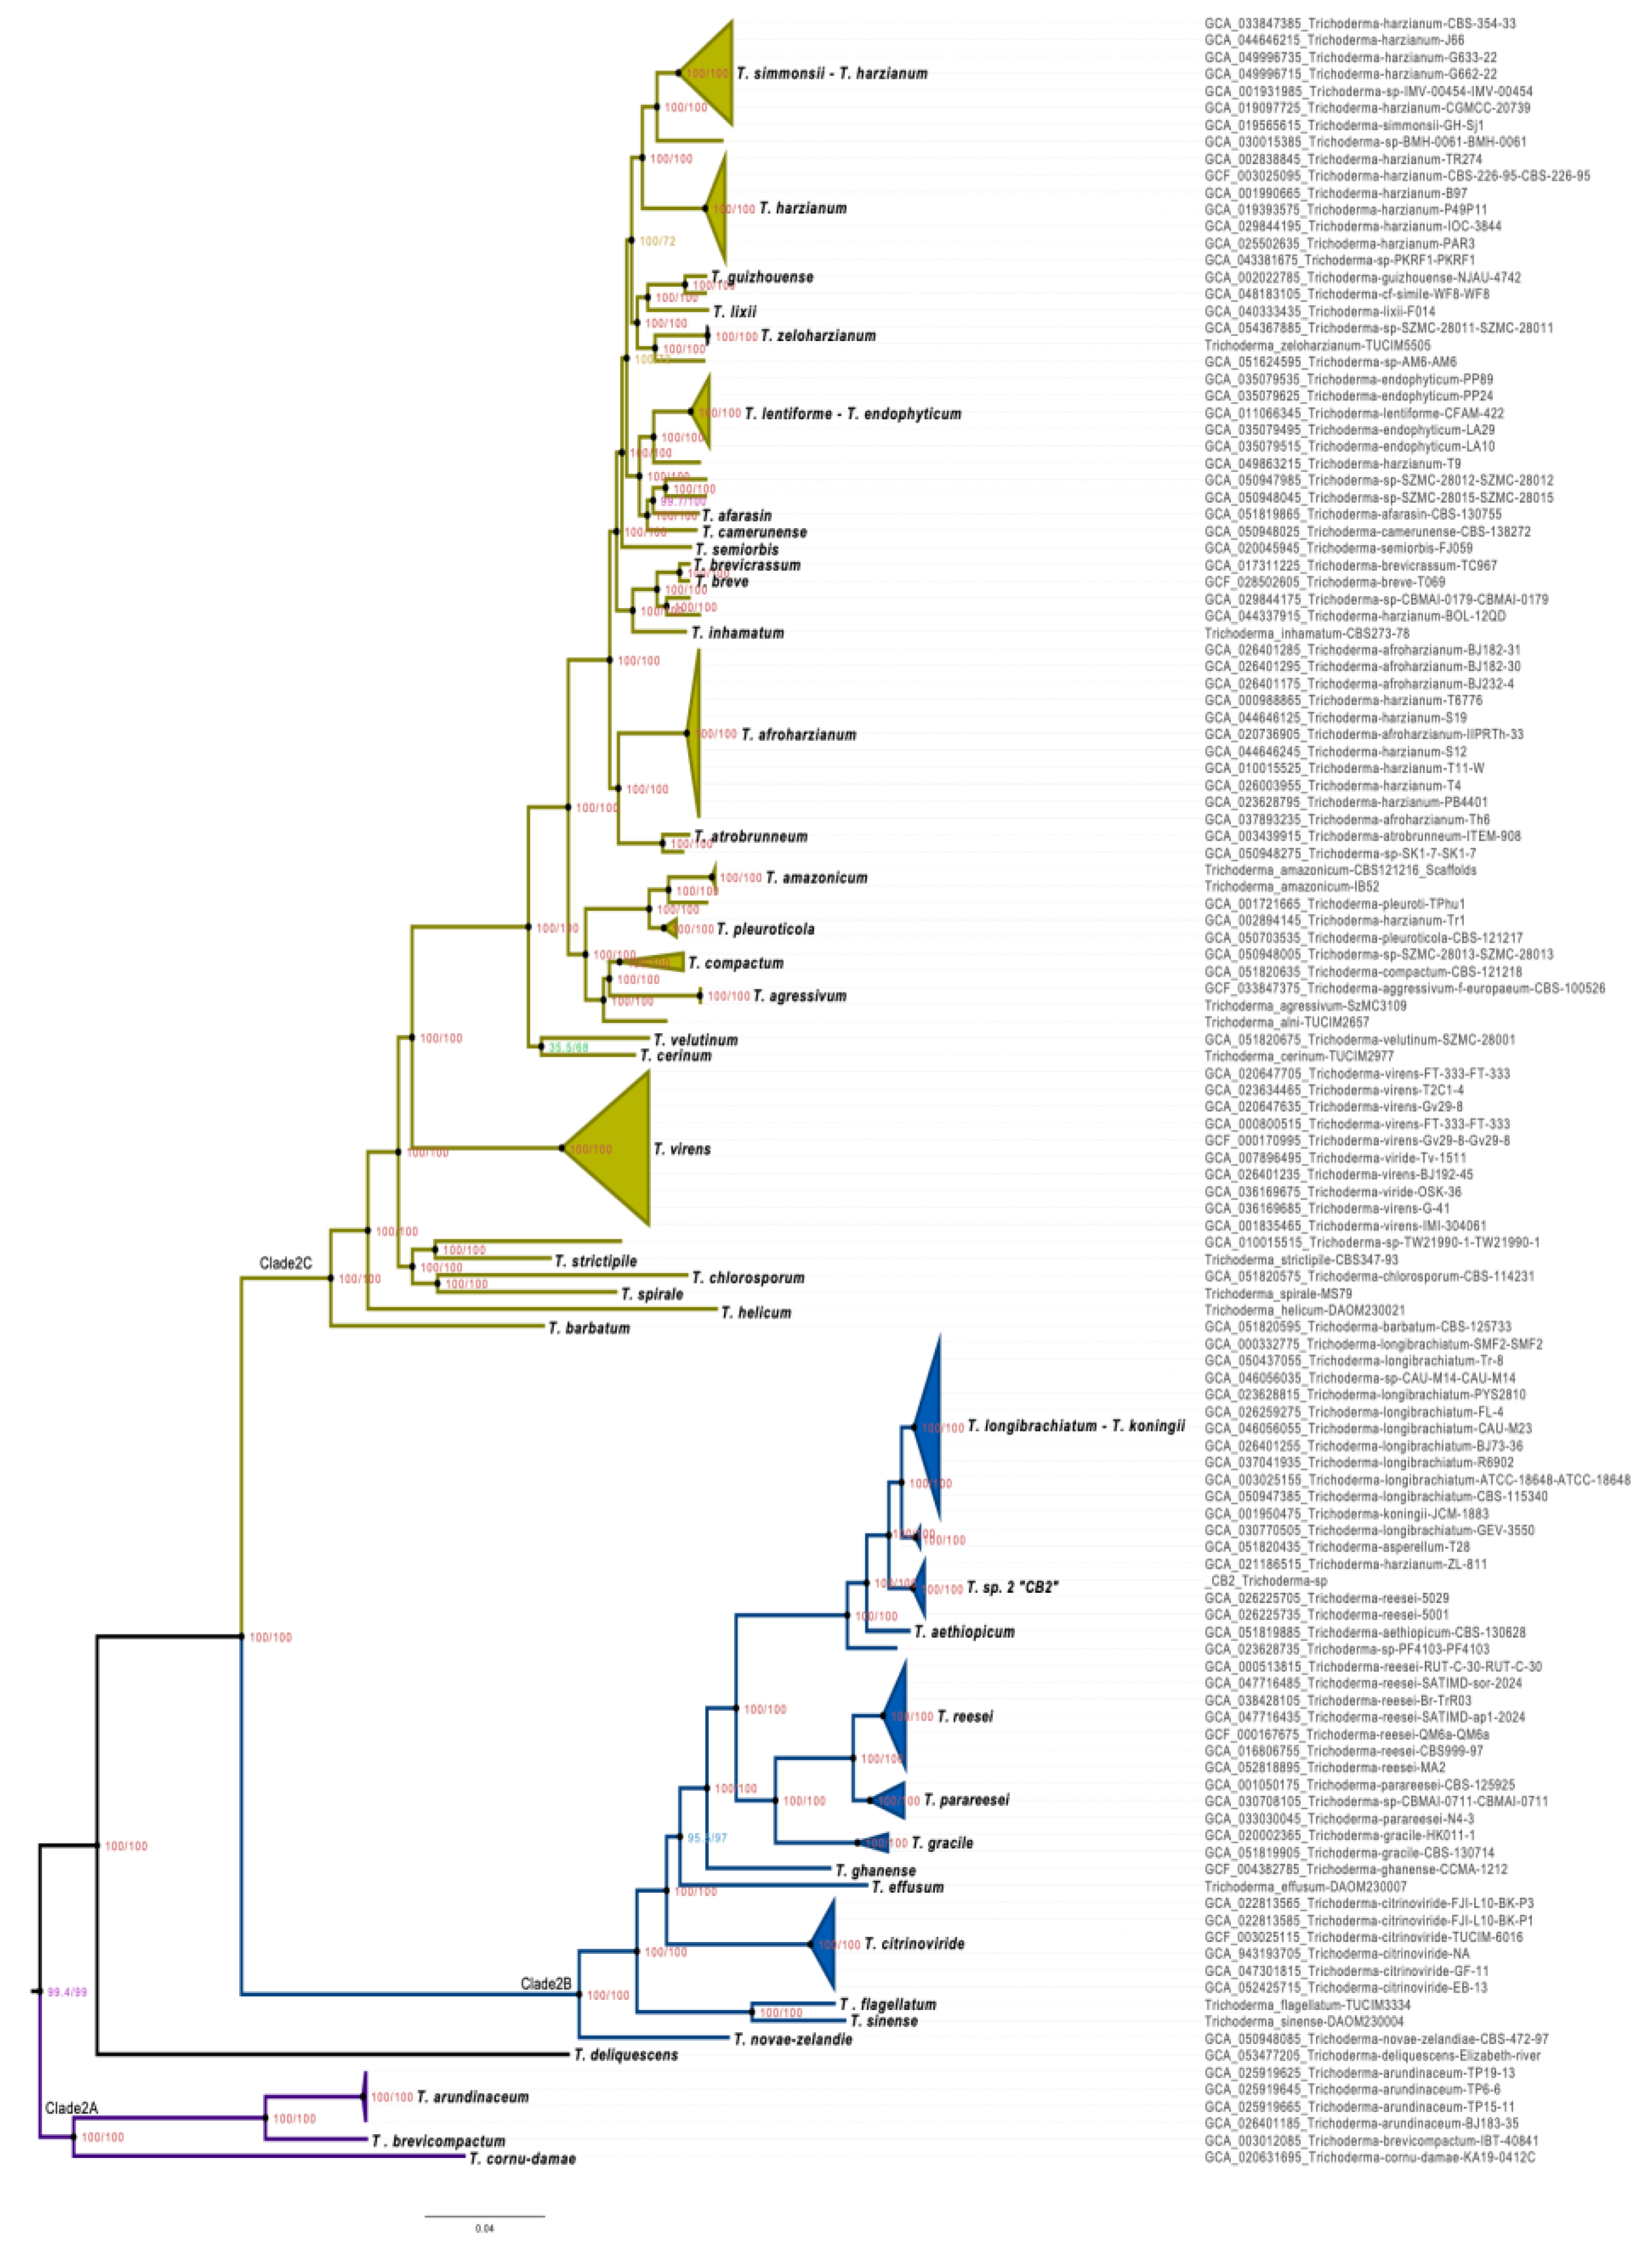
Figure 4.
Global geographic presence and distribution of four major Trichoderma clades. Geographic distribution maps are faceted independently for Clade 1 (light slate blue), Clade 2A (dark purple), Clade 2B (royal blue), and Clade 2C (olive drab). Filled colored regions indicate countries with at least one confirmed genome isolation event belonging to that specific clade. Light gray regions represent countries where the respective clade has not been recorded or where geographical metadata was unavailable. Strains lacking geographical provenance in public repositories or associated literature were excluded from spatial mapping.
Figure 4.
Global geographic presence and distribution of four major Trichoderma clades. Geographic distribution maps are faceted independently for Clade 1 (light slate blue), Clade 2A (dark purple), Clade 2B (royal blue), and Clade 2C (olive drab). Filled colored regions indicate countries with at least one confirmed genome isolation event belonging to that specific clade. Light gray regions represent countries where the respective clade has not been recorded or where geographical metadata was unavailable. Strains lacking geographical provenance in public repositories or associated literature were excluded from spatial mapping.
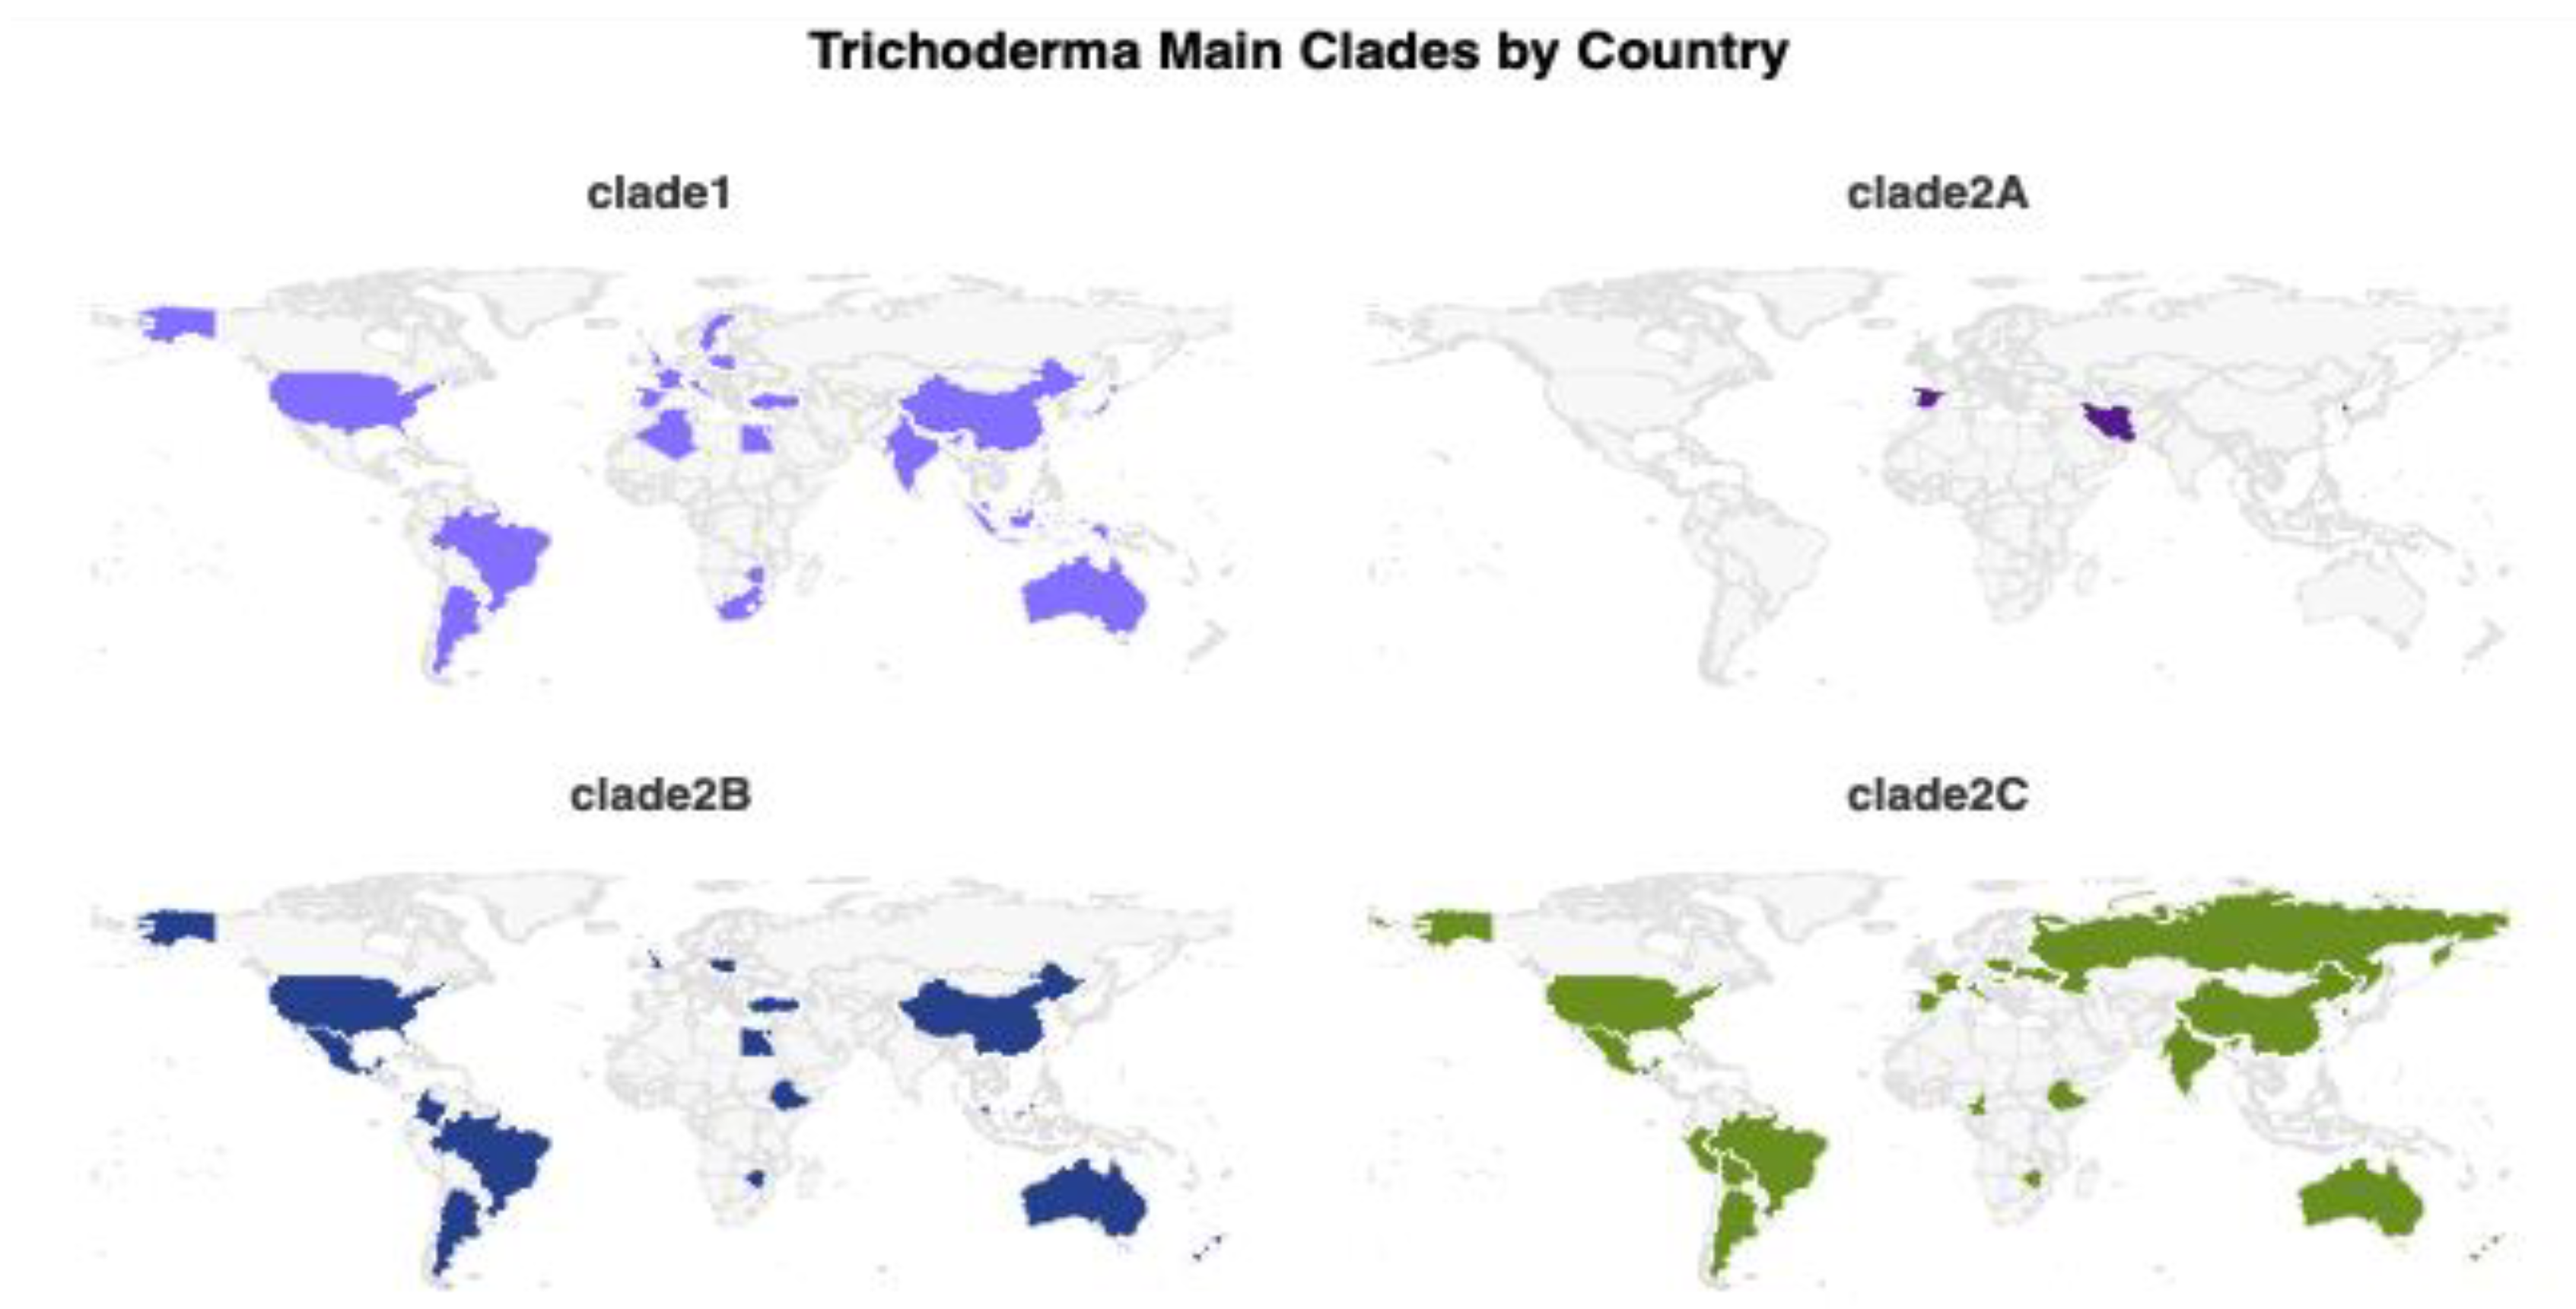
Figure 5.
Comparative genomic features and genome size correlations across Trichoderma genomes. (A) Distribution of genome assembly sizes among the major phylogenomic clades (Clade 1, Clade 2A, Clade 2B, and Clade 2C). Assembly sizes were converted from base pairs to megabase pairs (Mbp). (B) Distribution of genomic GC content across the same clades. Boxplots represent the median and interquartile range, whiskers indicate data dispersion, and points correspond to individual genomes. Kruskal–Wallis test p-values are shown within panels. (C–F) Correlation analyses between genome assembly size and genomic features, including GC content (C), proportion of masked repetitive regions (D), percentage of multicopy BUSCO genes (E), and predicted gene count (F). Scatterplots include linear regression fits with 95% confidence intervals. Spearman's rank correlation coefficient (rho), linear regression slope, and p-values are indicated in each panel.
Figure 5.
Comparative genomic features and genome size correlations across Trichoderma genomes. (A) Distribution of genome assembly sizes among the major phylogenomic clades (Clade 1, Clade 2A, Clade 2B, and Clade 2C). Assembly sizes were converted from base pairs to megabase pairs (Mbp). (B) Distribution of genomic GC content across the same clades. Boxplots represent the median and interquartile range, whiskers indicate data dispersion, and points correspond to individual genomes. Kruskal–Wallis test p-values are shown within panels. (C–F) Correlation analyses between genome assembly size and genomic features, including GC content (C), proportion of masked repetitive regions (D), percentage of multicopy BUSCO genes (E), and predicted gene count (F). Scatterplots include linear regression fits with 95% confidence intervals. Spearman's rank correlation coefficient (rho), linear regression slope, and p-values are indicated in each panel.
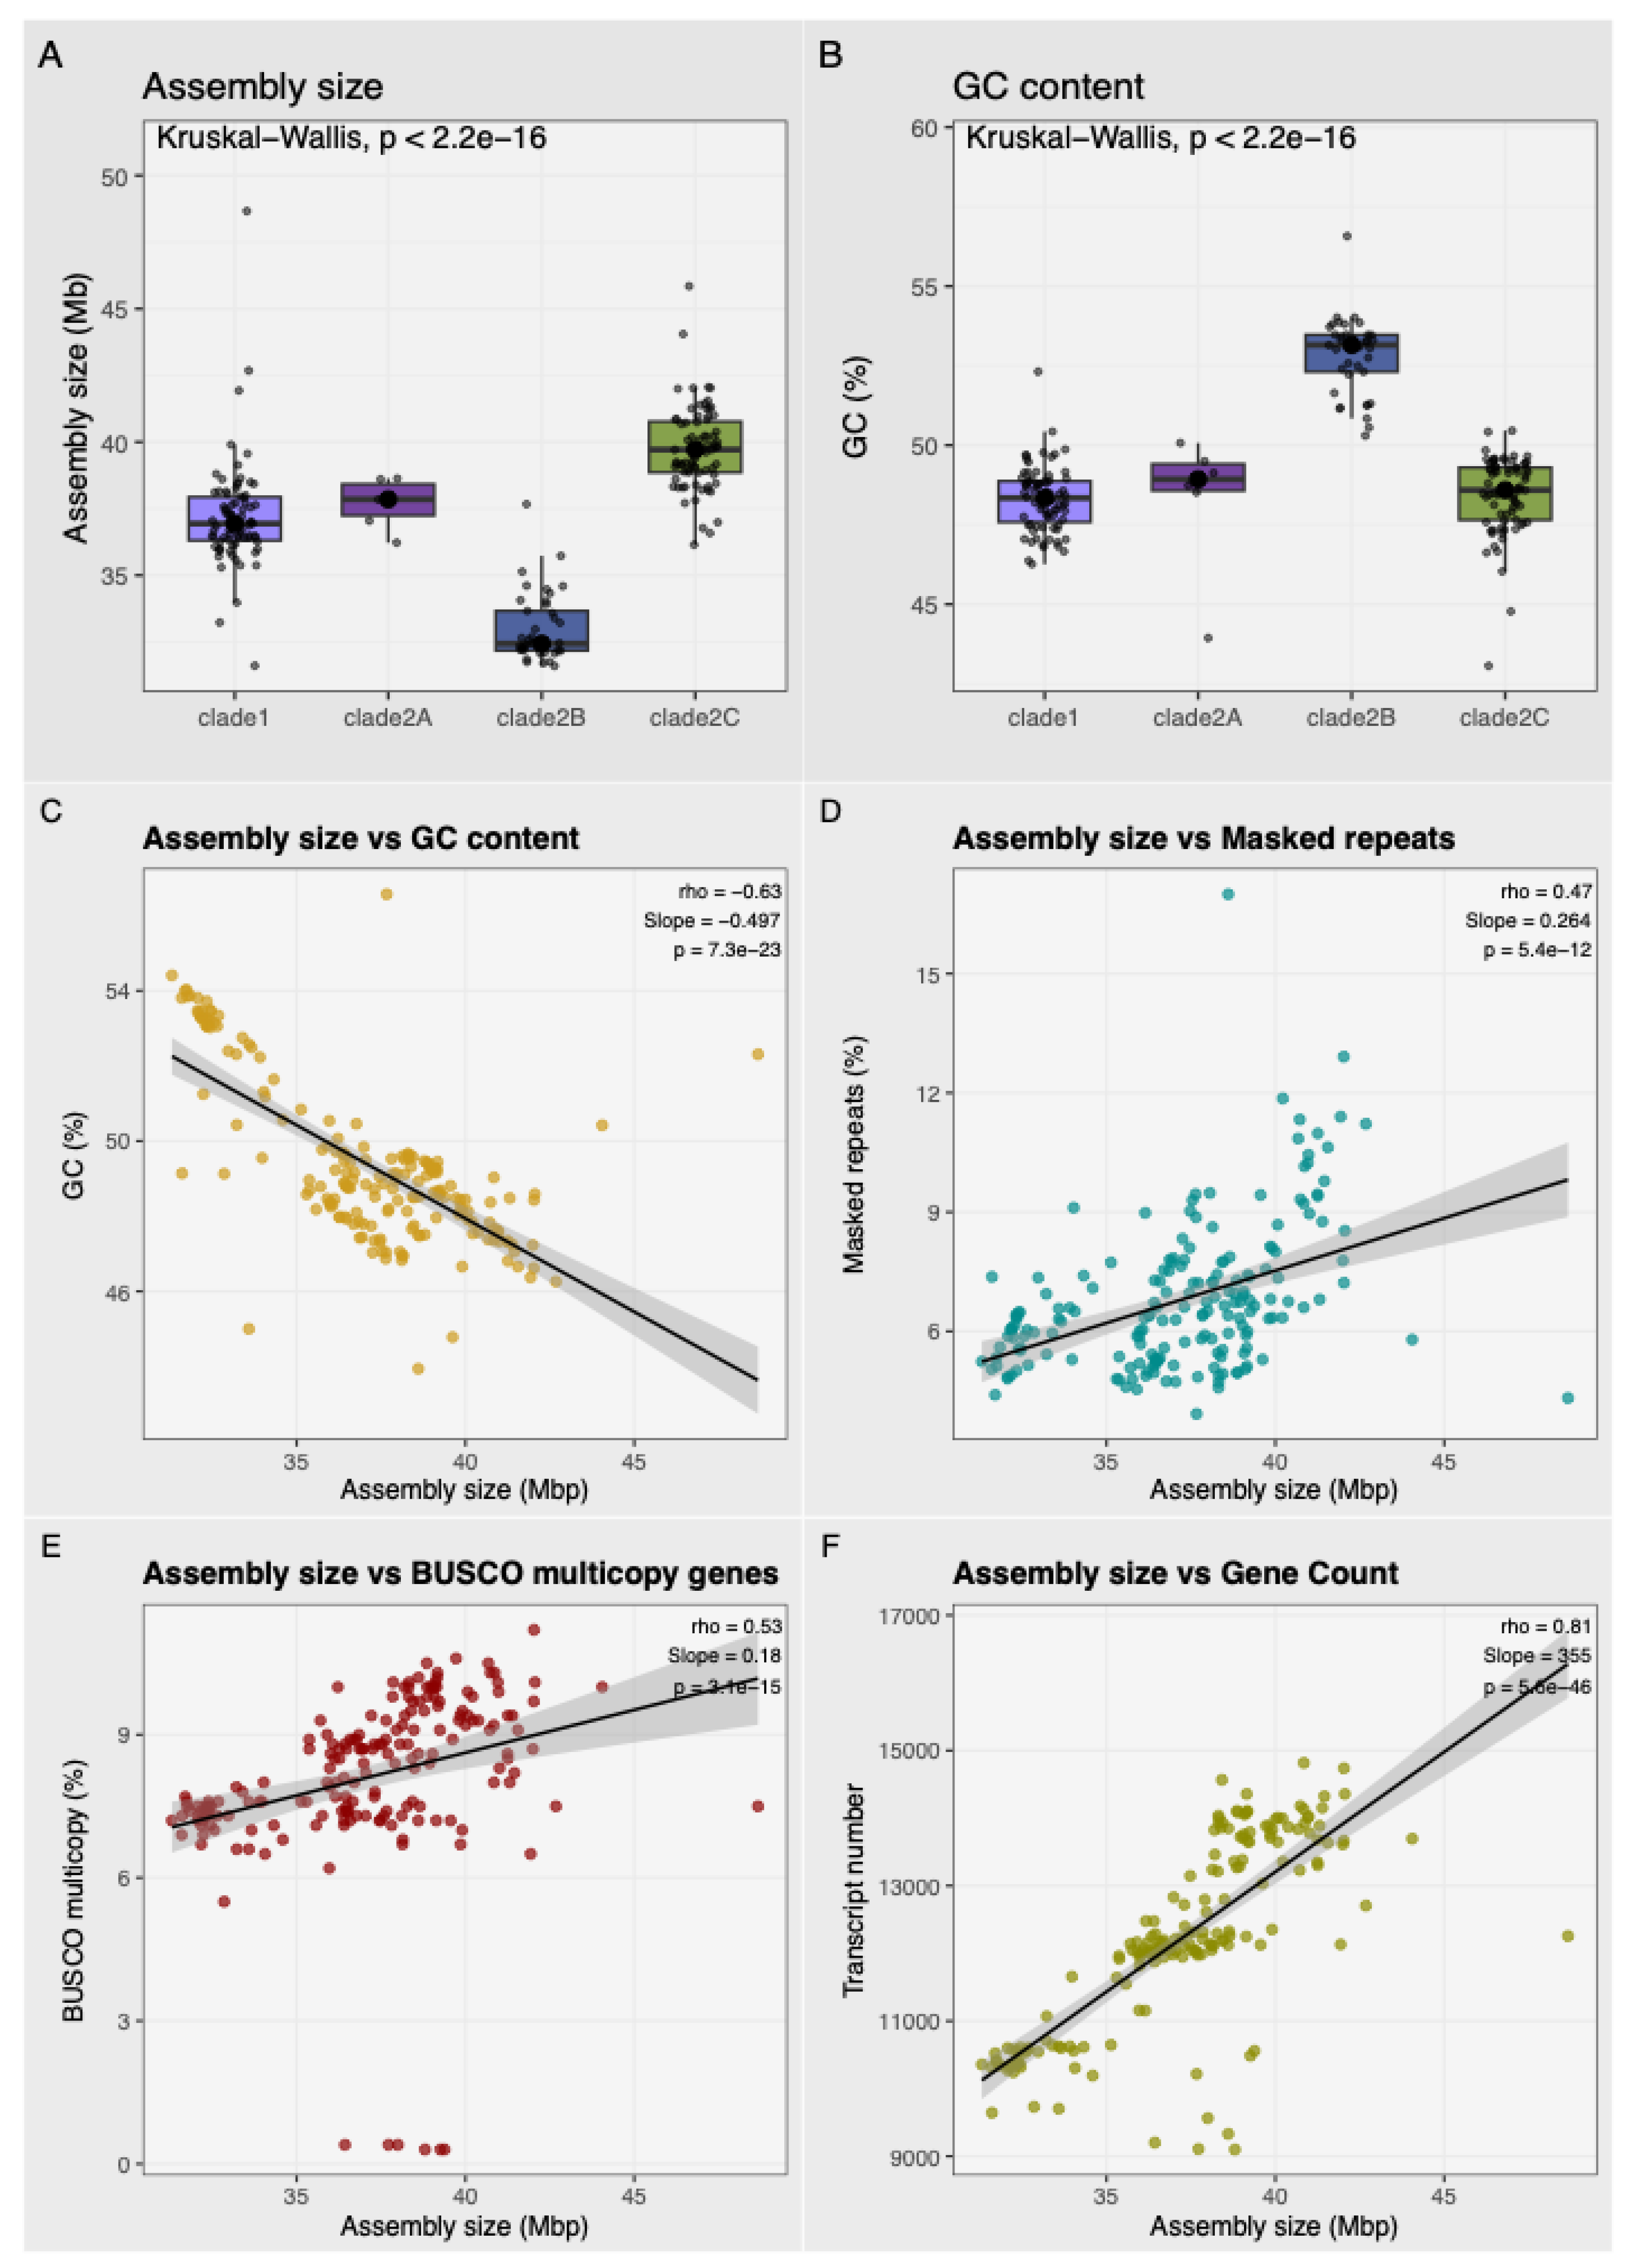
Figure 6.
Genome conservation among Trichoderma genomes based on pairwise whole-genome alignments. (A) Scatterplot showing the relationship between assembly aligned bases (%) and average nucleotide identity (%) for all pairwise genome comparisons. Points are colored and shaped according to whether the comparison was performed between genomes belonging to the same clade (Within clade) or different clades (Inter clade). (B) Distribution of assembly aligned bases (%) for within-clade and inter-clade genome comparisons. (C) Distribution of average nucleotide identity (%) for within-clade and inter-clade genome comparisons. Boxplots display the median, interquartile range, and 1.5× interquartile range whiskers. Comparisons within clades generally exhibited higher nucleotide identity and a greater proportion of aligned bases than comparisons between clades, reflecting increased genomic conservation among members of the same phylogenetic group.
Figure 6.
Genome conservation among Trichoderma genomes based on pairwise whole-genome alignments. (A) Scatterplot showing the relationship between assembly aligned bases (%) and average nucleotide identity (%) for all pairwise genome comparisons. Points are colored and shaped according to whether the comparison was performed between genomes belonging to the same clade (Within clade) or different clades (Inter clade). (B) Distribution of assembly aligned bases (%) for within-clade and inter-clade genome comparisons. (C) Distribution of average nucleotide identity (%) for within-clade and inter-clade genome comparisons. Boxplots display the median, interquartile range, and 1.5× interquartile range whiskers. Comparisons within clades generally exhibited higher nucleotide identity and a greater proportion of aligned bases than comparisons between clades, reflecting increased genomic conservation among members of the same phylogenetic group.
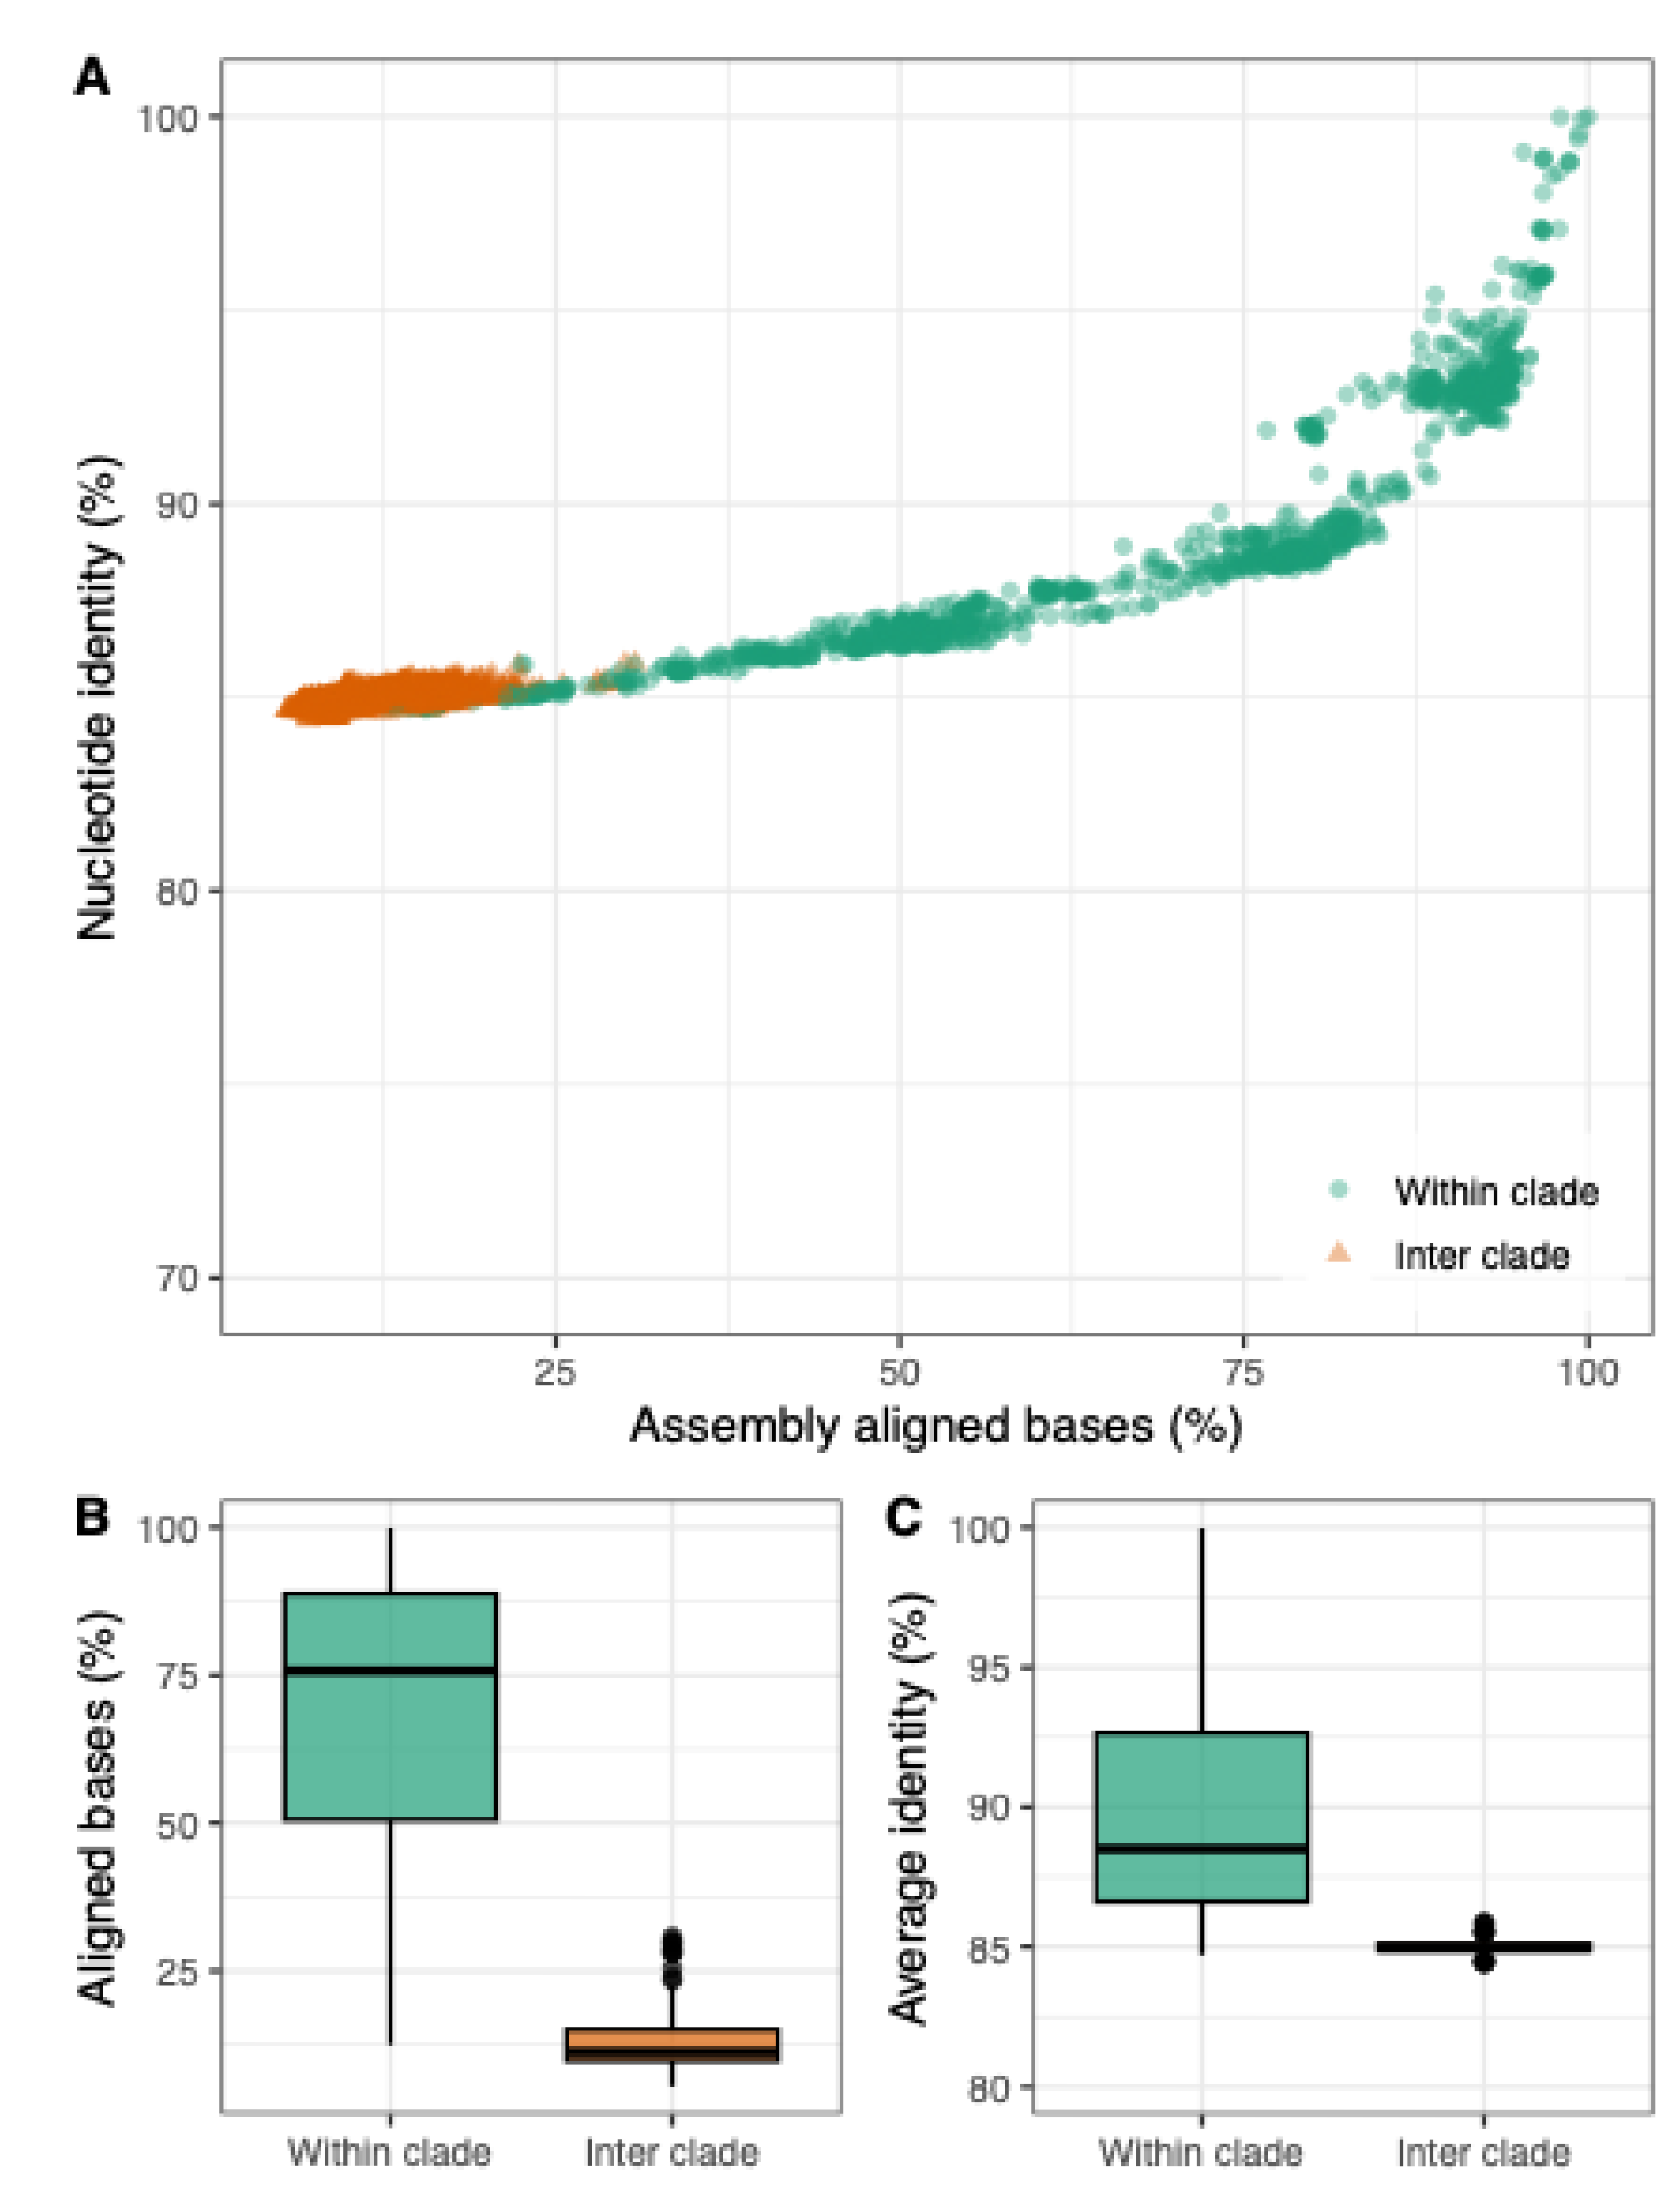
Figure 7.
Pairwise genome conservation comparisons among the four main Trichoderma clades. (A) Distribution of assembly aligned bases (%) between genome pairs classified as within-clade or inter-clade comparisons. (B) Distribution of average nucleotide identity (%) across the same comparison groups. Boxplots are colored according to the clade assignment of each genome pair: Clade 1 (light blue), Clade 2A (purple), Clade 2B (royal blue), Clade 2C (olive green). Boxes represent the interquartile range (IQR), center lines indicate the median, and whiskers represent data dispersion beyond the quartiles.
Figure 7.
Pairwise genome conservation comparisons among the four main Trichoderma clades. (A) Distribution of assembly aligned bases (%) between genome pairs classified as within-clade or inter-clade comparisons. (B) Distribution of average nucleotide identity (%) across the same comparison groups. Boxplots are colored according to the clade assignment of each genome pair: Clade 1 (light blue), Clade 2A (purple), Clade 2B (royal blue), Clade 2C (olive green). Boxes represent the interquartile range (IQR), center lines indicate the median, and whiskers represent data dispersion beyond the quartiles.
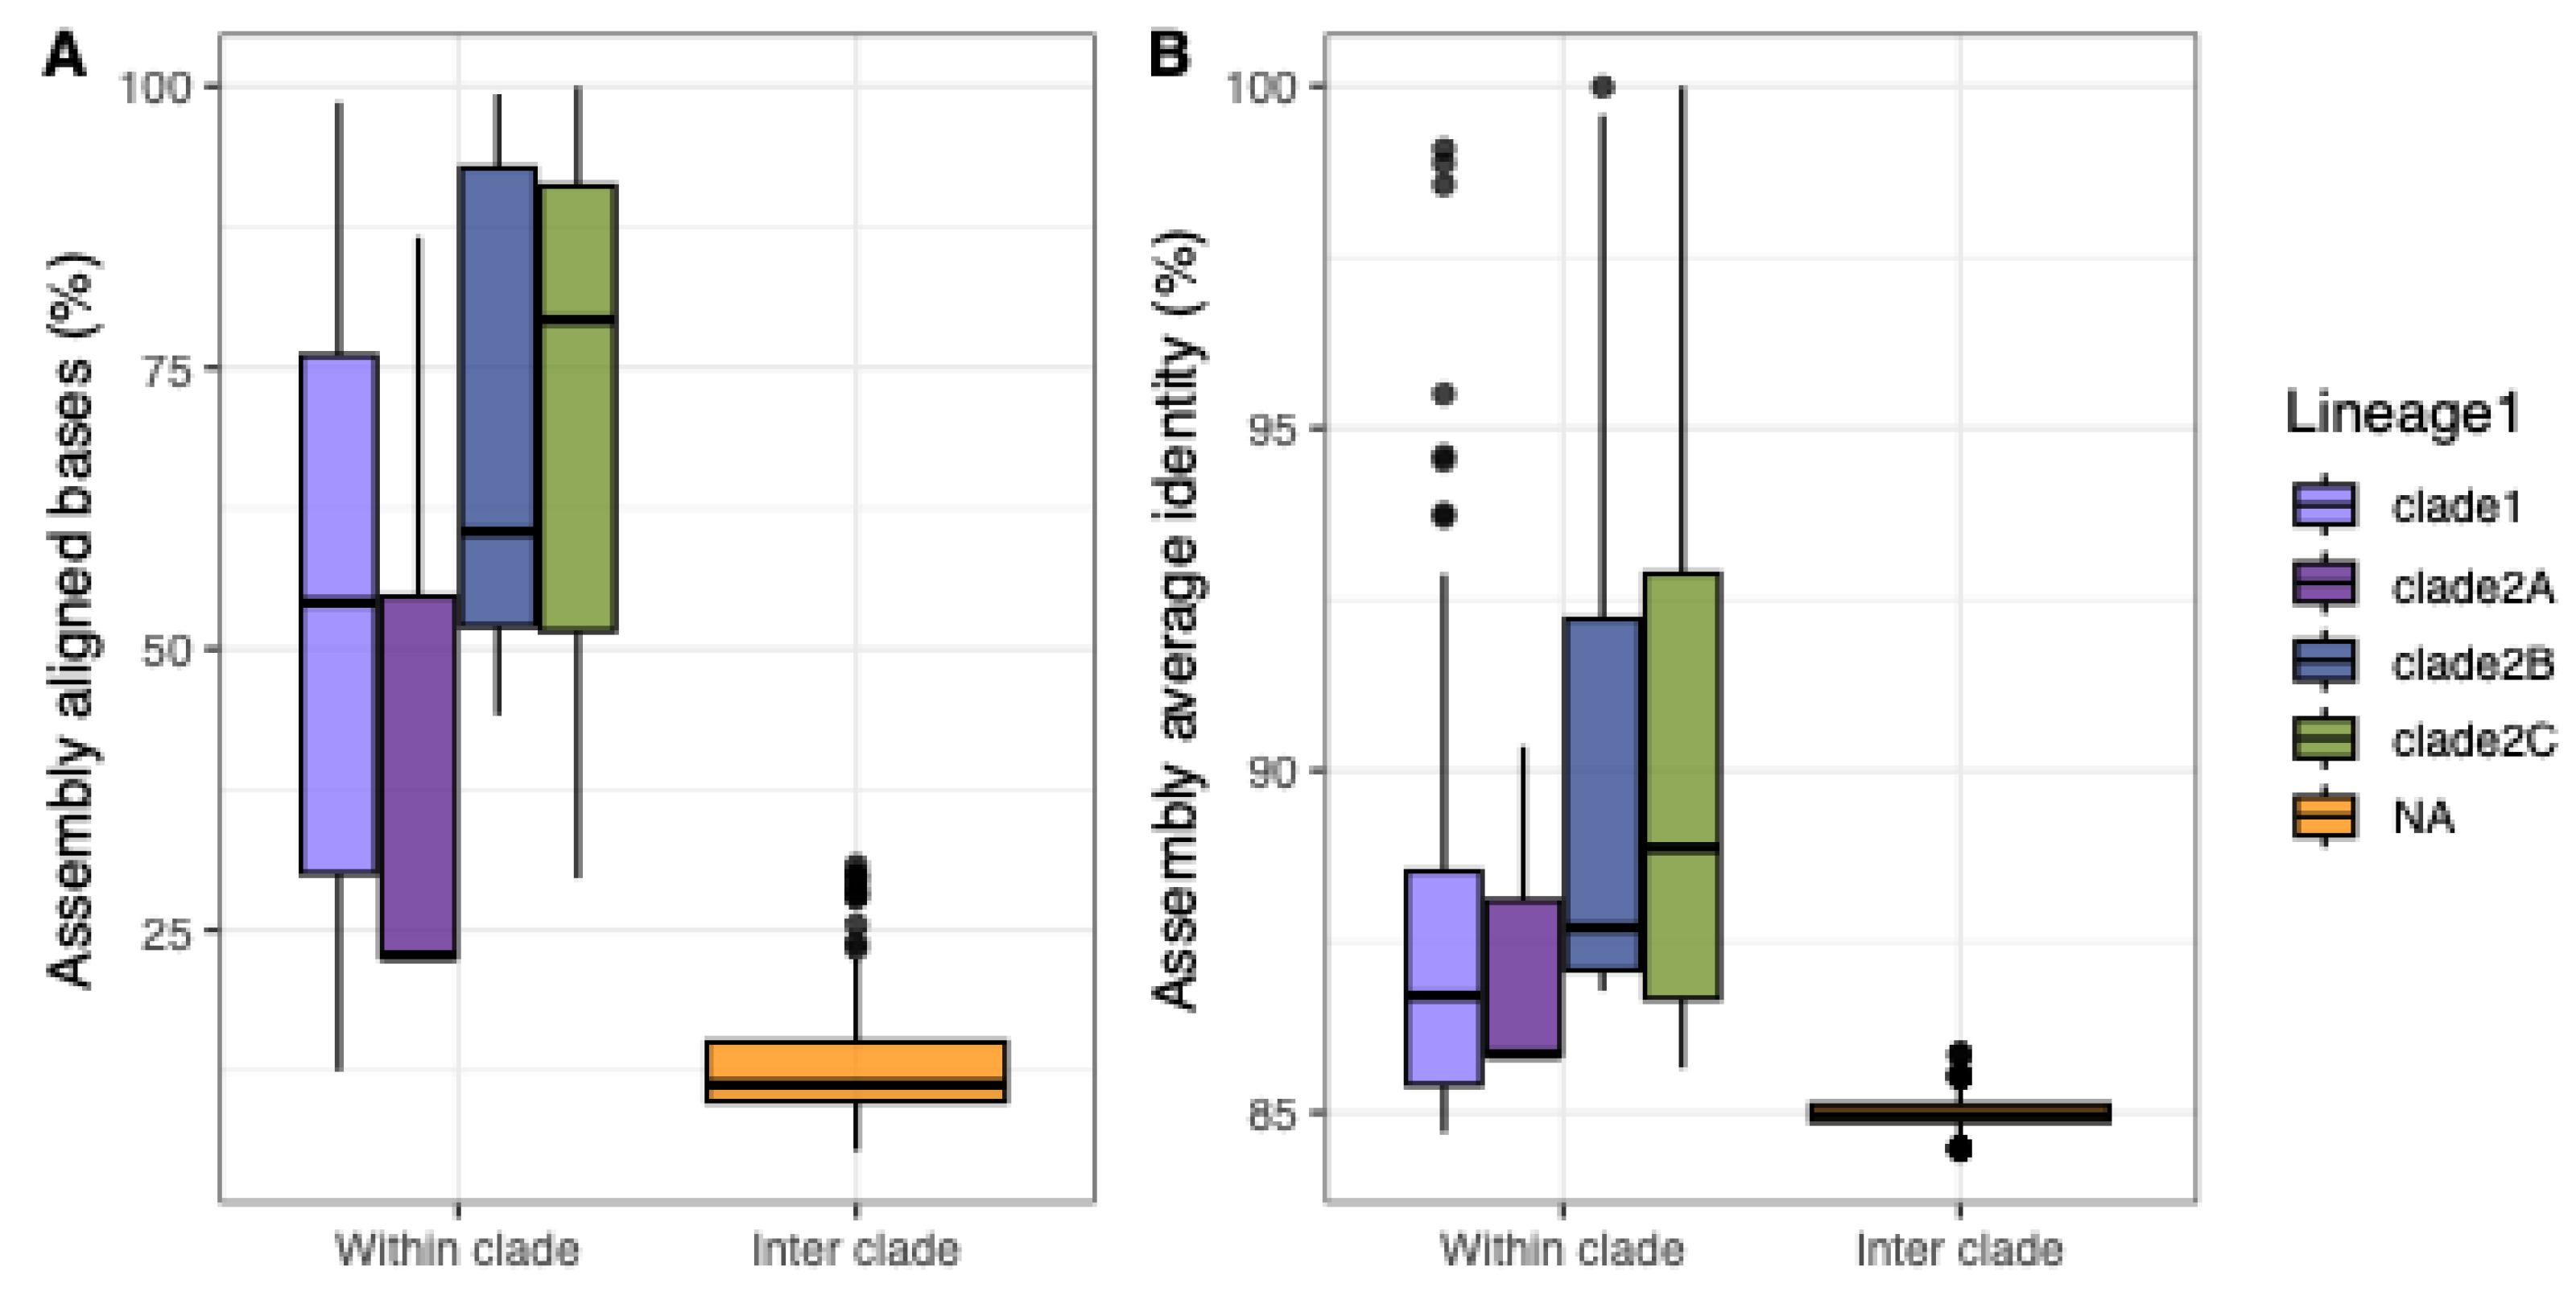
Figure 8.
(A) Functional classification of clade-specific proteins identified in Trichoderma genomes based on Clusters of Orthologous Groups (COG) categories. Horizontal bar plots show the most abundant functional categories detected among clade-specific proteins from Clade 1, Clade 2A, Clade 2B, and Clade 2C genomes. Bars represent the number of proteins assigned to each COG category, with colors indicating the corresponding clade. Functional assignments include categories associated with metabolism, transcription, posttranslational modification, signal transduction, intracellular trafficking, and secondary metabolite biosynthesis. COG category descriptions were derived from EggNOG-mapper annotations. Clade 2B is included in the legend but lacks visible bars because no proteins from this clade received functional assignments under the EggNOG-mapper annotation strategy. (B) Distribution of putative secondary metabolite-associated proteins identified among clade-specific proteins from Trichoderma genomes. Horizontal bar plots summarize proteins associated with biosynthetic and tailoring functions related to secondary metabolism, including polyketide synthases (PKS), nonribosomal peptide synthetases (NRPS), terpene biosynthesis, siderophore-associated proteins, cytochrome P450 enzymes, alkaloid and toxin-related proteins, and general secondary metabolite tailoring enzymes. Functional categories were inferred through text mining of EggNOG-mapper annotations and PFAM domain descriptions. Bars represent the number of proteins assigned to each functional category, with colors corresponding to the associated clade.
Figure 8.
(A) Functional classification of clade-specific proteins identified in Trichoderma genomes based on Clusters of Orthologous Groups (COG) categories. Horizontal bar plots show the most abundant functional categories detected among clade-specific proteins from Clade 1, Clade 2A, Clade 2B, and Clade 2C genomes. Bars represent the number of proteins assigned to each COG category, with colors indicating the corresponding clade. Functional assignments include categories associated with metabolism, transcription, posttranslational modification, signal transduction, intracellular trafficking, and secondary metabolite biosynthesis. COG category descriptions were derived from EggNOG-mapper annotations. Clade 2B is included in the legend but lacks visible bars because no proteins from this clade received functional assignments under the EggNOG-mapper annotation strategy. (B) Distribution of putative secondary metabolite-associated proteins identified among clade-specific proteins from Trichoderma genomes. Horizontal bar plots summarize proteins associated with biosynthetic and tailoring functions related to secondary metabolism, including polyketide synthases (PKS), nonribosomal peptide synthetases (NRPS), terpene biosynthesis, siderophore-associated proteins, cytochrome P450 enzymes, alkaloid and toxin-related proteins, and general secondary metabolite tailoring enzymes. Functional categories were inferred through text mining of EggNOG-mapper annotations and PFAM domain descriptions. Bars represent the number of proteins assigned to each functional category, with colors corresponding to the associated clade.
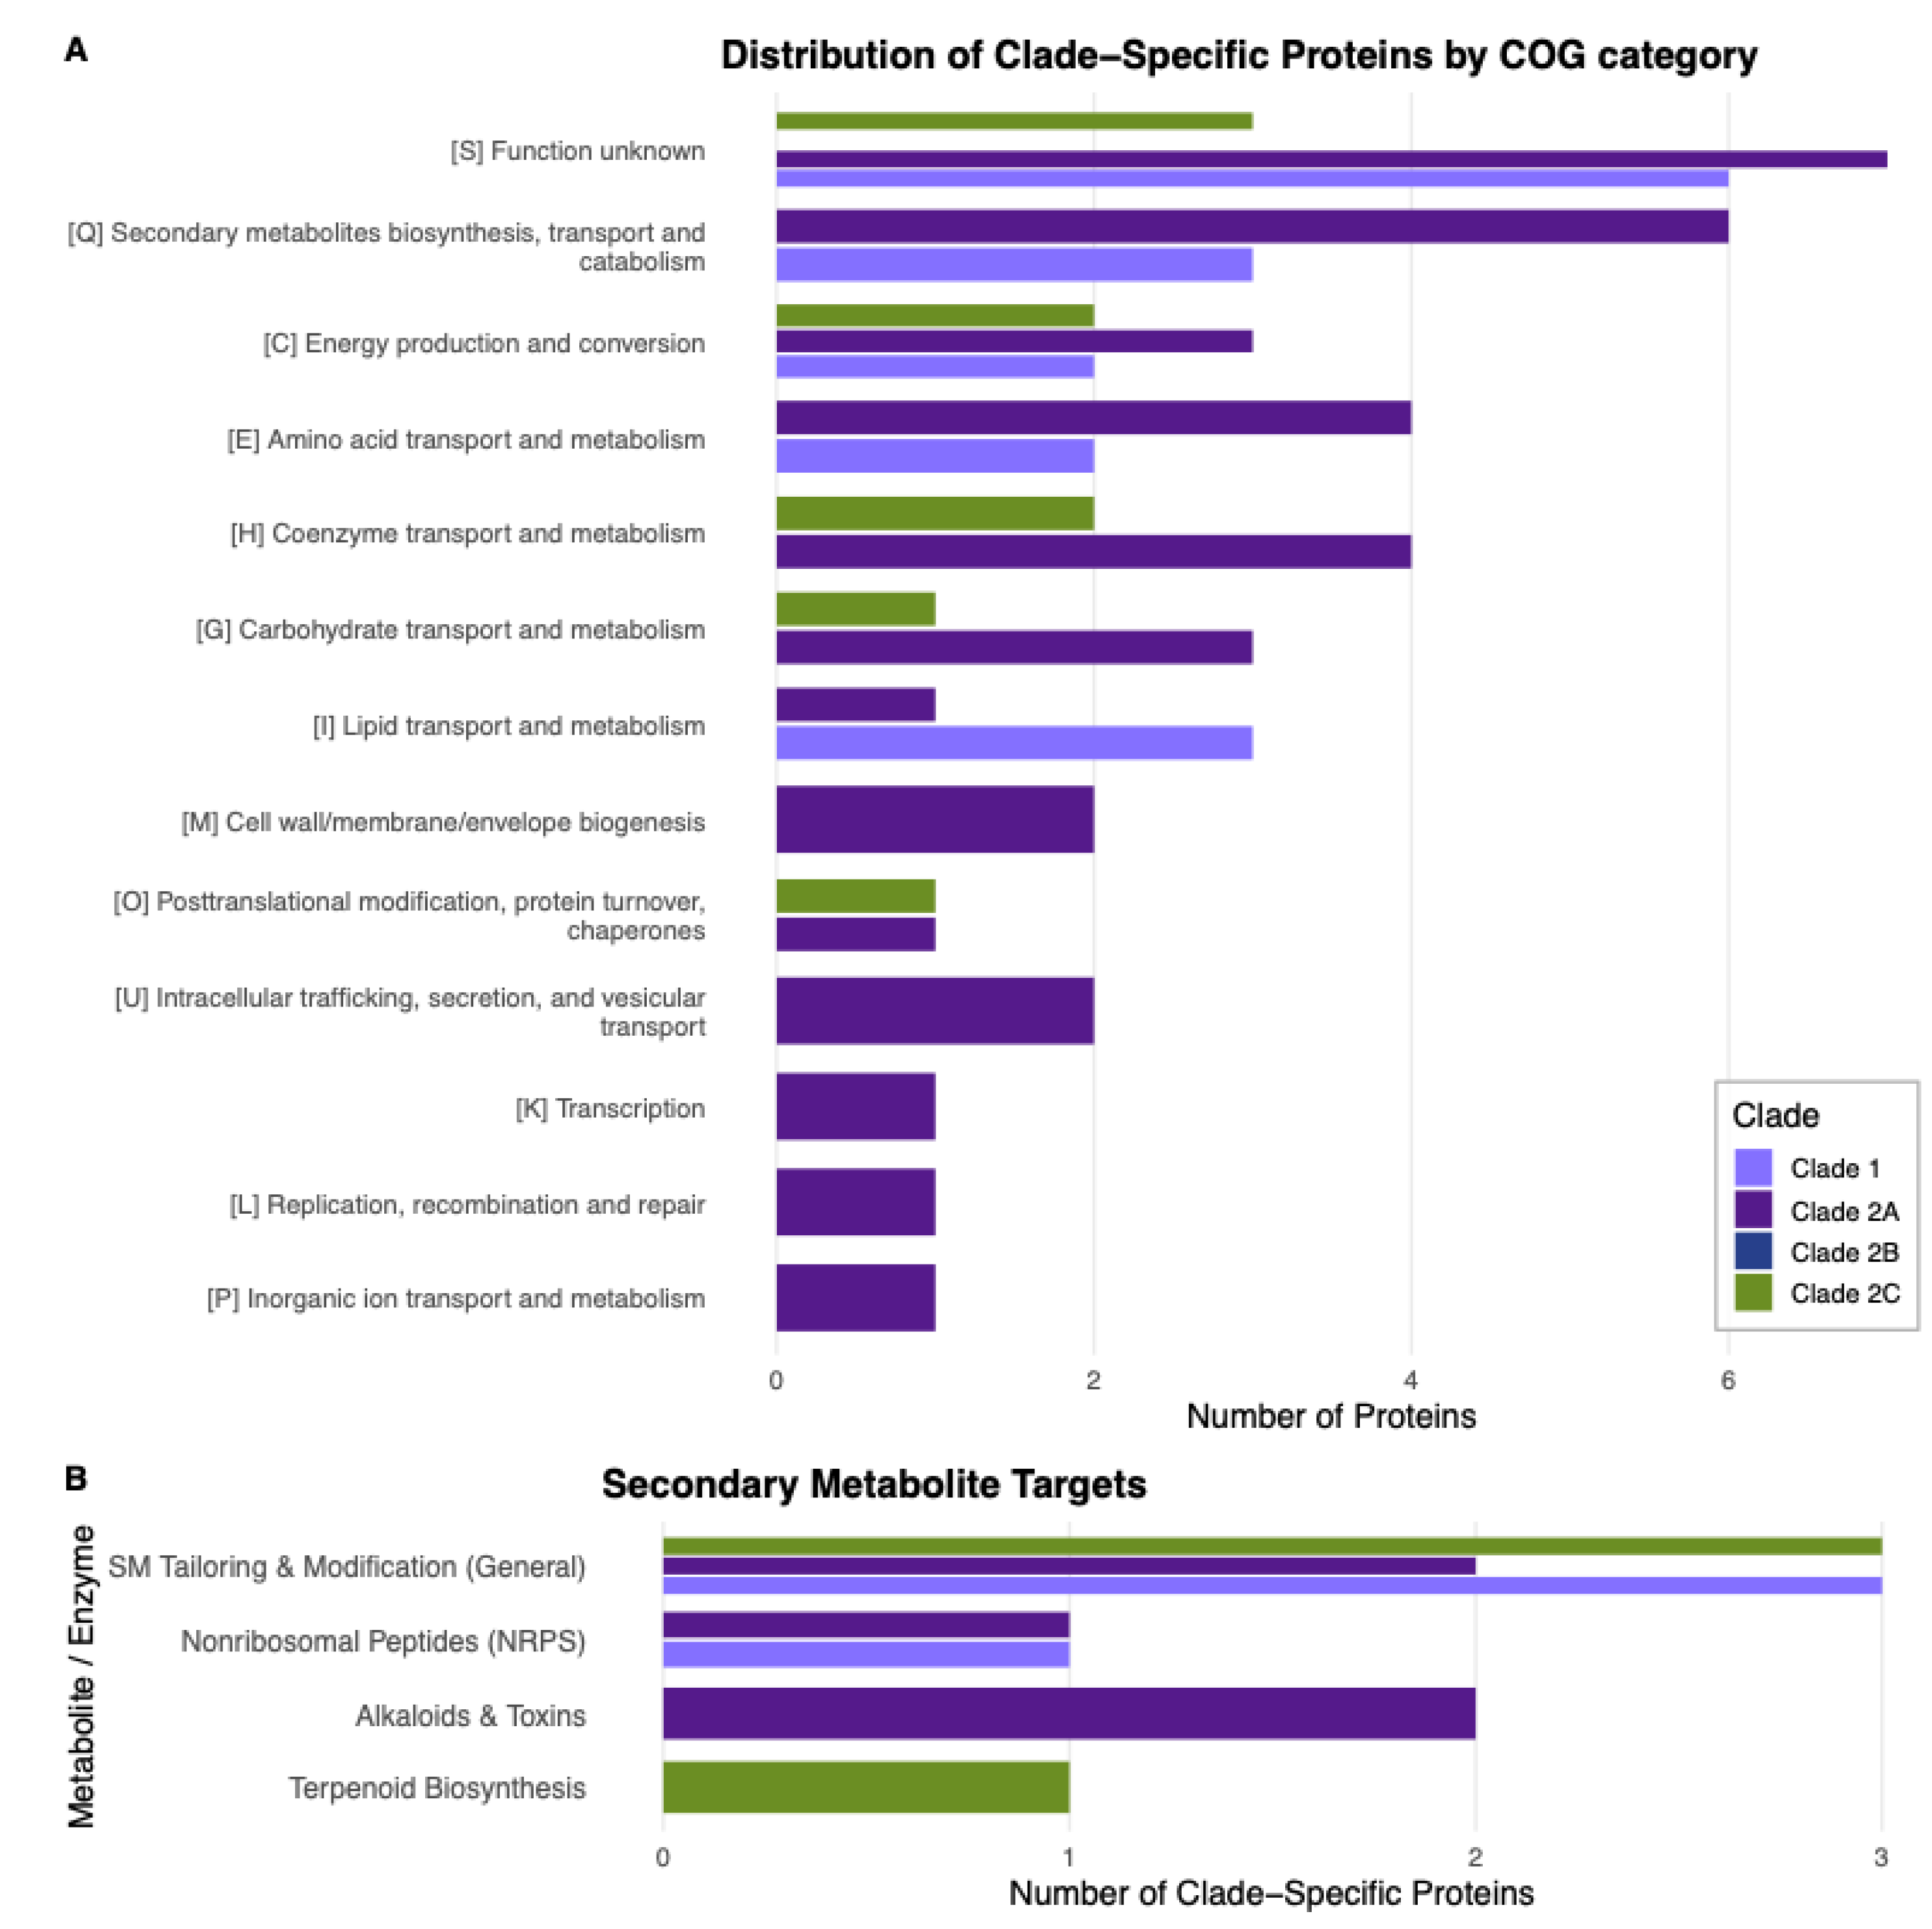
Figure 9.
(A–B) Pairwise genome conservation comparisons among assemblies belonging to Trichoderma Clade 2B. Boxplots show the distributions of assembly aligned bases (%) (A) and average nucleotide identity (%) (B) among genome pairs classified as within-lineage or inter-lineage comparisons. Colors indicate the lineage assignment of the compared genomes, including Trichoderma longibrachiatum, putative Trichoderma sp. "CB2", Trichoderma reesei, Trichoderma parareesei, Trichoderma gracile, and Trichoderma citrinoviride. (C–D) Pairwise genome conservation comparisons between the putative Trichoderma sp. "CB2" lineage and Trichoderma longibrachiatum genomes. Boxplots represent assembly aligned bases (%) (C) and average nucleotide identity (%) (D) among genome pairs classified as within-lineage or inter-lineage comparisons. Colors correspond to the lineage assignment of each genome pair. Statistical significance between within-lineage and inter-lineage comparisons was evaluated using Wilcoxon rank-sum tests.
Figure 9.
(A–B) Pairwise genome conservation comparisons among assemblies belonging to Trichoderma Clade 2B. Boxplots show the distributions of assembly aligned bases (%) (A) and average nucleotide identity (%) (B) among genome pairs classified as within-lineage or inter-lineage comparisons. Colors indicate the lineage assignment of the compared genomes, including Trichoderma longibrachiatum, putative Trichoderma sp. "CB2", Trichoderma reesei, Trichoderma parareesei, Trichoderma gracile, and Trichoderma citrinoviride. (C–D) Pairwise genome conservation comparisons between the putative Trichoderma sp. "CB2" lineage and Trichoderma longibrachiatum genomes. Boxplots represent assembly aligned bases (%) (C) and average nucleotide identity (%) (D) among genome pairs classified as within-lineage or inter-lineage comparisons. Colors correspond to the lineage assignment of each genome pair. Statistical significance between within-lineage and inter-lineage comparisons was evaluated using Wilcoxon rank-sum tests.
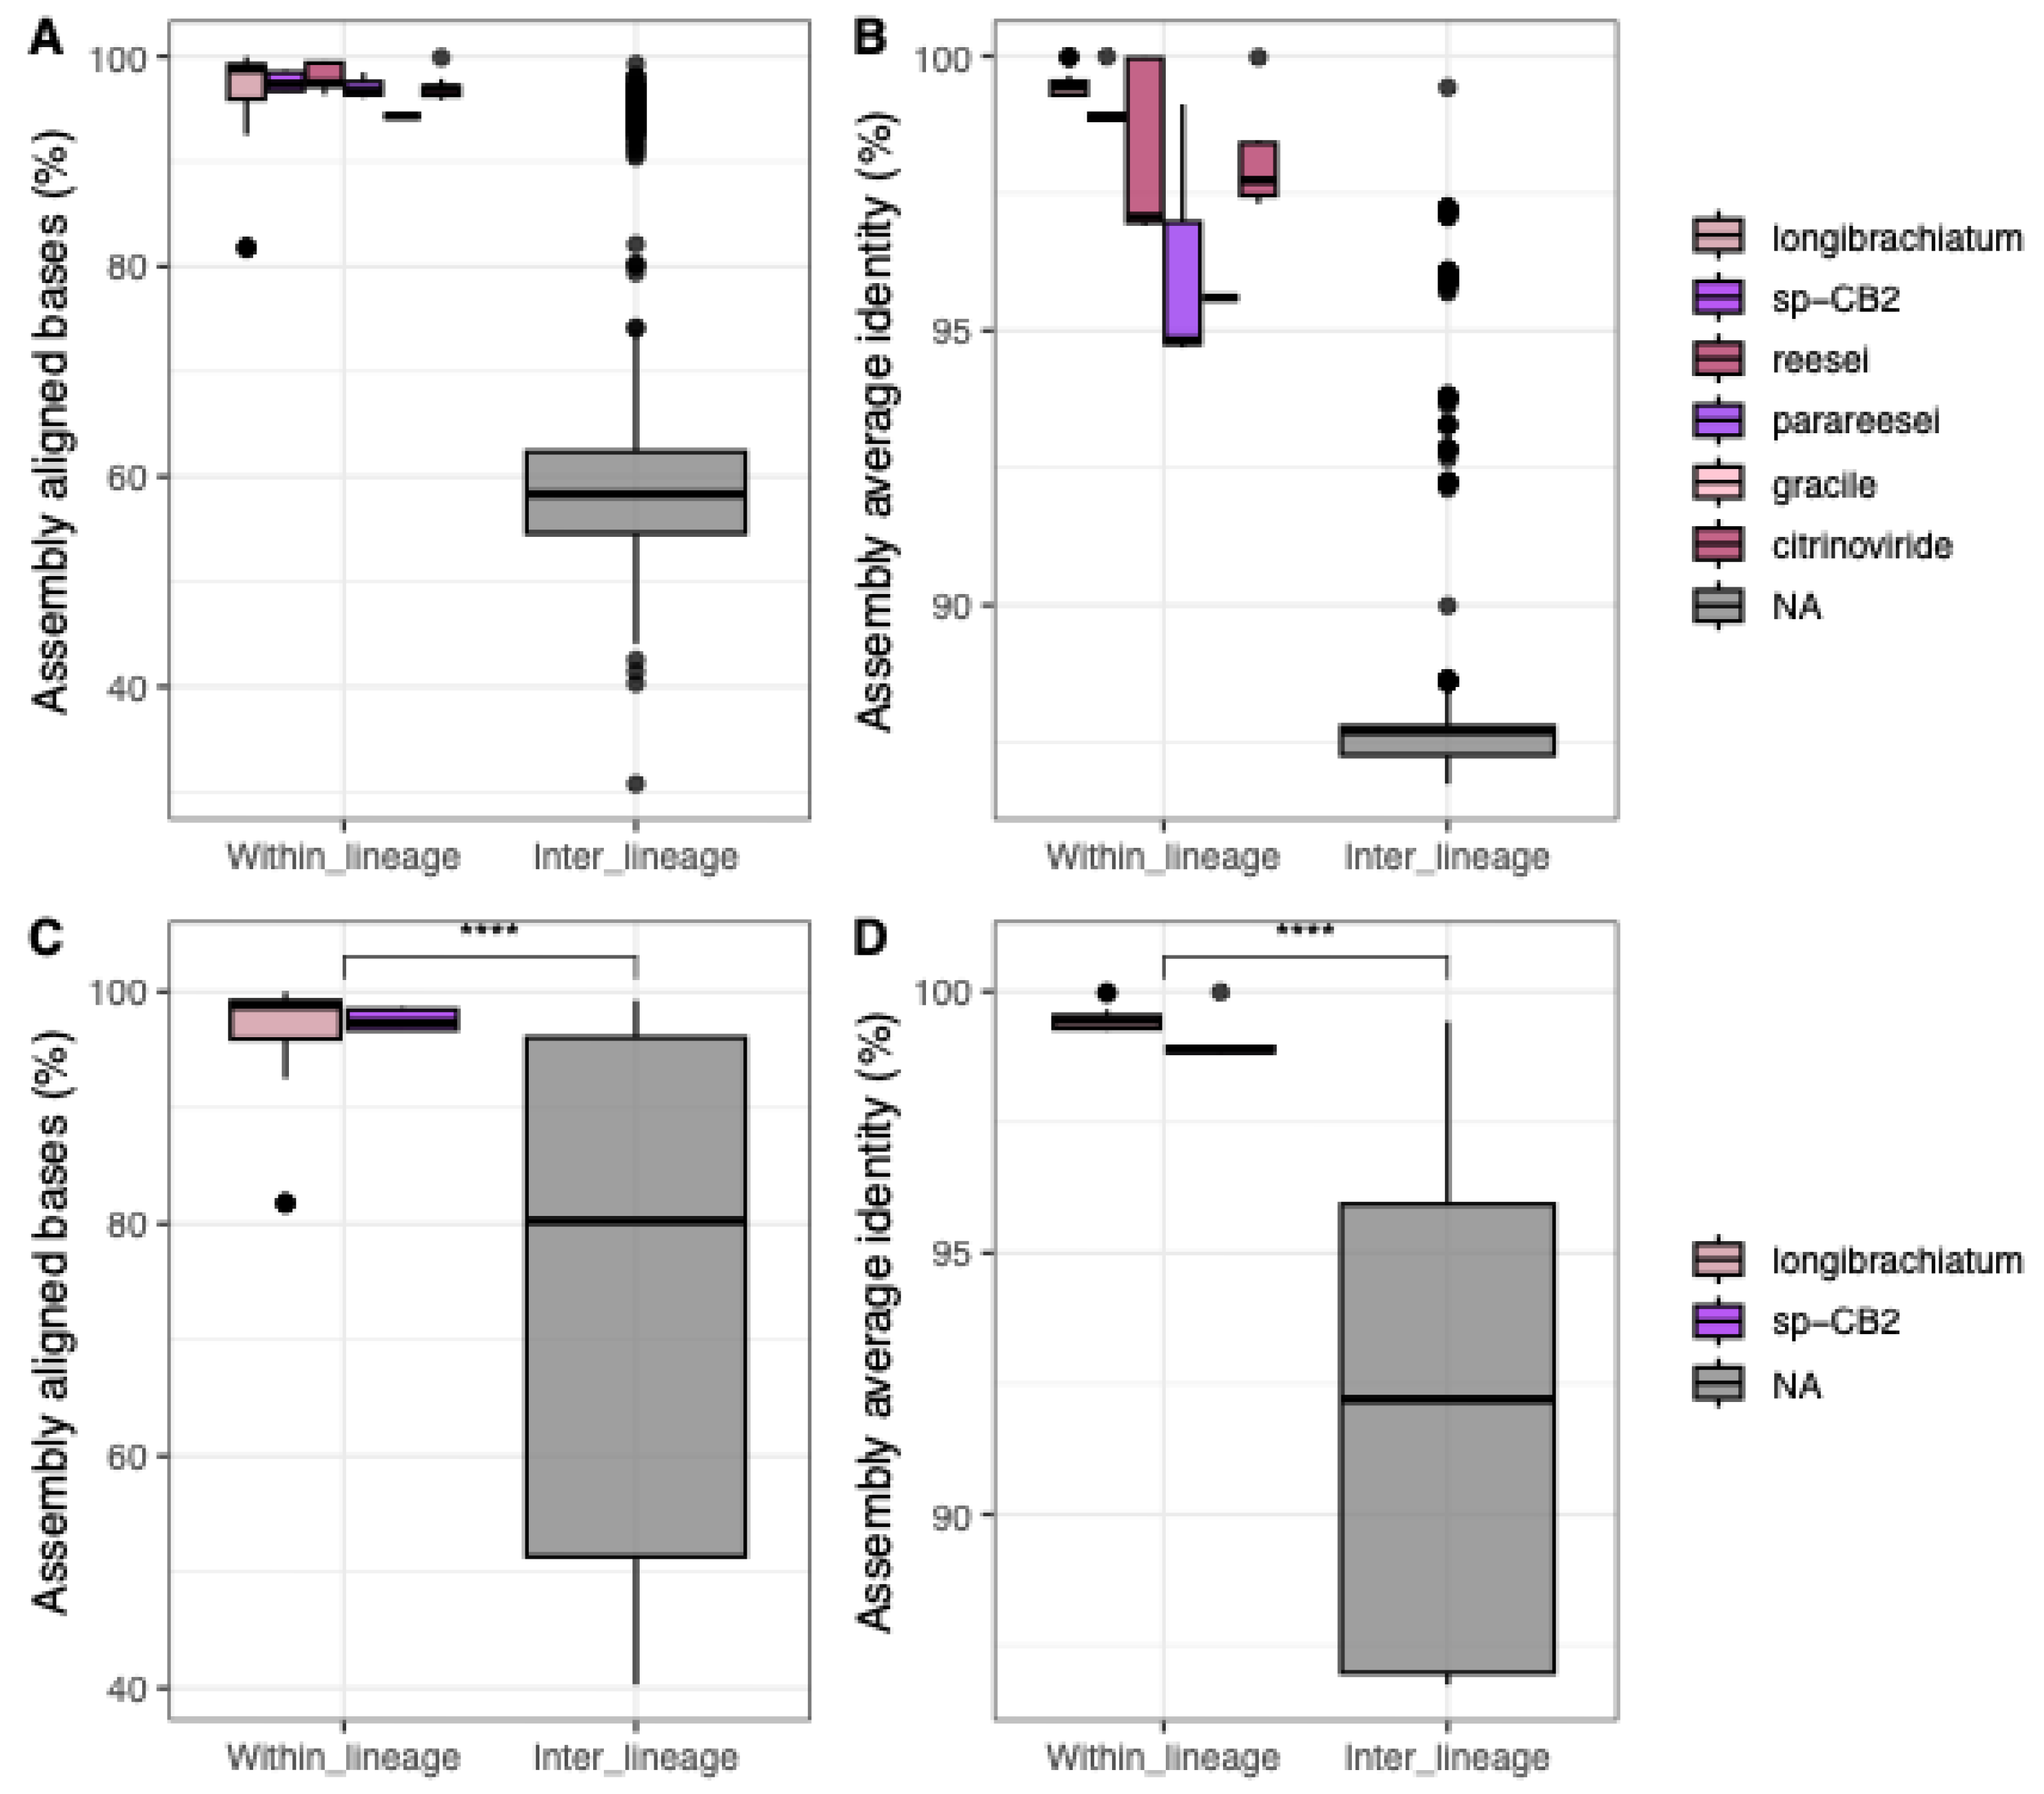
Disclaimer/Publisher’s Note: The statements, opinions and data contained in all publications are solely those of the individual author(s) and contributor(s) and not of MDPI and/or the editor(s). MDPI and/or the editor(s) disclaim responsibility for any injury to people or property resulting from any ideas, methods, instructions or products referred to in the content. |
© 2026 by the authors. Licensee MDPI, Basel, Switzerland. This article is an open access article distributed under the terms and conditions of the Creative Commons Attribution (CC BY) license (http://creativecommons.org/licenses/by/4.0/).
Copyright: This open access article is published under a Creative Commons CC BY 4.0 license, which permit the free download, distribution, and reuse, provided that the author and preprint are cited in any reuse.


