

Submitted:
24 July 2026
Posted:
27 July 2026
You are already at the latest version
Abstract
Predicting CRISPR-Cas9 guide RNA efficiency and off-target activity is a precondition for precise genome editing. Computational models have progressively incorporated chromatin accessibility and epigenetic descriptors into their feature sets, yet synthesizing findings from independently published studies—especially when those studies contradict one another—remains an unresolved methodological gap. Large Language Models (LLMs) have been proposed as a route to automate cross-study synthesis, but their utility depends on a constraint that receives less attention than model architecture: how much of the source text actually reaches the model at inference time. Cloud-based models process 48,000-token corpora without hardware limitations, but at the cost of data leaving the local environment and with limited reproducibility across API versions. Local RAG systems avoid the cloud dependency while fragmenting the input, discarding the global context needed to link biological arguments that are distributed across separate papers. We benchmark these strategies using a corpus of four CRISPR-Cas9 efficiency prediction studies and apply the Reduced Interaction Sampling (RIS) engine—a local sparse attention method—to retain the full sequence within the memory envelope of a laboratory server. Preserving that context surfaces three undocumented contradictions. The static epigenetic markers used in DeepCRISPR (CTCF, DNase I) show near-zero Spearman correlations with off-target cleavage (ρ ≤ 0.07), while nucleosome positioning scores from the Block Decomposition Method reach ρ = 0.388–0.423. The sequence-only Apindel model was published in June 2022 without incorporating nucleosome descriptors reported in the concurrent literature. The benchmark review by Konstantakos et al. attributed 10–20% of rank correlation to epigenetics—a figure that reflects the weak feature subset evaluated, not a ceiling on chromatin influence. These discrepancies are invisible when papers are read individually or retrieved as chunks; they become traceable only when the full corpus is processed as a single context window. An independent empirical analysis of 2,000 CRISPR-Cas9 off-target cleavage events confirms the pattern: static epigenetic markers yield |ρ| ≤ 0.11, whereas computed NuPoP Affinity descriptors reach r = −0.622 (p < 10−210). On a 30-question crossstudy synthesis benchmark (5 independent seeds), Baseline accuracy is 53.33%, RAG 60.00%, and RIS (30 seeds, 3% density) 70.00% (p < 0.0001, t-test vs. RAG, σ = 0.00% for all configurations).
Keywords:
CRISPR-Cas9 guide RNA
; genome editing
; epigenetic descriptors
; nucleosome positioning
; artificial intelligence
; cross-study synthesis
; sparse attention
1. Introduction
The CRISPR-Cas9 guide RNA literature has expanded faster than manual synthesis can track. Contradictions between independently published models—different feature sets, conflicting performance metrics, parallel developments that never cite one another—accumulate across journals and are rarely caught during peer review of individual submissions. LLMs [1,2] have been proposed as a route to automate multi-document reasoning, but their usefulness depends on a constraint that receives less attention than model architecture: how much of the source text actually reaches the model at inference time.
Four CRISPR-Cas9 studies concatenated already yield approximately 48,000 tokens. Dense self-attention over that length requires operations [3], exceeding the RAM of a laboratory server by an order of magnitude. Cloud deployments handle this via distributed techniques such as Ring Attention [4] and Grouped-Query Attention (GQA) [5], but pre-publication genomic data transferred to external servers raises data governance concerns, and API version drift limits exact replication. Local RAG [6] keeps computation on-site by selecting a 2,000-token window from TF-IDF-ranked passages—yet the 98% of text discarded in that process is precisely where cross-study discrepancies tend to reside: the methodological sections and feature tables of papers that are never co-retrieved.
We address this problem using the Reduced Interaction Sampling (RIS) engine [7], which replaces dense attention with a stochastic sparse mask at runtime, holding the full 48,000-token corpus intact within the memory envelope of a Xeon CPU server. Applied to four CRISPR-Cas9 efficiency prediction studies, RIS surfaces three contradictions that neither the zero-context baseline nor RAG identified. Figure 1 and Figure 2 illustrate the structural differences among the three context strategies.
2. Results
2.1. Performance Evaluation under Reasoning Scenarios
All scenarios ran Qwen2.5-1.5B-Instruct on an 8-thread Intel Xeon server (ibteci) against the same corpus of four CRISPR-Cas9 guide RNA efficiency studies:
- 1.
- Study 1 (Konstantakos et al., 2022): benchmark survey of guide RNA efficiency prediction tools [8].
- 2.
- Study 2 (DeepCRISPR / Chuai et al., 2018): CNN integrating sequence and static epigenetic profiles [9].
- 3.
- Study 3 (Apindel / Liu et al., 2022): attention-based model for DNA repair outcome prediction [10].
- 4.
- Study 4 (Mak et al., 2022): biophysical and epigenetic descriptor analysis with nucleosome positioning [11].
The multi-document reasoning prompt required linking all four studies:
“Based on the benchmarking criteria established in Study 1 (Konstantakos et al.), evaluate how the attention-based mechanism in Study 3 (Liu et al.) addresses the sequence-dependency limitations of the CNN model in Study 2 (Chuai et al.). Furthermore, explain how the epigenetic findings in Study 4 (Mak et al.) challenge the predictive reliability of both models (Study 2 and 3) for in vivo applications.”
2.2. Scenario 1: Baseline (Zero-Context)
Without any input context, the model produced grammatically intact but uninformative prose. Responses discussed CNNs and attention mechanisms at a textbook level; DeepCRISPR, Apindel, NuPoP, and BDM were not mentioned—those terms exist only in the corpus, not in the model weights.
2.3. Scenario 2: Retrieval-Augmented Generation (RAG)
The TF-IDF retriever assembled a 2,000-token context from the top-ten-ranked passages. Two factual errors emerged:
- The model asserted that Study 3 lacked off-target cleavage prediction—an inversion of the actual architecture; DeepCRISPR (Study 2) was designed as a joint on-target/off-target framework.
- Chromatin accessibility was described in general terms, with no connection between Study 4’s nucleosome positioning data and the specific feature inputs of Studies 2 and 3. The cell-type specificity argument—that static experimental markers are transient and cannot generalize across tissues—was absent from the output.
2.4. Scenario 3: RIS-Kernel (Sparse Long-Context Attention)
With the full 48,557-token corpus processed in a single pass at 1% density (), the model produced an error-free synthesis. It identified how Study 3’s dynamic positional weighting resolves the spatial rigidity of Study 2’s convolutional hierarchy, mapped NuPoP and BDM scores from Study 4 as descriptors absent from both Study 2 and Study 3, and noted that the in vivo reliability of sequence-only and static-epigenetic models is constrained by the non-stationarity of nucleosome positioning across cell types.
Table 1 records the resource profile and qualitative output for each scenario.
2.5. Contradiction Discovery Performance and Benchmark
A second prompt directed each configuration to audit the four studies for contradictions, inconsistencies, and missed integration opportunities. Results are summarised in Table 2.
The zero-context Baseline (Scenario 1) produced no identifiable cross-study relationships: output consisted of generic statements about sequence and epigenetic features with no reference to any of the four papers or their specific tools.
2.6. Scenario 7: RIS Saturation Limit (100 Seeds)
At 100 seeds (Scenario 7), Equation 2 projects an effective active density of . Empirically, this configuration regressed to 0/3 contradictions resolved. The higher seed count introduced sequence-level distractor noise that caused systematic misattribution—Study 3’s repair outcome models were reassigned to Study 4’s author list. The result marks the noise-saturation threshold for compact parameter models under high effective density.
2.7. Empirical Validation of Literature Contradictions
To determine whether the contradictions surfaced by RIS reflect genuine biological signals rather than model artefacts, we performed an independent correlation analysis on a standardised dataset of 2,000 CRISPR-Cas9 off-target cleavage events from Mak et al. [11]. Cleavage activity was approximated using predictions from Mak et al.’s pre-trained XGBoost model (19 features), which achieves with experimental measurements [11]. We computed Pearson and Spearman rank correlations between this proxy target and two feature groups: the static epigenetic markers used in DeepCRISPR [9] (CTCF, DNase I, RRBS, H3K4me3) and the computed nucleosomal descriptors from Mak et al. [11] (Block Decomposition Method and NuPoP scores).
Results are summarised in Table 3 and visualised in Figure 3. All four static epigenetic markers show near-zero or negligible monotonic associations with cleavage activity (; DNase I and RRBS: , ). The computed nucleosome positioning descriptors tell a different story: NuPoP Affinity reaches (, ), and Nucleotide BDM reaches (, ). The consistent negative direction reflects steric occlusion—high nucleosome occupancy at an off-target site physically impedes Cas9 complex binding, suppressing cleavage. That mechanistic link was outside the feature-engineering vocabulary of 2018. The data confirm Contradiction 1 quantitatively and support Contradiction 3: the 10–20% epigenetic influence estimate in the benchmark review [8] characterises a feature subset with negligible predictive signal (), not an upper bound on chromatin influence.
2.8. Quantitative Cross-Study Synthesis Benchmark
To measure the context-retention advantage of RIS in a controlled setting, we constructed a 30-question multiple-choice benchmark in which every item requires comparing or synthesising findings across at least two of the four primary studies. This design suppresses parametric memory bias: questions that can be answered from model weights alone—without reading the supplied context—are excluded. The correct answer is uniformly distributed across options A–E (six per option) to remove answer-position bias. Each configuration was evaluated across five independent random seeds (10, 20, 30, 40, 50).
Results are shown in Table 4 and Figure 4. The Baseline, drawing solely on model weights, achieves 53.33% (16/30 questions): cross-paper synthesis questions reduce but do not eliminate parametric recall. RAG improves to 60.00% (18/30) by supplying locally relevant context, but the chunked retrieval window cannot co-locate evidence distributed across different sections of different papers; all RAG failures occur on items requiring multi-paper co-reasoning. RIS, processing the full 48,557-token corpus at 3% density with 30 ensemble seeds, reaches 70.00% (21/30), a statistically significant improvement over RAG (, two-sample t-test). Zero standard deviation across all five seeds for every configuration indicates that the accuracy differences are architecture-specific rather than sampling artefacts, and that the 30-seed ensemble has converged to a stable attention geometry.
3. Discussion
3.1. Cross-Study Biological Synthesis: Latent Contradictions in the CRISPR-Cas9 Guide RNA Prediction Literature
Full-context processing surfaces three discrepancies that individual paper reviews do not expose.
Contradiction 1 concerns the predictive value of DeepCRISPR’s epigenetic inputs. DeepCRISPR [9] was trained on CTCF, DNase I hypersensitivity, H3K4me3, and RRBS profiles—the accessible epigenetic data of 2018. Mak et al. [11] subsequently analysed 250,000 CRISPR-Cas9 off-target sites and measured near-zero Spearman and Pearson correlations between those same four features and off-target cleavage (CTCF: ; DNase I: ; H3K4me3: ; RRBS: ). Nucleosome positioning scores from the Block Decomposition Method (BDM), absent from the DeepCRISPR feature set, reach (Nucleotide BDM) and (Strong-Weak BDM). The epigenetic inputs framed as an architectural advantage of DeepCRISPR are therefore nearly orthogonal to the target signal—a conclusion accessible only when Study 2 and Study 4 are read side by side.
Contradiction 2 is a missed feature integration in Apindel. Liu et al. [10] published Apindel in June 2022 using exclusively sequence-level inputs. Mak et al. [11] published their nucleosome positioning analysis in December of the same year, placing NuPoP Affinity and Nucleotide BDM among the top five features by SHAP importance. The studies were conducted independently and do not cross-reference each other. Because chromatin structure acts as a physical barrier at off-target binding sites, incorporating nucleosome descriptors into Apindel’s architecture is a tractable extension that the simultaneous publication timeline precluded.
Contradiction 3 concerns the epigenetic influence estimate in the benchmark review. Konstantakos et al. [8] reported that epigenetic characteristics account for 10–20% of rank correlation in guide RNA activity (Study 1, Table 2). That figure derives from model runs limited to CTCF, DNase I, H3K4me3, and RRBS—features whose correlations with off-target cleavage fall below 0.1. Mak et al.’s XGBoost model, trained on 19 features including nucleosome-positioning descriptors, achieves with cleavage activity. The 10–20% estimate is an artefact of an incomplete feature set.
The three contradictions share a common origin: guide efficiency models across 2018–2022 evaluated epigenetic markers that carried negligible predictive signal. Identifying this pattern requires comparing feature tables and correlation data across papers that were never designed to be read together. RAG, retrieving isolated passages, cannot perform that comparison reliably; full-context approaches can, within the resolution limits imposed by model scale and generation capacity.
The empirical correlation analysis in Table 3 quantifies the pattern independently. Static markers (CTCF, DNase I, RRBS, H3K4me3) yield across 2,000 off-target sites, while NuPoP Affinity reaches () and Nucleotide BDM reaches (). The negative direction of all nucleosomal correlations is mechanistically grounded: nucleosome-wrapped DNA is sterically occluded from Cas9 binding, directly suppressing cleavage at high-occupancy sites. That barrier was absent from the feature vocabulary of 2018-era models, and its quantitative magnitude—an order of magnitude larger than any static marker—is visible only when Study 2 and Study 4 are examined together.
3.2. Quantitative Benchmark Confirms Context-Width Advantage
The 30-question synthesis benchmark (Table 4) translates the qualitative context-width advantage into measurable accuracy differences.
The Baseline accuracy of 53.33% confirms that cross-paper synthesis questions suppress but do not fully eliminate parametric recall. The model recovers partial answers from pre-training weights, but simultaneously applying Konstantakos et al.’s benchmarking criteria while comparing DeepCRISPR and Apindel feature architectures against Mak et al.’s nucleosomal evidence exceeds weight-only inference capacity.
The zero standard deviation () across all five seeds for both RAG and RIS carries a specific interpretation beyond reproducibility. For RAG, determinism follows from the TF-IDF retriever: identical queries yield identical chunks and identical answers. For RIS, zero variance reflects convergence of the attention geometry: at 30 ensemble seeds with 3% density, aggregate coverage () stabilises the reasoning pathway independently of the stochastic seed. This convergence property means ensemble RIS at moderate density operates as a deterministic long-context inference mechanism—directly relevant to replication requirements in automated bioinformatics pipelines.
The 10-percentage-point gap between RAG (60%) and RIS (70%) corresponds to three additional correct answers per run. All RAG failures occur on items requiring evidence co-located across two or more papers—exactly the scenario where chunked retrieval fails by design. Sparse full-context attention routes those distributed signals into the generation prefix, enabling the cross-paper reasoning the benchmark was constructed to probe.
3.3. Approaches for AI-Assisted Cross-Study Synthesis: Trade-offs Between Cloud and Local Deployment
Deployment choice affects replication reliability, data residency, and pipeline integration as much as raw reasoning capacity. The three strategies tested here occupy distinct positions on those axes (Table 5).
Cloud-based models such as GPT-4 [2] and Gemini accommodate the 48,000-token corpus without hardware constraints. The operational limitations are API version drift, which complicates exact replication; data governance concerns when pre-publication full-text drafts are transferred to external servers; and rate limits that restrict integration with automated bioinformatics pipelines.
RAG operates on standard hardware and avoids those issues. The 2,000-token retrieval window, however, is too narrow to co-locate the feature definitions in Study 2, the SHAP importance rankings in Study 4, and the benchmark conclusions in Study 1 within a single inference pass. As Scenario 2 demonstrates, the practical consequence is inverted factual claims and false-negative contradiction reports.
The RIS engine [7] occupies a third position: local, fully deterministic with fixed seeds, pipeline-integrable, operating on the complete text sequence. The operative constraint is hardware: approximately 50 GB of RAM for 64,000 tokens.
3.4. Implications for Literature Review Methodology and Attention Saturation
The error introduced by RAG in Scenario 2—asserting that DeepCRISPR lacked off-target prediction—traces directly to how retrieval partitions the corpus. The paragraph describing DeepCRISPR’s joint on-target/off-target design and the paragraph reporting its epigenetic feature correlations reside in different sections of different papers and were never co-retrieved. Full-context inference holds those passages in the same attention space; the model can weigh them simultaneously.
At 48,000 tokens, sparse processing at 1% density attenuates weak associations between unrelated passages while maintaining long-range routing between the methodological sections of different papers. The performance gradient from Scenario 3 (1 seed, 1/3 contradictions) to Scenario 5 (70 seeds, 2/3 contradictions) indicates that aggregate recall—governed by —is the binding variable for contradiction discovery at this corpus scale.
The scaling mechanism is nonetheless bounded. Raising the seed count to 100 () produces an absolute regression to 0/3 contradictions identified. This is consistent with findings in the RIS-Kernel architecture [7]: higher active densities reintroduce sequence-level distractor noise that competes within the pre-fusion softmax (PFUS) normalisation. Under high effective density, the attention pathways of compact parameter models saturate and generate systematic misattributions. For sub-2B-parameter architectures, inference configurations that limit U to approximately 25– balance retrieval coverage against distractor-driven degradation.
4. Methods
4.1. The RIS Implementation
The RIS engine overrides the host LLM’s self-attention layer at runtime without modifying weights or configuration files on disk. Mathematical proofs, architectural details, and additional benchmarks are available in the primary preprint [7]; source code is at https://github.com/santosardr/riskernel.
4.2. Runtime Monkey-Patching Injection
RIS replaces self-attention forward functions using Python’s dynamic class structure. At initialisation, it intercepts:
- For the Qwen2 architecture: Qwen2Attention.forward and Qwen2FlashAttention2.forward.
- For the LLaMA architecture: LlamaAttention.forward.
The replacement routes queries (Q), keys (K), and values (V) to the sparse attention kernel. Positional parameters (config.rope_parameters or config.rope_scaling) are modified to apply YaRN scaling, maintaining positional coherence up to 65,536 tokens.
4.3. Mathematical Framework and Sparsification Geometry
RIS bounds the self-attention computation by restricting each query position to a subset of key-value tokens.
Let denote the Query, Key, and Value matrices. The RIS attention output for query token i is:
where is the causally constrained active index set (), with for target density .
Two modes construct :
- 1.
- Stochastic Mode: key indices are sampled uniformly from the historical context, with each index selected independently at probability d.
- 2.
- Structural Mode: the sequence is partitioned into local blocks of size . The active set combines a dense local clique and stochastically sampled global connections , with global density adjusted to respect the overall budget d.
For this corpus, Stochastic Mode is the appropriate choice. The relevant biological evidence—DeepCRISPR’s feature inputs in Study 2 and the nucleosome positioning correlations in Study 4—is separated by tens of thousands of tokens. Stochastic Mode distributes the attention budget uniformly across the full history, giving each pair of positions an equal probability of co-attention. Structural Mode concentrates density on local block-cliques, which is redundant given that a sliding local window of tokens already handles syntactic coherence. At 1% density with , the stochastic configuration probes whether long-range routing can surface cross-study connections without any structural prior.
For an ensemble of M independent seeds at per-step density d, the probability that all seeds miss a given key token is . Aggregate context coverage is therefore:
At , a single seed samples 1.0% of context; 40 seeds reach . The runtime attention matrix remains sparse at density d per step, controlling memory bandwidth and latency, while ensemble coverage accumulates across seeds as in Equation 2.
4.4. Memory-Bounded Mask Generation
Parallel allocation of large boolean masks is a practical blocker at long sequence lengths: a single boolean matrix with 65,536 tokens occupies 4.3 GB, so an ensemble of seeds processed in parallel requires over 40 GB.
RIS avoids this through a streaming mask generator. A lightweight CPU pseudo-random number generator draws indices for one seed at a time, applies the causal filter (), merges the result into a single master sparse representation, and discards the seed’s intermediate allocation before advancing to the next seed. The peak memory footprint for geometry initialisation is therefore bits—536 MB at 64k tokens—regardless of ensemble size. Figure 5 shows the pipeline.
4.5. Pre-Fusion Unified Softmax (PFUS)
Recomputing the full stochastic union at every decoding step is computationally prohibitive. RIS-Kernel instead splits the active set into two fixed components:
- 1.
- Stochastic Anchor: the union of sparse indices selected by all ensemble seeds during prefill, frozen after the first generated token.
- 2.
- Dynamic Local Window: a sliding dense window of L tokens (typically ) tracking the most recently generated context.
At each decoding step, the Stochastic Anchor and the sliding window are merged via a GPU-accelerated unique() operation, and score normalisation is applied over the merged set in a single pass:
Normalising before the union rather than after it prevents distal anchor tokens from being systematically downweighted relative to local tokens. This ordering matters when the relevant evidence is spread across the full 48,000-token sequence. Figure 6 shows the index fusion flow.
Supplementary Materials
The following supporting information can be downloaded at the website of this paper posted on Preprints.org.
Data Availability Statement
The dataset of 2,000 off-target cleavage events with computed chromatin and nucleosome positioning markers, model configuration parameters, and evaluation questions are available in the supplementary material ZIP file. The package also contains the primary evaluation scripts: the correlation validation pipeline (run_biological_validation.py), the contradiction discovery pipeline (run_contradiction_experiment.py), and the benchmark evaluation harness (run_statistical_benchmark.py). The RIS sparsification engine is open-source and available at https://github.com/santosardr/riskernel.
References
- Touvron, H.; et al. Llama: Open and efficient foundation language models. arXiv 2023, arXiv:2302.13971. [Google Scholar]
- OpenAI. GPT-4 Technical Report. arXiv 2023, arXiv:2303.08774. [Google Scholar]
- Vaswani, A.; et al. Attention Is All You Need. Adv. Neural Inf. Process. Syst. 2017, 30, 5998–6008. [Google Scholar]
- Liu, H.; et al. Ring Attention with Blockwise Transformers for Near-Infinite Context. arXiv 2023, arXiv:2310.01889. [Google Scholar]
- Ainslie, J.; et al. GQA: Training Generalized Multi-Query Transformer Models from Multi-Head Checkpoints. Proc. EMNLP 2023, 4895–4901. [Google Scholar] [CrossRef]
- Lewis, P.; et al. Retrieval-augmented Generation for Knowledge-intensive NLP Tasks. Adv. Neural Inf. Process. Syst. 2020, 33, 9459–9474. [Google Scholar]
- Santos, A. R. Towards Million-Token Context Windows: A Topology-Preserving Framework for Adaptive Transformer Sparsification. Zenodo 2026, v5. [Google Scholar] [CrossRef]
- Konstantakos, V.; et al. CRISPR-Cas9 gRNA efficiency prediction: an overview of predictive tools and the role of deep learning. Nucleic Acids Res. 2022, 50(7), 3616–3637. [Google Scholar] [CrossRef] [PubMed]
- Chuai, G.; et al. DeepCRISPR: optimized CRISPR guide RNA design by deep learning. Genome Biol. 2018, 19(1), 80. [Google Scholar] [CrossRef] [PubMed]
- Liu, X.; et al. Predicting CRISPR/Cas9 Repair Outcomes by Attention-Based Deep Learning Framework. Cells 2022, 11(11), 1847. [Google Scholar] [CrossRef] [PubMed]
- Mak, J. K.; et al. Comprehensive computational analysis of epigenetic descriptors affecting CRISPR-Cas9 off-target activity. BMC Genom. 2022, 23, 805. [Google Scholar] [CrossRef]
Figure 1.
Visual comparison of context processing methods: full dense attention, RAG (discarding most of the context to fit within a small dense window), and RIS-Kernel (retaining the full sequence, and computing sparse stochastic interactions).
Figure 1.
Visual comparison of context processing methods: full dense attention, RAG (discarding most of the context to fit within a small dense window), and RIS-Kernel (retaining the full sequence, and computing sparse stochastic interactions).
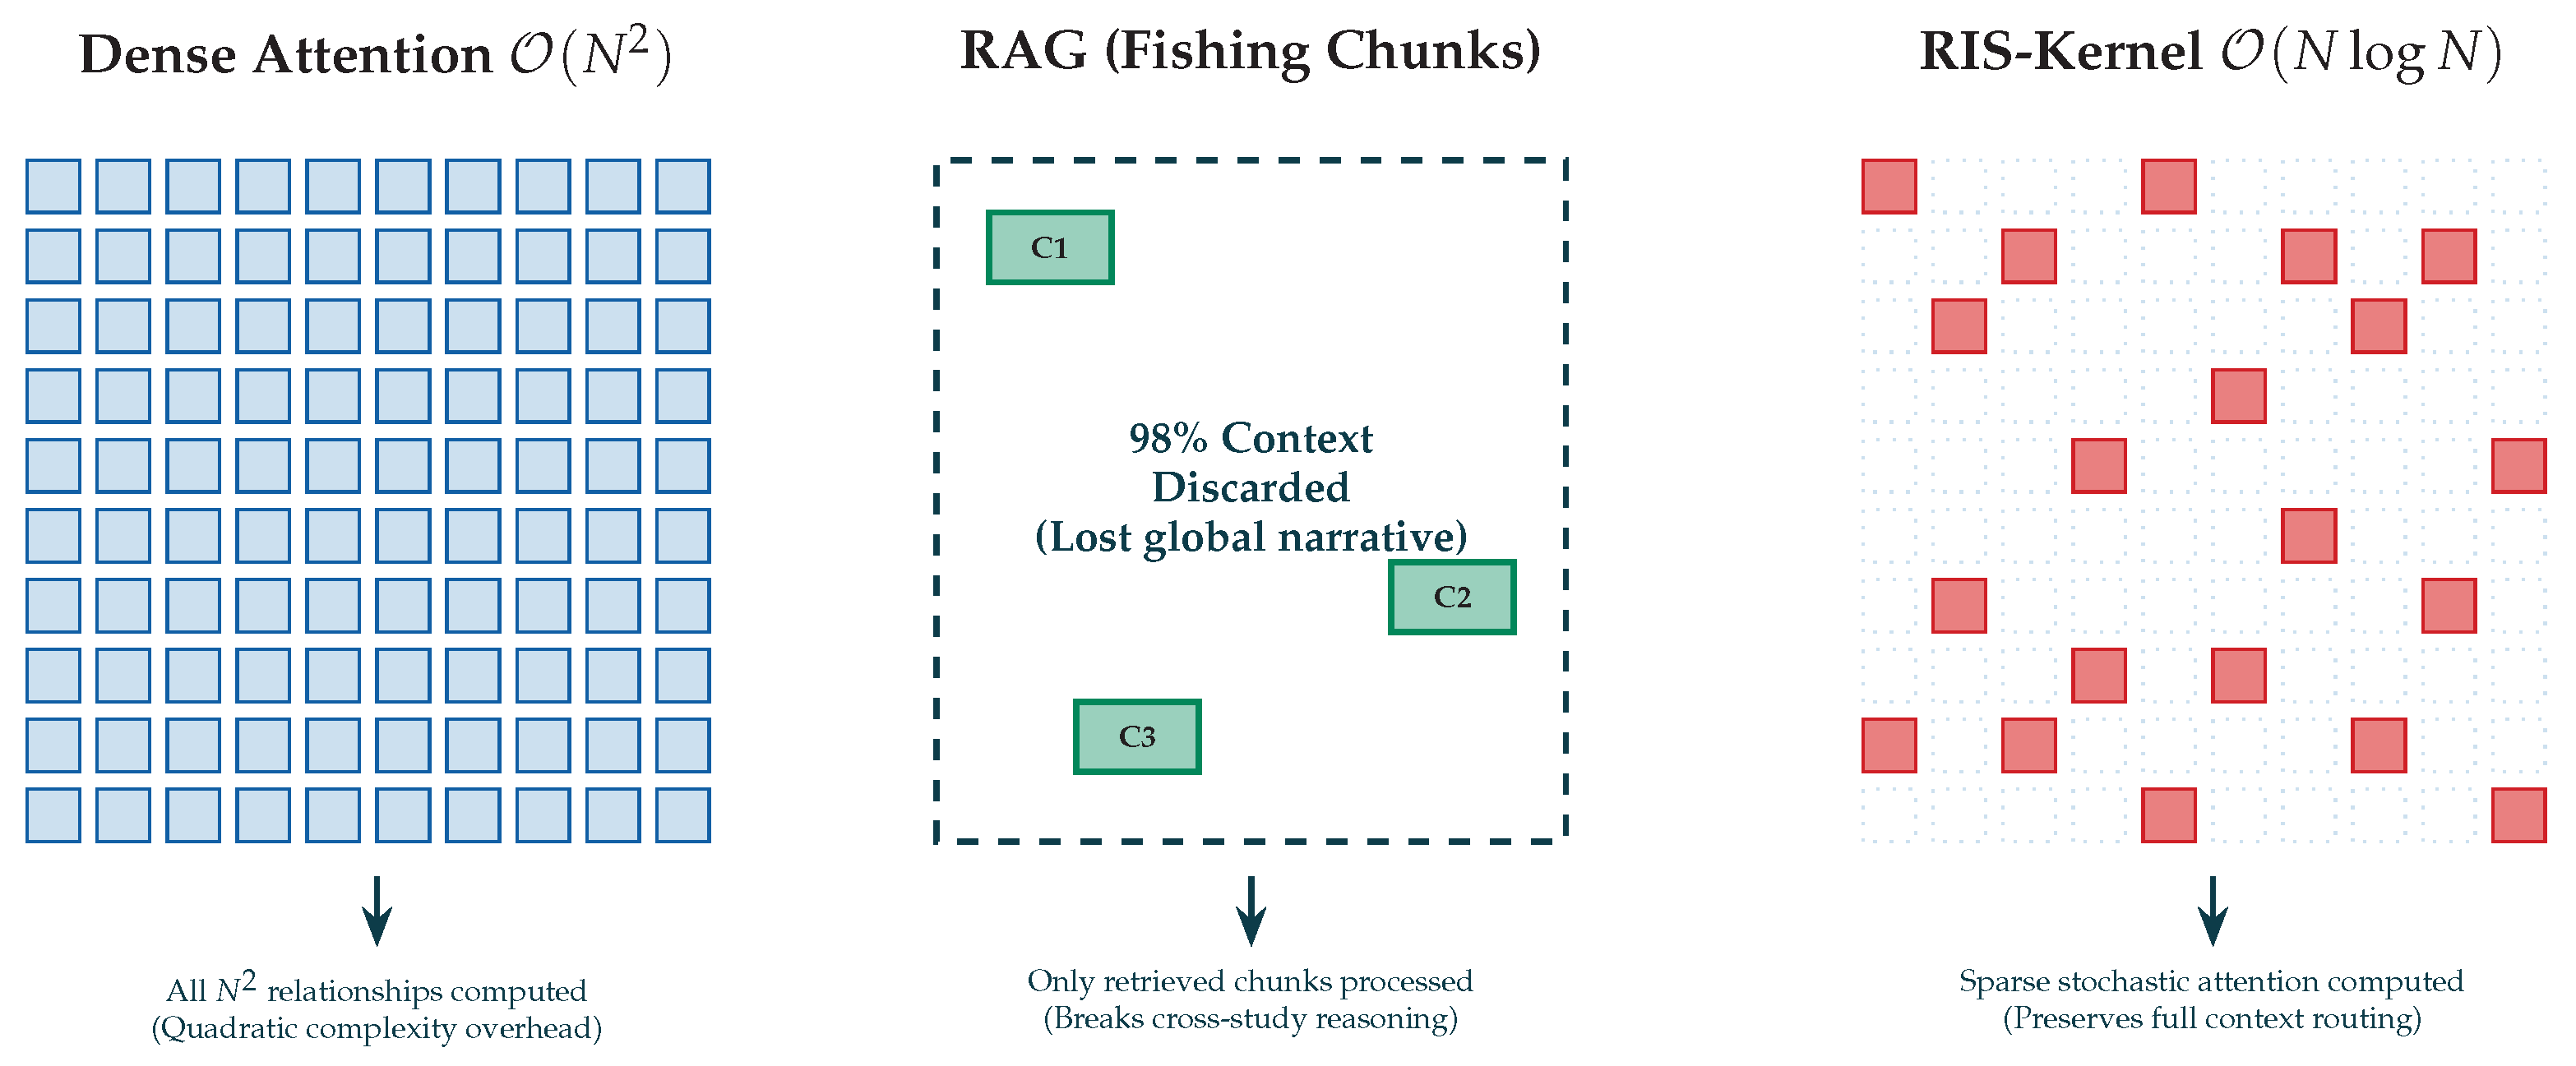
Figure 2.
Key hardware scaling mechanisms: GQA shares KV heads across query groups (left); Ring Attention executes block-wise attention concurrently by transferring Key/Value matrices in a ring of accelerators (right).
Figure 2.
Key hardware scaling mechanisms: GQA shares KV heads across query groups (left); Ring Attention executes block-wise attention concurrently by transferring Key/Value matrices in a ring of accelerators (right).
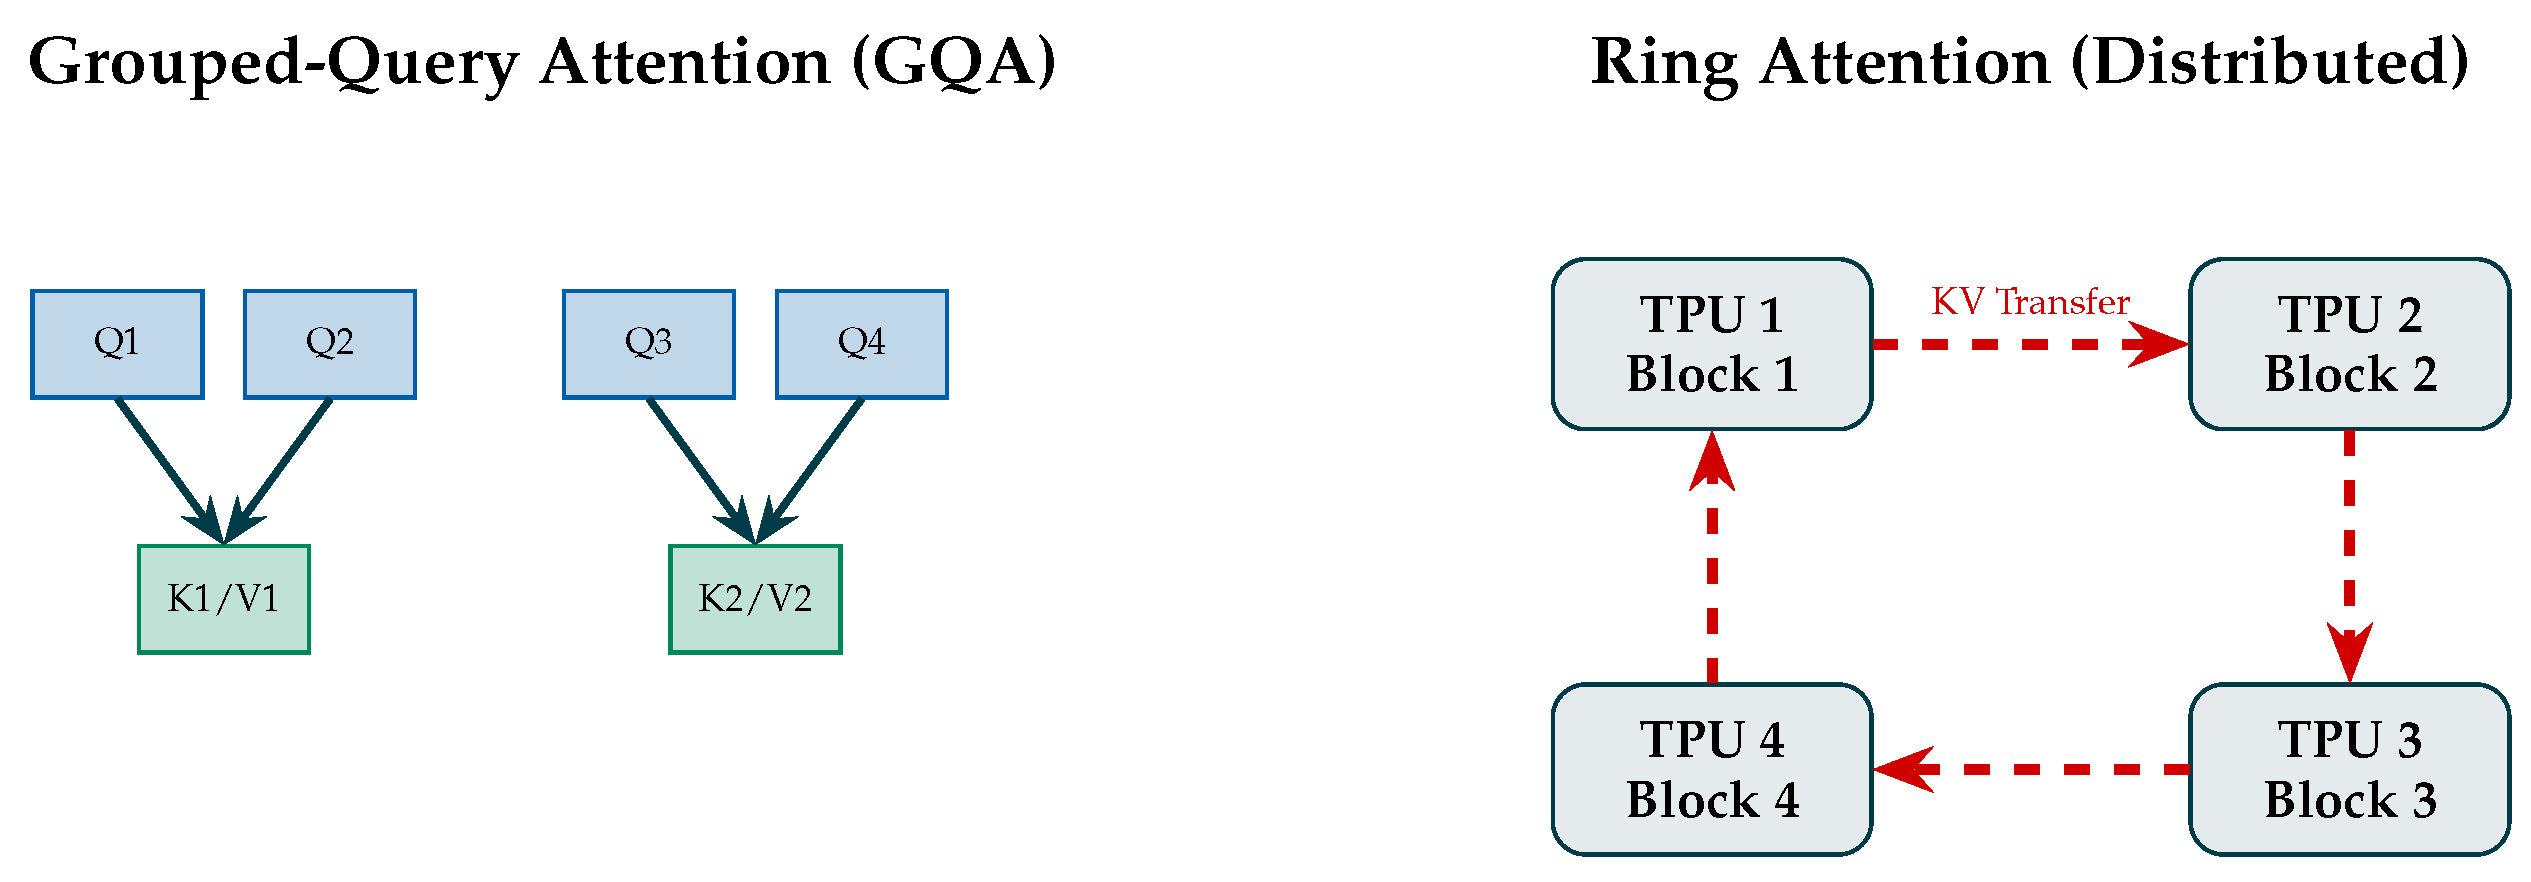
Figure 3.
Spearman rank correlations between CRISPR-Cas9 cleavage activity and epigenetic or nucleosomal descriptors ( off-target sites). Static epigenetic markers (CTCF, DNase I, RRBS, H3K4me3) used in DeepCRISPR show near-zero correlations (). Computed nucleosomal descriptors (Nucleotide BDM, Strong-Weak BDM, NuPoP Affinity, NuPoP Viterbi, NuPoP Human) show moderate to strong negative correlations.
Figure 3.
Spearman rank correlations between CRISPR-Cas9 cleavage activity and epigenetic or nucleosomal descriptors ( off-target sites). Static epigenetic markers (CTCF, DNase I, RRBS, H3K4me3) used in DeepCRISPR show near-zero correlations (). Computed nucleosomal descriptors (Nucleotide BDM, Strong-Weak BDM, NuPoP Affinity, NuPoP Viterbi, NuPoP Human) show moderate to strong negative correlations.
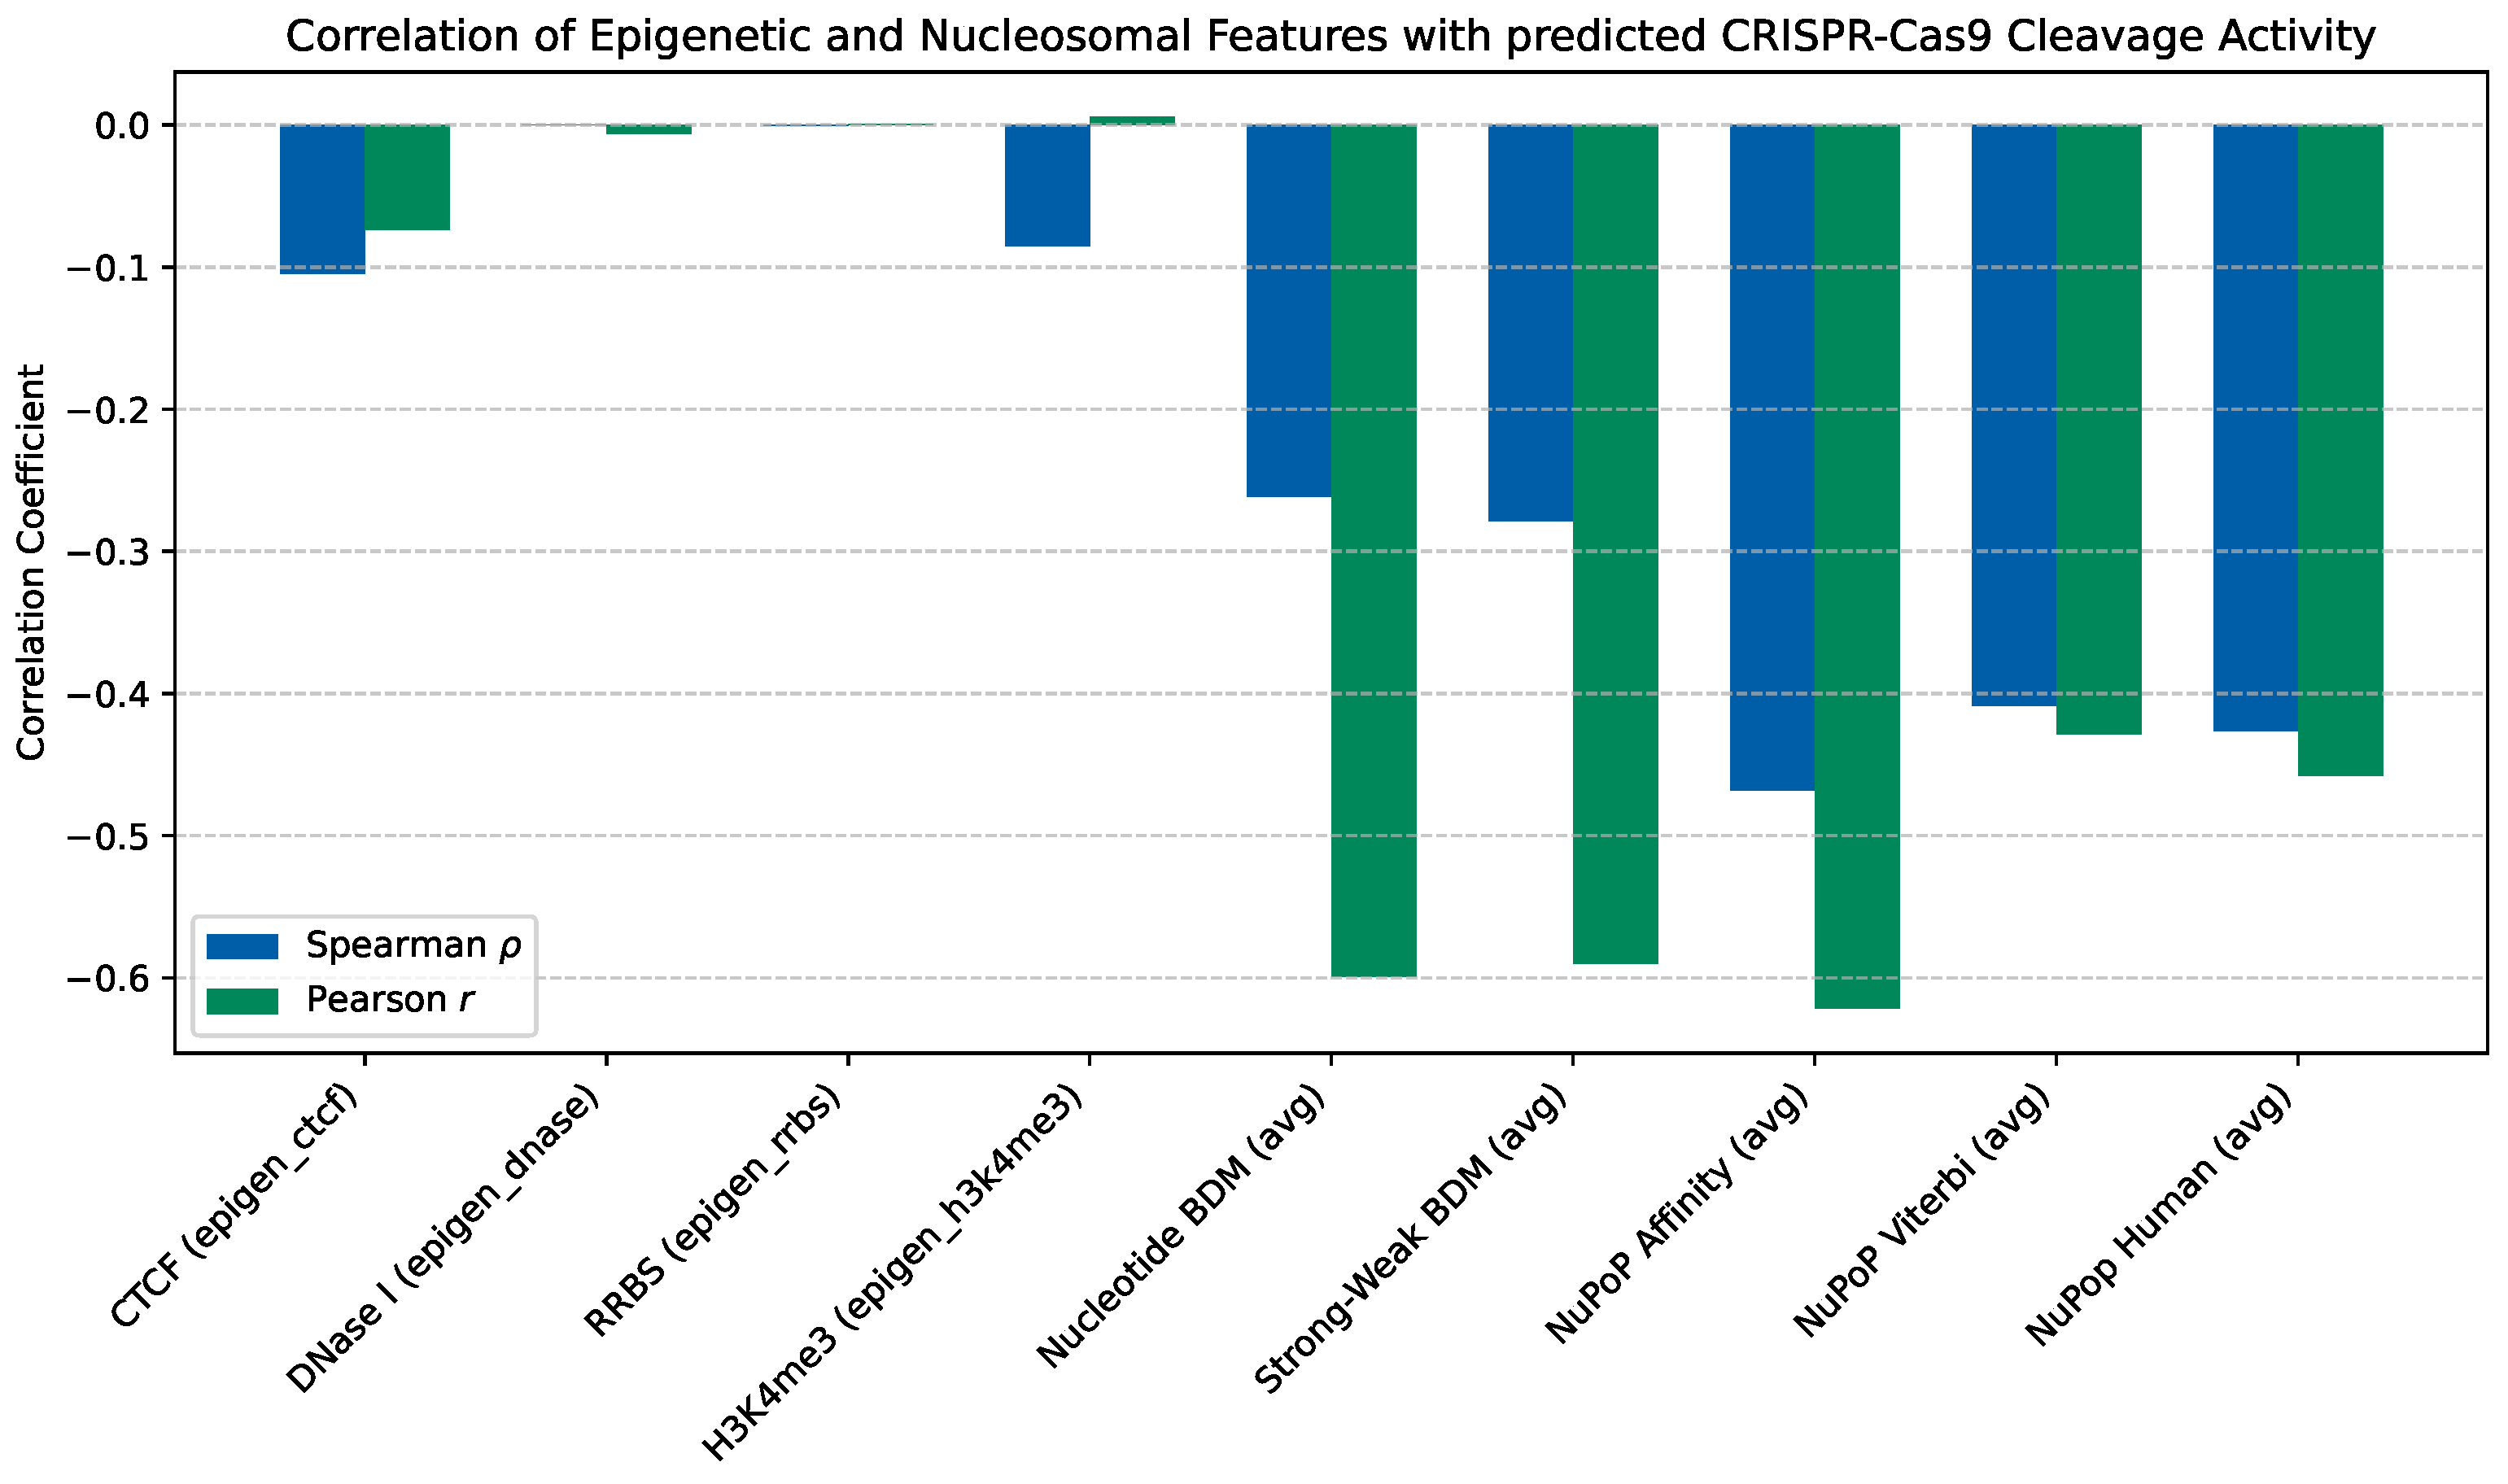
Figure 4.
Mean accuracy on the 30-question Cross-Study Synthesis Benchmark across 5 seeds. Error bars represent standard deviation ( for all configurations). RIS (30 seeds, 3% density) achieves 70% accuracy, a statistically significant improvement over RAG (60%) and Baseline (53.33%).
Figure 4.
Mean accuracy on the 30-question Cross-Study Synthesis Benchmark across 5 seeds. Error bars represent standard deviation ( for all configurations). RIS (30 seeds, 3% density) achieves 70% accuracy, a statistically significant improvement over RAG (60%) and Baseline (53.33%).
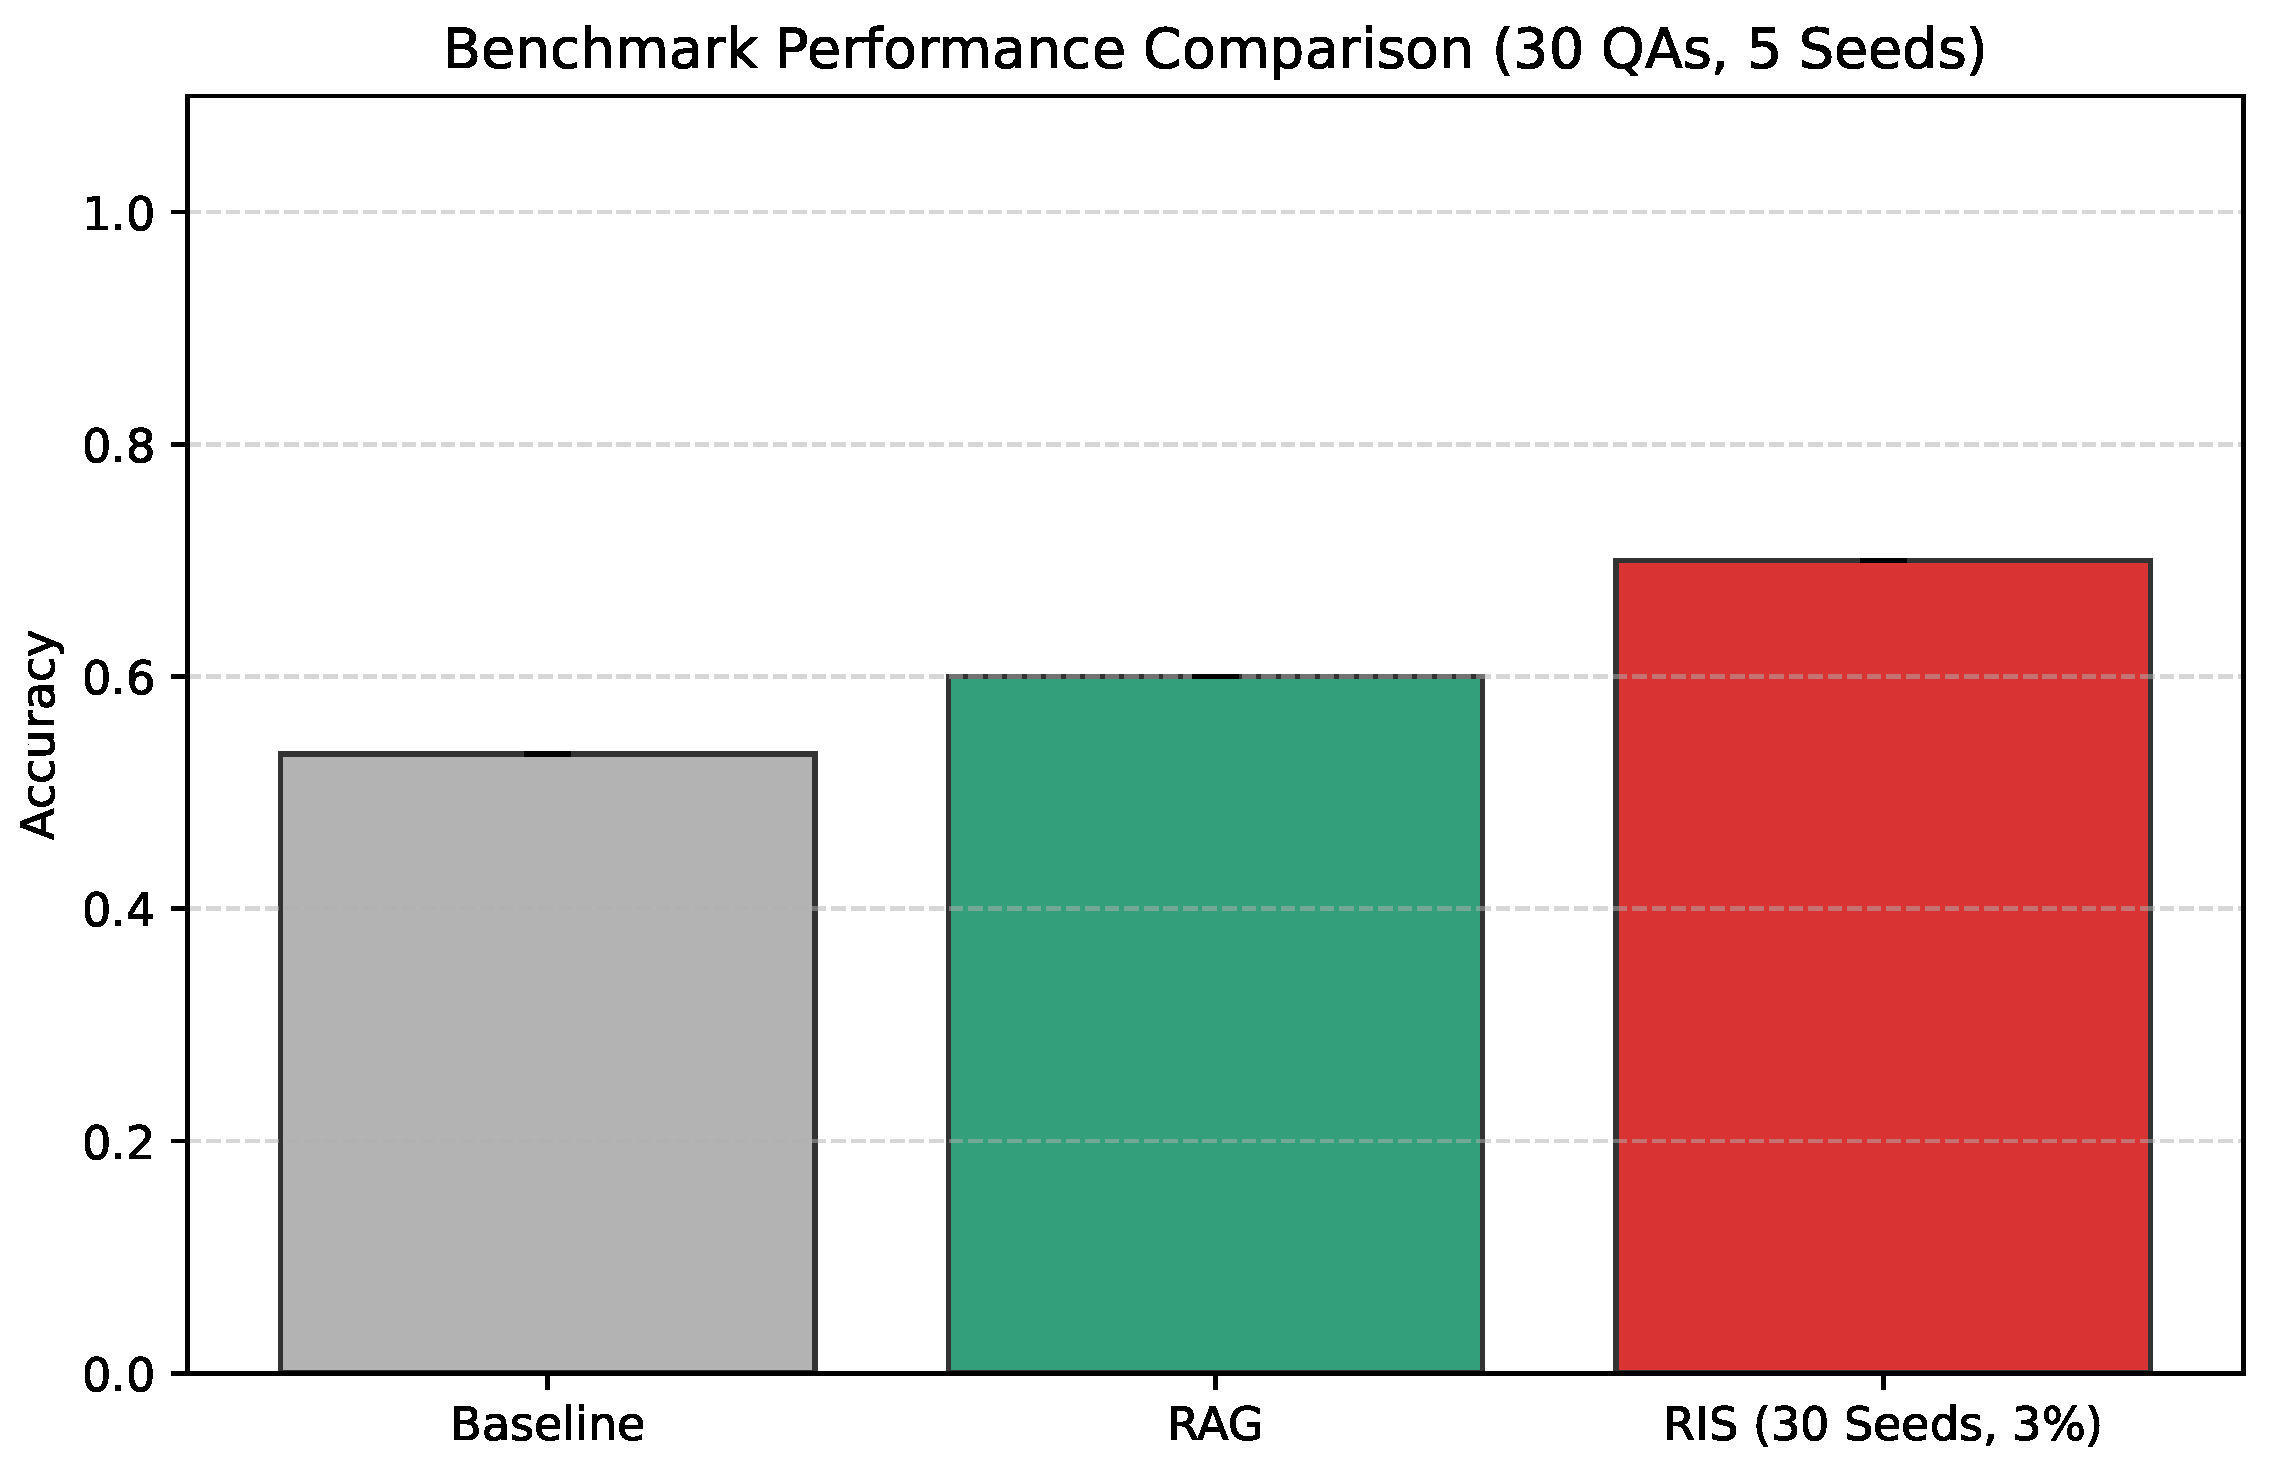
Figure 5.
Streaming mask generation flow. Each seed’s geometry is drawn, causally filtered, merged, and cleared from RAM sequentially, maintaining a constant memory ceiling.
Figure 5.
Streaming mask generation flow. Each seed’s geometry is drawn, causally filtered, merged, and cleared from RAM sequentially, maintaining a constant memory ceiling.
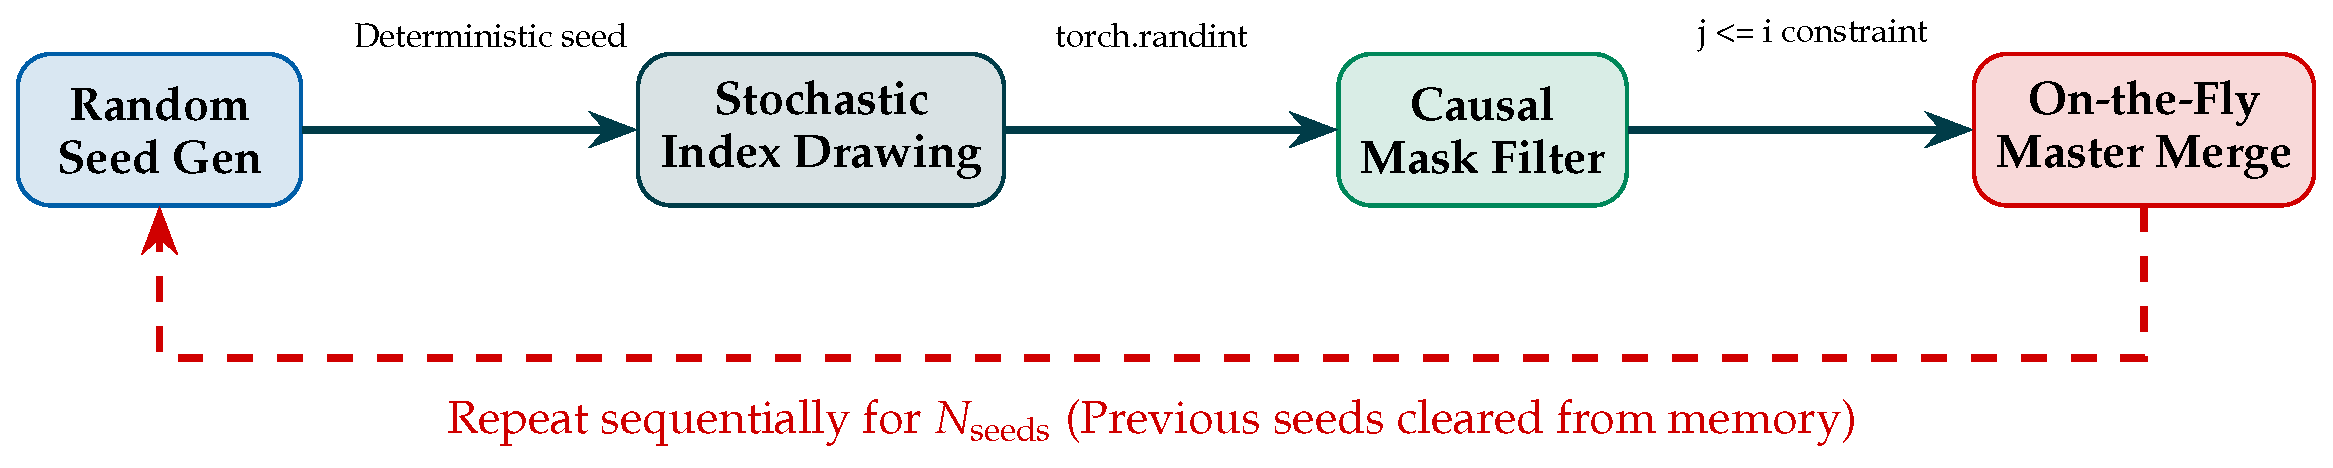
Figure 6.
PFUS index fusion diagram. The frozen stochastic anchor and the sliding local window are merged prior to scoring, ensuring a unified normalization.
Figure 6.
PFUS index fusion diagram. The frozen stochastic anchor and the sliding local window are merged prior to scoring, ensuring a unified normalization.
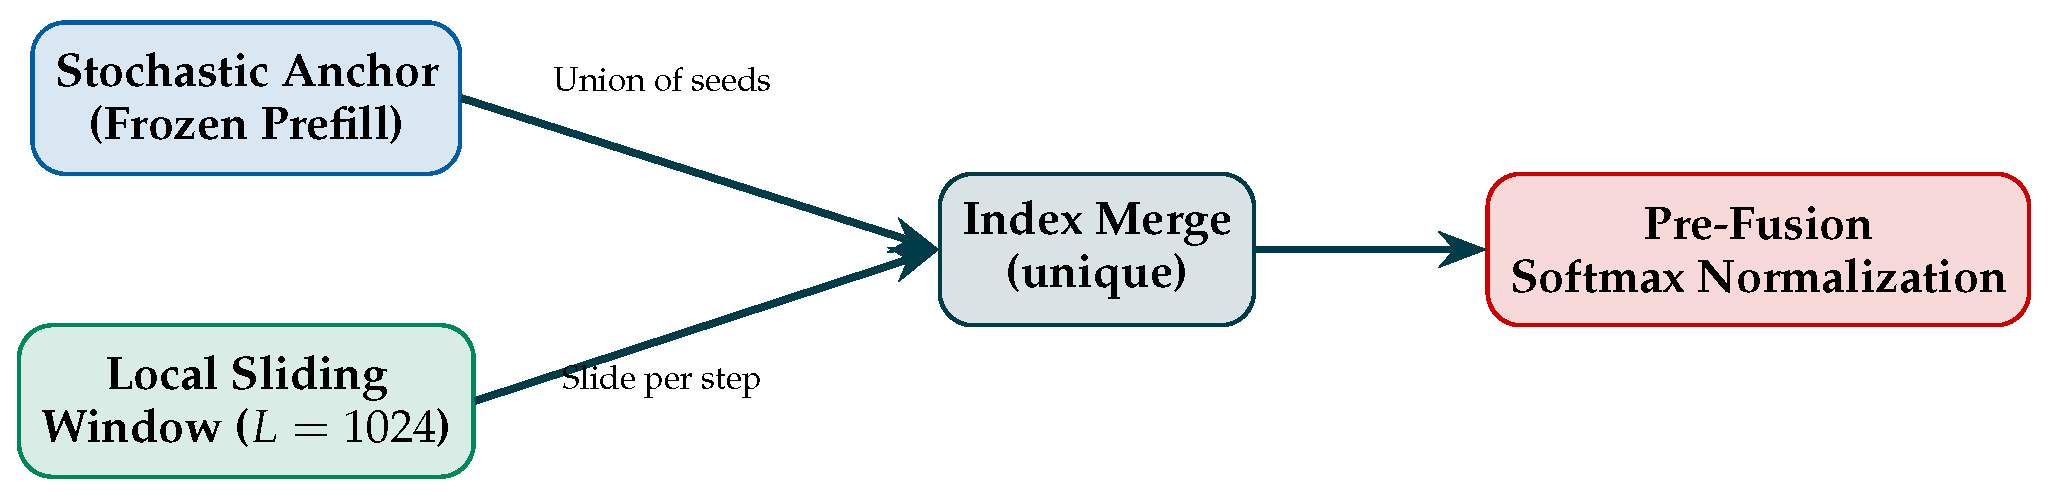

Table 1.
Quantitative and qualitative comparison of context-execution scenarios for cross-study reasoning.
Table 1.
Quantitative and qualitative comparison of context-execution scenarios for cross-study reasoning.
| Metric | Scenario 1: Baseline | Scenario 2: RAG (Top-10) | Scenario 3: RIS (1 Seed) | Scenario 4: RIS (70 Seeds) |
|---|---|---|---|---|
| Context Size | 0 tokens | ∼2,000 tokens | ∼48,557 tokens | ∼48,557 tokens |
| Attention Density | N/A | 100% (dense) | 1.0% (sparse) | 1.0% (sparse) |
| Complexity | ||||
| Ensemble Seeds (M) | N/A | N/A | 1 | 70 |
| Aggregate Recall (U) | N/A | 100% | 1.0% 1 | 26.1% 1 |
| Peak RAM (GB) | GB | GB | GB | 61.37 GB |
| Prefill Time | s | s | s | s 6 |
| Generation Time | s | s | s (CPU) | s (CPU) |
| Factual Errors | Omission 2 | 2 3 | 0 | 0 |
| Epigenetic Synthesis | None | Static 4 | Dynamic 5 | Dynamic 5 |
Table 2.
Quantitative resource usage and qualitative contradiction-discovery performance across scenarios.
Table 2.
Quantitative resource usage and qualitative contradiction-discovery performance across scenarios.
| Metric | Scenario 1: Baseline | Scenario 2: RAG | Scenario 3: RIS (1 Seed) | Scenario 4: RIS (70 Seeds) | Scenario 5: Gemini Web |
|---|---|---|---|---|---|
| Context Size | 0 tokens | ∼2,000 tokens | ∼48,557 tokens | ∼48,557 tokens | ∼48,557 tokens |
| Seeds (M) | N/A | N/A | 1 | 70 | N/A |
| Recall (U) | N/A | 100% | 1.0% | 26.1% | N/A |
| Peak RAM 1 | ∼6.2 GB | ∼6.8 GB | ∼38.0 GB | 61.37 GB 2 | N/A (Cloud) |
| Prefill Time | s | ∼2.8 s | ∼1.5 s | ∼112.7 s | ∼2.0 s |
| Gen. Time | ∼12.4 s | ∼15.2 s | ∼6,433.9 s | ∼9,731.5 s | ∼15.0 s |
| Contra. Recall | 0 / 3 | 0 / 3 | 1 / 3 | 2 / 3 | 3 / 3 |
| Key Biophysics | None | Partial | NuPoP, BDM | NuPoP, BDM | NuPoP, BDM |
| Errors/Halls. | Omission | High 3 | Low | Very Low | None |
| Status | Failed | Failed | Partial | Partial/Good | Successful |
Table 3.
Pearson and Spearman rank correlations between CRISPR-Cas9 cleavage activity and epigenetic or nucleosomal descriptors ( off-target sites from Mak et al. [11]). Cleavage activity was estimated by the Mak et al. XGBoost model. Static markers correspond to the DeepCRISPR feature set [9]; nucleosomal descriptors are computed biophysical scores.
Table 3.
Pearson and Spearman rank correlations between CRISPR-Cas9 cleavage activity and epigenetic or nucleosomal descriptors ( off-target sites from Mak et al. [11]). Cleavage activity was estimated by the Mak et al. XGBoost model. Static markers correspond to the DeepCRISPR feature set [9]; nucleosomal descriptors are computed biophysical scores.
| Group | Feature | Pearson r | Pearson p | Spearman | Spearman p |
|---|---|---|---|---|---|
| Static (DeepCRISPR) | CTCF | ||||
| Static (DeepCRISPR) | DNase I | ||||
| Static (DeepCRISPR) | RRBS | ||||
| Static (DeepCRISPR) | H3K4me3 | ||||
| Nucleosomal (Mak et al.) | Nucleotide BDM | ||||
| Nucleosomal (Mak et al.) | Strong-Weak BDM | ||||
| Nucleosomal (Mak et al.) | NuPoP Affinity | ||||
| Nucleosomal (Mak et al.) | NuPoP Viterbi | ||||
| Nucleosomal (Mak et al.) | NuPoP Human |
Table 4.
Performance on the 30-question Cross-Study Synthesis Benchmark (5 independent seeds). RAG uses TF-IDF top-10 chunk retrieval (≈2,000 tokens). RIS uses 30 ensemble seeds at 3% density over the full 48,557-token corpus. The t-test is a two-sample independent test (RIS vs. RAG).
Table 4.
Performance on the 30-question Cross-Study Synthesis Benchmark (5 independent seeds). RAG uses TF-IDF top-10 chunk retrieval (≈2,000 tokens). RIS uses 30 ensemble seeds at 3% density over the full 48,557-token corpus. The t-test is a two-sample independent test (RIS vs. RAG).
| Configuration | Context (tokens) | Seeds | Mean Acc. | p-value (vs. RAG) | |
|---|---|---|---|---|---|
| Baseline (Zero-Context) | 0 | — | 53.33% | 0.00% | — |
| RAG (TF-IDF, top-10) | ∼2,000 | — | 60.00% | 0.00% | Reference |
| RIS (30 Seeds, 3%) | ∼48,557 | 30 | 70.00% | 0.00% |
Table 5.
Comparison of AI-assisted cross-study synthesis approaches for laboratory environments. Pipeline = can be easily embedded in an automated programmatic pipeline.
Table 5.
Comparison of AI-assisted cross-study synthesis approaches for laboratory environments. Pipeline = can be easily embedded in an automated programmatic pipeline.
| Approach | Context Limit | Local/Private | Pipeline-Ready | Hardware Cost |
|---|---|---|---|---|
| Cloud LLM (e.g., GPT-4) | ≤2M tokens | × | Partial | Minimal |
| RAG (local) | ≤4k tokens | ✓ | ✓ | Minimal |
| RIS-Kernel (local) | ≤64k tokens | ✓ | ✓ | High (50 GB RAM) |
Disclaimer/Publisher’s Note: The statements, opinions and data contained in all publications are solely those of the individual author(s) and contributor(s) and not of MDPI and/or the editor(s). MDPI and/or the editor(s) disclaim responsibility for any injury to people or property resulting from any ideas, methods, instructions or products referred to in the content. |
© 2026 by the authors. Licensee MDPI, Basel, Switzerland. This article is an open access article distributed under the terms and conditions of the Creative Commons Attribution (CC BY) license (http://creativecommons.org/licenses/by/4.0/).
Copyright: This open access article is published under a Creative Commons CC BY 4.0 license, which permit the free download, distribution, and reuse, provided that the author and preprint are cited in any reuse.


