

Submitted:
24 July 2026
Posted:
27 July 2026
You are already at the latest version
Abstract
A two-component model, which is the sum of thermodynamically consistent Tsallis function with embedded transverse flow and inverse power-law function (which is asymptotic of Hagedorn function at very high pT), has been proposed to reproduce accurately the measured long pT ranges of midrapidity transverse momentum spectra of primary charged particles at various centralities of high-energy heavy-ion collisions at the LHC. This two-component model function, called Tsallis-Hagedorn model with transverse flow (THMTF), has described quite well the experimental midrapidity transverse momentum spectra of primary charged particles in the whole pT range, measured by ALICE Collaboration in minimum bias p+p collisions at √s=2.76 and 5.02 TeV, minimum bias p+Pb collisions at √snn=5.02 TeV, and various collision centrality intervals of Xe+Xe collisions at √snn=5.44 TeV and Pb+Pb collisions at √snn =2.76 and 5.02 TeV. Dependencies of non-extensivity parameter q, kinetic freeze-out temperature parameter, T0, momentum scale parameter, P0, and power-index n of the two-component THMTF function on the average number of participant nucleons ( <Npart> ) as well as mean charged-particle multiplicity density (<dNch/dη>) in the analyzed Xe+Xe and Pb+Pb collisions at the LHC have been established. The probable border (threshold) values of collision centrality (values of <Npart>) for crossover phase transition from the dense hadronic state to that of QGP in Pb+Pb collisions at √snn= 2.76 and 5.02 TeV, and in Xe+Xe collisions at √snn=5.44 TeV have been estimated. The average number of partons participating in a scattering, nα=5, has been estimated from extracted average value of power-index n in the analyzed collisions. This has suggested that g+q→meson+q and g+g→meson+g gluon fragmentation reactions are the dominant mechanism for high pT hadron production in the analyzed p+p, p+Pb, Xe+Xe, and Pb+Pb collisions at the LHC.
Keywords:
high-energy p+p
; p+Pb
; Xe+Xe and Pb+Pb collisions at the LHC
; transverse momentum distributions of primary charged particles
; Tsallis distribution with embedded transverse flow
; Hagedorn function
; two-component model function
; power-index n
; non-extensivity parameter q
; transverse flow velocity
; kinetic freeze-out temperature
; mechanisms of hadron production at the LHC
; crossover phase transition from the dense hadronic matter to QGP
; correlations among kinetic freeze-out parameters
1. Introduction
Quark-gluon plasma (QGP) is a plasma state of matter consisting of nearly free quarks and gluons, which is believed to be a matter of a newly born Universe a few microseconds after the so called Bing-Bang − starting point of Universe creation. QGP was generated [1,2,3,4,5,6,7,8,9] in high-energy heavy-ion collisions at the Large Hadron Collider (LHC, Switzerland) and the Relativistic Heavy-ion Collider (RHIC, USA). With a very short lifetime of the order of ~ 10−23 seconds, this extremely dense and hot QGP matter has demonstrated almost perfect fluid behavior, characterized by very low viscosity. During its short existence, QGP undergoes a process called hadronization, converting colored quarks and gluons into many color-neutral particles, most of which are charged and neutral pions. Following this, the hot and dense cluster (“fireball”) of newly produced hadrons expands (flows) longitudinally and radially, cooling down rapidly and passing through the chemical and kinetic freeze-out stages. Chemical freeze-out occurs when the hadrons cease inelastic interactions, which determines the final numbers of produced various particle species. The chemical potential and the temperature of the system at this moment are estimated by analyzing the yield ratios of different particle species with the help of statistical hadronization or thermal models [10,11,12,13,14,15]. Finally, kinetic freeze-out stage is reached when elastic interactions among particles in the expanding fireball stop, which determines the particles’ final momenta and energies as measured by detectors surrounding the interaction zone. Analysis of the experimental transverse momentum distributions of produced hadrons in the low (pT ≤ 2−3 GeV/c) and intermediate (2−3 GeV/c ≤ pT ≤ 5−6 GeV/c) pT range is needed for evaluating the thermodynamic and hydrodynamic properties of a collision system at the moment of kinetic freeze-out. Processes of quark recombination in production of hadrons, which result in enhancement of proton-to-pion yield ratio in high-energy nuclear collisions compared to proton-proton collisions, contribute to intermediate pT range of transverse momentum spectra of hadrons. QCD (Quantum-Chromo-Dynamics) hard scatterings, quark and gluon fragmentation, production of quark-gluon jets and their energy loss in the QGP medium, are responsible for and determine mostly the high-pT part (pT > 5−6 GeV/c) of hadron spectra [16]. While parton (quark or gluon) fragmentation dominates high-pT hadron production, the dense QGP matter produced in heavy-ion collisions allows for partons to recombine, which favors baryon (proton) production over meson (pion) production mostly in intermediate pT range. Decays of higher mass resonances also contribute to the measured hadron spectra [16]. Hence, analysis of transverse momentum spectra of hadrons and their dependencies on collision centrality, or average number of participant nucleons (or charged-particle multiplicity density), and their nuclear modifications allow one to extract valuable information on collective properties of the medium and various mechanisms of hadron production in proton-proton, proton-nucleus and nucleus-nucleus collisions at high energies [10,17,18,19,20,21,22,23,24,25,26,27,28,29,30,31,32,33,34,35,36,37,38,39,40,41].
Transverse momentum spectra of hadrons, produced in high-energy collisions, demonstrate exponential behavior in the low-pT part and power-like distribution, typical for pQCD (perturbative QCD), in the high-pT part. There are no exact pT borders between various processes and mechanisms, which contribute to the measured pT spectra of hadrons overlapping significantly in different pT regions. Therefore, these various phenomena, contributing differently to the final pT spectra of hadrons, still lack unambiguous theoretical explanation and can be reproduced by various phenomenological models only. Different phenomenological models have been proposed to describe the transverse momentum spectra of hadrons in high-energy proton-proton, proton-nucleus and nucleus-nucleus collisions. The most widely used model, which combines both exponential and power-like shapes, is the non-extensive Tsallis distribution function and its various modifications [42,43,44,45,46,47,48,49,50,51,52,53,54,55,56,57,58,59,60,61,62,63]. The QCD inspired inverse power-law Hagedorn function [64,65] could reproduce quite well the high pT part of pT spectra of particles generated in high-energy nucleon-nucleon collisions. Various power-law or Tsallis type models can describe well the whole measured pT spectra in minimum bias or low multiplicity proton-proton collisions, or in low multiplicity peripheral proton-nucleus and nucleus-nucleus collisions. However, these models fail to describe accurately the pT spectra in high-multiplicity proton-proton and central heavy-ion collisions in the whole measured pT range, suggesting more complex models [20,21,22,24,26,27,30,31,37,38,63,66,67,68,69], including the hydrodynamical flow effects in the blast-wave model (BWM) [24,26,27]. The BWM model itself is used to fit the pT spectra in the limited pT range up to 3 GeV/c [24,26,27]. The Hagedorn and Tsallis functions with embedded transverse flow [20,21,22,30,31,37,38,63,66], Blast-Wave model with Boltzmann Gibbs statistics [24,26,27], the Improved Tsallis function with an effect of transverse flow [67,68,69], and other functions incorporating transverse flow have been used to estimate the average transverse flow velocity and temperature of a collision system at the moment of kinetic freeze-out. However, these phenomenological model functions, which incorporate transverse flow, could describe well just the low and intermediate pT range up to 5 GeV/c only.
In Ref. [17] transverse momentum spectra of charged hadrons in proton-proton collisions at the LHC have been analyzed in terms of a two-component model [17], parameterizing the charged-particle spectrum by the sum of an exponential (Boltzmann-Gibbs like distribution) and a power-law term. The exponential term of this model has been associated with thermalized production of hadrons by valence quarks and cloud of quarks and gluons coupled to them [17]. The power-law term has been related to the mini-jet fragmentation of the virtual partons (pomerons in pQCD) exchanged between two colliding systems of partons [17]. Variations of the model parameters as a function of pseudorapidity interval and center-of-mass collision energy in proton-proton collisions have been investigated. However, this two-component model function could fit well the charged-hadron spectra only in minimum bias proton-proton collisions at high energies [17]. In Ref. [18] a three-component model function, which is a sum of the hydrodynamical blast-wave term, Tsallis function term and -dependent power-law term, has been proposed for an improved fitting of the hadron spectra measured at midrapidity for arbitrary transverse momenta in proton-proton and heavy-ion collisions at the LHC. It has been concluded that this model function is effectively two-component “soft+hard”
model, because of mainly auxiliary character of the Tsallis term, which vanishes for heavy particles and presumably describes mainly the contribution from decays of resonances [18]. In Ref. [70] a unified non-extensive statistical approach, using the Pearson distribution, has been proposed to describe pT spectra of hadrons produced in high-energy collisions. Though this unified model function reproduces accurately hadron pT spectra up to the largest pT values in minimum-bias high-energy proton-proton collisions, it could fit well pT distributions of particles in various centralities of high-energy heavy-ion collisions in the limited pT range up to 5 GeV/c only [70].
In present work, we propose a new two-component model function, which is a sum of thermodynamically consistent [45] Tsallis function with embedded transverse flow, introduced for the first time in Ref. [21] and shown [21,36,37,66] to reproduce quite well the midrapidity pT spectra of identified hadrons in various centralities of high-energy heavy-ion collisions in pT range up to 5 GeV/c, and inverse power-law function, which is asymptotic of Hagedorn function at very high pT, aimed to reproduce hadron pT spectra in pT > 5 GeV/c range up to the highest measured pT values. We call this two-component model function as Tsallis-Hagedorn model with transverse flow (THMTF) in present analysis. In present work, we analyze, using proposed THMTF function, the midrapidity experimental pT spectra of primary charged hadrons up to the highest pT values, as measured by ALICE collaboration, in various centrality intervals of high-energy Xe+Xe (at =5.44 TeV) [71] and Pb+Pb (at =2.76 and 5.02 TeV) [72] collisions at the LHC. We study also the midrapidity experimental pT spectra of primary charged hadrons produced in minimum bias proton-proton (at =2.76 and 5.02 TeV) and p+Pb (at = 5.02 TeV) collisions at the LHC, measured [72] by ALICE collaboration, as the reference data for a comparison.
2. Experimental Data and Two-Component (THMTF) Model
In present work, we analyze the transverse momentum spectra of primary charged particles from Pb+Pb collisions at =2.76 and 5.02 TeV [72] and Xe+Xe collisions at =5.44 TeV [71] measured by the ALICE Collaboration in nine centrality intervals in midpseudorapidity region |η| < 0.8 and in the transverse momentum ranges 0.15 < pT < 15 GeV/c (for Pb+Pb collisions) and 0.15 < pT < 50 GeV/c (for Xe+Xe collisions). We also use experimental transverse momentum spectra of primary charged particles measured [72] by the ALICE Collaboration in minimum bias proton-proton (at =2.76 and 5.02 TeV) and p+Pb (at = 5.02 TeV) collisions as the reference data for comparison with those in Pb+Pb collisions at =2.76 and 5.02 TeV [72] and Xe+Xe collisions at =5.44 TeV [71]. The pT spectra of primary charged particles in minimum bias proton-proton collisions at =2.76 and 5.02 TeV have been measured [72] by ALICE collaboration in pT range 0.15 < pT < 50 GeV/c, and in pT range 0.15 < pT < 15 GeV/c in minimum bias p+Pb collisions at = 5.02 TeV. A primary charged particle is [72] taken to be a charged particle with a mean proper lifetime largerthan 1 cm/c which is either produced directly in the interaction, or from decays of particles with lifetimesmaller than 1 cm/c, excluding particles produced in interactions with the detector material (here c is the speed of light in vacuum). The criteria for selection of tracks have been identical for all data sets and optimized for best track quality and minimal contamination from secondary particles. The average values of the number of participant nucleons () and charged-particle (pseudo-rapidity) multiplicity density () obtained [71,72,73] by the ALICE Collaboration, using the Glauber - Monte Carlo model calculations, in the analyzed centrality classes of Xe+Xe collisions at =5.44 TeV and Pb+Pb collisions at =2.76 and 5.02 TeV are presented in Table 1.
The following version of Tsallis function [45,46,47,50], calculated for a zero chemical potential (μ ≈ 0 at the TeV collision energies) at midrapidity (<y>=0), agrees with the thermodynamic relations for pressure, temperature, particle number, energy, and entropy densities [45]:
where Cq represents the fitting constant, Nev indicates the total number of inelastic collision events, – denotes the transverse energy (mass), and m0 is the hadron's rest mass. Furthermore, T shows the effective temperature, while q refers to the non-extensivity parameter. This parameter, q, which is fundamental for Tsallis distribution, is assumed to represent the fluctuations in system’s temperature via the relationship . The deviation, q−1, from unity of this parameter is believed to quantify the extent of non-thermalization and non-equilibrium within the system. As q approaches one (1), the Tsallis distribution converges to the exponential Boltzmann-Gibbs distribution, applicable to systems in equilibrium. The closer the q parameter is to one (1), the higher the level of thermalization (equilibrium) of the system. Since the majority (~ 85%) of primary charged particles generated in high-energy p+p, p+Pb, Xe+Xe, and Pb+Pb collisions at LHC energies are charged pions [19,25,74], we use charged-pion mass, m0 = 139.57 MeV/c2, for all primary charged particles spectra across all the analyzed collision systems in present study. The function represented in Eq. (1) is termed the thermodynamically consistent Tsallis function. The proof of thermodynamic consistency of the function in Eq. (1) was illustrated in Ref. [45]. The normalization constant is assumed to have a linear relationship with the system’s volume (V) [45,46] through expression Cq=gV/(2π)3, where g is the degeneracy factor of particle species.
In Eq. (1), the effective temperature T includes contributions from both chaotic thermal motion and transverse radial flow. To distinguish these two contributions, the velocity of transverse flow must be plugged into the Tsallis distribution function. The transverse flow can be incorporated into the Tsallis distribution with thermodynamic consistency in Eq. (1) by substituting , as was first done in Ref. [21], to derive the function:
This substitution, , means [21] simply the Lorentz transformation to a system co-moving with an average transverse flow velocity, , of the system of particles in the transverse plane assuming that such a flow of particles exists in this system. The thermodynamically consistent Tsallis function with embedded transverse flow in Eq. (2) has reproduced [21,36,37,66] quite well the midrapidity pT spectra of identified charged hadrons in the low and intermediate pT ranges up to 5 GeV/c in high-energy p+Pb, Xe+Xe, and Pb+Pb collisions at the LHC, allowing for the physically meaningful interpretation of the extracted collective parameters and their dependencies on system size, collision centrality and average charged-particle multiplicity density.
The high pT part of transverse momentum spectra of hadrons in high-energy nucleon-nucleon collisions could be reproduced well by the inverse power law − QCD inspired Hagedorn function [62,64,65]:
where is the fitting constant, proportional to the system’s volume at freeze-out, n and P0 are free parameters, which have distinct physical meanings related to underlying production mechanisms of hadrons. Parameter , being characteristic momentum scale, can represent the typical momentum scale where the production mechanism transitions from soft (thermal/exponential) to hard (power-law/perturbative) processes. In some modified versions of Hagedorn function, is related to the temperature of the system (T) and the power-index n, expressed as . It also characterizes the average transverse momentum contributed by partons (quarks or gluons) before they fragment into hadrons. The power-index parameter n describes the "hardness" of the interaction. A small value of n represents a "hard" spectrum dominated by perturbative QCD (pQCD) scattering and jet production. The QCD cross sections at high energies scale as with the power-index n modelled as , where represents the number of active flavors or the number of partons participating in a scattering [62,75]. In the simple scattering (leading twist), the dominant process is a simple point-like scattering between two quarks, , with the number of participant quarks () equal four. This results in the power-index parameter . In the multiple scattering (higher twist), multiple quark-quark scatterings or quark-hadron scatterings occur, and the value of n increases. This reflects the involvement of more constituent participants in the processes of particle production. Obviously, the value of parameter changes significantly depending on whether the produced particle is a meson (two constituent quarks) or a baryon (three constituent quarks). These differences are due to the differing quark structure and distinct production mechanisms of mesons and baryons − specifically, how many constituent quarks (partons) must recombine or "coalesce" to form the final hadron. In a statistical framework, Hagedorn parameter is inversely connected to the Tsallis non-extensivity parameter q through the relation .
For very large values of transverse momentum () the Hagedorn function in Eq. (3) reduces to the following asymptotic, called (simple) inverse power-law function:
To reproduce well the measured long ranges of midrapidity transverse momentum distributions of charged particles at various centralities of high-energy heavy-ion collisions, we propose the following two-component model function, which is the sum of the thermodynamically consistent Tsallis function with embedded transverse flow, given in Eq. (2), and (simple) inverse power-law function, shown in Eq. (4):
where is the Heaviside function with the following properties: if and if . This new two-component model function in Eq. (5) is called Tsallis-Hagedorn model with transverse flow (THMTF) in present work. Parameter represents the optimal value of border between the corresponding fit ranges of the first and second term in Eq. (5). In our work, we use fixed GeV/c, because thermodynamically consistent Tsallis function with embedded transverse flow, given in Eq. (2), could reproduce quite well the midrapidity transverse momentum distributions of identified charged particles at various centralities of high-energy heavy-ion collisions in the low and intermediate range up to = 5 GeV/c [21,36,37,66]. Using GeV/c in Eq. (5) means that the hadron spectrum is described by thermodynamically consistent Tsallis function with transverse flow (Eq. (2)) in ≤ 5 GeV/c range and by inverse power-law function (Eq. (4)) in > 5 GeV/c region. For the measured midrapidity spectra, , of particles the THMTF function in Eq. (5) becomes:
In present work, we have fitted, using the newly introduced THMTF function (Eq. (6)), the midrapidity experimental pT spectra of primary charged hadrons up to the highest pT values, measured by ALICE collaboration, in nine centrality intervals (see Table 1) of high-energy Xe+Xe (at =5.44 TeV) and Pb+Pb (at =2.76 and 5.02 TeV) collisions at the LHC. We have also fitted using THMTF function the midrapidity experimental pT spectra of primary charged hadrons produced in minimum bias proton-proton (at =2.76 and 5.02 TeV) and minimum bias p+Pb (at = 5.02 TeV) collisions at the LHC, measured by ALICE collaboration, as a baseline data for comparison. The minimum χ2 fits of the experimental pT spectra with two-component model (THMTF) function in Eq. (6) have been done using Nonlinear Curve Fitting of the Origin 9.1 Graphing and Data Analysis Software. The error bars for the experimental data points in the figures of present work show the added (combined) statistical and systematic errors. These combined errors are mostly determined by the systematic uncertainties, which are much larger than the statistical errors. Minimum χ2 fit procedures have been conducted taking into account the weights (1/(combined error)2) of the experimental data points. The region pT < 0.5 GeV/c in spectra of primary charged particles has been excluded from fitting procedures, as also done previously in Refs. [19,21,25,36,37,66], because of the significant contribution to production of primary charged particles (mostly pions) from decays of baryon resonances in this low pT range. Because the midrapidity experimental pT spectra of primary charged hadrons produced in various centrality intervals of Pb+Pb collisions at =2.76 and 5.02 TeV in Ref. [72], measured by ALICE collaboration, are available up to 15 GeV/c, in present work we analyze and compare the parameters of the THMTF function extracted from fitting the experimental pT spectra in the same pT range from 0.5 to 15 GeV/c across all the analyzed Xe+Xe, Pb+Pb, proton-proton and p+Pb collision systems.
3. Analysis and Results
The parameters obtained from minimum fits with Tsallis-Hagedorn model with transverse flow (THMTF) (Eq. (6)) of experimental midrapidity spectra of primary charged particles in minimum bias p+p collisions at =2.76 and 5.02 TeV and minimum bias p+Pb collisions at = 5.02 TeV for the fitted pT range from 0.5 to 15 GeV/c are presented in Table 2. The corresponding results for the fitted pT range from 0.5 to 50 GeV/c in minimum bias p+p collisions at =2.76 and 5.02 TeV are also shown in this table. The corresponding minimum fit curves of experimental midrapidity spectra of primary charged particles in minimum bias p+p collisions at =2.76 and 5.02 TeV and minimum bias p+Pb collisions at = 5.02 TeV are demonstrated in Figure 1. As observed from Figure 1, THMTF function in Eq. (6) describes quite well the experimental spectra of primary charged particles in minimum bias p+p collisions at =2.76 and 5.02 TeV and minimum bias p+Pb collisions at = 5.02 TeV. As seen from Table 2, the parameters of THMTF function remain practically the same, not changing within fit errors in minimum bias p+p collisions at =2.76 and 5.02 TeV when the fitted pT range changes from [0.5−15] GeV/c to [0.5−50] GeV/c.
Table 2 demonstrates that the power-index decreases and momentum scale parameter, , slightly increases in minimum bias proton-proton collisions with an increase in center-of-mass collision energy, , from 2.76 to 5.02 TeV. Decrease of parameter is obviously caused by the hardening of pT spectrum because of more frequent high-momentum partonic scatterings at higher proton-proton collision energy (=5.02 TeV) with respect to lower collision energy (=2.76 TeV). The increase in parameter with an increase in proton-proton collision energy reflects higher energy transfer (higher energy density) and multiple parton scatterings during the initial collision, leading to a higher average transverse momentum at =5.02 TeV as compared to that at =2.76 TeV. As seen from Table 2, non-extensivity parameter q increases significantly as proton-proton c.m. collision energy, , increases from 2.76 to 5.02 TeV. As mentioned earlier, non-extensivity parameter q measures the degree of non-extensivity or deviation of the system from standard Boltzmann-Gibbs thermal equilibrium. As the proton-proton collision energy increases, parameter q typically increases [31,63] because the system moves further away from equilibrium due to several physical reasons. At higher collision energies, particle production is increasingly governed by perturbative QCD (pQCD) processes rather than soft thermal-like interactions. These hard scattering events produce power-law tails in the transverse momentum spectra, which are mathematically represented by a higher q value. The parameter q can also be interpreted as a measure of temperature fluctuations within the system. Higher collision energies lead to more violent and diverse initial conditions, resulting in larger fluctuations of the local "temperature," which pushes parameter q further away from unity. In addition, systems at higher collision energies undergo a more rapid expansion and evolution process. This could mean that the system has less time to thermalize before "freeze-out" occurs, leaving it in a more non-equilibrium state characterized by a larger q value. Because the nuclear modification factor (RpPb) in p+Pb collisions is close to unity at high pT values (pT > 8 GeV/c), the value of parameter in minimum bias p+Pb collisions at = 5.02 TeV does not deviate significantly from values in minimum bias p+p collisions at =2.76 and 5.02 TeV in Table 2. This is obviously due to the nuclear modification factor (RpPb) in p+Pb collisions being close to unity at high pT values (pT > 8 GeV/c), and, hence, similar power-law tails (governed by similar values of parameter ) in p+p and p+Pb collisions at comparable c.m. collision energies. The significant increase in parameter in minimum bias p+Pb collisions at = 5.02 TeV as compared to that in minimum bias p+p collisions at =5.02 and 2.76 TeV in Table 2 is obviously due to the stronger radial flow and collective expansion in the larger (p+Pb) nuclear system than that in smaller p+p system. As seen from Table 2, the temperature parameter, T0, has proved to be significantly larger in minimum bias p+Pb collisions at = 5.02 TeV as compared to that in minimum bias p+p collisions at =5.02 and 2.76 TeV. This can be explained as follows. In p+Pb collisions, the incoming proton undergoes multiple scatterings with nucleons inside the lead nucleus. This "random walk" of impinging proton increases the transverse momentum of the partons (the Cronin effect), which results in a "harder" spectrum and a higher extracted temperature parameter in the final state as compared to p+p collisions at the same collision energy. The non-extensivity parameter q in minimum bias p+Pb collisions at = 5.02 TeV has proved to be significantly smaller than parameter q in minimum bias p+p collisions at =5.02 TeV. This is because in p+Pb collisions the larger system size and higher particle density lead to more frequent secondary collisions among the produced particles, which pushes the system closer to thermal equilibrium, resulting in a q value closer to 1. On the contrary, the p+p collision system is smaller and more dilute, meaning that the particles are more likely to escape without sufficient re-scattering to reach equilibrium, leading to a higher q value further away from 1.
The parameters extracted from minimum fits with two-component model (THMTF) function (Eq. (6)) of experimental midrapidity spectra of primary charged particles in different centrality classes of Xe+Xe collisions at =5.44 TeV and Pb+Pb collisions at =2.76 and 5.02 TeV for the fitted pT range from 0.5 to 15 GeV/c are presented in Table 3. It is necessary to mention that the corresponding parameter <βT> values in Table 3 have been fixed to those extracted earlier [21,36,37] from simultaneous minimum fits with thermodynamically consistent Tsallis function with transverse flow (Eq. (2)) of experimental midrapidity transverse momentum distributions of the charged pions and kaons, protons and antiprotons in corresponding centrality classes of Xe+Xe collisions at =5.44 TeV [21] and Pb+Pb collisions at =2.76 TeV [37], and Pb+Pb collisions at =5.02 TeV [36] in the fitted pT range up to 5 GeV/c. The parameter <βT> values have been fixed during minimum fit procedures because of the strong negative correlation between the parameters <βT> and T0 [21,36,37] of thermodynamically consistent Tsallis function with embedded transverse flow. The resulting fit curves with the THMTF function of experimental midrapidity spectra of primary charged particles in various centralities of Xe+Xe collisions at =5.44 TeV for the fitted pT range from 0.5 to 15 GeV/c are shown in Figure 2. The corresponding results for the fitted pT range from 0.5 to 50 GeV/c in various centralities of Xe+Xe collisions at =5.44 TeV are also demonstrated in Figure 2. The fit curves with the THMTF function of experimental midrapidity spectra of primary charged particles in various centralities of Pb+Pb collisions at =2.76 and 5.02 TeV for the fitted pT range from 0.5 to 15 GeV/c are given in Figure 3. As seen from Figure 2 (a) and Figure 2 (b), the THMTF function in Eq. (6) reproduces quite accurately the experimental midrapidity spectra of primary charged particles in various centralities of Xe+Xe collisions at =5.44 TeV in both fitted pT ranges: pT = 0.5−15 GeV/c and pT = 0.5−50 GeV/c. It is necessary to mention that the parameters of THMTF function remain practically the same, not changing within fit errors in all the analyzed centrality classes of Xe+Xe collisions at =5.44 TeV when the fitted pT range changes from [0.5−15] GeV/c to [0.5−50] GeV/c. As observed from Figure 3 (a) and Figure 3 (b), the THMTF function describes quite well the experimental midrapidity spectra of primary charged particles in various centralities of Pb+Pb collisions at =2.76 and 5.02 TeV in the fitted pT range from 0.5 to 15 GeV/c.
To consider the correlation between two sets of parameters x and y, in present work we calculate the Pearson linear correlation coefficient as follows:
where and are the average values of the parameters x and y. The Pearson correlation coefficient, , being a statistical measure of a linear correlation between two sets of data, changes from −1 to +1. The values = ±1 mean that the dependence between x and y is perfectly described by a linear equation, and all data points (xi, yi) are lying on a line in XY plane. The value = 0 implies an absence of a linear correlation between x and y. The positive and negative values of denote the positive and negative (linear) correlation, respectively, between x and y.
To evaluate the uncertainty in the values, we calculate the standard error of Pearson correlation coefficient as
The formula in Eq. (8) has been obtained from an assumption that the data are normally distributed and with the null hypothesis that there is a zero correlation between x and y. Pearson correlation coefficient, , and its corresponding standard error between various parameters of the THMTF function (Eq. (6)) extracted (see Table 3) in Xe+Xe collisions at =5.44 TeV and Pb+Pb collisions at =2.76 and 5.02 TeV in present work are given in Table 4.
The dependencies of the obtained parameters q, T0, P0, and n of two-component model (THMTF) function, given in Table 3, on the average number of participant nucleons () in Xe+Xe collisions at =5.44 TeV and Pb+Pb collisions at =2.76 and 5.02 TeV are illustrated in Figure 4. The corresponding dependencies of the same parameters, given in Table 3, on the average value of charged-particle multiplicity density () in the analyzed collisions are shown in Figure 5. As seen from Figure 4 (a) and Figure 5 (a), non-extensivity parameter q, decreases with an increase in and , that is with increasing collision centrality, in both Pb+Pb collisions at = 2.76 and 5.02 TeV. Parameter q for Xe+Xe collisions at =5.44 TeV also shows on the whole a decreasing trend with an increase in and values. This is further supported by the strong negative correlation observed between parameter q and <Npart> as well as between parameter q and <dNch/dη> in the analyzed collisions with Pearson correlation coefficient ~ −0.9, as seen in Table 4. This confirms quantitatively that non-extensivity parameter q decreases with increasing and (with an increase in collision centrality) in both Pb+Pb collisions at = 2.76 and 5.02 TeV. This demonstrates clear increase in degree of system thermalization with increasing centrality of Xe+Xe collisions at =5.44 TeV and Pb+Pb collisions at = 2.76 and 5.02 TeV at the LHC, which agrees with the similar result of previous works [21,36,37].
It is interesting to mention that the parameter q values in Figure 4 (a) coincide within uncertainties in Pb+Pb collisions at = 2.76 and 5.02 TeV in region > 109. As observed from Figure 4 (b), the kinetic freeze-out temperature parameter, T0, decreases drastically with an increase in up to = 109±8 ( = 71±7) values in Pb+Pb collisions at = 2.76 TeV (Pb+Pb collisions at = 5.02 TeV), then T0 parameter does not change, remaining constant within uncertainties, in region > 109 ( > 71). Parameter T0 decreases also drastically with an increase in up to = 68±5 values in Xe+Xe collisions at =5.44 TeV. It is interesting to mention that in the analyzed collisions the power-index parameter n shows the similar dependence on collision centrality, , in Figure 4 (d) as parameter T0 in Figure 4 (b). This is further supported by the strong positive linear correlation observed between parameters n and T0 (R(n, T0) ~ +0.95) in Table 4. Decreasing significantly with an increase in at low values, parameter n does not change, reaching a plateau within uncertainties starting from ≈ 109±8, ≈ 71±7, and ≈ 68±5 in Pb+Pb collisions at = 2.76 and 5.02 TeV, and in Xe+Xe collisions at =5.44 TeV, respectively. Parameter n reflects “hardness” of the spectrum and corresponding production mechanisms of high hadrons, being directly connected to the number of quarks (gluons) involved in initial hard scattering and in-medium energy loss (jet quenching) of produced high partons. Therefore, the observed dependencies of the parameter n in Figure 4 (d) coupled with similar T0 versus dependencies in Figure 4 (b) could indicate that ≈ 109±8, ≈ 71±7, and ≈ 68±5 are estimated border (threshold) values of collision centrality for crossover phase transition from the dense hadronic state to that of QGP in Pb+Pb collisions at = 2.76 and 5.02 TeV, and in Xe+Xe collisions at =5.44 TeV, respectively. These probable border (threshold) values of collision centrality for crossover phase transition estimated in present work have proved to be compatible with those estimated in Refs. [21,36,37] from combined (simultaneous) model analysis of the evolution of the experimental midrapidity transverse momentum distributions of the charged pions and kaons, protons and antiprotons with changing collision centrality in Pb+Pb collisions at = 2.76 and 5.02 TeV, and in Xe+Xe collisions at =5.44 TeV. The results for Pb+Pb collisions at = 2.76 and 5.02 TeV also agree well with those of recent work [41].
As observed from Figure 4 (c) and Figure 5 (c), momentum scale parameter, P0, of the inverse power-law component of THMTF function in Eq. (6) increases consistently with an increase in both and (with an increase in collision centrality) in Pb+Pb collisions at = 2.76 and 5.02 TeV, and in Xe+Xe collisions at =5.44 TeV. This is further supported by the strong positive correlation observed between parameter P0 and <Npart> as well as between parameter P0 and <dNch/dη> in the analyzed collisions with Pearson correlation coefficient > 0.9, as seen in Table 4. As seen from Figure 4 (c), parameter P0 demonstrates quite high rate of increase with in region up to ≈ 100 and then its rate of increase slows down significantly in region > 100. As can be seen from Table 4, parameter P0 and average transverse (radial) flow velocity, <βT>, demonstrate very strong positive linear correlation in all analyzed Xe+Xe and Pb+Pb collisions at the LHC with Pearson correlation coefficient ≈ +1. Parameter P0 values in Xe+Xe and Pb+Pb collisions at the LHC, given in Table 3, have proved to be significantly larger than P0 values in similar c.m. collision energies (per nucleon pair) in minimum bias proton-proton and minimum bias p+Pb collisions at the LHC, given in Table 2. This can serve as a signature of the strong radial flow in Xe+Xe and Pb+Pb collisions at the LHC, which pushes (boosts) particles to higher pT values and therefore shifts the transition point from “soft” to “hard” part of the spectrum towards larger values of pT as compared to proton-proton collisions. With an increase in centrality of Xe+Xe and Pb+Pb collisions at the LHC, the pressure gradient in the hot and dense overlap zone of the colliding nuclei increases significantly, resulting in the stronger collective flow in more central collisions. This could explain consistent increase of parameter P0 (similarly with <βT>) with an increase in both and (with an increase in collision centrality) observed in Pb+Pb collisions at = 2.76 and 5.02 TeV, and in Xe+Xe collisions at =5.44 TeV in Figure 4 (c) and Figure 5 (c). The values of P0 in Figure 4 (c) and Figure 5 (c) have proved to be very close to each other in Pb+Pb collisions at = 5.02 TeV and Xe+Xe collisions at =5.44 TeV at the same values of as well as . This is due to closeness of c.m. collision energies (per nucleon pair) and hence closeness of pressure gradients and corresponding energy densities of Xe+Xe and Pb+Pb collisions at the same as well as values. On the other hand, as seen from Figure 4 (c) and Figure 5 (c), values of P0 in Pb+Pb collisions at = 2.76 TeV have proved to be significantly smaller than P0 in Pb+Pb collisions at = 5.02 TeV and Xe+Xe collisions at =5.44 TeV at the same values of as well as . This is obviously due to the significantly smaller c.m. collision energy (per nucleon pair) of Pb+Pb collisions at = 2.76 TeV as compared to Pb+Pb collisions at = 5.02 TeV and Xe+Xe collisions at =5.44 TeV.
The power-index n, which describes “hardness” of pT spectrum and reflects high pT hadron production, also shows clear dependence on c.m. collision energy (per nucleon pair) in Figure 4 (d) and Figure 5 (d). The parameter n values have proved to be systematically and significantly larger in Pb+Pb collisions at = 2.76 TeV as compared to n values in Pb+Pb collisions at = 5.02 TeV and Xe+Xe collisions at =5.44 TeV at the same values of as well as . As collisions move from = 2.76 TeV to = 5.02 TeV or =5.44 TeV, the parameter n generally decreases, signifying a power-law exponent that produces harder spectra, consistent with higher effective temperatures, due to the harder initial parton scatterings, which produce larger number of high pT hadrons making high pT spectrum flatter at higher ( = 5.02 TeV or =5.44 TeV) collision energy as compared to the lower ( = 2.76 TeV) one. The values of parameter n in Figure 4 (d) and Figure 5 (d) have proved to be very close to each other in Pb+Pb collisions at = 5.02 TeV and Xe+Xe collisions at =5.44 TeV at the same values of as well as , which is due to closeness of c.m. collision energies (per nucleon pair) of Pb+Pb and Xe+Xe collisions. It is interesting to mention that the values of the parameter n extracted in minimum bias p+p collisions at =2.76 and 5.02 TeV (see Table 2) have coincided within uncertainties with the corresponding n values in most peripheral ((70-80)% centrality) Pb+Pb collisions at = 2.76 and 5.02 TeV (see Table 3), respectively. This is because only few participant nucleons at the edges of the nuclei actually collide in a peripheral collision. This makes the peripheral collision event with too small overlap volume as a collection of independent binary nucleon-nucleon collisions, where produced particles, including high pT partons, escape without significant loss of energy or flow as contrasted to central heavy-ion collisions with quite large and dense overlap zone resulting in significant medium effects (jet quenching and parton energy loss) and strong radial flow. Using model expression [62,75] for power-index n in high-energy collisions, , where is the number of partons participating in a scattering, we can estimate in the analyzed collisions. As can be seen from Table 2 and Table 3, the average value of is approximately 6 in the analyzed collision types. The value corresponds to the number of participant partons, =5. Considering that most of primary charged hadrons in the analyzed collisions at the LHC [19,25,74] are charged pions (~ 85%) and kaons (~ 10%), =5 corresponds to and (here g is the gluon and q − quark) gluon fragmentation reactions as the dominant mechanism for high pT hadron production in the analyzed p+p, p+Pb, Xe+Xe, and Pb+Pb collisions at the LHC. This result agrees with earlier result [76] stating that gluon fragmentation is the dominant mechanism for producing high pT mesons, particularly in the central rapidity region, in high-energy collisions at the LHC. This can be explained by that the gluons carry a higher color charge (3) as compared to that of quarks (4/3), making them more likely to radiate and fragment into a larger shower of particles. Besides it, the cross-sections for gluon-gluon () and quark-gluon () scatterings are significantly higher than that for quark-quark () scattering at a few TeV collision energy () range at the LHC.
4. Summary and Conclusions
To reproduce accurately the measured long ranges of the midrapidity transverse momentum distributions of charged particles at various centralities of high-energy heavy-ion collisions at the LHC, the two-component model function, which is the sum of thermodynamically consistent Tsallis function with embedded transverse flow and inverse power-law function (which is asymptotic of Hagedorn function at high pT values), has been proposed. The first and second terms of this two-component model function are assumed to describe the “soft” and “hard” components, respectively, of midrapidity transverse momentum distributions of hadrons in high-energy collisions. This two-component model function, called Tsallis-Hagedorn model with transverse flow (THMTF), has described quite well the experimental midrapidity transverse momentum spectra of primary charged particles in the whole range (up to 50 GeV/c), measured by ALICE Collaboration in minimum bias p+p collisions at =2.76 and 5.02 TeV [72], minimum bias p+Pb collisions at = 5.02 TeV [72], and nine collision centrality intervals of Xe+Xe collisions at =5.44 TeV [71] and Pb+Pb collisions at =2.76 and 5.02 TeV [72]. We have analyzed the dependencies of the extracted parameters of THMTF function on Xe+Xe and Pb+Pb collision centrality at the LHC, expressed by as well as , and c.m. collision energy (per nucleon pair). The midrapidity experimental pT spectra of primary charged hadrons produced in minimum bias proton-proton (at =2.76 and 5.02 TeV) and p+Pb (at = 5.02 TeV) collisions at the LHC, measured by ALICE collaboration, have been used as the reference data for a comparison.
The power-index has decreased and parameter slightly increased in minimum bias proton-proton collisions with an increase in center-of-mass collision energy, , from 2.76 to 5.02 TeV. Decrease of parameter could be explained by the hardening of pT spectrum due to more frequent high-momentum partonic scatterings at higher proton-proton collision energy (=5.02 TeV) with respect to lower collision energy (=2.76 TeV). The observed increase in momentum scale parameter, , with an increase in could reflect higher energy transfer (higher energy density) and multiple parton scatterings during the initial collision, leading to a higher average transverse momentum at =5.02 TeV as compared to that at =2.76 TeV.
The non-extensivity parameter q in minimum bias p+Pb collisions at = 5.02 TeV has proved to be significantly smaller than parameter q in minimum bias p+p collisions at =5.02 TeV, because the larger system size and higher particle density in p+Pb collisions lead to more frequent secondary collisions among the produced particles, which pushes the system closer to thermal equilibrium, resulting in a q value closer to 1.
Parameter q has shown a decreasing trend with an increase in and values, demonstrating clear increase in degree of system thermalization with increasing centrality of Xe+Xe collisions at =5.44 TeV and Pb+Pb collisions at = 2.76 and 5.02 TeV at the LHC, in agreement with the similar result of previous works. This has been further supported by the strong negative correlation observed between parameter q and <Npart> as well as between parameter q and <dNch/dη> in the analyzed collisions with corresponding Pearson correlation coefficient ~ −0.9.
Decreasing significantly with an increase in at low values, parameters T0 and n of the THMTF function have not changed, reaching a plateau within uncertainties starting from ≈ 109±8, ≈ 71±7, and ≈ 68±5 in Pb+Pb collisions at = 2.76 and 5.02 TeV, and in Xe+Xe collisions at =5.44 TeV, respectively. The analogous dependencies of the power-index n and kinetic freeze-out temperature parameter, T0 , have been further supported by the strong positive linear correlation observed between parameters n and T0 (R(n, T0) ~ +0.95).
Parameter n reflects “hardness” of the spectrum (and encompasses the corresponding production mechanisms of high hadrons), being directly related to the number of quarks (gluons) involved in initial hard scattering and in-medium energy loss (jet quenching) of produced high partons. Therefore, the observed dependencies of the parameter n coupled with analogous T0 versus dependencies could indicate that ≈ 109±8, ≈ 71±7, and ≈ 68±5 are estimated border values of collision centrality for probable crossover phase transition from the dense hadronic state to that of QGP in Pb+Pb collisions at = 2.76 and 5.02 TeV, and in Xe+Xe collisions at =5.44 TeV, respectively. These probable border (threshold) values of collision centrality for crossover phase transition estimated in present work have proved to be compatible with those evaluated recently in Refs. [21,36,37] from combined (simultaneous) model analysis of evolution of the experimental midrapidity transverse momentum distributions of the charged pions and kaons, protons and antiprotons with changing collision centrality in Pb+Pb collisions at = 2.76 and 5.02 TeV, and in Xe+Xe collisions at =5.44 TeV. The results for Pb+Pb collisions at = 2.76 and 5.02 TeV also agree well with those of recent work [41].
Momentum scale parameter, P0, of the inverse power-law component of THMTF function has increased consistently with an increase in both and in Pb+Pb collisions at = 2.76 and 5.02 TeV, and in Xe+Xe collisions at =5.44 TeV, which could likely be due to the higher pressure gradient in overlap zone and, hence, stronger radial flow developed in more central collisions. Parameter P0 has demonstrated quite high rate of increase with in region up to ≈ 100 and then its rate of increase has slowed down significantly in region > 100. Parameter P0 values in Xe+Xe and Pb+Pb collisions at the LHC have proved to be significantly larger than P0 values in similar c.m. collision energies (per nucleon pair) in minimum bias proton-proton and minimum bias p+Pb collisions at the LHC, which could serve as a signature of significantly stronger radial flow developed in Xe+Xe and Pb+Pb collisions as compared to p+Pb collisions at the LHC, which pushes (boosts) particles to higher pT values and therefore shifts the transition point from “soft” to “hard” part of the spectrum towards larger values of pT. Parameter P0 and average transverse (radial) flow velocity, <βT>, have demonstrated very strong positive linear correlation in analyzed Xe+Xe and Pb+Pb collisions at the LHC with Pearson correlation coefficient being R(<βT>, P0) ≈ +1.
Both P0 and n parameters of the inverse power-law component of THMTF function have shown clear dependencies in Xe+Xe and Pb+Pb collisions at the LHC. The P0 parameter has increased and parameter n decreased with an increase in . As collisions move from = 2.76 TeV to = 5.02 TeV or =5.44 TeV, the parameter n generally decreases because of the hardening of spectra, consistent with higher effective temperatures, due to the harder initial parton scatterings, which produce larger number of high pT hadrons at higher .
Using the average value of power-index ≈ 6 extracted in present work, we have estimated the average number of partons participating in a scattering, =5, in the analyzed collisions. Taking into account that most of primary charged hadrons in the analyzed collisions at the LHC are charged pions (~ 85%) and kaons (~ 10%), =5 matches well with and gluon fragmentation reactions as the dominant mechanism for high pT hadron production in the analyzed p+p, p+Pb, Xe+Xe, and Pb+Pb collisions at the LHC. This result agrees with earlier result that gluon fragmentation is the dominant mechanism for producing high pT mesons, particularly in the central rapidity region, in high-energy collisions at the LHC.
Acknowledgments
The work of PTI authors has been supported by the Agency of Innovative Development of the Ministry of Higher Education, Science and Innovations of Uzbekistan within the fundamental research Grant № F3-20200929146 on analysis of open data on heavy-ion collisions at the LHC. The work of F.-H.L. has been supported by the National Natural Science Foundation of China (Grant № 12147215) and the Shanxi Provincial Basic Research Program (Natural Science Foundation) under Grant № 202103021224036.
Data Availability Statement
The experimental data on transverse momentum distributions of primary charged particles in p+p, p+Pb, Pb+Pb, and Xe+Xe collisions at the LHC from Refs. [71,72], analyzed in present work, are available at [ https://www.hepdata.net/record/ins1657384 ] and at [ https://www.hepdata.net/record/ins1672790 ].
References
- Heinz, U. W.; Jacob, M. Evidence for a New State of Matter: An Assessment of the Results from the CERN Lead Beam Programme. arXiv [nucl-th]. arXiv:0002042.
- BRAHMS Collab., Quark–gluon plasma and color glass condensate at RHIC? The perspective from the BRAHMS experiment. Nucl. Phys. A 757 2005, 1.
- PHENIX Collab., Formation of dense partonic matter in relativistic nucleus–nucleus collisions at RHIC: Experimental evaluation by the PHENIX Collaboration. Nucl. Phys. A 2005, 757, 184. [CrossRef]
- Back, B.; Baker, M.; Ballintijn, M.; et al. The PHOBOS perspective on discoveries at RHIC. Nucl. Phys. A 757 2005, 28. [Google Scholar]
- STAR Collab., Experimental and theoretical challenges in the search for the quark–gluon plasma: The STAR Collaboration's critical assessment of the evidence from RHIC collisions. Nucl. Phys. A 757 2005, 102. [CrossRef]
- Shuryak, E. V. What RHIC experiments and theory tell us about properties of quark–gluon plasma? Nucl. Phys. A 750 2005, 64. [Google Scholar] [CrossRef]
- STAR Collab. Observation and studies of jet quenching in PbPb collisions at = 2.76 TeV. Phys. Rev. C 2011, 84, 024906. [CrossRef]
- Song, H.; et al. , 200 A GeV Au+Au Collisions Serve a Nearly Perfect Quark-Gluon Liquid. Phys. Rev. Lett. 2011, 106, 192301. [Google Scholar] [CrossRef] [PubMed]
- Rafelski, J. Melting hadrons, boiling quarks. Eur. Phys. J. A 2015, 51, 114. [Google Scholar] [CrossRef]
- STAR Collab., Bulk Properties of the Medium Produced in Relativistic Heavy-Ion Collisions from the Beam Energy Scan Program. Phys. Rev. C [nucl-ex]. 2017, arXiv:1701.0706596, 044904. [CrossRef]
- Braun-Munzinger, P.; Redlich, K.; Stachel, J. Particle production in heavy ion collisions. In Quark Gluon Plasma 3; Hwa, R.C., Wang, Xin-Nian, Eds.; World Scientific Publishing: Singapore, 2004. [Google Scholar]
- Andronic; P. Braun-Munzinger, J. Stachel, Hadron production in central nucleus-nucleus collisions at chemical freezeout. Nucl. Phys. A 772 nucl-th/0511071. 2006, 167. [Google Scholar]
- Becattini, F.; Manninen, J.; Gazdzicki, M. Energy and system size dependence of chemical freeze-out in relativistic nuclear collisions. Phys. Rev. C hep-ph/0511092. 2006, 73, 044905. [Google Scholar] [CrossRef]
- Andronic; P. Braun-Munzinger, J. Stachel, Thermal hadron production in relativistic nuclear collisions: The Hadron mass spectrum, the horn, and the QCD phase transition. Phys. Lett. B 2009, 673, 142. [Google Scholar] [CrossRef]
- Stachel, J.; Andronic, A.; Braun-Munzinger, P.; Redlich, K. Confronting LHC data with the statistical hadronization model. J. Phys. Conf. Ser. 2014, arXiv:1311.4662509, 012019. [Google Scholar] [CrossRef]
- Heinz, U.; Snellings, R. Ann. Rev. Part. Sci. 2013, 63, 123.
- Bylinkin, A.A.; et al. Predictions on the transverse momentum spectra for charged particle production at LHC-energies from a two-component model. Eur. Phys. J. C 2015, 75, 166. [Google Scholar]
- Grigoryan, S. A three component model for hadron pT spectra in pp and Pb-Pb collisions at the LHC. Eur. Phys. J. A 2021, 57, 328. [Google Scholar] [CrossRef]
- Collab, A.L.I.C.E. (B. Abelev et al.), Centrality dependence of π, K, and p production in Pb-Pb collisions at (snn)1/2=2.76 TeV. Phys. Rev. C 1303.0737 [hep-ex]. 2013, 88, 044910. [Google Scholar]
- Olimov, Khusniddin K.; Liu, Fu-Hu; Musaev, Kobil; Shodmonov, Maratbek. Multiplicity Dependencies of Midrapidity Transverse Momentum Distributions of Identified Charged Particles in Proton-Proton Collisions at (s)1/2 = 7 TeV at the LHC. Universe 2022, 8, 174. [Google Scholar] [CrossRef]
- Olimov, Kh. K.; et al. Study of midrapidity pt distributions of identified charged particles in Xe+Xe collisions at (snn)1/2=5.44 TeV using non-extensive Tsallis statistics with transverse flow. Mod. Phys. Lett. A 2022, 37, 2250095. [Google Scholar] [CrossRef]
- Olimov, Kh.K.; et al. Multiplicity dependencies of midrapidity transverse momentum spectra of identified charged particles in p+p collisions at (s)1/2=13 TeV at LHC. Int. J. Mod. Phys. A 2021, 36, 2150149. [Google Scholar] [CrossRef]
- Zhang, Q.; et al. An Energy Independent Scaling of Transverse Momentum Spectra of Direct (Prompt) Photons from Two-Body Processes in High-Energy Proton–Proton Collisions. Ann. Phys. 2022, 534, 2100567. [Google Scholar] [CrossRef]
- Schnedermann, E.; et al. Thermal phenomenology of hadrons from 200 A GeV S+S collisions. Phys. Rev. C 1993, 48, 2462. [Google Scholar] [CrossRef]
- ALICE Collab. Production of charged pions, kaons and (anti-)protons in Pb-Pb and inelastic pp collisions at=5.02 TeV. Phys. Rev. C 1910.07678v1 [nucl-ex]. 2020, 101, 044907.
- STAR Collab. Systematic measurements of identified particle spectra in pp, d+Au, and Au+Au collisions at the STAR detector. Phys. Rev. C 2009, 79, 034909. [Google Scholar]
- STAR Collab. Identified particle production, azimuthal anisotropy, and interferometry measurements in Au+Au collisions at=9.2 GeV. Phys. Rev. C 2010, 81, 024911.
- Tang, Z.B.; et al. , Spectra and radial flow in relativistic heavy ion collisions with Tsallis statistics in a blast-wave description. Phys. Rev. C 2009, 79, 051901. [Google Scholar] [CrossRef]
- Lao, H. L.; et al. Extracting kinetic freeze-out temperature and radial flow velocity from an improved Tsallis distribution. Eur. Phys. J. A 53 2017, 44. [Google Scholar] [CrossRef]
- Khandai, P. K.; et al. System size dependence of hadron pT spectra in p+p and Au+Au collisions at (snn)1/2= 200 GeV. J. Phys. G. 2014, 41, 025105. [Google Scholar] [CrossRef]
- Olimov, Kh.K.; et al. Combined analysis of midrapidity transverse momentum spectra of the charged pions and kaons, protons and antiprotons in p+p and Pb+Pb collisions at (snn)1/2= 2.76 and 5.02 TeV at the LHC. Mod. Phys. Lett. A 2020, 35, 2050237. [Google Scholar] [CrossRef]
- Olimov, Kh.K.; et al. Average transverse expansion velocities and global freeze-out temperatures in central Cu+Cu, Au+Au, and Pb+Pb collisions at high energies at RHIC and LHC. Mod. Phys. Lett. A 2020, 35, 2050115. [Google Scholar] [CrossRef]
- Zhang, X.; Liu, F.; Olimov, Kh.K. A systematic analysis of transverse momentum spectra of J/ψ mesons in high energy collisions. Int. J. Mod. Phys. E 2021, 30, 2150051. [Google Scholar] [CrossRef]
- Li, L.; Liu, F.; Olimov, Kh.K. Excitation Functions of Tsallis-Like Parameters in High-Energy Nucleus–Nucleus Collisions. Entropy 2021, 23, 478. [Google Scholar] [CrossRef] [PubMed]
- Qi-Wang; Liu, F.; Olimov, Kh.K. Initial-State Temperature of Light Meson Emission Source From Squared Momentum Transfer Spectra in High-Energy Collisions. Front. Phys. 2021, 9, 792039. [Google Scholar] [CrossRef]
- Olimov, Kh.K.; Liu, Fu-Hu; Fedosimova, A. I.; Lebedev, I.A.; Deppman, A.; Musaev, K.A.; Shodmonov, M.Z.; Tukhtaev, B.J. Analysis of Midrapidity pT Distributions of Identified Charged Particles in Pb + Pb Collisions at (snn)1/2 = 5.02 TeV Using Tsallis Distribution with Embedded Transverse Flow. Universe 2022, 8, 401. [Google Scholar] [CrossRef]
- 37. Khusniddin K. Olimov et al., Simultaneous Analysis of Midrapidity pT Spectra of Identified Particle Species in Pb + Pb Collisions at (snn)1/2 = 2.76 TeV Using Tsallis Distribution with Transverse Flow. Universe 2022, 8, 655. [CrossRef]
- Olimov, Khusniddin K.; Lebedev, Igor A.; Fedosimova, Anastasiya I.; Liu, Fu-Hu; Dmitriyeva, Elena; Musaev, Kobil A.; Olimov, Kosim; Yuldashev, Bekhzod S. Correlations among parameters of the Tsallis distribution and Hagedorn function with embedded transverse flow in proton–proton collisions at (s)1/2 = 7 and 13 TeV. Eur. Phys. J. Plus 2023, 138, 414. [Google Scholar] [CrossRef]
- Duan, Ting-Ting; et al. On extracting thermal parameters and scenario in high-energy collisions. Adv. High Energy Phys. 2025, 2025, 7766862. [Google Scholar] [CrossRef]
- Waqas, M.; et al. Multiplicity dependent behavior of thermodynamic parameters in proton-proton collisions at 13 TeV. Ann. Phys. 2025, 481, 170180. [Google Scholar] [CrossRef]
- Olimov, Khusniddin K.; et al. Centrality evolution of transverse momentum spectra of primary charged particles produced in high-energy Pb+Pb collisions at the LHC. Mod. Phys. Lett. A 2026, 41, 2650120. [Google Scholar] [CrossRef]
- Tsallis, C. Possible generalization of Boltzmann-Gibbs statistics. J. Stat. Phys. 1988, 52, 479. [Google Scholar] [CrossRef]
- Tsallis, C. Nonadditive entropy: The concept and its use. Eur. Phys. J. A 2009, 40, 257. [Google Scholar] [CrossRef]
- Tsallis, C.; et al. , The role of constraints within generalized nonextensive statistics. Phys. A 1998, 261, 534. [Google Scholar] [CrossRef]
- Cleymans, J.; Worku, D. The Tsallis distribution in proton–proton collisions at (snn)1/2= 0.9 TeV at the LHC. J. Phys. G. 2012, 39, 025006. [Google Scholar] [CrossRef]
- Cleymans, J.; et al. Systematic properties of the Tsallis Distribution: Energy Dependence of Parameters in High-Energy p-p Collisions. Phys. Lett. B 2013, 723, 351. [Google Scholar] [CrossRef]
- Cleymans, J.; et al. On the Use of the Tsallis Distribution at LHC Energies. J. Phys. Conf. Ser. 779 2017, 012079. [Google Scholar] [CrossRef]
- Sena; Deppman, A. Systematic analysis of pT -distributions in p+p collisions. Eur. Phys. J. A 49 2013, 17. [Google Scholar]
- Wong, C. Y.; Wilk, G. Tsallis Fits to pT Spectra for pp Collisions at LHC. Acta Phys. Pol. B 2012, 43, 2047. [Google Scholar]
- Zheng, H.; Zhu, Lilin. Comparing the Tsallis Distribution with and without Thermodynamical Description in p-p Collisions. Adv. High-Energy Phys. 2016, 2016, 9632126. [Google Scholar] [CrossRef]
- Biro, T. S.; et al. Non-extensive approach to quark matter. Eur. Phys. J. A 2009, 40, 325. [Google Scholar] [CrossRef]
- Biro, G.; et al. Mass hierarchy and energy scaling of the Tsallis – Pareto parameters in hadron productions at RHIC and LHC energies. EPJ Web Conf. 2018, 171, 14008. [Google Scholar] [CrossRef]
- Biro, G.; et al. Systematic Analysis of the Non-Extensive Statistical Approach in High-energy Particle Collisions-Experiment vs. Theory. Entropy 2017, 19, 88. [Google Scholar]
- Costa, Juliana O.; Aguiar, Isabelle; Barauna, Jadna L.; Megías, Eugenio; Deppman, Airton; da Silva, Tiago N.; Menezes, Débora P. Non-extensive statistics in Au-Au collisions. Phys. Lett. B 2024, 854, 138727. [Google Scholar] [CrossRef]
- STAR Collab. (B.I. Abelev et al.), Strange particle production in p+p collisions at (s)1/2=200 GeV. Phys. Rev. C 2007, 75, 064901.
- PHENIX Collab. (A. Adare et al.), Identified charged hadron production in p+p collisions at (s)1/2=200 and 62.4 GeV. Phys. Rev. C 2011, 83, 064903.
- PHENIX Collab. (A. Adare et al.), Measurement of neutral mesons in p+p collisions at (snn)1/2=200 GeV and scaling properties of hadron production. Phys. Rev. D. 2011, 83, 052004.
- ALICE Collab. (K. Aamodt et al.), Production of pions, kaons and protons in pp collisions at (s)1/2=900 GeV with ALICE at the LHC. Eur. Phys. J. C 2011, 71, 1655. [CrossRef]
- CMS Collab. (S. Chatrchyan et al.), Study of the inclusive production of charged pions, kaons, and protons in pp collisions at (s)1/2=0.9,2.76, and 7 TeV. Eur. Phys. J. C 2012, 72, 2164. [CrossRef]
- Baptista, Rafael P.; Rocha, Lucas Q.; Menezes, D.P.; Trevisan, Luis A.; Tsallis, Constantino; Deppman, Airton. Evidence of fractal structures in hadrons. Eur. Phys. J. A 2024, 60, 93. [Google Scholar] [CrossRef]
- Grigoryan, S. Using the Tsallis distribution for hadron spectra in pp collisions: Pions and quarkonia at (snn)1/2=5−13000 GeV. Phys. Rev. D. 2017, 95, 056021. [Google Scholar] [CrossRef]
- Khandai, P. K.; et al. Hadron spectra in p+p collisions at RHIC and LHC energies. Int. J. Mod. Phys. A 2013, 28, 1350066. [Google Scholar] [CrossRef]
- Olimov, Kh.K.; et al. Systematic analysis of midrapidity transverse momentum spectra of identified charged particles in p+p collisions at (snn)1/2=2.76, 5.02, and 7 TeV at the LHC. Int. J. Mod. Phys. A 2020, 35, 2050167. [Google Scholar] [CrossRef]
- Hagedorn, R. Multiplicities, pT Distributions and the Expected Hadron → Quark-Gluon Phase Transition. Riv. Nuovo Cim. 1983, 6(10), 1. [Google Scholar] [CrossRef]
- Saraswat, K.; et al. Transverse momentum spectra of hadrons in high energy pp and heavy ion collisions. J. Phys. Commun. 2018, 2, 035003. [Google Scholar] [CrossRef]
- Olimov, Kh.K.; et al. Combined analysis of midrapidity transverse momentum distributions of the charged pions and kaons, protons and antiprotons in p+Pb collisions at (snn)1/2=5.02 TeV at the LHC. Eur. Phys. J. Plus 2024, 139, 457. [Google Scholar] [CrossRef]
- Lao, Hai Ling; et al. Extracting kinetic freeze-out temperature and radial flow velocity from an improved Tsallis distribution. Eur. Phys. J. A 53 2017, 44. [Google Scholar] [CrossRef]
- Bhattacharyya, T.; et al. Radial flow in non-extensive thermodynamics and study of particle spectra at LHC in the limit of small (q − 1). Eur. Phys. J. A 52 2016, 30. [Google Scholar]
- Thakur, D.; et al. , Indication of a Differential Freeze-Out in Proton-Proton and Heavy-Ion Collisions at RHIC and LHC Energies. Adv. High-Energy Phys. 2016, 4149352. [Google Scholar]
- Jena, S.; Gupta, R. A unified formalism to study transverse momentum spectra in heavy-ion collision. Phys. Lett. B 2020, 807, 135551. [Google Scholar] [CrossRef]
- Collab, A.L.I.C.E. Transverse momentum spectra and nuclear modification factors of charged particles in Xe-Xe collisions at = 5.44 TeV. Phys. Lett. B 2019, 788, 166–179. [Google Scholar]
- ALICE Collaboration; Acharya, S.; et al. Transverse momentum spectra and nuclear modification factors of charged particles in pp, p-Pb and Pb-Pb collisions at the LHC. JHEP 2018 2018, 13. [Google Scholar]
- CERN Preprint ALICE-PUBLIC-2018-011; ALICE Collaboration, Centrality determination in heavy ion collisions. Available online: https://cds.cern.ch/record/2636623/files/centrality%20determination%20note.pdf.
- ALICE Collaboration, Production of pions, kaons, (anti-)protons and φ mesons in Xe–Xe collisions at = 5.44 TeV. Eur. Phys. J. C 81 2021, 584.
- Brodsky, S.J.; Pirner, H.J.; Raufeisen, J. Phys. Lett. B 637 2006, 58.
- Foka, P.; Janik, M.A. An overview of experimental results from ultra-relativistic heavy-ion collisions at the CERN LHC: hard probes. Rev. Phys. 2016, 1, 172–194. [Google Scholar] [CrossRef]
Figure 1.
(a) - Minimum fits (solid blue curves) with two-component model (THMTF) function (Eq. (6)) of experimental midrapidity spectra (symbols) of primary charged particles in minimum bias p+p collisions at =2.76 and 5.02 TeV and minimum bias p+Pb collisions at = 5.02 TeV for the fitted pT range from 0.5 to 15 GeV/c. (b) - The corresponding results for the fitted pT range from 0.5 to 50 GeV/c in minimum bias p+p collisions at =2.76 and 5.02 TeV. The vertical error bars are combined (added) systematic and statistical errors. The combined errors are of the order of symbol sizes or less.
Figure 1.
(a) - Minimum fits (solid blue curves) with two-component model (THMTF) function (Eq. (6)) of experimental midrapidity spectra (symbols) of primary charged particles in minimum bias p+p collisions at =2.76 and 5.02 TeV and minimum bias p+Pb collisions at = 5.02 TeV for the fitted pT range from 0.5 to 15 GeV/c. (b) - The corresponding results for the fitted pT range from 0.5 to 50 GeV/c in minimum bias p+p collisions at =2.76 and 5.02 TeV. The vertical error bars are combined (added) systematic and statistical errors. The combined errors are of the order of symbol sizes or less.
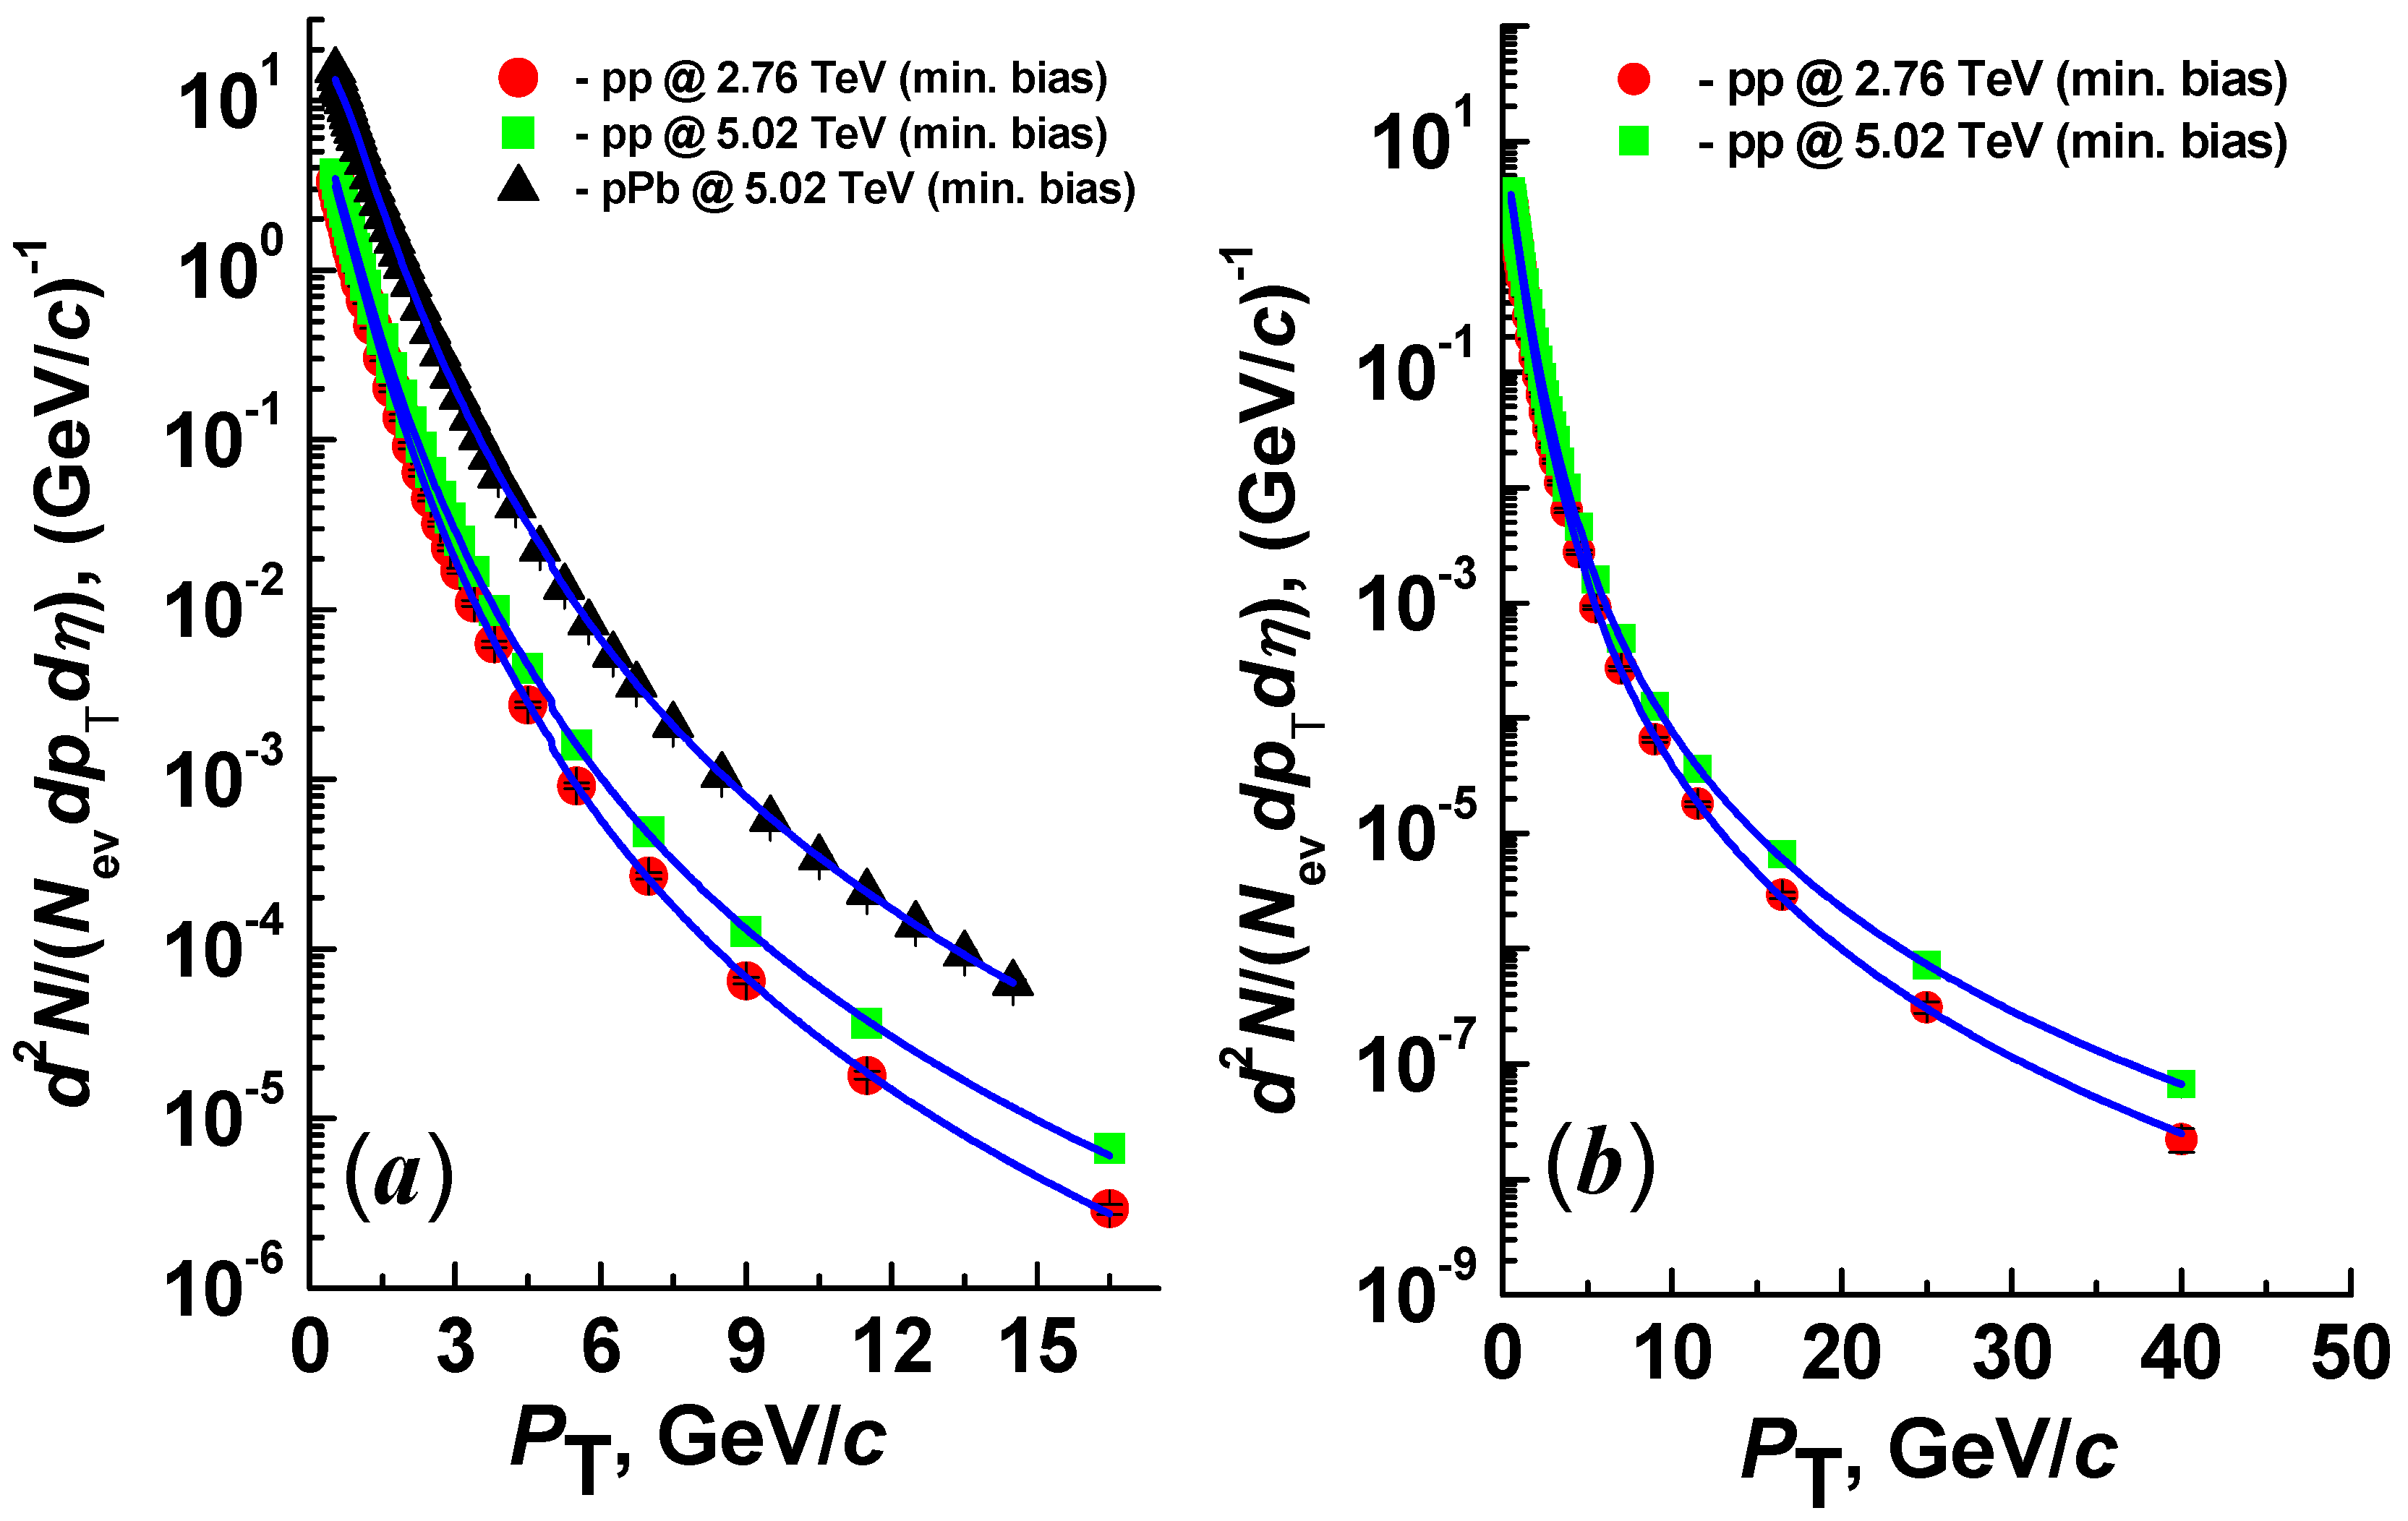
Figure 2.
(a) - Minimum fits (solid blue curves) with two-component model (THMTF) function (Eq. (6)) of experimental midrapidity spectra (symbols) of primary charged particles in various centralities of Xe+Xe collisions at =5.44 TeV for the fitted pT range from 0.5 to 15 GeV/c. (b) - The corresponding results for the fitted pT range from 0.5 to 50 GeV/c in various centralities of Xe+Xe collisions at =5.44 TeV. The vertical error bars are combined (added) systematic and statistical errors. The combined errors are of the order of symbol sizes or less. .
Figure 2.
(a) - Minimum fits (solid blue curves) with two-component model (THMTF) function (Eq. (6)) of experimental midrapidity spectra (symbols) of primary charged particles in various centralities of Xe+Xe collisions at =5.44 TeV for the fitted pT range from 0.5 to 15 GeV/c. (b) - The corresponding results for the fitted pT range from 0.5 to 50 GeV/c in various centralities of Xe+Xe collisions at =5.44 TeV. The vertical error bars are combined (added) systematic and statistical errors. The combined errors are of the order of symbol sizes or less. .
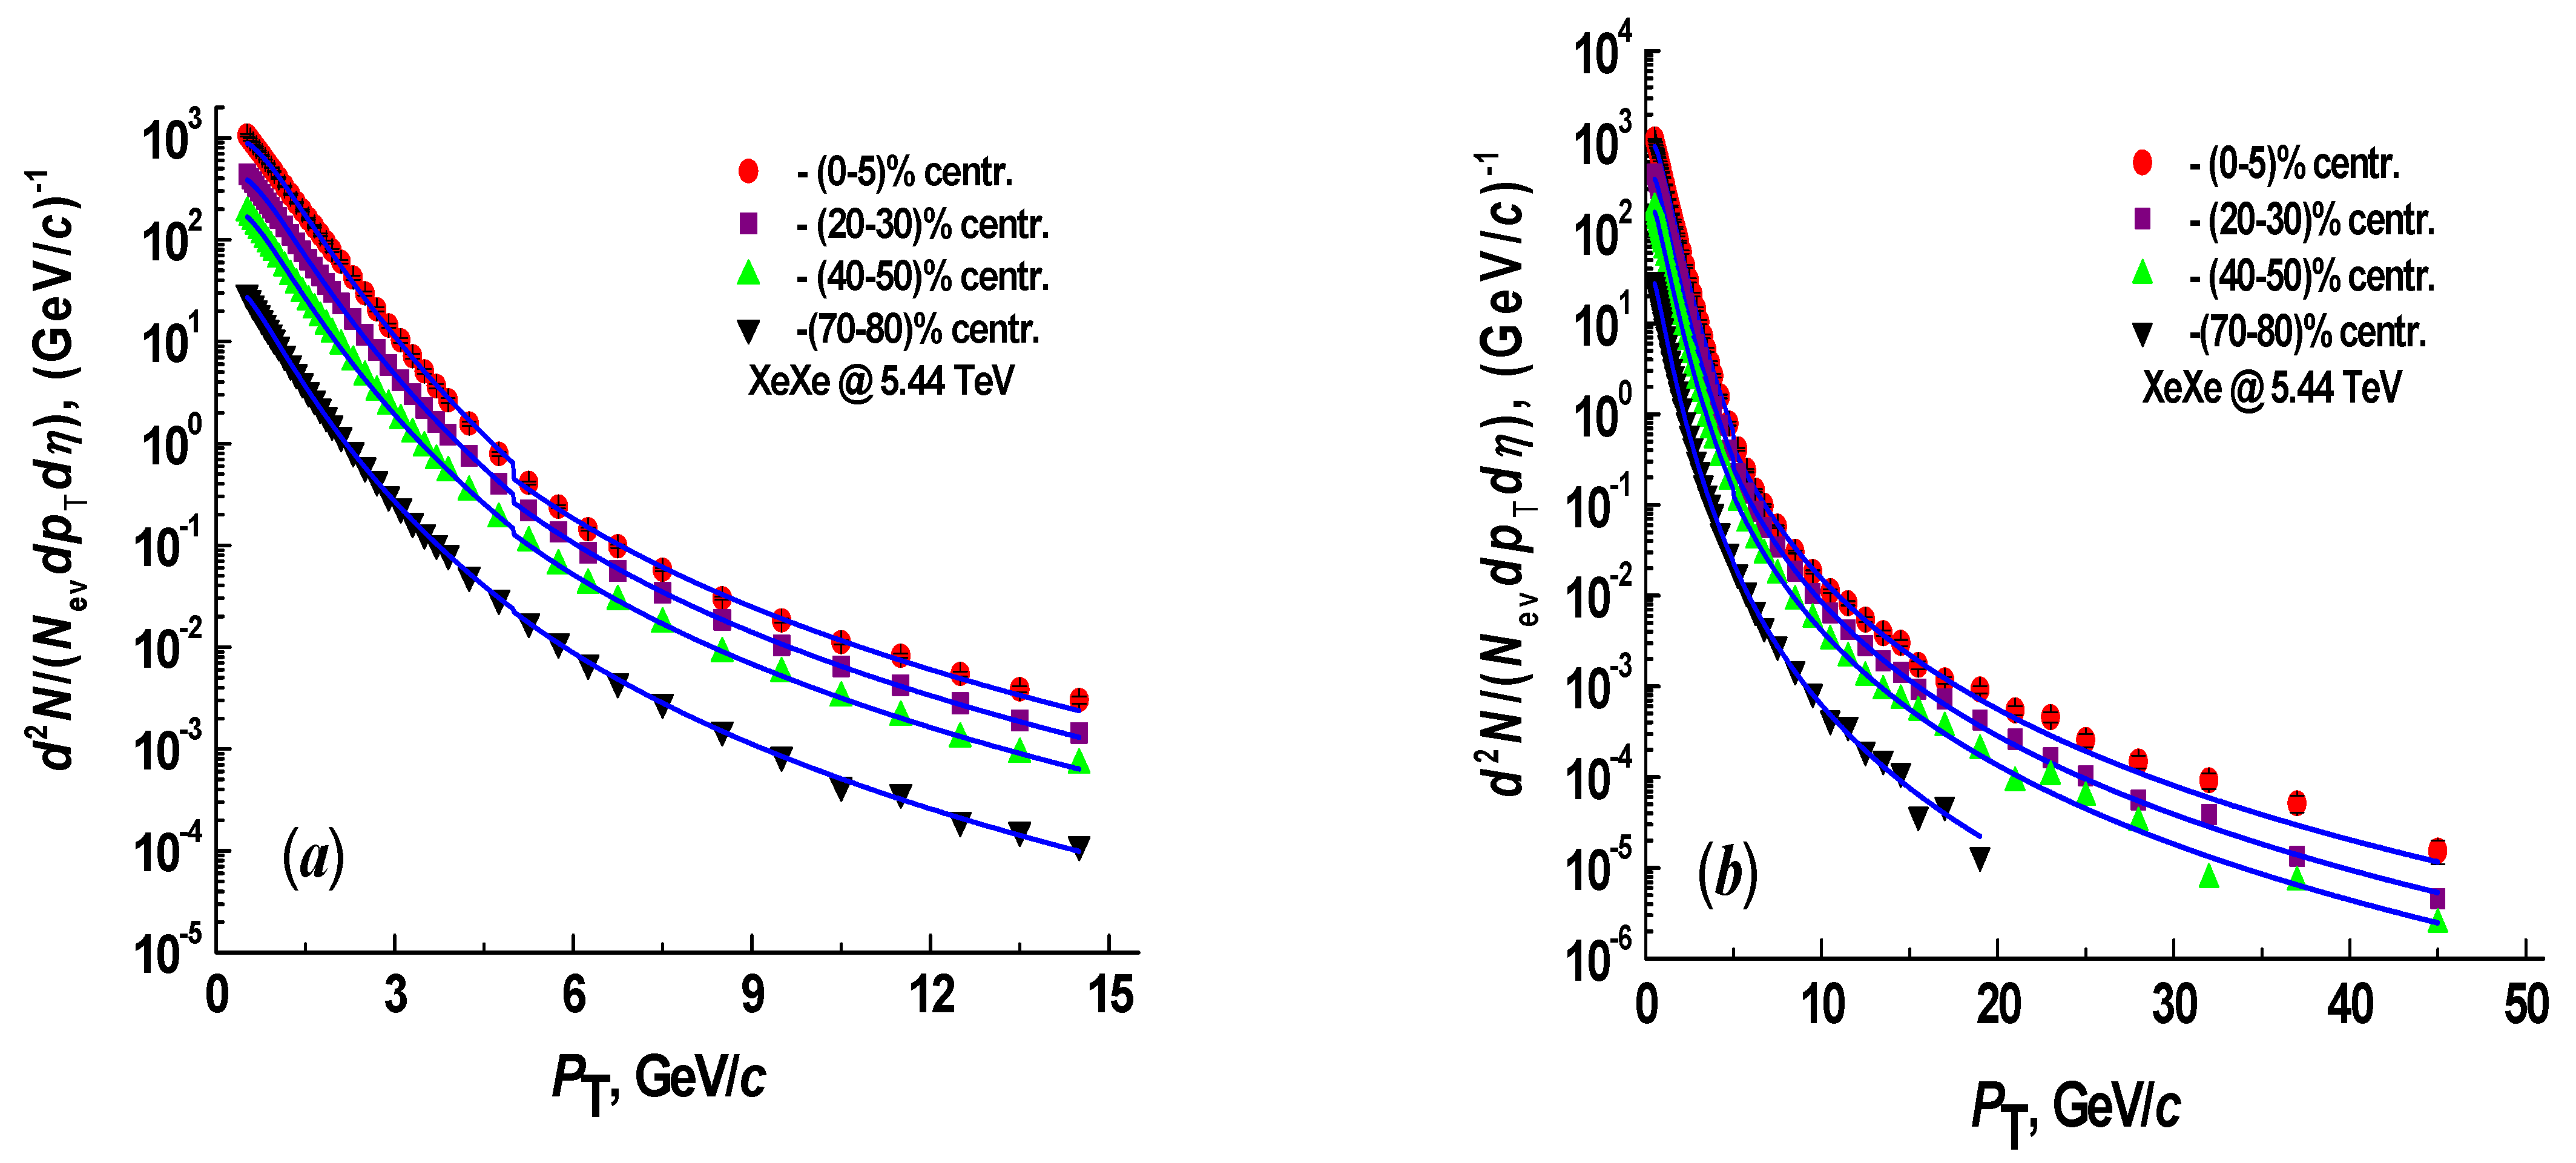
Figure 3.
(a) - Minimum fits (solid blue curves) with two-component model (THMTF) function (Eq. (6)) of experimental midrapidity spectra (symbols) of primary charged particles in various centralities of Pb+Pb collisions at =2.76 TeV for the fitted pT range from 0.5 to 15 GeV/c. (b) - The corresponding results for various centralities of Pb+Pb collisions at =5.02 TeV. The vertical error bars are combined (added) systematic and statistical errors. The combined errors are of the order of symbol sizes or less. .
Figure 3.
(a) - Minimum fits (solid blue curves) with two-component model (THMTF) function (Eq. (6)) of experimental midrapidity spectra (symbols) of primary charged particles in various centralities of Pb+Pb collisions at =2.76 TeV for the fitted pT range from 0.5 to 15 GeV/c. (b) - The corresponding results for various centralities of Pb+Pb collisions at =5.02 TeV. The vertical error bars are combined (added) systematic and statistical errors. The combined errors are of the order of symbol sizes or less. .
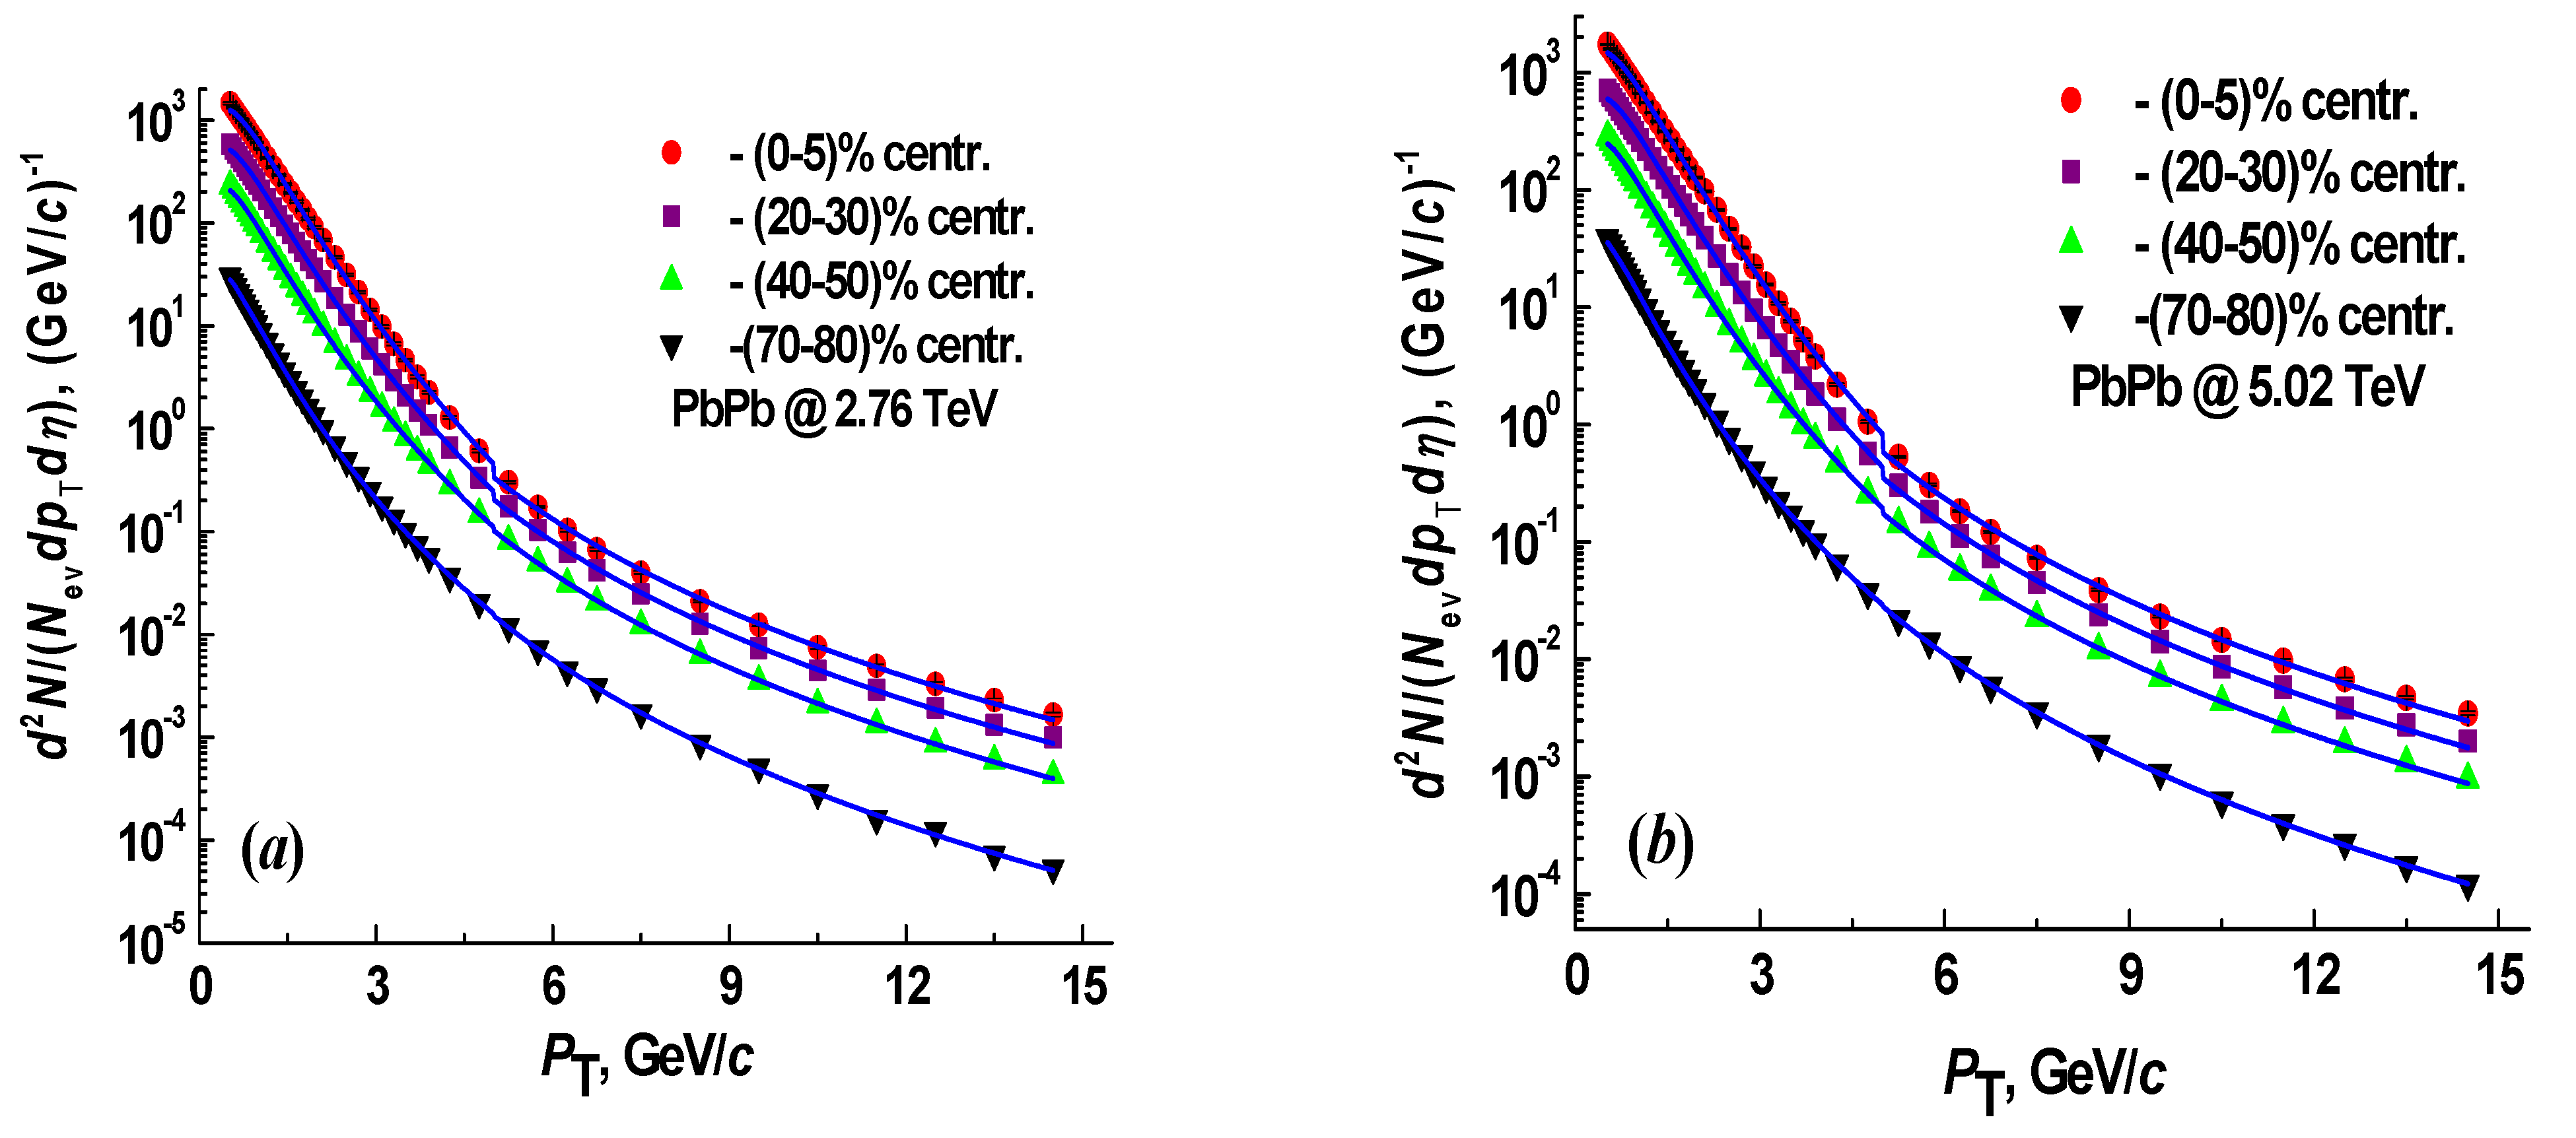
Figure 4.
The dependencies of the obtained parameters q (a), T0 (b), P0 (c), and n (d) of two-component model (THMTF) function (Eq. (6)), given in Table 3, on the average number of participant nucleons () in Xe+Xe collisions at =5.44 TeV and Pb+Pb collisions at =2.76 and 5.02 TeV. .
Figure 4.
The dependencies of the obtained parameters q (a), T0 (b), P0 (c), and n (d) of two-component model (THMTF) function (Eq. (6)), given in Table 3, on the average number of participant nucleons () in Xe+Xe collisions at =5.44 TeV and Pb+Pb collisions at =2.76 and 5.02 TeV. .
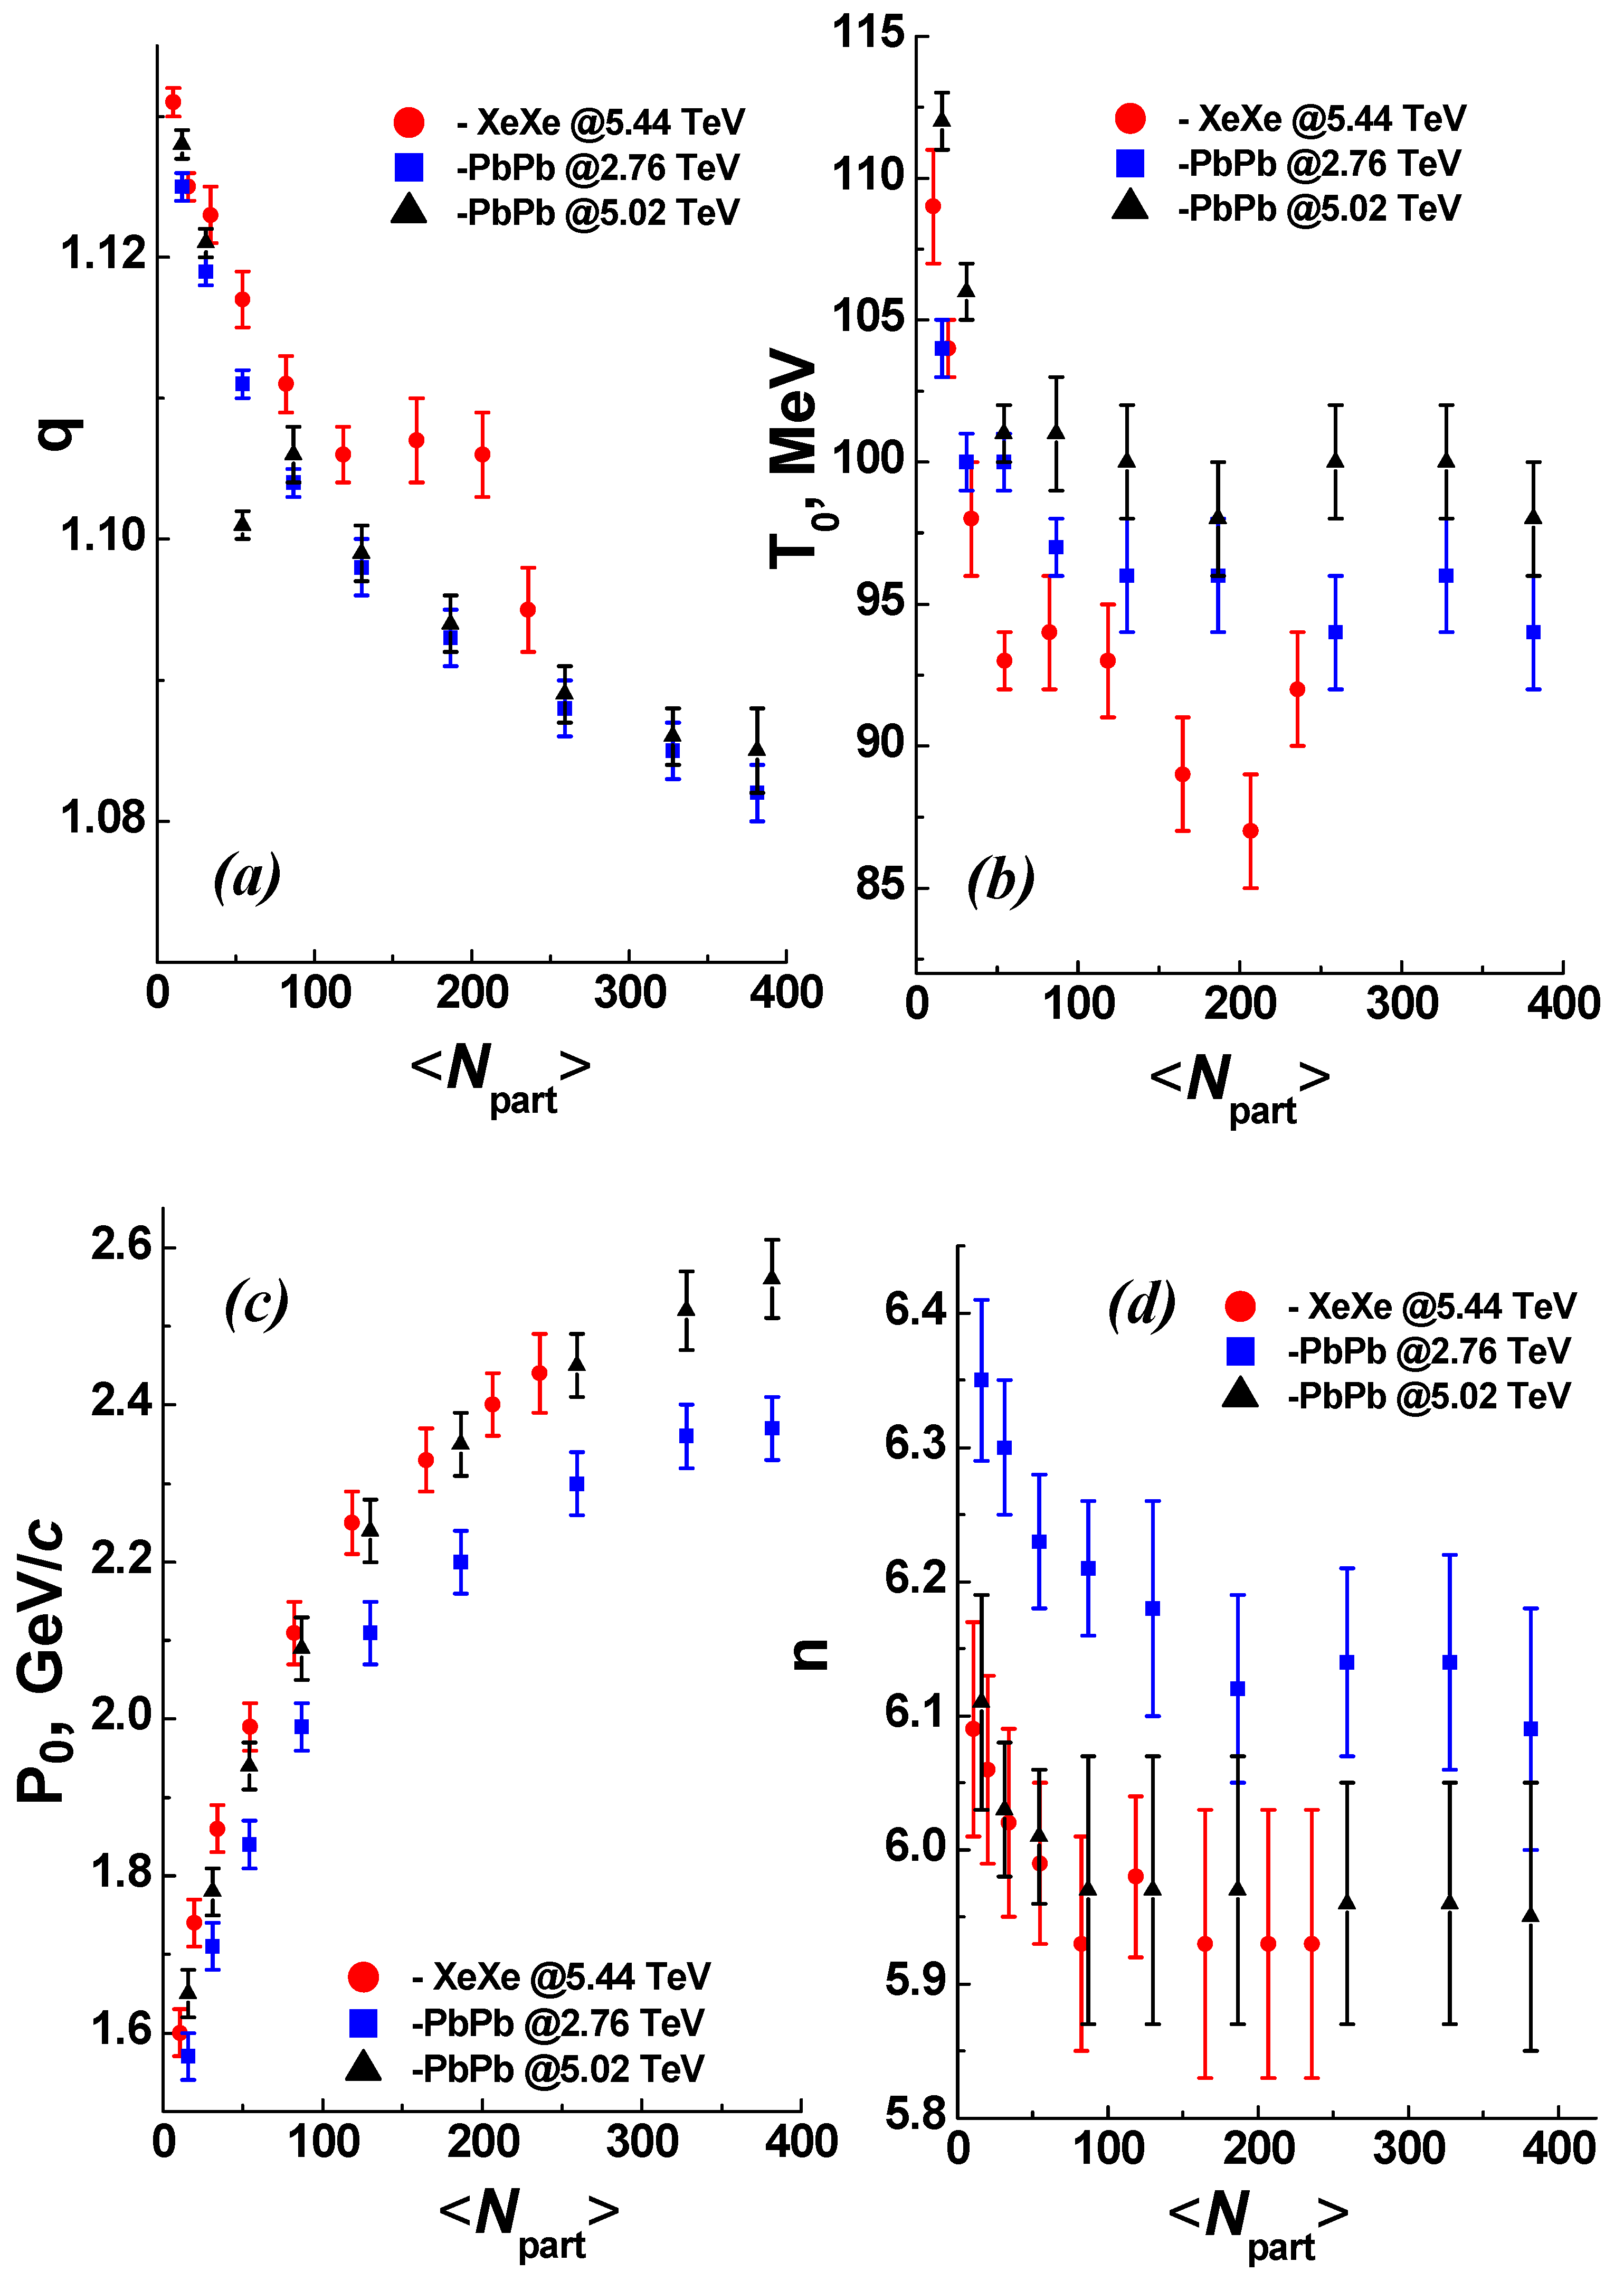
Figure 5.
The dependencies of the obtained parameters q (a), T0 (b), P0 (c), and n (d) of two-component model (THMTF) function (Eq. (6)), given in Table 3, on the average value of charged-particle multiplicity density () in Xe+Xe collisions at =5.44 TeV and Pb+Pb collisions at =2.76 and 5.02 TeV.
Figure 5.
The dependencies of the obtained parameters q (a), T0 (b), P0 (c), and n (d) of two-component model (THMTF) function (Eq. (6)), given in Table 3, on the average value of charged-particle multiplicity density () in Xe+Xe collisions at =5.44 TeV and Pb+Pb collisions at =2.76 and 5.02 TeV.
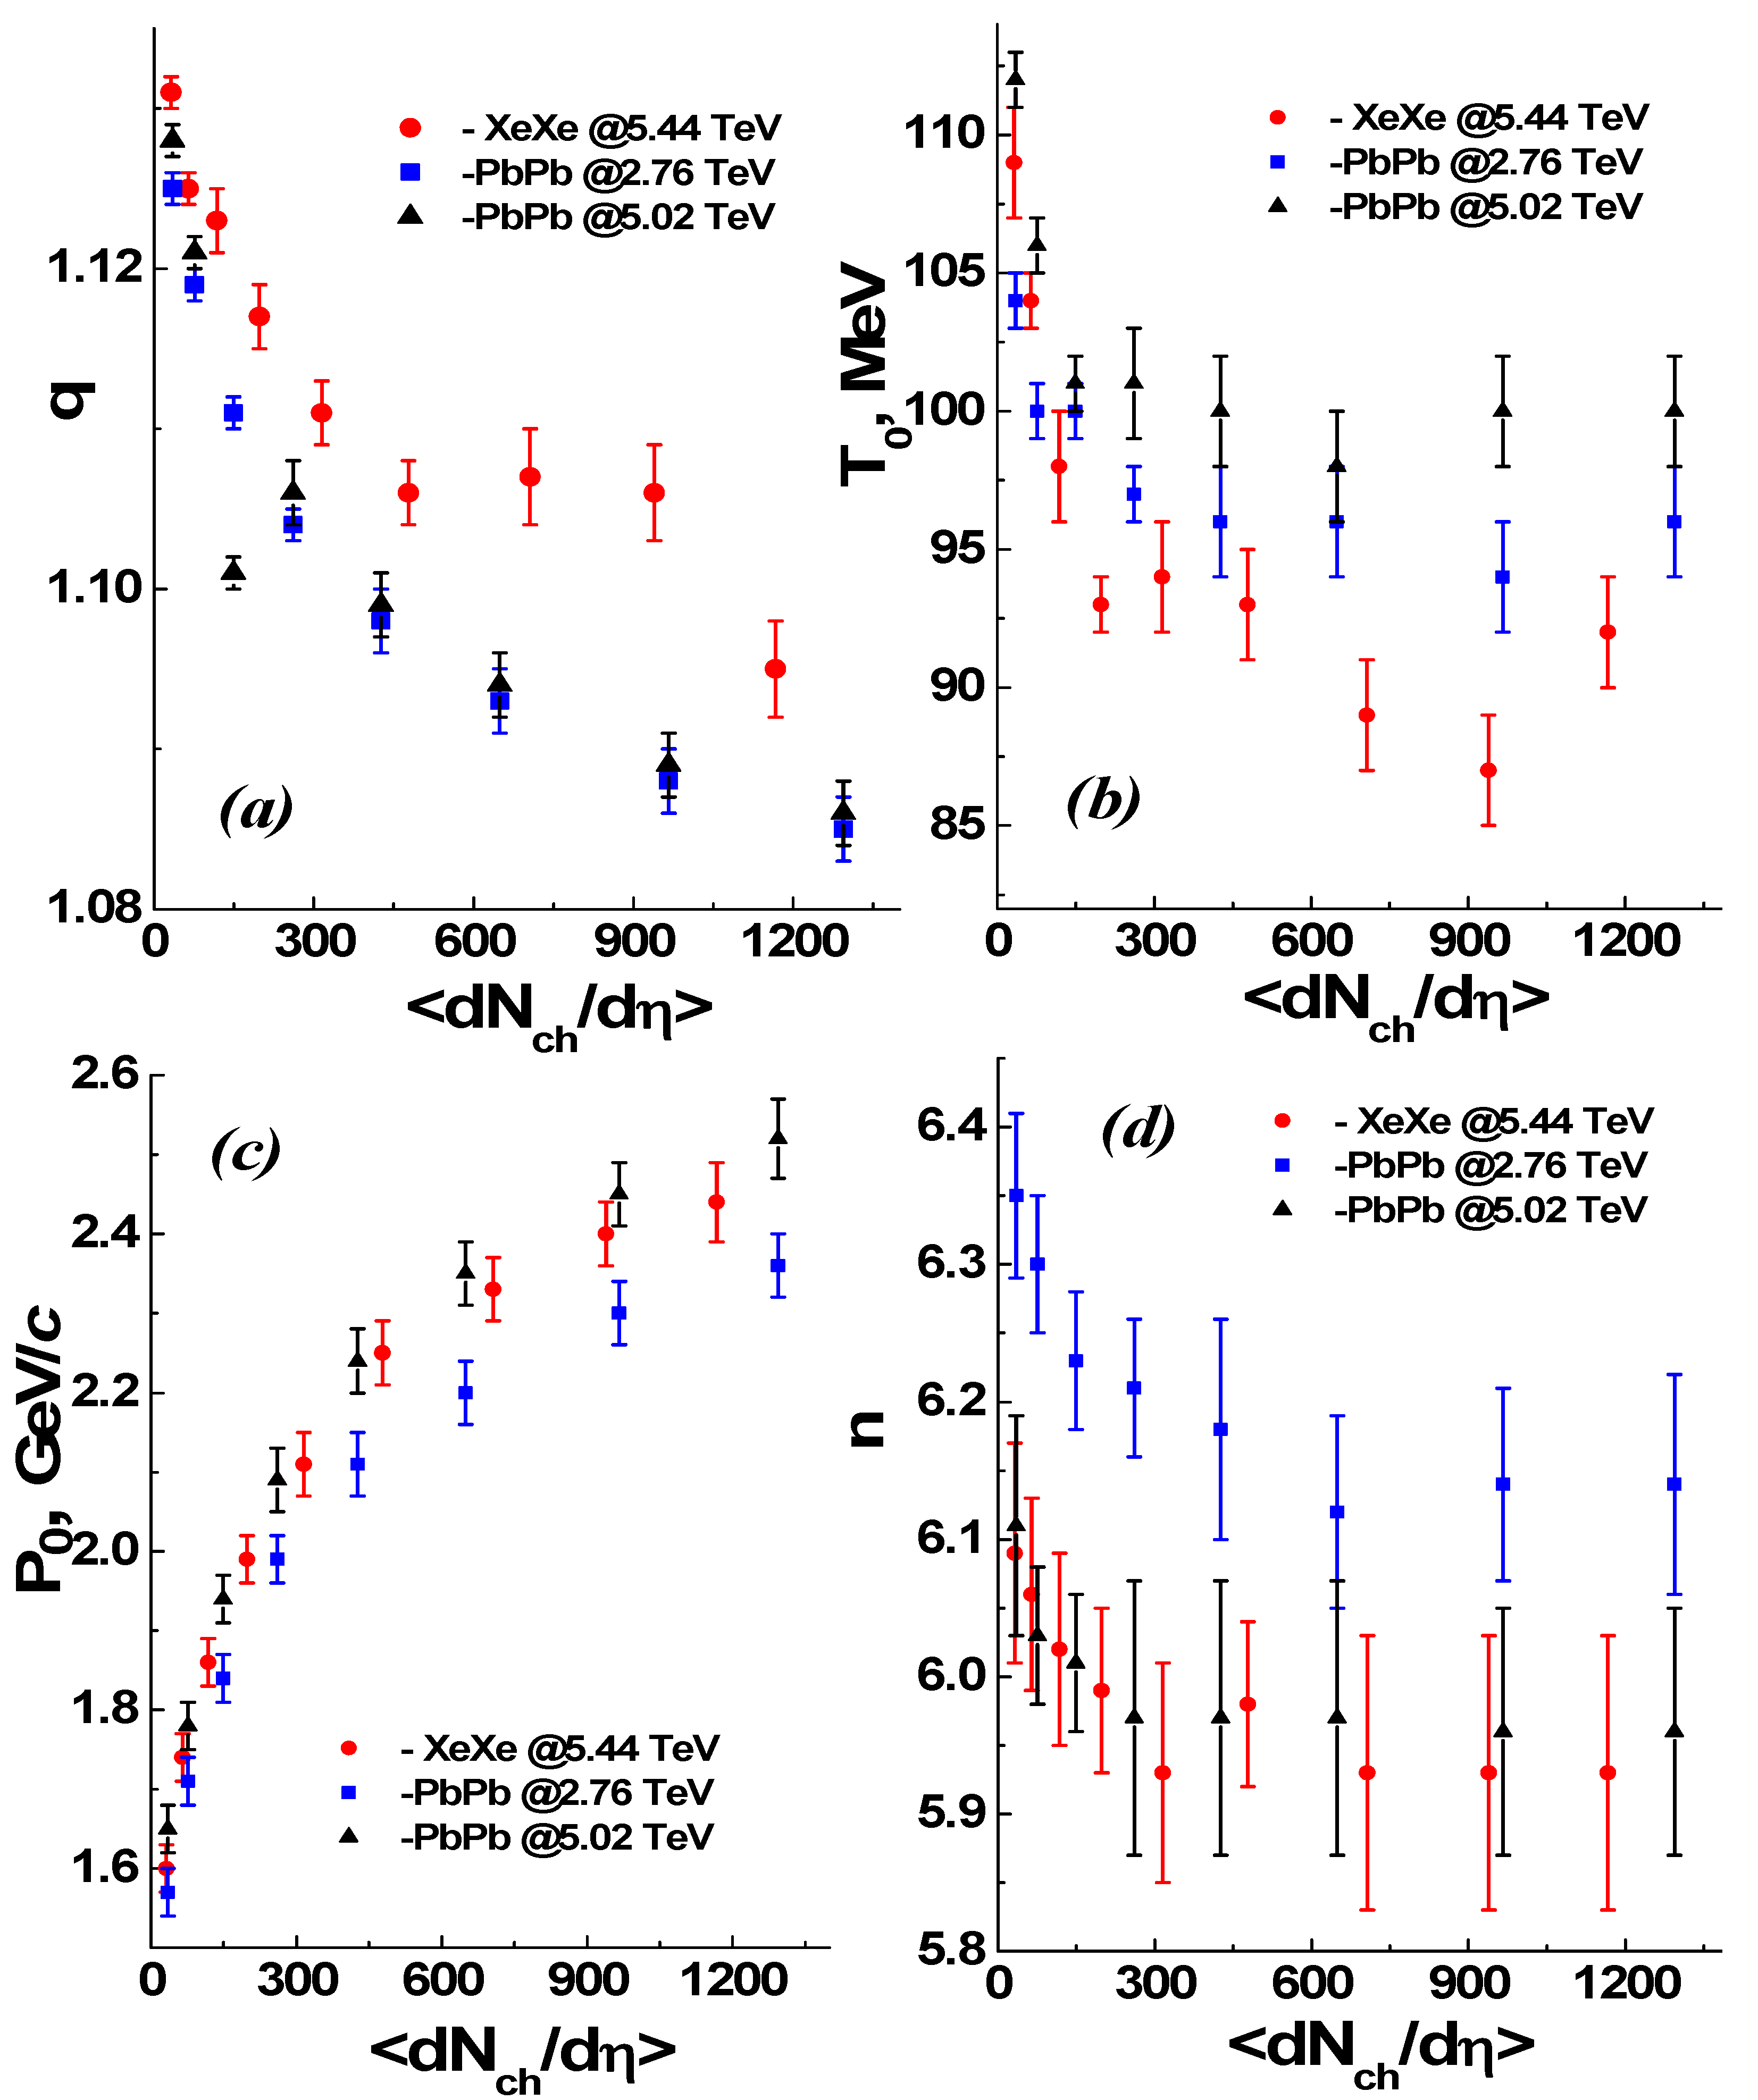

Table 1.
The average number of participant nucleons and mean charged-particle multiplicity densities [71,72,73] in the analyzed centrality classes of Xe+Xe collisions at =5.44 TeV and Pb+Pb collisions at =2.76 and 5.02 TeV.
| Centrality | Xe+Xe collisions at =5.44 TeV | Pb+Pb collisions at =2.76 TeV | Pb + Pb collisions at = 5.02 TeV | |||
| 0-5% | 236±2 | 1167±26 | 382±14 | 1601±60 | 383 ± 11 | 1943 ± 56 |
| 5-10% | 207±2 | 939±24 | 328±13 | 1294±49 | 331 ± 10 | 1587 ± 47 |
| 10-20% | 165±2 | 706±17 | 260±10 | 966±37 | 262 ± 7 | 1180 ± 31 |
| 20-30% | 118±3 | 478±11 | 187±7 | 649±23 | 188 ± 5 | 786 ± 20 |
| 30-40% | 82±3 | 315±8 | 130±5 | 426±15 | 131 ± 4 | 512 ± 15 |
| 40-50% | 55±3 | 198±5 | 87±3 | 261±9 | 87 ± 4 | 318 ± 12 |
| 50-60% | 34±2 | 118±3 | 54±2 | 149±6 | 54 ± 3 | 183 ± 8 |
| 60-70% | 20±2 | 65±2 | 31±2 | 76±4 | 31 ± 2 | 96 ± 6 |
| 70-80% | 11±1 | 32±1 | 16±2 | 35±2 | 16 ± 2 | 45 ± 3 |
Table 2.
The results obtained from minimum fits with two-component model (THMTF) function (Eq. (6)) of experimental midrapidity spectra of primary charged particles in minimum bias p+p collisions at =2.76 and 5.02 TeV and minimum bias p+Pb collisions at = 5.02 TeV for the fitted pT range from 0.5 to 15 GeV/c. The corresponding results are given also for the fitted pT range from 0.5 to 50 GeV/c in minimum bias p+p collisions at =2.76 and 5.02 TeV. n.d.f. denotes the number of degrees of freedom.
Table 2.
The results obtained from minimum fits with two-component model (THMTF) function (Eq. (6)) of experimental midrapidity spectra of primary charged particles in minimum bias p+p collisions at =2.76 and 5.02 TeV and minimum bias p+Pb collisions at = 5.02 TeV for the fitted pT range from 0.5 to 15 GeV/c. The corresponding results are given also for the fitted pT range from 0.5 to 50 GeV/c in minimum bias p+p collisions at =2.76 and 5.02 TeV. n.d.f. denotes the number of degrees of freedom.
| Fitted pT range: [0.5−15] GeV/c | ||||||
|---|---|---|---|---|---|---|
| Collision type | <βT> | q | T0, MeV | n | P0 (GeV/c) | χ2/n.d.f. (n.d.f.) |
| min. bias p+p @ 2.76 TeV | ~10-5 | 1.136±0.004 | 115±15 | 6.29±0.10 | 1.26±0.03 | 0.65 (23) |
| min. bias p+p @ 5.02 TeV | ~10-5 | 1.144±0.006 | 117±16 | 6.08±0.08 | 1.29±0.03 | 3.94 (23) |
| min. bias p+Pb @ 5.02 TeV | ~10-5 | 1.130±0.005 | 157±19 | 6.29±0.05 | 1.59±0.04 | 2.76 (37) |
| Fitted pT range: [0.5 −50] GeV/c | ||||||
| Collision type | <βT> | q | T0, MeV | n | P0 (GeV/c) | χ2/n.d.f. (n.d.f.) |
| min. bias p+p @ 2.76 TeV | ~10-5 | 1.136±0.004 | 115±23 | 6.30±0.11 | 1.26±0.04 | 0.61 (25) |
| min. bias p+p @ 5.02 TeV | ~10-5 | 1.144±0.005 | 117±28 | 6.08±0.06 | 1.30±0.04 | 3.62 (25) |
Table 3.
The results obtained from minimum fits with two-component model (THMTF) function (Eq. (6)) of experimental midrapidity spectra of primary charged particles in different centrality classes of Xe+Xe collisions at =5.44 TeV and Pb+Pb collisions at =2.76 and 5.02 TeV for the fitted pT range from 0.5 to 15 GeV/c.
Table 3.
The results obtained from minimum fits with two-component model (THMTF) function (Eq. (6)) of experimental midrapidity spectra of primary charged particles in different centrality classes of Xe+Xe collisions at =5.44 TeV and Pb+Pb collisions at =2.76 and 5.02 TeV for the fitted pT range from 0.5 to 15 GeV/c.
| Xe+Xe collisions at =5.44 TeV | ||||||
|---|---|---|---|---|---|---|
| Centrality |
<βT> (fixed [21]) |
q | T0, MeV | n | P0(GeV/c) |
χ2/n.d.f. (n.d.f.) |
| (0-5)% | 0.61 | 1.095±0.003 | 92±2 | 5.93±0.10 | 2.44±0.05 | 4.85 (38) |
| (5-10)% | 0.60 | 1.106±0.003 | 87±2 | 5.93±0.10 | 2.40±0.04 | 2.21 (38) |
| (10-20)% | 0.58 | 1.107±0.003 | 89±2 | 5.93±0.10 | 2.33±0.04 | 1.87 (38) |
| (20-30)% | 0.55 | 1.106±0.002 | 93±2 | 5.98±0.06 | 2.25±0.04 | 1.63 (38) |
| (30-40)% | 0.52 | 1.111±0.002 | 94±2 | 5.93±0.08 | 2.11±0.04 | 1.48 (38) |
| (40-50)% | 0.48 | 1.117±0.002 | 93±1 | 5.99±0.06 | 1.99±0.03 | 0.81 (38) |
| (50-60)% | 0.40 | 1.123±0.002 | 98±2 | 6.02±0.07 | 1.86±0.03 | 0.76 (38) |
| (60-70)% | 0.33 | 1.125±0.001 | 104±1 | 6.06±0.07 | 1.74±0.03 | 0.70 (38) |
| (70-80)% | 0.22 | 1.131±0.001 | 109±2 | 6.09±0.08 | 1.60±0.03 | 0.41 (38) |
| Pb+Pb collisions at=2.76 TeV | ||||||
| Centrality |
<βT> (fixed [37]) |
q | T0, MeV | n | P0(GeV/c) |
χ2/n.d.f. (n.d.f.) |
| (0-5)% | 0.60 | 1.082±0.002 | 94±2 | 6.09±0.09 | 2.37±0.04 | 5.72 (38) |
| (5-10)% | 0.58 | 1.085±0.002 | 96±2 | 6.14±0.08 | 2.36±0.04 | 5.03 (38) |
| (10-20)% | 0.58 | 1.088±0.002 | 94±2 | 6.14±0.07 | 2.30±0.04 | 4.55 (38) |
| (20-30)% | 0.55 | 1.093±0.002 | 96±2 | 6.12±0.07 | 2.20±0.04 | 3.33 (38) |
| (30-40)% | 0.52 | 1.098±0.002 | 96±2 | 6.18±0.08 | 2.11±0.04 | 2.44 (38) |
| (40-50)% | 0.47 | 1.104±0.001 | 97±1 | 6.21±0.05 | 1.99±0.03 | 1.57 (38) |
| (50-60)% | 0.40 | 1.111±0.001 | 100±1 | 6.23±0.05 | 1.84±0.03 | 1.32 (38) |
| (60-70)% | 0.33 | 1.119±0.001 | 100±1 | 6.30±0.05 | 1.71±0.03 | 0.92 (38) |
| (70-80)% | 0.24 | 1.125±0.001 | 104±1 | 6.35±0.06 | 1.57±0.03 | 0.92 (38) |
| Pb + Pb collisions at= 5.02 TeV | ||||||
| Centrality |
<βT> (fixed [36]) |
q | T0, MeV | n | P0(GeV/c) |
χ2/n.d.f. (n.d.f.) |
| (0-5)% | 0.60 | 1.085±0.003 | 98±2 | 5.95±0.10 | 2.56±0.05 | 13.16 (38) |
| (5-10)% | 0.59 | 1.086±0.002 | 100±2 | 5.96±0.09 | 2.52±0.05 | 11.41 (38) |
| (10-20)% | 0.58 | 1.089±0.002 | 100±2 | 5.96±0.09 | 2.45±0.04 | 11.31 (38) |
| (20-30)% | 0.57 | 1.094±0.002 | 98±2 | 5.97±0.10 | 2.35±0.04 | 8.77 (38) |
| (30-40)% | 0.53 | 1.099±0.002 | 100±2 | 5.97±0.10 | 2.24±0.04 | 7.84 (38) |
| (40-50)% | 0.49 | 1.106±0.002 | 101±2 | 5.97±0.10 | 2.09±0.04 | 5.80 (38) |
| (50-60)% | 0.43 | 1.101±0.001 | 101±1 | 6.01±0.05 | 1.94±0.03 | 3.88 (38) |
| (60-70)% | 0.33 | 1.121±0.001 | 106±1 | 6.03±0.05 | 1.78±0.03 | 2.92 (38) |
| (70-80)% | 0.22 | 1.128±0.001 | 112±1 | 6.11±0.08 | 1.65±0.03 | 2.40 (38) |
Table 4.
Pearson correlation coefficient, , and its corresponding standard error between various parameters of two-component model function (Eq. (6)) obtained (see Table 3) in present work in Xe+Xe collisions at =5.44 TeV and Pb+Pb collisions at =2.76 and 5.02 TeV.
Table 4.
Pearson correlation coefficient, , and its corresponding standard error between various parameters of two-component model function (Eq. (6)) obtained (see Table 3) in present work in Xe+Xe collisions at =5.44 TeV and Pb+Pb collisions at =2.76 and 5.02 TeV.
| Collision type | Xe+Xe collisions at =5.44 TeV | Pb+Pb collisions at =2.76 TeV | Pb + Pb collisions at = 5.02 TeV |
|---|---|---|---|
| R(<βT>, T0) | −0.96±0.10 | −0.97±0.09 | −0.95±0.12 |
| R(<βT>, P0) | +0.98±0.08 | +0.99±0.06 | +0.97±0.10 |
| R(<βT>, n) | −0.96±0.11 | −0.98±0.07 | −0.97±0.10 |
| R(q, T0) | +0.84±0.21 | +0.94±0.13 | +0.91±0.16 |
| R(q, P0) | −0.97±0.09 | −0.99±0.02 | −0.96±0.10 |
| R(q, <βT>) | −0.95±0.12 | −0.98±0.07 | −0.97±0.10 |
| R(q, n) | +0.90±0.17 | +0.97±0.09 | +0.90±0.17 |
| R(q, <Npart>) | −0.93±0.14 | −0.94±0.13 | −0.88±0.18 |
| R(q, <dNch/dη>) | −0.92±0.15 | −0.91±0.15 | −0.85±0.20 |
| R(P0, T0) | −0.92±0.15 | −0.95±0.12 | −0.85±0.20 |
| R(P0, n) | −0.93±0.14 | −0.97±0.09 | −0.89±0.17 |
| R(P0, <Npart>) | +0.95±0.12 | +0.93±0.14 | +0.94±0.13 |
| R(P0, <dNch/dη>) | +0.92±0.15 | +0.90±0.17 | +0.91±0.16 |
| R(n, T0) | +0.93±0.14 | +0.94±0.13 | +0.96±0.11 |
| R(n, <Npart>) | −0.83±0.21 | −0.87±0.19 | −0.73±0.26 |
| R(n, <dNch/dη>) | −0.79±0.23 | −0.84±0.20 | −0.69±0.27 |
Disclaimer/Publisher’s Note: The statements, opinions and data contained in all publications are solely those of the individual author(s) and contributor(s) and not of MDPI and/or the editor(s). MDPI and/or the editor(s) disclaim responsibility for any injury to people or property resulting from any ideas, methods, instructions or products referred to in the content. |
© 2026 by the authors. Licensee MDPI, Basel, Switzerland. This article is an open access article distributed under the terms and conditions of the Creative Commons Attribution (CC BY) license (http://creativecommons.org/licenses/by/4.0/).
Copyright: This open access article is published under a Creative Commons CC BY 4.0 license, which permit the free download, distribution, and reuse, provided that the author and preprint are cited in any reuse.


