Preprint
Article

This version is not peer-reviewed.

Customized SNP Panel for Local Brazilian Sheep Breed Assignment

Submitted:

23 July 2026

Posted:

24 July 2026

You are already at the latest version

Abstract

Background/Objectives: Brazilian locally adapted sheep breeds represent valuable genetic resources. However, market appreciation of these breeds depends on genetic certification that ensures traceability, thereby qualifying their products as originating from sustainable production models. This study aimed to identify and evaluate the minimum set of highly informative SNPs for accurate and efficient breed assignment across five Brazilian sheep breeds. Methods: A total of 677 animal samples were used, the SNPs were selected from the Embrapa Multispecies 65K Illumina Infinium 1 chip, which contains 2,926 markers for Ovis aries. The dataset was randomly partitioned into training (80%) and testing (20%) sets. Markers were prioritized based on genetic differentiation using Pairwise Wright's fixation index (FST), implemented in the Toolbox for Ranking and Evaluation of SNPs (TRES), generating three nested reduced panels of 288, 192, and 96 SNPs. Finally, panel performance and preservation of population structure were evaluated using Random Forest classification, Principal Component Analysis (PCA), and ADMIXTURE. Results: The 96-SNP panel maintained high classification accuracy, comparable to larger subsets. This indicates that targeted marker selection is more effective than simply increasing marker density for breed assignment. Conclusions: While the development and analytical validation of a dedicated low-density genotyping assay remain necessary before routine implementation, the 96-SNP panel identified here provides a solid foundation for an efficient, cost-effective genomic tool. This panel will support breed certification, traceability, and the conservation of Brazilian locally adapted sheep genetic resources.

Keywords: 
;  ;  ;  ;  

1. Introduction

Sheep represent one of the most genetically diverse livestock species, comprising a large number of breeds shaped by a long history of migrations, selection and environmental adaptation [1,2]. In Brazil, indigenous hair sheep, such as Brazilian Somali, Morada Nova, and Santa Inês are mostly reared in the harsh environments of the country’s semi-arid Northeast and are characterized by a diverse genetic composition [3]. In southern Brazil, sheep production is mainly composed of wool breeds, including the autochthonous Crioula, and the Pantaneiro genetic group, which is predominantly distributed in the Pantanal wetlands, reflecting adaptation to distinct biomes [4,5].
These sheep constitute important genetic resources, especially for smallholder farmers from the Northeast and South, contributing to the production of milk, meat, leather, and wool [6,7]. However, these locally adapted breeds are increasingly threatened by indiscriminate crossbreeding and population admixture aimed at introducing traits from highly productive commercial sheep [8,9,10]. Therefore, accurate breed assignment is essential for implementing conservation strategies and traceability systems that can effectively support the preservation of these genetic resources.
Traditional traceability approaches based on pedigree records and phenotypic characterization are often unreliable in locally managed or smallholder production systems, where systematic recording is limited or absent [11,12]. In this context, genomic markers, such as single nucleotide polymorphisms (SNPs), have emerged as a solution for accurate breed assignment in domesticated animal populations [13,14,15,16,17,18,19,20,21,22]. Although high-density SNP arrays are widely used for these purposes, their high cost and intensive computational requirements restrict routine application in large-scale monitoring, particularly in developing countries [23].
To address these limitations, reduced SNP panels composed of ancestry-informative markers (AIMs) have been developed as cost-effective alternatives for breed assignment across livestock species [24,25,26,27]. However, while global efforts have advanced sheep genomic traceability and characterization using minimal markers sets [21,28,29,30], most studies focused on commercial or exotic breeds, leading to the underrepresentation of Neotropical sheep populations. This highlights a critical gap, as Brazilian sheep presents complex demographic histories driven by admixture, drift, and selection [3], as well as documented breed-specific variation in loci controlling traits such as prolificacy and coat color, highlighting their distinct genetic architecture relative to commercial European breeds [31]. Collectively, these findings underscore the need for a cost-effective and efficient SNP panel tailored to capture breed-specific genomic structure of Brazilian locally adapted breeds.
In Brazil, the recently developed EMBRAPA Multispecies 65K Illumina Infinium 1 chip, comprising 66,413 SNPs across 27 plant and animal species, has demonstrated robust genotyping performance in both crop and livestock species [32,33,34]. This high-density genomic tool tailored for Brazilian genetic resources provides an important foundation for identifying highly informative markers in indigenous sheep breeds. These markers can subsequently be assembled into reduced SNP panels for targeted applications, such as population assignment. This study aimed to identify and empirically evaluate the minimum set of highly informative SNPs required for accurate and efficient breed assignment in Brazilian locally adapted sheep, leveraging the EMBRAPA Multispecies 65K Illumina Infinium 1 chip.

2. Materials and Methods

2.1. Biological Samples

DNA was extracted from 677 whole-blood samples (preserved in EDTA) obtained directly from the Banco de DNA e Tecidos Animais biobank at Embrapa Recursos Genéticos e Biotecnologia (Embrapa Genetic Resources and Biotechnology). Because this study relied exclusively on existing biobank specimens and involved no live animal handling or primary tissue collection by the authors, formal ethical approval from an institutional animal care and use committee was not required. The dataset comprised individuals from the five principal locally adapted sheep breeds in Brazil. For marker selection and model development, samples were partitioned into independent training and testing datasets, while maintaining comparable breed proportions across both subsets (Table 1).
Genomic DNA was extracted using the Gentra Puregene Blood Kit (Qiagen, Germantown, MD, USA; https://www.qiagen.com/us; accessed on 27 April 2026), following the manufacturer's instructions. DNA quality and concentration were assessed by electrophoresis on a 1% agarose gel stained with ethidium bromide using lambda DNA standards (50, 100, and 200 ng/µL), and by spectrophotometric analysis (NanoDrop™ 8000, Thermo Fisher Scientific, Waltham, MA, USA; https://www.thermofisher.com/; accessed on 27 April 2026).

2.2. Genotyping and Quality Control (QC)

All samples used in this study were genotyped using the EMBRAPA Multispecies 65K Illumina Infinium 1 chip, by Neogen/Geneseek (Lincoln, NE, USA) (https://www.neogen.com/; accessed on 27 April 2026). This genomic tool was developed from OvineSNP50 Genotyping BeadChip (Illumina Inc., San Diego, CA, USA, https://support.illumina.com/array/array_kits/ovinesnp50_dna_analysis_kit.html/; accessed on 27 April 2026), which identified 2,926 SNPs, distributed across the 26 ovine autosomal chromosomes anchored in the sheep reference genome assembly ARS UI_Ramb_v3.0 (Ovis aries; NCBI RefSeq accession GCF_016772045.2). Genotype calling was performed using GenomeStudio 2.0 (Illumina Inc., San Diego, CA, USA, https://www.illumina.com/; accessed on 27 April 2026), following standard quality control procedures, and alleles were exported in the top format (A, C, G, T).
Quality control of the genotype data was performed using PLINK v1.9 [35]. Only autosomal SNPs were used, and the markers were filtered using the following criteria: call rate ≥ 95%, minor allele frequency (MAF) ≥ 0.05, and linkage disequilibrium (LD) pruning. Pairwise LD was estimated using the r² statistic implemented in PLINK, and pruning was performed using a sliding-window approach (50 SNP window, 5-SNP step size) with an r² threshold of 0.20.

2.3. SNP Selection

After QC, individuals from each breed were allocated to independent training (n = 566) and testing (n = 111) datasets, corresponding to approximately 80% and 20% of the total dataset, respectively (Table 1). SNP selection was performed exclusively using the training dataset, whereas the independent test dataset was reserved for subsequent empirical performance evaluation of the reduced panels. To identify ancestry-informative markers (AIMs) for breed assignment, candidate SNPs from the full reference baseline were evaluated using pairwise Wright's fixation index ( F S T ) as implemented in the Java-based Toolbox for Ranking and Evaluation of SNPs (TRES) [36]. SNP selection was performed exclusively using the training dataset, leaving the independent testing dataset reserved for the subsequent evaluation of the target panels. Candidate SNPs were ranked in descending order according to their pairwise F S T scores, where higher values indicated greater genetic differentiation among breeds and higher discriminatory power. Based on this ranking, three nested reduced panels comprising the top-ranked 288, 192, and 96 SNPs were generated.

2.4. Breed Classification and Statistical Analysis

Population classification was performed using a Random Forest classifier implemented with the ranger [37] and caret [38] packages in R version 4.5.2 [39]. SNP genotype data from the training and independent testing datasets were aligned to ensure marker consistency, and marker nomenclature was standardized prior to model fitting. Missing genotypes were imputed using the modal genotype at each locus prior to model training.
Model hyperparameters were optimized exclusively on the training dataset through a repeated stratified 10-fold cross-validation procedure (10 folds, 3 repetitions), using a grid search. This optimization identified the optimal combination of mtry, splitrule, and min.node.size based on the highest mean balanced accuracy, while fixing the number of trees at 1,000. The final Random Forest classifier was subsequently trained on the complete training dataset using the optimized hyperparameters, and SNP importance was estimated via permutation importance. Model performance was evaluated on the independent testing dataset using a confusion matrix to derive overall accuracy, Cohen's Kappa coefficient, and balanced accuracy. To evaluate the impact of target marker reduction against unselected genomic variance, classification models were fitted independently for the three reduced panels (288, 192, and 96 SNPs) and the full 2,145-SNP reference baseline. Posterior class probabilities were obtained for all test individuals; predictions with a maximum probability below 0.70 were flagged as "Unassigned” for exploratory analyses.
To independently evaluate whether the reduced SNP panels preserved the underlying population genetic structure, model-based ancestry estimation was performed using ADMIXTURE [40]. Each of the three reduced SNP panels and the full 2,145-SNP reference baseline were analyzed separately under an unsupervised maximum-likelihood framework. The number of ancestral populations (K) was explored from 2 to 14, and the optimal K was determined using the cross-validation (CV) procedure implemented in ADMIXTURE, whereby the model exhibiting the lowest CV error was considered the best-supported solution. Individual ancestry coefficients (Q-values) were subsequently estimated for the optimal K and used to assess the ability of each reduced panel to recover the genetic structure and ancestry profiles of the reference breeds relative to the complete baseline. The individual ancestry coefficients were visualized using CLUMPAK (Cluster Markov Packager Across K) [41].
Additionally, Principal Component Analysis (PCA) was performed using PLINK v1.9 [35] to evaluate whether the reduced SNP panels preserved the macro-level genetic structure and breed differentiation observed in the reference dataset. Separate PCAs were conducted for each reduced panel density (288, 192, and 96 SNPs) and the full 2,145-SNP reference baseline using the independent testing dataset. The proportion of variance explained by each principal component was calculated from the eigenvalues generated by PLINK. Individual coordinates for the first two principal components (PC1 and PC2) were visualized using the R ggplot2 package [42] to assess whether progressively smaller SNP subsets preserved breed-specific clustering patterns.
To compare classification accuracy among the full 2,145-SNP reference baseline and the three reduced SNP panels (288, 192, and 96 SNPs), individual-level classification outcomes (correct/incorrect) from the Random Forest models were treated as paired binary data, given that the same animals were evaluated across all subsets. An omnibus Cochran's Q test was performed to assess whether classification accuracy differed among all panels, followed by pairwise McNemar's tests with continuity correction for post hoc comparisons. Resulting p-values were adjusted for multiple comparisons using the Holm method. All analyses were performed in R version 4.5.2 [39], using base R functions (stats package) and an implementation of Cochran's Q test based on Cochran (1950) [43].

3. Results

3.1. Selection of Informative Markers and Genomic Distribution

Following quality control, 2,145 out of 2,926 initial SNPs were retained for down-stream analyses. Subsequently, pairwise Wright's fixation index (FST) analysis identified the most informative loci for breed assignment, generating three nested reduced SNP panels containing the top 288, 192 and 96 markers. The FST analysis demonstrated that the marker selection strategy effectively enriched the reduced panels with highly informative loci for breed discrimination (Figure 1).
Compared with the full BeadChip (2,145 SNPs), the reduced panels containing 288, 192 and 96 SNPs, respectively, presented an increase in FST values, indicating a successful enrichment for loci with greater allele-frequency differentiation among breeds (Figure 1a). This pattern was further supported by the boxplot distributions (Figure 1b), in which all reduced panels showed substantially higher median and mean FST values than full 2,145-SNP reference baseline, with a marginal increase in average FST as panel size decreased. The three reduced subsets displayed highly consistent distribution shapes despite the progressive reduction in marker numbers, indicating that the sequential ranking procedure successfully retained the most informative markers.
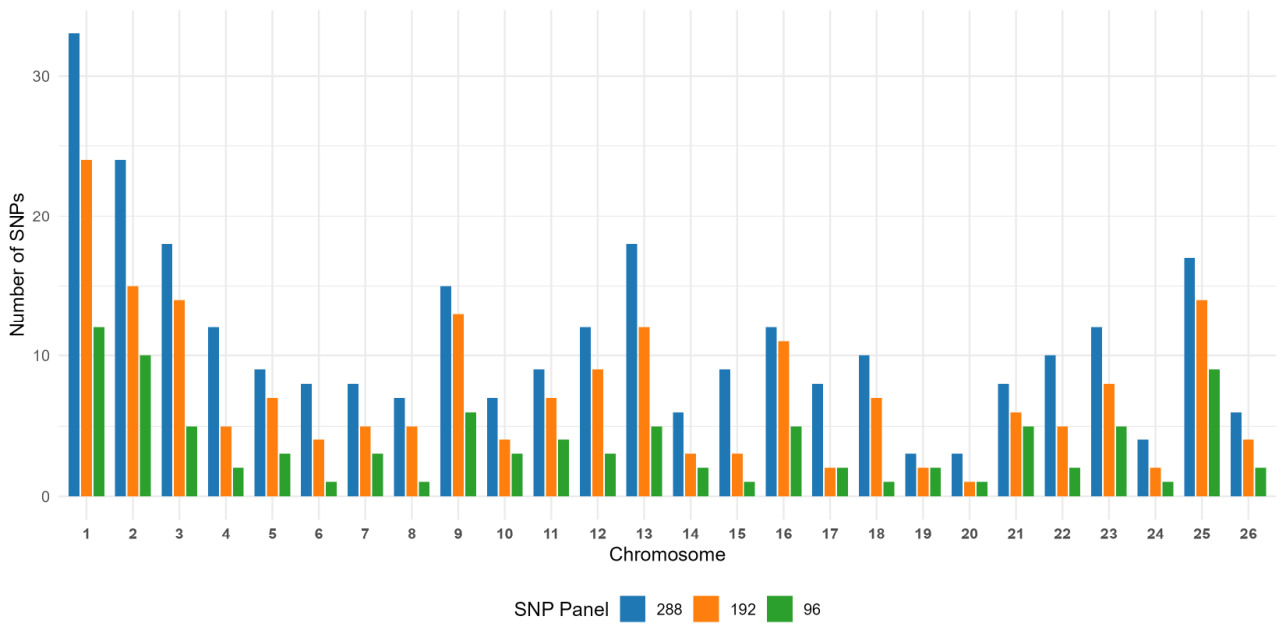
The genomic distribution of the selected SNPs was subsequently evaluated to assess chromosome-wide representation. The selected markers were distributed across 26 sheep autosomes (Figure 2), maintaining broad genomic coverage despite progressive marker reduction. Notably, even the smallest panel (96 SNPs) retained at least one marker on every represented chromosome, indicating that marker reduction preserved genome-wide representation while substantially decreasing overall panel size. Detailed information on the SNPs included in each reduced panel, including marker identification, chromosomal location, and genomic position, is provided in Supplementary Table S1.

3.2. Principal Component Analysis (PCA)

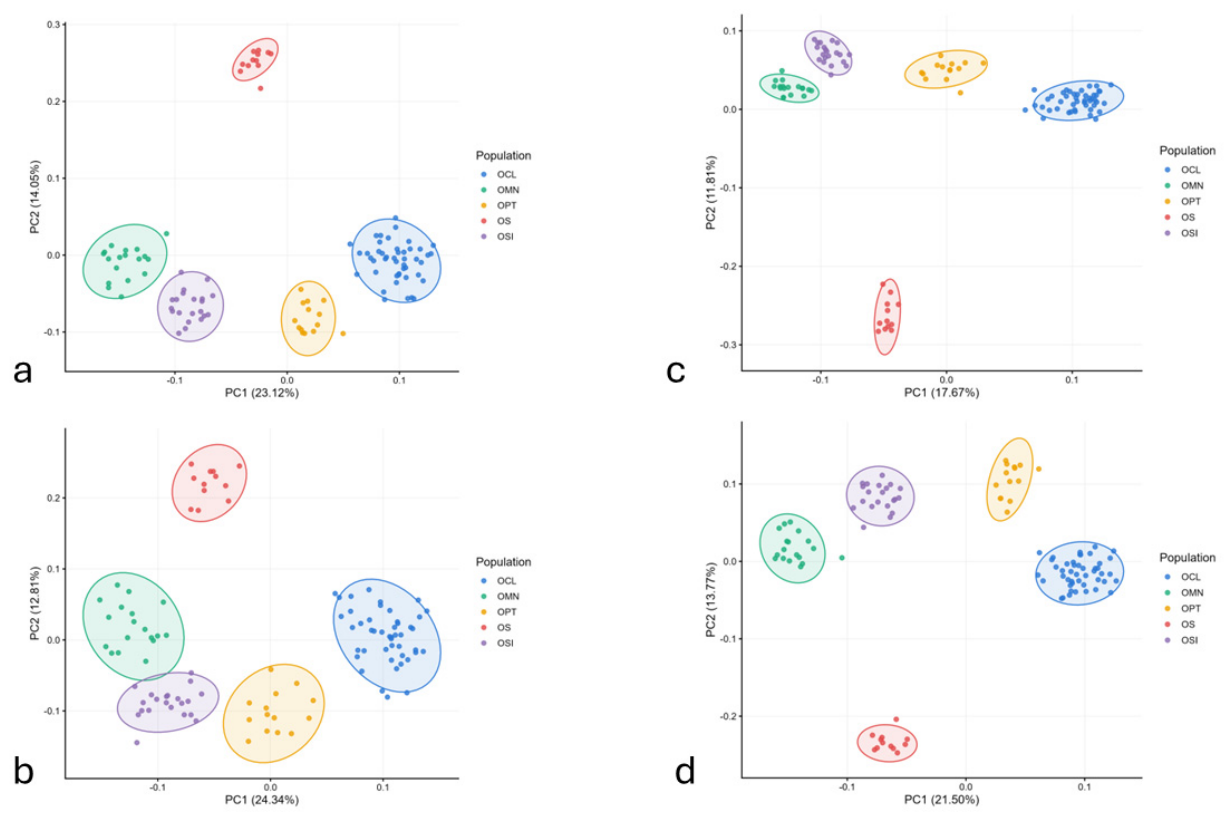
Principal Component Analysis (PCA) was performed to evaluate whether the reduced SNP panels retained the genetic structure of the studied breeds following marker reduction. Overall, all three reduced panels preserved the major patterns of population differentiation observed in the full dataset. The first two principal components (PC1 and PC2) explained 23.12% and 14.05% of the total genetic variance for the 96-SNP panel (Figure 3a), 24.34% and 12.81% for the 192-SNP panel (Figure 3b), 17.67% and 11.81% for the 288-SNP panel (Figure 3c), mirroring the 21.50% and 13.77% captured by the full 2,145-SNP reference panel (Figure 3d). Despite the progressive reduction in marker count, the overall PCA topology remained highly consistent between the full dataset and the subset panels. This demonstrates that the targeted selection strategy successfully captured the key patterns of genetic differentiation among the evaluated breeds without the need for the full marker array.

3.3. Population Structure Inferred by Admixture

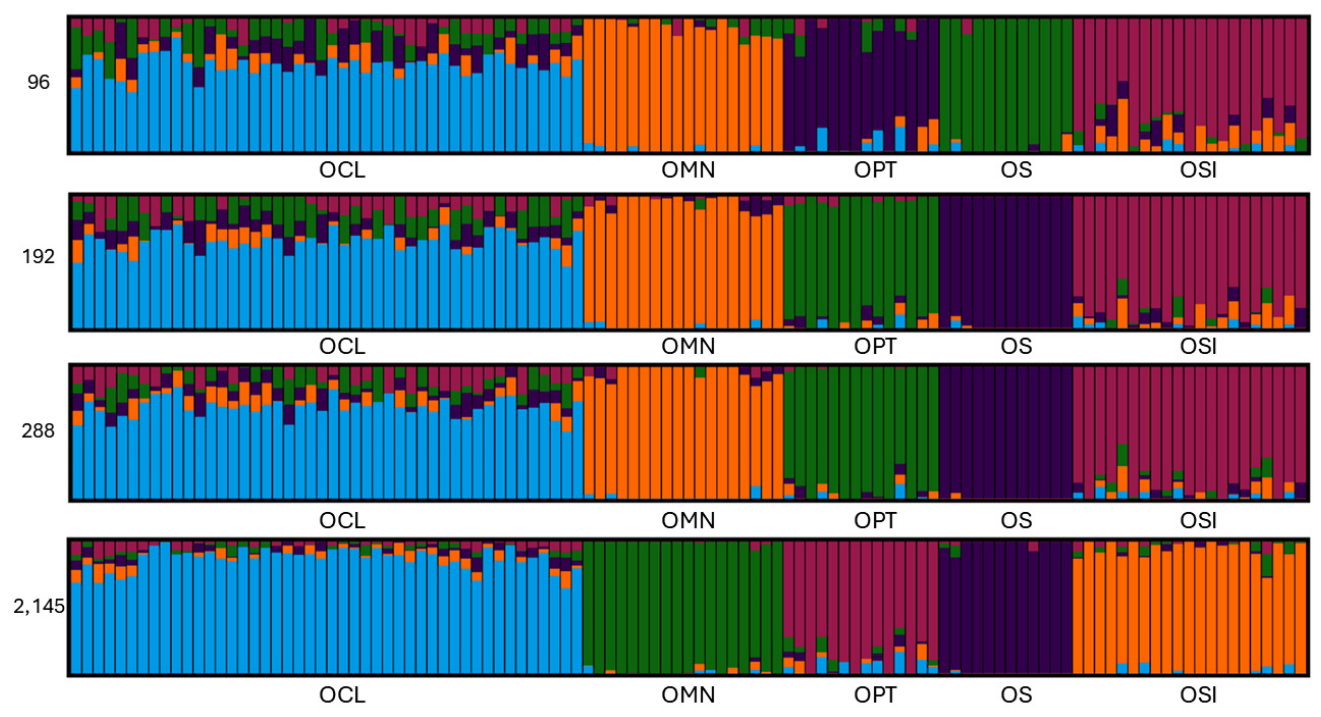
ADMIXTURE analyses consistently recovered the genetic structure of the five Brazilian sheep breeds across all three reduced, selected SNP panels when compared to the complete 2,145-SNP reference baseline at K=5 (Figure 4). The structure is supported by the lowest cross-validation (CV) error observed at K=5 across all subsets and the full dataset (Supplementary Figure S1).
The 288-SNP panel produced highly homogeneous ancestry profiles with minimal evidence of admixture among breeds, perfectly capturing the baseline patterns. Similar clustering patterns were observed for both the 192-SNP and 96-SNP panels; although the 96-SNP panel showed a slight increase in background ancestry sharing between certain breeds, it still preserved well-defined, breed-specific clusters equivalent to the full reference baseline.

3.4. Random Forest Classification

The Random Forest classifier demonstrated consistently high predictive performance across all three reduced SNP panels, paradoxically outperforming the full reference array (Table 2). The two intermediate-density panels (192 and 288 SNPs) exhibited the highest overall classification accuracy, correctly assigning 100% of the individuals to their respective breeds within the independent testing dataset (overall accuracy = 100%, balanced accuracy = 100%, Kappa = 1.000). In contrast, the 96-SNP panel showed only a marginal reduction in performance, maintaining an overall accuracy of 99.10%, a balanced accuracy of 99.17%, and an almost perfect agreement with reference classifications (Kappa = 0.988).
Conversely, the complete 2,145-SNP baseline dataset presented the lowest predictive performance, yielding an overall accuracy of 97.30%, a balanced accuracy of 97.40%, and a Kappa coefficient of 0.963. This confirms that unselected high-density panels retain uninformative noise that can detract from machine learning assignment accuracy. The final model configurations obtained after hyperparameter optimization are provided in Supplementary Table S2.
Breed-specific performance metrics further confirmed the high discriminatory capacity of the targeted, reduced SNP subsets over the complete marker set (Table 3). Both the 192 and 288 SNP panels achieved flawless classification across all evaluated breeds, yielding sensitivity, specificity, positive predictive value (PPV), and negative predictive values (NPV) equal to 1.000 for every breed group. The minimal 96 SNP panel also maintained exceptional individual metrics, with mean sensitivity, specificity, PPV, and NPV of 0.986, 0.998, 0.991, and 0.998, respectively. Minor performance drops within 96-SNP subset were restricted to the Pantaneiro breed (sensitivity = 0.929), and Santa Inês, (PPV = 0.955) due to a single instance of false-positive assignment.
The complete 2,145-SNP dataset once again demonstrated lower comparative performance across individual populations, particularly for the Pantaneiro sheep, where sensitivity declined to 0.786, illustrating that the inclusion of non-filtered markers compromises assignment resolution for breeds with complex demographic or crossbreeding histories.

3.5. Comparative Evaluation of SNP Panels

Random Forest classification accuracy did not differ significantly among the four evaluated panels (2,145, 288, 192, and 96-SNPs), as assessed by Cochran's Q test (Q = 6.00, df = 3, p = 0.112). Pairwise post hoc comparisons using McNemar's test with Holm adjustment revealed no statistically significant differences between any pair of panels. However, comparisons involving the full 2,145-SNP baseline dataset yielded the lowest raw p-values (2,145 vs. 288-SNP and vs. 192-SNP panels: χ² = 1.33, p = 0.248), aligning with the lower empirical test accuracy observed for the complete baseline array (Table 2).
Furthermore, no discordant misclassifications occurred between the 288-SNP and 96-SNP, or between the 192-SNP and 96-SNP panels (χ² = 0, p = 1.000). The 288-SNP and 192-SNP panels exhibited perfect classification agreement, which precluded McNemar's test computation due to the total absence of discordant pairs. Taken together, these results demonstrate that drastically reducing marker density from 2,145 SNPs down to as few as 96 SNPs does not compromise breed assignment accuracy, establishing the 96-SNP panel as the optimal balance between cost-effectiveness and predictive performance.

4. Discussion

In the present study, three nested reduced SNP panels (288, 192, and 96 SNPs) for breed assignment were derived from a reference BeadChip array comprising 2,926 SNPs (2,145 markers post-quality control). A comparison of classification performance among the complete baseline BeadChip and the three reduced SNP panels demonstrated that all four datasets achieved high classification accuracy, with no significant differences (Cochran's Q test: Q = 6.00, df = 3, p = 0.112). Given this statistical equivalence, the 96-SNP panel represents the most cost-effective and operationally efficient option among those evaluated, requiring substantially fewer markers without compromising classification accuracy.
Beyond genotyping cost, reducing the marker count lowers computational demands and analytical turnaround time, both of which are critical considerations for large-scale, routine applications. These findings support the future development of a dedicated low-density genotyping kit based on the 96-SNP panel, which will facilitate its practical implementation in routine breed assignment, population screening and conservation programs.
The high classification accuracy achieved by the reduced SNP panels reinforces that the successful breed assignment depends primarily on the discriminatory power of the selected markers rather than on absolute SNP density, as previously highlighted by [44]. The optimization strategy adopted here prioritized loci with high FST values, thereby enriching the panels with ancestry-informative markers (AIMs) that capture substantial allele-frequency differentiation among breeds. Consequently, the classification performance of the optimized panels exceeded that obtained with the full baseline array drastically reducing marker density. This aligns with previous studies demonstrating that targeted, reduced SNP sets can effectively preserve population assignment accuracy [17,44,45].
Although the 288-SNP panel provided slightly clearer population separation in PCA space, this did not translate into superior machine learning assignment, as the 192 and 96-SNP panels successfully preserved the major genetic structure inferred by PCA and ADMIXTURE while achieved equivalent Random Forest performance. These findings indicate that incorporating additional loci yields diminishing returns for breed assignment. Highly informative markers capture majority of the necessary discriminatory signal, whereas additional loci on medium- and high-density arrays often contribute redundant or uninformative noise for population classification [44,46].
Compared with previously published SNP panels for breed assignment and traceability in sheep, the optimized 96-SNP panel selected in this study achieved equivalent classification performance while requiring substantially fewer markers than many established arrays. For example, [28] curated a 163-SNP panel validated primarily across cosmopolitan, commercial sheep breeds globally dispersed. Similarly, several other studies have reported high breed assignment accuracy using considerably larger SNP sets, typically ranging from 200 to over 6,000 markers [21,30,47,48].
Despite the prevalence of larger arrays, minimalist panels have occasionally been implemented with success: [17] identified three breed-specific panels comprising 89 to 95 SNPs for Indian sheep breeds, while [45] achieved 100% classification accuracy using only 48 SNPs in local Sicilian breeds. However, direct cross-study comparisons must be interpreted with caution, as panel efficiency is inherently dictated by the underlying genetic differentiation among target populations, breed diversity, marker selection criteria, and classification algorithms. Collectively, our findings demonstrate that that panel informativeness outweighs sheer marker volume, confirming that 96 carefully selected SNPs are fully sufficient to discriminate Brazilian locally adapted sheep breeds.
Crucially, while reduced SNP panels have been optimized for sheep breed assignment previously, these efforts have predominantly focused on European autochthonous or commercial breeds, leaving Neotropical populations markedly underrepresented in genomic literature. Brazilian locally adapted sheep constitute invaluable genetic resources due to their unique physiological adaptations to tropical and semi-arid environments [3]. However, no validated low-density SNP panel has previously been available for breed certification or traceability in these populations.
Previously, [49] applied a machine learning approach to identify 18 informative SNPs for breed assignment in Crioula, Morada Nova, and Santa Inês sheep; however, the proposed markers were not experimentally validated. Subsequently, [50] evaluated this panel and demonstrated that it did not provide sufficient discriminatory power for unequivocal breed assignment in these breeds. Consequently, until now, no validated reduced SNP panel has been available for breed assignment in Brazilian locally adapted sheep. The present study addresses this long-standing gap by presenting a reduced empirically validated 96-SNP panel, representing a valuable alternative with potential applications in breed certification, traceability, and conservation programs, particularly for Brazilian locally adapted sheep breeds adapted to tropical and semi-arid environments, for which comparable genomic resources remain limited.
Although the development and analytical validation of a dedicated custom assay remain necessary before routine field implementation, this study extends beyond in silico selection by demonstrating, with real empirical genotype data, that the 96 selected SNPs provide robust discriminatory power. This resolution is particularly noteworthy for distinguishing Crioula and Pantaneiro sheep, two wool-producing populations from southern Brazil that share overlapping genetic backgrounds and historical migration routes [6,9]. The Pantaneiro sheep remains an officially underrecognized genetic group restricted to the Pantanal wetlands, where historical gene flow with neighboring Paraguayan and Bolivian populations has influenced its genetic profile [5,9].
Similarly, Brazilian locally adapted hair sheep breeds share African ancestral contributions and have undergone adaptation to challenging climatic conditions in northeastern Brazil [3]. Despite these shared evolutionary histories and environmental selective pressures, our 96-SNP panel successfully discriminated all evaluated populations, demonstrating its capacity to resolve fine-scale population structure even among closely related groups.
Reduced SNP panels are especially valuable for smallholder production systems, which maintain the vast majority of locally adapted breeds in Brazil but face strict financial barriers regarding access to high-density genomic technologies [51,52]. Accurate, affordable breed assignment can directly support genetic certification and product traceability, adding commercial value to artisanal meat, high-quality leather, specialized wool, and regional dairy products [7,53,54,55]. This value proposition is particularly compelling for populations like the Pantaneiro sheep, which are reared under challenging environmental conditions in multi-purpose production models [56,57,58].
Beyond commercial certification, low-density panels offer practical tools for conservation genetics, enabling precise breed identification, the discovery of unrecorded or admixed individuals, and the monitoring of population diversity [19,44,59]. In summary, the 96-SNP panel developed here provides a cost-effective, practical framework to empower the sustainable management, commercialization, and conservation of Brazil's locally adapted sheep genetic resources.

5. Conclusions

This study demonstrates that a targeted set of 96 highly informative SNPs accurately discriminates five principal Brazilian locally adapted sheep breeds. Across all evaluated panel densities, the 96-SNP panel maintained classification performance equivalent to larger SNP sets and the full baseline array, reinforcing that marker informativeness rather than panel size is the primary driver of breed assignment accuracy.
Although the formal development and analytical validation of a low-density genotyping assay remain the next steps toward field deployment, the in silico marker selection and empirical validation performed in this study provide a robust framework for translating informative SNP discovery into an accessible genomic tool. Ultimately, this cost-effective 96-SNP panel offers a practical solution to support breed certification, traceability, and the sustainable management and conservation of Brazilian locally adapted sheep genetic resources.

Supplementary Materials

The following supporting information can be downloaded at Preprints.org, Table S1: Description of the SNPs included in the 288, 192, and 96-SNP reduced panels developed for breed assignment in Brazilian locally adapted sheep breeds; Figure S1: Cross-validation (CV) error from ADMIXTURE analyses (K = 2–14) for the complete post-QC BeadChip and the three reduced SNP panels. The minimum CV error was observed at K = 5 for all marker sets; Table S2: Optimized Random Forest hyperparameters for each SNP panel evaluated for breed assignment in Brazilian locally adapted sheep.

Author Contributions

Conceptualization, C.S.R., D.A.F., S.R.P., and C.M.; methodology, C.S.R.; formal analysis, C.S.R.; investigation, C.S.R.; resources, S.R.P.; data curation, C.S.R. and D.A.F.; writing-original draft preparation, C.S.R.; writing-review and editing, C.S.R., D.A.F., and C.M.; supervision, D.A.F., S.R.P., and C.M.; funding acquisition, S.R.P. and C.M. All authors have read and agreed to the published version of the manuscript.

Funding

This research was funded by the Coordination for the Improvement of Higher Education Personnel (CAPES), Finance Code 001, and the National Council for Scientific and Technological Development (CNPq), 101711-2024-7.

Data Availability Statement

The data presented in this study are available on request from the corresponding author due to institutional restrictions.

Acknowledgments

The authors gratefully acknowledge Embrapa Genetic Resources and Biotechnology for providing access to the biological samples and research infrastructure that made this study possible.

Conflicts of Interest

The authors declare no conflicts of interest.

Institutional Review Board Statement

Ethical review and approval were waived for this study because it utilized pre-existing whole-blood samples (preserved in EDTA) accessed from the Banco de DNA e Tecidos Animais biobank at Embrapa Recursos Genéticos e Biotecnologia (Embrapa Genetic Resources and Biotechnology). No live animals were handled, sampled, or subjected to experimental procedures by the authors.

Abbreviations

The following abbreviations are used in this manuscript:
AIMs Ancestry-informative markers
CI Confidence interval
CV Cross validation
EDTA Ethylenediaminetetraacetic acid
FST Pairwise Wright's fixation index
LD Linkage disequilibrium
NPV Negative predictive value
OOB Out-of-bag
PCA Principal Component Analysis
PPV Positive predictive value
QC Quality control
SNP Single-nucleotide polymorphism

References

  1. Kijas, J.W.; Lenstra, J.A.; Hayes, B.; Boitard, S.; Porto Neto, L.R.; San Cristobal, M.; Servin, B.; McCulloch, R.; Whan, V.; Gietzen, K.; Paiva, S.; Stothard, P.; Moore, S.S.; Gore, K.P.; Bowman, P.J.; Lamara, A.; Cockett, N.; Georges, M.; International Sheep Genomics Consortium. Genome-wide analysis of the world's sheep breeds reveals high levels of population structure and adaptive variation. PLoS Biol. 2012, 10, e1001258. [Google Scholar] [CrossRef] [PubMed]
  2. Groeneveld, L.F.; Lenstra, J.A.; Eding, H.; Toro, M.A.; Scherf, B.; Pilling, D.; Negrini, R.; Finlay, E.K.; Jianlin, H.; Groeneveld, E.; Weigend, S.; The GLOBALDIV Consortium. Genetic diversity in farm animals: A review. Anim. Genet. 2010, 41 (Suppl. 1), 6–31. [Google Scholar] [CrossRef] [PubMed]
  3. Paim, T.P.; Paiva, S.R.; Toledo, N.M.; Yamagishi, M.E.B.; Carneiro, P.L.S.; Facó, O.; Araújo, A.M.; Azevedo, H.C.; Caetano, A.R.; Braga, R.M.; et al. Origin and population structure of Brazilian hair sheep breeds. Anim. Genet. 2021, 52, 492–504. [Google Scholar] [CrossRef] [PubMed]
  4. McManus, C.; Paiva, S.R.; Caetano, A.R.; Hermuche, P.; Guimarães, R.F.; Carvalho, O.A., Jr.; Braga, R.; Carneiro, P.L.S.; Ferrugem-Moraes, J.; Hoff De Souza, C.J.; et al. Landscape genetics of sheep in Brazil using SNP markers. Small Rumin. Res. 2020, 192, 106239. [Google Scholar] [CrossRef]
  5. Crispim, B.A.; Banari, A.C.; Oliveira, J.A.; Fernandes, J.S.; Grisolia, A.B. Naturalized breeds in Brazil: Reports on the origin and genetic diversity of the Pantaneiro sheep. In Livestock Science; InTech: Rijeka, Croatia, 2017. [Google Scholar] [CrossRef]
  6. de Azambuja Ribeiro, E.L.; González-García, E. Indigenous sheep breeds in Brazil: Potential role for contributing to the sustainability of production systems. Trop. Anim. Health Prod. 2016, 48, 1305–1313. [Google Scholar] [CrossRef] [PubMed]
  7. Moreira, G.R.P. Conservation status of Creole sheep flocks in Brazil. Genet. Resour. 2022, 3, 68–74. [Google Scholar] [CrossRef]
  8. McManus, C.; Paiva, S.R.; Araújo, R.O. Genetics and breeding of sheep in Brazil. Rev. Bras. Zootec. 2010, 39 (Suppl. spe), 236–246. [Google Scholar] [CrossRef]
  9. McManus, C.; Hermuche, P.; Paiva, S.R.; Moraes, J.C.F.; Melo, C.B.; Mendes, C. Geographical distribution of sheep breeds in Brazil and their relationship with climatic and environmental factors as risk classification for conservation. Braz. J. Sci. Technol. 2014, 1, 3. [Google Scholar] [CrossRef]
  10. McManus, C.; Paiva, S.R.; Pimentel, F.; Pimentel, D.; Peripolli, V.; Paim, T.P. Bibliometric analysis of the Santa Ines sheep breed. Appl. Vet. Res. 2025, 3, 2024010. [Google Scholar] [CrossRef]
  11. Powell, O.; Mrode, R.; Gaynor, R.C.; Johnsson, M.; Gorjanc, G.; Hickey, J.M. Genomic evaluations using data recorded on smallholder dairy farms in low- to middle-income countries. JDS Commun. 2021, 2, 366–370. [Google Scholar] [CrossRef] [PubMed]
  12. Gizaw, S.; Abebe, A.; Goshme, S.; Getachew, T.; Bisrat, A.; Abebe, A.; Besufikad, S. Evaluating the accuracy of smallholder farmers’ sire identification for introducing genetic evaluation in community-based sheep breeding programs. Livest. Sci. 2022, 255, 104804. [Google Scholar] [CrossRef]
  13. Negrini, R.; Nicoloso, L.; Crepaldi, P.; Milanesi, E.; Colli, L.; Chegdani, F.; Pariset, L.; Dunner, S.; Leveziel, H.; Williams, J.L.; et al. Assessing SNP markers for assigning individuals to cattle populations. Anim. Genet. 2009, 40, 18–26. [Google Scholar] [CrossRef] [PubMed]
  14. Strucken, E.M.; Al-Mamun, H.A.; Esquivelzeta-Rabell, C.; Gondro, C.; Mwai, O.A.; Gibson, J.P. Genetic tests for estimating dairy breed proportion and parentage assignment in East African crossbred cattle. Genet. Sel. Evol. 2017, 49, 67. [Google Scholar] [CrossRef] [PubMed]
  15. He, J.; Guo, Y.; Xu, J.; Li, H.; Fuller, A.; Tait, R.G., Jr.; Bauck, S.; Wu, X.L. Comparing SNP panels and statistical methods for estimating genomic breed composition of individual animals in ten cattle breeds. BMC Genet. 2018, 19, 56. [Google Scholar] [CrossRef] [PubMed]
  16. Gebrehiwot, N.Z.; Strucken, E.M.; Marshall, K.; Gibson, J.P.; Al-Mamun, H.A. SNP panels for the estimation of dairy breed proportion and parentage assignment in African crossbred dairy cattle. Genet. Sel. Evol. 2021, 53, 21. [Google Scholar] [CrossRef] [PubMed]
  17. Kumar, H.; Panigrahi, M.; Saravanan, K.A.; Parida, S.; Bhushan, B.; Gaur, G.K.; Dutt, T.; Mishra, B.P.; Singh, R.K. SNPs with intermediate minor allele frequencies facilitate accurate breed assignment of Indian Tharparkar cattle. Gene 2021, 777, 145473. [Google Scholar] [CrossRef] [PubMed]
  18. Wilmot, H.; Bormann, J.; Soyeurt, H.; Hubin, X.; Glorieux, G.; Mayeres, P.; Bertozzi, C.; Gengler, N. Development of a genomic tool for breed assignment by comparison of different classification models: Application to three local cattle breeds. J. Anim. Breed. Genet. 2022, 139, 40–61. [Google Scholar] [CrossRef] [PubMed]
  19. Jasielczuk, I.; Gurgul, A.; Szmatoła, T.; Radko, A.; Majewska, A.; Sosin, E.; Litwińczuk, Z.; Rubiś, D.; Ząbek, T. The use of SNP markers for cattle breed identification. J. Appl. Genet. 2024, 65, 575–589. [Google Scholar] [CrossRef] [PubMed]
  20. Zayas, G.A.; Rodriguez, E.; Hernandez, A.; Martinez, R.; Thomas, M.G.; Speidel, S.E.; Enns, R.M.; Canovas, A. Breed of origin analysis in genome-wide association studies: Enhancing SNP-based insights into production traits in a commercial Brangus population. BMC Genom. 2024, 25, 654. [Google Scholar] [CrossRef] [PubMed]
  21. Zhao, C.H.; Wang, D.; Yang, C.; Chen, Y.; Teng, J.; Zhang, X.Y.; Cao, Z.; Wei, X.M.; Ning, C.; Yang, Q.E.; et al. Population structure and breed identification of Chinese indigenous sheep breeds using whole genome SNPs and InDels. Genet. Sel. Evol. 2024, 56, 60. [Google Scholar] [CrossRef] [PubMed]
  22. Wilmot, H.; Gengler, N. Good practice for assignment of breeds and populations: A review. Front. Anim. Sci. 2025, 6, 1508081. [Google Scholar] [CrossRef]
  23. Ducrocq, V.; Laloe, D.; Swaminathan, M.; Rognon, X.; Tixier-Boichard, M.; Zerjal, T. Genomics for ruminants in developing countries: From principles to practice. Front. Genet. 2018, 9, 251. [Google Scholar] [CrossRef] [PubMed]
  24. Liang, Z.; Bu, L.; Qin, Y.; Peng, Y.; Yang, R.; Zhao, Y. Selection of optimal ancestry informative markers for classification and ancestry proportion estimation in pigs. Front. Genet. 2019, 10, 183. [Google Scholar] [CrossRef] [PubMed]
  25. Chhotaray, S.; Panigrahi, M.; Pal, D.; Ahmad, S.F.; Bhushan, B.; Gaur, G.K.; Mishra, B.P.; Singh, R.K. Ancestry informative markers derived from discriminant analysis of principal components provide important insights into the composition of crossbred cattle. Genomics 2020, 112, 1726–1733. [Google Scholar] [CrossRef] [PubMed]
  26. Gangwar, M.; Ahmad, S.F.; Ali, A.B.; Kumar, H.; Panigrahi, M.; Bhushan, B.; Dutt, T. Identifying low-density, ancestry-informative SNP markers through whole genome resequencing in Indian, Chinese, and wild yak. BMC Genom. 2024, 25, 1043. [Google Scholar] [CrossRef] [PubMed]
  27. Somenzi, E.; Ajmone-Marsan, P.; Barbato, M. Identification of ancestry informative marker (AIM) panels to assess hybridisation between feral and domestic sheep. Animals 2020, 10, 582. [Google Scholar] [CrossRef] [PubMed]
  28. Heaton, M.P.; Leymaster, K.A.; Kalbfleisch, T.S.; Kijas, J.W.; Clarke, S.M.; McEwan, J.; Maddox, J.F.; Basnayake, V.; Petrik, D.T.; Simpson, B.; et al. SNPs for parentage testing and traceability in globally diverse breeds of sheep. PLoS ONE 2014, 9, e94851. [Google Scholar] [CrossRef] [PubMed]
  29. Kumar, H.; Panigrahi, M.; Seo, D.; Cho, S.; Bhushan, B.; Dutt, T. Machine learning-aided ultra-low-density single nucleotide polymorphism panel helps to identify the Tharparkar cattle breed: Lessons for digital transformation in livestock genomics. OMICS J. Integr. Biol. 2024, 28, 514–525. [Google Scholar] [CrossRef] [PubMed]
  30. Moradi, M.; Khaltabadi-Farahani, A.; Khodaei-Motlagh, M.; Kazemi-Bonchenari, M.; McEwan, J. Genome-wide selection of discriminant SNP markers for breed assignment in indigenous sheep breeds. In Bioeconomy Science Institute; AgResearch Group, 2021; Available online: https://hdl.handle.net/11440/8409 (accessed on 20 July 2026).
  31. Rodrigues, C.S.; Faria, D.A.d.; Azevedo, H.C.; Silva, K.d.M.; Facó, O.; Santos, S.A.; Braga, R.M.; Caetano, A.R.; Moraes, J.C.F.; Souza, C.J.H.d.; et al. Assessment of a Reduced SNP Panel Targeting Prolificacy and Coat Color Genes in Brazilian Sheep Breeds. Animals 2026, 16, 2008. [Google Scholar] [CrossRef] [PubMed]
  32. Lopes, U.V.; Pires, J.L.; Gramacho, K.P.; Grattapaglia, D. Genome-wide SNP genotyping as a simple and practical tool to accelerate the development of inbred lines in outbred tree species: An example in cacao (Theobroma cacao L.). PLoS ONE 2022, 17, e0270437. [Google Scholar] [CrossRef] [PubMed]
  33. Rodrigues, C.S.; Faria, D.A.d.; Ramos, A.F.; McManus, C.; Paiva, S.R. Uso de ferramenta genômica no manejo genético das raças conservadas in situ na Embrapa Recursos Genéticos e Biotecnologia; Boletim de Pesquisa e Desenvolvimento, 385; Embrapa Recursos Genéticos e Biotecnologia: Brasília, DF, Brazil, 2025; Available online: http://www.infoteca.cnptia.embrapa.br/infoteca/handle/doc/1176023.
  34. Guazzeli, L.d.M.; Araujo, A.M.d.; Santos, S.A.; Juliano, R.S.; Rodrigues, C.S.; Faria, D.A.d.; Paiva, S.R. Uso de ferramentas genômicas no manejo do Núcleo de Conservação Animal da Embrapa Pantanal; Boletim de Pesquisa e Desenvolvimento, 386; Embrapa Recursos Genéticos e Biotecnologia: Brasília, DF, Brazil, 2025; Available online: http://www.infoteca.cnptia.embrapa.br/infoteca/handle/doc/1179430.
  35. Purcell, S.; Neale, B.; Todd-Brown, K.; Thomas, L.; Ferreira, M.A.; Bender, D.; Maller, J.; Sklar, P.; de Bakker, P.I.; Daly, M.J.; et al. PLINK: A tool set for whole-genome association and population-based linkage analyses. Am. J. Hum. Genet. 2007, 81, 559–575. [Google Scholar] [CrossRef] [PubMed]
  36. Kavakiotis, I.; Triantafyllidis, A.; Ntelidou, D.; Alexandri, P.; Megens, H.J.; Crooijmans, R.P.M.A.; Groenen, M.A.M.; Tsoumakas, G.; Vlahavas, I. TRES: Identification of discriminatory and informative SNPs from population genomic data. J. Hered. 2015, 106, 672–676. [Google Scholar] [CrossRef] [PubMed]
  37. Wright, M.N.; Ziegler, A. ranger: A Fast Implementation of Random Forests for High Dimensional Data in C++ and R. J. Stat. Softw. 2017, 77, 1–17. [Google Scholar] [CrossRef]
  38. Kuhn, M. Building Predictive Models in R Using the caret Package. J. Stat. Softw. 2008, 28, 1–26. [Google Scholar] [CrossRef]
  39. R Core Team. R: A Language and Environment for Statistical Computing; R Foundation for Statistical Computing: Vienna, Austria, 2025; Available online: https://www.r-project.org/ (accessed on 20 June 2026).
  40. Alexander, D.H.; Novembre, J.; Lange, K. Fast model-based estimation of ancestry in unrelated individuals. Genome Res. 2009, 19, 1655–1664. [Google Scholar] [CrossRef] [PubMed]
  41. Kopelman, N.M.; Mayzel, J.; Jakobsson, M.; Rosenberg, N.A.; Mayrose, I. Clumpak: a program for identifying clustering modes and packaging population structure inferences across K. Mol. Ecol. Resour. 2015, 15, 1179–1191. [Google Scholar] [CrossRef] [PubMed]
  42. Wickham, H. ggplot2: Elegant Graphics for Data Analysis; Springer-Verlag: New York, NY, USA, 2016. [Google Scholar]
  43. Cochran, W.G. The Comparison of Percentages in Matched Samples. Biometrika 1950, 37, 256–266. [Google Scholar] [CrossRef]
  44. Wilkinson, S.; Wiener, P.; Archibald, A.L.; Law, A.; Schnabel, R.D.; McKay, S.D.; Taylor, J.F.; Ogden, R. Evaluation of approaches for identifying population informative markers from high density SNP chips. BMC Genet. 2011, 12, 45. [Google Scholar] [CrossRef] [PubMed]
  45. Sottile, G.; Sardina, M.T.; Mastrangelo, S.; Di Gerlando, R.; Tolone, M.; Chiodi, M.; Portolano, B. Penalized classification for optimal statistical selection of markers from high-throughput genotyping: application in sheep breeds. Animal 2018, 12, 1118–1125. [Google Scholar] [CrossRef] [PubMed]
  46. Zhao, Y.; Adedze, Y.M.N.; Dong, J.; Zhang, R.; Zheng, S.; Lan, H.; Li, Y.; Liu, S.; Xu, Y.; Zhang, J. Optimization of commercial SNP arrays and the generation of a high-efficiency GenoBaits Peanut 10K panel. Sci. Rep. 2025, 15, 9995. [Google Scholar] [CrossRef] [PubMed]
  47. Dimauro, C.; Nicoloso, L.; Cellesi, M.; Macciotta, N.P.P.; Ciani, E.; Moioli, B.; Pilla, F.; Crepaldi, P. Selection of discriminant SNP markers for breed and geographic assignment of Italian sheep. Small Rumin. Res. 2015, 128, 27–33. [Google Scholar] [CrossRef]
  48. O’Brien, A.C.; Purfield, D.C.; Judge, M.M.; Long, C.; Fair, S.; Berry, D.P. Population structure and breed composition prediction in a multi-breed sheep population using genome-wide single nucleotide polymorphism genotypes. Animal 2020, 14, 464–474. [Google Scholar] [CrossRef] [PubMed]
  49. Vieira, F.D.; Oliveira, S.R.M.; Paiva, S.R. Metodologia baseada em técnicas de mineração de dados para suporte à certificação de raças de ovinos. Eng. Agríc. 2015, 35, 1172–1186. [Google Scholar] [CrossRef]
  50. Paim, T.P.; McManus, C.; Vieira, F.D.; Oliveira, S.R.M.; Facó, O.; Azevedo, H.C.; Araújo, A.M.; Moraes, J.C.F.; Yamagishi, M.E.B.; Carneiro, P.L.S.; et al. Validation of a customized subset of SNPs for sheep breed assignment in Brazil. Pesq. Agropec. Bras. 2019, 54, e00506. [Google Scholar] [CrossRef]
  51. Guilherme, R.F.; Lima, A.M.C.; Alves, J.R.A.; Costa, D.F.; Pinheiro, R.R.; Alves, F.S.F.; Azevedo, S.S.; Alves, C.J. Characterization and typology of sheep and goat production systems in the State of Paraíba, a semi-arid region of northeastern Brazil. Semin. Ciênc. Agrár. 2017, 38, 2163–2178. [Google Scholar] [CrossRef]
  52. Debortoli, E.C.; Monteiro, A.L.G.; Gameiro, A.H.; Saraiva, L.C.V.F. Meat sheep farming systems according to economic and productive indicators: A case study in Southern Brazil. Rev. Bras. Zootec. 2021, 50, e20200216. [Google Scholar] [CrossRef]
  53. Sousa, R.T.; Gonçalves, J.L.; Fonteles, N.L.O.; Santos, C.M.; Ricci, G.D.; Albuquerque, F.H.M.A.R.; Fernandes, F.E.P.; Bomfim, M.A.D. Reproductive characteristics of Morada Nova and Brazilian Somalis sheep breeds. Pubvet 2015, 9, 495–501. [Google Scholar] [CrossRef]
  54. Sá, H.A.O.M.; Fluck, A.C.; Cardinal, K.M.; Costa, O.A.D.; Lemes, J.S.; Debo, E.C.; Vaz, R.Z. Physical characteristics of meat from native Brazilian sheep breeds: A systematic review and meta-analysis. Semin. Ciênc. Agrár. 2025, 46, 1485–1508. [Google Scholar] [CrossRef]
  55. Costa, J.A.A.; Egito, A.A.; Barbosa-Ferreira, M.; Reis, F.A.; Vargas Junior, F.M.; Santos, S.A.; Catto, J.B.; Juliano, R.S.; Feijó, G.L.D.; Ítavo, C.C.B.F.; et al. Ovelha Pantaneira, um grupamento genético naturalizado do estado de Mato Grosso do Sul. Palestras do VIII Congreso Latinoamericano de Especialistas en Pequeños Rumiantes y Camélidos Sudamericanos, Campo Grande, MS, Brazil, 2013; pp. 25–43. Available online: http://www.alice.cnptia.embrapa.br/alice/handle/doc/982438 (accessed on 20 July 2026).
  56. Longo, M.L.; Vargas Junior, F.M.; Cansian, K.; Souza, M.R.; Burim, P.C.; Silva, A.L.A.; Costa, C.M.; Seno, L.O. Environmental factors that influence milk production of Pantaneiro ewes and the weight gain of their lambs during the pre-weaning period. Trop. Anim. Health Prod. 2018, 50, 1493–1497. [Google Scholar] [CrossRef] [PubMed]
  57. Monteschio, J.O.; Burin, P.C.; Leonardo, A.P.; Fausto, D.A.; Silva, A.L.A.; Ricardo, H.A.; Vargas Junior, F.M. Different physiological stages and breeding systems related to the variability of meat quality of indigenous Pantaneiro sheep. PLoS ONE 2018, 13, e0191668. [Google Scholar] [CrossRef] [PubMed]
  58. Silva, G.A.; Santos, S.A.; Meirelles, P.R.L.; Pinheiro, R.S.B.; Gôlo, M.P.S.; Franco, J.L.; Péres, I.A.H.F.S.; Moura, L.F.; Costa, C. Tracking free-ranging Pantaneiro sheep during extreme drought in the Pantanal through precision technologies. Agriculture 2024, 14, 1154. [Google Scholar] [CrossRef]
  59. Gurgul, A.; Rubiś, D.; Ząbek, T.; Żukowski, K.; Pawlina, K.; Semik, E.; Bugno-Poniewierska, M. The evaluation of the usefulness of pedigree verification-dedicated SNPs for breed assignment in three Polish cattle populations. Mol. Biol. Rep. 2013, 40, 6803–6809. [Google Scholar] [CrossRef] [PubMed]
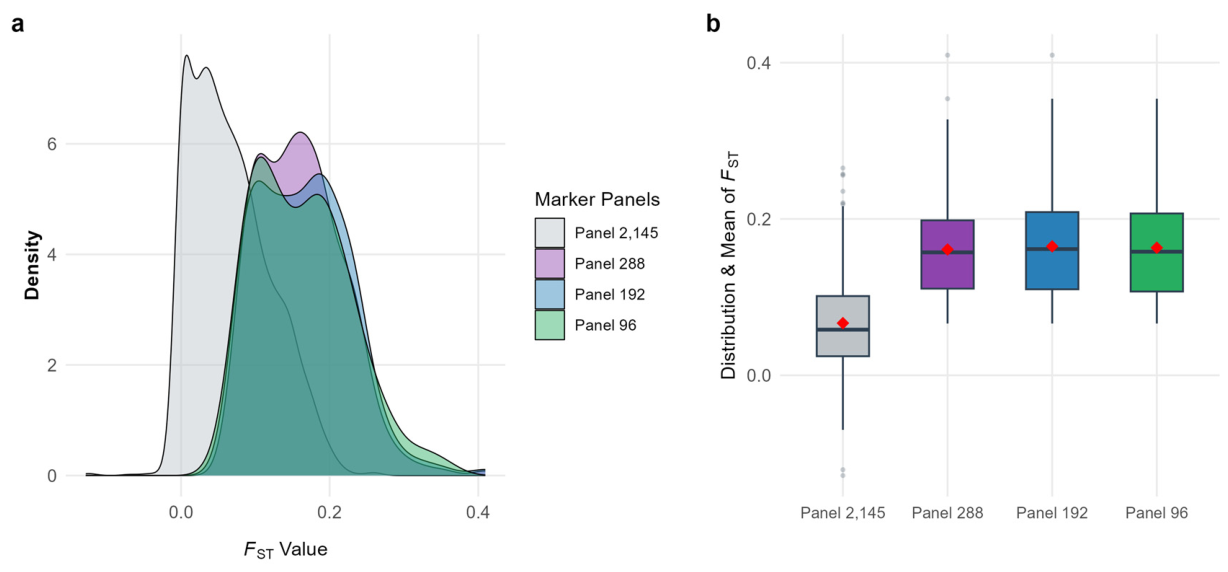
Figure 1. Distributional dynamics and enrichment of FST values across different marker scales. (a) Probability density profiles showing the displacement toward higher differentiation of the three reduced panels compared to the full 2,145-SNP reference baseline. (b) Boxplots of FST values across the evaluated panels. Red diamonds indicate the mean FST of each panel, whereas boxes, horizontal lines, and gray circles represent the interquartile range, median, and outliers, respectively.
Preprints 224640 g001
Figure 2. Chromosomal distribution of the selected SNPs across the three reduced panels.
Preprints 224640 g002
Figure 3. Principal component analysis (PCA) of the reduced SNP panels: (a) 96 SNPs, (b) 192 SNPs, and (c) 288 SNPs, compared with (d) the full BeadChip comprising 2,145 SNPs. Breed codes are provided in Table 1.
Preprints 224640 g003
Figure 4. Population structure inferred by ADMIXTURE at the optimal number of ancestral populations (K = 5) for the three reduced SNP panels (96, 192, and 288 SNPs) compared to the complete 2,145-SNP reference dataset. Individual ancestry proportions are represented by vertical bars, with colors indicating inferred ancestral clusters. Breed codes are listed in Table 1.
Preprints 224640 g004
Table 1. Description of the sheep breeds included in the study, sample size for training and testing datasets, and their economic relevance.
Breed Breed Code Sample Size Train / Test Type Economic Relevance
Crioula OCL 190/46 Wool Triple-Purpose (Meat, Wool and Skin)
Morada Nova OMN 69/18 Hair Dual-Purpose (Meat/Skin)
Pantaneiro OPT 55/14 Wool Triple-Purpose (Meat, Milk and Wool)
Brazilian Somali OS 58/12 Hair Dual-Purpose (Meat/Skin)
Santa Inês OSI 194/21 Hair Dual-Purpose (Meat/Skin)
Table 2. Random Forest classification performance for breed assignment across three reduced SNP panels versus the full BeadChip reference baseline (2,145 SNPs), based on repeated 10-fold cross-validation and an independent test set (n = 111).
SNP Panel Accuracy (95% CI)1 Balanced
Accuracy (%)
Kappa
Coefficient
10-fold CV
Balanced Accuracy (%)2
OOB Brier score3
96 SNPs 99.1 (95.08 - 99.98) 99.17 0.988 95.39 0.085
192 SNPs 100 (96.73 - 100) 100 1.000 95.52 0.092
288 SNPs 100 (96.73 - 100) 100 1.000 95.87 0.091
2145 SNPs
(Baseline)
97.3 (92.30-99.44) 97.4 0.963 96.13 0.096
1 Values within parentheses indicate the lower and upper bounds of the 95% confidence interval for overall classification accuracy. 2Mean balanced accuracy across repeated stratified 10-fold cross-validation (3 repeats), used as the model selection criterion. 3 Out-of-bag Brier score from the final Random Forest model, computed on the training set as a measure of probability calibration. All models were trained on the same 566 individuals and evaluated on the same independent test set of 111 individuals, using 1,000 trees per Random Forest.
Table 3. Population-specific classification performance of the Random Forest model evaluated on an independent testing set (n = 111) comparing the three reduced SNP panels against the complete 2,145 SNPs baseline dataset.
SNP Panel Breed Sensitivity Specificity PPV¹ NPV²
96 SNPs OCL 1.000 1.000 1.000 1.000
OMN 1.000 1.000 1.000 1.000
OPT 0.929 1.000 1.000 0.990
OS 1.000 1.000 1.000 1.000
OSI 1.000 0.989 0.955 1.000
Mean 0.986 0.998 0.991 0.998
192 SNPs OCL 1.000 1.000 1.000 1.000
OMN 1.000 1.000 1.000 1.000
OPT 1.000 1.000 1.000 1.000
OS 1.000 1.000 1.000 1.000
OSI 1.000 1.000 1.000 1.000
Mean 1.000 1.000 1.000 1.000
288 SNPs OCL 1.000 1.000 1.000 1.000
OMN 1.000 1.000 1.000 1.000
OPT 1.000 1.000 1.000 1.000
OS 1.000 1.000 1.000 1.000
OSI 1.000 1.000 1.000 1.000
Mean 1.000 1.000 1.000 1.000
2,145 SNPs
(Baseline)
OCL 1.000 0.954 0.939 1.000
OMN 1.000 1.000 1.000 1.000
OPT 0.786 1.000 1.000 0.970
OS 1.000 1.000 1.000 1.000
OSI 1.000 1.000 1.000 1.000
Mean 0.957 0.991 0.988 0.994
¹ PPV = Positive Predictive Value (Precision). ² NPV = Negative Predictive Value.
Disclaimer/Publisher’s Note: The statements, opinions and data contained in all publications are solely those of the individual author(s) and contributor(s) and not of MDPI and/or the editor(s). MDPI and/or the editor(s) disclaim responsibility for any injury to people or property resulting from any ideas, methods, instructions or products referred to in the content.
Copyright: This open access article is published under a Creative Commons CC BY 4.0 license, which permit the free download, distribution, and reuse, provided that the author and preprint are cited in any reuse.
Prerpints.org logo

Preprints.org is a free preprint server supported by MDPI in Basel, Switzerland.

Subscribe

© 2026 MDPI (Basel, Switzerland) unless otherwise stated

Accessibility

Disclaimer

Terms of Use

Privacy Policy

Privacy Settings