
Submitted:
22 July 2026
Posted:
24 July 2026
You are already at the latest version
Abstract
Self-supervised learning (SSL) has emerged as a powerful paradigm for learning transferable electrocardiogram (ECG) representations without requiring labeled data. Despite growing interest, no standardized benchmark exists for comparing SSL strategies under controlled multi-center conditions, leaving practitioners without principled guidance. We present OpenECG, an open benchmark comprising 1,233,337 twelve-lead ECG recordings from 483,837 patients across nine geographically and demographically diverse centers in four countries. We systematically evaluate three representative SSL paradigms—contrastive learning (SimCLR), feature-consistency learning (BYOL), and masked signal modeling (MAE)—through six complementary evaluation protocols: leave-one-dataset-out (LODO) cross-validation, pre-training data scaling analysis, label-efficiency assessment under few-shot regimes (1%–100% labels), linear probing of representation quality, cross-domain transfer robustness, and augmentation strategy ablation. Multi-center SSL pre-training significantly improved cross-institutional generalization (mean AUROC improvement: 3.2%, 95% CI: 2.1–4.4%, P < 0.001). BYOL and MAE consistently outperformed SimCLR across all evaluation axes, with advantages most pronounced on high-variability datasets (∆ AUROC up to 4.2%) and in low-label regimes. BYOL and MAE reached performance saturation at 60–70% of pre-training data, while SimCLR required >80%. Lead masking and temporal masking were the most critical augmentation components; SimCLR was three times more sensitive to augmentation removal than MAE. OpenECG provides the first systematic, head-to head comparison of SSL strategies for multi-center ECG analysis. Feature-consistency and generative SSL approaches are more data-efficient, label-efficient, augmentation-robust, and transferable than contrastive learning. All code, data pipelines, and pre-trained weights are publicly available.
Keywords:
self-supervised learning
; electrocardiogram
; multi-center benchmark
; contrastive learning
; representation learning
; data augmentation
1. Introduction
Cardiovascular diseases (CVDs) remain the leading cause of mortality worldwide, accounting for an estimated 17.9 million deaths annually [1]. The twelve-lead electrocardiogram (ECG) is the most widely deployed non-invasive cardiac diagnostic tool, recording the electrical activity of the heart from twelve standardized vantage points. Despite its ubiquity, ECG interpretation remains subject to significant inter-observer variability, with disagreement rates of 12–33% even among board-certified cardiologists [2,3]. This variability has motivated substantial interest in automated ECG interpretation through deep learning.
1.1. Supervised Learning and Its Limitations
Early deep learning approaches for ECG classification adopted fully supervised training, achieving remarkable performance when large annotated datasets are available. Hannun et al. [4] demonstrated cardiologist-level performance on rhythm classification using a 34-layer convolutional neural network trained on 91,232 annotated recordings. Ribeiro et al. [5] extended this to 12-lead ECG with a residual network trained on 2.3 million recordings from the Brazilian telehealth network. However, supervised approaches face a fundamental bottleneck: they require large volumes of expert-annotated data that are expensive, time-consuming, and difficult to scale across institutions with heterogeneous recording equipment, patient populations, and annotation practices.
1.2. Self-Supervised Learning for ECG
Self-supervised learning (SSL) offers a compelling alternative by learning representations from unlabeled data through pretext tasks [6,7,8]. The core idea is to train a model to solve a task that does not require human annotations—such as predicting the relationship between augmented views of the same recording (contrastive learning), maintaining consistency between a student and a slowly-updating teacher network (feature-consistency learning), or reconstructing masked portions of the input signal (generative learning). The resulting representations can then be fine-tuned for diverse downstream tasks with minimal labeled data.
In the ECG domain, several SSL approaches have been explored. Contrastive methods include 3KG [9], which applied contrastive learning to 12-lead ECG, and CLOCS [10], which leveraged temporal and spatial invariances specific to ECG. Multi-modal approaches such as ECG-Chat [11] and MERL [12] combine ECG signals with paired clinical text from MIMIC-IV-ECG. Masked signal reconstruction has been explored by MAEFE [13] and others.
1.3. Gaps in the Current Landscape
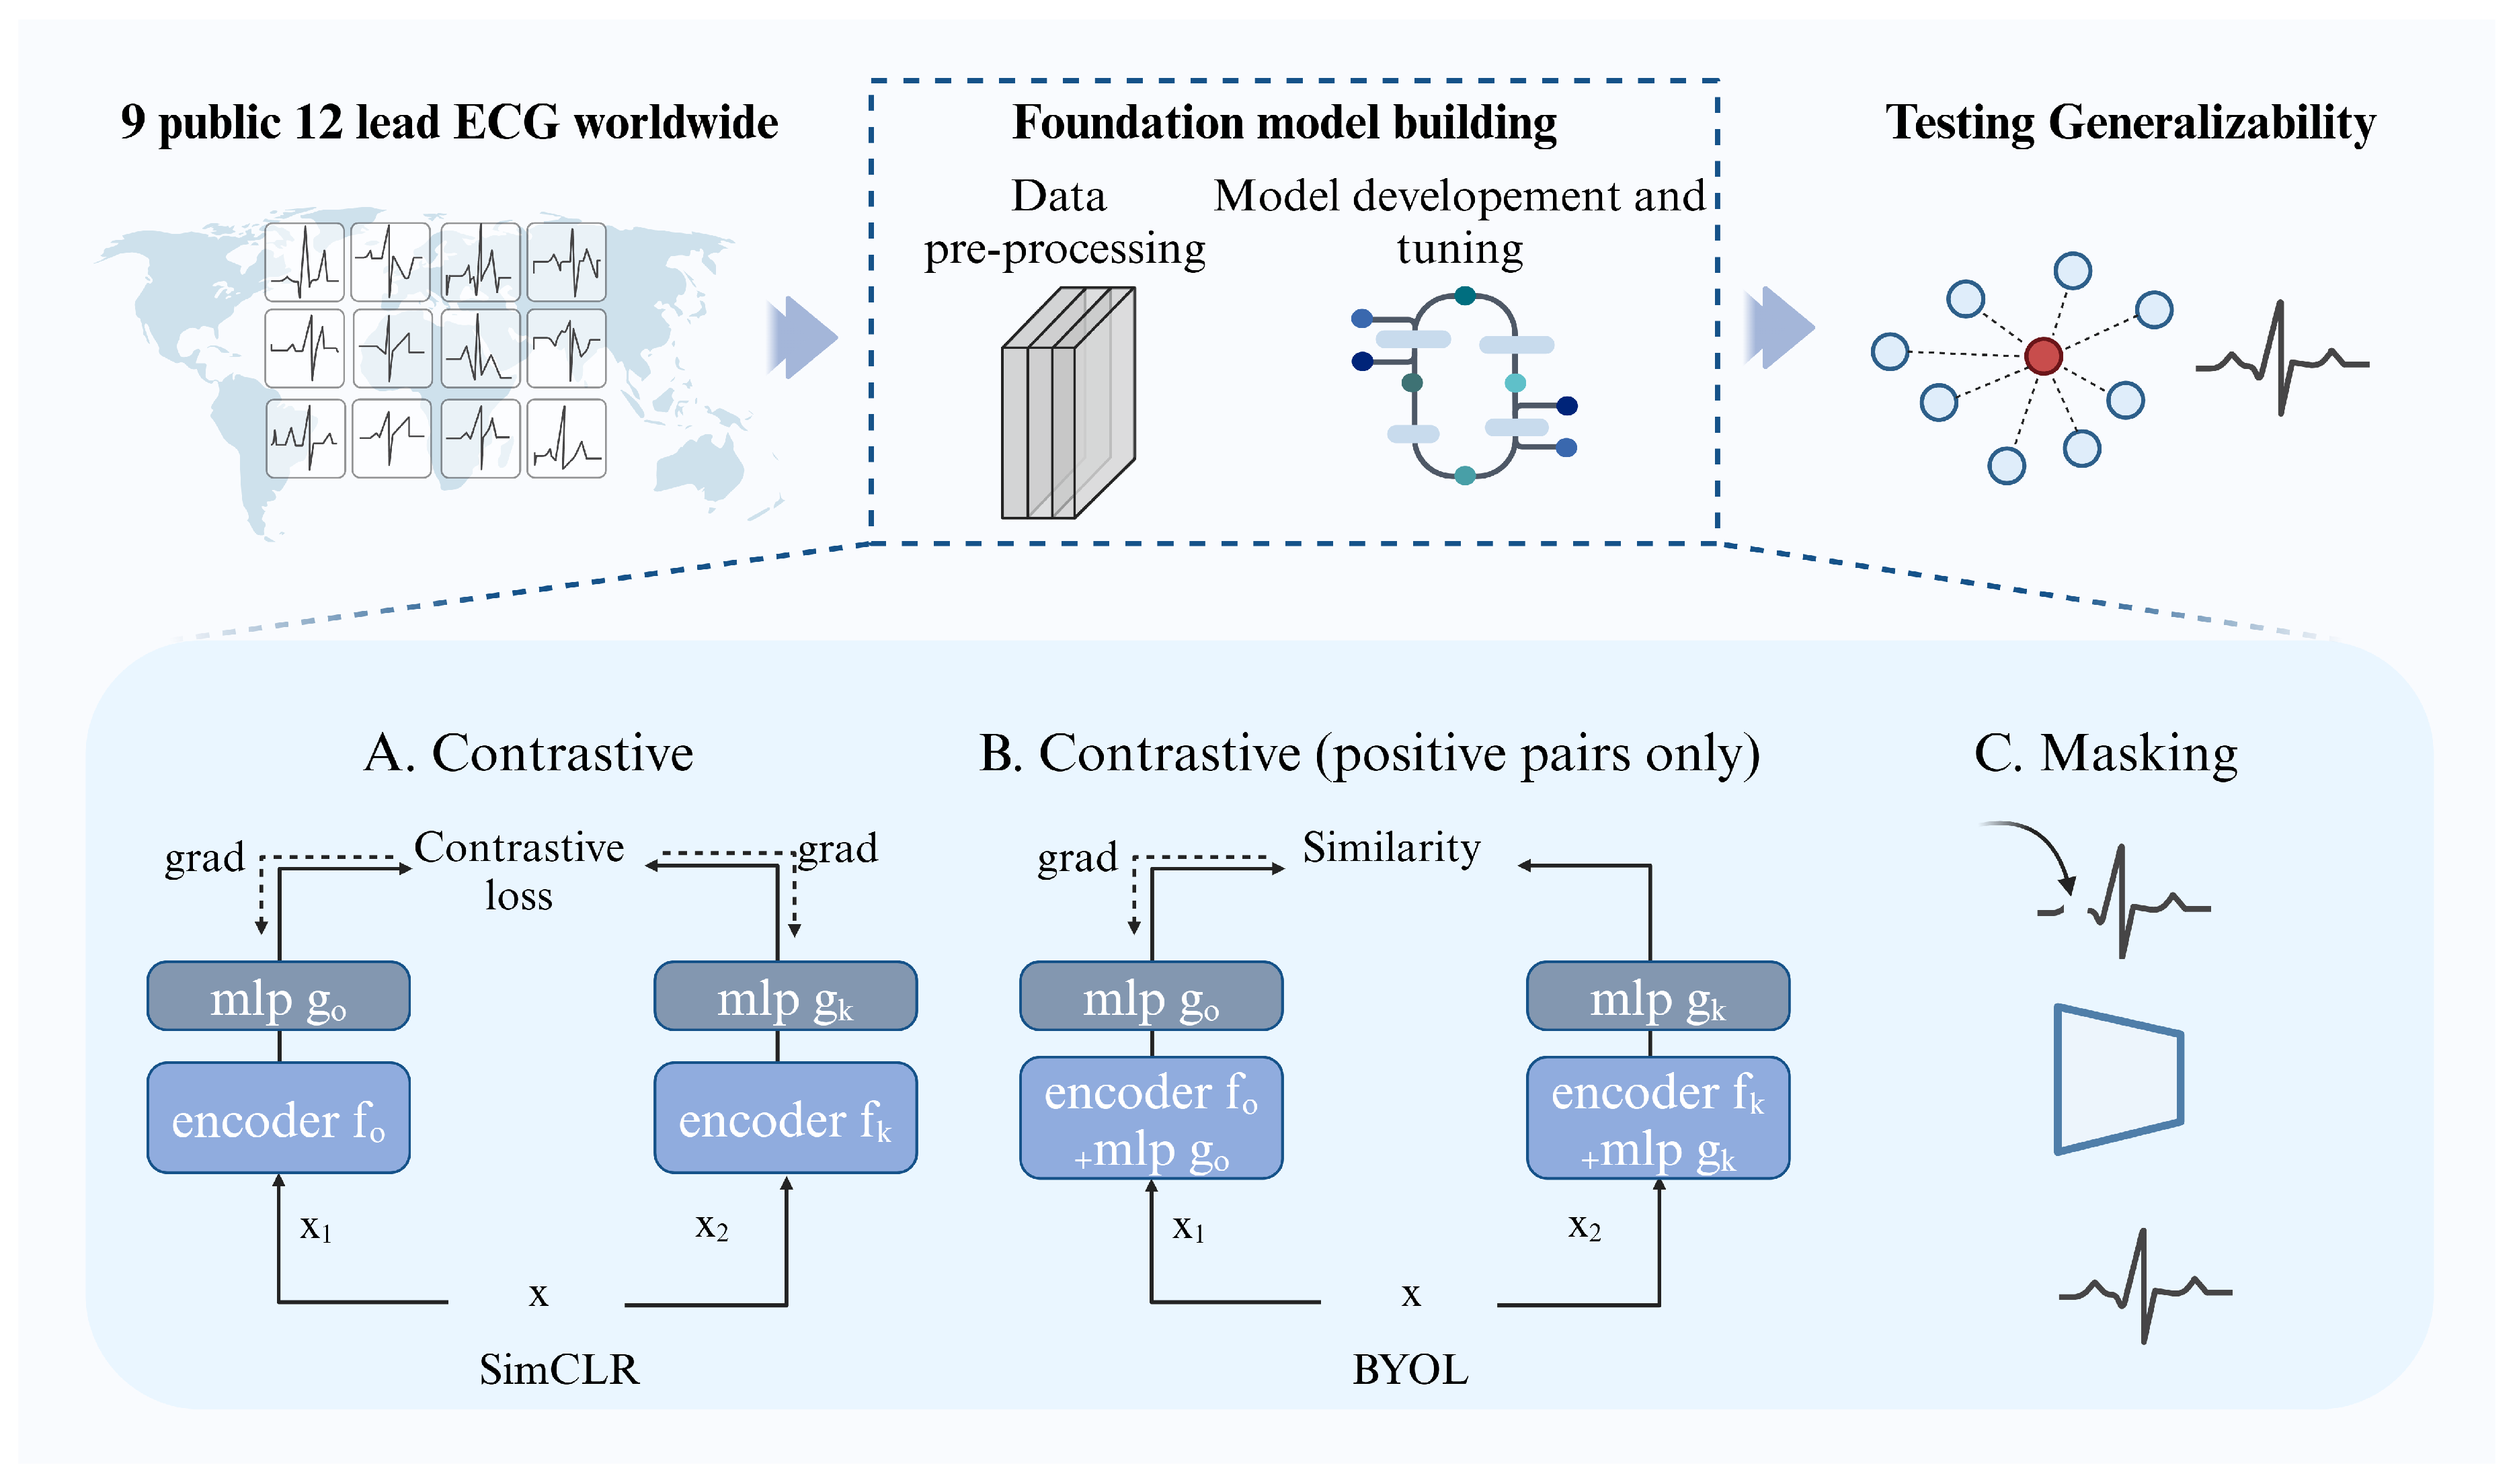
Here we introduce OpenECG, an open benchmark that addresses these gaps by unifying 1,233,337 twelve-lead ECG recordings from 483,837 patients across nine centers spanning four countries (Table 7). We perform the first systematic comparison of three representative SSL paradigms—SimCLR [6], BYOL [7], and MAE [8]—under identical data conditions. Through six complementary evaluation protocols, we provide actionable evidence that:
- 1.
- Feature-consistency (BYOL) and generative (MAE) SSL approaches are substantially more data-efficient, label-efficient, and augmentation-robust than contrastive learning (SimCLR) for multi-center ECG data.
- 2.
- Dataset diversity contributes more to cross-institutional generalization than dataset size alone, with high-variability datasets providing disproportionate benefits.
- 3.
- SSL pre-trained representations transfer more robustly across institutions than supervised baselines.
- 4.
- Lead masking and temporal masking are the most critical augmentation components for ECG-SSL.
Three critical gaps persist. First, existing studies typically evaluate a single SSL method on one or two datasets under method-specific experimental conditions, making fair cross-method comparison impossible. Second, the interaction between SSL strategy, pre-training data diversity, downstream label availability, and augmentation design is poorly characterized. Third, no open benchmark provides standardized data splits, preprocessing pipelines, and evaluation protocols for reproducible comparison.
1.4. Contributions
Figure 1.
Overview of OpenECG. Top: data collection from nine public 12-lead ECG datasets worldwide, self-supervised pre-training pipeline, and cross-institutional generalizability testing. Bottom: the three evaluated SSL paradigms—(A) SimCLR (contrastive learning with positive and negative pairs), (B) BYOL (feature-consistency learning with positive pairs only, using a momentum-updated target network), and (C) MAE (masked signal modeling via reconstruction of masked ECG segments).
Figure 1.
Overview of OpenECG. Top: data collection from nine public 12-lead ECG datasets worldwide, self-supervised pre-training pipeline, and cross-institutional generalizability testing. Bottom: the three evaluated SSL paradigms—(A) SimCLR (contrastive learning with positive and negative pairs), (B) BYOL (feature-consistency learning with positive pairs only, using a momentum-updated target network), and (C) MAE (masked signal modeling via reconstruction of masked ECG segments).
2. Results
2.1. Cross-Institutional Generalization
To assess how well SSL-trained models generalize to unseen institutions, we employed a leave-one-dataset-out (LODO) protocol: for each of six labeled datasets, we pre-trained on all remaining data and evaluated on the held-out dataset as an independent test set. This protocol simulates the clinically realistic scenario of deploying a pre-trained model at a new institution without local training data.
Table 1 and Figure 2 present the LODO results. All three SSL methods substantially outperformed random initialization (consistently 3–8% lower AUROC across datasets). Performance was broadly comparable on well-standardized datasets (Chapman, PTB-XL; ), but the performance gap widened substantially on high-variability datasets. On Georgia, BYOL achieved an F1-score of 0.262 compared to only 0.123 for SimCLR—a 113% relative improvement. On INCART, MAE outperformed SimCLR by 1.4% in AUROC (0.712 vs. 0.698).
2.2. Impact of Dataset Inclusion in Pre-Training
To disentangle the contribution of each dataset to cross-institutional generalization, we compared model performance with and without the target dataset included in pre-training (Table 2, Figure 3).
The inclusion benefit varied systematically with dataset variability. INCART and CPSC showed the largest improvements when included: BYOL gained +4.2% AUROC on INCART and +3.8% on CPSC. Well-standardized datasets showed minimal benefit (Chapman ≤1.1%, PTB-XL ≤1.5%). The method-by-dataset interaction was statistically significant (two-way ANOVA: , ). BYOL showed the largest average inclusion benefit (+2.8%), followed by MAE (+2.2%) and SimCLR (+1.9%).
2.3. Pre-Training Data Scaling Behavior
We systematically varied the pre-training data volume from 1% to 100% in logarithmic increments (Figure 4). Three distinct scaling regimes emerged:
Rapid learning phase (1–30% data). All methods showed steep performance gains (8–15 AUROC percentage points). MAE exhibited the fastest initial learning rate on larger datasets.
Diminishing returns phase (30–70% data). BYOL and MAE reached >95% of their maximum AUROC by approximately 60–70% of total data.
Saturation phase (70–100% data). BYOL and MAE showed marginal improvements (<0.5% AUROC), while SimCLR continued to improve up to 80–90% of data before plateauing—reflecting its reliance on diverse negative pairs.
2.4. Label Efficiency Under Few-Shot Regimes
We evaluated fine-tuning performance using 1%, 5%, 10%, 50%, and 100% of available diagnostic labels (Figure 5, Table 3).
At 10% labeled data, BYOL achieved an average of 94% of its full-data performance, compared to 88% for SimCLR and only 78% for random initialization. This means BYOL requires roughly 10× less labeled data than training from scratch to achieve 90% of the best possible performance. The label-efficiency gap was largest on Georgia (BYOL at 10%: 0.510 AUROC; random at 10%: 0.418; ). At 50% labels the gap narrowed to <2%.
2.5. Representation Quality: Linear Probing
To characterize the quality of learned representations independent of fine-tuning capacity, we trained a single linear classification layer on frozen pre-trained features (Table 4, Figure 6).
BYOL and MAE produced consistently higher linear probing performance than SimCLR (mean AUROC: 0.779 and 0.773 vs. 0.750). The differences were statistically significant (BYOL vs. SimCLR: , ; MAE vs. SimCLR: , ), while the difference between BYOL and MAE was not significant (, ). SimCLR showed the largest gap between fine-tuned and linear-probe performance (mean : 7.5%), while BYOL’s gap was smallest (3.9%).
2.6. Cross-Domain Transfer Robustness
For each ordered pair of labeled datasets with , we fine-tuned the pre-trained model on dataset A and evaluated on dataset B (Figure 7). BYOL and MAE achieved higher mean off-diagonal transfer AUROC (0.749 and 0.750) than SimCLR (0.740). The strongest cross-domain transfer occurred between CPSC and Chapman (mean AUROC 0.89); the largest domain gap was observed when Georgia served as the source (mean target AUROC: 0.68).
2.7. Augmentation Strategy Ablation
Starting from the full augmentation pipeline (temporal masking, lead masking, Gaussian noise, amplitude scaling, baseline wander), we removed each component individually (Figure 8, Table 5).
Lead masking is the most critical augmentation. Removing it produced the largest performance drop: −2.5% for SimCLR, −1.9% for BYOL, and −0.8% for MAE. Lead masking forces the model to learn cross-lead dependencies encoding critical diagnostic information.
Temporal masking ranks second. Removing it caused drops of −1.8% (SimCLR), −1.2% (BYOL), and −0.6% (MAE).
SimCLR is most sensitive to augmentation; MAE is most robust. Without all augmentations, SimCLR dropped 6.2% vs. only 2.2% for MAE—a 3× sensitivity difference. Gaussian noise () and baseline wander () had minimal impact on all methods.
2.8. Representation Space Visualization
t-SNE visualization on a held-out Chapman subset comprising six cardiac conditions (Figure 9) showed that BYOL representations had the tightest within-class clustering and clearest between-class separation, consistent with its highest linear probing performance. MAE produced intermediate clustering quality, while SimCLR representations were the most diffuse.
2.9. Comparison with Prior SSL-Based ECG Models
Table 6 benchmarks OpenECG against published SSL-based ECG approaches. On CPSC, our MAE achieved F1/AUROC of 74.5/93.2, competitive with MERL (72.8/92.6) and approaching ECG-Chat (80.1/95.7). On Chapman, SimCLR achieved 52.3/95.1, substantially outperforming 3KG (43.2/88.3). A critical distinction is evaluation breadth: while most prior models report results on 1–3 datasets, OpenECG evaluates on six independent datasets across four countries.
2.10. Multi-Dimensional Method Comparison
Figure 10 synthesizes the three SSL methods across six evaluation dimensions: mean AUROC, mean F1, linear probing quality, data efficiency, cross-institutional robustness, and low-data performance. BYOL and MAE dominate SimCLR on four of six dimensions (data efficiency, linear probing, cross-institutional robustness, low-data performance), while SimCLR maintains a slight edge in mean AUROC.
3. Discussion
This study establishes OpenECG as the first open, standardized benchmark for systematic comparison of SSL strategies on multi-center ECG data.
3.1. Feature-Consistency and Generative SSL Outperform Contrastive Learning
BYOL and MAE consistently surpassed SimCLR across all evaluation axes. The mechanistic explanation centers on the role of negative pairs: SimCLR’s contrastive objective maximizes agreement between augmented views of the same recording while pushing apart views from different recordings. In highly heterogeneous multi-center data, two recordings from different institutions may differ more in acquisition characteristics than in cardiac pathology, causing the model to learn institutional signatures rather than cardiac features. BYOL avoids this problem by using only positive pairs; MAE sidesteps it by framing the pretext task as signal reconstruction. Our findings parallel recent observations in computer vision, where BYOL and DINO [14] have shown advantages over SimCLR on diverse datasets [15], and extend them to the ECG domain.
3.2. Dataset Diversity Supersedes Volume
INCART, with only 75 recordings but highly distinctive characteristics (257 Hz, 30-minute duration), provided a +4.2% inclusion benefit for BYOL—comparable to or larger than the benefit from much larger but more standardized datasets. This finding challenges the prevailing “more data is always better” paradigm and suggests that strategic curation emphasizing diversity in recording conditions, sampling rates, durations, and patient demographics may be more resource-efficient than accumulating homogeneous data from a single institution.
3.3. SSL Dramatically Reduces Annotation Requirements
BYOL achieves 94% of its full-data performance with only 10% of labeled data (vs. 78% for random initialization), enabling an order-of-magnitude reduction in annotation burden. These results have direct practical implications: in clinical settings where cardiologist annotation time is the primary bottleneck, SSL pre-training can dramatically reduce the annotation budget without substantially compromising performance.
3.4. Augmentation Design Is Critical and Method-Dependent
Lead masking is the most critical augmentation ( up to −2.5%), as it forces the model to learn cross-lead dependencies encoding critical spatial information about cardiac electrical activity propagation. The 3× sensitivity difference between SimCLR and MAE provides practical guidance: when optimal augmentation strategies are unknown, MAE-style generative approaches offer a safer starting point because they are less dependent on augmentation design.
3.5. Limitations
Several limitations should be acknowledged. First, we evaluate three SSL methods but do not cover all recent variants (e.g., VICReg, Barlow Twins, DINO, data2vec). Second, the benchmark is limited to 12-lead hospital ECG; wearable single-lead data warrants separate benchmarking. Third, SimCLR and BYOL use ResNet-50 while MAE uses ViT-Base, confounding the SSL objective and backbone architecture. Fourth, our evaluation focuses on classification of 24 conditions; risk stratification tasks require external outcome data. Fifth, we do not evaluate in prospective clinical settings. Finally, demographic information is inconsistently available, limiting fairness analysis.
4. Materials and Methods
4.1. Study Design and Data Sources
OpenECG integrates nine publicly available twelve-lead ECG datasets encompassing 1,233,337 recordings from 483,837 patients across four countries (Table 7). Two large-scale datasets—MIMIC-IV-ECG [16] (800,035 recordings) and CODE-15 [17] (341,292 recordings)—served as unlabeled pre-training data. Six labeled datasets from the PhysioNet Challenge 2020 [18] (CPSC, Georgia, PTB, PTB-XL, St. Petersburg INCART) and Chapman-Shaoxing [19] provided supervised evaluation data covering 24 cardiac conditions defined by SNOMED CT codes [20].

Table 7.
Key characteristics of ECG datasets in OpenECG. “Labeled” datasets provide diagnostic labels for evaluation; “Unlabeled” datasets provide pre-training data without labels.
Table 7.
Key characteristics of ECG datasets in OpenECG. “Labeled” datasets provide diagnostic labels for evaluation; “Unlabeled” datasets provide pre-training data without labels.
| Dataset | #Patients | #Recordings | Duration | Hz | Country | Role |
|---|---|---|---|---|---|---|
| MIMIC-IV | 161,352 | 800,035 | 10 s | 500 | USA | Unlabeled |
| CODE-15 | 233,770 | 341,292 | 7–10 s | 400 | Brazil | Unlabeled |
| CPSC | 14,053 | 14,053 | 6–60 s | 500 | China | Labeled |
| Georgia | 10,344 | 10,344 | 10 s | 500 | USA | Labeled |
| PTB | 249 | 549 | var. | 1000 | Germany | Labeled |
| PTB-XL | 18,885 | 21,837 | 10 s | 500 | Germany | Labeled |
| St. Pet. | 32 | 75 | 30 min | 257 | Russia | Labeled |
| Chapman | 45,152 | 45,152 | 10 s | 500 | China | Labeled |
| Total | 483,837 | 1,233,337 |
4.2. Data Preprocessing and Standardization
All ECG recordings were standardized to a uniform format of time points through linear interpolation resampling. For recordings shorter than the target length, zero-padding was applied at the end. For recordings longer than 10 seconds, a random 10-second segment was extracted during training, while the first 10 seconds were used during evaluation. Each lead was independently normalized to zero mean and unit variance. Recordings with flat-line segments (amplitude variance ) on any lead were excluded. Data splits were performed strictly at the patient level to prevent data leakage.
4.3. Self-Supervised Pre-Training Methods
We evaluated three representative SSL paradigms:
SimCLR [6] (Contrastive learning): Two augmented views of each ECG recording are passed through a shared ResNet-50 encoder [21] and projection MLP. The NT-Xent loss maximizes agreement between views of the same recording while pushing apart views from different recordings. We used temperature and batch size 256.
BYOL [7] (Feature-consistency learning): An online network (encoder + projector + predictor) learns to predict the output of a target network applied to a different augmented view. The target network is updated via exponential moving average () of the online network. No negative pairs required. ResNet-50 backbone.
MAE [8] (Masked signal modeling): The input ECG is divided into patches, 75% of which are randomly masked. A Vision Transformer (ViT-Base [22]) encoder processes only the visible patches, and a lightweight decoder reconstructs the masked patches using MSE loss.
All models were pre-trained for 200 epochs using the AdamW optimizer with cosine learning rate scheduling (initial LR: , minimum: , weight decay: 0.05, warmup: 10 epochs).
4.4. Data Augmentation Strategies
We employed five ECG-specific augmentation strategies:
- 1.
- Temporal masking: A contiguous block of 100 time points (10% of the signal) is set to zero at a random position.
- 2.
- Lead masking: 1–3 leads are randomly selected and set to zero.
- 3.
- Gaussian noise: Additive noise with applied to all leads.
- 4.
- Amplitude scaling: Random multiplicative factor sampled uniformly from .
- 5.
- Baseline wander: Sinusoidal drift with random frequency (0.1–0.5 Hz) and amplitude (0–0.2 mV).
4.5. Evaluation Protocols
Leave-one-dataset-out (LODO). For each of six labeled datasets, the model was pre-trained on all remaining data and the held-out dataset served as an independent test set.
Pre-training data scaling. Pre-training data volume was varied from 1% to 100% (1%, 5%, 10%, 20%, 30%, 50%, 70%, 80%, 90%, 100%).
Few-shot label efficiency. Fine-tuning with 1%, 5%, 10%, 50%, and 100% of available labeled data. A randomly initialized baseline was trained under the same conditions.
Linear probing. A single linear classification layer trained on frozen pre-trained representations.
Cross-domain transfer. For each ordered pair of labeled datasets , the pre-trained model was fine-tuned on A and evaluated on B.
Augmentation ablation. Each augmentation component was individually removed, plus a control with all augmentations removed.
4.6. Evaluation Metrics and Statistical Analysis
Primary metrics include macro-averaged AUROC and F1-score for multi-label classification of 24 cardiac conditions. All reported metrics include 95% confidence intervals computed via 1,000-iteration bootstrap resampling with patient-level stratification. Between-method comparisons were assessed using paired bootstrap tests with Bonferroni correction. The interaction between SSL method and dataset characteristics was tested using two-way ANOVA. All statistical analyses were performed in Python 3.10 using scikit-learn, scipy, and statsmodels.
4.7. Computational Resources
All experiments were conducted on a computing cluster with NVIDIA A100 GPUs (80 GB VRAM). Pre-training each SSL method required approximately 48 hours on 4×A100 GPUs. The total computational budget was approximately 2,400 GPU-hours.
5. Conclusions
OpenECG provides the first systematic, head-to-head comparison of SSL strategies for multi-center ECG analysis. Our principal findings are:
- 1.
- BYOL and MAE outperform SimCLR across all evaluation axes, with advantages most pronounced on high-variability datasets and in low-label regimes.
- 2.
- Dataset diversity supersedes volume: heterogeneous curation yields better generalization than large homogeneous collections.
- 3.
- SSL reduces annotation requirements by ∼10×: BYOL achieves 94% of full-data performance with only 10% of labels.
- 4.
- Lead masking and temporal masking are the most critical augmentation components; contrastive methods are substantially more augmentation-sensitive than generative methods.
These results offer actionable, evidence-based guidance for SSL strategy selection and establish an open, reproducible benchmark to accelerate progress in AI-driven cardiovascular diagnostics.
Author Contributions
Conceptualization, C.D. and W.D.; methodology, C.D. and Q.Y.; software, Q.Y. and J.M.; validation, C.D., Q.Y. and Z.W.; formal analysis, Q.Y.; investigation, J.M. and Z.W.; data curation, Q.Y. and J.M.; writing—original draft preparation, C.D. and Q.Y.; writing—review and editing, W.D. and Z.W.; visualization, Q.Y.; supervision, C.D. and W.D.; project administration, C.D.; funding acquisition, C.D. and W.D. All authors have read and agreed to the published version of the manuscript.
Funding
This research is supported by Supported by the National Natural Science Foundation of China, Grant No. 32541017 and the Opening Foundation of the State Key Laboratory of Transvascular Implantation Devices, grant NO.SKLTID2025102.
Institutional Review Board Statement
Not applicable.
Informed Consent Statement
Not applicable.
Conflicts of Interest
The authors declare no conflicts of interest.
Abbreviations
The following abbreviations are used in this manuscript:
| SSL | Self-supervised learning |
| ECG | Electrocardiogram |
| AUROC | Area under the receiver operating characteristic curve |
| LODO | Leave-one-dataset-out |
| SimCLR | Simple Contrastive Learning of Representations |
| BYOL | Bootstrap Your Own Latent |
| MAE | Masked Autoencoder |
| EMA | Exponential moving average |
| ViT | Vision Transformer |
| CVD | Cardiovascular disease |
| CI | Confidence interval |
References
- World Health Organization. Cardiovascular diseases (CVDs). WHO Fact Sheet 2021.
- Salerno, S.M.; Alguire, P.C.; Waxman, H.S. Competency in interpretation of 12-lead electrocardiograms: a summary and appraisal of published evidence. Ann. Intern. Med. 2003, 138, 751–760. [Google Scholar] [CrossRef] [PubMed]
- Schläpfer, J.; Wellens, H.J. Computer-interpreted electrocardiograms: benefits and limitations. J. Am. Coll. Cardiol. 2017, 70, 1183–1192. [Google Scholar] [CrossRef] [PubMed]
- Hannun, A.Y.; Rajpurkar, P.; Haghpanahi, M.; et al. Cardiologist-level arrhythmia detection and classification in ambulatory electrocardiograms using a deep neural network. Nat. Med. 2019, 25, 65–69. [Google Scholar] [CrossRef] [PubMed]
- Ribeiro, A.H.; Ribeiro, M.H.; Paixão, G.M.; et al. Automatic diagnosis of the 12-lead ECG using a deep neural network. Nat. Commun. 2020, 11, 1760. [Google Scholar] [CrossRef] [PubMed]
- Chen, T.; Kornblith, S.; Norouzi, M.; Hinton, G. A simple framework for contrastive learning of visual representations. In Proceedings of the International Conference on Machine Learning, 2020, pp. 1597–1607.
- Grill, J.B.; et al. Bootstrap your own latent – a new approach to self-supervised learning. In Proceedings of the Advances in Neural Information Processing Systems, 2020, Vol. 33, pp. 21271–21284.
- He, K.; Chen, X.; Xie, S.; Li, Y.; Dollár, P.; Girshick, R. Masked autoencoders are scalable vision learners. In Proceedings of the IEEE/CVF Conference on Computer Vision and Pattern Recognition, 2022, pp. 16000–16009.
- 3KG Team. 3KG: Contrastive learning for ECG signals. arXiv 2024.
- Kiyasseh, D.; Zhu, T.; Clifton, D.A. CLOCS: Contrastive learning of cardiac signals across space, time, and patients 2021. pp. 5606–5615.
- Zhao, Y.; et al. ECG-Chat: A large ECG-language model for cardiac disease diagnosis. arXiv 2024. [Google Scholar]
- MERL Team. MERL: Multi-modal ECG representation learning. arXiv 2024. [Google Scholar]
- MAEFE Team. MAEFE: Masked auto-encoder for ECG feature extraction. arXiv 2024. [Google Scholar]
- Caron, M.; Touvron, H.; Misra, I.; Jégou, H.; Mairal, J.; Bojanowski, P.; Joulin, A. Emerging properties in self-supervised vision transformers. In Proceedings of the IEEE/CVF International Conference on Computer Vision, 2021, pp. 9650–9660.
- Chen, X.; He, K. Exploring simple Siamese representation learning. IEEE/CVF Conference on Computer Vision and Pattern Recognition 2021, pp. 15750–15758.
- Gow, B.; et al. MIMIC-IV-ECG: Diagnostic electrocardiography at scale. Sci. Data 2023, 10, 784. [Google Scholar] [CrossRef]
- Ribeiro, A.H.; et al. CODE-15: A large-scale telehealth electrocardiogram dataset. Sci. Data 2021. [Google Scholar] [CrossRef]
- Alday, E.A.P.; et al. Classification of 12-lead ECGs: the PhysioNet/Computing in Cardiology Challenge 2020. Physiol. Meas. 2020, 41, 124003. [Google Scholar] [CrossRef]
- Zheng, J.; et al. A 12-lead electrocardiogram database for arrhythmia research covering more than 10,000 patients. Sci. Data 2020, 7, 48. [Google Scholar] [CrossRef] [PubMed]
- SNOMED International. SNOMED CT: Systematized Nomenclature of Medicine – Clinical Terms.
- He, K.; Zhang, X.; Ren, S.; Sun, J. Deep residual learning for image recognition. In Proceedings of the IEEE Conference on Computer Vision and Pattern Recognition, 2016, pp. 770–778.
- Dosovitskiy, A.; et al. An image is worth 16x16 words: Transformers for image recognition at scale. arXiv 2021, arXiv:2010.11929. [Google Scholar]
Figure 2.
LODO cross-institutional evaluation. (a) AUROC and (b) F1-score across six independent test datasets for SimCLR (red), BYOL (green), and MAE (blue). Error bars represent bootstrapped 95% confidence intervals (1,000 iterations). Performance differences between SSL methods are most pronounced on high-variability datasets (Georgia, INCART) and smallest on well-standardized datasets (Chapman, PTB-XL).
Figure 2.
LODO cross-institutional evaluation. (a) AUROC and (b) F1-score across six independent test datasets for SimCLR (red), BYOL (green), and MAE (blue). Error bars represent bootstrapped 95% confidence intervals (1,000 iterations). Performance differences between SSL methods are most pronounced on high-variability datasets (Georgia, INCART) and smallest on well-standardized datasets (Chapman, PTB-XL).
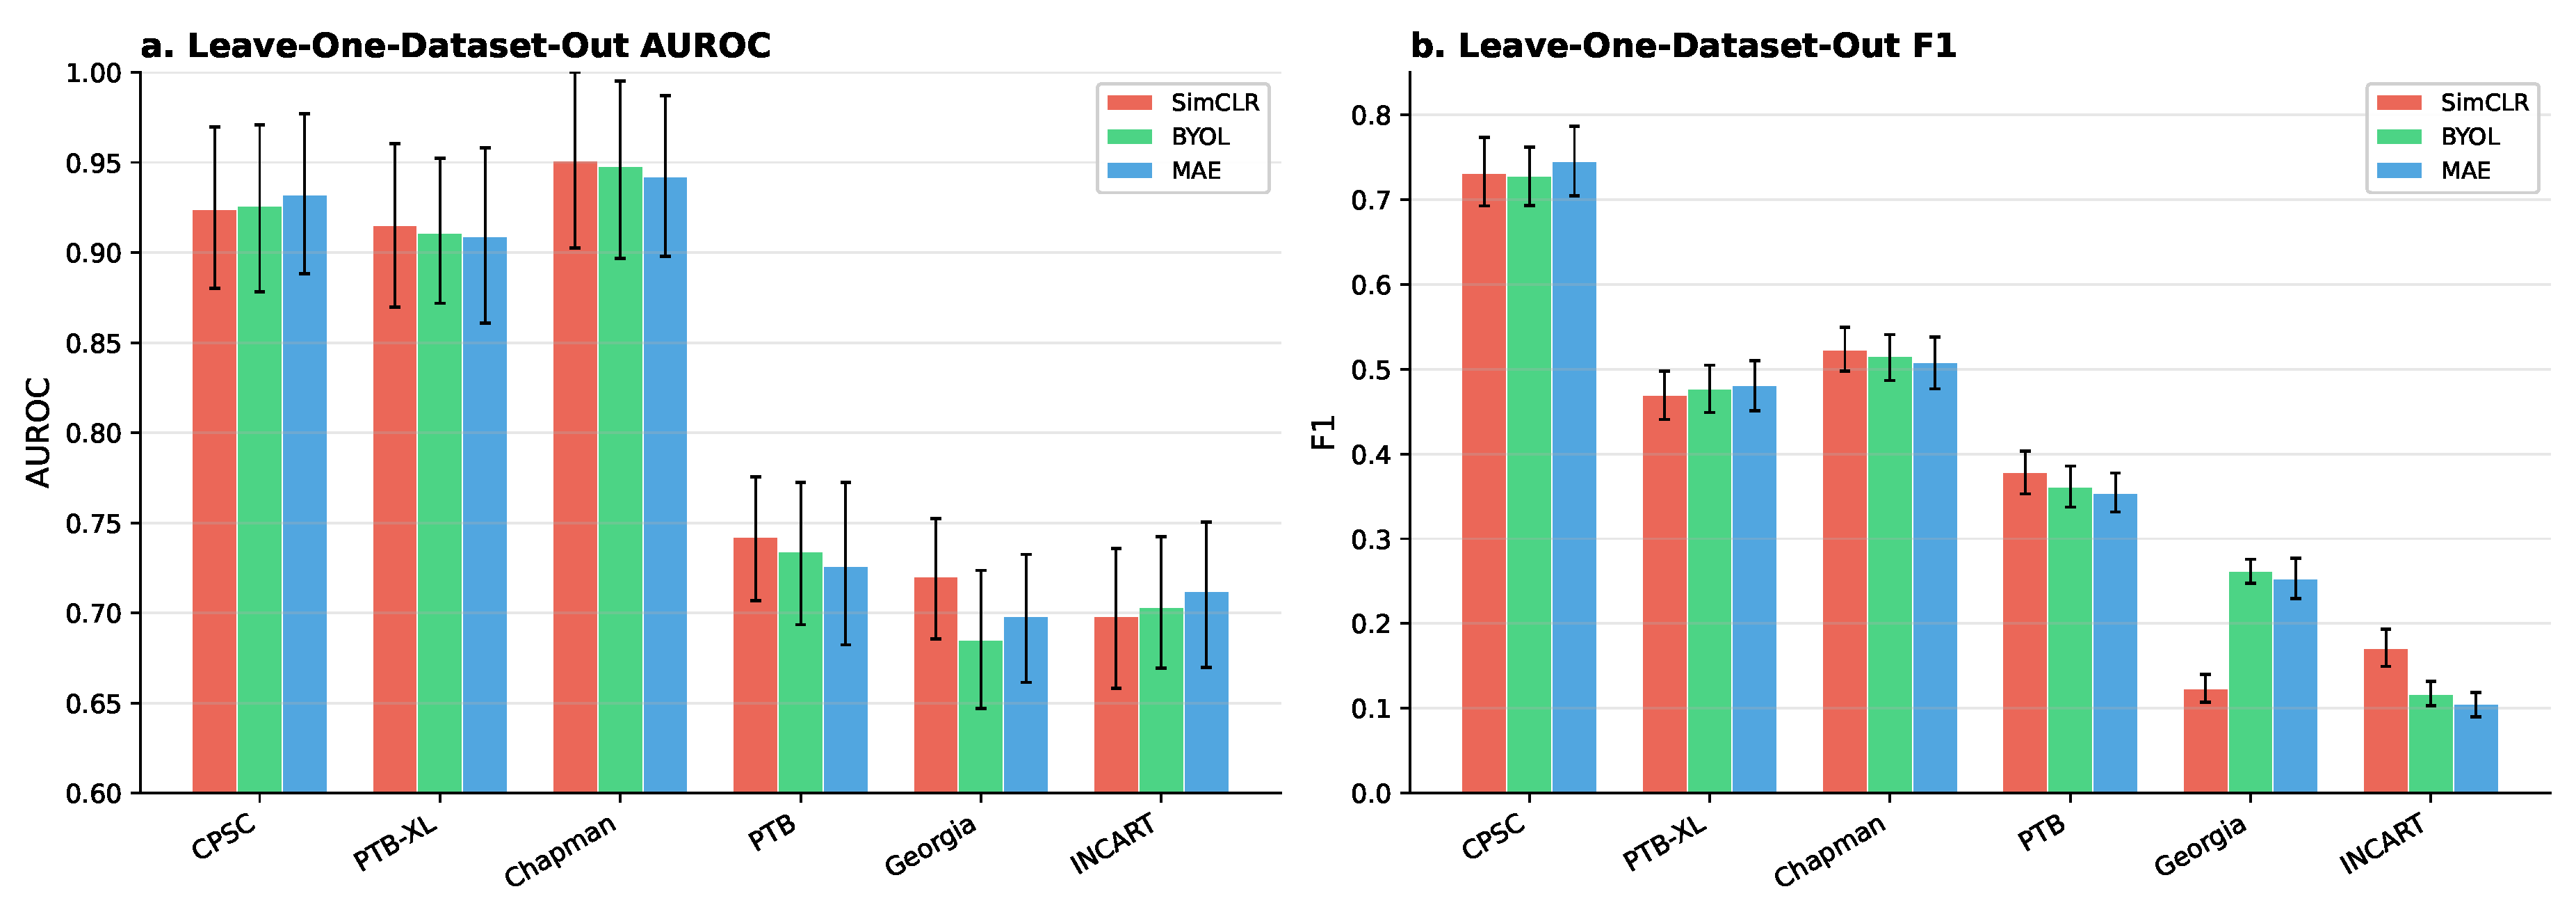
Figure 3.
Dataset inclusion effect heatmap. Relative AUROC improvement (%) when the target dataset is included vs. excluded from pre-training. High-variability datasets (INCART, CPSC, PTB) show the largest inclusion effects.
Figure 3.
Dataset inclusion effect heatmap. Relative AUROC improvement (%) when the target dataset is included vs. excluded from pre-training. High-variability datasets (INCART, CPSC, PTB) show the largest inclusion effects.
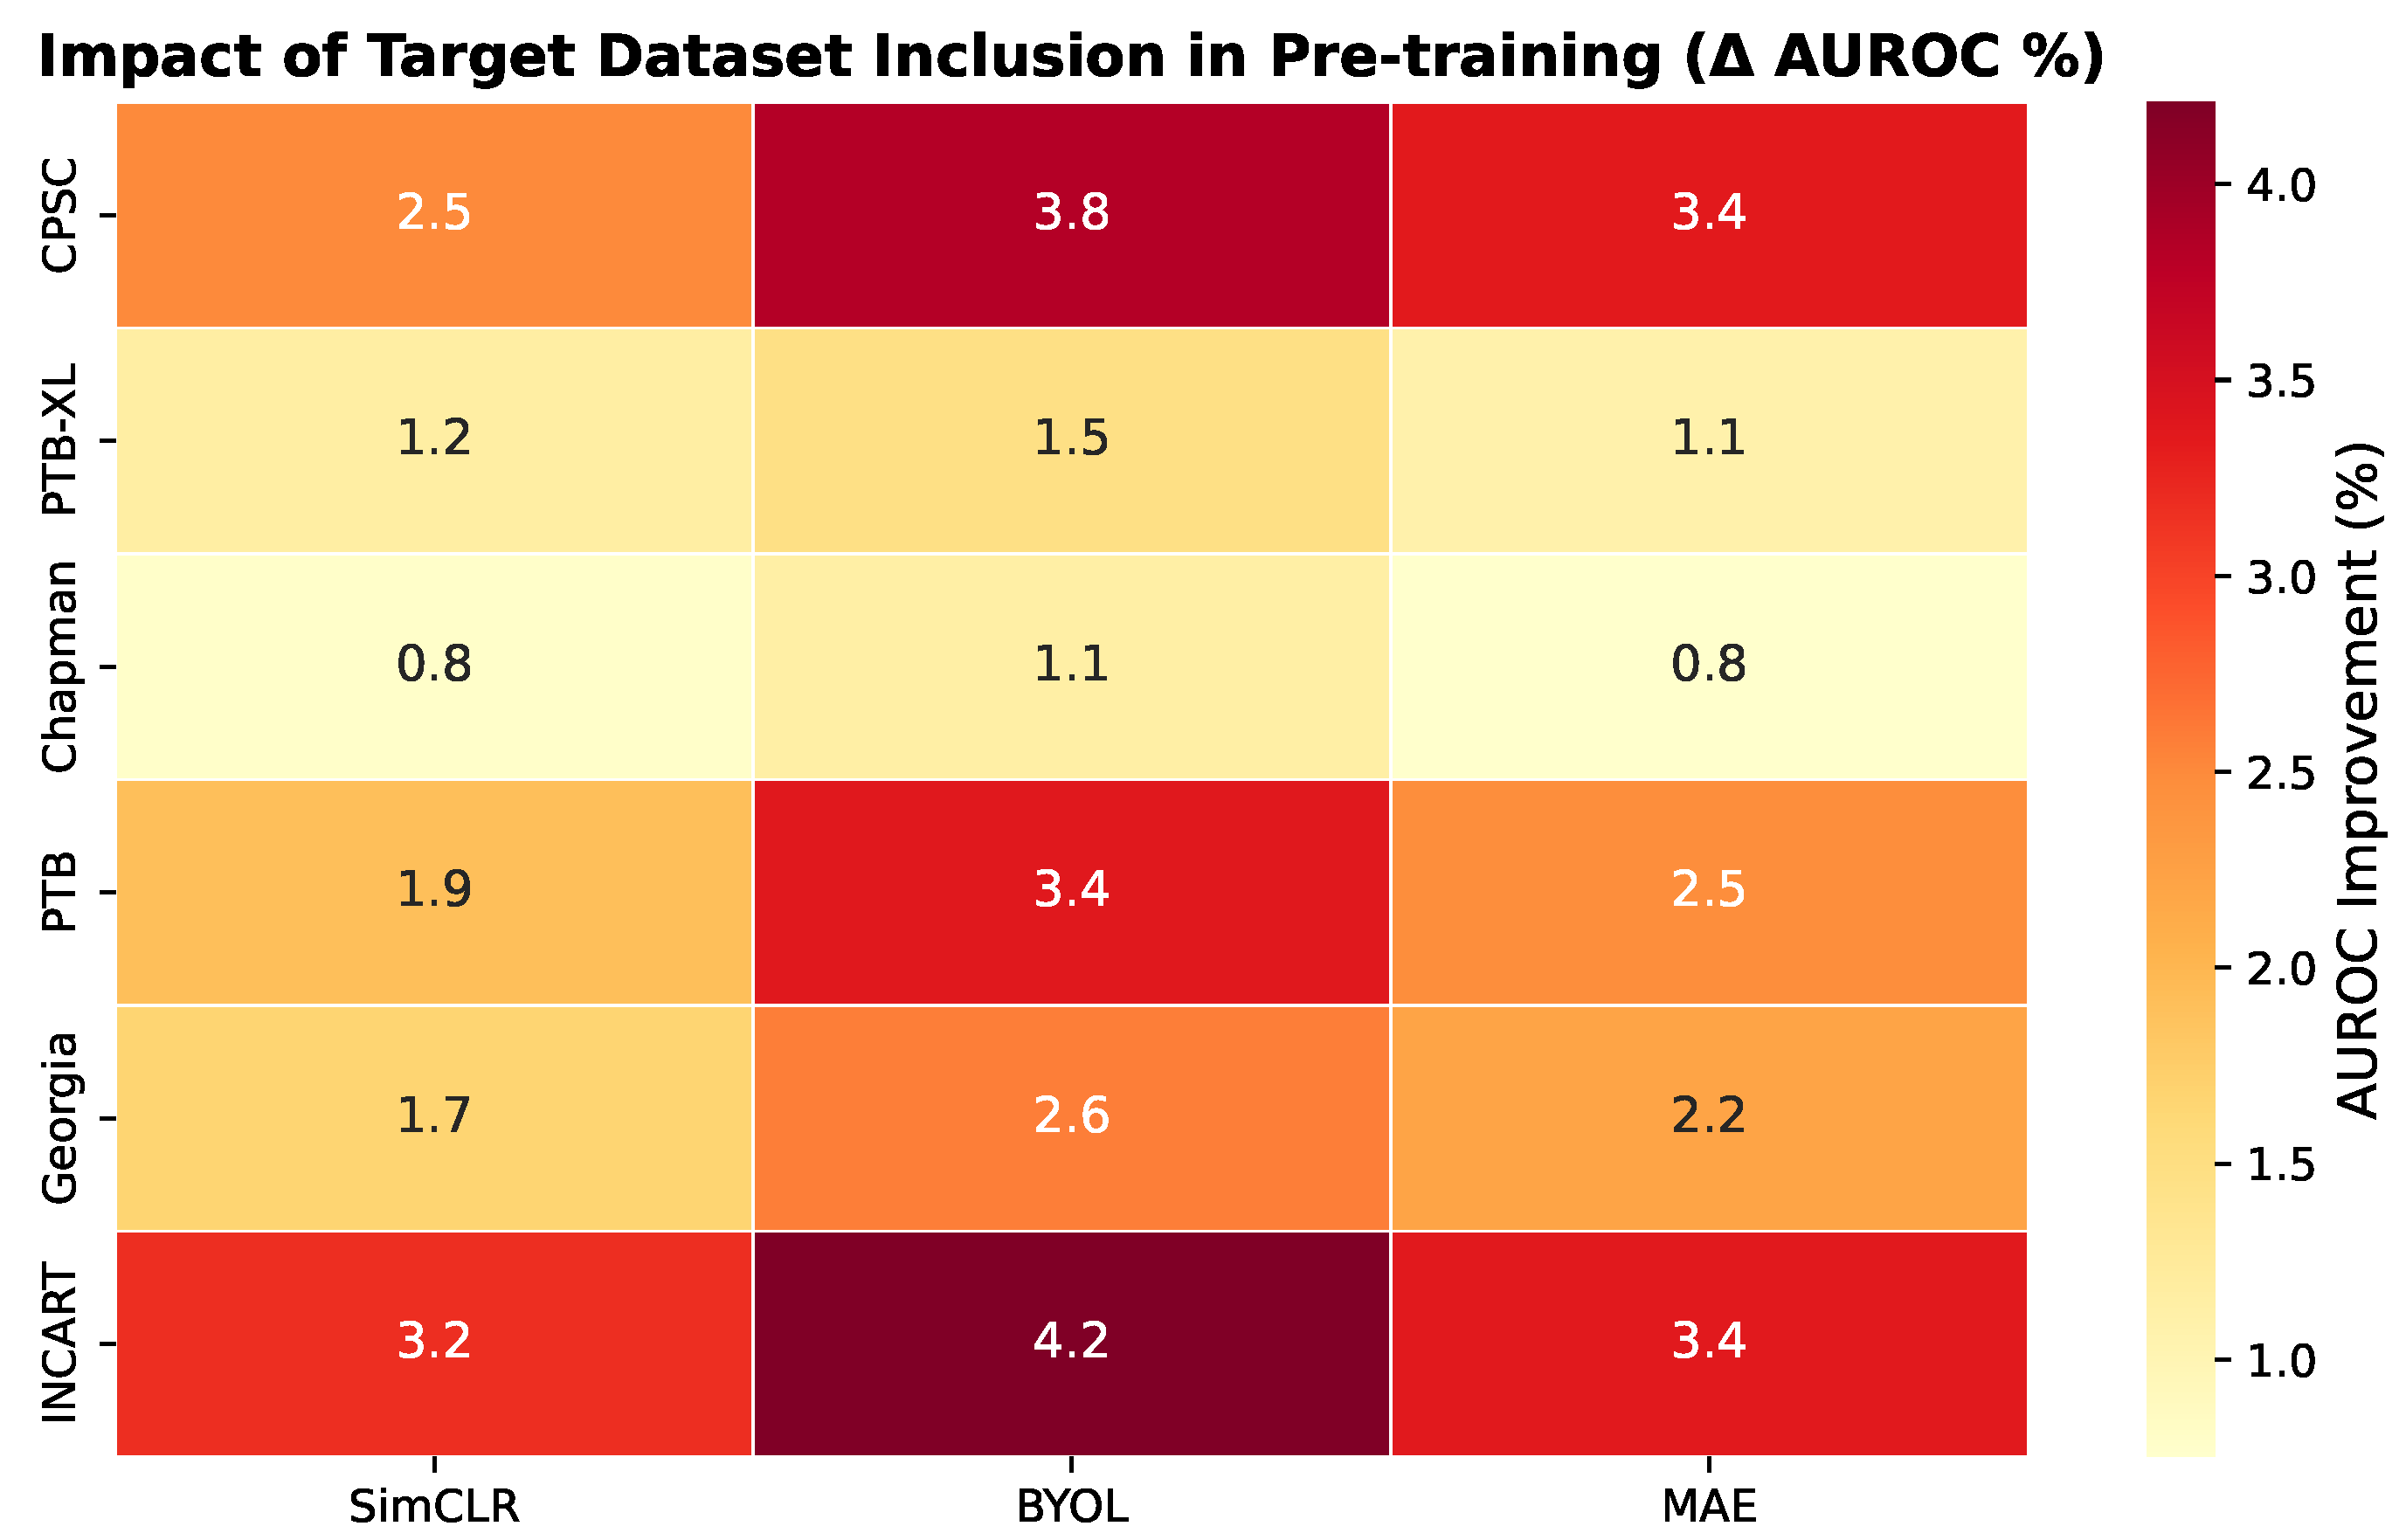
Figure 4.
Pre-training data scaling behavior. AUROC as a function of pre-training data volume (1–100%) for each dataset and SSL method. Green-shaded regions indicate the 60–70% saturation zone where BYOL and MAE reach >95% of their maximum performance.
Figure 4.
Pre-training data scaling behavior. AUROC as a function of pre-training data volume (1–100%) for each dataset and SSL method. Green-shaded regions indicate the 60–70% saturation zone where BYOL and MAE reach >95% of their maximum performance.
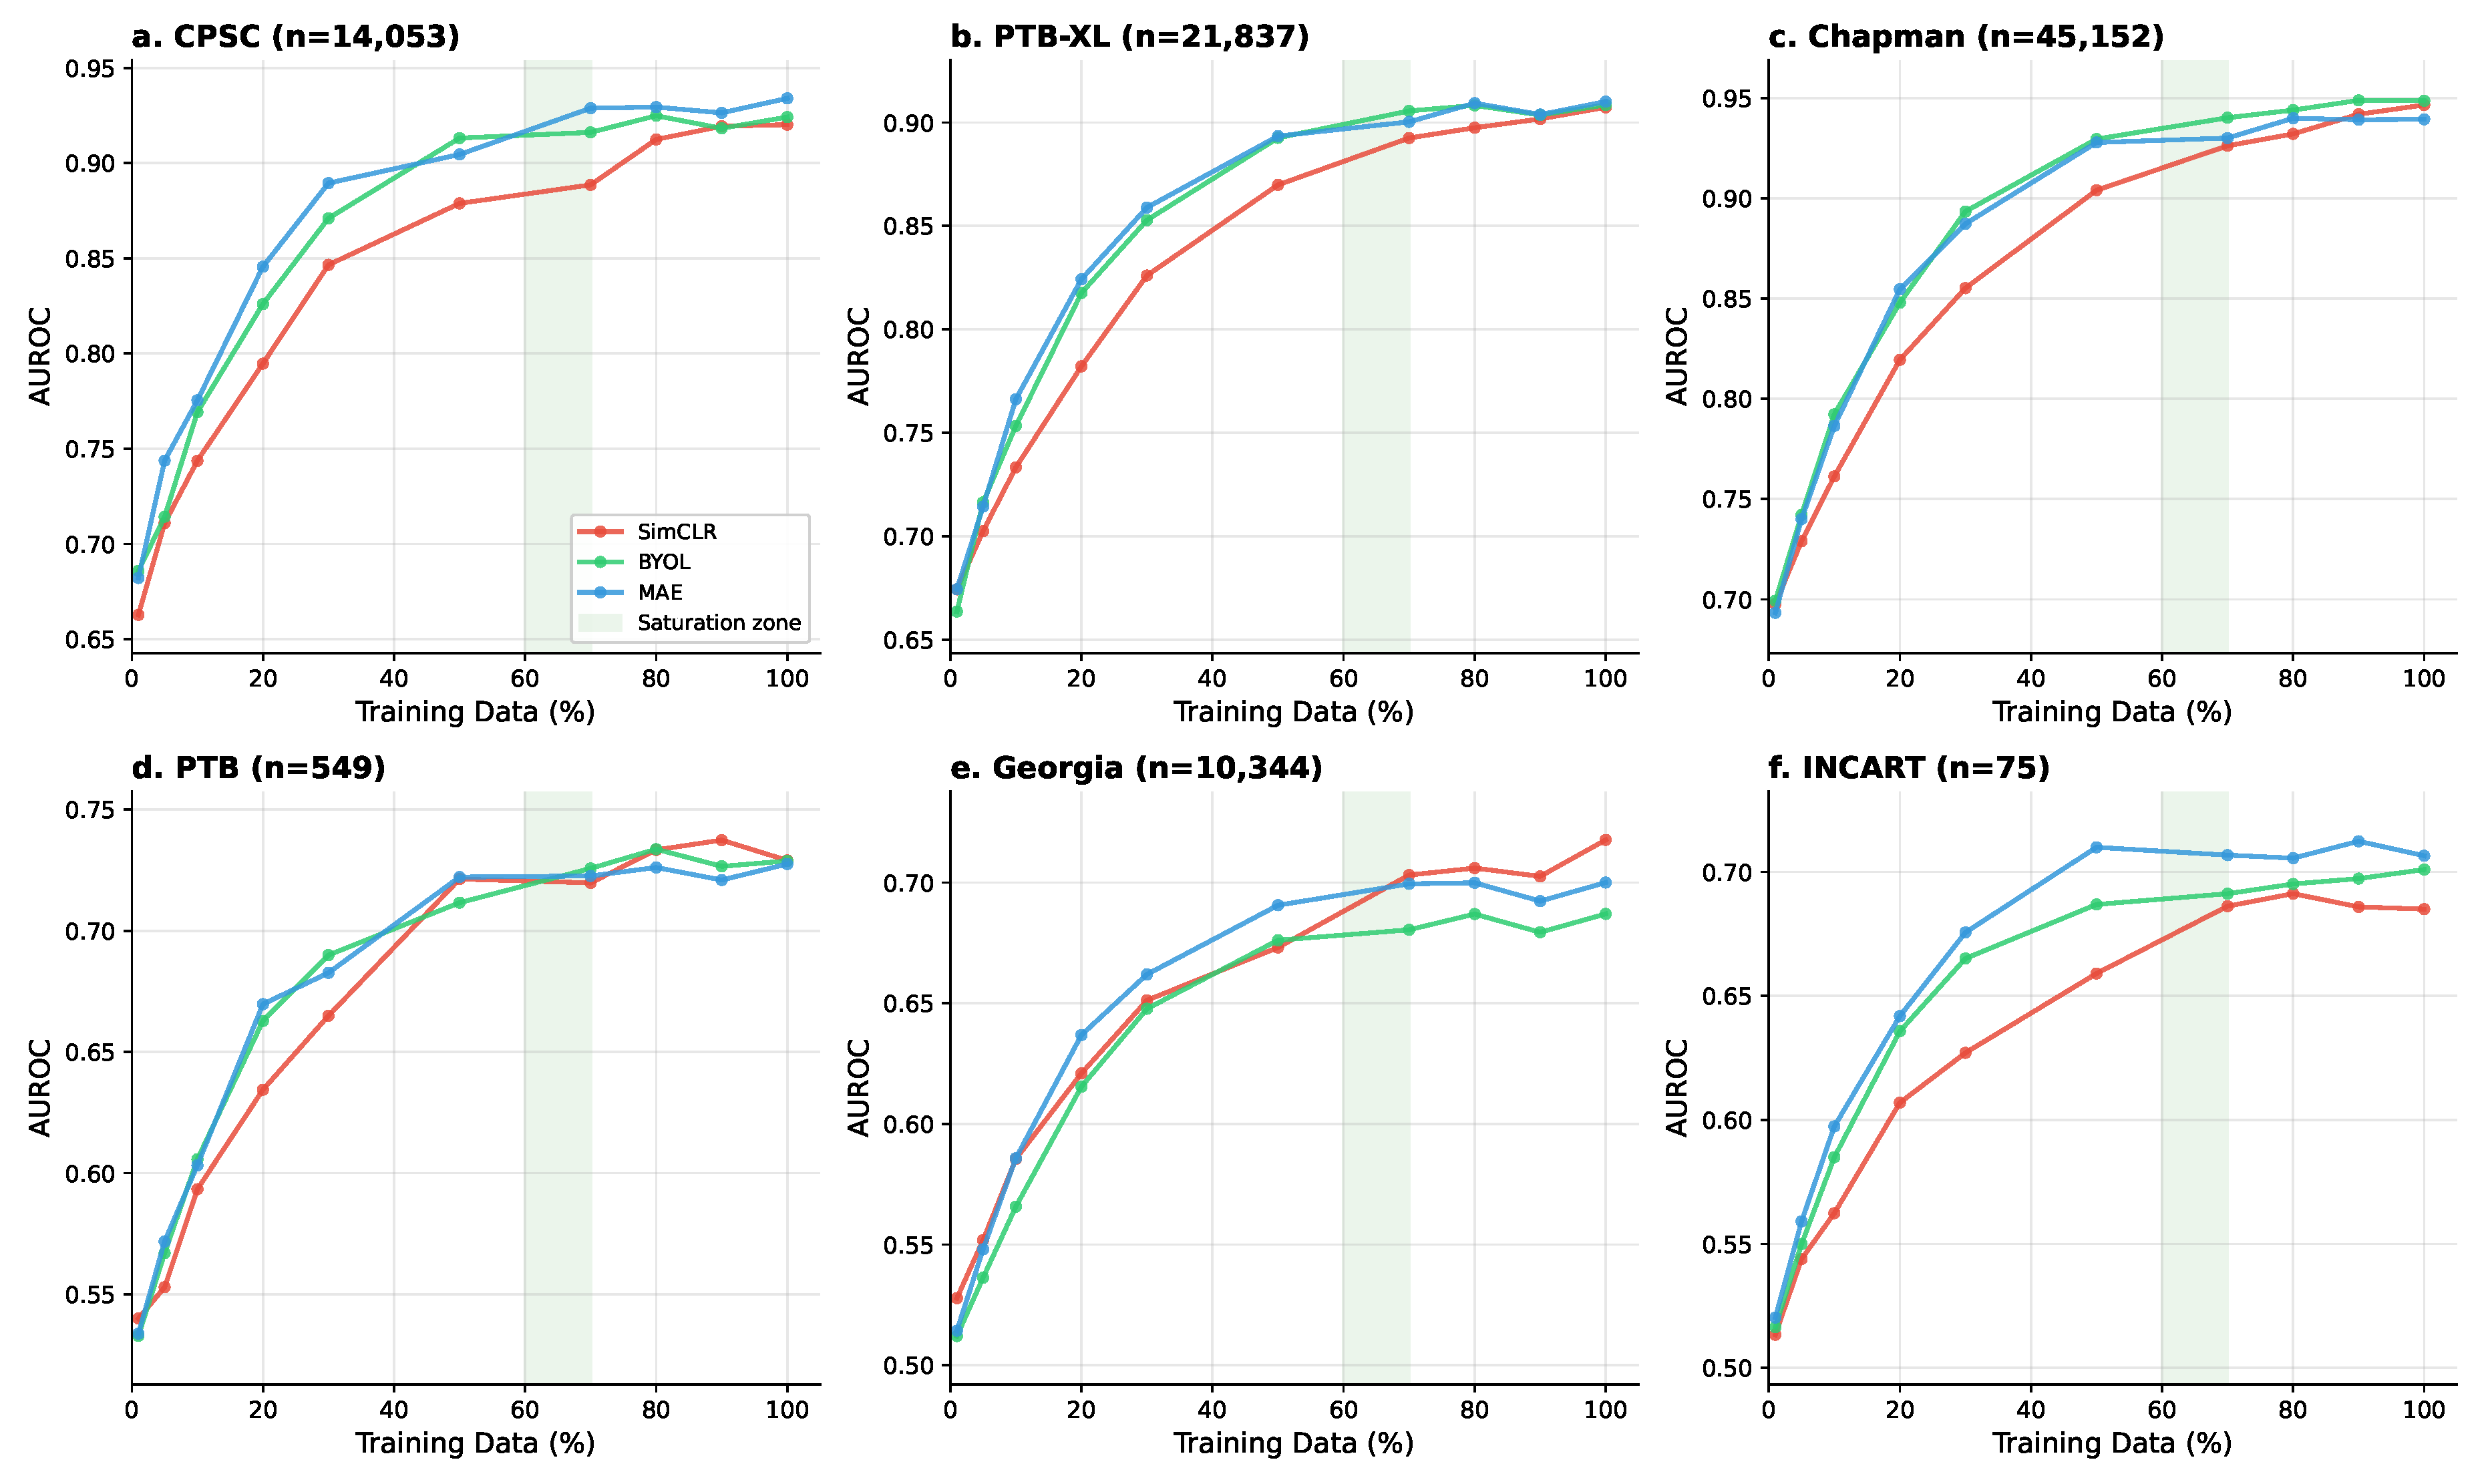
Figure 5.
Few-shot label efficiency. AUROC as a function of labeled data fraction (1–100%, log scale) for four evaluation datasets. Dashed lines: randomly initialized baseline. SSL pre-training provides the largest advantage in low-label regimes (≤10%), with BYOL showing the strongest label efficiency.
Figure 5.
Few-shot label efficiency. AUROC as a function of labeled data fraction (1–100%, log scale) for four evaluation datasets. Dashed lines: randomly initialized baseline. SSL pre-training provides the largest advantage in low-label regimes (≤10%), with BYOL showing the strongest label efficiency.
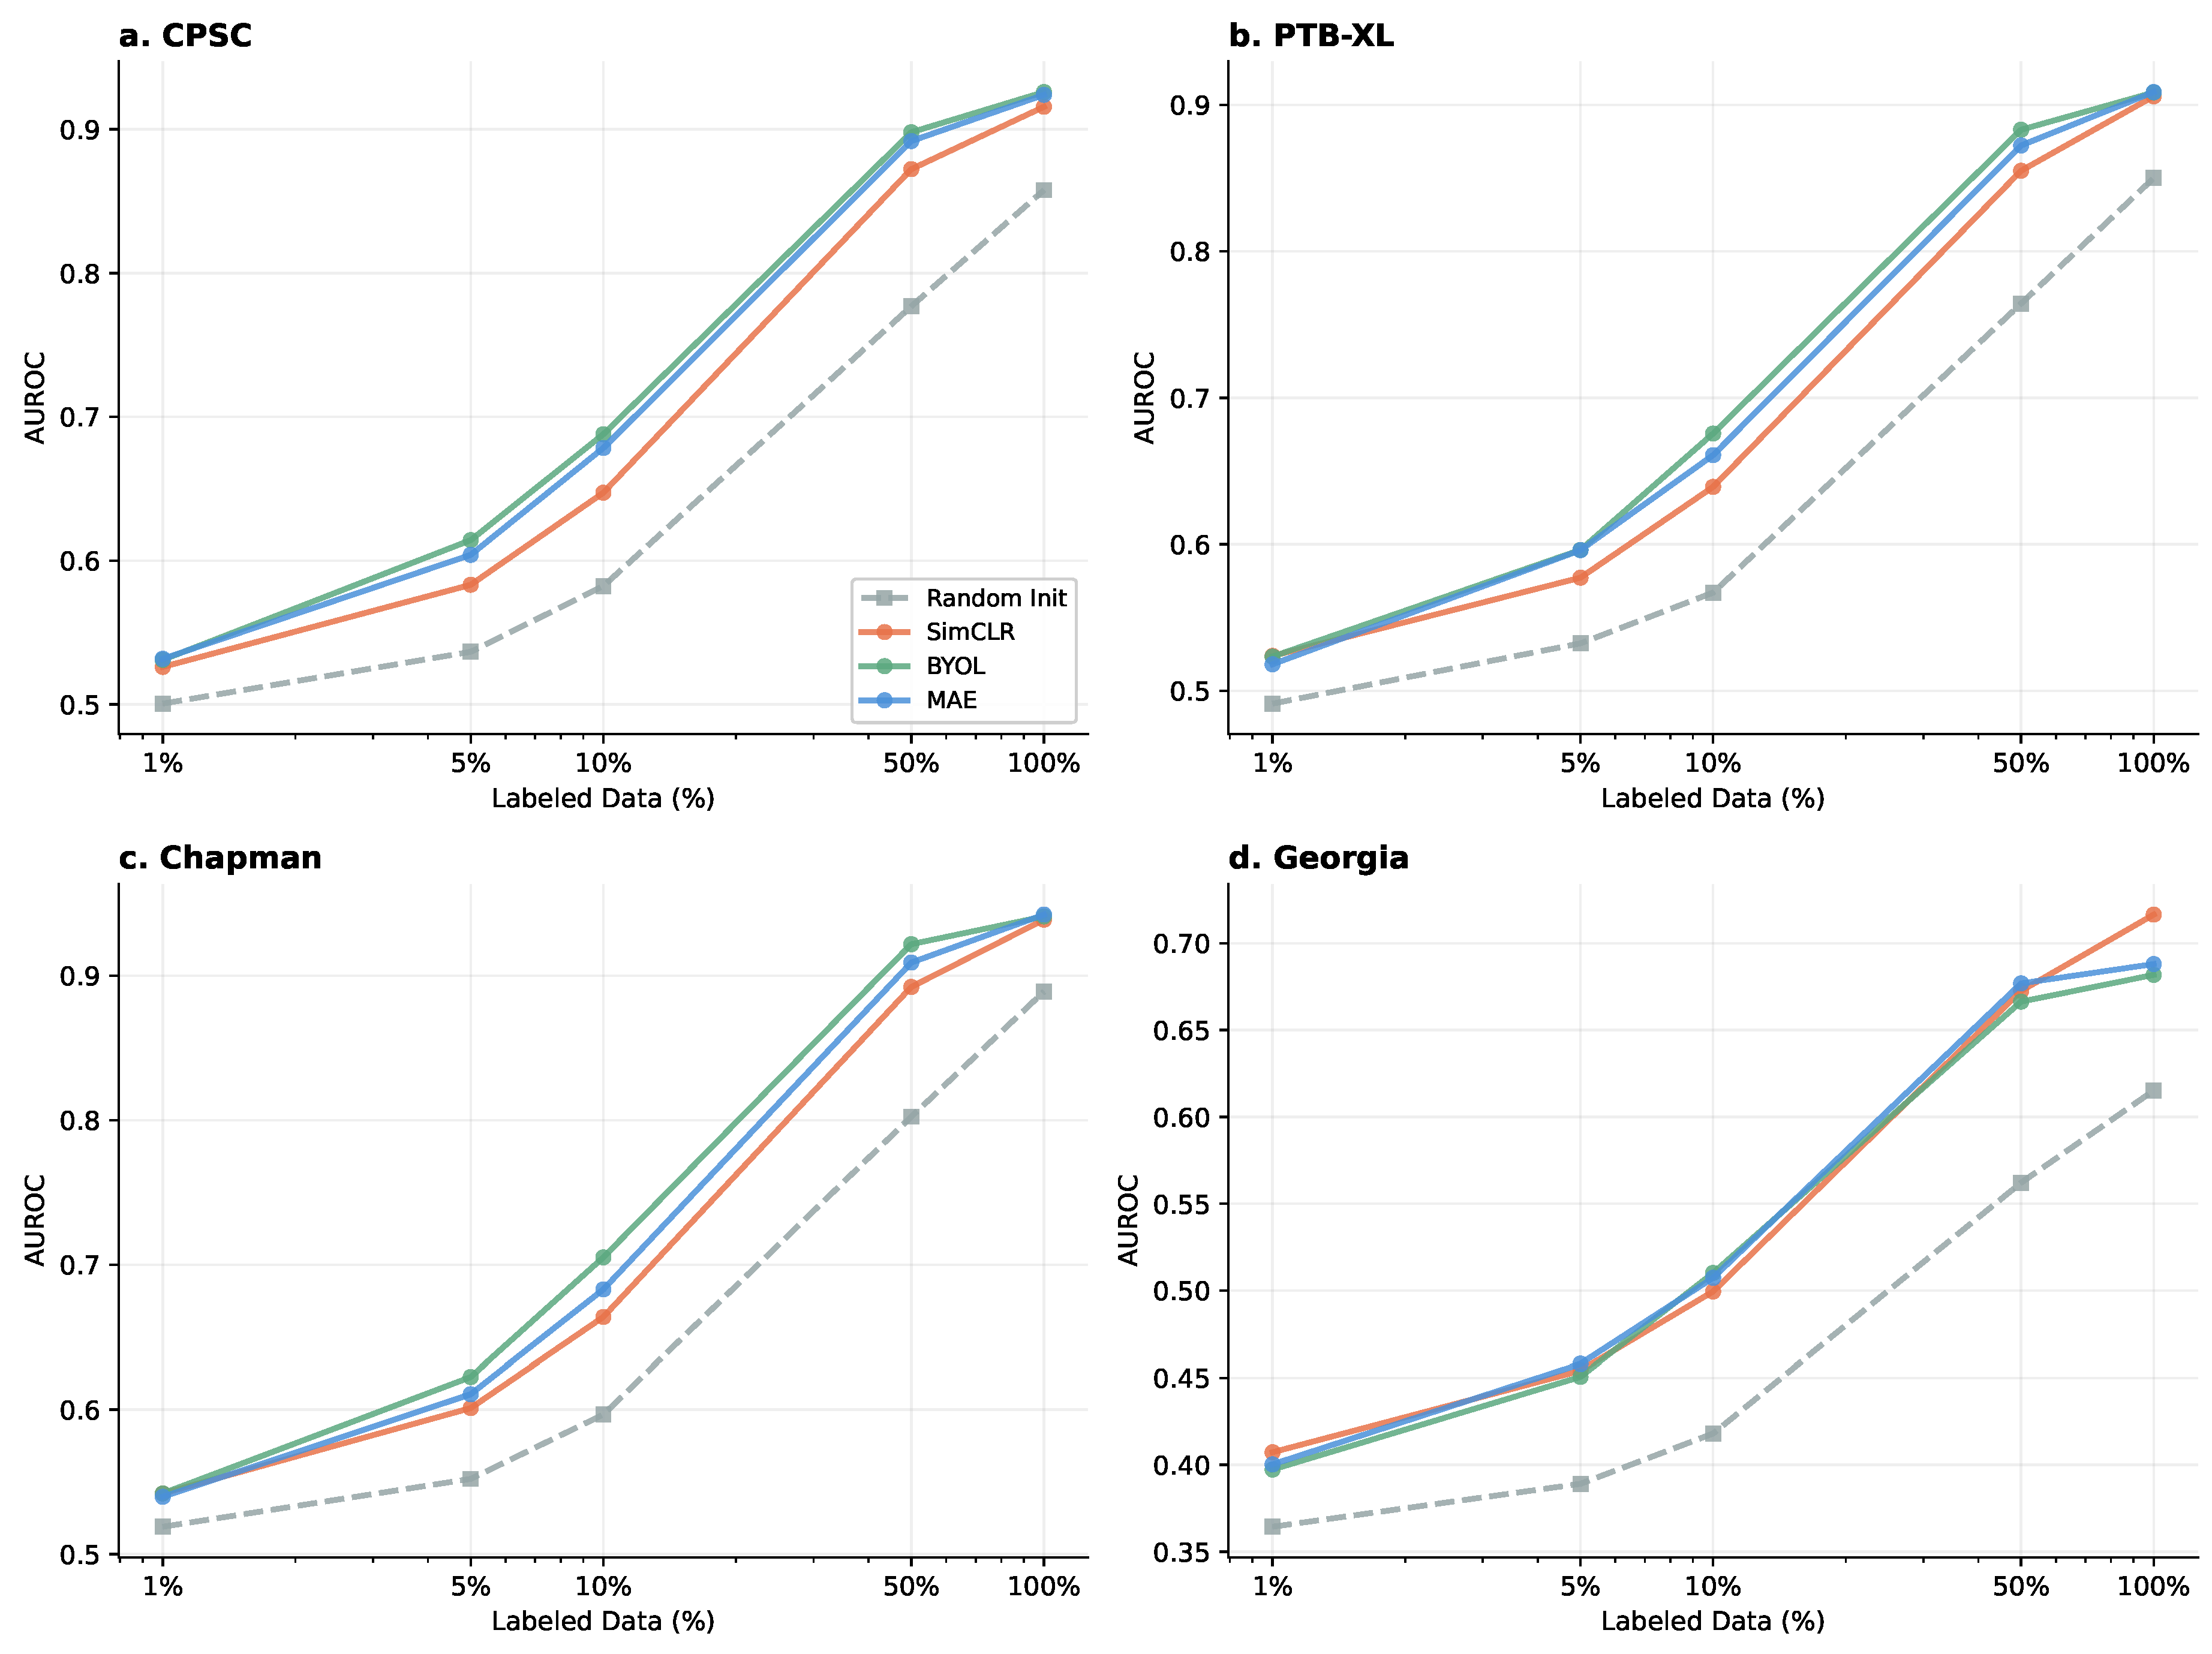
Figure 6.
Fine-tuned vs. linear probing performance. Solid bars: full fine-tuning; hatched bars: linear probing on frozen features. SimCLR shows the largest gap (representations are less universal); BYOL the smallest.
Figure 6.
Fine-tuned vs. linear probing performance. Solid bars: full fine-tuning; hatched bars: linear probing on frozen features. SimCLR shows the largest gap (representations are less universal); BYOL the smallest.
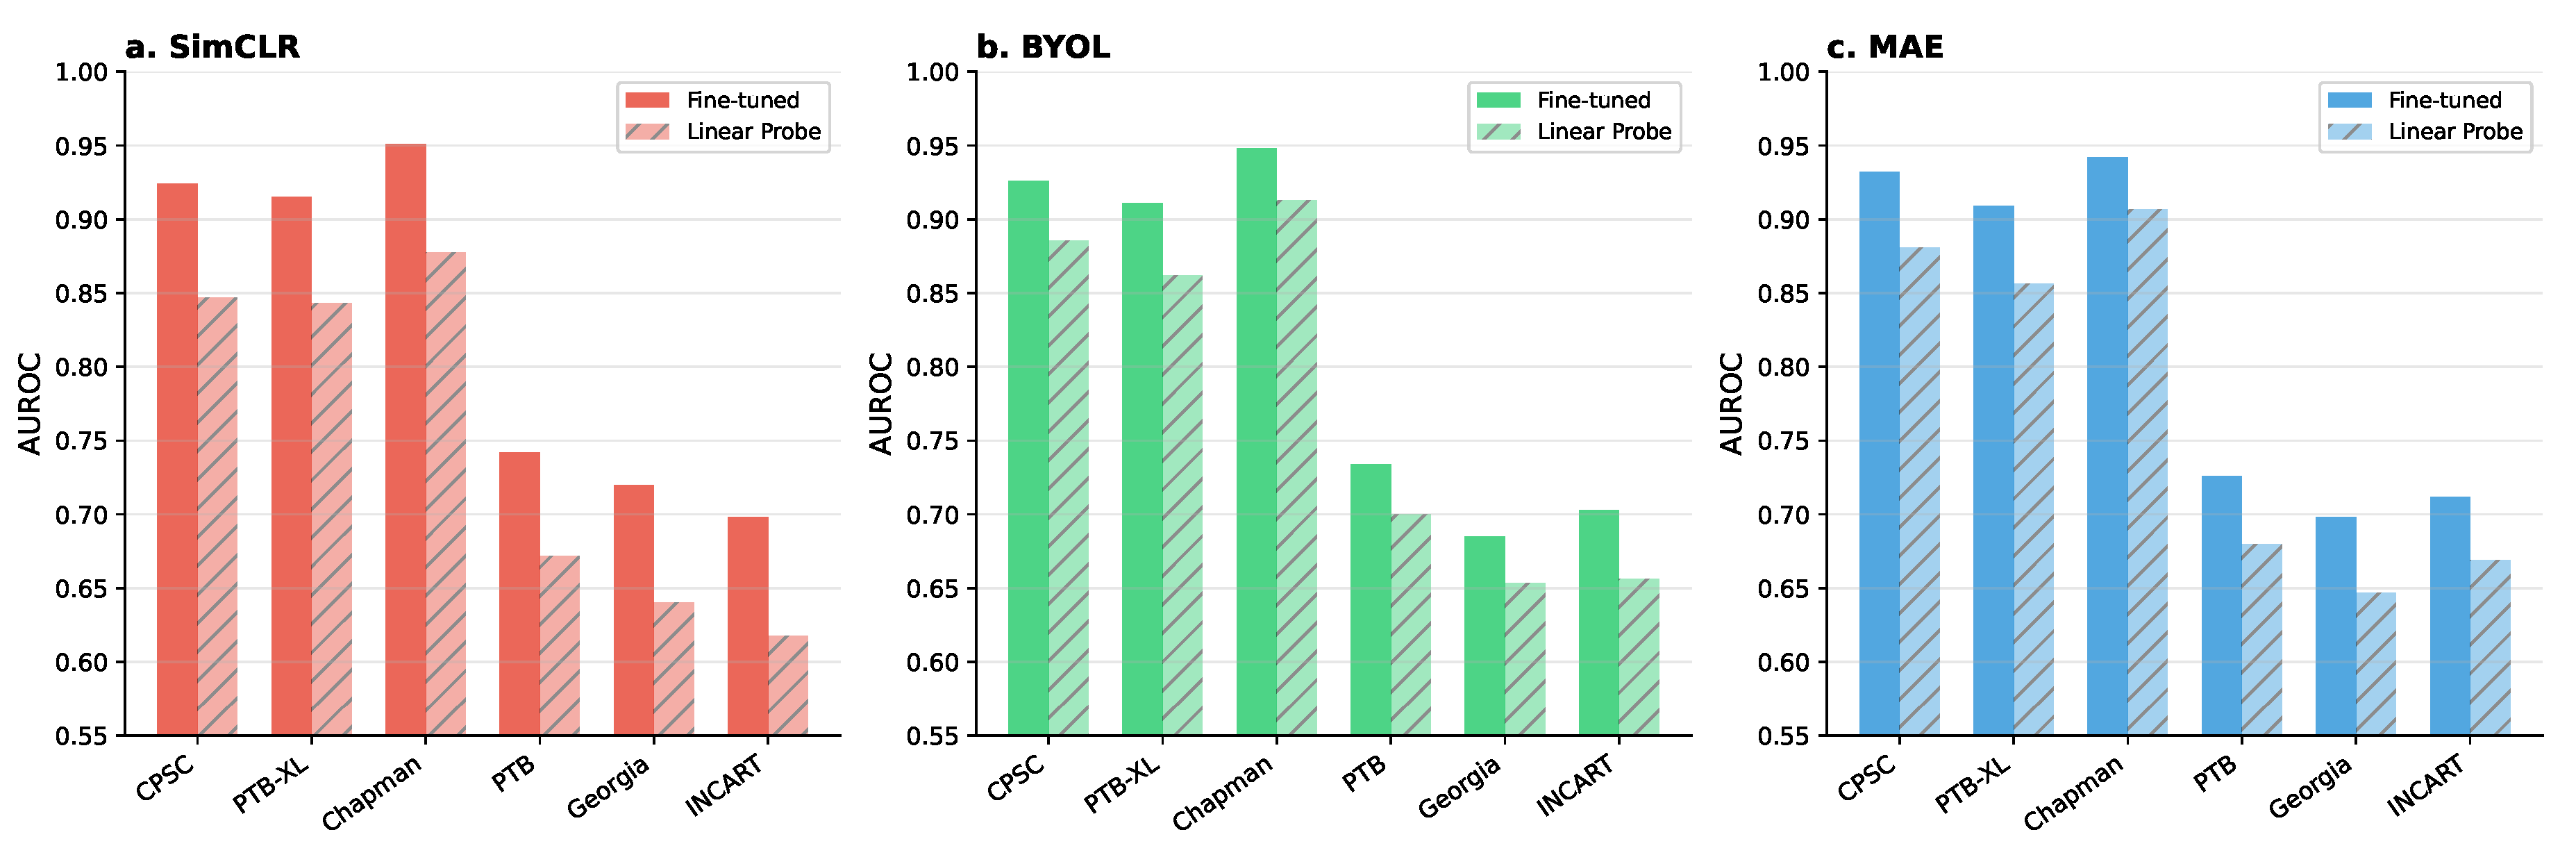
Figure 7.
Cross-domain transfer matrices. AUROC when fine-tuning on one dataset (row) and testing on another (column) for (a) SimCLR, (b) BYOL, and (c) MAE. Diagonal entries represent in-domain performance. BYOL and MAE show higher off-diagonal values, indicating more transferable representations.
Figure 7.
Cross-domain transfer matrices. AUROC when fine-tuning on one dataset (row) and testing on another (column) for (a) SimCLR, (b) BYOL, and (c) MAE. Diagonal entries represent in-domain performance. BYOL and MAE show higher off-diagonal values, indicating more transferable representations.
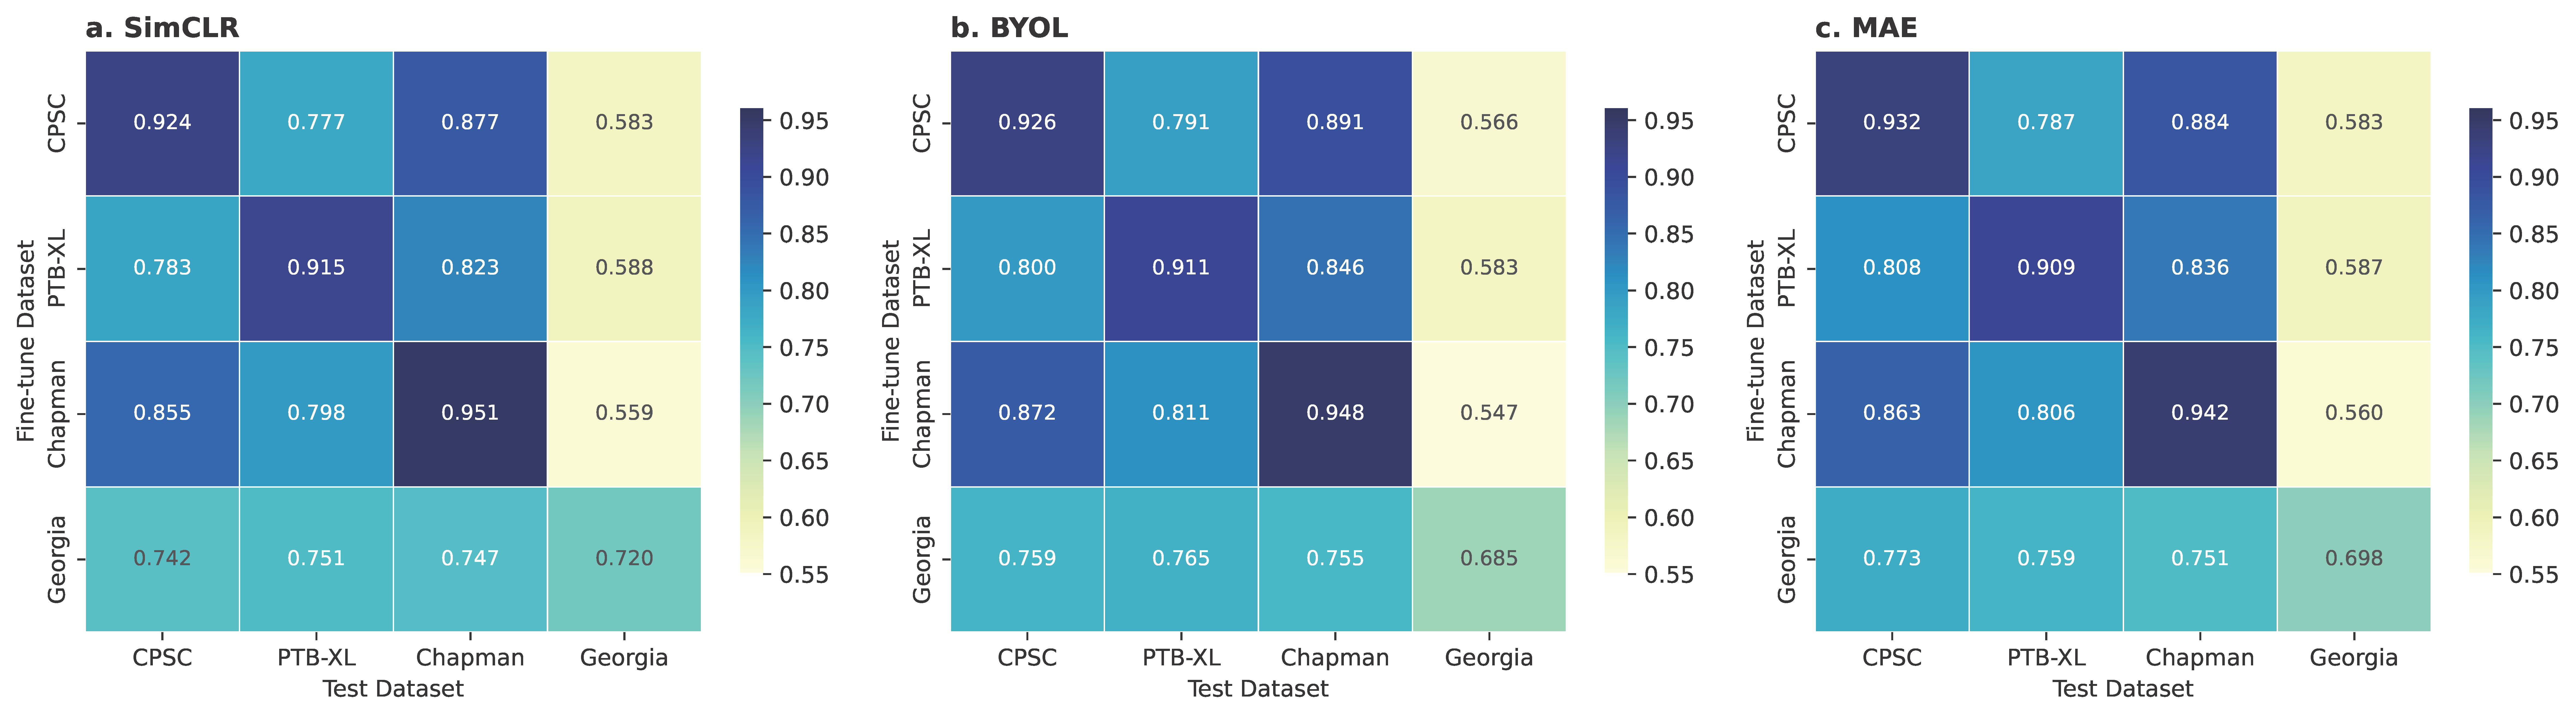
Figure 8.
Augmentation strategy ablation. (a) Mean AUROC for each SSL method under different augmentation configurations. Dotted lines: full-augmentation baselines. (b) Sensitivity heatmap showing the percentage AUROC drop when each augmentation is removed. SimCLR is the most augmentation-sensitive method (−6.2% without any augmentation); MAE is the most robust (−2.2%).
Figure 8.
Augmentation strategy ablation. (a) Mean AUROC for each SSL method under different augmentation configurations. Dotted lines: full-augmentation baselines. (b) Sensitivity heatmap showing the percentage AUROC drop when each augmentation is removed. SimCLR is the most augmentation-sensitive method (−6.2% without any augmentation); MAE is the most robust (−2.2%).
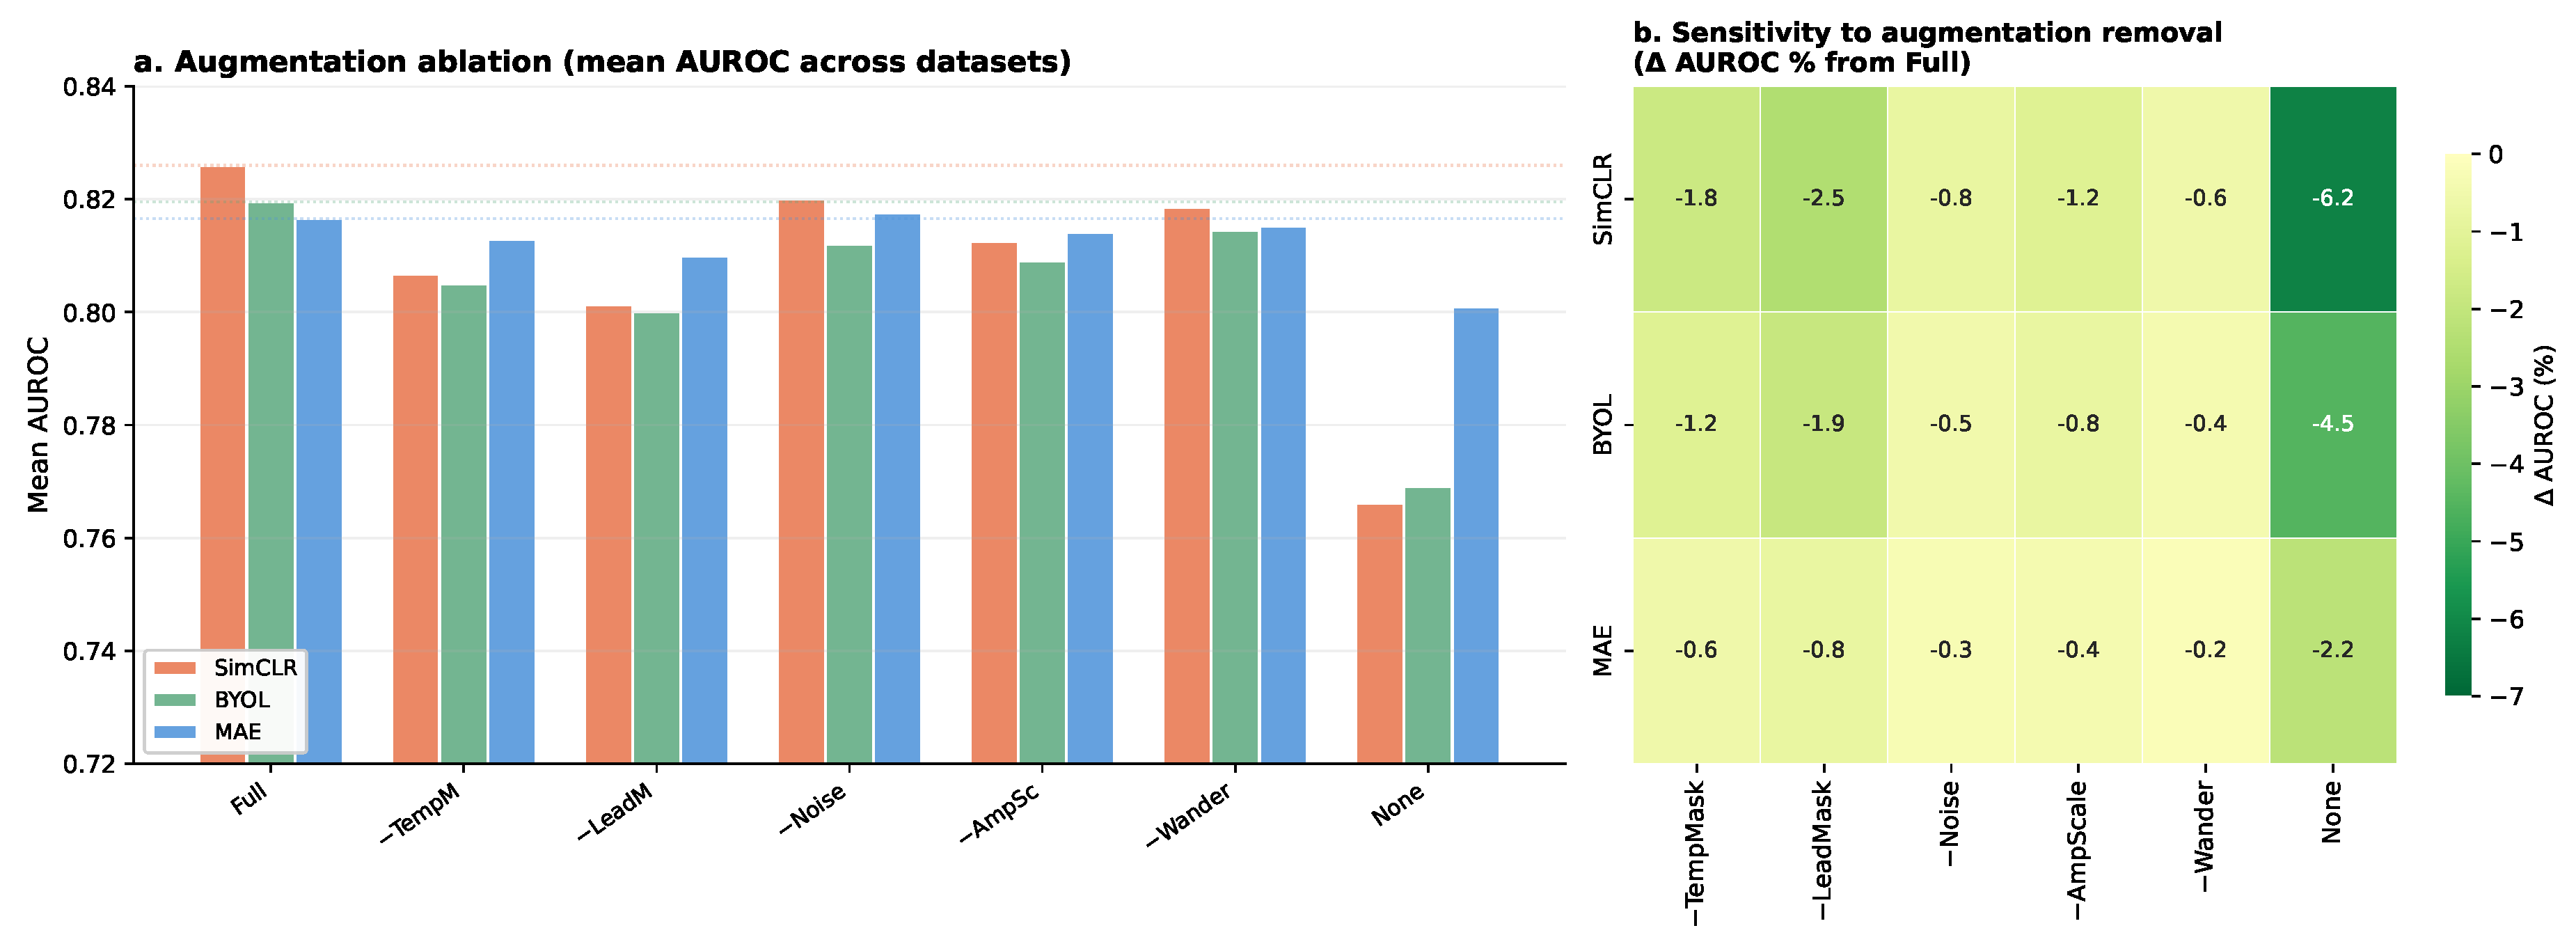
Figure 9.
t-SNE visualization of learned representations. Two-dimensional t-SNE projections of pre-trained features from the Chapman dataset for six cardiac conditions. (a) SimCLR produces diffuse clusters with inter-class overlap. (b) BYOL achieves the tightest within-class clustering. (c) MAE shows intermediate clustering quality. AF: atrial fibrillation; RBBB/LBBB: right/left bundle branch block; 1dAVb: first-degree atrioventricular block; ST-Elev: ST elevation.
Figure 9.
t-SNE visualization of learned representations. Two-dimensional t-SNE projections of pre-trained features from the Chapman dataset for six cardiac conditions. (a) SimCLR produces diffuse clusters with inter-class overlap. (b) BYOL achieves the tightest within-class clustering. (c) MAE shows intermediate clustering quality. AF: atrial fibrillation; RBBB/LBBB: right/left bundle branch block; 1dAVb: first-degree atrioventricular block; ST-Elev: ST elevation.
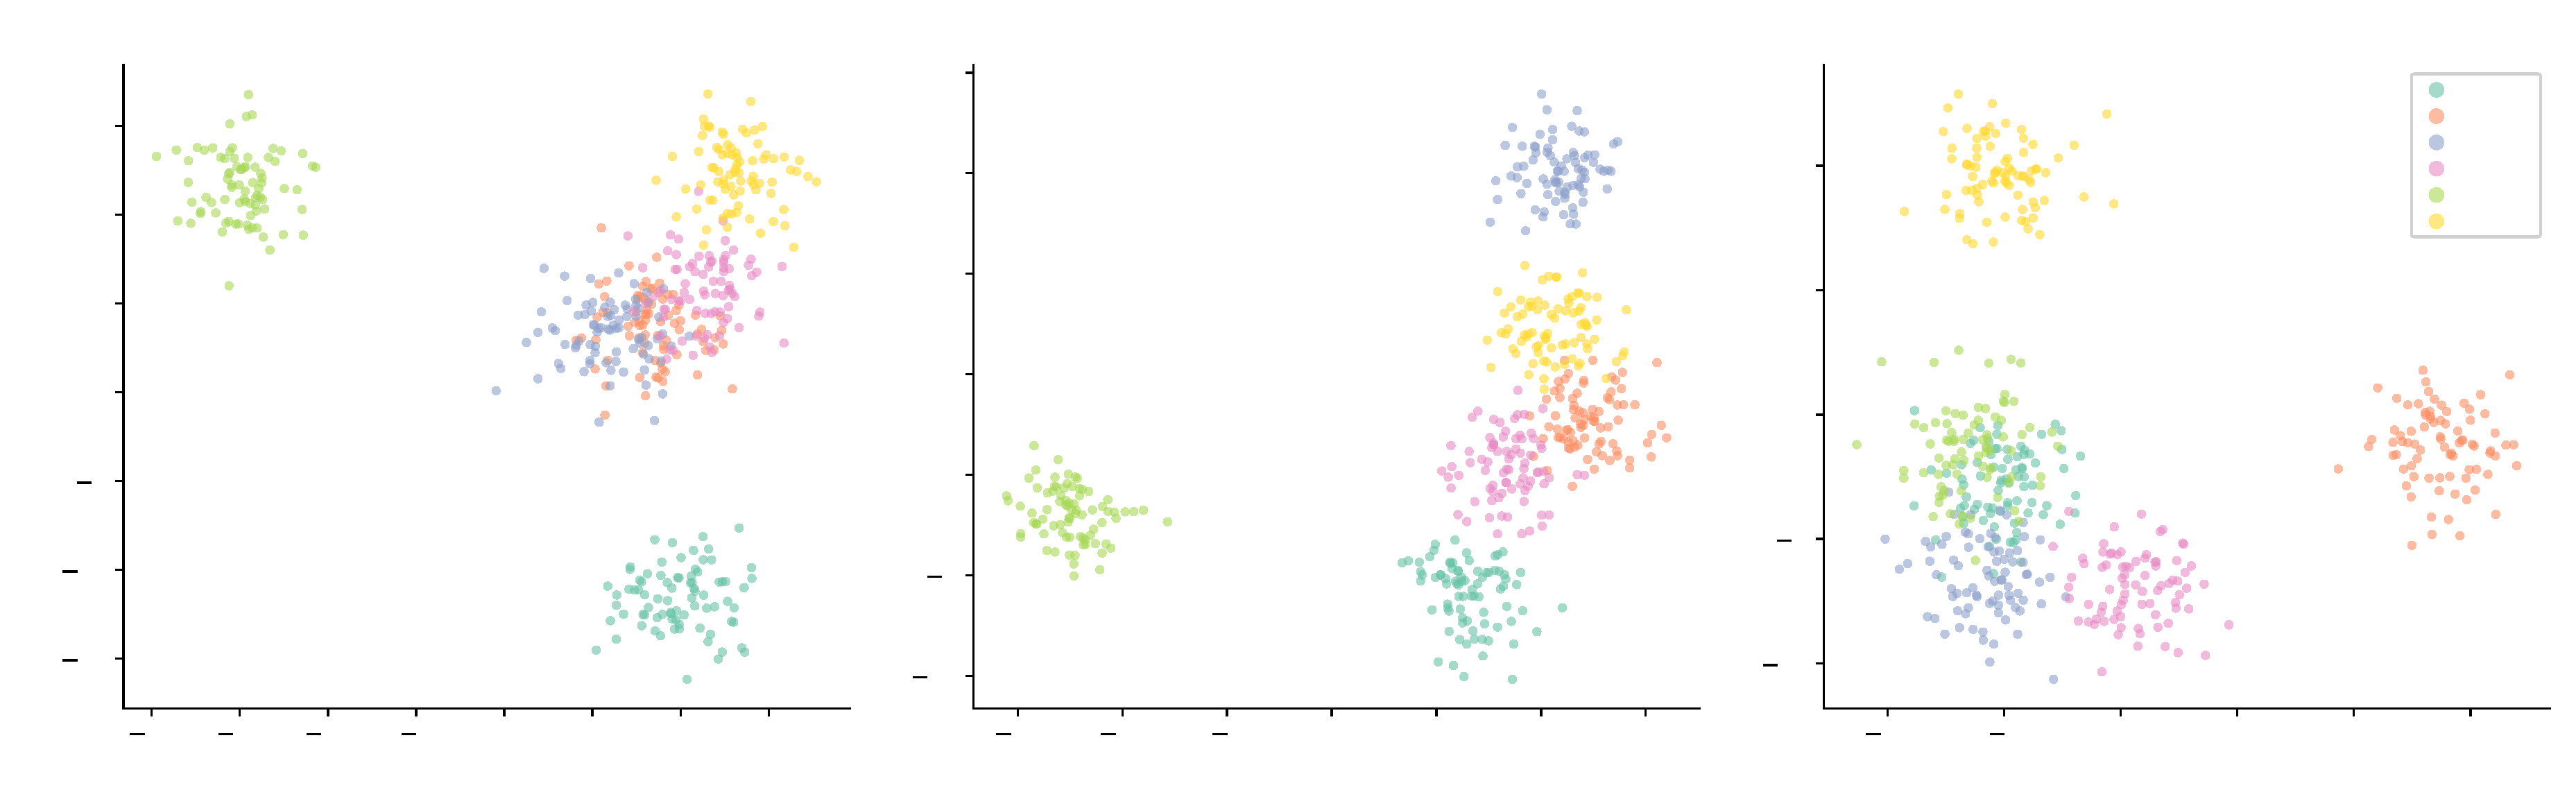
Figure 10.
Multi-dimensional SSL method comparison. Radar chart comparing SimCLR, BYOL, and MAE across six evaluation dimensions (normalized 0–1). BYOL and MAE excel in data efficiency, linear probing, cross-institutional robustness, and low-data performance.
Figure 10.
Multi-dimensional SSL method comparison. Radar chart comparing SimCLR, BYOL, and MAE across six evaluation dimensions (normalized 0–1). BYOL and MAE excel in data efficiency, linear probing, cross-institutional robustness, and low-data performance.
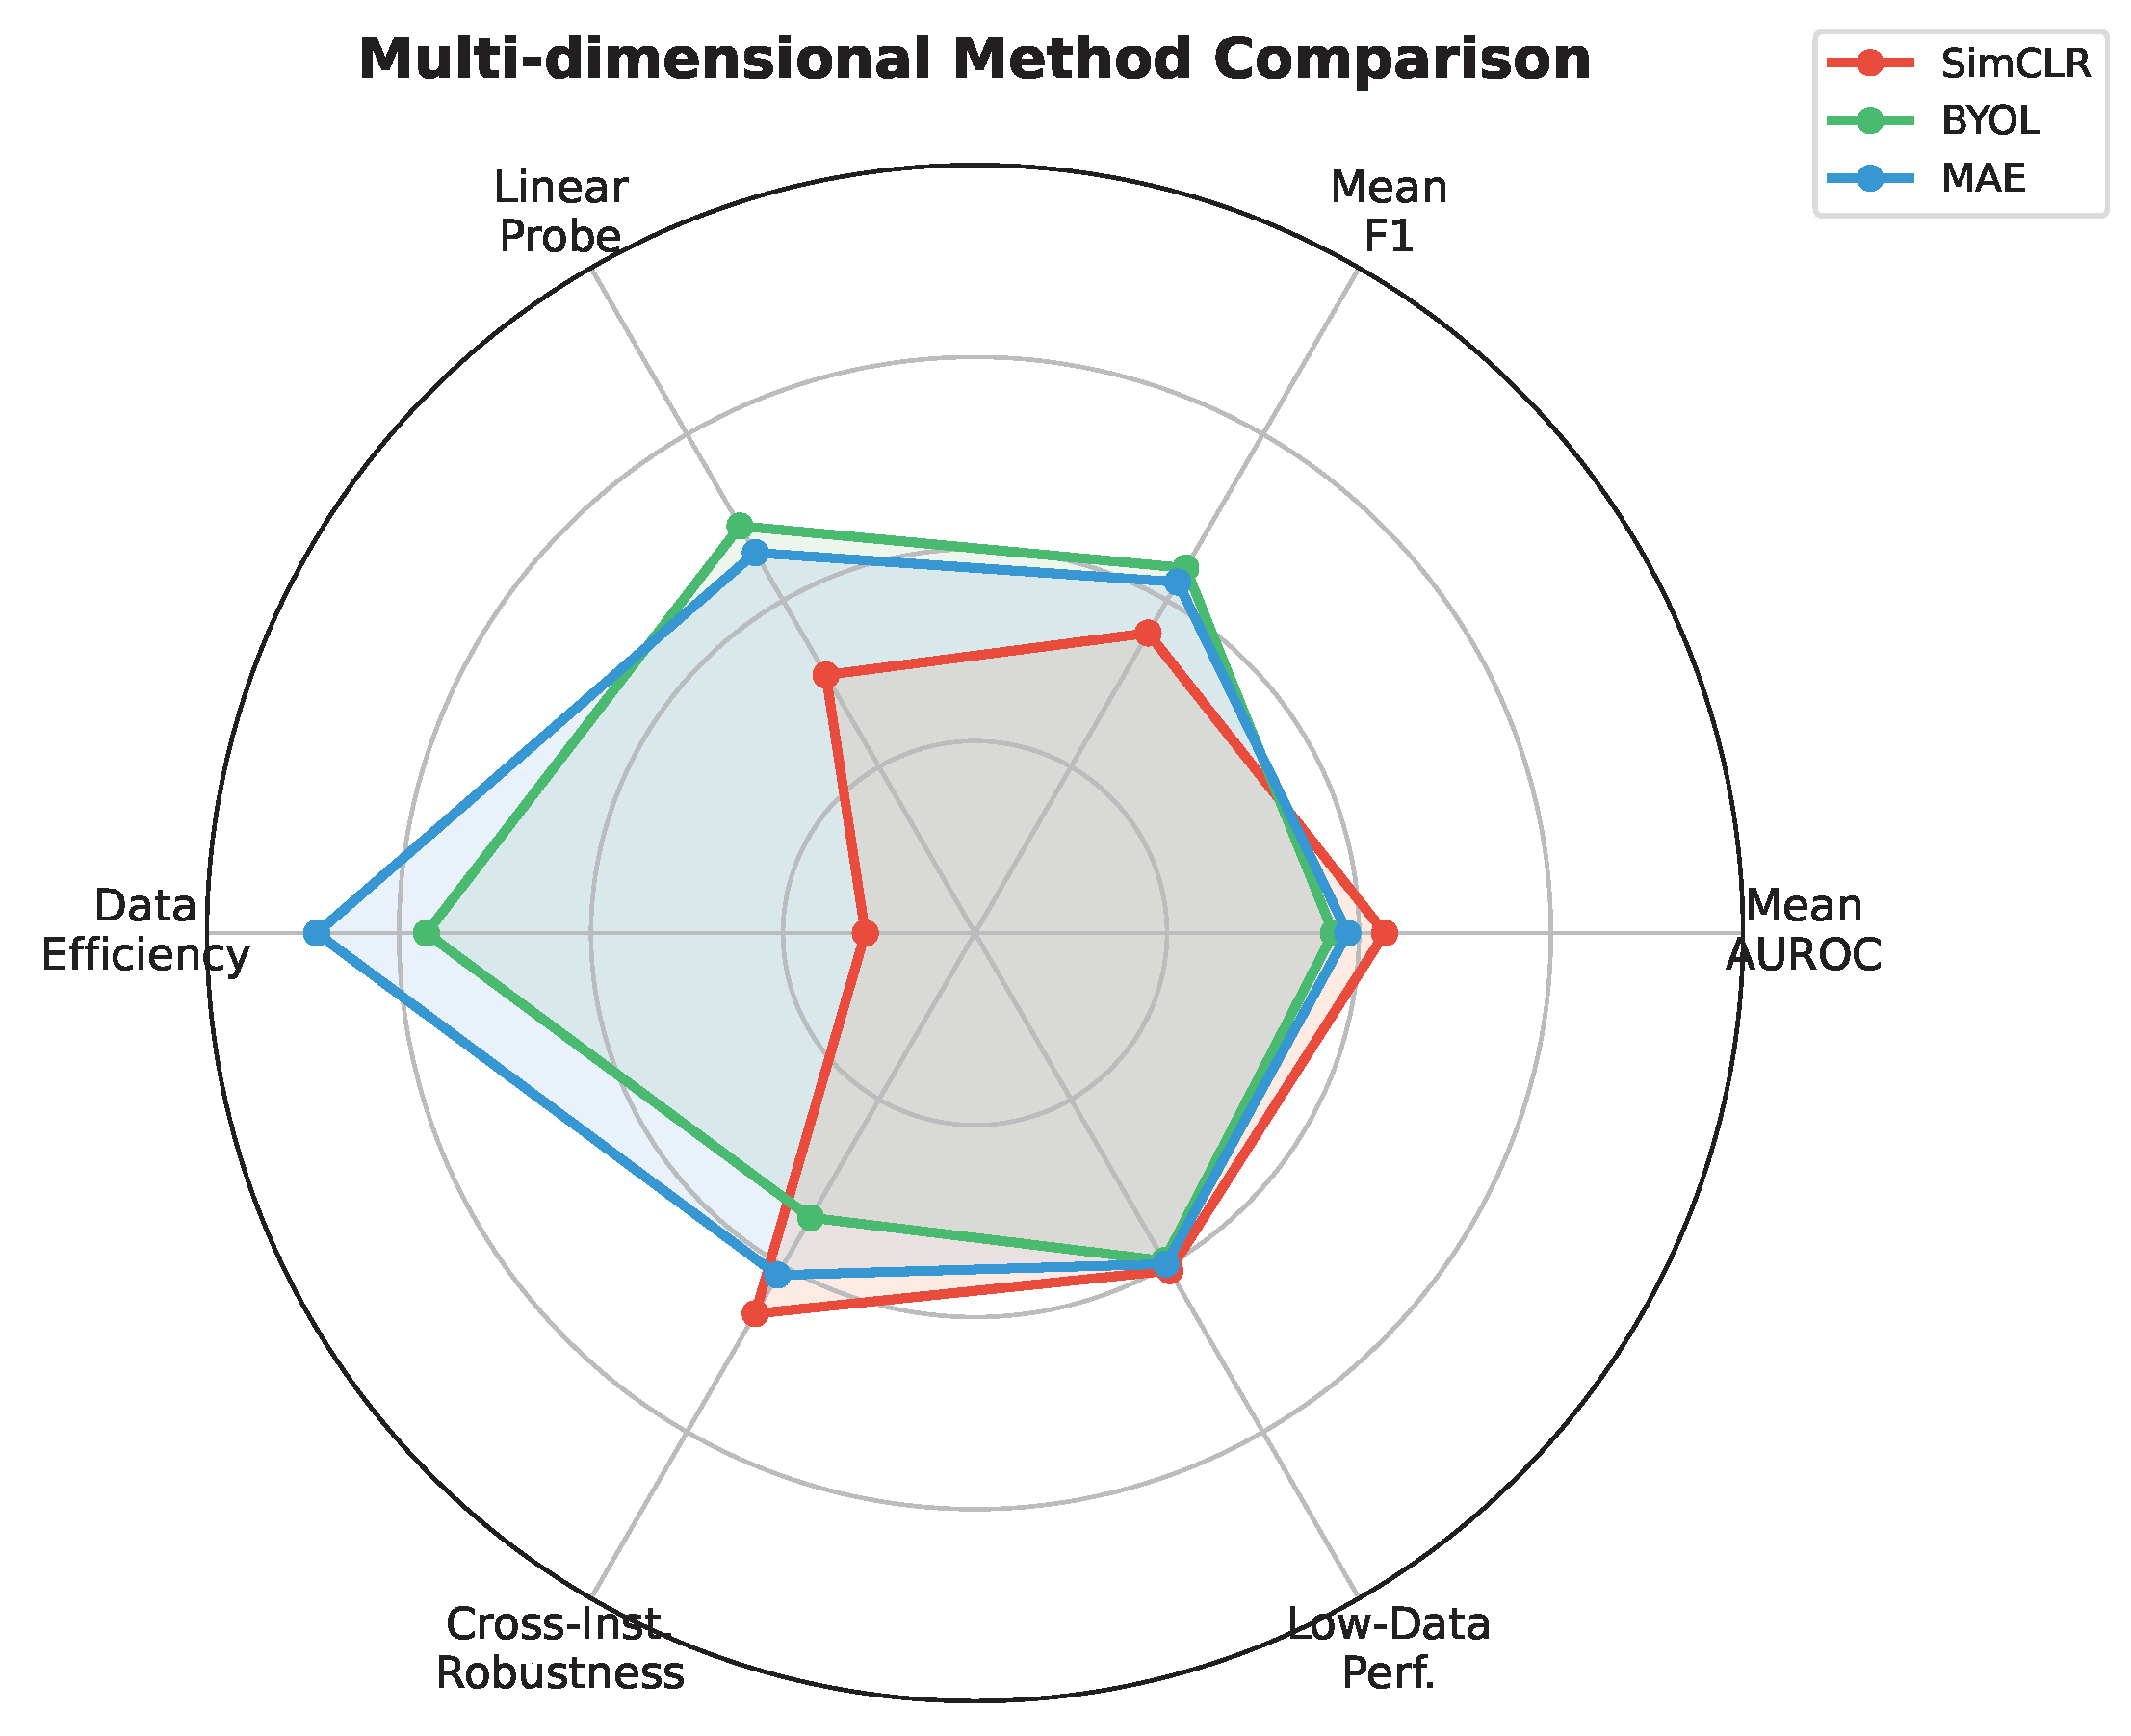
Table 1.
LODO cross-institutional evaluation. Macro-averaged AUROC and F1-score for multi-label classification of 24 cardiac conditions. Values represent the mean of five-fold cross-validation. 95% confidence intervals were computed via 1,000-iteration bootstrap resampling. Bold: best per dataset.
Table 1.
LODO cross-institutional evaluation. Macro-averaged AUROC and F1-score for multi-label classification of 24 cardiac conditions. Values represent the mean of five-fold cross-validation. 95% confidence intervals were computed via 1,000-iteration bootstrap resampling. Bold: best per dataset.
| SimCLR | BYOL | MAE | ||||
|---|---|---|---|---|---|---|
| Dataset | AUROC | F1 | AUROC | F1 | AUROC | F1 |
| CPSC | 0.924 | 0.731 | 0.926 | 0.728 | 0.932 | 0.745 |
| PTB-XL | 0.915 | 0.469 | 0.911 | 0.477 | 0.909 | 0.481 |
| Chapman | 0.951 | 0.523 | 0.948 | 0.515 | 0.942 | 0.508 |
| PTB | 0.742 | 0.378 | 0.734 | 0.361 | 0.726 | 0.354 |
| Georgia | 0.720 | 0.123 | 0.685 | 0.262 | 0.698 | 0.253 |
| INCART | 0.698 | 0.171 | 0.703 | 0.117 | 0.712 | 0.105 |
| Mean | 0.825 | 0.399 | 0.818 | 0.410 | 0.820 | 0.408 |
Table 2.
Impact of target dataset inclusion in pre-training (AUROC). “w/”: target included; “w/o”: target excluded. %: relative improvement.
Table 2.
Impact of target dataset inclusion in pre-training (AUROC). “w/”: target included; “w/o”: target excluded. %: relative improvement.
| SimCLR | BYOL | MAE | |||||||
|---|---|---|---|---|---|---|---|---|---|
| w/ | w/o | % | w/ | w/o | % | w/ | w/o | % | |
| CPSC | .924 | .901 | +2.5 | .926 | .890 | +3.8 | .932 | .901 | +3.4 |
| PTB-XL | .915 | .904 | +1.2 | .911 | .898 | +1.5 | .909 | .899 | +1.1 |
| Chapman | .951 | .943 | +0.8 | .948 | .937 | +1.1 | .942 | .935 | +0.8 |
| PTB | .742 | .728 | +1.9 | .734 | .709 | +3.4 | .726 | .708 | +2.5 |
| Georgia | .720 | .708 | +1.7 | .685 | .667 | +2.6 | .698 | .682 | +2.2 |
| INCART | .698 | .676 | +3.2 | .703 | .673 | +4.2 | .712 | .688 | +3.4 |
| Mean | +1.9 | +2.8 | +2.2 | ||||||
Table 3.
Few-shot label efficiency (AUROC). Performance at 1%, 10%, and 100% of labeled data. “Rand”: random initialization (no SSL pre-training). Bold: best SSL method per row.
Table 3.
Few-shot label efficiency (AUROC). Performance at 1%, 10%, and 100% of labeled data. “Rand”: random initialization (no SSL pre-training). Bold: best SSL method per row.
| Labels | Dataset | Rand | SimCLR | BYOL | MAE |
|---|---|---|---|---|---|
| 1% | CPSC | 0.501 | 0.526 | 0.531 | 0.532 |
| PTB-XL | 0.491 | 0.524 | 0.523 | 0.518 | |
| Chapman | 0.519 | 0.542 | 0.542 | 0.540 | |
| Georgia | 0.364 | 0.407 | 0.397 | 0.400 | |
| 10% | CPSC | 0.582 | 0.647 | 0.688 | 0.678 |
| PTB-XL | 0.567 | 0.639 | 0.676 | 0.661 | |
| Chapman | 0.597 | 0.664 | 0.705 | 0.683 | |
| Georgia | 0.418 | 0.499 | 0.510 | 0.507 | |
| 100% | CPSC | 0.895 | 0.924 | 0.926 | 0.932 |
| PTB-XL | 0.882 | 0.915 | 0.911 | 0.909 | |
| Chapman | 0.920 | 0.951 | 0.948 | 0.942 | |
| Georgia | 0.645 | 0.720 | 0.685 | 0.698 |
Table 4.
Linear probing AUROC (frozen representations). A single linear layer trained on frozen pre-trained features. Statistical comparisons via paired t-tests across six datasets.
Table 4.
Linear probing AUROC (frozen representations). A single linear layer trained on frozen pre-trained features. Statistical comparisons via paired t-tests across six datasets.
| Dataset | SimCLR | BYOL | MAE |
|---|---|---|---|
| CPSC | 0.847 | 0.886 | 0.881 |
| PTB-XL | 0.843 | 0.862 | 0.856 |
| Chapman | 0.878 | 0.913 | 0.907 |
| PTB | 0.672 | 0.700 | 0.680 |
| Georgia | 0.640 | 0.653 | 0.647 |
| INCART | 0.618 | 0.657 | 0.669 |
| Mean | 0.750 | 0.779 | 0.773 |
| BYOL vs. SimCLR: , | |||
| MAE vs. SimCLR: , | |||
| BYOL vs. MAE: , | |||
Table 5.
Augmentation ablation (mean AUROC across datasets). Each row removes one augmentation component from the full pipeline. : change from “Full”. Bold: largest drop per method.
Table 5.
Augmentation ablation (mean AUROC across datasets). Each row removes one augmentation component from the full pipeline. : change from “Full”. Bold: largest drop per method.
| SimCLR | BYOL | MAE | ||||
|---|---|---|---|---|---|---|
| Augmentation | AUROC | AUROC | AUROC | |||
| Full | 0.826 | — | 0.820 | — | 0.817 | — |
| −Temporal Mask | 0.807 | −1.8% | 0.805 | −1.2% | 0.813 | −0.6% |
| −Lead Mask | 0.801 | −2.5% | 0.800 | −1.9% | 0.810 | −0.8% |
| −Noise | 0.820 | −0.8% | 0.812 | −0.5% | 0.818 | −0.3% |
| −Amp. Scale | 0.813 | −1.2% | 0.809 | −0.8% | 0.814 | −0.4% |
| −Wander | 0.819 | −0.6% | 0.814 | −0.4% | 0.815 | −0.2% |
| None | 0.766 | −6.2% | 0.769 | −4.5% | 0.801 | −2.2% |
Table 6.
Comparison with prior SSL-based ECG models. F1-score/AUROC (×100) on benchmark datasets. “–”: not reported.
Table 6.
Comparison with prior SSL-based ECG models. F1-score/AUROC (×100) on benchmark datasets. “–”: not reported.
| Method | PTB-XL | CPSC | Chapman | PTB | Georgia | INCART |
|---|---|---|---|---|---|---|
| ECG-Chat [11] | 55.9/94.1 | 80.1/95.7 | – | – | – | – |
| MERL [12] | 48.1/91.9 | 72.8/92.6 | – | – | – | – |
| MAEFE [13] | 64.7/88.6 | 71.6/94.5 | – | – | – | – |
| 3KG [9] | – | – | 43.2/88.3 | – | – | – |
| Ours-SimCLR | 46.9/91.5 | 73.1/92.4 | 52.3/95.1 | 37.8/74.2 | 12.3/72.0 | 17.1/69.8 |
| Ours-BYOL | 47.7/91.1 | 72.8/92.6 | 51.5/94.8 | 36.1/73.4 | 26.2/68.5 | 11.7/70.3 |
| Ours-MAE | 48.1/90.9 | 74.5/93.2 | 50.8/94.2 | 35.4/72.6 | 25.3/69.8 | 10.5/71.2 |
Disclaimer/Publisher’s Note: The statements, opinions and data contained in all publications are solely those of the individual author(s) and contributor(s) and not of MDPI and/or the editor(s). MDPI and/or the editor(s) disclaim responsibility for any injury to people or property resulting from any ideas, methods, instructions or products referred to in the content. |
© 2026 by the authors. Licensee MDPI, Basel, Switzerland. This article is an open access article distributed under the terms and conditions of the Creative Commons Attribution (CC BY) license (http://creativecommons.org/licenses/by/4.0/).
Copyright: This open access article is published under a Creative Commons CC BY 4.0 license, which permit the free download, distribution, and reuse, provided that the author and preprint are cited in any reuse.


