

Submitted:
23 July 2026
Posted:
23 July 2026
You are already at the latest version
Abstract
Telomere-to-telomere (T2T) genomes provide a framework for resolving fungal chromosome architecture and lineage-specific evolution. We generated chromosome-complete assemblies of Coprinellus xanthothrix and C. saccharinus by integrating Oxford Nanopore, DNBSEQ, Hi-C, and RNA-seq data. Each genome comprised 13 gapless chromosomes with all 26 telomeres recovered; assembly sizes were 46.92 and 54.81 Mb, with BUSCO completeness of 99.20% and 99.10%, respectively. The larger C. saccharinus genome was primarily associated with greater retroelement content, whereas functional annotation profiles and CAZyme repertoires were broadly comparable between species. Phylogenomic analyses grouped C. xanthothrix with C. radians and C. saccharinus with C. micaceus, with estimated divergence times of 54.4 and 32.8 Ma, respectively. Both divergence events occurred within the Paleogene. Gene-family analyses identified lineage-specific expansions enriched in nucleotide metabolism, DNA replication and repair, glutathione metabolism, redox regulation, endocytosis, cytoskeletal organization, and cell-cycle processes. Synteny and Ks analyses further revealed chromosome-level rearrangements and lineage-specific small-scale duplication but no strong evidence of recent whole-genome duplication. Together, the temporal placement of these divergences and the associated genomic patterns raise a testable hypothesis that long-term climatic and vegetation reorganization, together with changes in plant-derived substrates and microhabitats, may have contributed to lineage establishment and ecological differentiation. However, because direct paleoecological evidence and functional validation are currently lacking, this proposed relationship should not be interpreted as causal. These chromosome-complete assemblies provide important resources for comparative genomics in Coprinellus and future experimental studies of saprotrophic adaptation.
Keywords:
Coprinellus xanthothrix
; Coprinellus saccharinus
; telomere-to-telomere genome
; comparative genomics
; chromosome architecture
; retroelements
; gene-family evolution
; synteny
; carbohydrate-active enzymes
; whole-genome duplication
1. Introduction
Complete and chromosome-end-resolved genome assemblies are becoming foundational resources for fungal comparative genomics. Draft assemblies have supported many analyses of gene content, orthology, and species relationships, but fragmented contigs can obscure chromosome termini, subtelomeric repeats, repeat-rich intervals, local duplication structure, and long-range syntenic relationships. The telomere-to-telomere (T2T) assembly framework has therefore become an important direction in genomics, particularly after rapid improvements in long-read sequencing, polishing, and chromosome-conformation scaffolding [1,2]. Although fungal genomes are typically smaller than plant and animal genomes, they still contain biologically important repeats, chromosome-end features, and structural variants that can be missed or misassembled in draft genomes.
Recent fungal T2T or near-T2T studies show why complete assemblies matter for mycology. A telomere-to-telomere genome of the model mould pathogen Aspergillus fumigatus improved resolution of chromosome architecture and repetitive regions [3]. Complete chromosome-end assemblies of Agaricus bisporus revealed polymorphic chromosome ends in the cultivated button mushroom [4]. In macrofungi, the T2T assembly of Ganoderma leucocontextum supported centromere-associated repeat characterization [5], and a haplotype-resolved T2T assembly of the dikaryotic pathogen Rhizoctonia cerealis showed how complete assembly can clarify haplotype structure and genome organization [6]. These studies collectively indicate that complete assemblies are not simply longer versions of draft genomes; they provide a more reliable coordinate system for studying repeats, telomeres, synteny, and lineage-specific genome evolution.
Coprinellus is a mushroom-forming genus in Psathyrellaceae. The modern circumscription of coprinoid fungi was reshaped when Coprinus sensu lato was divided into Coprinus sensu stricto, Coprinellus, Coprinopsis, and Parasola, with Coprinellus placed in Psathyrellaceae [7]. Subsequent multigene phylogenetic work demonstrated that species delimitation within Coprinellus, especially among haired species, can be complex and benefits from molecular data [8]. Related coprinoid fungi have also been important for fungal genomics: the assembled chromosomes of Coprinopsis cinerea provided an early model for studying multicellular development and chromosome biology in mushroom-forming fungi [9]. More broadly, Coprinellus species are saprotrophic fungi that colonize decomposing organic substrates such as wood, leaves, grass, and dung, linking their genome evolution to plant-derived carbon turnover and microhabitat specialization [10].
Despite this biological and phylogenetic relevance, chromosome-complete resources for Coprinellus remain limited. Existing comparative datasets include several Coprinellus and related fungal genomes, but most available assemblies do not resolve both telomeres of every chromosome. This limitation is important because chromosome-end regions and repetitive sequences can contribute to genome-size variation, structural rearrangement, and gene-family evolution. For saprotrophic mushrooms, complete genomes also provide a better framework for interpreting carbohydrate-active enzyme (CAZyme) repertoires, gene-family expansions, and potential links between genome architecture and ecological adaptation.
In the present study, we generated T2T genome assemblies for Coprinellus xanthothrix (CXA) and Coprinellus saccharinus (CSA). These two species occupy different positions within the local Coprinellus comparative framework: C. xanthothrix is closely related to C. radians, whereas C. saccharinus is closely related to C. micaceus. This arrangement allows the two new assemblies to anchor separate lineage comparisons while being processed under the same assembly, annotation, and evolutionary-analysis framework. We combined ONT long reads, DNBSEQ short reads, Hi-C data, and RNA-seq data to assemble and validate the genomes, then annotated repeats, genes, functional categories, and CAZymes. We further inferred orthogroups across 11 fungal genomes, reconstructed a dated phylogeny, estimated gene-family expansion and contraction, tested GO and KEGG enrichment among expanded gene families, and examined chromosome-scale synteny and synonymous substitution rate (Ks) distributions.
The goals of this work were threefold. First, we aimed to produce high-quality telomere-capped chromosome assemblies for C. xanthothrix and C. saccharinus. Second, we sought to compare their genome size, repeat composition, gene content, CAZyme repertoire, and chromosome-level organization using the same analytical framework. Third, we evaluated lineage-specific gene-family dynamics and considered whether the Paleogene divergence of C. xanthothrix and C. saccharinus from close relatives may have coincided with broader climatic warming, forest ecological expansion, and ecological niche restructuring. The resulting assemblies provide reference genomes for Coprinellus comparative genomics and a data-supported basis for future functional studies of saprotrophic mushroom adaptation.
2. Materials and Methods
2.1. Fungal Strains and Culture Conditions
Coprinellus xanthothrix and C. saccharinus were cultured to yield fresh mycelial biomass for genomic DNA and total RNA extraction. The fungal cultures were incubated in potato dextrose broth within a temperature-controlled orbital shaker at 25 °C for 5–7 days. Mycelia were harvested via filtration, snap-frozen in liquid nitrogen immediately, and preserved at −80 °C prior to nucleic acid extraction. Species identification was verified based on internal transcribed spacer (ITS) sequences.
2.2. Nucleic Acid Extraction and Quality Assessment
High-molecular-weight genomic DNA and total RNA were extracted from frozen mycelial material using commercially available kits adapted for fungal material. Nucleic acid purity was assessed spectrophotometrically with a NanoDrop™ instrument (Thermo Fisher Scientific, Waltham, MA, USA), and nucleic acid concentration was quantified using a Qubit® 3.0 fluorometer (Thermo Fisher Scientific). The integrity of DNA and RNA was further evaluated via 1% agarose gel electrophoresis to confirm that all samples satisfied the quality standards required for library preparation. Qualified samples that passed all quality assessment criteria were subjected to ONT long-read sequencing, DNBSEQ short-read whole-genome sequencing, Hi-C library construction, and RNA-seq library construction. All the above quality-control procedures adopted the general analytical framework, guaranteeing that sequencing libraries were generated from intact nucleic acids with minimal contamination.
2.3. Library Construction and Sequencing Platform Integration
Four complementary sets of sequencing data were generated for each species. Oxford Nanopore Technologies (ONT) sequencing was applied to generate ultra-long reads capable of spanning repetitive regions, which served as the primary dataset for de novo contig assembly and telomere extension. High-molecular-weight genomic DNA was subjected to end repair and enzymatic single-strand conversion prior to adapter ligation. Nanopore libraries were constructed and sequenced on a PromethION instrument with R10.4.1 flow cells. Raw electrical signals were base-called via Dorado (v0.9.0, https://github.com/nanoporetech/dorado) to yield high-quality ultra-long ONT reads.
DNBSEQ short-read sequencing was performed to support genome survey analysis and single-nucleotide-level genome polishing on an MGI DNBSEQ high-throughput sequencer (MGI Tech Co., Ltd., Shenzhen, China). Genomic DNA was fragmented physically or enzymatically, followed by end repair, dA-tailing and adapter ligation. Target-size DNA fragments were purified with magnetic beads and denatured into single-stranded circles for rolling circle amplification to produce DNA nanoballs (DNBs). Libraries were sequenced in paired-end 150 bp (PE150) mode.
Hi-C sequencing data were used to construct chromosome-scale scaffolds, validate chromosomal architecture, and provide contact information for the final genome assemblies. Briefly, fresh mycelial cells were cross-linked with formaldehyde to preserve native chromatin conformation and digested with DpnII restriction endonuclease. Biotin-labelled nucleotides were incorporated during proximity ligation at cleavage sites. Following cross-link reversal and DNA purification, DNA was sheared to fragments ranging from 300 to 700 bp. Biotin-containing ligation products were enriched using streptavidin magnetic beads, and the resulting Hi-C libraries were sequenced in PE150 mode on the DNBSEQ-T7 platform (MGI Tech Co., Ltd., Shenzhen, China).
RNA-seq transcriptome data were generated to supply transcript evidence for gene prediction and improve genome functional annotation. Poly(A)+ mRNA was enriched from total RNA using oligo-dT magnetic beads. After chemical denaturation, mRNA was reverse-transcribed into double-stranded cDNA with random hexamers. The cDNA was processed through end repair, 3′ dA-tailing, adapter ligation and PCR amplification to construct single-stranded circular DNA libraries, which were subsequently sequenced in PE150 mode on the DNBSEQ platform (MGI Tech Co., Ltd., Shenzhen, China). The sequencing depths and datasets obtained from the four sequencing strategies are summarised in Table 1.
2.4. Genome Survey and Preliminary Characterization
Prior to the final genome assembly, k-mer frequency distribution analysis was performed to characterize the preliminary genomic features of the strains. Quality-filtered clean short reads were subjected to k-mer analysis with a k-value of 21 using Jellyfish (v2.2.10) [11], and the resulting k-mer frequency spectra were fitted via GenomeScope 2.0 [12] to estimate genome size, heterozygosity level, and genomic repeat content. The obtained genomic survey results not only revealed the overall size and complexity of the genome but also guided the parameter optimization for subsequent genome assembly tools, while providing a reliable baseline for evaluating the size and completeness of the final assembled genome. Adapter trimming and strict quality filtering of short reads were conducted in advance to ensure the accuracy of downstream k-mer analysis and genome assembly [13,14].
2.5. Data Quality Control and T2T Assembly Pipeline
Raw sequencing reads from multiple platforms were firstly subjected to strict quality filtering and trimming to eliminate adapter sequences, low-quality bases, ultra-short fragments, and technical sequencing artifacts. Specifically, DNBSEQ short reads were processed and trimmed using fastp (v0.23.2) [13], Hi-C paired-end reads were cleaned with Trim Galore (v0.6.7) [14], and ultra-long ONT reads were filtered via Filtlong (v0.2.1) [15] to retain high-quality valid sequences for subsequent genome assembly. The cleaned ONT ultra-long reads were corrected and assembled de novo using NECAT [16] to generate the initial draft contigs. To improve assembly accuracy, iterative polishing was performed: the draft contigs were firstly polished for multiple rounds with Racon (v1.4.3) [17], with ONT reads realigned to the updated contig references using minimap2 [18] in each iteration. For the elimination of residual single-base and small structural errors, high-quality short reads were mapped to the polished contigs using BWA-MEM [19], followed by sorting and indexing of alignment files via SAMtools (v1.22.1) [20], and two additional rounds of base-level refinement were conducted using Pilon (v1.24) [21].
For chromosome-scale scaffolding, Juicer (v1.6) [22] and 3D-DNA [23] were applied to process Hi-C alignment data and construct chromosomal scaffolds, with Hi-C contact maps generated at a 100 kb resolution for structural evaluation. Preliminary assembly errors and structural abnormalities were manually inspected and corrected using Juicebox Assembly Tools [24]. The manually curated assembly was further processed to generate standardized chromosome-level FASTA sequences utilizing the assembly2agp and agp2fasta modules of CPhasing (v0.2.1, https://github.com/wangyibin/CPhasing) to optimize chromosomal grouping and structural ordering.
To achieve complete telomere-capped gapless genomes, FungalTeloExtender (v1.0.3, https://github.com/huowenyanabace/FungalTeloExtender) was employed with default parameters for systematic telomere motif identification and sequence extension.
The identical assembly pipeline with consistent software versions and parameter settings was uniformly applied for the de novo genome assembly of C. xanthothrix and C. saccharinus. Comprehensive assembly statistics and quality metrics of the two target species are summarized in Table 2. All final assemblies were gapless telomere-to-telomere (T2T) genomes with all chromosomal ends fully capped by the telomere motif AACCCT. The two assemblies achieved BUSCO completeness scores of 99.20% (C. xanthothrix) and 99.10% (C. saccharinus) based on the fungi_odb10 database, with respective QV values of 38.36 and 39.26. The uniformly assembled high-quality genomes provide reliable and comparable genomic resources for subsequent analyses of orthologous relationships, CAZyme annotation, synteny comparison, and gene family evolution.
2.6. Assembly Quality Validation
Assembly quality was evaluated using multiple complementary metrics. Contiguity and chromosome number were assessed from final scaffold statistics, including genome size, chromosome number, largest and smallest chromosome length, N50, N90, L50, and L90. Assembly contiguity was summarized using QUAST-style metrics [26], base-level accuracy was estimated using consensus quality value (QV) [27], and gene-space completeness was evaluated using BUSCO with an appropriate fungal lineage dataset [25]. Telomere completeness was assessed by searching chromosome termini for the canonical fungal telomeric repeat motifs 5-prime (AACCCT)n and 3-prime (AGGGTT)n. Hi-C contact maps were visualized and inspected using Hi-C contact-map analysis approaches [28] to assess chromosome-scale structural consistency.
2.7. Repetitive Element Annotation
Repetitive elements were annotated using a combined strategy that incorporated de novo repeat prediction and homology-based repeat searches. Repeat classes included retroelements, DNA transposons, rolling-circle elements, small RNA-related repeats, simple repeats, and low-complexity regions. RepeatModeler2 (v2.0.1), RepeatMasker (v4.2.2), and Repbase-supported searches were used to mask repeat sequences and summarize repeat composition [29,30,31]. Class-level repeat landscapes are reported in Table 3, and detailed family-level repeat compositions for CXA and CSA are provided in Tables S7 and S8, respectively.
2.8. Gene Prediction, Functional Annotation, and CAZyme Detection
Protein-coding genes were predicted using an integrated annotation strategy combining ab initio prediction with transcriptomic and homology-based evidence. RNA-seq reads were aligned to the genome using HISAT2 [32], and the resulting alignments were used as empirical evidence for an initial round of gene prediction with BRAKER v2.1.6 [33]. Final gene prediction and evidence integration were performed using MAKER v3.1.3 [34], incorporating de novo assembled transcripts generated with rnaSPAdes [35], transcripts from closely related species, homologous proteins retrieved from NCBI databases, and Augustus training parameters generated during the BRAKER analysis [36]. These predicted proteins were used for functional annotation with eggNOG-mapper v2.1.12 [37], which assigned GO, KEGG, and COG/KOG terms through homology-based searches against complete reference databases.
CAZymes were identified using run_dbcan v2.0.11 from the dbCAN2 suite [38] through three complementary approaches: HMMER searches against dbCAN HMM profiles (E-value < 1 × 10⁻⁵ and coverage > 0.35) [39], DIAMOND searches against CAZyDB (identity > 30% and coverage > 0.35) [40], and Hotpep peptide-based searches (frequency ≥ 2.6 and hits ≥ 6) [41]. To improve annotation reliability and minimize false-positive assignments, only genes supported by at least two of the three methods were retained in the final CAZyme catalogue. The identified CAZymes were classified as Glycoside Hydrolases (GHs), Glycosyl Transferases (GTs), Polysaccharide Lyases (PLs), Carbohydrate Esterases (CEs), Auxiliary Activities (AAs), and Carbohydrate-binding Modules (CBMs). Gene annotation statistics are summarized in Table 4, whereas class- and family-level CAZyme distributions are presented in Tables S1 and S2, respectively.
2.9. Genome Visualization and Circos Plot Generation
Genome-wide feature landscapes were visualized for both species. Chromosome ideograms, GC content, gene density, repeat density, and intragenomic synteny were summarized in Circos-style plots [42]. The window-based metrics for GC content, gene density, and repeat coverage were estimated using Bedtools (v2.30.0) [43] and seqtk (https://github.com/lh3/seqtk) with properly-sized sliding windows to balance resolution and visualization clarity. Hi-C contact matrices were used to visualize genome-wide and per-chromosome interaction patterns. These visualizations were used to support interpretation of chromosome integrity, genome organization, and feature distribution across the two T2T assemblies.
2.10. Comparative Genomics Framework
Comparative genomics included C. xanthothrix, C. saccharinus, and nine related fungal genomes: C. domesticus, C. radians, C. disseminatus, C. micaceus, Coprinopsis cinerea, Coprinopsis marcescibilis, Psathyrella aberdarensis, Agaricus bisporus, and Saccharomyces cerevisiae as the outgroup (Table S4). Orthology inference across the 11 fungal genomes was conducted with OrthoFinder v2.5.4 [44]. DIAMOND [40] was employed for rapid sequence-similarity searches, while multiple sequence alignments were generated using MAFFT [45]. Phylogenetic relationships among the sampled species were reconstructed using two complementary strategies: a maximum-likelihood analysis of the concatenated orthologue alignment with raxmlHPC-PTHREADS [46] and a multispecies coalescent analysis with ASTRAL v5.7.8 [47].
The divergence times of major evolutionary lineages were inferred with MCMCTree implemented in PAML v4.9 [48]. The split between S. cerevisiae and Psathyrellaceae was selected as the principal temporal constraint, with soft lower and upper bounds of 583 and 749 million years ago, respectively, based on the TimeTree database [49]. Markov chain Monte Carlo sampling was performed for 2,000,000 generations, of which the first 500,000 were discarded as burn-in. Adequate convergence was supported by effective sample sizes exceeding 200 for all estimated parameters. The posterior median divergence ages and associated 95% highest posterior density intervals for the principal nodes are provided in Table S6.
2.11. Gene Family Evolution and Functional Enrichment
Gene-family expansion and contraction were estimated using CAFE [50] based on the dated species tree and orthogroup counts. Terminal and internal branches were examined for expanded and contracted gene families, genes gained and lost, and rapidly evolving families. Expanded gene families in C. xanthothrix and C. saccharinus were subjected to GO and KEGG enrichment analyses using enrichment-analysis workflows such as clusterProfiler [51]. KEGG pathway identifiers shown in enrichment figures were interpreted using the pathway-name mapping in Table S9.
2.12. Synteny Analysis and Ks-Based Duplication Assessment
Chromosome-scale synteny was evaluated among selected Coprinellus species using pairwise genome alignment and syntenic block detection [43,52]. Macrosynteny was visualized for C. xanthothrix with C. domesticus and C. radians, and for C. saccharinus with C. disseminatus. Dot-plot analyses were generated for C. xanthothrix versus C. domesticus, C. xanthothrix versus C. radians, and C. saccharinus versus C. disseminatus. Synonymous substitution rate (Ks) distributions were calculated for paralogous gene pairs within C. xanthothrix and C. saccharinus and for orthologous gene pairs between C. xanthothrix and C. domesticus, C. xanthothrix and C. radians, C. saccharinus and C. disseminatus, and C. saccharinus and C. micaceus [53].
2.13. Data Visualization and Statistical Software
Final plots were prepared from the processed assembly, annotation, orthology, enrichment, synteny, and Ks outputs. Statistical summaries were reported directly from the corresponding tables and figure source files. Unless otherwise specified, descriptive comparisons were based on observed counts, proportions, assembly metrics, enrichment outputs, and divergence-time estimates generated by the pipelines described above. Custom scripts written in Python v3.11 and R v4.5 were used to process the data and generate the figures. The complete source code supporting these analyses and visualizations is publicly available in the GitHub repository (https://github.com/huowenyanabace/T2Tfungi_custom_scripts.git).
3. Results
3.1. Sequencing Data Generation and Coverage Statistics
Multi-platform sequencing generated sufficient data for chromosome-complete assembly and annotation of both Coprinellus species (Table 1). For C. xanthothrix, DNBSEQ short-read sequencing produced 15.22 Gb of raw data and 15.12 Gb of clean data, corresponding to 101.48 million raw reads, 101.47 million clean reads, and approximately 324x coverage. ONT long-read sequencing generated 10.76 Gb raw data and 10.38 Gb clean data, with 1.77 million raw reads, 1.62 million clean reads, and approximately 228x coverage. Hi-C sequencing generated 10.85 Gb raw data and 10.84 Gb clean data, corresponding to 36.18 million raw and clean reads and approximately 231x coverage. RNA-seq produced 5.49 Gb of raw data and 0.11 million raw reads for transcript-supported gene annotation.
For C. saccharinus, short-read sequencing generated 10.28 Gb raw data and 10.03 Gb clean data, corresponding to 68.52 million raw reads, 67.92 million clean reads, and approximately 187x coverage (Table 1). ONT sequencing generated 12.57 Gb raw data and 11.96 Gb clean data, with 0.54 million raw reads, 0.50 million clean reads, and approximately 229x coverage. Hi-C sequencing produced 19.11 Gb raw data and 19.09 Gb clean data, corresponding to 63.69 million raw and clean reads and approximately 349x coverage. RNA-seq generated 9.12 Gb of raw data and 0.19 million raw reads. These datasets provided complementary long-read, short-read, chromosome-conformation, and transcriptomic evidence for the two assemblies.
3.2. T2T Assembly Quality, Structural Validation, and Telomere Integrity
Both C. xanthothrix and C. saccharinus were assembled into telomere-to-telomere (T2T) chromosome-scale genomes (Table 2; Figure 1). The C. xanthothrix genome was 46.92 Mb and consisted of 13 gapless chromosomes. Its largest chromosome was Chr01 at 5.08 Mb and its smallest chromosome was Chr13 at 2.22 Mb. The assembly had a GC content of 53.72%, N50 of 4,017,987 bp, N90 of 2,528,967 bp, L50 of 6, L90 of 11, QV of 38.36, and BUSCO completeness of 99.20%. The C. saccharinus assembly was larger, at 54.81 Mb, and also consisted of 13 gapless chromosomes. Its largest chromosome was Chr01 at 7.31 Mb and its smallest chromosome was Chr13 at 0.84 Mb. The C. saccharinus assembly had a GC content of 53.79%, N50 of 5,059,299 bp, N90 of 3,343,676 bp, L50 of 5, L90 of 11, QV of 39.26, and BUSCO completeness of 99.10%.
Hi-C contact maps supported the chromosome-scale organization of both assemblies (Figure 1A, B). The interaction matrices showed strong intrachromosomal contact patterns for each chromosome, consistent with the 13-chromosome assembly structure. Per-chromosome Hi-C heatmaps further supported the structural integrity of all 13 C. xanthothrix chromosomes (Figure S1) and all 13 C. saccharinus chromosomes (Figure S2). Chromosome ideograms showed continuous chromosome models with terminal telomere extensions at both ends (Figure 1C,D). Telomere analysis identified the expected 5-prime (AACCCT)n and 3-prime (AGGGTT)n motifs and recovered 26 of 26 telomere-capped chromosome ends in each species (Table 2; Table S5). Terminal extension lengths varied among chromosomes and termini; for example, C. xanthothrix Chr01 had a 155,584 bp 3-prime extension and a 34,865 bp 5-prime extension, whereas C. saccharinus Chr01 had a 153,876 bp 3-prime extension and a 921 bp 5-prime extension (Table S5).
3.3. Chromosome-Level Genomic Landscapes
Circos plots summarized genome-wide feature distributions across the two T2T assemblies (Figure 2). The outer chromosome tracks showed the 13 assembled chromosomes of C. xanthothrix and C. saccharinus, while inner tracks displayed GC content, gene density, repeat density, and intragenomic synteny ribbons. The visualization showed that both genomes have chromosome-wide variation in gene and repeat density, with repeat-enriched regions contributing to local heterogeneity. Intragenomic synteny links indicated duplicated or homologous segments within each genome. Together with the Hi-C evidence in Figure 1 and Figures S1-S2, the Circos plots support the interpretation that both assemblies provide complete chromosome frameworks suitable for repeat, gene-density, and synteny analyses.
3.4. Repetitive Element Landscapes
Repeat annotation revealed a larger repeat fraction in C. saccharinus than in C. xanthothrix (Table 3; Table S7; Table S8). In C. xanthothrix, interspersed repeats covered 3,735,248 bp, corresponding to 7.96% of the genome. In C. saccharinus, interspersed repeats covered 6,617,796 bp, corresponding to 12.07% of the genome. Retroelements accounted for much of this difference: C. xanthothrix contained 1,649,099 bp of retroelements (3.51%), whereas C. saccharinus contained 4,424,077 bp (8.07%). DNA transposons were more similar between the two species, covering 160,597 bp in C. xanthothrix and 160,697 bp in C. saccharinus.
Detailed repeat-family summaries showed that total masked sequence reached 4,123,325 bp (8.79%) in C. xanthothrix (Table S7) and 6,975,358 bp (12.73%) in C. saccharinus (Table S8). LINEs were especially expanded in C. saccharinus, covering 1,710,455 bp (3.12%) compared with 209,191 bp (0.45%) in C. xanthothrix. LTR retrotransposons also occupied more sequence in C. saccharinus than in C. xanthothrix, with 2,653,814 bp (4.84%) in C. saccharinus and 1,427,245 bp (3.04%) in C. xanthothrix. Within LTRs, Ty1/Copia elements covered 430,822 bp in C. xanthothrix and 906,798 bp in C. saccharinus, while Gypsy/DIRS1 elements covered 818,928 bp in C. xanthothrix and 1,517,994 bp in C. saccharinus. These results indicate that the larger C. saccharinus genome is associated mainly with higher retroelement content rather than with changes in GC content or chromosome number.
3.5. Gene Prediction, Functional Annotation, and CAZyme Repertoire
Gene prediction identified 11,205 high-confidence protein-coding genes in C. xanthothrix and 11,881 in C. saccharinus (Table 4). Functional annotation rates were broadly comparable between the two species. In C. xanthothrix, 3,645 genes (32.53%) were assigned GO terms, 4,563 genes (40.72%) received KEGG KO annotations, 2,862 genes (25.54%) were assigned KEGG pathway annotations, and 8,325 genes (74.30%) were assigned COG annotations. In C. saccharinus, 3,690 genes (31.06%) were assigned GO terms, 4,717 genes (39.70%) received KEGG KO annotations, 2,929 genes (24.65%) were assigned KEGG pathway annotations, and 8,733 genes (73.50%) were assigned COG annotations. The number of unique GO terms, KOs, pathways, and COG categories was also similar, with C. xanthothrix containing 10,173 unique GO terms, 3,298 KOs, 750 pathways, and 24 COG categories, and C. saccharinus containing 10,220 unique GO terms, 3,318 KOs, 752 pathways, and 24 COG categories.
CAZyme annotation showed that C. xanthothrix and C. saccharinus have comparable carbohydrate-active enzyme repertoires (Table S1). C. xanthothrix contained 480 predicted CAZymes, including 166 glycoside hydrolases (GH), 65 glycosyltransferases (GT), 17 polysaccharide lyases (PL), 36 carbohydrate esterases (CE), 92 auxiliary activity enzymes (AA), and 104 carbohydrate-binding modules (CBM). C. saccharinus contained 504 predicted CAZymes, including 181 GH, 67 GT, 17 PL, 34 CE, 99 AA, and 106 CBM. Family-level CAZyme distributions across C. xanthothrix, C. saccharinus, and related fungi are provided in Table S2, which lists 151 CAZyme families and supports more detailed comparisons of carbohydrate metabolism potential.
3.6. Comparative Genomics and Orthologous Group Identification
Orthogroup analysis was performed across 11 fungal genomes (Table 5 and Tables 5 and S4). The comparative dataset included C. xanthothrix, C. saccharinus, C. domesticus, C. radians, C. disseminatus, C. micaceus, Coprinopsis cinerea, Coprinopsis marcescibilis, Psathyrella aberdarensis, Agaricus bisporus, and Saccharomyces cerevisiae as the outgroup (Table S4). Orthogroup input gene counts varied among species, ranging from 4,399 genes in S. cerevisiae to 20,758 genes in C. micaceus (Table 5). The orthogroup input set contained 13,046 genes for C. xanthothrix and 15,802 genes for C. saccharinus; these values reflect the orthology-analysis input context and should not be interpreted as identical to the high-confidence gene counts reported in Table 4.
Species-specific and single-copy gene counts also varied among taxa (Table 5). C. xanthothrix had 45 species-specific genes and 5,702 single-copy genes, while C. saccharinus had 109 species-specific genes and 6,662 single-copy genes. Other Coprinellus species showed different species-specific gene counts, including 180 in C. disseminatus, 32 in C. domesticus, 1068 in C. micaceus, and 32 in C. radians. These orthology results provided the basis for single-copy phylogenetic reconstruction, divergence-time estimation, and downstream gene-family expansion and contraction analysis.
3.7. Phylogenetic Reconstruction, Divergence Time Estimation, and Gene-Family Evolution
Phylogenetic analysis placed C. xanthothrix and C. saccharinus in separate Coprinellus lineages (Figure 3). C. xanthothrix grouped with C. radians, whereas C. saccharinus grouped with C. micaceus. Divergence-time estimates showed that the split between C. radians and C. xanthothrix occurred at 54.4 Ma, with a 95% highest posterior density interval of 43.6-66.9 Ma (Table S6). The split between C. saccharinus and C. micaceus was estimated at 32.8 Ma, with a 95% interval of 20.9-54.9 Ma. Deeper nodes included the divergence between the C. disseminatus/C. saccharinus/C. micaceus lineage and the C. domesticus/C. radians/C. xanthothrix lineage at 156.6 Ma, and the divergence between C. domesticus and the C. radians/C. xanthothrix lineage at 75.8 Ma (Table S6).
CAFE analysis identified extensive gene-family changes across the phylogeny (Figure 3; Table S3). On the C. xanthothrix terminal branch, 536 gene families were expanded, corresponding to 1,235 genes gained, while 471 gene families were contracted, corresponding to 583 genes lost. This branch included 83 rapidly expanded families and 26 rapidly contracted families, for 109 total rapidly changing families. On the C. saccharinus terminal branch, 606 gene families were expanded, corresponding to 980 genes gained, while 1,142 families were contracted, corresponding to 1,543 genes lost. C. saccharinus showed 51 rapidly expanded families and 83 rapidly contracted families, for 134 total rapidly changing families. Among related species, C. micaceus showed particularly extensive expansion, with 2,264 expanded families, 4,803 genes gained, and 234 rapidly expanded families (Table S3).
3.8. GO and KEGG Enrichment of Expanded Gene Families
Expanded gene families in C. xanthothrix and C. saccharinus were enriched for functions related to nucleotide metabolism, DNA synthesis and repair, redox processes, and cellular organization (Figure 4 and Figure 5; Table S9). In C. xanthothrix, GO enrichment included terms associated with deoxyribonucleotide metabolism, ribonucleoside-diphosphate reductase activity, oxidoreductase activity, and other processes connected to nucleotide supply and redox balance (Figure 4A). KEGG enrichment in C. xanthothrix included purine metabolism (map00230), pyrimidine metabolism (map00240), glutathione metabolism (map00480), drug metabolism—other enzymes (map00983), homologous recombination (map03440), endocytosis (map04144), and regulation of actin cytoskeleton (map04810), as mapped in Table S9 (Figure 4B).
In C. saccharinus, GO enrichment highlighted mitotic chromosome migration, spindle checkpoint, chromosome segregation, and related cell-cycle processes (Figure 5A). KEGG enrichment included purine metabolism (map00230), pyrimidine metabolism (map00240), glutathione metabolism (map00480), DNA replication (map03030), homologous recombination (map03440), Fanconi anemia pathway (map03460), cell cycle—yeast (map04111), meiosis—yeast (map04113), endocytosis (map04144), and regulation of actin cytoskeleton (map04810), among other pathway IDs listed in Table S9 (Figure 5B). Several KEGG pathway names in Table S9 are named from animal disease or cellular systems; in this fungal context, they are interpreted as conserved molecular modules rather than literal disease phenotypes. Overall, the enrichment results support the hypothesis that lineage-specific expansions in C. xanthothrix and C. saccharinus involved nucleotide metabolism, DNA replication and repair, oxidative stress-related metabolism, and cellular proliferation or organization.
3.9. Genomic Synteny and Ks-Based Evolutionary Trajectory Detection
Chromosome-scale synteny analysis showed both conservation and rearrangement among Coprinellus genomes (Figure 6). For the C. xanthothrix comparison, C. domesticus contained 15 chromosomes, whereas C. xanthothrix and C. radians each contained 13 chromosomes (Figure 6A). Synteny links connected many homologous chromosomal regions across the three genomes, indicating retained macrosynteny, but cross-chromosomal links also indicated lineage-specific rearrangements. For the C. saccharinus comparison, C. saccharinus contained 13 chromosomes and C. disseminatus contained 15 chromosomes in the plotted comparison (Figure 6B). The synteny plot showed multiple chromosome-to-chromosome correspondences as well as rearranged segments between the two genomes. Dot-plot analyses further supported these pairwise relationships for C. xanthothrix versus C. domesticus, C. xanthothrix versus C. radians, and C. saccharinus versus C. disseminatus (Figure S3).
Ks distributions provided an additional view of duplication and divergence history (Figure 7). In C. xanthothrix, paralogous gene pairs showed a distribution distinct from the orthologous comparisons with C. domesticus and C. radians (Figure 7A). The ortholog distribution between C. xanthothrix and C. radians was consistent with the closer phylogenetic relationship between these species, whereas the comparison between C. xanthothrix and C. domesticus represented a more distant relationship. In C. saccharinus, paralogous pairs and orthologous pairs with C. disseminatus and C. micaceus showed corresponding differences in Ks distributions (Figure 7B). The comparison between C. saccharinus and C. micaceus was consistent with the close phylogenetic placement of these species. Neither C. xanthothrix nor C. saccharinus showed a dominant recent paralogous Ks peak that would support a clear recent whole-genome duplication event. Instead, the data are more consistent with lineage-specific small-scale duplication, gene-family expansion, and chromosome-level rearrangement.
4. Discussion
The two assemblies reported here add chromosome-end-resolved genomic resources for Coprinellus. Both C. xanthothrix and C. saccharinus were assembled into 13 gapless chromosomes with complete telomere recovery, high BUSCO completeness, and high consensus QV. These characteristics are important because T2T genomes reduce uncertainty in subtelomeric regions and repeat-rich intervals, which are often difficult to reconstruct with fragmented assemblies [1,2,3,4,5,6]. For comparative genomics, the use of a common assembly and annotation workflow also reduces technical variation when interpreting genome size, repeat proportion, gene-family dynamics, and synteny across species.
The assembly statistics support both shared architecture and species-specific divergence. Both species have 13 chromosomes and almost identical GC content, but C. saccharinus is 7.89 Mb larger than C. xanthothrix. Repeat annotation indicates that retroelement content explains a substantial fraction of this difference. C. saccharinus contains more than twice the retroelement sequence of C. xanthothrix, with especially higher LINE and LTR element coverage. Similar observations in other T2T fungal genomes have shown that complete assemblies improve the ability to quantify repetitive and chromosome-terminal sequence [3,4,5,6]. In the present data, the larger C. saccharinus genome therefore appears to reflect repeat accumulation rather than a broad change in gene number or GC content.
The gene annotation results show comparable functional capacity between the two species. C. saccharinus has more high-confidence genes than C. xanthothrix, but annotation rates for GO, KEGG, KEGG pathway, and COG categories are similar. CAZyme repertoires are also broadly comparable, with C. saccharinus carrying 504 predicted CAZymes and C. xanthothrix carrying 480. Because both species are saprotrophic, carbohydrate-active enzymes are expected to be relevant to organic matter decomposition. However, the class-level differences observed here are modest, and the current evidence does not support a strong functional shift in CAZyme repertoire alone. More specific ecological or substrate-use hypotheses would require transcriptomic profiling under defined substrate conditions and manual curation of family-level CAZyme functions.
The dated phylogeny places the divergence between C. xanthothrix and C. radians at 54.4 Ma and that between C. saccharinus and C. micaceus at 32.8 Ma. These estimates place the focal terminal divergences within the Paleogene, a period characterized by greenhouse climates, the Paleocene–Eocene Thermal Maximum, the Early Eocene Climatic Optimum, and subsequent long-term Cenozoic climatic reorganization [54,55]. The PETM and early Eocene hyperthermal intervals were associated with major carbon-cycle perturbations, rapid warming, vegetation turnover, range shifts, and changes in terrestrial ecosystem structure [5,6,7]. In Neotropical records, rapid warming across the Paleocene–Eocene boundary was associated with increased plant diversity and origination rates, suggesting that warm and reorganized ecosystems created new ecological opportunities for associated organisms [57].
Within this broader context, the Paleogene divergence of C. xanthothrix and C. saccharinus from their close relatives may have been associated with global warming, vegetation turnover, restructuring of plant-derived habitats, and ecological niche reorganization. Changes in forest composition could have altered the abundance, chemical composition, and decomposition stages of deadwood, leaf litter, and other plant residues, while simultaneously modifying microhabitat temperature, moisture, redox conditions, and competitive interactions. Under increasingly heterogeneous substrate conditions and fluctuating microenvironments, the expansion of gene families associated with nucleotide metabolism, DNA replication and repair, glutathione metabolism, and redox regulation may have contributed to nucleotide supply during hyphal growth, maintenance of genome stability, and tolerance of oxidative stress. Expansions involving endocytosis, cytoskeletal regulation, and cell-cycle processes may likewise have supported hyphal proliferation, nutrient acquisition, and colonization of newly available substrates. Together, these changes could have facilitated adaptation to heterogeneous plant residues and dynamic microhabitats, thereby contributing to lineage establishment and ecological differentiation in C. xanthothrix and C. saccharinus. This interpretation should nevertheless be regarded as a testable evolutionary hypothesis rather than a direct causal conclusion because the present study does not include fossil calibrations within Coprinellus, ancestral niche reconstruction, paleodistribution modelling, or experimental functional validation. Future substrate-utilization assays, stress treatments, transcriptomic analyses, and targeted gene-function studies will be required to evaluate these proposed relationships.
The synteny and Ks results refine the evolutionary interpretation. Macrosynteny plots show that substantial collinearity is retained among related Coprinellus genomes, but the cross-chromosome ribbons indicate rearrangements after species divergence. The 13-chromosome assemblies of C. xanthothrix and C. saccharinus, compared with 15-chromosome configurations in C. domesticus and C. disseminatus in the plotted comparisons, suggest that chromosome fusion, fission, translocation, or assembly/annotation differences may contribute to the observed patterns. The current evidence supports chromosome-level reorganization, but the exact mechanisms cannot be resolved without breakpoint-level analysis and manual validation.
Ks distributions are consistent with the dated phylogeny: lower-Ks ortholog peaks occur for the closer species pairs C. xanthothrix-C. radians and C. saccharinus-C. micaceus, while more distant comparisons show broader or higher-Ks distributions. The paralogous distributions in C. xanthothrix and C. saccharinus do not show a dominant recent peak typical of a clear whole-genome duplication signature. Accordingly, the most conservative interpretation is that retained paralogs and segmental or small-scale duplications contribute to the observed patterns, while no strong evidence for a recent WGD event is present in either focal species.
Because this study is primarily based on genome assemblies and comparative computational analyses, the biological implications inferred from the functional enrichment analyses should be regarded as testable hypotheses. The proposed Paleogene ecological scenario is supported by divergence-time estimates and published paleoclimate evidence, while direct ecological reconstruction of these fungal lineages remains an important direction for future research. Future studies integrating transcriptomic analyses under defined substrate and stress conditions, population-level sampling, manual curation of expanded gene families, breakpoint-level synteny analyses, and functional validation of genes involved in nucleotide metabolism, DNA repair, redox regulation, and cell-cycle control will help to further test and refine these evolutionary interpretations.
5. Conclusions
This study generated T2T genome assemblies for C. xanthothrix and C. saccharinus, each resolved into 13 gapless chromosomes with complete telomere recovery and high assembly completeness. Comparative analyses showed that C. saccharinus has a larger and more repeat-rich genome than C. xanthothrix, largely because of its greater retroelement content, whereas the two species retain broadly comparable functional annotation profiles and CAZyme repertoires. Phylogenomic analysis grouped C. xanthothrix with C. radians and C. saccharinus with C. micaceus, with terminal divergences estimated at 54.4 and 32.8 Ma, respectively. Gene-family analyses identified lineage-specific expansions enriched in nucleotide metabolism, DNA replication and repair, glutathione metabolism, redox regulation, endocytosis, cytoskeletal organization, and cell-cycle processes. Synteny and Ks analyses further revealed chromosome-level conservation and rearrangement together with lineage-specific small-scale duplication, but provided no strong evidence of recent whole-genome duplication.
The Paleogene timing of the focal divergences, considered together with lineage-specific gene-family expansions, suggests a possible association between long-term environmental reorganization and ecological differentiation in C. xanthothrix and C. saccharinus. This interpretation remains a testable evolutionary hypothesis rather than a causal conclusion and will require paleobiogeographic reconstruction and experimental functional validation. Collectively, the two T2T genomes provide chromosome-complete references for investigating genome evolution, ecological adaptation, and functional diversification in saprotrophic Coprinellus lineages.
Supplementary Materials
The following supporting information can be downloaded at the website of this paper posted on Preprints.org.
Author Contributions
Conceptualization, M.Y., H.L., and W.H.; methodology, M.Y., H.L., X.H., and W. H.; software, M.Y., H.L. and X.H.; validation, L.Z., Y.L., P.Q., L.D., and T.Q.; formal analysis, M.Y., and H.L.; investigation, L.Z., Y.L., P.Q., L.D., and T.Q.; resources, L.Z., Y.L., P.Q., L.D., and W.H.; data curation, M.Y., and H.L.; writing—original draft preparation, M.Y., and H.L.; writing—review and editing, M.Y., and H.L.; visualization, M.Y., and H.L.; supervision, M.Y., and H.L.; project administration, M.Y., and H.L.; funding acquisition, W.H., and J.L.. All authors have read and agreed to the published version of the manuscript.
Funding
This research was funded by National Key R&D program of China (grant number 2021YFD1600400), and Shaanxi Academy of Sciences Platform Project (grant number 2025k-37). The APC was funded by National Key R&D program of China (grant number 2021YFD1600400).
Conflicts of Interest
The authors declare no conflicts of interest.
References
- Li, H.; Durbin, R. Genome assembly in the telomere-to-telomere era. Nat. Rev. Genet. 2024, 25, 658–670. [Google Scholar] [CrossRef]
- Nurk, S.; et al. The complete sequence of a human genome. Science 2022, 376, 44–53. [Google Scholar] [CrossRef]
- Bowyer, P.; Currin, A.; Delneri, D.; Fraczek, M.G. Telomere-to-telomere genome sequence of the model mould pathogen Aspergillus fumigatus. Nat. Commun. 2022, 13, 5394. [Google Scholar] [CrossRef]
- Sonnenberg, A.S.M.; et al. Telomere-to-telomere assembled and centromere annotated genomes of the two main subspecies of the button mushroom Agaricus bisporus reveal especially polymorphic chromosome ends. Sci. Rep. 2020, 10, 14653. [Google Scholar] [CrossRef] [PubMed]
- Wang, M.; et al. Telomere-to-telomere genome assembly of Tibetan medicinal mushroom Ganoderma leucocontextum and the first Copia centromeric retrotransposon in macro-fungi genome. J. Fungi 2024, 10, 15. [Google Scholar] [CrossRef] [PubMed]
- Han, J.-N.; et al. Haplotype-resolved telomere-to-telomere genome assembly of the dikaryotic fungus pathogen Rhizoctonia cerealis. Sci. Data 2025, 12, 951. [Google Scholar] [CrossRef] [PubMed]
- Redhead, S.A.; Vilgalys, R.; Moncalvo, J.-M.; Johnson, J.; Hopple, J.S., Jr. Coprinus Pers. and the disposition of Coprinus species sensu lato. Taxon 2001, 50, 203–241. [Google Scholar] [CrossRef] [PubMed]
- Nagy, L.G.; Hazi, J.; Vagvolgyi, C.; Papp, T. Phylogeny and species delimitation in the genus Coprinellus with special emphasis on the haired species. Mycologia 2012, 104, 254–275. [Google Scholar] [CrossRef] [PubMed]
- Stajich, J.E.; et al. Insights into evolution of multicellular fungi from the assembled chromosomes of the mushroom Coprinopsis cinerea (Coprinus cinereus). Proc. Natl. Acad. Sci. USA 2010, 107, 11889–11894. [Google Scholar] [CrossRef] [PubMed]
- Fabros, R.J.P.; Dulay, R.M.R. Status review of the distribution, biological compounds, and bioactivities of Coprinellus mushrooms, and their medicinal and biotechnological prospects. Stud. Fungi 2025, 10, e0250024. [Google Scholar] [CrossRef]
- Marcais, G.; Kingsford, C. A fast, lock-free approach for efficient parallel counting of occurrences of k-mers. Bioinformatics 2011, 27, 764–770. [Google Scholar] [CrossRef] [PubMed]
- Ranallo-Benavidez, T.R.; Jaron, K.S.; Schatz, M.C. GenomeScope 2.0 and Smudgeplot for reference-free profiling of polyploid genomes. Nat. Commun. 2020, 11, 1432. [Google Scholar] [CrossRef] [PubMed]
- Chen, S.; et al. fastp: an ultra-fast all-in-one FASTQ preprocessor. Bioinformatics 2018, 34, i884–i890. [Google Scholar] [CrossRef] [PubMed]
- Krueger, F. Trim Galore: A wrapper tool around Cutadapt and FastQC to consistently apply quality and adapter trimming to FastQ files. Babraham Bioinformatics. 2015. Available online: https://github.com/FelixKrueger/TrimGalore.
- Wick, R.R. Filtlong: A tool for filtering long reads by quality. GitHub. 2017. Available online: https://github.com/rrwick/Filtlong.
- Chen, Y.; et al. Efficient assembly of nanopore reads via highly accurate and intact error correction. Nat. Commun. 2021, 12, 60. [Google Scholar] [CrossRef] [PubMed]
- Vaser, R.; et al. Fast and accurate de novo genome assembly from long uncorrected reads. Genome Res. 2017, 27, 737–746. [Google Scholar] [CrossRef] [PubMed]
- Li, H. Minimap2: pairwise alignment for nucleotide sequences. Bioinformatics 2018, 34, 3094–3100. [Google Scholar] [CrossRef] [PubMed]
- Vasimuddin, M.; et al. Efficient architecture-aware acceleration of BWA-MEM for multicore systems. In 2019 IEEE International Parallel and Distributed Processing Symposium (IPDPS); IEEE: Rio de Janeiro, Brazil, 2019; pp. 314–324. [Google Scholar] [CrossRef]
- Li, H.; et al. The Sequence Alignment/Map format and SAMtools. Bioinformatics 2009, 25, 2078–2079. [Google Scholar] [CrossRef] [PubMed]
- Walker, B.J.; et al. Pilon: an integrated tool for comprehensive microbial variant detection and assembly improvement. PLoS ONE 2014, 9, e112963. [Google Scholar] [CrossRef] [PubMed]
- Durand, N.C.; et al. Juicer provides a one-click system for analyzing loop-resolution Hi-C experiments. Cell Syst. 2016, 3, 95–98. [Google Scholar] [CrossRef] [PubMed]
- Dudchenko, O.; et al. De novo assembly of the Aedes aegypti genome using Hi-C yields chromosome-length scaffolds. Science 2017, 356, 92–95. [Google Scholar] [CrossRef] [PubMed]
- Dudchenko, O.; et al. The Juicebox Assembly Tools module facilitates de novo assembly of mammalian genomes with chromosome-length scaffolds for under $1000. bioRxiv 2018. [Google Scholar] [CrossRef]
- Simao, F.A.; et al. BUSCO: assessing genome assembly and annotation completeness with single-copy orthologs. Bioinformatics 2015, 31, 3210–3212. [Google Scholar] [CrossRef] [PubMed]
- Gurevich, A.; et al. QUAST: quality assessment tool for genome assemblies. Bioinformatics 2013, 29, 1072–1075. [Google Scholar] [CrossRef] [PubMed]
- Rhie, A.; et al. Merqury: reference-free quality, completeness, and phasing assessment for genome assemblies. Genome Biol. 2020, 21, 245. [Google Scholar] [CrossRef] [PubMed]
- Wolff, J.; et al. Galaxy HiCExplorer 3: a web server for reproducible Hi-C, capture Hi-C and single-cell Hi-C data analysis, quality control and visualization. Nucleic Acids Res. 2020, 48, W177–W184. [Google Scholar] [CrossRef] [PubMed]
- Flynn, J.M.; et al. RepeatModeler2 for automated genomic discovery of transposable element families. Proc. Natl. Acad. Sci. USA 2020, 117, 9451–9457. [Google Scholar] [CrossRef] [PubMed]
- Tarailo-Graovac, M.; Chen, N. Using RepeatMasker to identify repetitive elements in genomic sequences. Curr. Protoc. Bioinform. 2009, Chapter 4, 4.10.1–4.10.14. [Google Scholar] [CrossRef] [PubMed]
- Bao, W.; Kojima, K.K.; Kohany, O. Repbase Update, a database of repetitive elements in eukaryotic genomes. Mob. DNA 2015, 6, 11. [Google Scholar] [CrossRef] [PubMed]
- Kim, D.; et al. Graph-based genome alignment and genotyping with HISAT2 and HISAT-genotype. Nat. Biotechnol. 2019, 37, 907–915. [Google Scholar] [CrossRef] [PubMed]
- Hoff, K.J.; Lange, S.; Lomsadze, A.; Borodovsky, M.; Stanke, M. BRAKER1: Unsupervised RNA-Seq-Based Genome Annotation with GeneMark-ET and AUGUSTUS. Bioinformatics 2016, 32, 767–769. [Google Scholar] [CrossRef] [PubMed]
- Cantarel, B.L.; et al. MAKER: an easy-to-use annotation pipeline designed for emerging model organism genomes. Genome Res. 2008, 18, 188–196. [Google Scholar] [CrossRef] [PubMed]
- Bushmanova, E.; et al. rnaSPAdes: a de novo transcriptome assembler and its application to RNA-Seq data. GigaScience 2019, 8, giz100. [Google Scholar] [CrossRef] [PubMed]
- Stanke, M.; et al. AUGUSTUS: a web server for gene finding in eukaryotes. Nucleic Acids Res. 2004, 32, W309–W312. [Google Scholar] [CrossRef] [PubMed]
- Cantalapiedra, C.P.; et al. eggNOG-mapper v2: functional annotation, orthology assignments, and domain prediction at the metagenomic scale. Mol. Biol. Evol. 2021, 38, 5825–5829. [Google Scholar] [CrossRef] [PubMed]
- Zhang, H.; et al. dbCAN2: a meta server for automated carbohydrate-active enzyme annotation. Nucleic Acids Res. 2018, 46, W95–W101. [Google Scholar] [CrossRef] [PubMed]
- Eddy, S.R. Accelerated profile HMM searches. PLoS Comput. Biol. 2011, 7, e1002195. [Google Scholar] [CrossRef] [PubMed]
- Buchfink, B.; Reuter, K.; Drost, H.G. Sensitive protein alignments at tree-of-life scale using DIAMOND. Nat. Methods 2021, 18, 366–368. [Google Scholar] [CrossRef] [PubMed]
- Busk, P.K.; et al. Homology to peptide pattern for annotation of carbohydrate-active enzymes and prediction of function. BMC Bioinform. 2017, 18, 214. [Google Scholar] [CrossRef] [PubMed]
- Krzywinski, M.; et al. Circos: an information aesthetic for comparative genomics. Genome Res. 2009, 19, 1639–1645. [Google Scholar] [CrossRef] [PubMed]
- Quinlan, A.R.; Hall, I.M. BEDTools: a flexible suite of utilities for comparing genomic features. Bioinformatics 2010, 26, 841–842. [Google Scholar] [CrossRef] [PubMed]
- Emms, D.M.; Kelly, S. OrthoFinder: phylogenetic orthology inference for comparative genomics. Genome Biol. 2019, 20, 238. [Google Scholar] [CrossRef] [PubMed]
- Katoh, K.; et al. MAFFT: a novel method for rapid multiple sequence alignment based on fast Fourier transform. Nucleic Acids Res. 2002, 30, 3059–3066. [Google Scholar] [CrossRef] [PubMed]
- Stamatakis, A. RAxML version 8: a tool for phylogenetic analysis and post-analysis of large phylogenies. Bioinformatics 2014, 30, 1312–1313. [Google Scholar] [CrossRef] [PubMed]
- Zhang, C.; et al. ASTRAL-III: polynomial time species tree reconstruction from partially resolved gene trees. BMC Bioinform. 2018, 19, 153. [Google Scholar] [CrossRef] [PubMed]
- Yang, Z. PAML 4: phylogenetic analysis by maximum likelihood. Mol. Biol. Evol. 2007, 24, 1586–1591. [Google Scholar] [CrossRef] [PubMed]
- Kumar, S.; et al. TimeTree 5: an expanded resource for species divergence times. Mol. Biol. Evol. 2022, 39, msac174. [Google Scholar] [CrossRef] [PubMed]
- De Bie, T.; Cristianini, N.; Demuth, J.P.; Hahn, M.W. CAFE: a computational tool for the study of gene family evolution. Bioinformatics 2006, 22, 1269–1271. [Google Scholar] [CrossRef] [PubMed]
- Wu, T.; et al. clusterProfiler 4.0: a universal enrichment tool for interpreting omics data. Innovation 2021, 2, 100141. [Google Scholar] [CrossRef] [PubMed]
- Tang, H.; et al. JCVI: a versatile toolkit for comparative genomics analysis. iMeta 2024, 3, e211. [Google Scholar] [CrossRef] [PubMed]
- Zwaenepoel, A.; Van de Peer, Y. wgd: simple command line tools for the analysis of ancient whole-genome duplications. Bioinformatics 2019, 35, 2153–2155. [Google Scholar] [CrossRef] [PubMed]
- Zachos, J.C.; Dickens, G.R.; Zeebe, R.E. An early Cenozoic perspective on greenhouse warming and carbon-cycle dynamics. Nature 2008, 451, 279–283. [Google Scholar] [CrossRef] [PubMed]
- Westerhold, T.; et al. An astronomically dated record of Earth’s climate and its predictability over the last 66 million years. Science 2020, 369, 1383–1387. [Google Scholar] [CrossRef] [PubMed]
- McInerney, F.A.; Wing, S.L. The Paleocene-Eocene Thermal Maximum: A perturbation of carbon cycle, climate, and biosphere with implications for the future. Annu. Rev. Earth Planet. Sci. 2011, 39, 489–516. [Google Scholar] [CrossRef]
- Jaramillo, C.; et al. Effects of rapid global warming at the Paleocene-Eocene boundary on Neotropical vegetation. Science 2010, 330, 957–961. [Google Scholar] [CrossRef] [PubMed]
Figure 1.
Telomere-to-telomere genome assemblies of C. xanthothrix and C. saccharinus. (A, B) Genome-wide Hi-C contact maps at 100-kb resolution for C. xanthothrix (A) and C. saccharinus (B), supporting the chromosome-scale continuity and structural integrity of the assemblies. (C, D) Chromosome-level ideograms of C. xanthothrix (C) and C. saccharinus (D), showing chromosome bodies drawn to scale and terminal telomere extensions with 5′ (AACCCT)n and 3′ (AGGGTT)n motifs.
Figure 1.
Telomere-to-telomere genome assemblies of C. xanthothrix and C. saccharinus. (A, B) Genome-wide Hi-C contact maps at 100-kb resolution for C. xanthothrix (A) and C. saccharinus (B), supporting the chromosome-scale continuity and structural integrity of the assemblies. (C, D) Chromosome-level ideograms of C. xanthothrix (C) and C. saccharinus (D), showing chromosome bodies drawn to scale and terminal telomere extensions with 5′ (AACCCT)n and 3′ (AGGGTT)n motifs.
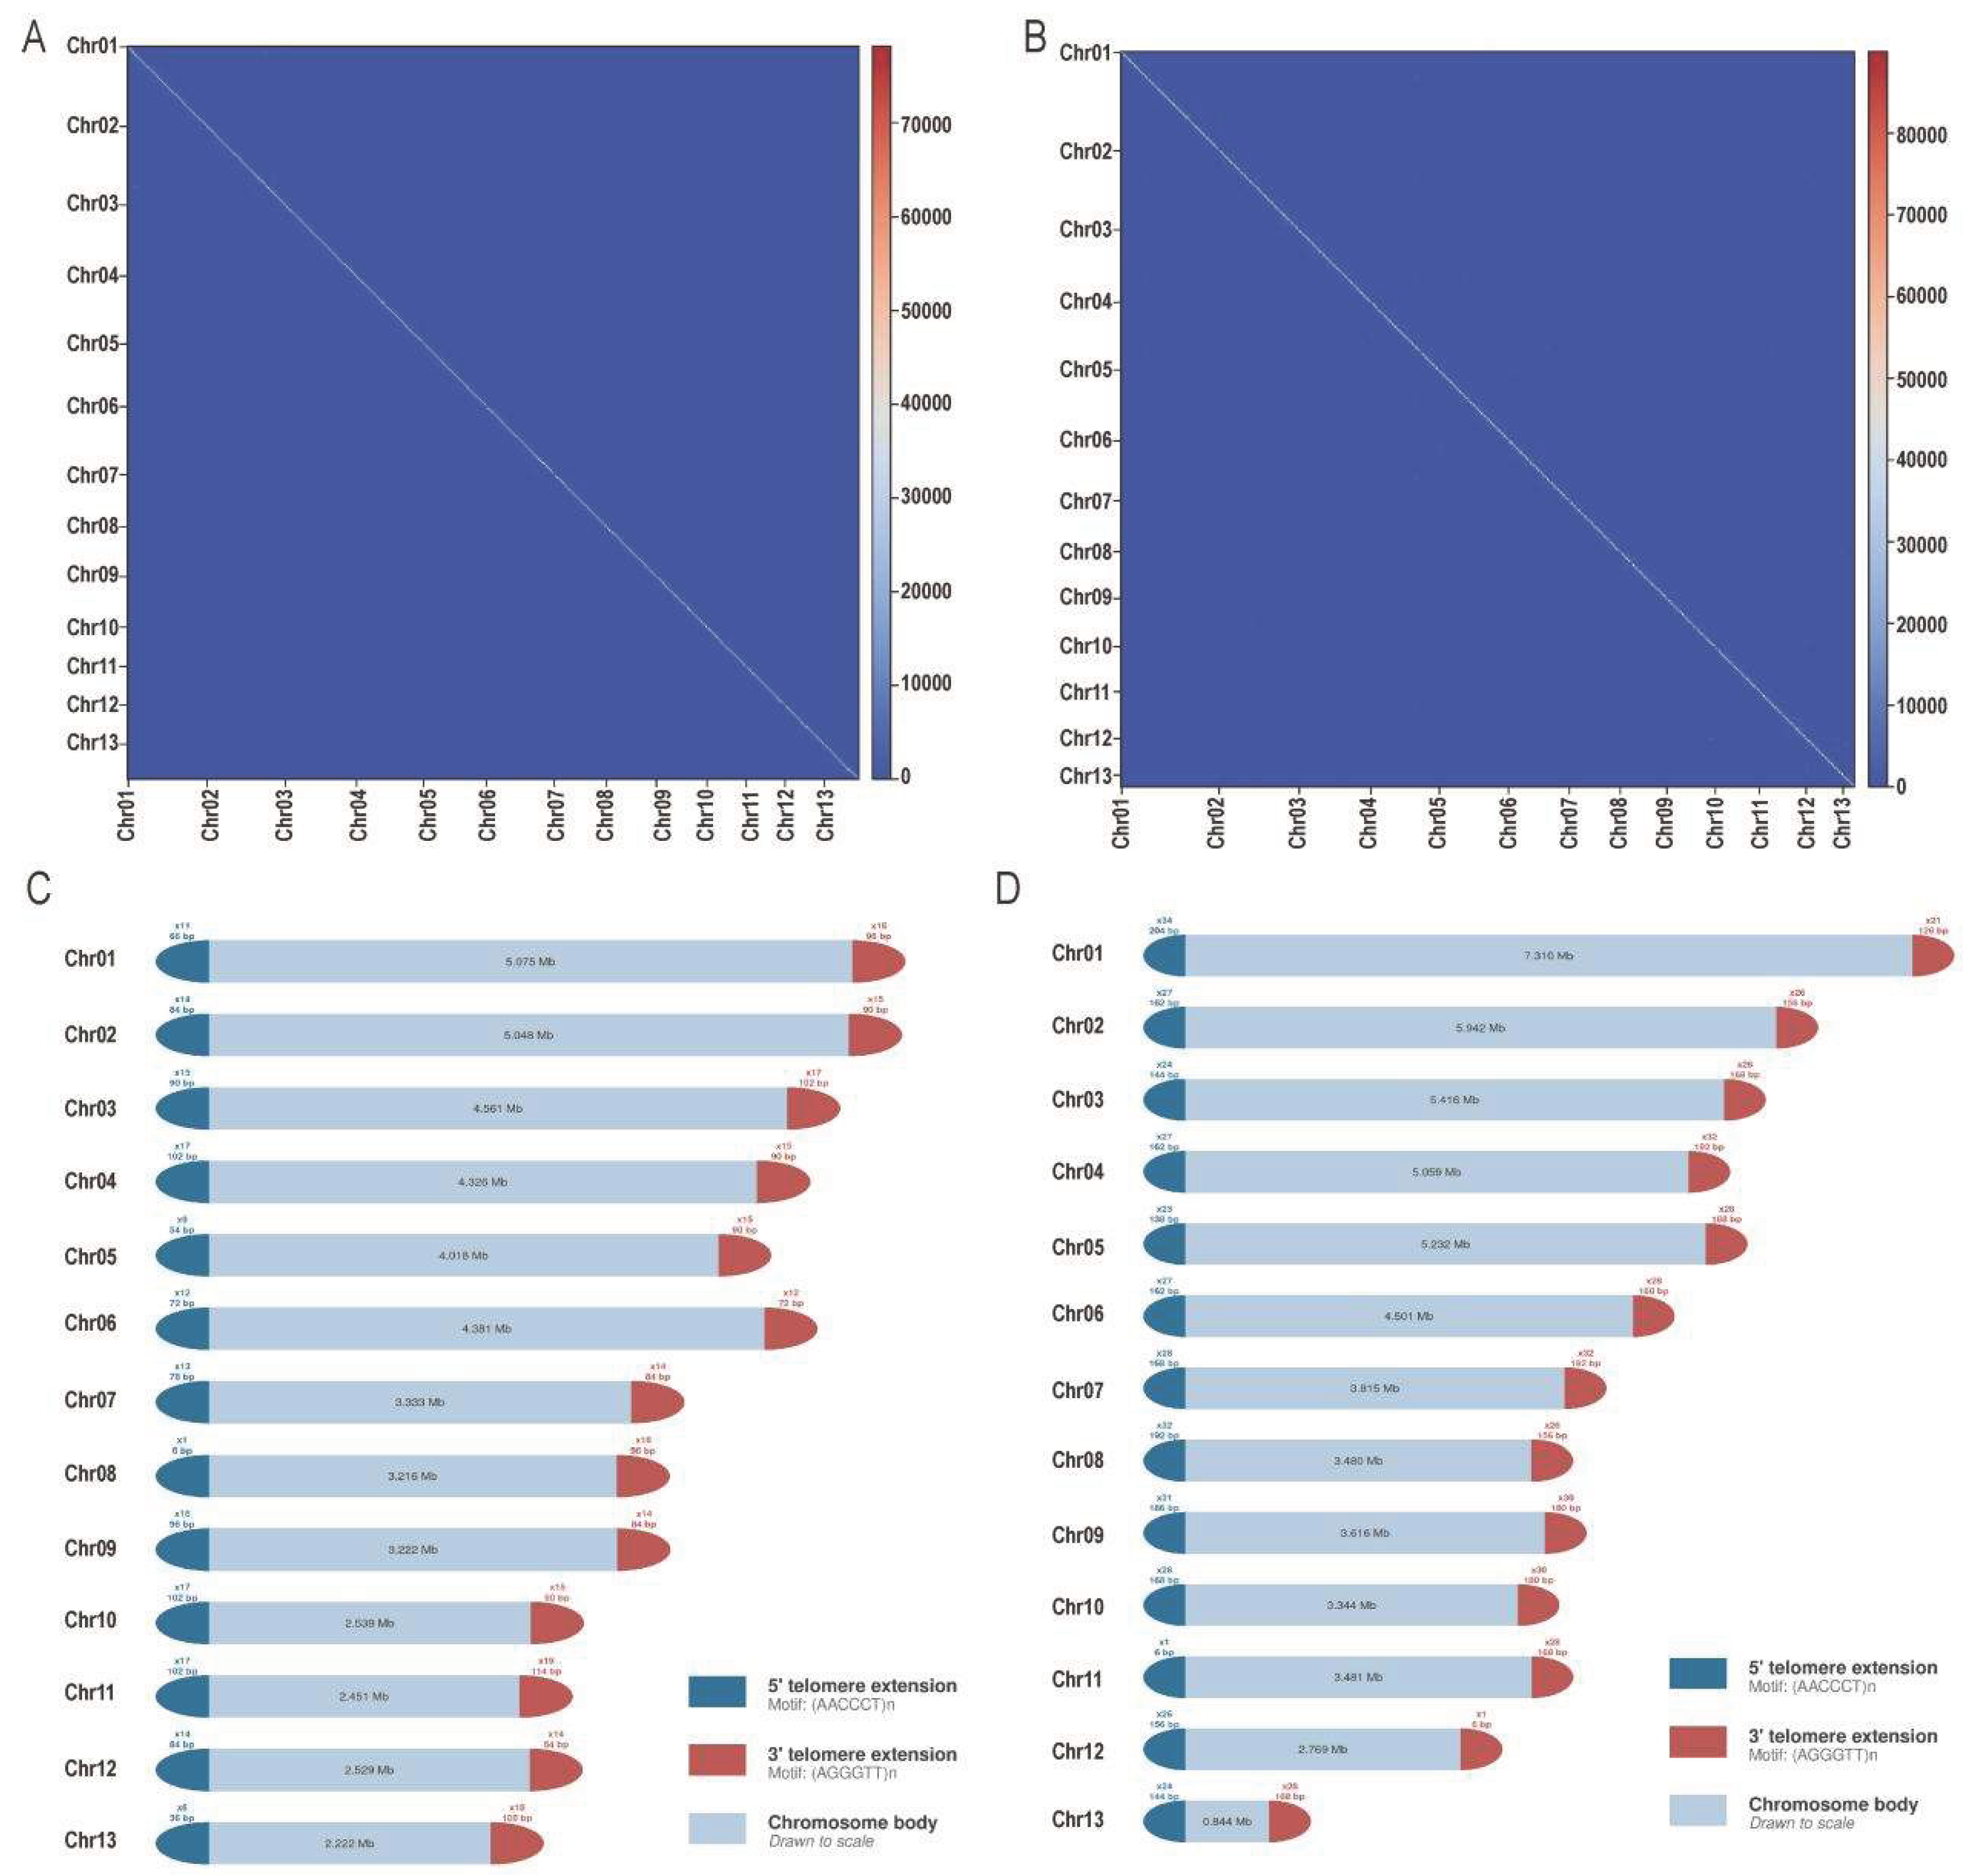
Figure 2.
Circos visualization of chromosome organization and genomic feature landscapes in C. xanthothrix and C. saccharinus. (A) C. xanthothrix and (B) C. saccharinus. Tracks from outside to inside represent chromosome ideograms, GC content, gene density, repeat density, and intragenomic synteny ribbons.
Figure 2.
Circos visualization of chromosome organization and genomic feature landscapes in C. xanthothrix and C. saccharinus. (A) C. xanthothrix and (B) C. saccharinus. Tracks from outside to inside represent chromosome ideograms, GC content, gene density, repeat density, and intragenomic synteny ribbons.
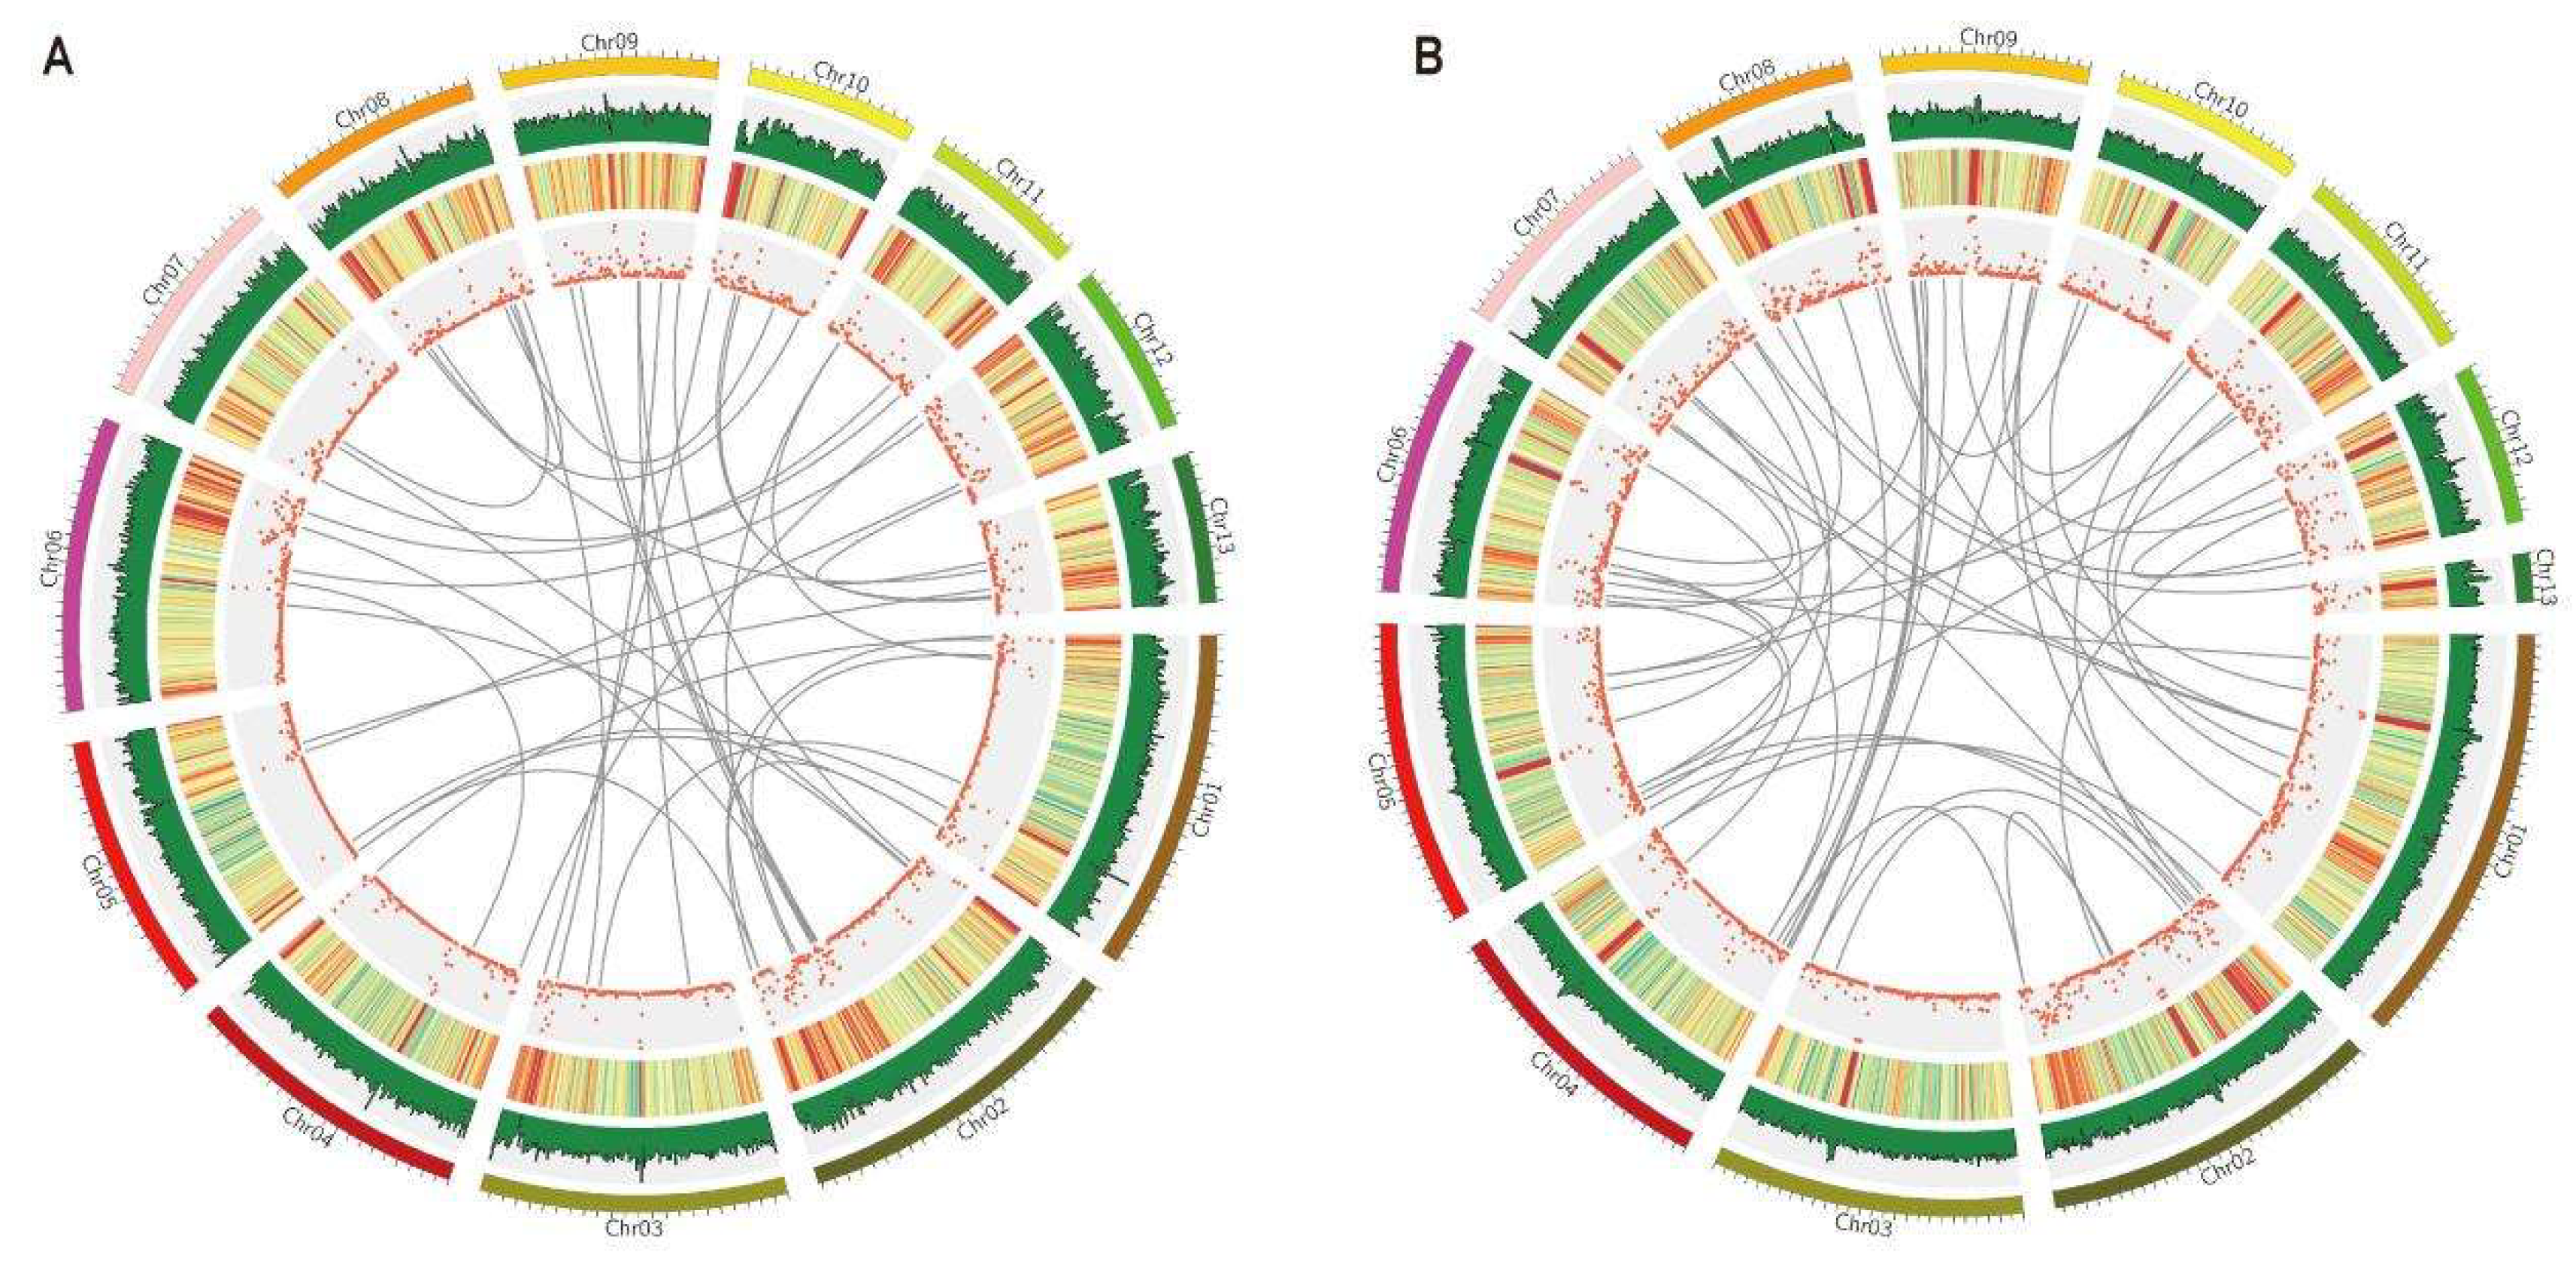
Figure 3.
Phylogenetic placement, divergence time estimation, and gene family evolution of C. xanthothrix and C. saccharinus. A time-calibrated phylogeny of C. xanthothrix, C. saccharinus, and related fungal species was inferred from single-copy orthologues using maximum-likelihood analysis and MCMCTree, with S. cerevisiae used as the outgroup. Numbers at internal nodes indicate gene family expansions (green) and contractions (red) estimated using CAFE. The time scale is shown in million years ago (MYA).
Figure 3.
Phylogenetic placement, divergence time estimation, and gene family evolution of C. xanthothrix and C. saccharinus. A time-calibrated phylogeny of C. xanthothrix, C. saccharinus, and related fungal species was inferred from single-copy orthologues using maximum-likelihood analysis and MCMCTree, with S. cerevisiae used as the outgroup. Numbers at internal nodes indicate gene family expansions (green) and contractions (red) estimated using CAFE. The time scale is shown in million years ago (MYA).
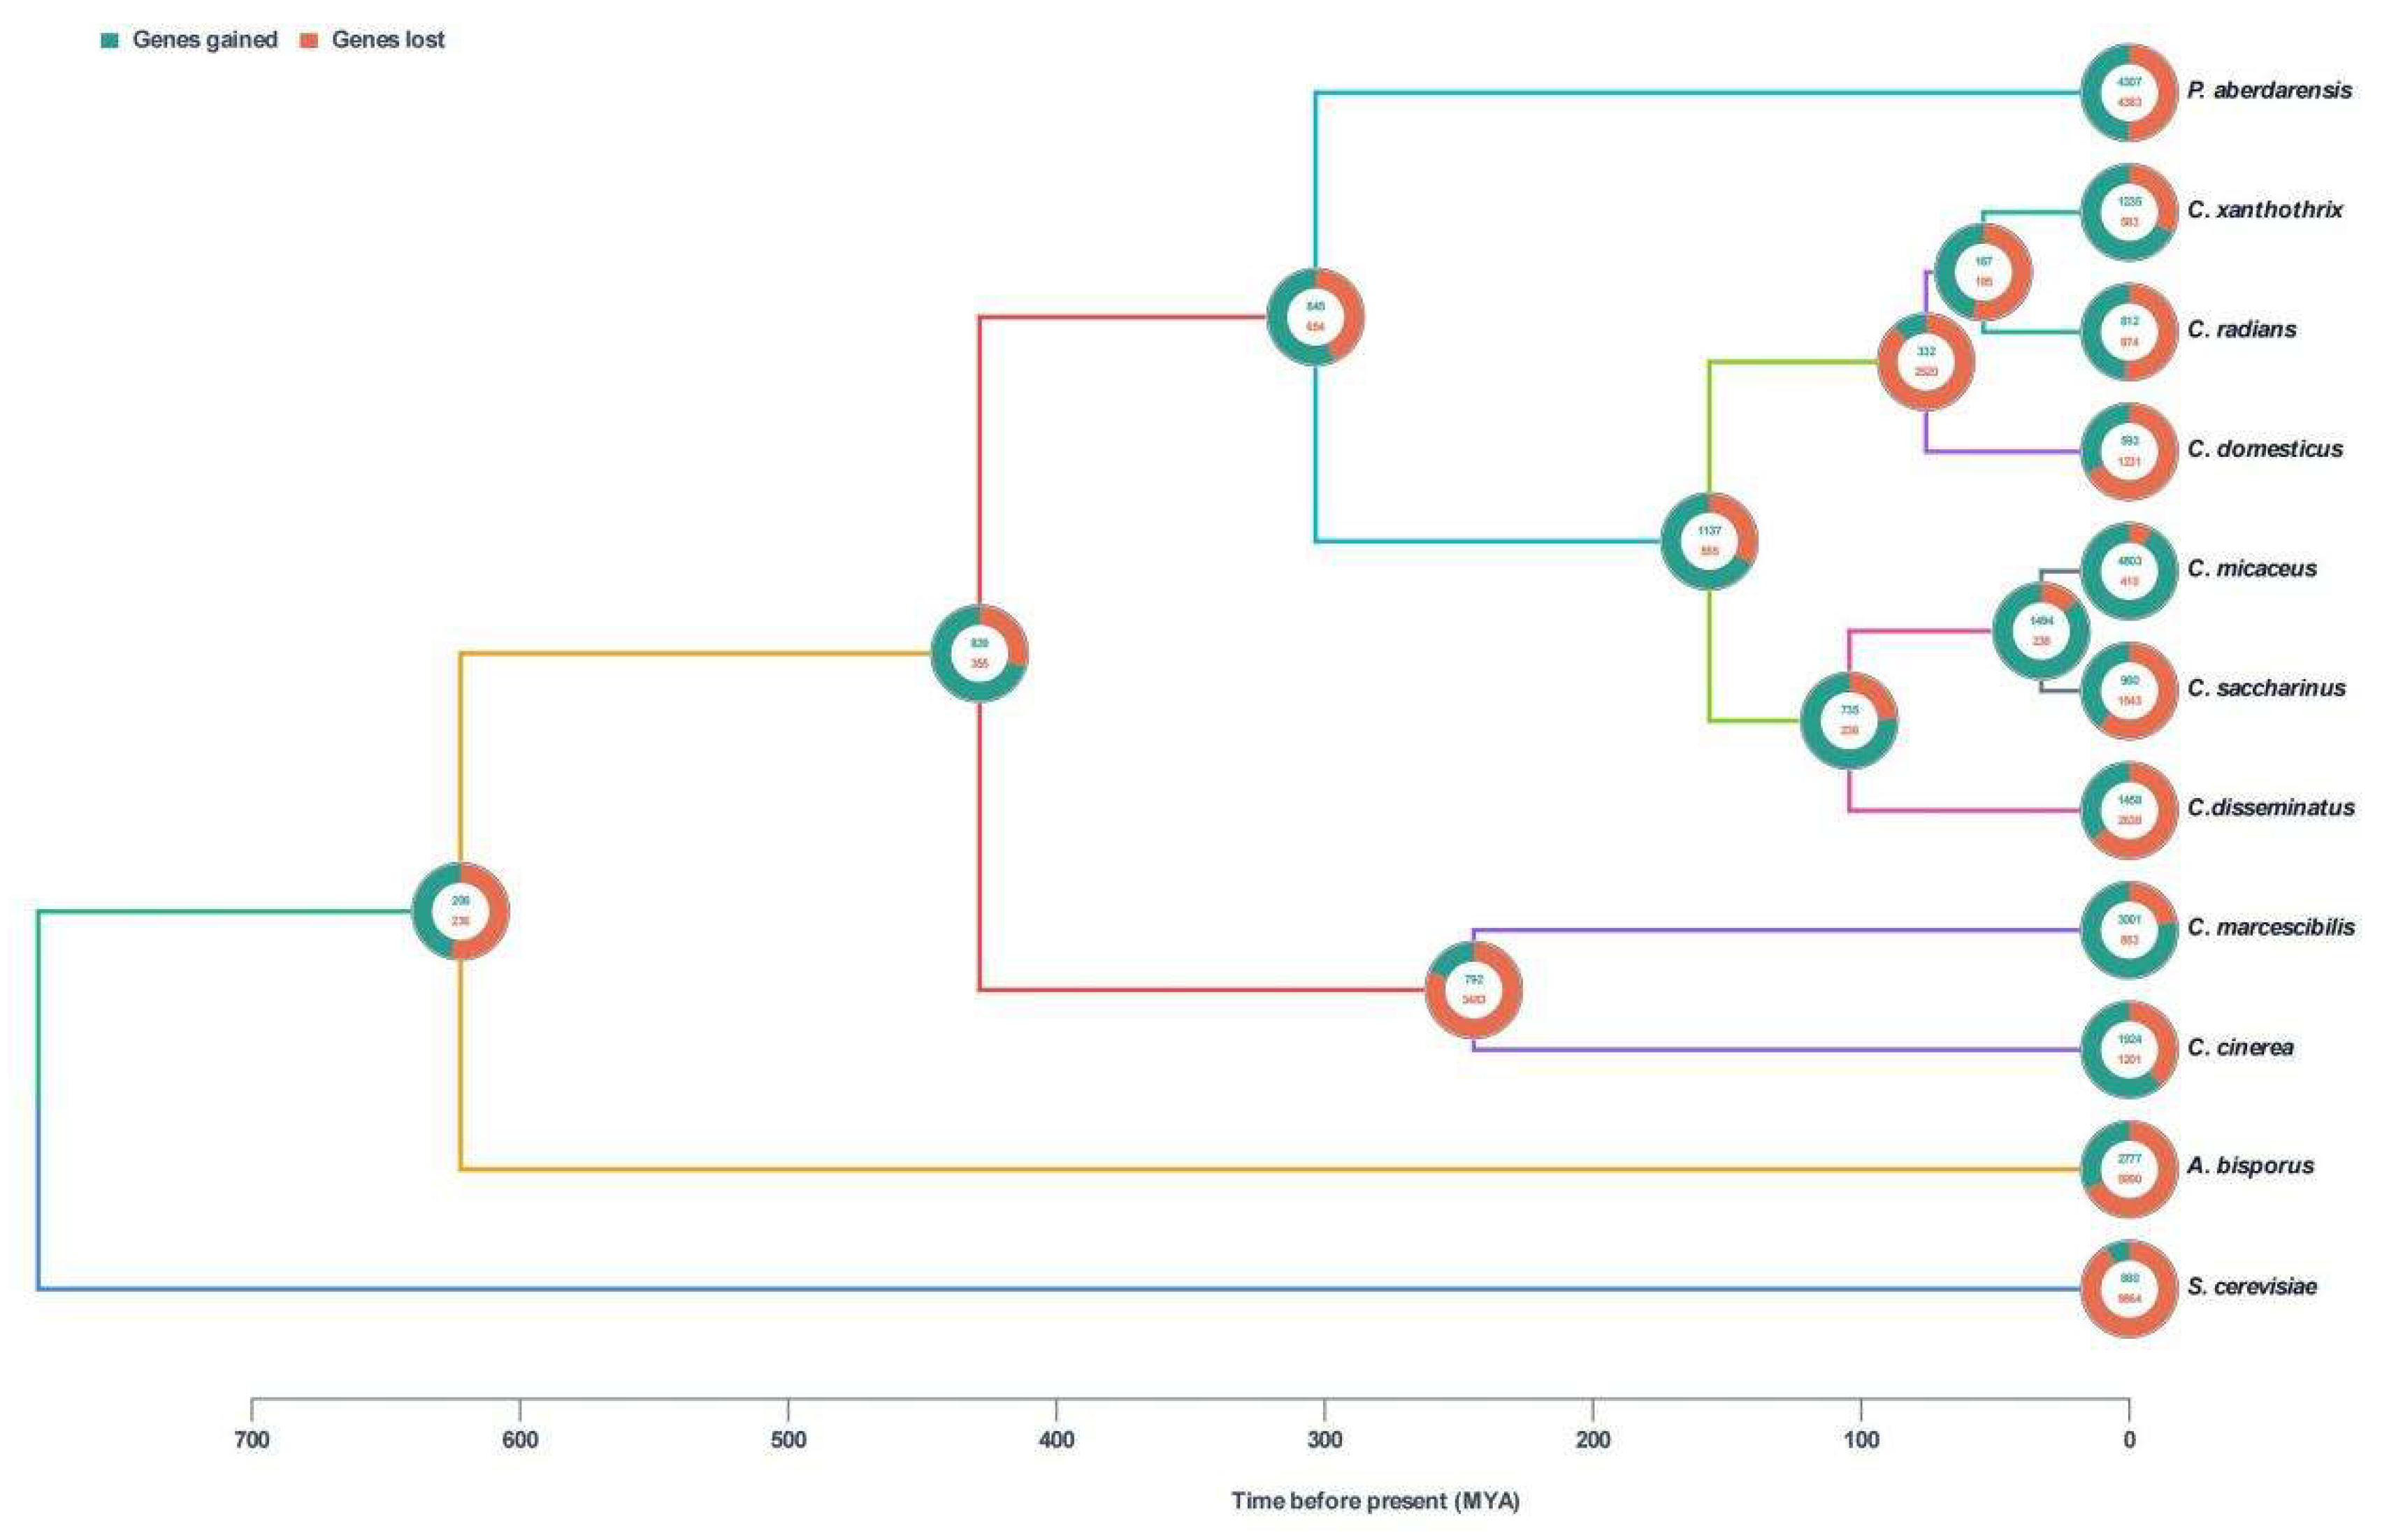
Figure 4.
Functional enrichment analysis of expanded gene families in C. xanthothrix. (A) Gene Ontology (GO) enrichment of expanded genes. (B) KEGG pathway enrichment of expanded genes. The pathway names corresponding to the KEGG pathway IDs shown on the y-axis are provided in Table S9.
Figure 4.
Functional enrichment analysis of expanded gene families in C. xanthothrix. (A) Gene Ontology (GO) enrichment of expanded genes. (B) KEGG pathway enrichment of expanded genes. The pathway names corresponding to the KEGG pathway IDs shown on the y-axis are provided in Table S9.
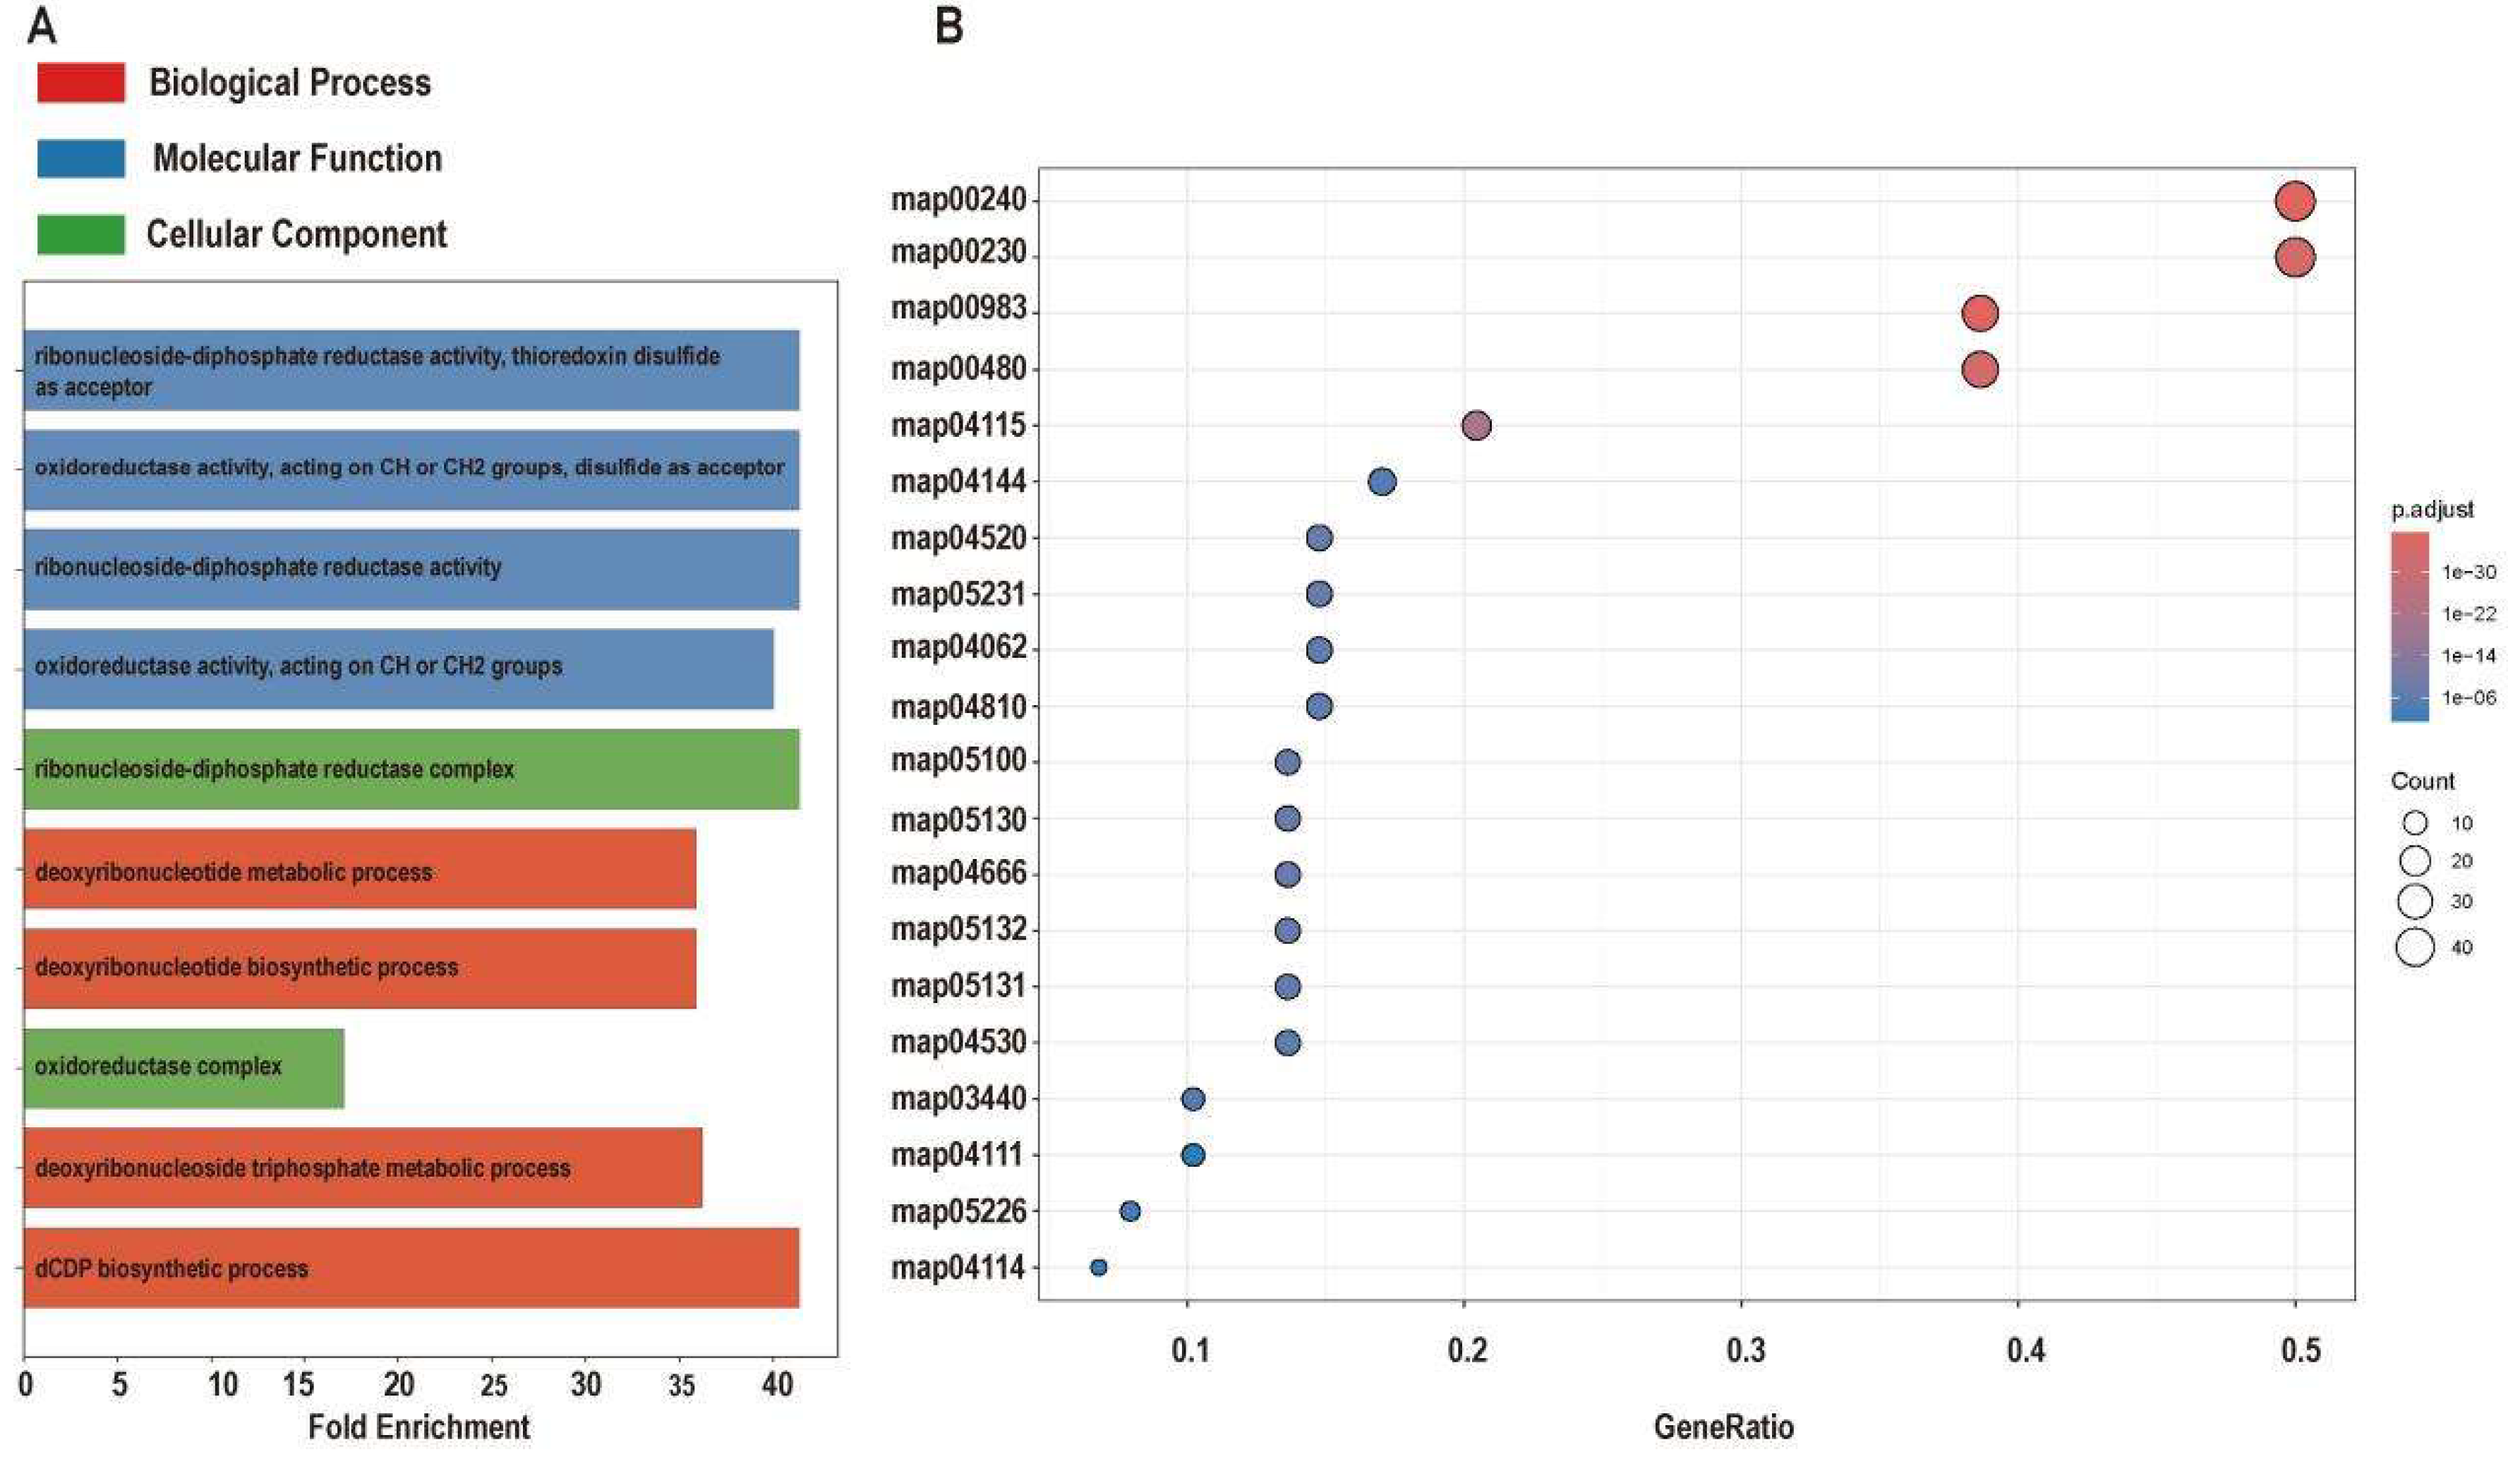
Figure 5.
Functional enrichment analysis of expanded gene families in C. saccharinus. (A) Gene Ontology (GO) enrichment of expanded genes. (B) KEGG pathway enrichment of expanded genes. The pathway names corresponding to the KEGG pathway IDs shown on the y-axis are provided in Table S9.
Figure 5.
Functional enrichment analysis of expanded gene families in C. saccharinus. (A) Gene Ontology (GO) enrichment of expanded genes. (B) KEGG pathway enrichment of expanded genes. The pathway names corresponding to the KEGG pathway IDs shown on the y-axis are provided in Table S9.
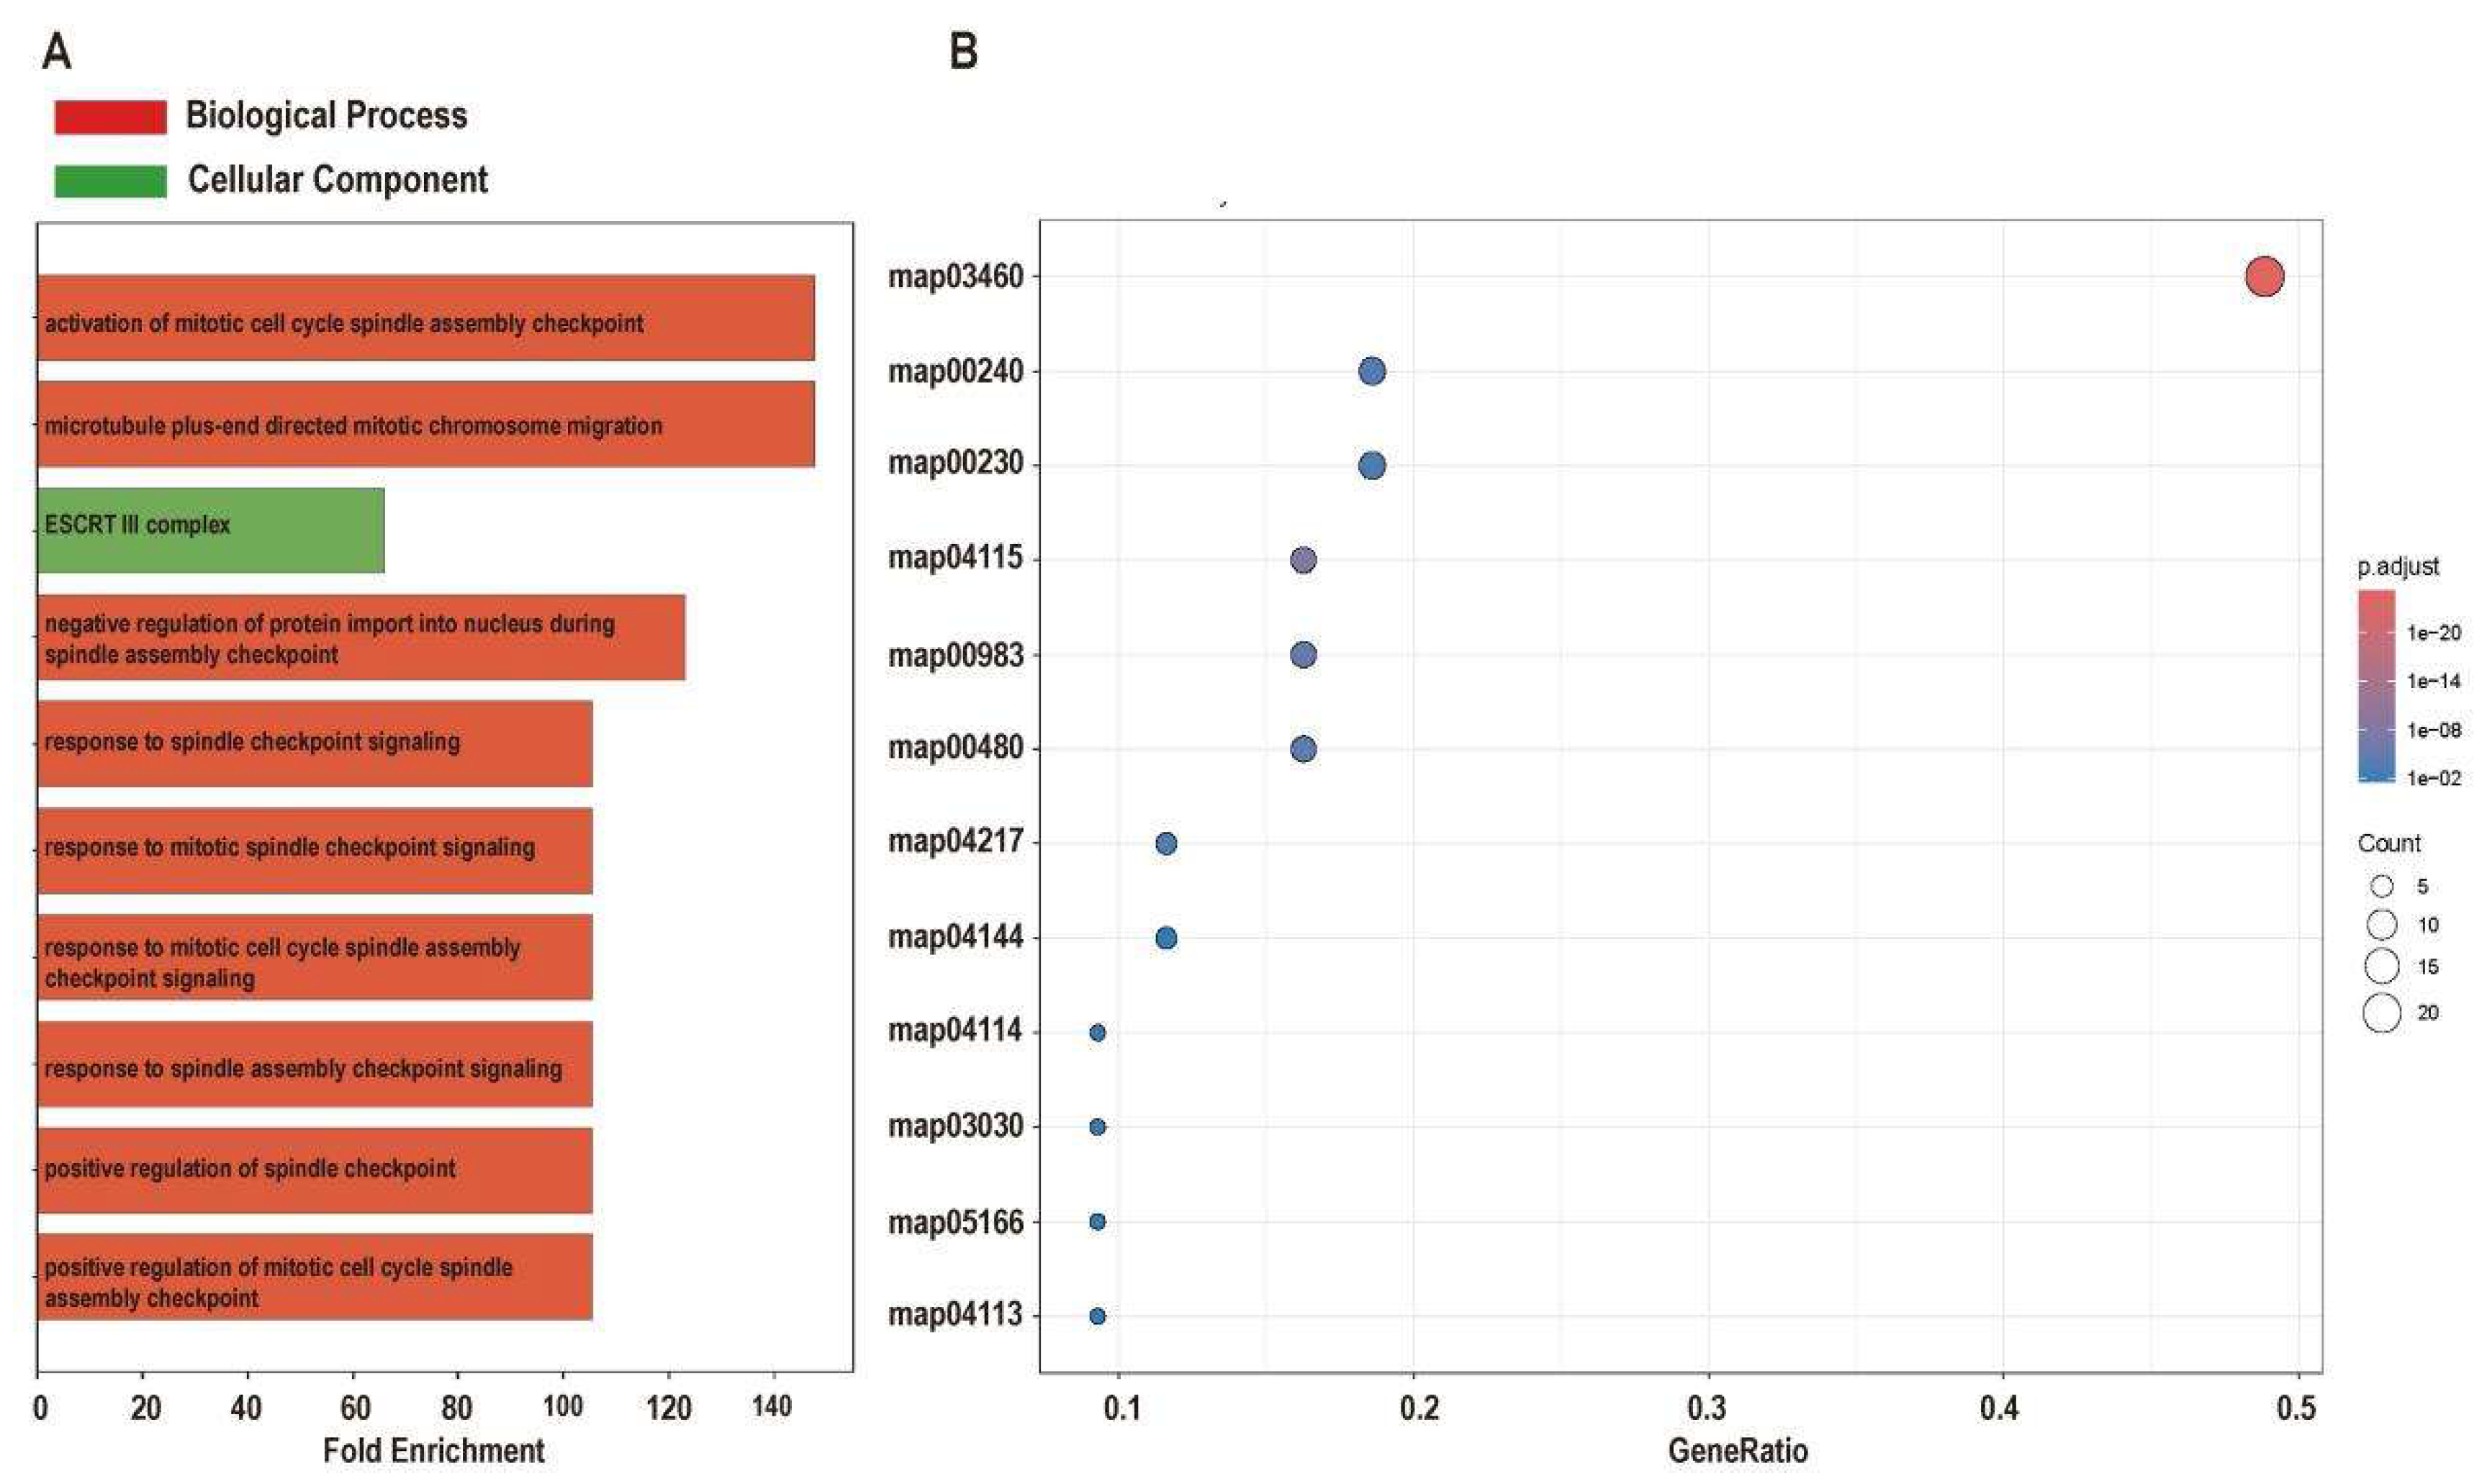
Figure 6.
Comparative macrosynteny among Coprinellus species. (A) Chromosome-scale synteny comparison among C. domesticus (Cdom; 15 chromosomes), C. xanthothrix (CXA; 13 chromosomes), and C. radians (Crad; 13 chromosomes). (B) Chromosome-scale synteny comparison between C. saccharinus (CSA; 13 chromosomes) and C. disseminatus (Cdis; 15 chromosomes).
Figure 6.
Comparative macrosynteny among Coprinellus species. (A) Chromosome-scale synteny comparison among C. domesticus (Cdom; 15 chromosomes), C. xanthothrix (CXA; 13 chromosomes), and C. radians (Crad; 13 chromosomes). (B) Chromosome-scale synteny comparison between C. saccharinus (CSA; 13 chromosomes) and C. disseminatus (Cdis; 15 chromosomes).
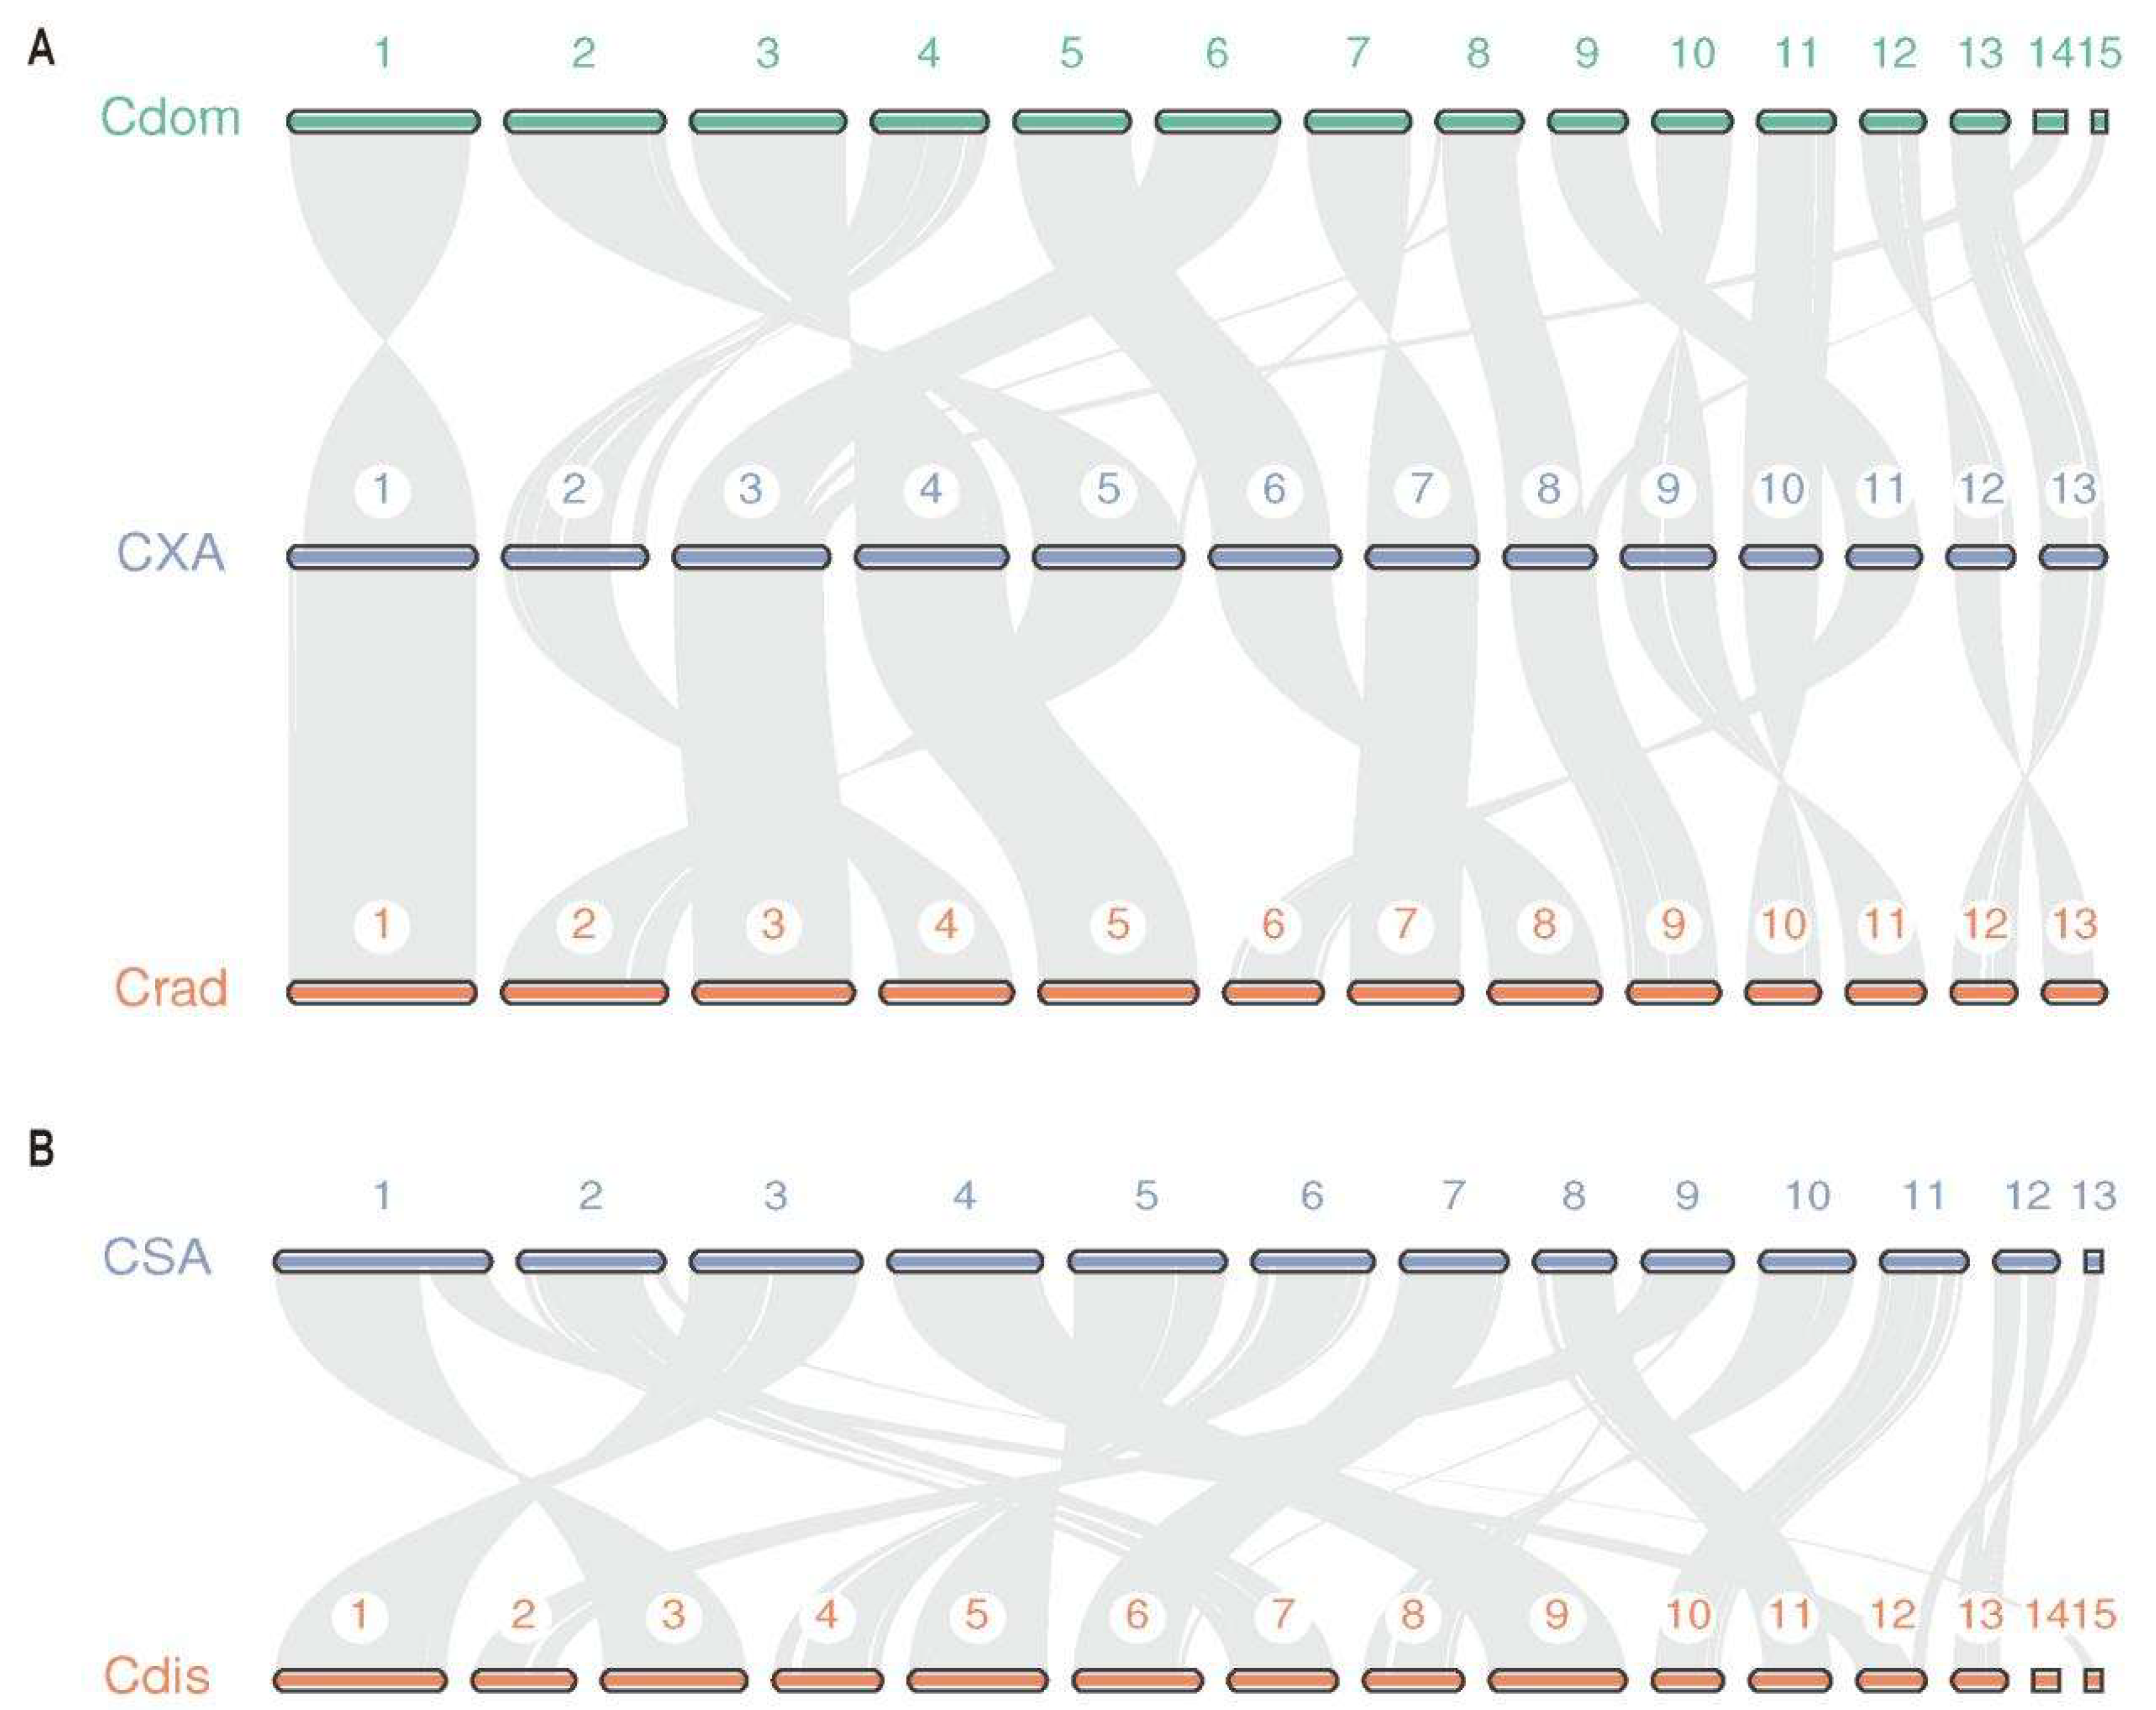
Figure 7.
Synonymous substitution rate (Ks) distributions reveal gene duplication and divergence patterns in Coprinellus genomes. (A) Ks distributions for paralogous gene pairs within C. xanthothrix (CXA) and orthologous gene pairs between C. xanthothrix and C. domesticus (CXA_Cdom), and between C. xanthothrix and C. radians (CXA_Crad). (B) Ks distributions for paralogous gene pairs within C. saccharinus (CSA) and orthologous gene pairs between C. saccharinus and C. disseminatus (CSA_Cdis), and between C. saccharinus and C. micaceus (CSA_Cmic).
Figure 7.
Synonymous substitution rate (Ks) distributions reveal gene duplication and divergence patterns in Coprinellus genomes. (A) Ks distributions for paralogous gene pairs within C. xanthothrix (CXA) and orthologous gene pairs between C. xanthothrix and C. domesticus (CXA_Cdom), and between C. xanthothrix and C. radians (CXA_Crad). (B) Ks distributions for paralogous gene pairs within C. saccharinus (CSA) and orthologous gene pairs between C. saccharinus and C. disseminatus (CSA_Cdis), and between C. saccharinus and C. micaceus (CSA_Cmic).
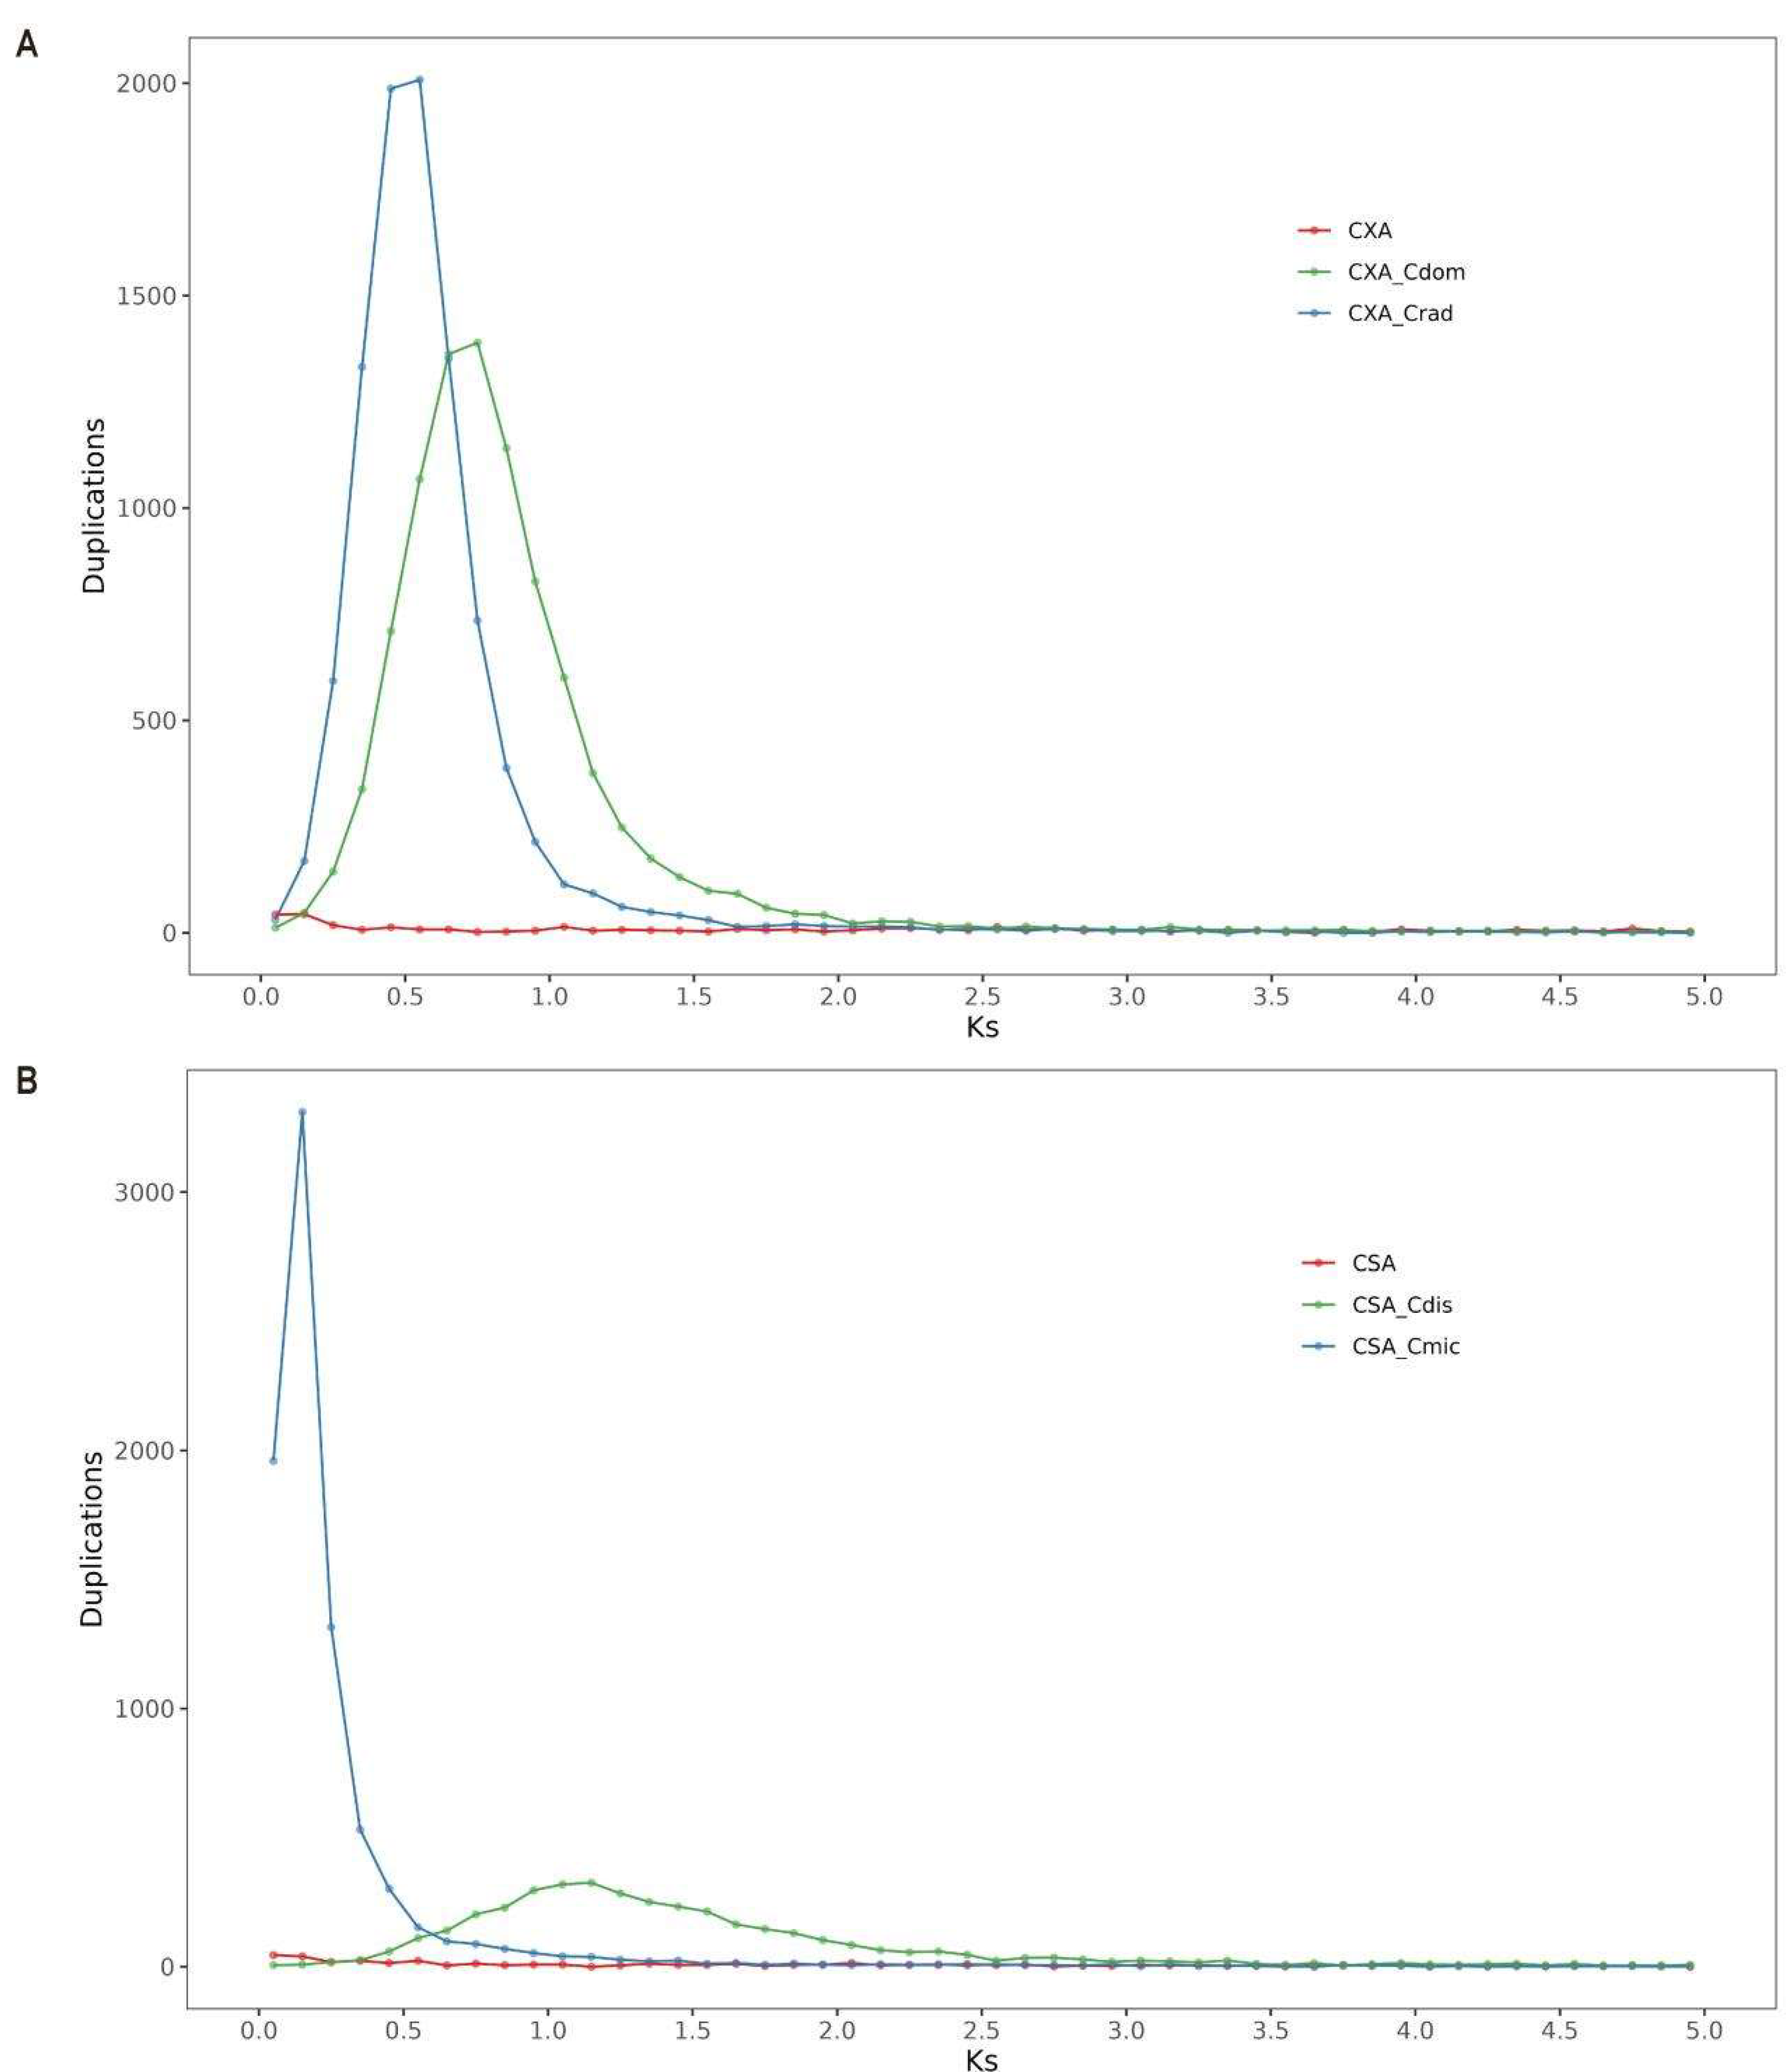

Table 1.
Sequencing Data Statistics.
| Species | Data Type | TotalBase of Raw Data (G) | TotalBase of Clean Data (G) | TotalReads of Raw Data (M) | TotalReads of Clean Data (M) | Coverage (X) |
|---|---|---|---|---|---|---|
| C. xanthothrix | Short-read WGS | 15.22 | 15.12 | 101.48 | 101.47 | 324X |
| C. xanthothrix | Long-read | 10.76 | 10.38 | 1.77 | 1.62 | 228X |
| C. xanthothrix | Hi-C | 10.85 | 10.84 | 36.18 | 36.18 | 231X |
| C. xanthothrix | RNA-seq | 5.49 | / | 0.11 | / | / |
| C. saccharinus | Short-read WGS | 10.28 | 10.03 | 68.52 | 67.92 | 187X |
| C. saccharinus | Long-read | 12.57 | 11.96 | 0.54 | 0.50 | 229X |
| C. saccharinus | Hi-C | 19.11 | 19.09 | 63.69 | 63.69 | 349X |
| C. saccharinus | RNA-seq | 9.12 | / | 0.19 | / | / |
Table 2.
Genome Assembly Statistics.
| Feature | C. xanthothrix | C. saccharinus |
|---|---|---|
| Assembly level | T2T | T2T |
| Total genome size (Mb) | 46.92 | 54.81 |
| Chromosome number | 13 | 13 |
| Largest chromosome (Mb) | 5.08 (Chr01) | 7.31 (Chr01) |
| Smallest chromosome (Mb) | 2.22 (Chr13) | 0.84 (Chr13) |
| Gap number | 0 | 0 |
| GC content (%) | 53.72% | 53.79% |
| N50 | 4017987 | 5059299 |
| N90 | 2528967 | 3343676 |
| L50 | 6 | 5 |
| L90 | 11 | 11 |
| QV | 38.36 | 39.26 |
| Telomere motif | AACCCT | AACCCT |
| Telomere-capped ends | 26/26 (100%) | 26/26 (100%) |
| BUSCO (fungi_odb10) | 99.20% | 99.10% |
| NCBI/GSA Accession | PRJNA1450334 / PRJCA038423 | PRJNA1450334 / PRJCA038423 |
Table 3.
Repeat Element Statistics.
| Species | Element Type | Number of elements | Length (bp) | Percentage of sequence (%) |
|---|---|---|---|---|
| C. xanthothrix | Retroelements | 1286 | 1649099 | 3.51 |
| DNA transposons | 142 | 160597 | 0.34 | |
| Rolling-circles | 101 | 106931 | 0.23 | |
| Unclassified | 3806 | 1925552 | 4.10 | |
| Total interspersed repeats | / | 3735248 | 7.96 | |
| Small RNA | 41 | 11155 | 0.02 | |
| Simple repeats | 4609 | 220747 | 0.47 | |
| Low complexity | 1037 | 58988 | 0.13 | |
| C. saccharinus | Retroelements | 2757 | 4424077 | 8.07 |
| DNA transposons | 181 | 160697 | 0.29 | |
| Rolling-circles | 13 | 28761 | 0.05 | |
| Unclassified | 4803 | 2033022 | 3.71 | |
| Total interspersed repeats | / | 6617796 | 12.07 | |
| Small RNA | 127 | 36128 | 0.07 | |
| Simple repeats | 5741 | 255121 | 0.47 | |
| Low complexity | 1322 | 73680 | 0.13 |
Table 4.
Gene Annotation Statistics with MAKER.
| Species | Category | Count | Percentage (%) |
|---|---|---|---|
| C. xanthothrix | Total Genes | 11205 | 100.00 |
| GO Annotated | 3645 | 32.53 | |
| KEGG KO Annotated | 4563 | 40.72 | |
| KEGG Pathway Annotated | 2862 | 25.54 | |
| COG Annotated | 8325 | 74.30 | |
| Unique GO Terms | 10173 | / | |
| Unique KEGG KOs | 3298 | / | |
| Unique KEGG Pathways | 750 | / | |
| Unique COG Categories | 24 | / | |
| C. saccharinus | Total Genes | 11881 | 100.00 |
| GO Annotated | 3690 | 31.06 | |
| KEGG KO Annotated | 4717 | 39.70 | |
| KEGG Pathway Annotated | 2929 | 24.65 | |
| COG Annotated | 8733 | 73.50 | |
| Unique GO Terms | 10220 | / | |
| Unique KEGG KOs | 3318 | / | |
| Unique KEGG Pathways | 752 | / | |
| Unique COG Categories | 24 | / |
Table 5.
Ortholog Statistics.
| Species | Genes | Species-specific | Single-copy |
|---|---|---|---|
| A. bisporus | 10140 | 1546 | 4742 |
| C. saccharinus | 15802 | 109 | 6662 |
| C. xanthothrix | 13046 | 45 | 5702 |
| C. cinerea | 11869 | 687 | 5422 |
| C.disseminatus | 13929 | 180 | 5757 |
| C. domesticus | 11784 | 32 | 5718 |
| C. marcescibilis | 13294 | 775 | 5404 |
| C. micaceus | 20758 | 1068 | 5977 |
| C. radians | 12332 | 32 | 5713 |
| P. aberdarensis | 13952 | 913 | 4614 |
| S. cerevisiae | 4399 | 659 | 2636 |
Disclaimer/Publisher’s Note: The statements, opinions and data contained in all publications are solely those of the individual author(s) and contributor(s) and not of MDPI and/or the editor(s). MDPI and/or the editor(s) disclaim responsibility for any injury to people or property resulting from any ideas, methods, instructions or products referred to in the content. |
© 2026 by the authors. Licensee MDPI, Basel, Switzerland. This article is an open access article distributed under the terms and conditions of the Creative Commons Attribution (CC BY) license (http://creativecommons.org/licenses/by/4.0/).
Copyright: This open access article is published under a Creative Commons CC BY 4.0 license, which permit the free download, distribution, and reuse, provided that the author and preprint are cited in any reuse.


