

Submitted:
22 July 2026
Posted:
23 July 2026
You are already at the latest version
Abstract
Numerous studies indicate that a flapping-foil thruster installed at a ship’s bow can convert wave energy into propulsive power and reduce added wave resistance while improving dynamic stability. Building on prior research into the drag reduction mechanism of an elastic bow-flapping-foil system, this paper further compares its resistance reduction and motion response across three typical ship forms (DTMB 5415, KCS, and Wigley) under similar wave conditions. Using the ISIS-CFD solver in NUMECA software, the study simulates the ship coupled with a semi-active elastic flapping foil in head waves, analyzing the influences of spring stiffness, foil size, installation position, and encounter phase on system performance. Numerical results show effective wave energy harvesting, boosting propulsion and stability. Under optimized parameters, ship pitch and heave amplitudes decrease by up to 20.14%, resistance reduction reaches 9.60%, and DTMB 5415 achieves a comprehensive drag-reduction and thrust-increase efficiency of 31.39%. Further analysis reveals that thrust performance does not rise proportionally with spring stiffness, whereas drag and heaving reduction improve with increasing stiffness. The system performs best at a wavelength-to-ship-length ratio of 1.2 and a foil encounter phase of −90°. This work supports parameter optimization for such systems based on practical application scenarios and requirements.
Keywords:
flapping foil thruster
; numerical simulation
; ship’s sea-keeping
; spring stiffness
; counter phase
1. Introduction
1.1. Background
In real sea conditions, marine craft undergo undesirable wave-induced oscillatory heave and pitch motions. These motions impair ship stability [1] and increase navigational resistance [2]. It has long been recognized that ships traveling in waves can induce free heave-driven flapping of foils during pitch and heave motions, which provides a favorable basis for the application of semi-active flapping-foil thrusters [3,4]. In recent years, the International Maritime Organization (IMO) has pledged to reduce greenhouse gas emissions from shipping, and the development of sustainable energy has become increasingly important. As a renewable energy source, ocean wave energy has also attracted extensive attention from researchers. In this context, studies have shown that flapping foils can significantly enhance hull propulsion [5,6,7,8], reduce ship resistance [9], and attenuate hull motion amplitudes, thereby improving fuel efficiency. In 2009, Terao developed a Wave Devouring Propulsion System (WDPS) and installed it beneath a ship’s bow [10]. Torsion springs were employed to provide restoring torque for the flapping foils. Using a custom-designed double-hull form and dual flapping-foil technology, the vessel completed a voyage from Hawaii to Japan, successfully demonstrating the feasibility of ship-integrated flapping foils. In 2020, Hou mounted flapping foils at different angles of attack and positions on the stern of a DTMB 5415 model ship. Numerical simulations and experimental measurements were carried out at the Kelvin Hydrodynamics Laboratory of the University of Strathclyde [1]. The results indicate that flapping foils can significantly suppress the stern wake, thereby reducing total ship resistance and mitigating pitch and heave motions. The total resistance of the hull was reduced by approximately 10%, while the pitch amplitude decreased by up to 26%
1.2. Investigations About the Bow Foil
A bio-mimetic underwater propulsion system named the flapping foil was developed to mimic fish swimming. Owing to its high mobility and favorable propulsion efficiency, it has been comprehensively investigated by numerous experts and researchers [11]. When an external force drives the flapping foil to perform vertical heaving and pitching motions, it can generate an appropriate angle of attack relative to the incoming flow direction. According to the Kutta-Joukowski theorem, the flapping foil will generate a lift force perpendicular to the incoming flow direction due to the fluid’s velocity circulation around it, thereby producing thrust.
As early as 1998, Anderson conducted experimental investigations into the thrust and efficiency of multiple sets of flapping foils under various Strouhal (Sr) numbers, maximum angles of attack, and phase variations to explore the operating characteristics and mechanisms [12]. The experimental results not only achieved a preliminary optimization of the ideal operating parameters of the flapping foil, with an efficiency reaching up to 87%, but also showed good agreement with the theoretical predictions of both linear and nonlinear non-viscous theories. The ideal maximum angle of attack was considered to range between 15° and 25° [12,13,14].
Read constructed an active flapping foil test device and conducted model experiments in a test tank at the Massachusetts Institute of Technology (MIT). The aim was to comprehensively examine the effects of the heave, pitch amplitude, and Strouhal number Sr of the NACA 0012 flapping foil on the ship’s thrust and efficiency, so as to explore the influence of important parameters on the flapping foil’s performance [15] (Read et al., 2003). Moreover, numerous experiments have demonstrated that the flapping foil exhibits higher efficiency when the Sr numbers are within the range of 0.2 to 0.4 [16]. Based on these findings, numerous specialists and scholars subsequently conducted research on the trajectory, motion mode, and application of flapping foil motion. For instance, Schouveier’s experiment examined the impact of asymmetric pitch motion on the angle of attack curve and performance of a type of fish swimming with flapping foil propulsion in an MIT towing tank [17]. To compare the propulsion performance of flapping foils and propellers, Floc’H described the performance of flapping foils using the acceleration coefficient J instead of the Sr number [18]. Esfahani employed elliptical trajectory heave motion to study the effects of different angle of attack curves [19]. Qi investigated the propulsion capabilities of tandem flapping foils and examined the influence of wave motion on different front and rear foils [20]. This was achieved by examining the motion synchronization and installation distances of the two foil types, as well as factors such as pressure, pitch trajectory, and instantaneous thrust coefficient. Studies have indicated that the rear foil enhances the thrust generated by the front foil. Additionally, reducing the distance between the two foils can increase the dipole vortex generated by both, thereby increasing thrust. This provides novel concepts for foil thruster design [20,21]. On this topic, Harshal also conducted relevant research. Based on the results of the two-foil model calculation, he developed a Wave-assisted propulsion (WAP) system that not only explored the two-foils model but also proposed high-performance three-foils and four-foils models [22].
In order to better target the field of technical applications and adapt the flapping foil to various working situations, numerous researchers have developed various semi-active flapping foil experimental and application devices and studied their performance in great detail. In 2014, Bøckmann experimentally evaluated a high-aspect-ratio three-dimensional semi-active flapping foil made of a NACA0015 foil. It achieved a preliminary high propulsion efficiency and was compared to an active flapping foil [23]. Then, in 2018, Thaweewat used numerical simulations to conduct a thorough examination of the technical parameters influencing the semi-active flapping foil [24]. After conducting initial research, he concluded that, similar to adjusting a propeller’s pitch, the propulsion effectiveness of the flapping foil can be altered by appropriately adjusting the stiffness of the torsion spring. By varying the Sr number and pitch amplitude, the maximum efficiency point of the flapping foil can be found.
Jiang proposed an actively controlled T-shaped foil in 2022 that may greatly increase a high-speed three-body ship’s wave resistance. He also tested head waves in the Dalian University of Technology towing tank at two different speeds and at various wavelengths. Measurements were made of the ship’s local acceleration, pitch, and heave [25]. Deng then looked at how the hull’s motion response was affected by a bow-fixed T-shaped foil. It was discovered via experimentation that the foil can greatly lower the hull’s overall resistance and ease motion in normal bow waves. Furthermore, foil with higher aspect ratios has more noticeable benefits on roll and resistance reduction [26].
Regarding the exploration of the wave impact on the flapping foil propulsion system, Grue al. [27] investigated the energy relationship of the flapping foil with certain heave and pitch motions in waves, recognizing the significant impact of waves on the performance of the flapping foil. Silva et al. detailedly explored the influencing parameters of flapping foil performance in regular waves, finding that the encounter phase between the flapping foil and waves has a significant impact on the performance of the flapping foil [28]. Belibassakis et al. [29] mainly discussed the influence of different sea states and the immersion depth of the flapping foil. Zhang also took into account how water particles in waves affected flapping foil performance from the standpoint of the flapping foil mechanism. He suggested an active control pitch flapping foil, which improves the thrust of the foil by promptly adjusting the flapping foil’s rotation angle by determining the wave phase of the foil’s position [30].
1.3. Paper Contribution and Outline
With the sufficient study of the RANS viscous flow numerical method for hull motion and hydrofoil hydrodynamic characteristics [12,14,15,17,23,24], the coupled motions and resistance in waves of a ship with bow foils can be found by using a Navier–Stokes solver in theory [8].
Based on our preliminary research in 2023 [8], this paper further investigates the resistance reduction and thrust enhancement performance of NACA 0012 flapping foils on three classic ship models (DTMB 5415, KCS, and Wigley). In addition, it analyzes the effect of key parameters of the flapping foils (spring stiffness, dimensions, and installation position) and the motion of water particles in the wave (encountering phase on the coupling system). The FINE/Marine ship and ocean engineering hydrodynamic analysis software in the NUMECA software family was utilized in this work to jointly simulate the ship’s flapping foil model using the Computational Fluid Dynamics (CFD) method. The fluid dynamics equations were solved using the software’s integrated viscous incompressible flow field ISIS-CFD solver. The propulsion efficiency enhancement mechanism, the applicability of different vessel types, and the impact of important parameters on the ship flapping foil’s operational performance were investigated.
The layout of this paper is as follows:
Section 2 outlines the parameters of the proposed hull, foil, and wave conditions. Section 3 details the methodology, including the design of the model, the fluid-structure coupling numerical method, and full validation. Section 4 systematically presents the co-simulation results of flapping foils on three classic ship models. The effects of the spring stiffness ratio (k’), the span length (h), and installation position (x/Lpp) of the bow foil on the drag reduction and thrust increase ability of the system are further discussed, and the sensitivity of the performance to the variation of parameters is also evaluated in the current study. Section 5 focuses on the influence of the encountering phase of the near-wave surface flapping foil with waves. Finally, Section 6 summarizes the key insights obtained from the study.
This research presents datasets of bow hydrofoils for three archetypal ship types, including simulation methodologies, crucial parameters, and ship motion responses. This further validates the drag-reduction and thrust-enhancement effects as well as the applicability of the bow-flapping system. Moreover, it offers systematic and comprehensive design parameter data for the application of this novel system.
2. Physical Model
2.1. Ship Elastic Flapping Foil Motion Model
The two standard ship models (DTMB 5415 high-speed naval ship and KCS MOERI big container ship) are chosen as two research objects in this work based on the SIMMAN conference’s recommendations. Furthermore, the Wigley-type ship is also chosen as the third research object for this paper. As a conceptual ship, this ship’s hull is made up of a collection of straightforward parabolas, which is widely accepted for experimental study by academics. This ship type could eliminate the effect of the intricate profiles and can reflect the fundamental principles of the interaction between the ship and flapping foil. The mathematical formula for the Wigley-type ship’s profile is:
where x, y, and z are the longitudinal, transverse, and vertical coordinates of the curve, respectively; B is the moulded breadth; Lpp is the length between perpendiculars; T is the draught of the ship; and in this study, the aspect ratio Lpp/B of the Wigley type ship is 10.
In order to facilitate the verification of the numerical method, the scale ratio of the two ship models (DTMB 5415 high-speed naval ship and KCS MOERI big container ship) are kept consistent with that of the control experiment [31,32], and all ship models were scaled according to the ITTC recommended scale ratio to ensure consistency between the Fr number and towing tests. Wigley-type ships of varying lengths (6 m, 4 m, 2.5 m, and 2 m) were carried out in 1983 by the University of Tokyo in Japan [33]. Experimental data of 2.5 m in length was chosen for verification in this research. Table 1 displayed the scaled ship models and the primary scale parameters for the three ship classes in this study.
Furthermore, the NACA 0012 rigid foil with publicly accessible data was chosen as the study object for the flapping foil in this paper. The flapping foil underwent circular processing at both ends, with an equal chord length design in the center. The span of the flapping foil is h, and its vertical projection is roughly rectangular. The flapping foil’s chord length was defined as c, and the fillet radius at both ends was 0.1c. Figure 1 displays the flapping foil model and the processed ship models.
A sketch of a ship with a semi-passive flapping foil in the head wave is shown in Figure 2. As shown in Figure 2, position the flapping foil beneath the ship’s bow at a distance from the ship’s baseline (D-T), with the center of gravity of the foil located on the ship’s longitudinal section, where D is the depth of immersion of the oscillating foil and T is the ship’s draft. The torsion spring (spring stiffness k) is set at the leading edge of the flapping foil, which provides a restoring torque for the pitch motion of the flapping foil.
When the semi-passive flapping foil heaves under the drive of the hull in waves, the heave motion together with the advance velocity creates an oscillating hydrodynamic force and moment, causing the foil to work at an angle of attack (α) and a pitch angle (θ). Due to the velocity circulation around the oscillating foil, according to Kutta-Joukowski theorem, a potential pressure difference will be formed between the upper and lower surfaces of the oscillating foil. This difference will show up as a lift FL that is perpendicular to the direction of the Vfoil. The thrust force TF and damping force Fz, foil for the flapping foil, are provided by the lift FL component in the ship’s forward direction and the lift FL component in the vertical direction, as well as the foil resistance FD component created in these two directions.
The design parameters of the flapping foil were dimensionless to allow for a comparative analysis of the flapping effect of three different ship types. The relative installation immersion depth of the flapping foil (D/T) was defined as the ratio of the flapping foil immersion depth D to the ship draught T; the relative foil span length of the flapping foil ( h/B ) was defined as the ratio of the foil span length h to the ship moulded breadth B; the relative chord length of the flapping foil (c/Lpp) was defined as the ratio of the flapping foil’s chord length c to the length Lpp between the ship’s vertical line. The spring stiffness coefficient k’, which measures the relative magnitude of spring stiffness, is defined as following Equation 2.
Where k represents the torsion spring stiffness, N. m/rad; ρ is the density of water, kg/m3, which is determined to be 998.6 kg/m3; Bf is the flapping foil’s sweeping height during heave motion; and fe is the flapping foil’s encounter frequency, which can be found in Equation 3.
Where V is the ship’s speed, m/s; Cw is the wave velocity, m/s; and Cw = f ∙ λ, where f is the wave frequency, Hz; and λ is the wavelength, m.
The previous research results show that, except the spring stiffness k, frequency ratio r is another important parameter that may affect the performance of the semi-passive flapping foil system [8]. The relationship between them can be expressed as Equation 4. In this paper, a fixed and sufficiently small rotational inertia of the flapping foil =0.001kg.m2 is selected for the research. Because when the frequency ratio is small, that is, the foil has a small rotational inertia, the semi-passive flapping foil can work well, and the influence of the rotational inertia on the hydrodynamic force can be ignored. The effect of the spring stiffness on the propulsion performance and motion of the wave-augmented propulsion system is mainly discussed at a relatively lower rotational inertia of the flapping foil.
Where fN is the natural frequency of the semi-passive flapping foil, Hz; fe is the flapping foil’s encounter frequency; is the inertia moment of the flapping foil without the attached water, kg.m2.
We consider the ship traveling at constant forward speed V in basic waves propagating at 180°with respect to the ship’s longitudinal axis, which corresponds to head-incident waves. The FINE/Marine program utilized in this work is capable of producing steady second-order Stokes waves based on the VOF model, defined by Equation 5.
Where H is the wave height, m; K is the wave number; ω is the frequency of the wave circle (ω = 2π∙ f); and t is time, s.
2.2. Near Wave Surface Flapping Foil Motion Model
The thrust enhancement benefits of bow-flapping foils come from the absorption of wave energy. From existing research, this benefit can be roughly attributed to two mechanisms: one is waves drive the ship’s motion, which in turn drives the flapping foils to work, indirectly absorbing wave energy and generating thrust; The second is the direct effect of waves on flapping foils, which changes their performance.
The performance of ships with bow-flapping foil in pitch and heave motion in head waves is examined in this research. The second-order Stokes wave control equation in this numerical method can be reduced and written as cosine waves to make it easier to see the phase link between wave formation and flapping foil motion.
Where A represents the amplitude of the wave, m.
The trajectory of flapping foil motion near the wavefront is depicted in Figure 3, and its pitch and heave movements roughly correspond to a periodic sine law. Consequently, the flapping foil’s heave and pitch motion equations can be expressed as
Where h0 is the heave amplitude of the flapping foil, m; θ0 is the pitch amplitude, radian; Φ = π/2 represents the phase difference between the flapping foil’s heave and pitch movements; ω0 denotes the flapping foil motion’s circular frequency, Hz; ψ is the phase difference between the flapping foil and the wave.
As mentioned earlier, wave activity could influence the motion of a bow-flapping foil. Consequently, in the near-wave surface flapping foil motion model, the flapping foil motion’s circular frequency ω0 and its encounter circular frequency ωe are identical, and their relationship to the wave circular frequency ω is as follows.
In this study, it is defined that when initial conditions x0 = 0 and t0 = 0 are given, the wave control equation at η(x = 0, t = 0) = A corresponds to the moment when the flap’s initial position aligns with the wave crest. The encounter phase ψ = 0 is defined at this instant, with θ(t=0) = θ0 and y(t=0)=0. This method enables us to determine the flapping foil’s motion posture when encountering wave crests at different encounter phases, as illustrated in Figure 3.
3. Numerical Method
Based on the general-purpose ISIS-CFD solver of FINE/Marine, the rigid body dynamics equation and fluid hydrodynamic equation are solved simultaneously for coupled interaction between the bow foils and ship in head sea condition, to verify that the proposed wave foil is capable of generating propelling forces. The domain flow field and object surface of the ship and flapping foil are meshed with unstructured hexahedral grids generated by the Hexpress grid generator, which can well adapt to complex geometric shapes. The dynamic mesh technology can ensure the mesh quality after deformation.
Free-surface flow is modeled with the two-phase VOF approach with an interface tracking and interface-capturing method [34]. Both steady and unsteady free-surface flows are solved with a time integration technique. For specific numerical method details, please refer to our previous work [8].
3.1. Governing Equations
This research does not take the flapping foil’s assembly procedure into account. As a result, the hydrodynamic relationship between the ship and flapping foil can be simply studied by creating a virtual connection using FINE/Marine software. The hydrodynamic model uses the hull motion as its input to determine the hydrodynamic force and moment of the bow foil wave-augmented propulsion system. As for the dynamic model, the hydrodynamic force and moment from the hydrodynamic model are applied in the Newton–Euler equation to determine the foil and hull motion. By using Reynolds-averaged integral in-compressible viscous fluid dynamics equations, considering the motion of grid cells and the influence of gravity, the continuity equation and momentum equation can be written as the following integral forms:
where Ω is the element volume; is the flow velocity; vi is the velocity component; τij is the sum of viscous stress and Reynolds stress, and p is the pressure; Sj is the components of the area vector, and is the area vector of the element surface. gi is the acceleration component of the element, which has a component only in the direction of gravity. The turbulent viscosity coefficient is determined by Menter’s SST k-ω shear-stress transport turbulent model [35].
The density can be represented by Equation 12 by specifying the volume fraction as α and capturing the free surface using the VOF (volume of fluid) method.
Where ρw and ρa are the densities of water and air, respectively.
3.2. Grid Division and Boundary Conditions
According to the length of different ship models (Lpp), this work performs simulations in a numerical wave tank of around 5Lpp × 2Lpp × 2Lpp. The height above the water surface is one time the Lpp. A numerical wave generator is placed at the entrance boundary of about one time the Lpp in front of the bow. A numerical wave absorber is set in the rear section of the tank, which is roughly twice the Lpp long. And the zero-pressure gradient is set at the outlet boundary approximately 4 times Lpp behind the stern. The surfaces on both sides and the upper and lower surfaces are set as slip wall boundary conditions. Both the hull surface and the hydrofoil surface are non-slip wall boundary conditions. And numerical interpolation is used to transfer information in the interface of overlap grid region. The free surface is modeled with the two-phase VOF approach with a High Resolution Interface Capturing (HRIC) scheme. One half of the calculation domain diagram is shown in Figure 4. With a time step of 0.005 seconds, set a free surface with air fluid above and water fluid below at the ship’s waterline position (z = T).
To reduce computation for the background mesh, a hexahedron mesh with local successive refinement method was chosen for the computational domain to keep just some local region as a refined mesh, as shown in Figure 4. The local successive refinement approach is used to gradually refine the grids of the free surface, the ship hull’s Kelvin wave-forming zone, and the object’s surface and boundary layer areas in order to reduce the number of grids while preserving high computational accuracy. The y-direction grid in the two-dimensional parallel zone is the same size as the free-surface grid, and the z-direction grid is the same size as the ship’s surface grid. Additional refining is needed in the x-direction; the ship’s hull’s Kelvin wave area’s z-direction grid size matches the ship’s surface grid size, and additional refinement is done in the x and y directions. The enlarged detail grid of the free surface and ship wave region is illustrated in Figure 5, which is the top view of local successive refinement of the grid near the free surface.
A multi-block dynamic overlap grid approach is adopted in the whole calculation domain to allow relative motion between the grids for hull motions, that is, the computational domain grid will produce elastic deformation with the heave and pitch motion of the hull. And the overlapping grid technique is also used to construct the foil domain grid. The overlap grid subdomain around the foil is cylindrical, with a diameter of 2.5c. The overlap grid subdomain around the foil makes rigid motion together with the foil. The background grid for the foil’s domain will be the ship’s domain grid. To get precise results of the wave’s effect on the flapping foil, the ship’s backdrop grid must still be locally densified at the flapping foil’s location. The grid size must also match the size of the foil’s domain. The surface grid of the hull and foil was also refined to more properly represent force variations of the hull and foil during wave motion. Figure 4 displays the mesh partition of the domain as well as the mesh of the ship and flapping foil surface. Table 2 displays the grid sizes in each location.
3.3. Validation of Numerical Methods
The accuracy of numerical methods must be guaranteed prior to undertaking numerical research on ships and flapping foils. In this section, simulation results are compared against other methods for the validation of the numerical scheme used for the hydrodynamic analysis of the examined system. The simulation in this hydrodynamic problem of bow foil involves ship waves, flapping foils, and wave problems, so the following three aspects are numerically verified separately.
3.3.1. Ship Wave and Resistance in Still Water
In this section, the results of calm water resistance (Rx) at various speeds (V) and wave profiles are selected to verify the reliability of ISIS-CFD solver of FINE/Marine. Equations 13 and 14 demonstrate how to use the Froude number (Fr) to describe a ship’s relative speed and the resistance coefficient CT to describe the relative magnitude of the resistance the ship experiences.
Where g is the gravitational acceleration, taken as 9.8 m/s2; L is the characteristic length of the ship model; V is the ship’s speed.
Where Rx represents the total resistance of the ship’s hull, and Sa is the wetted surface area of the ship.
Figure 7 compares the CFD results of ship resistance coefficient CT in still water with the towing tank experiment results conducted by Olivieri et al. [31], MOERI [32], and the University of Tokyo in Japan [33]. It is evident that there is a good agreement between the experimental data and the CFD results. The error for most calculation points is less than 1%, and for some calculation points, the error does not exceed 3%.
Subsequently, the waveform calculated by CFD is compared with the experimental results to further verify the accuracy of the numerical method. Similarly, the waveform charts obtained from the towing tank experiment conducted by Olivieri et al. [31] are used to compare and verify the calculation results of the DTMB 5415 type ship. For the KCS type ship, the waveform comparison is conducted using the experimental results obtained by Kim et al. [36] at MOERI in 2001. It is easy to see from Figure 8 that, in still water conditions, the waveform derived from CFD calculations and experiments are almost identical, with essentially the same peak and valley positions. In conclusion, the numerical method used in this paper is feasible and reliable for the resistance and ship wave analysis.
3.3.2. Ship in Head Wave
The research in this paper is mainly carried out in wave settings, so it is also necessary to verify the numerical wave generator. Based on previous research on ship sea-keeping performance [37], this paper also compared the heave transfer function TFx3 and pitch transfer function TFx5 to verify the accuracy of the heave and pitch amplitudes calculated by the CFD method under wave conditions. The following are the two expressions:
Where X3 is the heave height of the hull; X5 is the pitch angle of the hull (sum of positive and negative pitch angles); Ak is the wave steepness, that is, Ak = H/λ.
For the DTMB 5415 ship, the following working conditions were chosen: Fr = 0.28, wave steepness Ak = H/λ = 0.025, and the working conditions can be changed by setting alternative wavelengths λ. Experiment data from Irvine [37] was utilized for validation. The KCS ship model was validated by comparing the EFD results from Simonsen [38], under the conditions of wave steepness H/λ = 1/60 and Fr = 0.26. Experimental data from Journée [39] at Delft University of Technology was utilized to validate the Wigley ship model. In their experiment, Journée measured four different kinds of Wigley ships. The Wigley-type ship model used in this study is consistent with the Wigley III ship model employed in the experiments conducted by Journée’s et al. Consequently, the Wigley III ship’s experimental data is chosen for validation.
The heave and pitch motion transfer functions and for three ship types under various wave conditions are compared, as shown in Figure 9 and Figure 10. From the comparison results, most of the calculated results are in good agreement with the experimental results of all three ship models under various wave situations, with the majority of errors being less than 1%. On the other hand, the error somewhat increases in high wave situations. This occurs because the designed wave height exceeds the grid refinement range for the near wave surface in the grid division.
The sea conditions studied for the bow-flapping foil system in this paper are all within the grid refinement range for the near-wave surface in the grid division, so this kind of error will not appear. The accuracy of the numerical approach described in this paper for ship wave analysis may now be verified.
3.3.3. Flapping Foil and Wake Vortex
In order to validate the numerical method used for flapping foil, selected benchmark conditions in Chen’s two-dimensional semi-active flapping foil research experiments are simulated [40]. Chen selected a high aspect ratio flapping foil model with an aspect ratio of 7.5 in the experiment to prevent the flapping foil’s three-dimensional effect from having a major influence. Table 3 displays the experimental settings chosen for this validation stage, and the definitions of relevant parameters could refer to the expressions in the literature [40].
Chen’s experimental and CFD data, including the force condition, pitch angle, and the vortex propagation process of the flapping foil, were compared in Figure 11 and Figure 12 separately. The image shows how well the numerical simulation findings of this study match the CFD data and Chen’s experiment, and how the vortices form and develop. This can suggest that the physical model and numerical method used in this paper are feasible and reliable for the hydrodynamic performance analysis of the flapping hydrofoil.
In conclusion, it’s discovered that the results of the numerical method in this research are essentially consistent with the verification data of ship still water resistance, ship wave motion, ship model tests, and flapping foil models. We may now be sure that the numerical approach described in this study is essentially accurate and trustworthy.
4. The Resistance Reduction and Thrust Enhancement Effect of the Bow-Flapping Foil System
4.1. Applicability of Different Vessel Types with Flapping Foil System
In order to verify the universality of the thrust and drag reduction characteristics of the flapping foil system and compare the differences in the flap characteristics under different ship types. In this section of the study, the flapping foil system is positioned at the same location on the bow of three different ship types, ensuring the same axial position (x/Lpp = 0.5) and identical submergence depth of the flapping foil (D/T = 3.016). And the wave conditions for these three ship types are also uniform, with λ/L = 1.2 and Ak = 0.025.
To eliminate the size influence of the flapping foil on the drag reduction effect of the system, we only explore the impact of the flapping foil system on the hull when their relative sizes are consistent, that is, with the fixed relative dimensions of the flapping foil to the hull (h/B = 0.52; c/Lpp = 0.0175.). Firstly, adjust the corresponding Fr by setting different speeds V for three types of ship models. The selected speeds for the first two ships (DTMB5415, KCS) are both close to their service speeds; for the third ship (Wigley), which is a theoretical model, the selected Fr number is relatively broad. Then, in order to make the relative torsion spring stiffness k of the flapping foil of the three ship types consistent, the sweep height Bf in the expression of the dimensionless parameter spring stiffness coefficient k′(Formula 2) is described by the average sweep height. The specific sea conditions and ship motion parameters are shown in Table 4 and Table 5. Different torsion spring stiffness k of the three ship types are given in Table 5 to ensure that the spring stiffness coefficient k′ is within the similar range.
Figure 13 shows the resistance coefficient CT of DTMB 5415 under different working conditions. Since the ship is sailing in the negative direction of the x-axis, the resistance of the hull is positive on average. On the contrary, the additional thrust generated by the foil is negative. It can be clearly seen from Figure 13 that the resistance of the hull with bow foil (red line) is smaller than that of the ordinary hull (black line). At the same time, this trend is more obvious with the increase of speed. The ship resistance time history curve varies significantly at higher speeds (Fr = 0.26, Fr = 0.28). In addition to lowering the ship’s overall resistance, flapping foil can efficiently smooth out higher-order resistance, increasing the ship’s stability while in motion.
In order to further clearly observe the motion of the hull and the bow foil, the heave and pitch motion curves of the hull and the bow foil in different working conditions are compared in Figure 14(a) and (b), respectively. The ordinates in the figures are all expressed as the magnitude of the parameter deviation from the equilibrium position. It is evident from Figure 14(a) and (b) that the ship with foil has substantially smaller heave and pitch amplitudes (red line) than a ship without foil (black line), and this effect progressively grows as speed increases. It is easy to conclude that the flapping foil system lowers the hull’s resistance by decreasing its motion response in waves. That is, for the hull, the bow foil is equivalent to a damping. Due to the damping effect of the bow foil, the heave amplitude of the hull with foil is slightly lower than that of normal hulls. It makes the heave amplitude of the hull with foil change very little at different speeds, that is, the bow foil plays a good damping role on the hull heave motion. Furthermore, from Figure 14(a) and (b), the flapping foil’s heave and pitch amplitude (blue line) are both far larger than that of the hull, and much larger than the wave amplitude. This is because the motion of flapping foil is affected by the combined action of the heave and the pitch motion of the hull. It is important to note that while the ship with foil experiences a large decrease in heave amplitude as speed increases, the flapping foils themselves experience a minor increase in heave amplitude. This suggests that the flapping foil’s heave amplitude is proportional to the wave energy it absorbs, which is advantageous for the engineering application of the bow flapping foil system. More focus should be put on creating the technical specifications of flapping foil according to sea conditions instead of hull motion in engineering applications.
To further verify the drag reduction and thrust enhancement effects of this bow-flapping foil system on the other two ship models, this paper also lists the CT curves and motion history curves of the KCS and Wigley ships at different speeds.
Figure 15 illustrates the CT curves of the KCS ship at different speeds. Similar to the results of the DTMB5415, as the speed increases, the drag reduction performance of the bow-flapping foil system on the hull is gradually enhanced. It is worth noting that for the KCS ship with intricate profiles and high service speeds (Fr = 0.26), due to the increased influence of the bow foil, the time history curve of the ship resistance has not changed significantly as DTMB5415. But the bow foil added not only reduces the resistance of the ship but also smooths the high-order resistance at high speed. However, at a lower speed (V = 0.5 m/s), the bow foil has little effect on the hull resistance. From the time-history curves of heave and pitch motion in Figure 16, it can also be observed that for the KCS hull, the influence of the flapping foil on its pitch motion is slightly greater than that on its heave motion. Overall, the influence on the motion of the KCS hull is less pronounced than that on the DTMB hull, and consequently, its impact on the overall drag coefficient of the hull is also slightly smaller.
Finally, we analyze the drag reduction effect of the flapping foil system on the Wigley ship through Figure 17 and Figure 18. According to the curve of drag coefficient CT in Figure 17, it can be seen that at low speeds (Fr=0.15) and medium to high speeds (Fr=0.25), the flapping foil system still has a significant drag reduction effect on the hull, and can efficiently smooth out higher-order resistance, increasing the ship’s stability while in motion. These effects are consistent with those of the first two ship types. However, at higher speeds (Fr = 0.35), the drag reduction effect of the flapping foil system disappears, and even causes an increase in drag. The changes in resistance values are more clearly displayed in the quantitative bar chart in Figure 19.
Figure 18 shows the heave and pitch time-history curves of the Wigley ship with and without flapping foils when Fr=0.15. It can be observed that the main reason for the resistance reduction of the hull by a flapping foil is the control of the pitch amplitude, which can be reduced by up to 20.14%. Moreover, from the shape of the pitch curve contour (dashed line in Figure 18(b)), flapping foils can significantly improve the stability of the hull movement, thereby further enhancing the seakeeping of the ship. However, it can also be seen that this flapping foil system has little effect on the heave motion of the Wigley hull, which is also the reason why the system’s drag reduction effect on the Wigley ship is not very ideal. It is speculated that this is due to the fact that during the process of increasing the ship’s speed from Fr=0.25 to 0.35, the excessive speed weakened the ship’s response to wave motion (as shown in Figure 18(a)), resulting in a decrease in the heave and pitch amplitude of the flapping foils, leading to a decrease in the drag reduction effect. This also explains the phenomenon that the resistance coefficient of the Wigley ship with and without flapping foils is not significantly different at high speeds.
In order to further quantitatively analyze the drag reduction and thrust enhancement performance of the flapping foil system on different ship types, the time average of the hull resistance and the thrust of the foil under the three working conditions was carried out for the whole period in Figure 19. Since the ship is sailing in the negative direction of the x-axis, the resistance of the hull is positive on average. On the contrary, the additional thrust generated by the foil is negative. Overall, at the same speed, the overall resistance of a ship with a flapping foil system is significantly lower than that of a ship without the system, and this drag reduction effect also increases with the increase of speed. Near the service speed, the maximum drag reduction ratio of the DTMB 5415 ship reached about 6.21%, which is consistent with the results of Hou’s fixed foil installation experiment under wave circumstances [1]. The drag reduction ratio of the KCS ship reached 9.60%, and the Wigley ship also showed good drag reduction performance at medium speed. All these fully demonstrate the universality of the flapping foil’s drag reduction effect on ships. Furthermore, it can be seen that the flapping foil system not only could reduce the resistance of the hull, it also generates thrust, and the higher the speed, the greater the thrust. Even for the Wigley ship with less than ideal drag reduction effects, the thrust increase rate of the bow flapping foil system is as high as 17.78%. And, the thrust generated by the flapping foil increases significantly with the increase of speed. Although the heave and pitch amplitude of the flapping foil decrease at Fr=0.35, the thrust generated by the system further increases due to the increase in ship speed and the advancing speed of the flapping foil. Once again, it confirms the principal mechanism of the bow foil: increased thrust generated by the bow foil, and reduced the added resistance in waves by damping effect of the bow foil [41].
From the above results, it was discovered that the anti-resistance and anti-pitching properties of the flapping foil on these three different hulls are consistent. In other words, the fundamental characteristics of the flapping foil are its sensitivity to speed, anti-resistance, and anti-pitching performance. However, the features of the flapping foil’s effects on various ship types also varied because of the variations in the appropriate ship molded lines and service speeds.
4.2. Analysis of Ship-Foil Coupling Effect
In order to reveal the interaction law between the flapping foil and the hull from the mechanism, and to provide the theoretical basis for future engineering applications, it is necessary to analyze the regularity in changes of the flapping foil operating and the influence of the hull flow field on the flow field of the flapping foil.
Figure 20 shows the variation of various parameters of the flapping foil system within the motion cycle, using a DTMB5415 ship with k = 40 N ∙ m/rad and Fr = 0.28 as an example. Sea condition is λ/L = 1.2, Ak = 0.025. Overall, the motion characteristics of the bow-flapping foil system are quite similar to those of traditional semi-active flapping foil thrusters. In the heave curve of the bow foil system, it can be seen that the flapping foil moves symmetrically at the position of z= -0.5 m, basically showing a sine curve, similar to a conventional semi-active flapping foil thruster. This is because the flapping foil system is set at a position 0.5 meters below the bow baseline and is actively controlled by the ship’s motion. The phase difference between the pitch curve and the heave curve is slightly less than π/2, which is due to the inertia of the flapping foil and the action of the torsion spring, which has been discussed in detail in our previous work. However, the pitch motion of the bow-flapping foil system is no longer in the form of a sine curve due to its complex hydrodynamic driving. Since the torsion spring can provide a restoring torque for the flapping foil during motion, the hydrodynamic angle of attack (AOA) curve of the flapping foil system still presents a relatively regular sine curve shape. Additionally, it is evident from the FL-AOA curve in Figure 20 that the flapping foil’s lift FL has a positive correlation with the absolute value of its hydrodynamic AOA. The following are the methods used to calculate lift and angle of attack, if we ignore the moving speed of the water particle in the wave:
Further observation of the force curves (Fz and TF) of the bow flapping foil system in Figure 20 reveals that within one cycle, the damping force (Fz) generated by the flapping foil at time t2 and t4 reaches two peaks, and their absolute values are almost equal. This means that the damping force Fz generated during the first and second half of the cycle is almost equal in magnitude. Based on the heave curve of the bow-flapping foil, it is found that from time t1 to t3, which is the process of the ship’s center of gravity rising, the damping force Fz generated by the flapping foil is negative, indicating a downward direction; from time t3 to t5, which is the process of the ship’s weight center descending, the damping force Fz is positive and directed upwards. That is to say, the damping force Fz generated by the system can always serve to reduce the pitch and heave of the ship, which is beneficial for the ship’s navigation in waves and further reflects the corresponding between the flapping foil system and ship.
The thrust TF curve generated by flapping foil is different from that of traditional semi-active flapping foil thruster. At the three moments t1, t3, and t5, where the AOA of the flapping foil is 0, no thrust is generated. However, at the two symmetrical moments t2 and t4, the magnitude of the thrust force TF generated by the flapping foil varies greatly.
On the one hand, this is due to the fact that the heave motion of the bow foil system is controlled by the pitch and heave of the ship, resulting in the motion trajectory of the flapping foil presenting a semi-elliptical arc shape [19]. It is not difficult to see from the time history curve of the horizontal motion velocity VA of the flapping foil that due to the influence of ship pitch and heave, its VA has been fluctuating around the ship speed (-2.09745 m/s). The VA at time t2 is significantly higher than that at time t4, and the AOA at time t4 is larger than that at time t2. Different speeds result in different propulsive forces, while larger separation caused by excessive AOA could also weaken the thrust generated. On the other hand, it is speculated that it may be the coupling effect of the bow flow field on the flapping foil. To verify this hypothesis, we further analyzed the velocity field of the longitudinal profile position of the ship’s flapping foil system in Figure 21, and also selected a set of four moments in one cycle starting from the lowest point of the flapping foil’s motion.
The scale of the velocity field in Figure 21 uses wave velocity as the reference, focusing on the velocity distribution of the flow field around the flapping foil and the wake field. From the figure, it can be seen that the velocity field distribution generated by the two motion processes of the flapping foil from bottom to top (1/4T) and from top to bottom (3/4T) is not symmetrical. During the process of the flapping foil from bottom to top (1/4T), the low-speed region (as indicated by the black arrow) has a smaller range compared to the latter (3/4T); the high-speed zone (as indicated by the white arrow) has a larger range compared to the latter (3/4T), and the velocity of the wake field (as indicated by the purple arrow) is significantly higher than that of the latter (3/4T). All these indicate that the flow velocity of the flapping foil in the motion process from bottom to top is generally greater than in the motion process from top to bottom. By observing the velocity distribution around the surface of the ship, it was further found that when the ship drives the flapping foil to move from bottom to top, the bulbous bow will generate a velocity field higher than the wave, thereby increasing the inflow velocity of the bow foil system. However, when moving from top to bottom, the inflow source of the bow foil system is only a stable open deep water, which is consistent with the flow field of a single flapping foil. In our previous research, it has been concluded that the speed of the flapping foil directly affects the thrust it generates. This could explain the problem of asymmetric TF time history curve of the flapping foil in Figure 20. Therefore, from the perspective of the velocity field and flapping foil thrust performance, the ship’s flow field will improve the flapping foil’s thrust performance by increasing the advance velocity of the flapping foil system, providing positive assistance for it. This further demonstrates the positive coupling effect of the system.
4.3. The Resistance Reduction Effect of Different Foil Parameters
Through the study in the previous section, it was found that the resistance reduction performance of the bow foil system under the coupling effect of the hull and flapping foil may be related to the motion parameters of the hull in waves, the geometric parameters of the flapping foil, and the encounter phase with waves. We will conduct detailed research on these aspects later.
4.3.1. The Influence of the Installation Position of the Flapping Foil on Its Effectiveness
Based on the preliminary study of the flapping foil mechanism, the speed of the heave motion has a direct impact on the FL of the flapping foil. However, not only the pitching motion but also the heaving motions of the ship in the waves can provide significant heave motions for the bow flapping system. Therefore, in order to fully exploit the positive effects of the flapping foil system, it should be installed at the position where the longitudinal motion amplitude of the hull is maximum, thereby further improving the thrust enhancement and resistance reduction performance of the flapping foil system. Based on the characteristics of ship pitch and heave motion, it is preliminarily inferred that installing the flapping foil system at the bow position should provide significant heave motion for the flapping foil.
To verify this hypothesis, we take the DTMB 5415 ship as an example and define the installation position of the flapping foil as the ratio x/Lpp (x is the distance from the leading edge of the flapping foil to amidship). Under the fixed conditions of Fr = 0.248, the flapping foil with the same size (h/B = 0.52, c/Lpp = 0.0175) is installed at three positions: bow (x/Lpp = 0.5), mid-ship (x/Lpp = 0), and stern (x/Lpp = -0.5), respectively, to explore the influence of the installation position on its effectiveness.
As shown in Figure 22, in order to compare the drag reduction and thrust enhancement effects of the flapping foil system at different positions of the ship more clearly, the CFD results of the hull resistance with the flapping foil system at the bow, middle, and stern positions were compared with the results of the ship without the flapping foil system. It is evident from Figure 22(a) that bow-foils (red line) can smooth the resistance curve and drastically lower the ship’s total resistance. However, the resistance curve of the ship with the mid-foil (blue line) is not much different from the average resistance of the empty ship (black line) and nearly overlaps with the resistance curve of the empty ship, indicating that the mid-foil has virtually little effect on reducing resistance. In the meantime, Figure 22(b) makes it clear that the bow-foil may continually provide a significant amount of thrust TF, which powers the ship. However, for the mid-foil, it primarily functions as a drag force. This occurs because its vertical movement is almost entirely driven by the ship’s pitching motion, which is far less pronounced than that of the bow-foil (as shown in Figure 23). Consequently, the component force TF of lift in the x-direction is smaller than the resistance Rx experienced by the flapping foil itself, which is undesirable in engineering. The stern-foil could produce some thrust, but the magnitude of that thrust is significantly less than that of the bow-foil, and the resistance reduction effect of the stern-foil on the hull is non-significant.
In conclusion, the bow-foil could produce significantly more thrust than the mid-foil and stern-foil in addition to having superior resistance reduction capabilities. At this point, not only can the optimal effect of the bow-foil be verified, but it also once again proves the correctness of the previous explanation of the principle of reducing drag and increasing thrust with a flapping foil system.
4.3.2. The Influence of the Spring Stiffness of the Flapping Foil on Its Effectiveness
Torsion spring stiffness is especially important in the semi-active flapping foil thruster design parameters. In addition to giving the flapping foil a restoring moment while in motion, the torsion spring can also raise the foil’s hydrodynamic angle of attack, which increases the lift that the flapping foil produces. But because there are so many different kinds of ships, there are also a variety of flapping foil system application scenarios. Therefore, it is crucial to investigate how spring stiffness affects the thrust augmentation, resistance reduction, and roll reduction of the flapping foil system in order to better adapt the bow foil system to various operating scenarios. The fixed sea state requirement in this section is λ/L = 1.2 Ak = 0.025. We still take the DTMB 5415 ship as an example, and investigate how flapping foil thrust, ship resistance, and ship motion responsiveness are affected by varying spring stiffness coefficients.
The thrust variations caused by the flapping foil system with varying spring stiffness at Fr = 20 are displayed in Figure 24. It is evident from Figure 24(a) that there have been notable alterations to the thrust time-history curve of the flapping foil at the two peak positions. Within one cycle, the value of the first thrust peak point of the flapping foil shows a trend of first increasing and then decreasing with the increase of spring stiffness k, and the time of the peak point gradually advances, while the second thrust peak point shows a gradual decrease with the increase of k. The average thrust value in Figure 24(b) shows that under the condition of Fr=0.2, the average thrust is highest at k=20. Additionally, Figure 25 shows the lift variation of the flapping foil under different spring stiffness. It is not difficult to observe that as k increases, the shape of the image gradually changes from “short and fat” to “slender,” and the peak lift gradually increases. When the spring stiffness k>40, the curve forms two intersection points, and the growth trend of lift gradually slows down as the spring stiffness k increases. This is because the torsional stiffness of the spring to some extent reflects the followability of the semi-active flapping foil. As the stiffness of the spring increases, the followability of the flapping foil improves and the hysteresis effect weakens. Therefore, the lift-AOA angle curve changes from an elliptical shape to an intersecting straight line. Overall, as the stiffness increases, the maximum AOA of the flapping foil gradually increases, and the lift generated also increases accordingly; however, the thrust generated by the flapping foil first increases and then decreases, and the maximum thrust does not increase with the increase of maximum lift. That is to say, although spring stiffness can effectively increase the hydrodynamic angle of attack and lift, it may not necessarily be beneficial for the thrust performance of the flapping foil system.
In order to further investigate the drag reduction and pitch motion reduction performance of a flapping foil with different spring stiffness on the hull, Figure 26, Figure 27 and Figure 28, respectively, show the changes in the total hull resistance Rx, pitch angle θ, and damping force Fz generated by the bow foil system.
From Figure 26, it can be seen that flapping wings can significantly reduce the peak resistance of the hull in waves, and as the spring stiffness increases, the average total resistance of the hull gradually decreases, with a maximum drag reduction ratio rR of about 4.38%. But when the spring stiffness k>40, the growth rate of the drag reduction ratio rR of the oscillating wing on the hull significantly decreases. From Figure 27, it can be seen that flapping wings can significantly reduce the peak resistance of the hull in waves, and as the spring stiffness increases, the average total resistance of the hull gradually decreases, with a maximum drag reduction ratio rR of about 4.38%. But when the spring stiffness k>40, the growth rate of the drag reduction ratio rR of the oscillating wing on the hull significantly decreases. And due to the fact that the drag reduction performance of the flapping foil on the hull is mainly achieved by reducing the motion response of the hull in waves, as shown in Figure 27, the flapping foil system can significantly reduce the pitch angle of the hull. As the spring stiffness of the flapping foil system gradually increases, the pitch height X5 of the ship gradually decreases, and the anti-pitching ratio rp of the ship also gradually increases with the increase of the spring stiffness, but the growth rate gradually slows down. The maximum anti-pitching ratio rp reaches about 10.30%, as shown in Figure 27 (b). Among them, the drag reduction ratio rR and pitching reduction ratio rp are calculated by the following formula
Where WOF represents a ship without foil; WF represents a ship with foil. X5 is the pitch angle of the hull (sum of positive and negative pitch angles)
Furthermore, it is easy to determine from Figure 28 that the more spring stiffness the flapping foil has, the more damping force Fz it generates. The direction of the damping force Fz is nearly always opposite to the ship’s pitch and heave direction, meaning that the more spring stiffness the flapping foil has, the more damping force Fz it generates and the stronger the anti-pitching performance. This is demonstrated by the time history curves of the damping force Fz generated by the flapping foil with different spring stiffness shown in Figure 28.
Thus far, we have discovered that spring stiffness has a different impact on the flapping foil’s ability to reduce resistance and increase thrust. The spring stiffness has a favorable correlation with the flapping foil’s resistance reduction and pitching reduction performance, but it does not directly improve the thrust-increasing performance. This is because in the operation of the flapping foil, the torsion spring will significantly increase the lift FL generated by increasing the hydrodynamic angle of attack AOA. However, it is not positively correlated with the thrust generated by the flapping foil, and the thrust-increasing performance of the flapping foil system is also related to its advance velocity VA. These have been discussed in detail in our previous research [41].
4.3.3. The Influence of Foil Size on the Effectiveness of the Action
Our previous research has shown that there is a contradiction between the selection of the spring stiffness of the flapping foil and its performance under different Sr number conditions, making the selection of the stiffness of semi-active flapping foil springs in engineering a dilemma. In order to adjust the spring stiffness coefficient k according to the changing working conditions at all times during its operation, there may be a scheme that can flexibly change the wingspan length to ensure that the bow foil system is always in a high-efficiency condition. Therefore, it is necessary to explore the performance differences of different sizes of flapping foils in resistance reduction and thrust increasing of the ship.
In the following set of experiments, the three kinds of ships are set at the speed which the effect of the flapping foil system is most obvious, as shown in Table 6 below.
The results shown in Figure 29, Figure 30 and Figure 31 show the changes in hull resistance of three ship models after installing flapping foil systems of different sizes. From Figure (a) of each figure, it can be observed that all three sizes of flapping foils can significantly smooth the ship’s resistance curve, and their effect is positively correlated with their own size. It is not difficult to see from Figure (b) of the three figures that the average resistance of the three types of ships with flapping foils is significantly lower than that of ships without the systems, and Size-III has the best resistance reduction effect. These two indicate that increasing the size of the flapping foil can enhance the system’s drag reduction performance on ships. By further observing the change in thrust of the flapping foil in Figure 32, it is not difficult to see that the larger the size of the flapping foil, the greater the thrust generated by itself. And as can be seen from the dashed line representing the average thrust in Figure 32, compared to resistance, changes in thrust are more sensitive to the size of the flapping foil system.
The comprehensive energy-saving effect of flapping foils on the hull could be characterized by the drag reduction and thrust increase ratio rRT, which is expressed as Equation 19.
According to this definition, when the Size-III flapping foil is installed on the DTMB 5415 ship, the maximum drag reduction and thrust increase ratio (rRT) of the bow foil system will reach 31.39%. That is to say, by installing the system, the overall resistance of a boat is 31.39% lower than that of a boat without this system. Although the thrust and drag reduction performance of all three kinds of hull gradually increase with the size of the flapping foil, the sensitivity of different ship types to the size of the flapping foil is not the same, and more detailed design work needs to be carried out based on specific sea conditions and ship types.
5. The Influence of the Encountering Phase on the Near-Wave Surface Bow-Flapping Foil
As mentioned earlier, there are numerous parameters that affect the performance of a flapping foil near the wave surface, and these have been extensively studied under open-water conditions. Excluding conventional flapping foil parameters, the key parameters influencing the performance of flapping foil in waves are solely the ratio of the chord length to the wavelength, and the encounter phase between the flapping foil and the wave [28,42]. Considering that in practical engineering, the flapping foil chord length is usually much smaller than the wavelength, its impact on thrust is essentially linear. However, research on the encounter phase is still quite lacking. Our previous work did not take into account the factors affecting the phase change of wave particles, but for real wave and flow conditions, the pressure distribution of any solid’s flow motion cannot ignore the velocity potential and viscous stress of fluid particles. Therefore, studying the encounter phase is of great significance for the bow-flapping foil system.
Ship motion could affect water particles close to the wave surface because of the intricate relationship between the ship and the wave as well as the various velocities of the water particles at different immersion depths. It is challenging to specify the precise angle of attack and relative velocity of the flapping foil with regard to the water particle at various times and locations. Consequently, only qualitative analysis is done here to examine the properties of a near-wave surface ship flapping foil. In the encounter phase scenario depicted in Figure 33, a semi-active spring-flapping foil thruster is positioned at a specific depth beneath the ship’s bow. The wave travels from left to right, causing the ship to sail against the wave. Pitch and heave amplitudes reach their highest when the ship is at the peak of the wave, and they reach their minimum when the ship is in a trough. This is the manifestation of the ship’s wave following state when the wavelength is large (λ >> Lpp). Thus, the foil’s encounter phase at this time is ψ = 90°, and the accompanying figure’s five positions depict the ship and foil’s velocity states at various wave positions. The fundamental ideas of hydrodynamics state that the periodic oscillation of water particles at equilibrium positions is what causes waves to propagate. The following figure shows the water particle’s velocity directions at various locations. The parameter definitions in the figure are shown in Table 7.
In Figure 33, from right to left, we can observe that:
- The foil is horizontal and has a zero speed while the ship is in a wave peak position. The foil speed is Vfoil = -Vw′ , which is calculated without taking the impact of water particles into account. At this time, the water particle velocity Vpoint in the wave is horizontally to the right, and the direction of the inflow velocity Vw (Vw = Vw′+ Vpoint) is consistent with the direction of the foil motion velocity Vfoil. At this time, the flapping foil does not generate lift FL.
- When the ship moves from the crest to the trough (at λ/4 ), the foil velocity Vfoil is created by combining the foil advance velocity VA and the heave velocity Vz. At this time, due to the vertical downward movement of the water particle, the direction of the relative inflow velocity of the foil (Vw) is shifted downward, and the velocity magnitude is also weakened compared to Vw′; At the same time, the lift FL generated by the flapping foil will also shift downward and decrease in magnitude (|FL| < |FL′|). The thrust TF generated by the flapping foil is to the right, and the damping force Fz is downward. The magnitude of the thrust TF is relatively reduced, while the magnitude of the damping force Fz is relatively increased. In short, at this point, both the two forces are not conducive to the movement of the ship (the ship’s overall resistance rises, and the amplitude of pitch and heave increases).
- When the ship is in a trough state (at λ/2), the foil is in a horizontal state, with the inflow velocity Vw′ moving horizontally to the right and the water particle velocity Vpoint moving horizontally to the left. At this time, the foil does not generate lift FL;
- When the ship moves from trough to peak (at 3/4 λ), the foil advance velocity VA and heave velocity Vz create the foil velocity Vfoil. At this time, due to the vertical upward movement of the water particle velocity Vpoint, the direction of relative flow velocity Vw′is shifted upward, becoming Vw. And the velocity magnitude of Vw is also lower than Vw′, resulting in the lift FL generated by the foil also shifting downward, and the magnitude is weakened ( |FL| < |FL′| ). The foil’s thrust TF is to the left, and the damping force Fz is downward; the thrust TF’s magnitude is relatively lower, while the damping force Fz’s magnitude is relatively higher; both are advantageous for the ship’s motion at this point (the ship’s overall resistance is decreased, and the pitch and heave amplitude are decreased). That is, after considering the movement of water quality points, the foil’s effect on the ship’s motion response is slightly strengthened, but the foil thrust effect will be diminished.
- When the ship is in a wave peak state again, the foil is in a horizontal state, and at this time, the foil does not generate lift FL again.
According to Zhou’s earlier research [42], the encounter phase ψ = 90° is generally at the worst effect phase rather than the optimal effect phase for the bow foil system. However, due to the inertia of the hull, it is not in a completely wave-following state. Instead, when the waves act, the hull responds with a certain phase delay, resulting in the encounter phase of the flapping foil being less than 90 °. Taking the DTMB 5415 ship as an example, Figure 34 shows the actual phase of the ship’s flapping foils at different positions of the waves in the CFD simulation results. The corresponding operating conditions are λ/L = 1.2, Ak = 0.025.
Under these operating conditions, the foil-wave encounter phase is ψ = -90°, as Figure 34 illustrates. When the flapping foil generates an angle of attack, such as at the 1/4 λ position, the water quality point velocity Vpoint direction is vertically downward, causing the relative inflow velocity of the foil Vw′ to shift downward and become Vw, resulting in an increase in velocity. As a result, the lift FL generated by the foil increases, and the horizontal thrust TF and vertical damping force Fz are effectively enhanced. This is manifested in the favorable impact of water particle motion on the performance of the bow foil system.
Adjust the ship’s flapping foil’s encounter phase with the wave by varying the wavelength and comparing the outcomes with the working parameters mentioned above to confirm the aforementioned perspective. Under wavelength ratios of λ/L=1.2 and λ/L=1.4, Figure 33 illustrates the force changes on the foil and the changes in heave motion between the foil and the hull. The hull has a considerable heave amplitude at λ/L=1.4, which causes the foil’s heave amplitude to somewhat rise. On the other hand, the foil produces much less thrust and damping force. The prior research rule is very different from this. The encounter phase of the foil in regard to the waves has obviously changed as a result of the wavelength shift, which has also altered the phase relationship between ship motion and wave motion. Using the foil’s heave motion as an example, Figure 34 examines how the foil’s encounter phase varies under two operating situations. When the foil is in the same wave position, the position of the foil heave motion at two wavelengths is compared.
To verify the above viewpoint, the phase of the ship flapping foil encountering waves was adjusted by changing the wavelength, and compared with the results of the above operating conditions. Under wavelength ratios of λ/L=1.2 and λ/L=1.4, Figure 35 illustrates the force changes on the foil and the changes in heave motion between the foil and the hull. As shown in Figure 35(a), compared to λ/L=1.2, under the condition of λ/L=1.4, the hull exhibits a larger heave amplitude, resulting in a slight increase in the heave amplitude of the bow foil. However, in Figure 35(b), the thrust and damping forces generated by the bow foil are significantly reduced, which differs significantly from the research pattern of conventional semi-active flapping foils. This is clearly due to the change in wavelength causing a change in the foil-wave encounter phase relationship between ship motion and wave motion, thereby altering the encounter phase of the flapping foil relative to the waves. Five places of the same wave period obtained at 1/4λ intervals from the wave peak point are represented by the five foil positions in Figure 36. By comparing the ship and foil heave curves under the two working conditions, it can be seen that the ship and foil motion curves have obvious phase changes under the two wavelengths. The illustration makes it evident that the foil experiences heave motion earlier when the wavelength length ratio λ/L is 1.4 than when it is 1.2. According to the definition of near-wave surface flapping foil motion model established in the previous section. The encounter phase between the foil and the wave is therefore 0° < ψ < -90° at this point. And, according to pertinent research [30,42], the thrust coefficient KT of the foil will exhibit a negative trend when the encounter phase ψ increases from -90° to 0°. As a result, the foil’s thrust curve extreme will exhibit a notable decline at λ/L = 1.4 in comparison to that value. Additionally, The study’s findings show that the peak thrust coefficient drops by almost 74% when the encounter phase ψ grows from -90° to 90°. Therefore, the encountering phase design is crucial for ship flapping foil performance optimization.
6. Conclusions
Based on previous preliminary studies on the drag reduction mechanism of an elastic bow-flapping-foil system, this paper further compares the resistance-reduction effects and motion response of flapping foil systems on three classic ship types (DTMB 5415, KCS, and Wigley) under similar operating conditions, in addition to analyzing the effects of key parameters of the flapping foils (spring stiffness, dimensions, and installation position) and the motion of water particles in waves (encountering phase) on the coupling system.
- The effects of ship flapping foil on resistance reduction and thrust enhancement were studied numerically for three classic ship types. The results showed that the flapping foil can reduce the motion response of the ship in waves by creating a damping moment that is opposite to the direction of ship motion, which lowers the ship’s overall resistance. Furthermore, the flapping foil can efficiently reduce the hull’s high-order resistance, increasing the hull’s stability. The resistance reduction ratio increased to 9.60%, and the pitch motion amplitude was decreased by up to 20.14%. Additionally, a certain amount of thrust is produced by the flapping foil. Generally speaking, the anti-resistance and anti-pitching properties of the flapping foil on these three different hulls are consistent. However, the features of the flapping foil’s effects on various ship types also varied because of the variations in the appropriate ship molded lines and service speeds.
- The lift produced by the flapping foil is directly proportional to the hydrodynamic angle of attack during its motion, according to the analysis of the coupling effect between the ship and foil. Increasing the spring stiffness for the semi-active spring flapping foil can effectively increase the flapping foil’s angle of attack, which will improve lift. Further investigation into spring stiffness, however, revealed that while the resistance-reducing and roll-reducing capabilities of the flapping foil will improve with increased spring stiffness, the thrust-increasing performance of the foil is not positively connected with spring stiffness. In the optimization of the flapping foil thruster, this also directs us to design the spring stiffness in accordance with the application scenario and relevant requirements.
- The study on the size and position of the flapping foil relative to the hull shows that the bow is the optimal installation position for flapping foil performance; larger flapping foils generate greater thrust and more significant drag reduction performance. However, when the foil size is large enough, its drag reduction performance increases relatively slowly. The thrust enhancement performance of the DTMB 5415 ship with flapping wings is significantly less sensitive to wing size than that of the KCS ship.
- Beginning with flapping foils’ mechanism, it is discovered that water particles in waves have a direct impact on the foil’s performance. Their impact on foil performance has both benefits and drawbacks depending on the encounter phase. The flapping foil’s encounter phase was altered by altering the wavelength, which also altered the phase relationship between ship motion and wave position. It was discovered that raising the wavelength ratio would result in the foil’s encounter phase shifting in the direction of 0°, which would lessen the flapping foil’s thrust. The flapping foil effect is at its best when the wavelength λ/L is 1.2, which causes the flapping foil’s encounter phase to be -90°.
In the future, on the one hand, we should further enrich the energy-saving effect data of bow-flapping foil systems of different ship types, laying the foundation for the widespread application of the system; on the other hand, a prediction model for the incremental effect of bow-flapping foils can be established, which can be further extended to estimate the carbon dioxide emissions of ships. This will more directly evaluate how this green ship technology can contribute to marine environmental protection.
Author Contributions
Conceptualization, J.Z. and L.M.; methodology, J.Z. and L.M.; investigation, L.L. and Y.Z.; validation, J.Z. and L.M.; writing—original draft preparation, L.L. and L.M.; writing—review and editing, W.S.; visualization, Y.Z.; funding acquisition, L.S. All authors have read and agreed to the published version of the manuscript.
Funding
This research was funded by the science foundation of national key laboratory of science and technology on advanced composites in special environments, grant number JCKYS2024603C013. And it is also funded by Shandong Provincial Natural Science Foundation, grant number ZR2025MS79.
Institutional Review Board Statement
Not applicable.
Informed Consent Statement
Not applicable.
Data Availability Statement
Not applicable.
Acknowledgments
This research is supported by the science foundation of the national key laboratory of science and technology on advanced composites in special environments.
Conflicts of Interest
The authors declare no conflict of interest.
References
- Hou H.; Krajewski M.; Ilter Y. K.,.et al. An experimental investigation of the impact of retrofitting an underwater stern foil on the resistance and motion. Ocean Eng. 2020, 205, 107290.
- Belibassakis K. A.; Filippas E. S. A Dynamical System for the Combined Performance of Innovative Biomimetic Thruster with Standard Propulsion System in Waves. Proceedings of ASME 2022 41st International Conference on Ocean, Offshore&Arctic Engineering. 2022, V05BT06A052.
- Jakobsen E. The foil propeller, wave power for propulsion. In 2nd International Symposium on Wave and Tidal Energy; BHRA Fluid Engineering: Cranfield, UK, 1981, 363–369.
- Naito, S.; Isshiki, H.; Fujimoto, K. Thrust generation of a fin attached to a ship in waves. J. Kansai Soc. Nav. Archit. 1986, 202, 23–29.
- Zhang Y.P.; Xu, L. A propulsion unit for ships based on water-treading of flapping foils. Ocean Eng. 2021, 235, 109330.
- Zhang Y.P.; Xu, L.; Zhou Y. A wave foil with passive angle of attack adjustment for wave energy extraction for ships. Ocean Eng. 2022, 246, 110627.
- Rozhdestvensky K.V.; Htet Z.M. A mathematical model of a ship with wings propelled by waves. J. Mar. Sci. Appl. 2021, 20, 595–620.
- Mei L.; Yan W. Propulsion characteristics of self-pitching flapping foil. Ocean Eng. 2023, 115233.
- Bøckmann E.; Steen S. Model test and simulation of a ship with wavefoils. Appl. Ocean Res. 2016, 57, 8–18.
- Terao Y., Wave Devouring Propulsion System: From Concept to Trans-Pacific Voyage. ASME, 2009. p. 119-126.
- Wu X.; Zhang X.; Tian X.; Li X.; Lu W. A review on fluid dynamics of flapping foils. Ocean Eng. 2020, 195, 106712.
- Anderson J. M.; Streitlien K. Oscillating foils of high propulsive efficiency. Fluid Mech. 1998, 41-72.
- Zhang, X., Su, Y.M., Wang, Z.L., Numerical simulation of the hydrodynamic performance of an unsymmetrical flapping caudal fin. J. Hydrodynamics, Ser. B 2012, 24(3), 354–362.
- Mei L.; Zhou J.; Yu D.; Shi W.; Pan X.; Li M. Parametric analysis for underwater flapping foil propulsion. Water 2021, 13:2103.
- Read D. A.; Hover F. S. Forces on oscillating foils for propulsion and maneuvering. J. Fluids Struct. 2003, 163-183.
- Taylor G.K.; Nudds R.L.; Thomas A.L.R.Flying and swimming animals cruise at a Strouhal number tuned for high power efficiency. Nature 2003,425: 707.
- Schouveiler L.; Hover F. S. Performance of flapping foil propulsion. J. Fluids Struct. 2005, 949-959.
- Floc’h F. Porpoising foil as a propulsion system. Ocean Eng. 2012, 53-61.
- Esfahani J. A.; Barati E. Fluid structures of flapping airfoil with elliptical motion trajectory. Computers & Fluids 2015, 142-155.
- Qi Z.; Xing Z. The propulsion performance of the semi-active tandem flapping foils for wave gliders: A study on vortex interactions and hydrodynamic performance. Ocean Eng. 2024, 117981.
- Lopes D.B.S.; Vaz. G. Analytical and numerical modelling of tandem oscillating foils propulsors. Ocean Eng. 2023, 113482.
- Harshal S. Raut, Jung-Hee Seo. Dynamics and thrust performance of a modeled multifoil wave-induced flapping foil propulsor. Ocean Eng. 2025, 119930.
- Bøckmann E.; Steen S. Experiments with actively pitch-controlled and spring-loaded oscillating foils. Appl. Ocean Res. 2014, 227-235.
- Thaweewat N.; Phoemsapthawee S. Semi-active flapping foil for marine propulsion. Ocean Eng. 2018, 556-564.
- Jiang Y.; Bai J.; Liu S.; Zong Z.; Li P. Experimental investigation of T-foil hybrid control strategy for ship motion reduction in head seas. Ocean Eng. 2022, 110251.
- Deng R.; Huang S..Experimental study on the influence of a T-foil and bulbous bow on the resistance and motion in regular head waves of trimarans. Ocean Eng. 2023, 114990.
- Grue J.; Mo A.; Palm E. Propulsion of a foil moving in water waves. Journal of Fluid Mechanics. 1988, 186: 393-417.
- De Silva, L.W.A.; Yamaguchi, H. Numerical study on active wave devouring propulsion. J. Mar. Sci. Tech. 2012, 17, 261-275.
- Belibassakis K.A.; Filippas E.S. Ship propulsion in waves by actively controlled flapping foils, Appl. Ocean Res. 2015, 52: 1-11.
- Zhang Y.p.; Xu Li. Wave propulsion for surface vehicle by foils with active angle of attack adjustment. Ocean Eng. 2023, 114980.
- Olivieri A.; Pistani F.; Avanzini A. et al. Towing Tank Experiments of Resistance, Sinkage and Trim, Boundary Layer, Wake and Free Surface Flow Around a Naval Combatant Insean 2340 Model. College of Engineering: Iowa City, IA, USA, 2001: 42.
- Van S. H.; Kim W. J.; Kim D. H.; Yim G. T.; Lee C. J.; Eom J. Y. Measurement of Flows Around a 3600TEU Container Ship Model[C]. Proceedings of the Annual Autumn Meeting.1997, 300-304.
- Kajitani H.; Miyata H.; Ikehata M. et al. The summary of the cooperative experiments on Wigely parabolic model in Japan[R].Proceedings of the Second DTRC Workshop on Ship Wave-Resistance Computations. Tokyo, 1983.
- Muzaferija S.; Peric M. Computation of free surface flows using interface-tracking and interface-capturing methods, In: Mahrenholtz O, Markiewicz M, editors. Nonlinear water wave interaction. WIT Press; 1999, 59-100.
- Menter F.R. Two-equation eddy-viscosity turbulence models for engineering applications. AIAA 1994, 32, 1598–1605.
- Kim W.J.; Van D.H.; Kim D.H. Measurement of flows around modern commercial ship models. Exp. Fluids 2001, 31:567-578.
- Irvine M.; Longo J.; Stern F. Pitch and Heave Tests and Uncertainty Assessment for a Surface Combatant in Regular Head Waves. J. Ship Res. 2008, 52: 146-163.
- Simonsen C.D.; Otzen J.F.; Stern F. EFD and CFD for KCS heaving and pitching in regular head waves. Proceedings of 27th ONR Symposium on Naval Hydrodynamics, Seoul, Korea, 2013.
- Journée, J. M. J. Experiments and Calculations On Four Wigley Hullforms. Delft University of Technology. Faculty of mechanical engineering and marine technology, 1992: Report 0909.
- Chen W.; Zhang Y.. Experimental and numerical studies on the torsion stiffness effect of a semi-active flapping hydrofoil propulsion. Ocean Eng. 2022, 265: 112578.
- Mei L.; Yan W.; Zhou J.; Shi W. Thrust Enhancement of DTMB 5415 with Elastic Flapping Foil in Regular Head Waves. J. Mar. Sci. Eng. 2023, 11: 632.
- Zhou J.; Zhang Y. Study on Effect of Encountering Phase on Performance of Flapping Foil Propulsor near Wave Surface. Shipbuilding of China 2023,64:249.
Figure 1.
Ship models and flapping foil models.
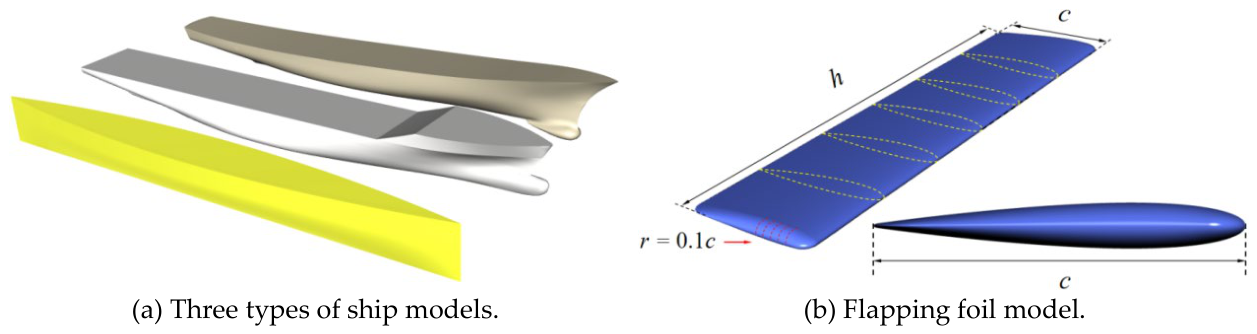
Figure 2.
Frames of reference and a sketch of the relationship between the hull, flapping foil, and wave.
Figure 2.
Frames of reference and a sketch of the relationship between the hull, flapping foil, and wave.
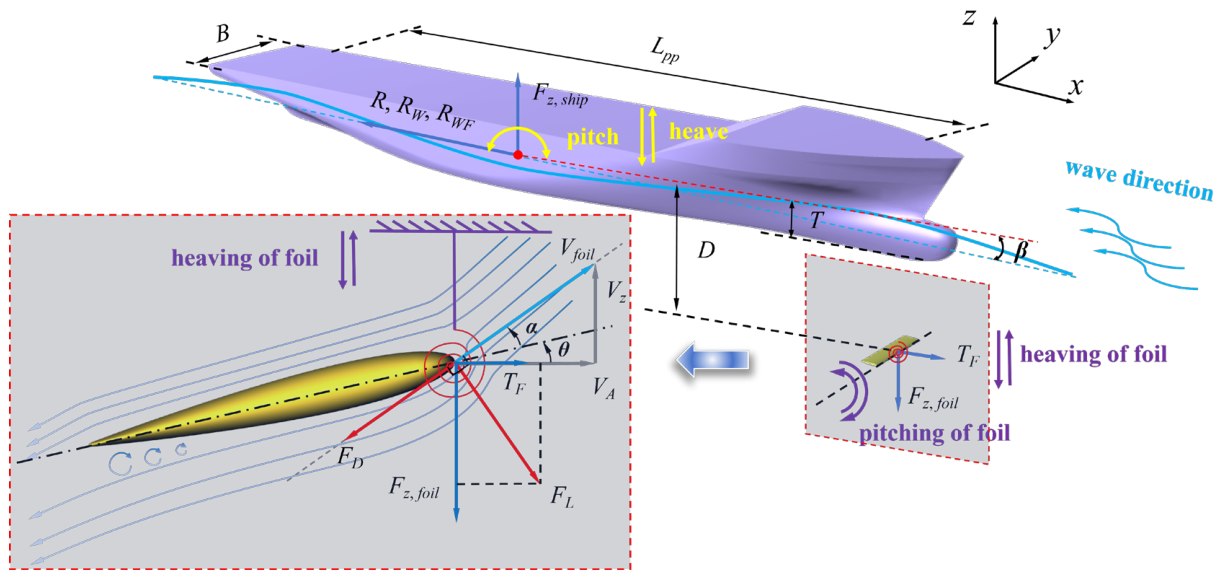
Figure 3.
Sketch of flapping foil motion near the wavefront.
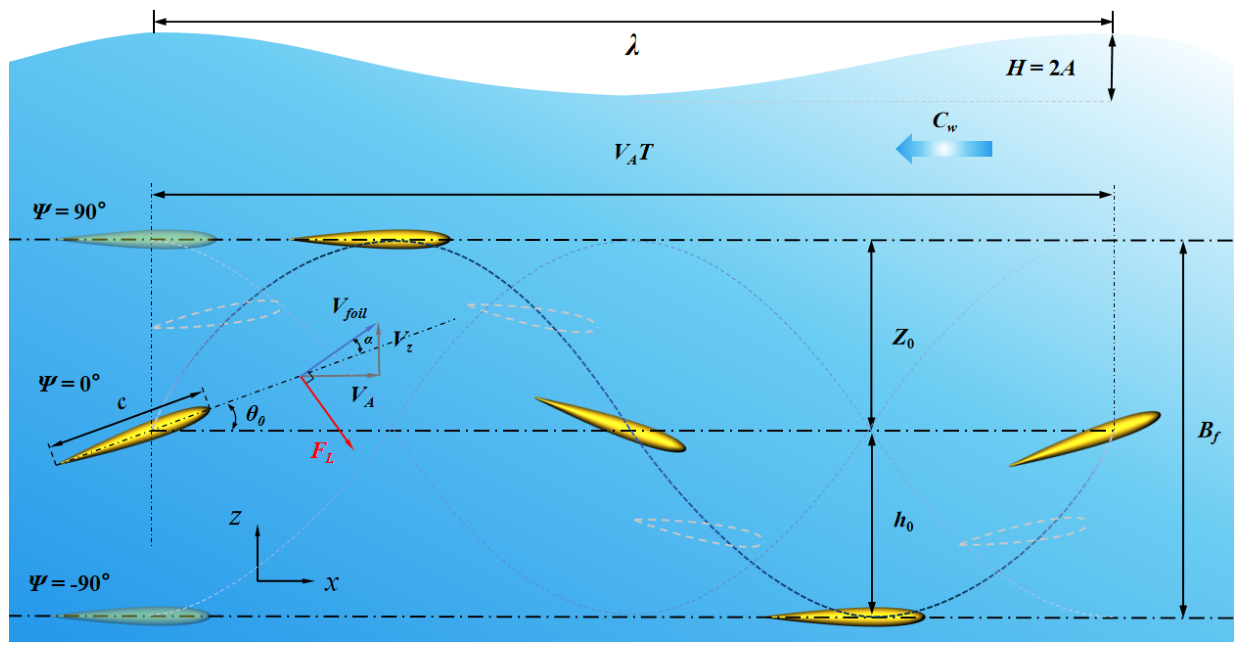
Figure 4.
Grid division of ship flapping foil calculation domain.
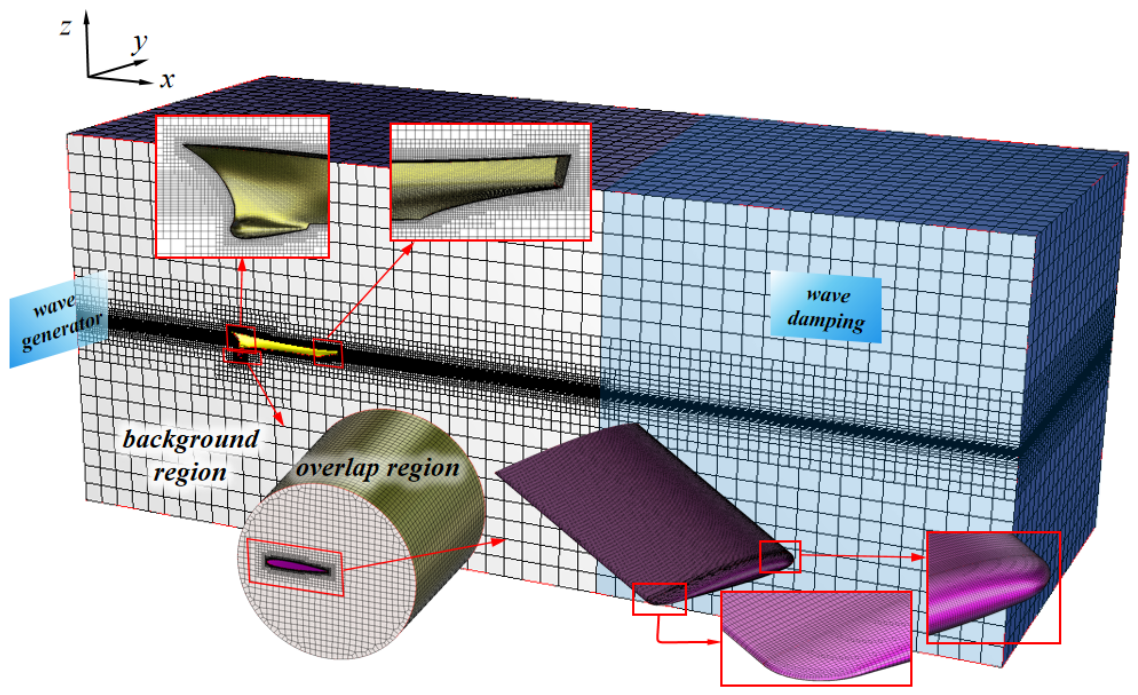
Figure 5.
Local successive refinement of the grid near the free surface.
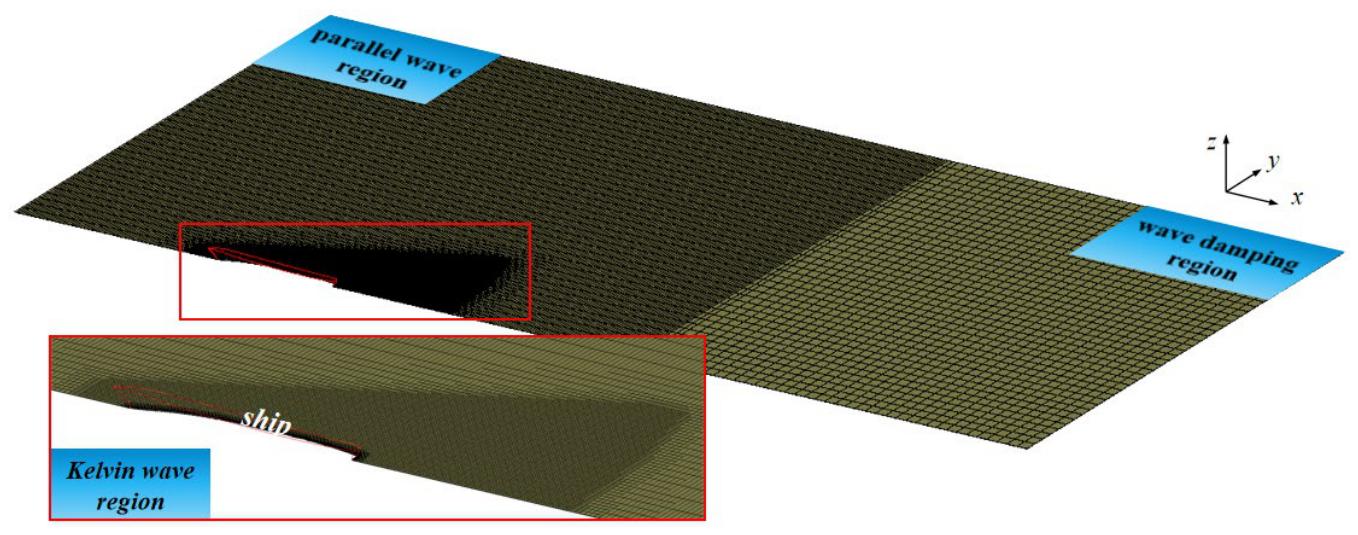
Figure 7.
Resistance coefficient CT of ship models under different Fr.
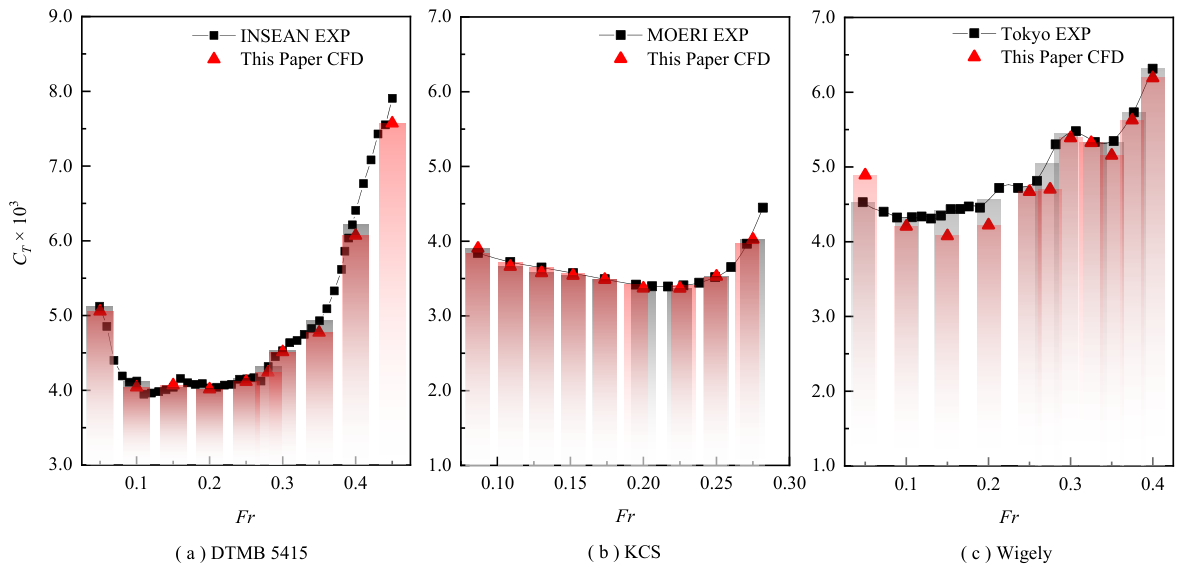
Figure 8.
Wave elevation contours comparison between CFD and experimental results.
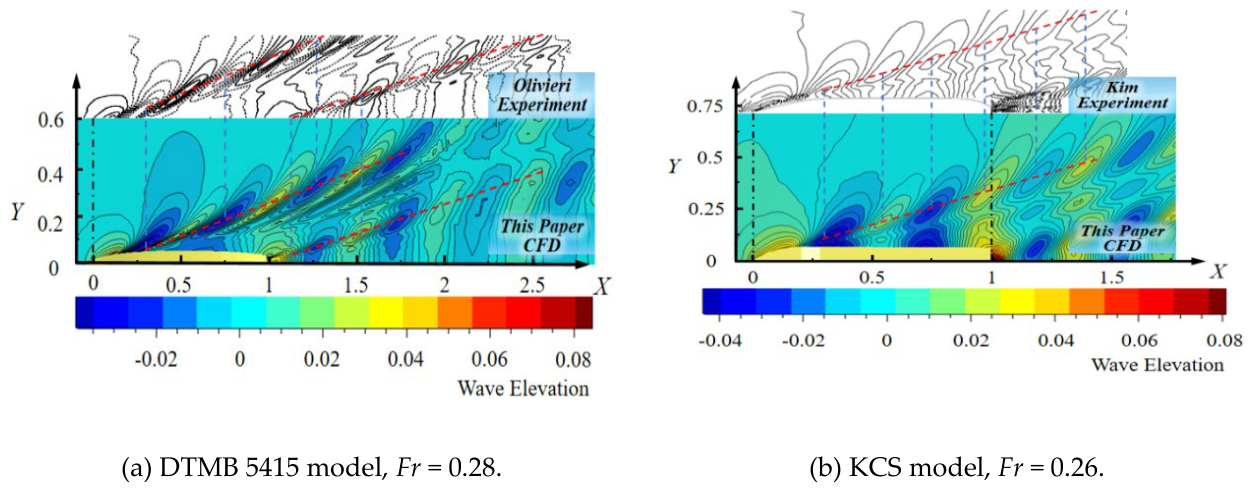
Figure 9.
Comparison results of heave motion transfer functions of three ship models at different wavelengths.
Figure 9.
Comparison results of heave motion transfer functions of three ship models at different wavelengths.
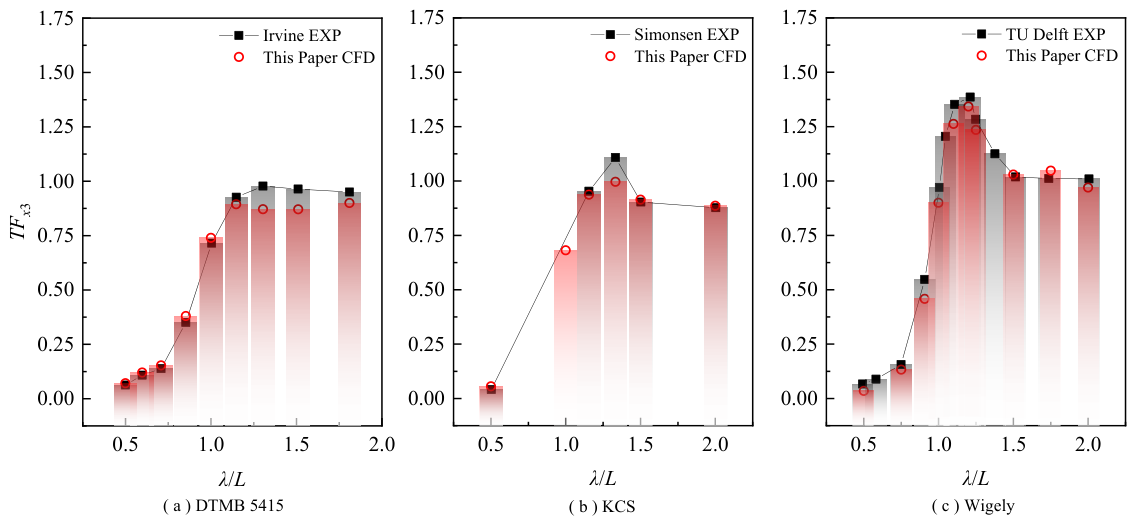
Figure 10.
Comparison results of pitch motion transfer functions of three ship models at different wavelengths.
Figure 10.
Comparison results of pitch motion transfer functions of three ship models at different wavelengths.
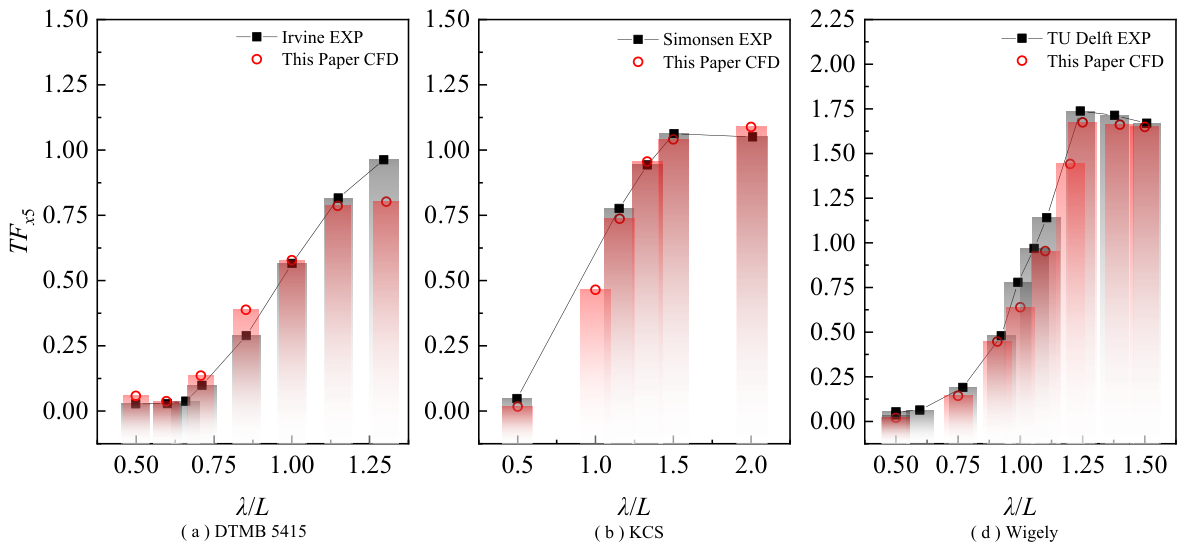
Figure 11.
Comparison of motion and force of semi-active flapping foil.
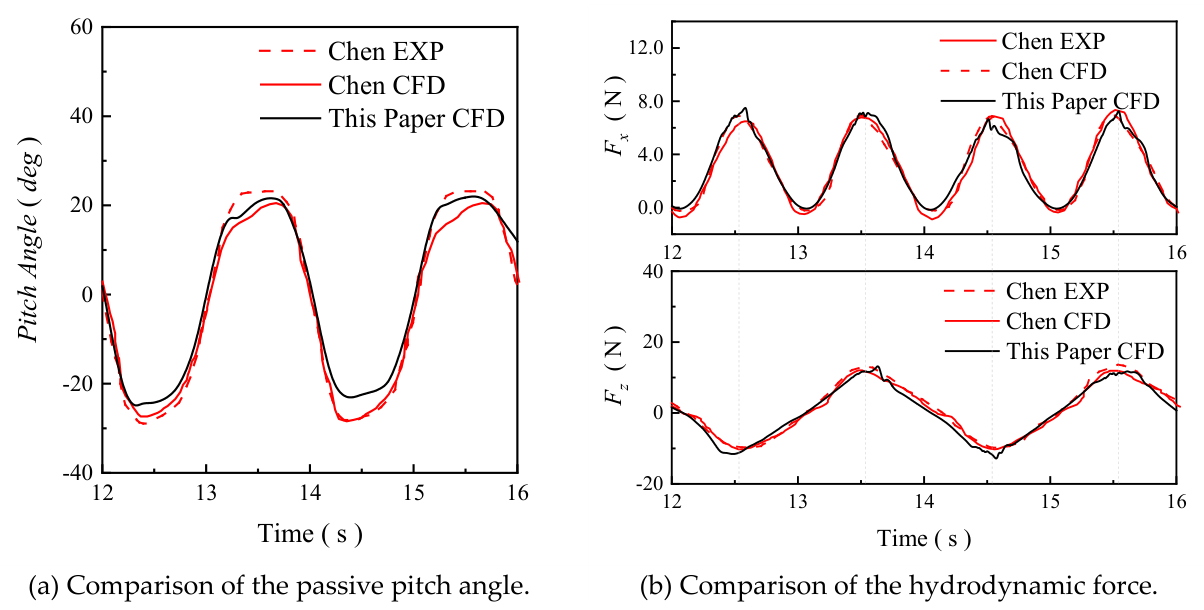
Figure 12.
Comparison of flapping foil vortices.
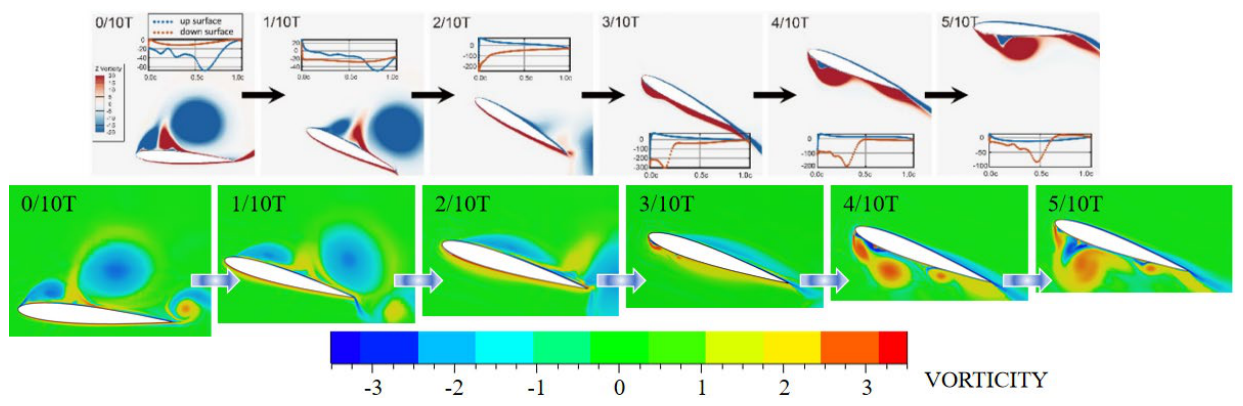
Figure 13.
Resistance coefficient curve of the DTMB 5415 hull at different speeds.
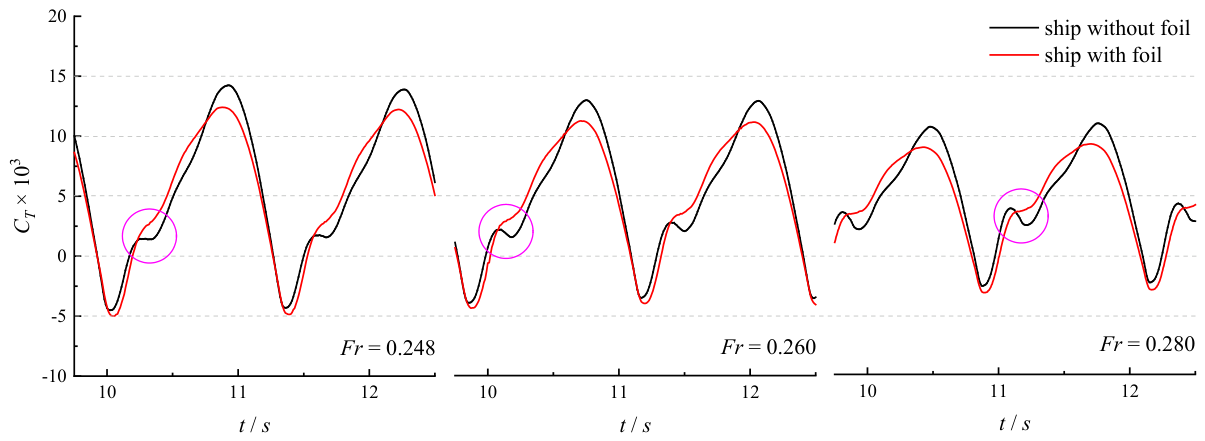
Figure 14.
Heave and pitch motion of the DTMB 5415 hull and bow foil at different speeds.
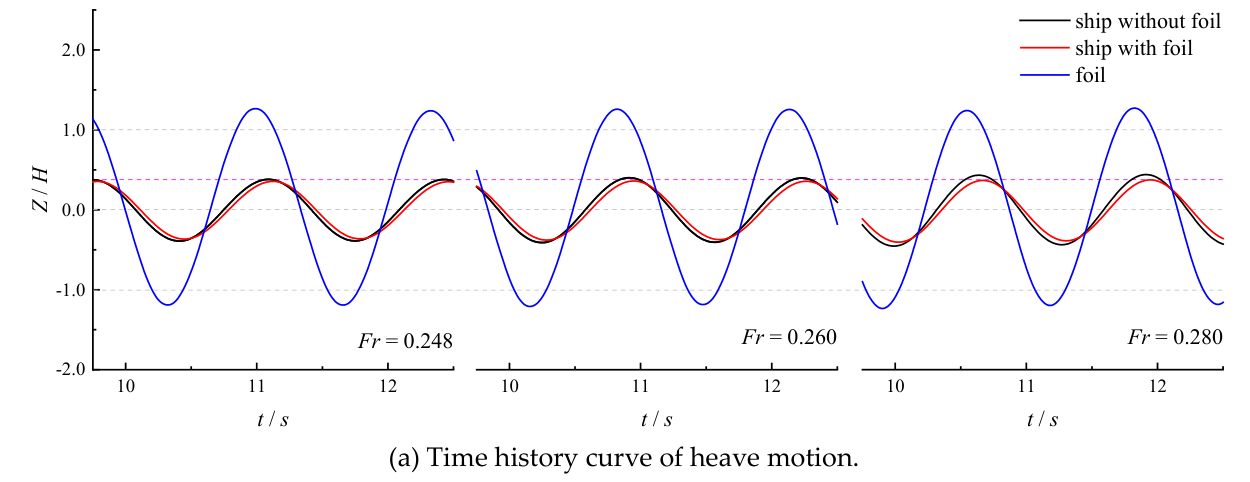
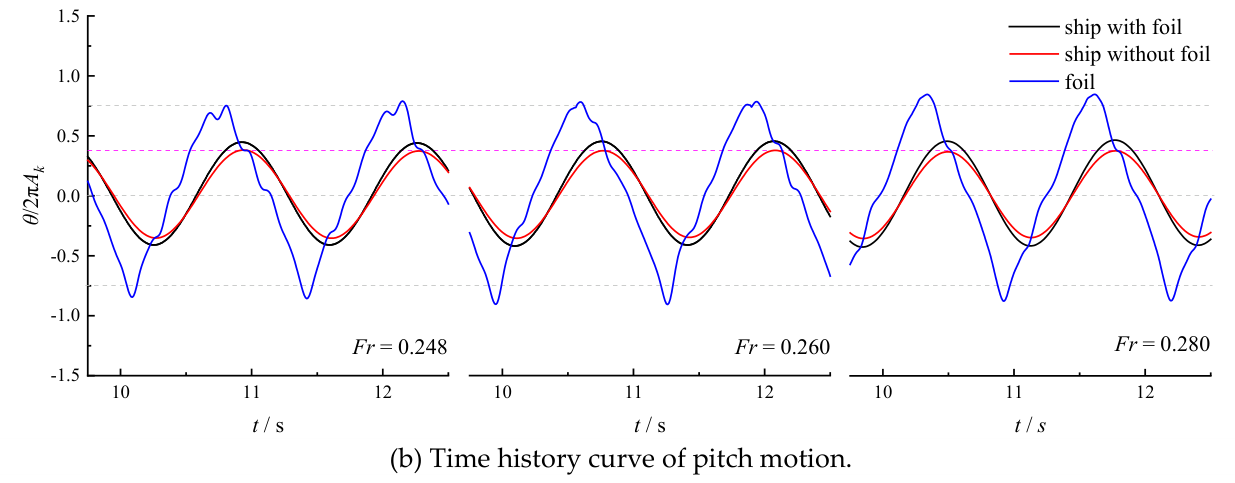
Figure 15.
Resistance coefficient curve of the KCS hull at different speeds.
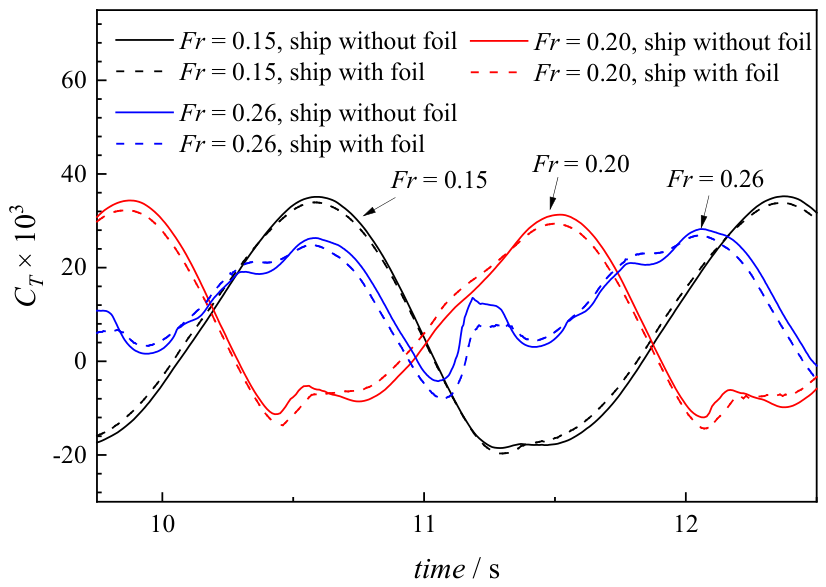
Figure 16.
Heave and pitch motion of the KCS hull and bow foil at different speeds.
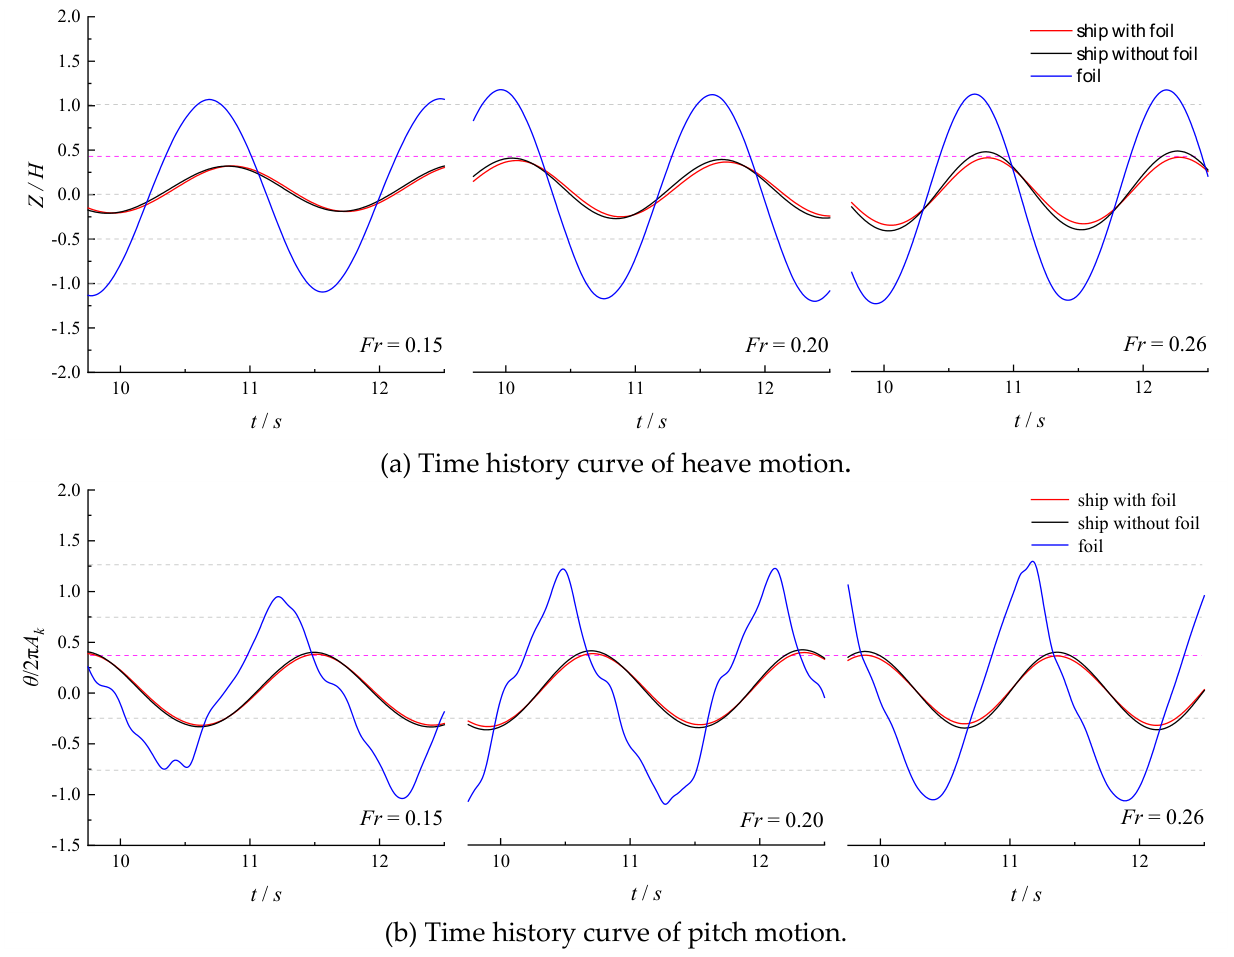
Figure 17.
Resistance coefficient curve of the Wigley hull at different speeds.
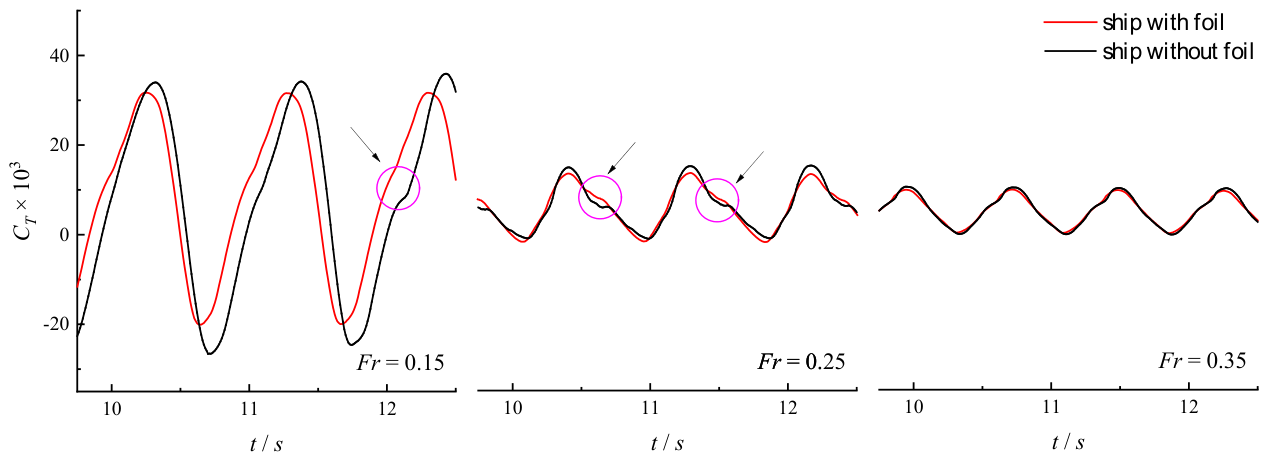
Figure 18.
Heave motion and pitch motion of the Wigley hull and bow foil at Fr=0.15.
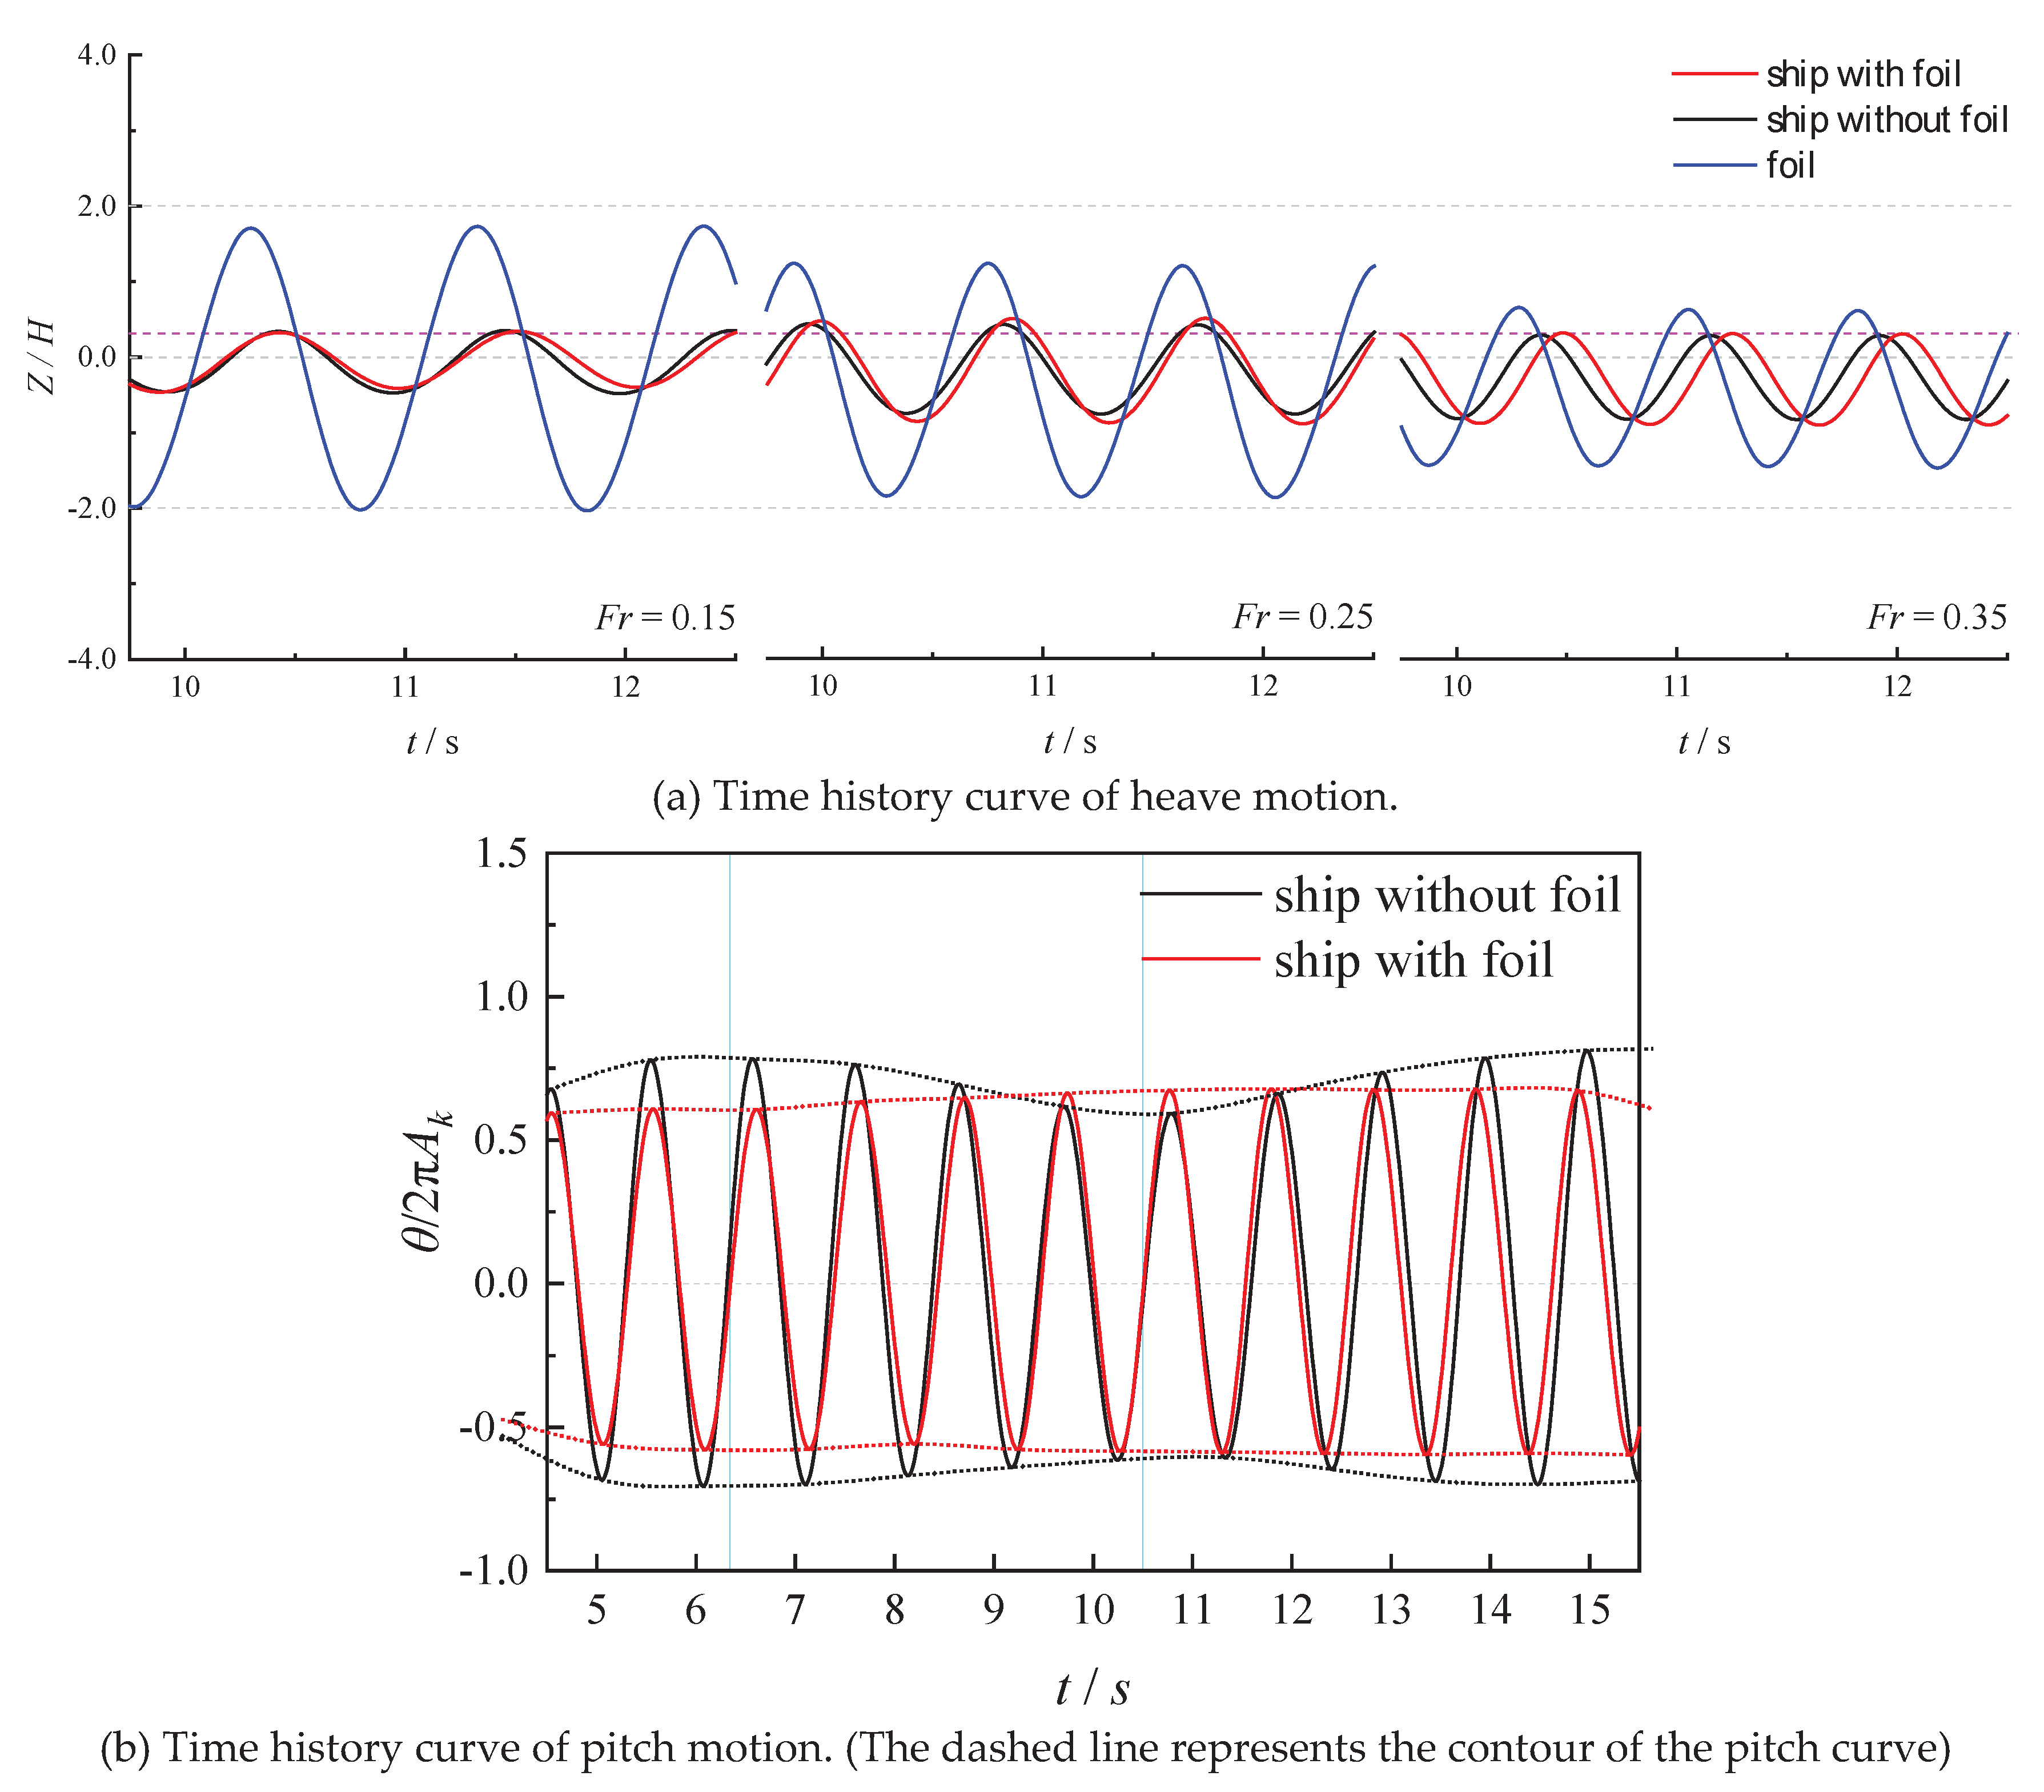
Figure 19.
Comparison of average resistance of three ship models’ hulls and flapping foils at different speeds.
Figure 19.
Comparison of average resistance of three ship models’ hulls and flapping foils at different speeds.
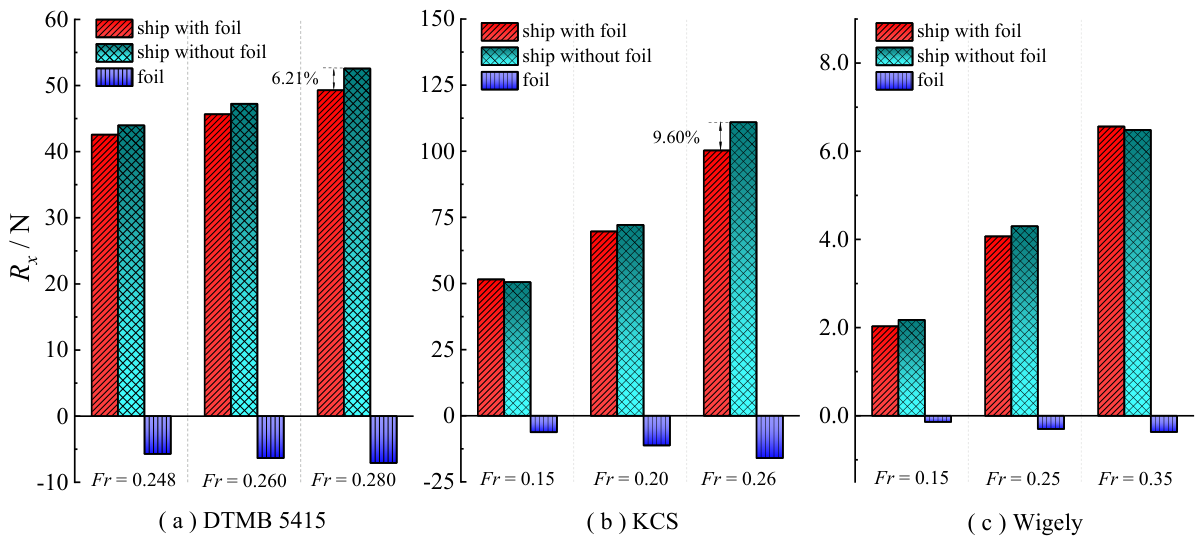
Figure 20.
The time history curves of various parameters of the bow flapping foil system at Fr = 0.28, with k = 40 N ∙ m / rad.
Figure 20.
The time history curves of various parameters of the bow flapping foil system at Fr = 0.28, with k = 40 N ∙ m / rad.
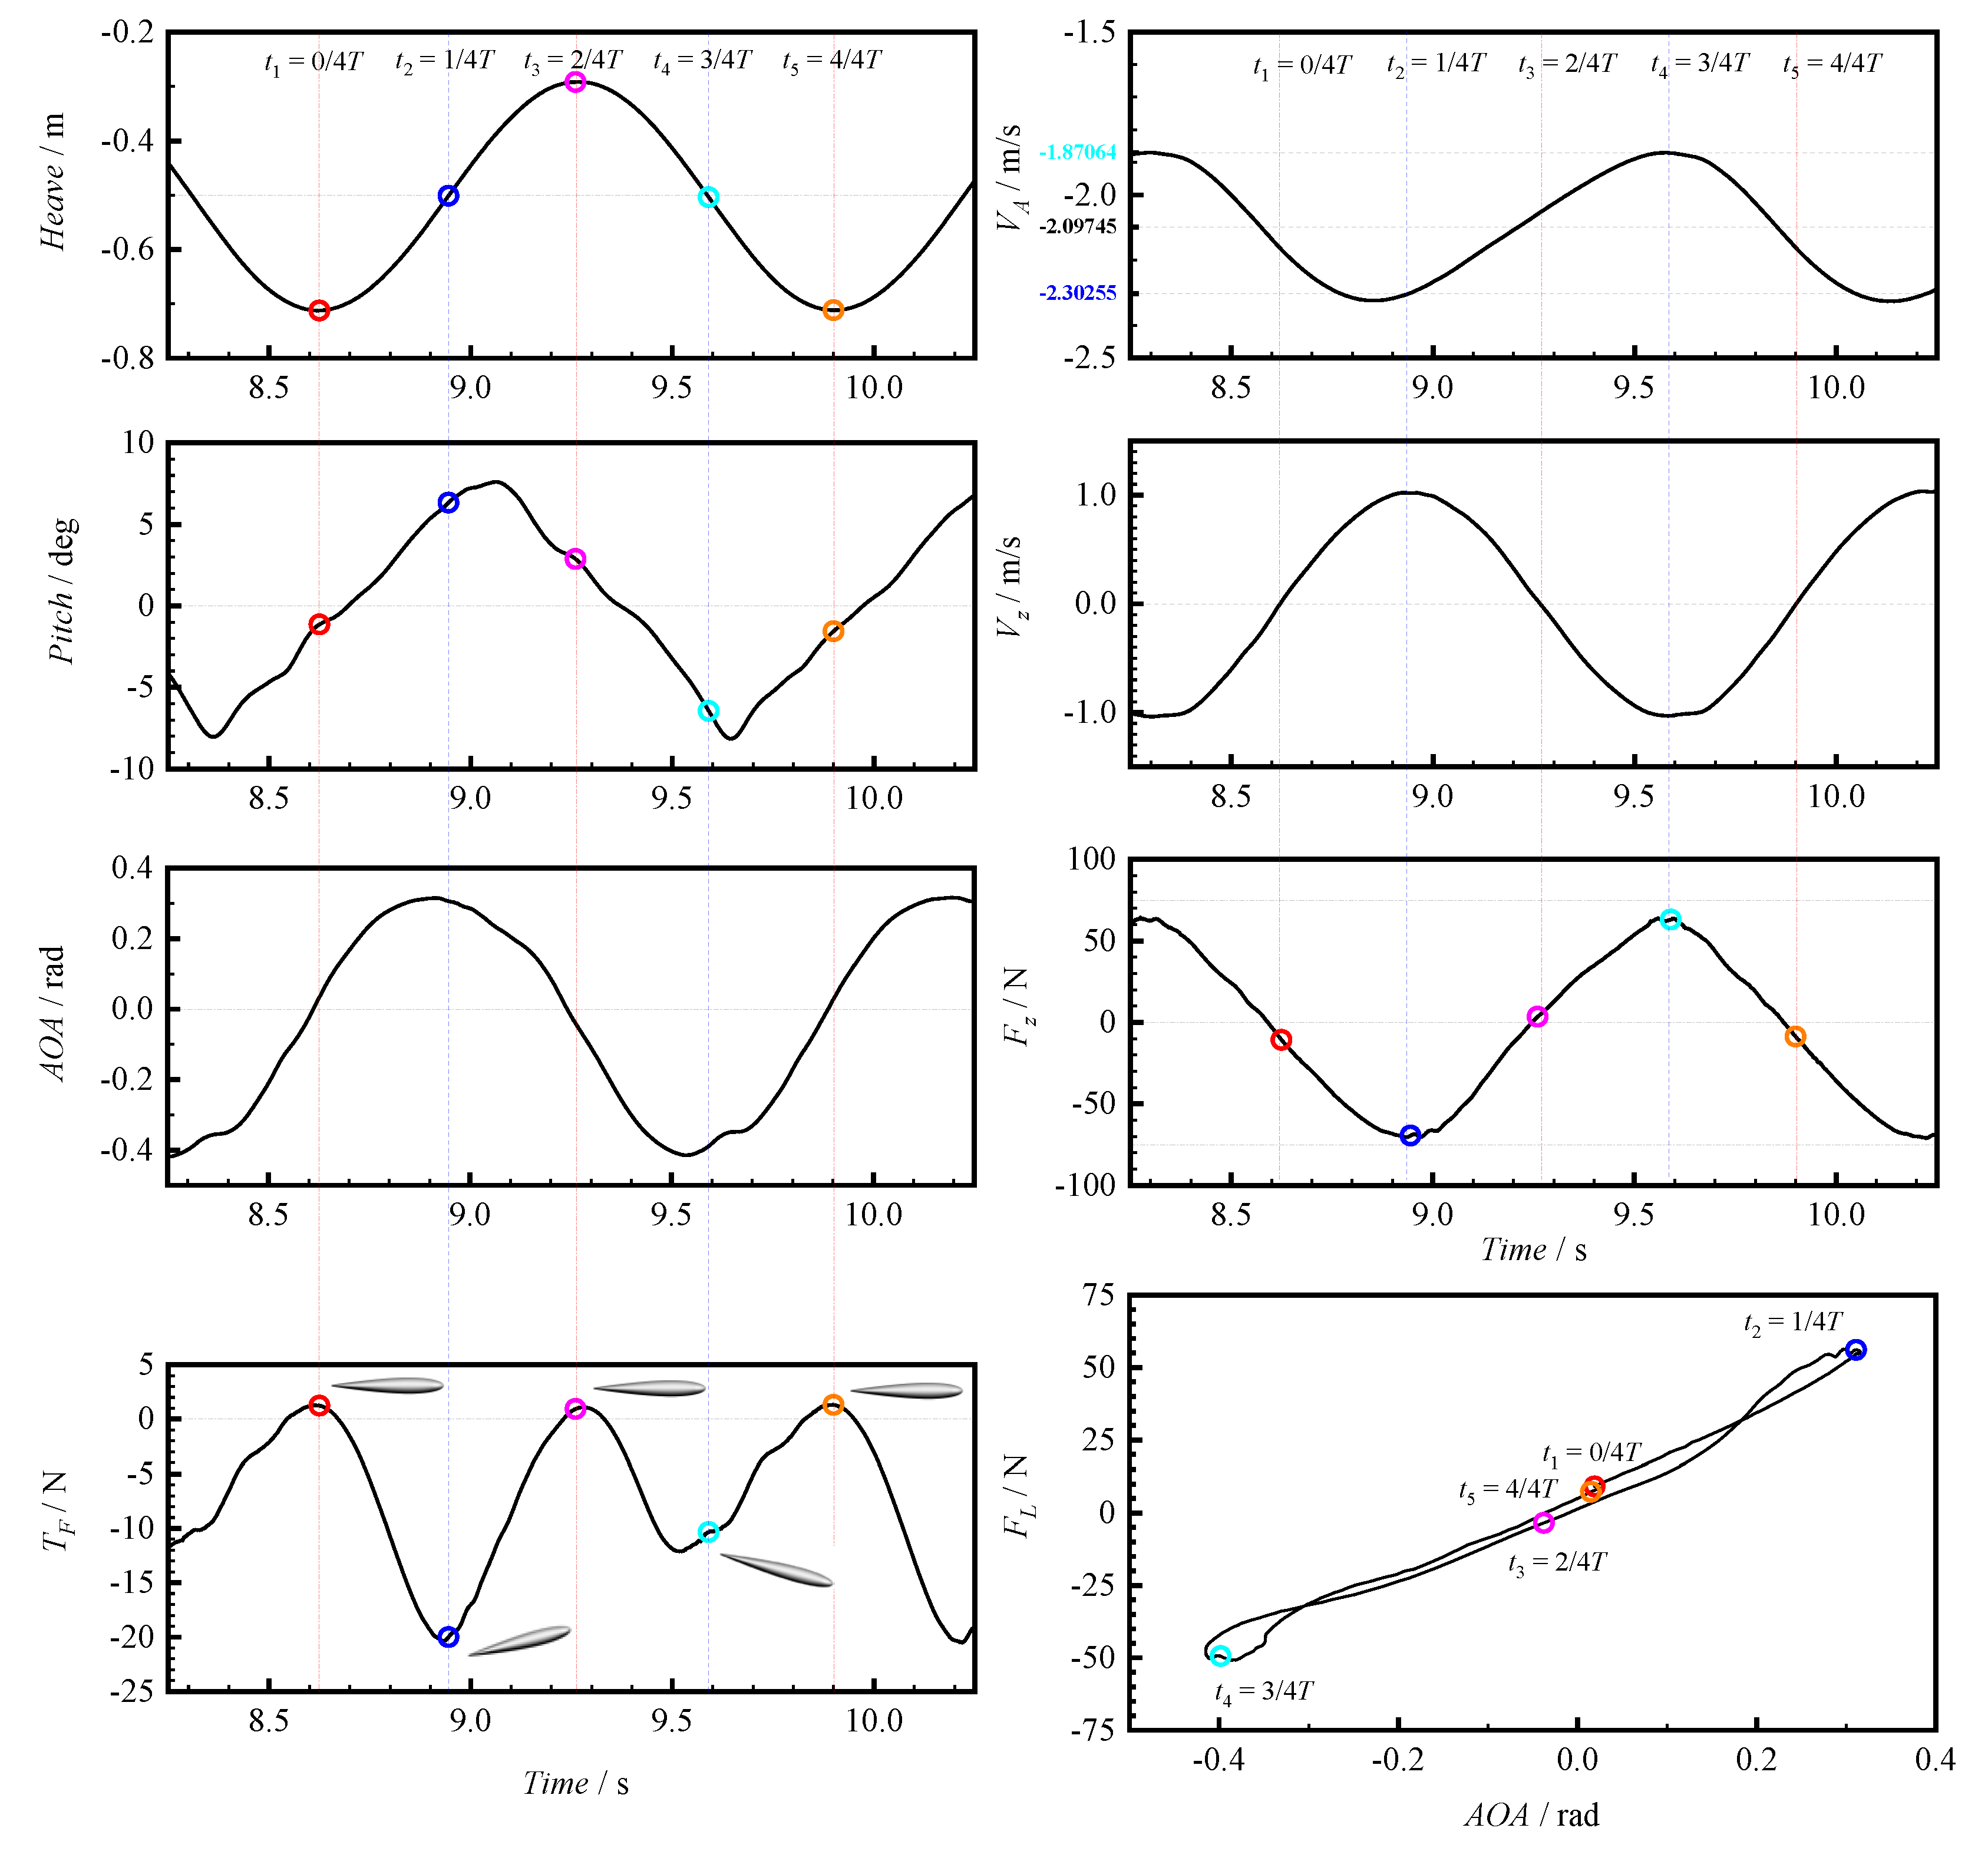
Figure 21.
Speed cloud map of the ship and bow flapping foil in head wave condition (The dashed lines in the bottom left corner of the picture are the enlarged views of the flapping foil).
Figure 21.
Speed cloud map of the ship and bow flapping foil in head wave condition (The dashed lines in the bottom left corner of the picture are the enlarged views of the flapping foil).
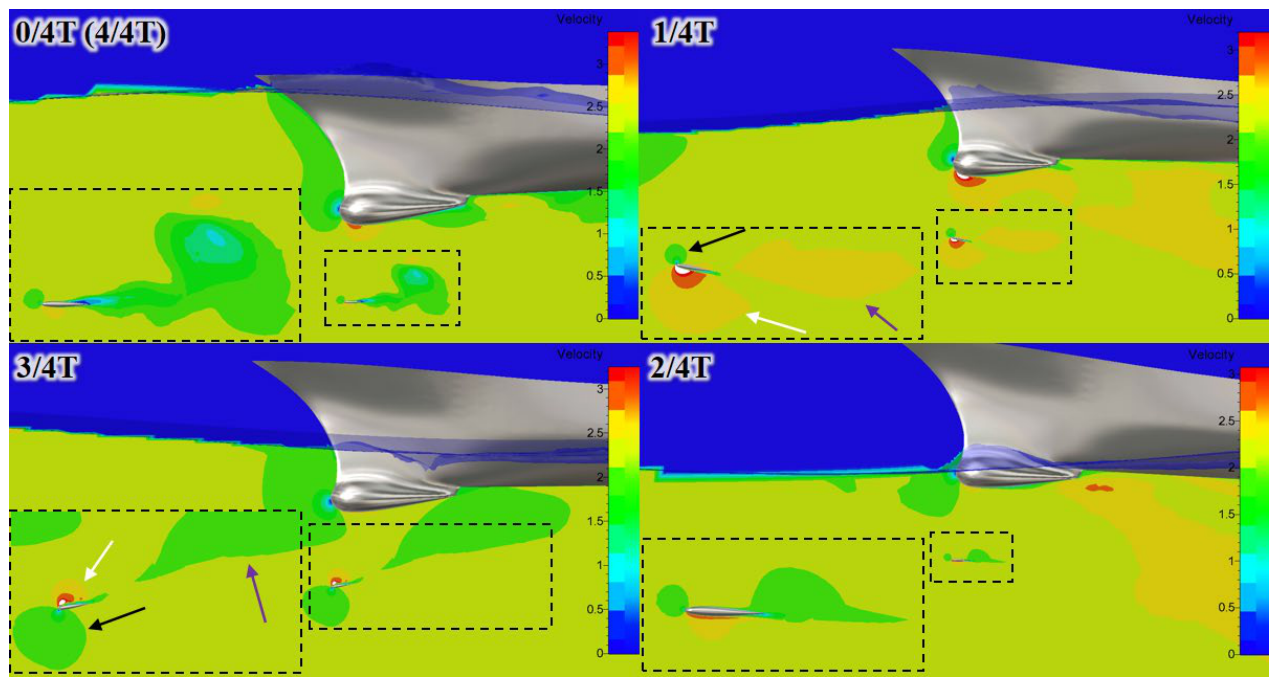
Figure 22.
Resistance reduction and thrust enhancement performance of the flapping foil system at different installation positions.
Figure 22.
Resistance reduction and thrust enhancement performance of the flapping foil system at different installation positions.
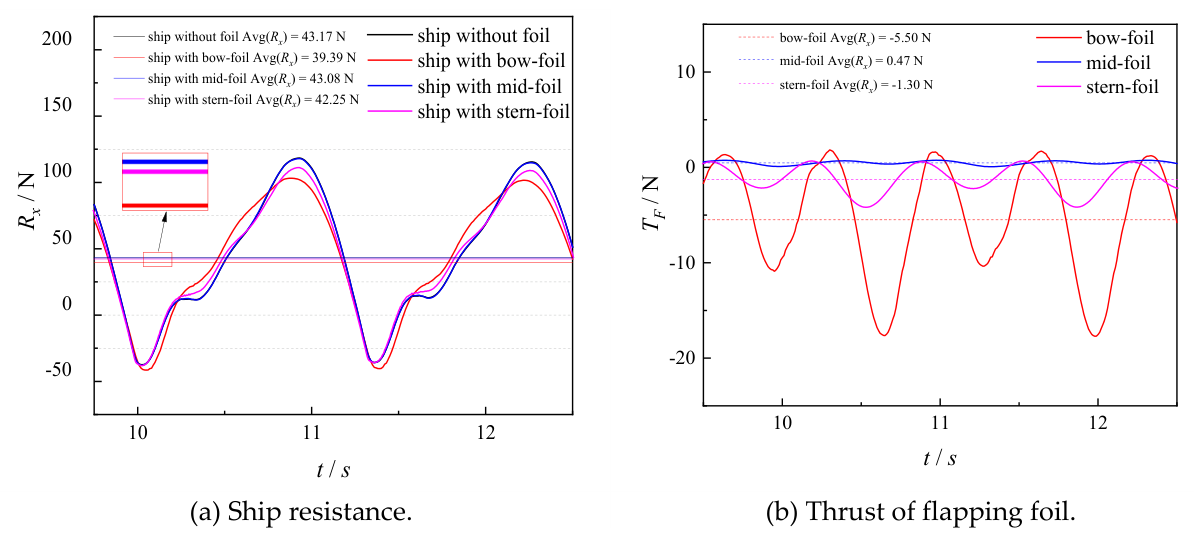
Figure 23.
Heave motion time history of the flapping foils at three positions.
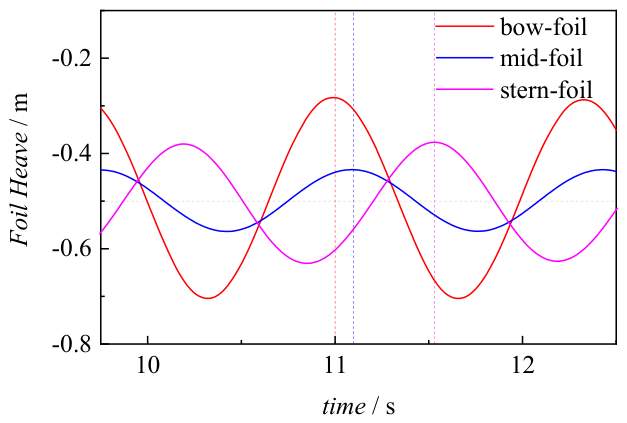
Figure 24.
Thrust TF of bow-flapping foil under different spring stiffness at the condition Fr = 0.20.
Figure 24.
Thrust TF of bow-flapping foil under different spring stiffness at the condition Fr = 0.20.
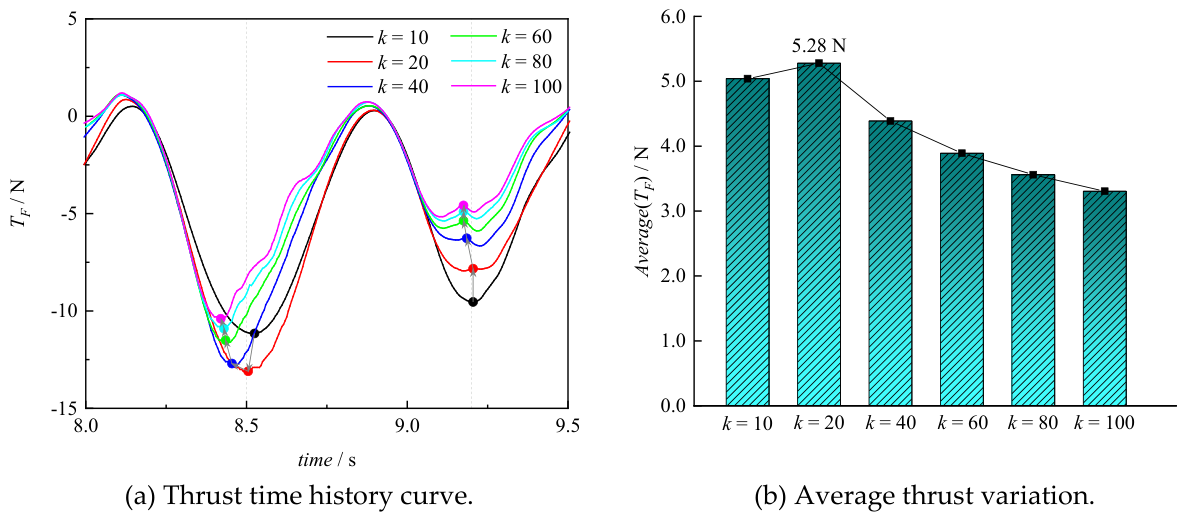
Figure 25.
FL-AOA curve of the bow-flapping foil system under different spring stiffness at the condition Fr = 0.20.
Figure 25.
FL-AOA curve of the bow-flapping foil system under different spring stiffness at the condition Fr = 0.20.
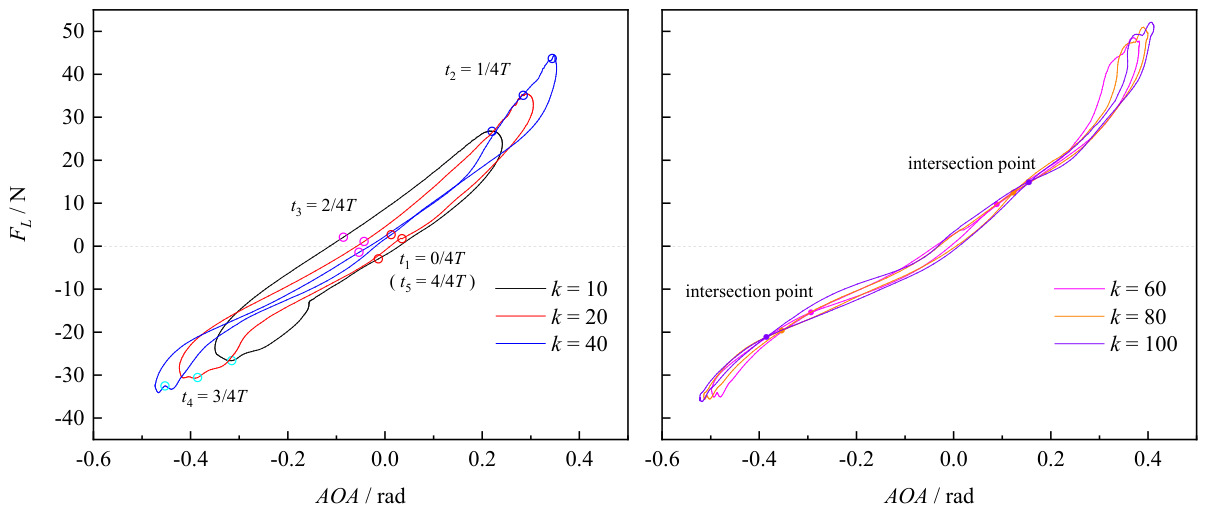
Figure 26.
Total resistance of a ship with a bow foil system under different spring stiffnesses at the condition Fr = 0.20.
Figure 26.
Total resistance of a ship with a bow foil system under different spring stiffnesses at the condition Fr = 0.20.
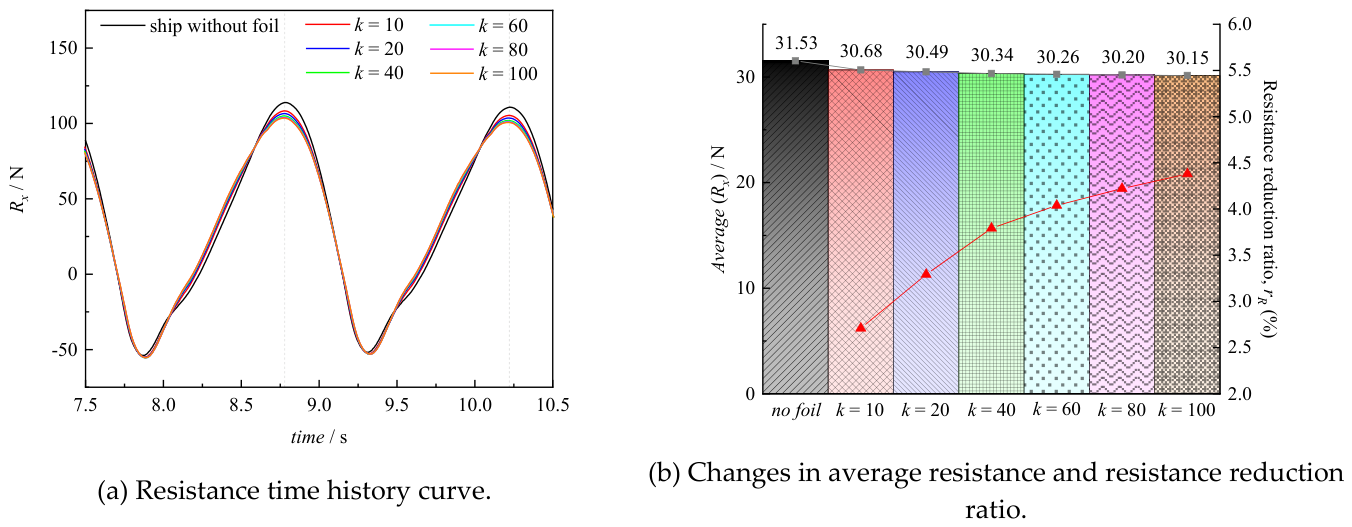
Figure 27.
Pitch angle of ship with bow foil under different spring stiffness at the condition Fr = 0.20.
Figure 27.
Pitch angle of ship with bow foil under different spring stiffness at the condition Fr = 0.20.
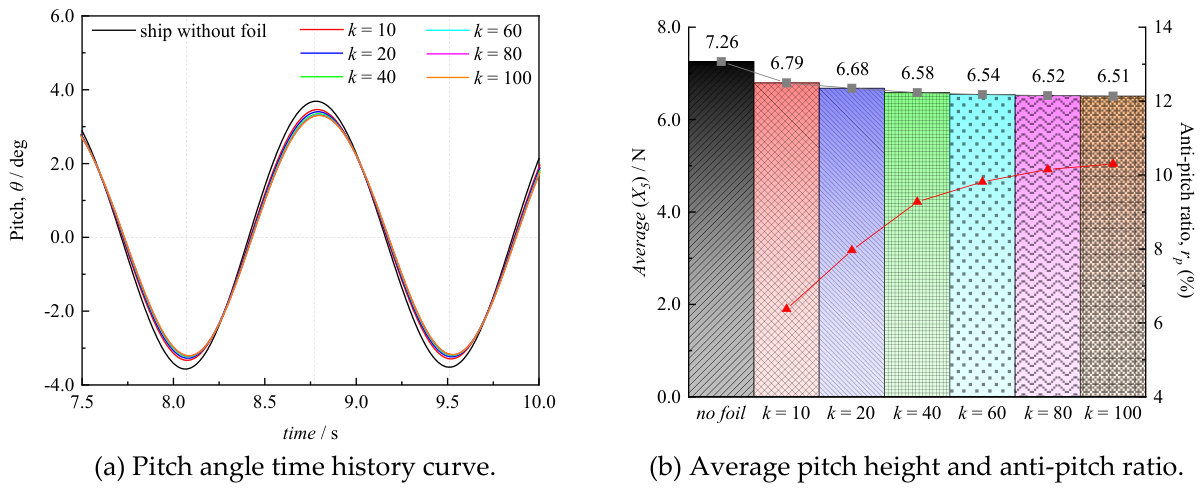
Figure 28.
Damping force Fz variation of the bow foil system with different spring stiffness at the condition Fr = 0.20.
Figure 28.
Damping force Fz variation of the bow foil system with different spring stiffness at the condition Fr = 0.20.
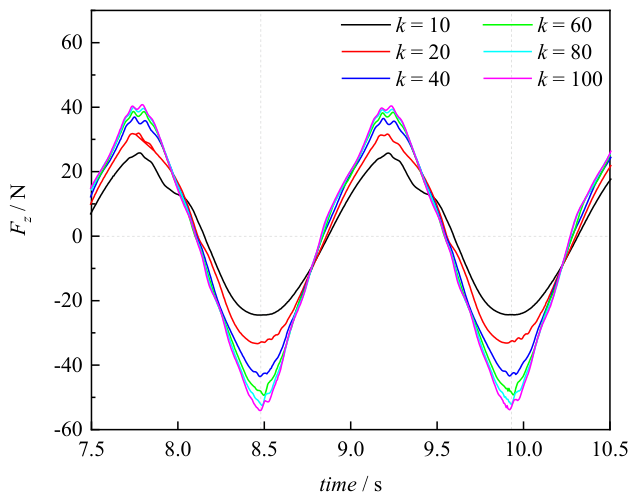
Figure 29.
DTMB 5415 ship hull resistance with different size foils at Fr = 0.28.
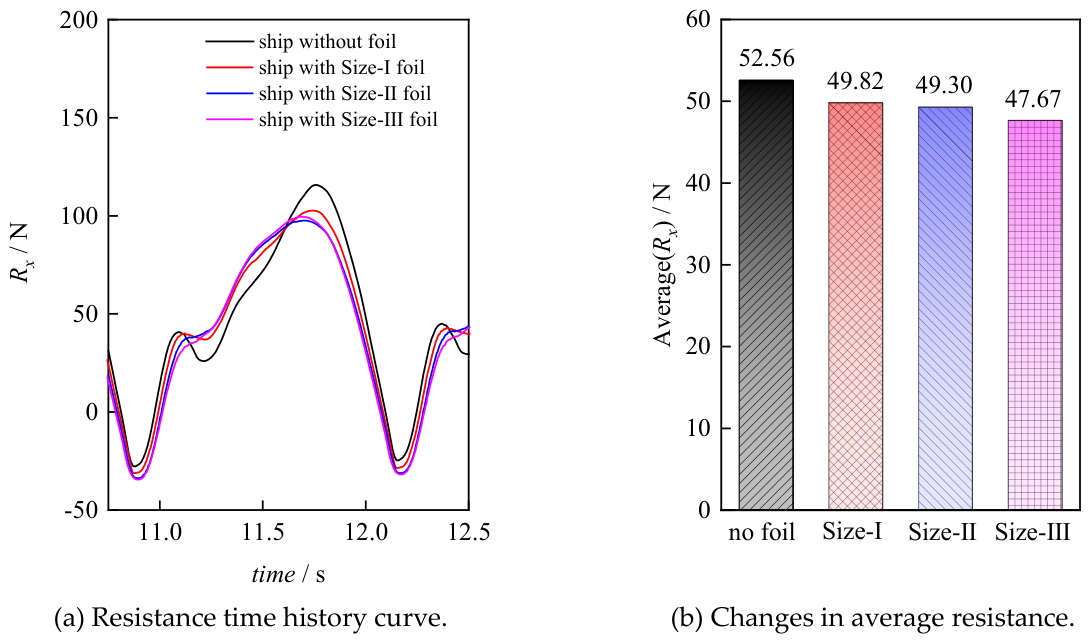
Figure 30.
KCS ship hull resistance with different size foils at Fr = 0.20.
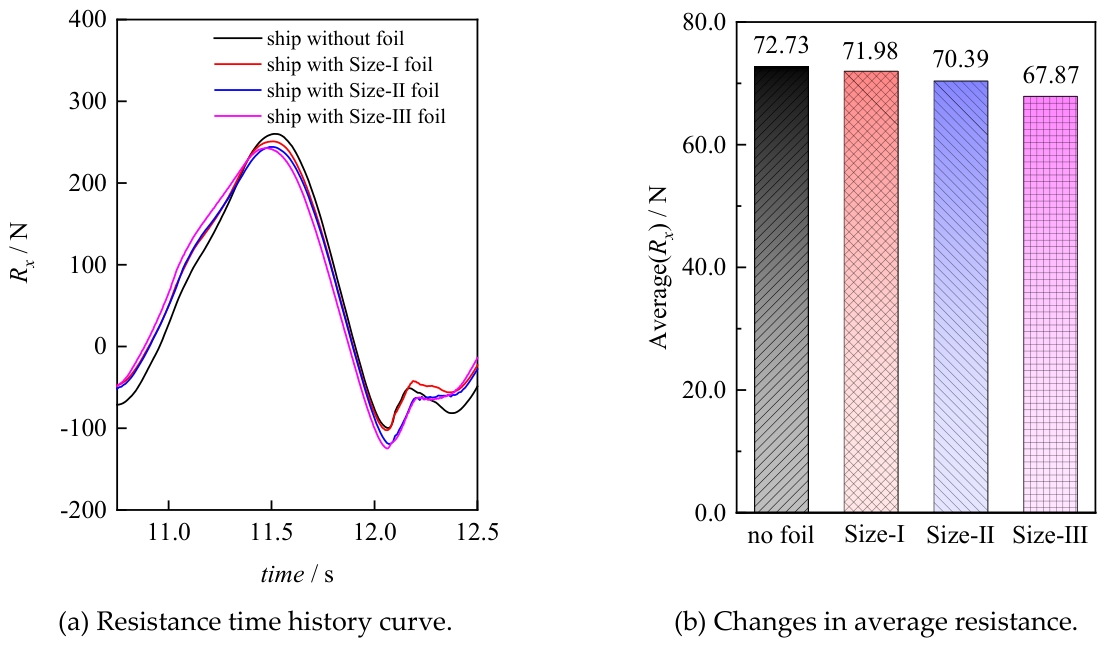
Figure 31.
Wigley ship hull resistance with different size foils at Fr = 0.25.
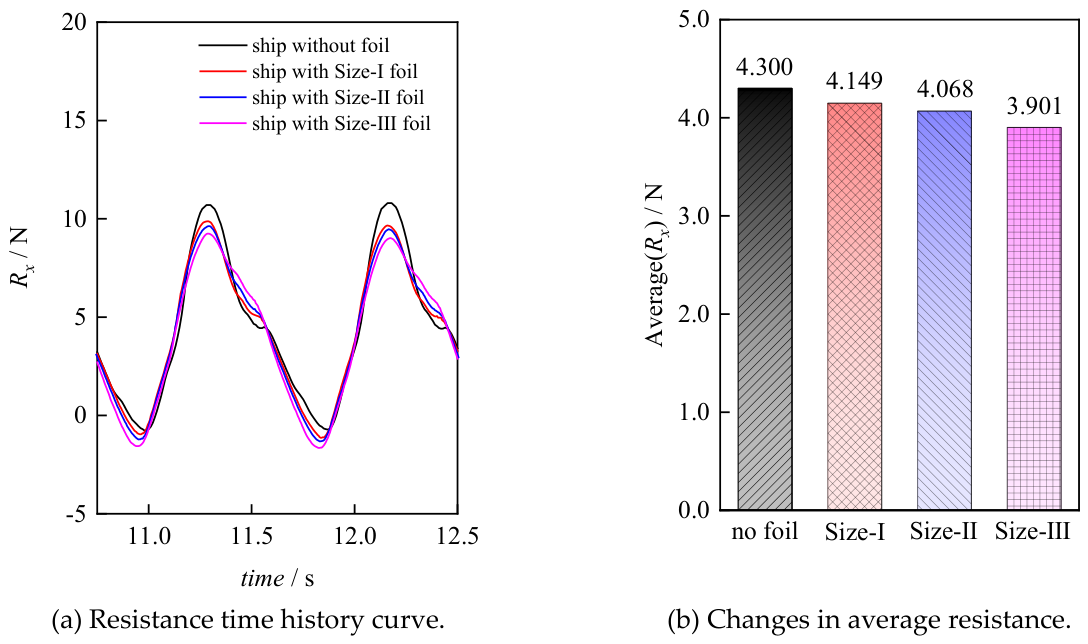
Figure 32.
The thrust generated by bow foil systems of different sizes on three types of ships (The dashed line in the figure represents the average thrust of flapping foils with different sizes).
Figure 32.
The thrust generated by bow foil systems of different sizes on three types of ships (The dashed line in the figure represents the average thrust of flapping foils with different sizes).
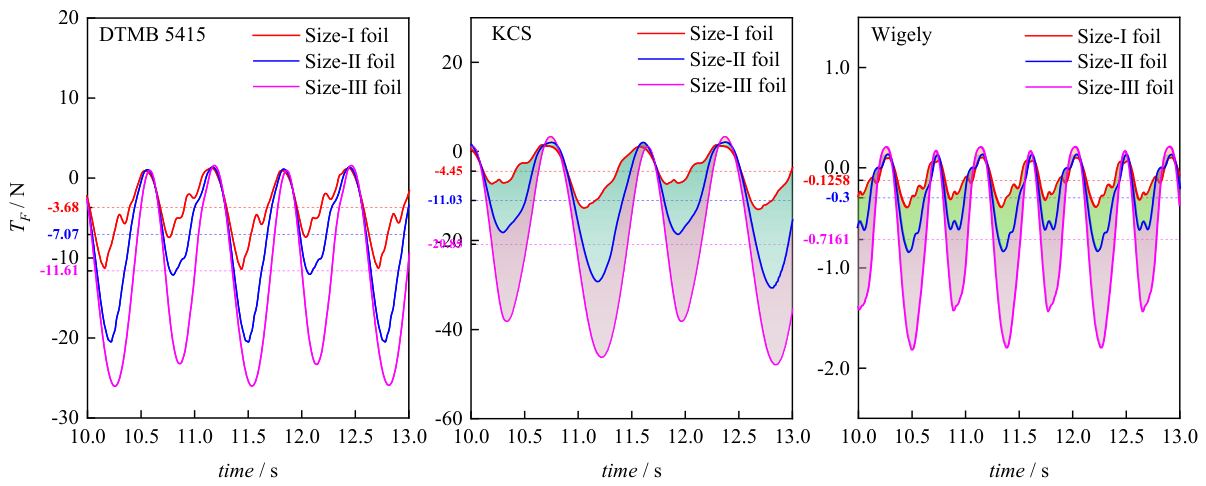
Figure 33.
Schematic diagram of the influence of water particle motion in waves on the effect of a bow-flapping foil with encounter phase ψ = 90°.
Figure 33.
Schematic diagram of the influence of water particle motion in waves on the effect of a bow-flapping foil with encounter phase ψ = 90°.
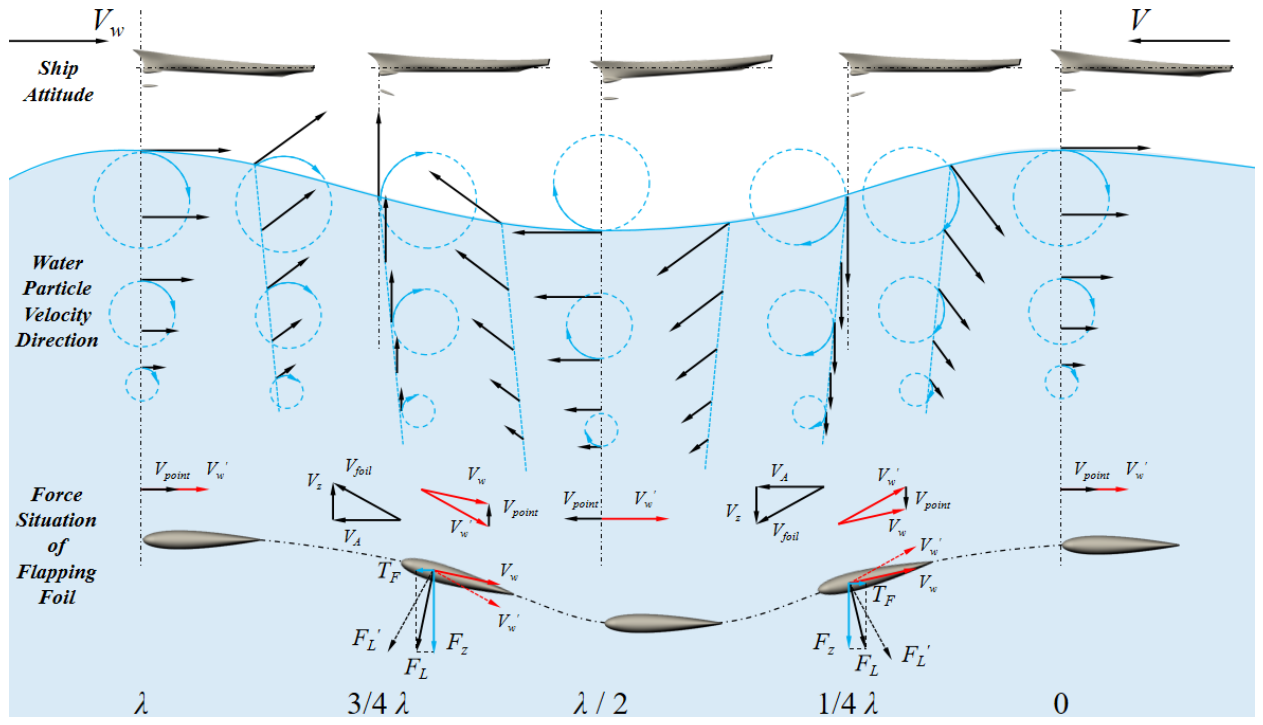
Figure 34.
The attitude of the ship and bow foil system at different times when λ/L = 1.2 and Ak = 0.025.
Figure 34.
The attitude of the ship and bow foil system at different times when λ/L = 1.2 and Ak = 0.025.
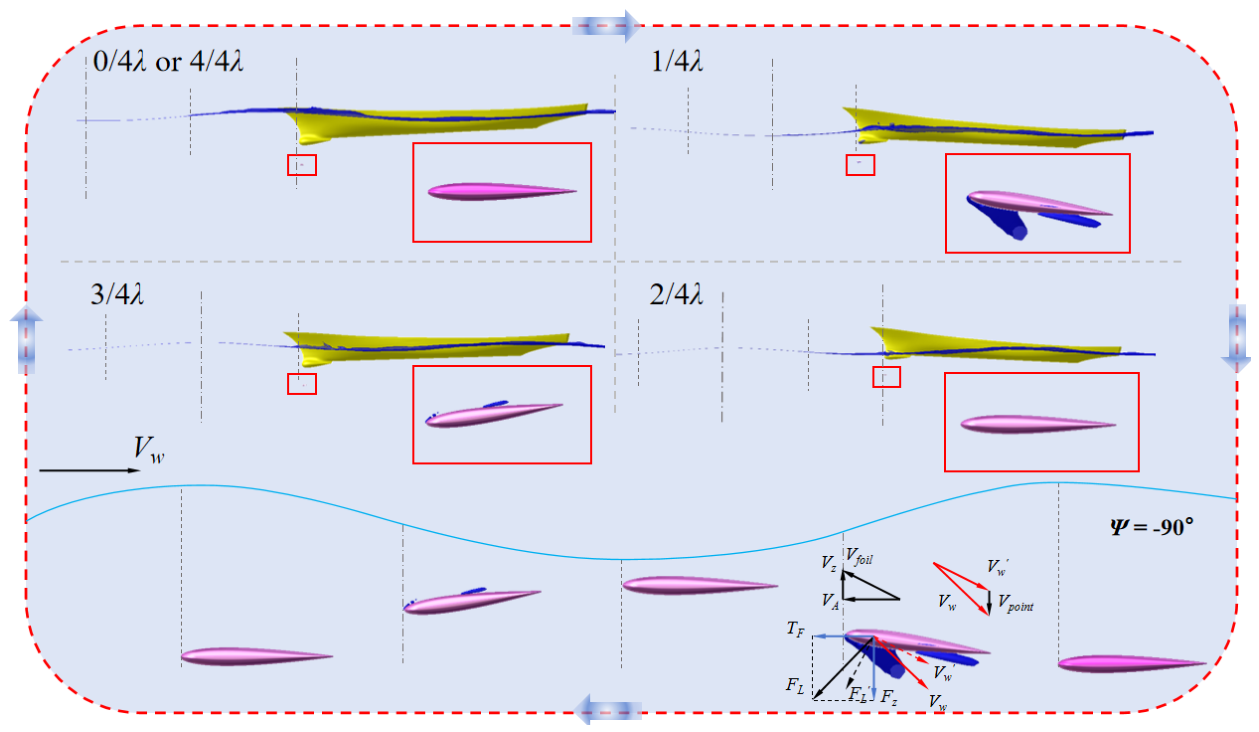
Figure 35.
When λ/L = 1.2 and λ/L = 1.4, the force and motion time history of the hull and flapping foil.
Figure 35.
When λ/L = 1.2 and λ/L = 1.4, the force and motion time history of the hull and flapping foil.
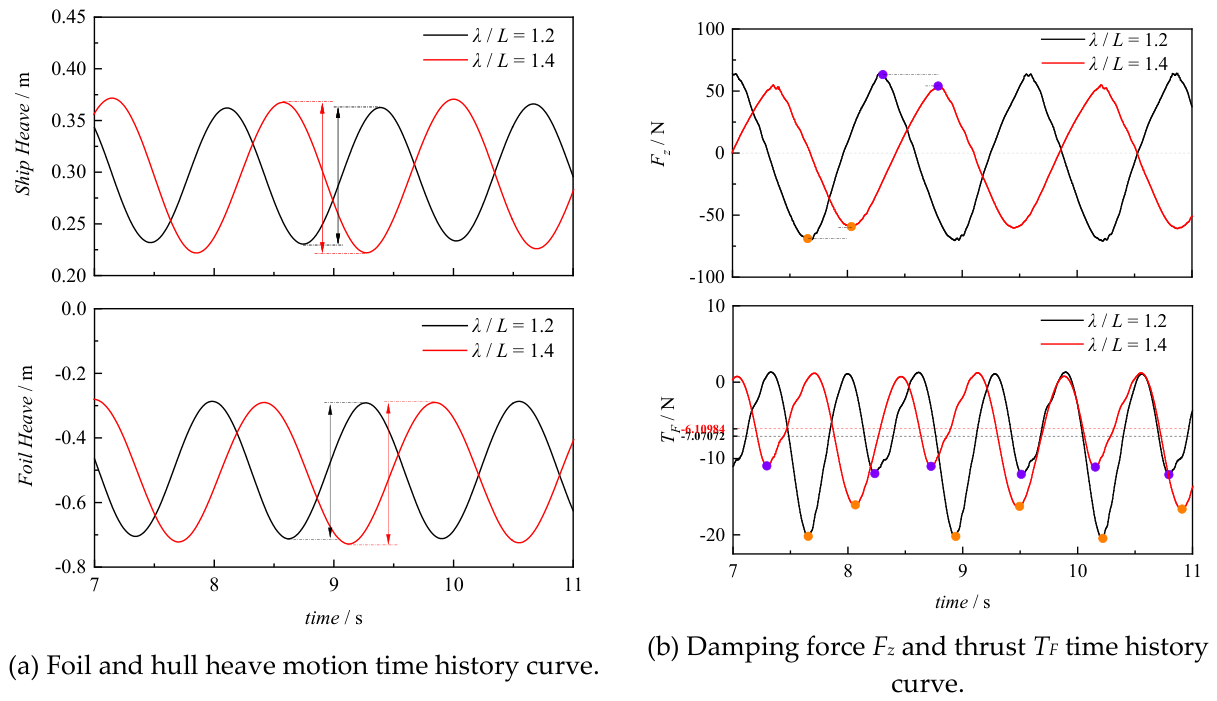
Figure 36.
The heave motion of the flapping foil at different wave positions.
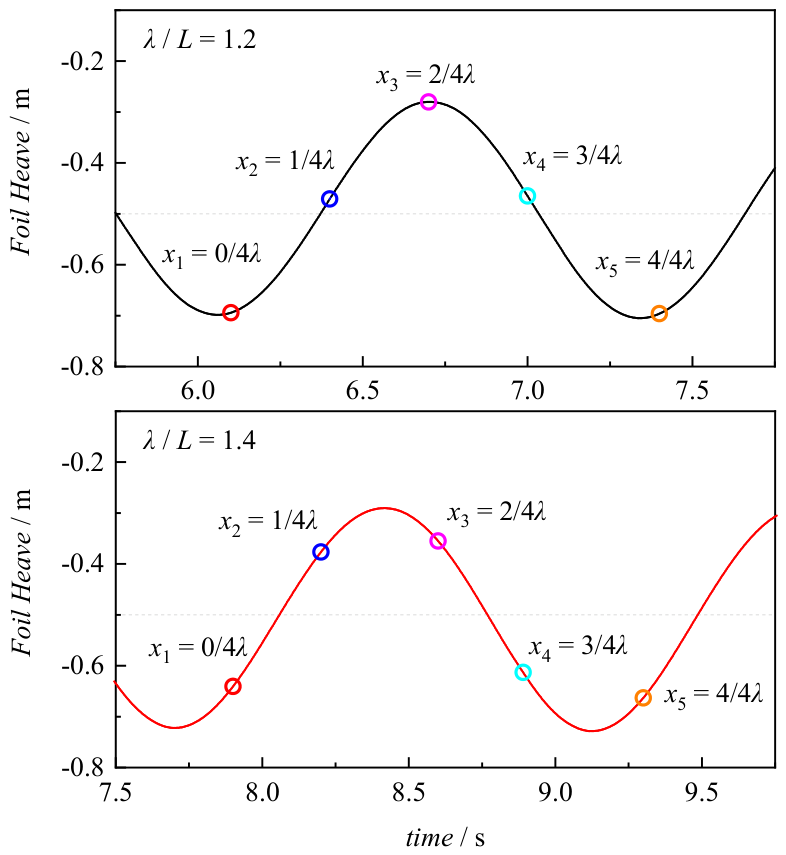

Table 1.
Ships and Models Main Scales.
| Parameter | DTMB 5415 (Scale Ratio 24.82:1) |
KCS (Scale Ratio 31.6:1) |
Wigley |
|||
|---|---|---|---|---|---|---|
| Ship | Model | Ship | Model | - | ||
| Length between Perpendiculars | Lpp ( m ) | 142 | 5.72 | 230 | 7.2786 | 2.5 |
| Moulded Breadth | B ( m ) | 19.06 | 0.768 | 32.2 | 1.0190 | 0.25 |
| Draught | T ( m ) | 6.15 | 0.248 | 10.8 | 0.3418 | 0.15625 |
| Displacement | ∇ ( m3 ) | 8424.4 | 0.5507 | 52 030 | 1.6490 | 0.04514 |
| Wetted Surface | S ( m2 ) | 2972.6 | 4.824 | 9 530 | 9.5437 | 0.9277 |
| Longitudinal Center of Gravity | LCG ( m ) | 70.030 | 2.811 | 111.596 | 3.5315 | 0.0 |
| Vertical Center of Gravity | VCG ( m ) | 7.5478 | 0.303 | 7.28 | 0.2304 | 0.1417 |
| Roll Radius of Gyration ( ratio ) | Ixx / B | 0.37 | 0.37 | 0.40 | 0.40 | 0.34 |
| Pitch Radius of Gyration (ratio) | Iyy / Lpp | 0.25 | 0.25 | 0.25 | 0.25 | 0.25 |
| Yaw Radius of Gyration (ratio) | Izz / Lpp | 0.25 | 0.25 | 0.25 | 0.25 | 0.25 |
Table 2.
Grid division and dimensions of different regions.
| Direction | Hull Surface Region | Flapping Foil Surface Region | Kelvin Wave Region | Parallel Wave Region |
|---|---|---|---|---|
| x | λ / 640 | c / 100 | λ / 160 | λ / 80 |
| y | λ / 640 | c / 40 | λ / 160 | λ / 20 |
| z | λ / 640 | c / 100 | H / 20 | H / 20 |
Table 3.
The selected validation condition of Chen’s experiment.
| Parameter | Numerical number | |
|---|---|---|
| Chord | c (m) | 0.1 |
| Span | h (m) | 0.75 |
| Foil Overall Density | ρ ( g/cm3 ) | 1.32 |
| Advance Speed | VA ( m/s ) | 0.2 |
| Reynolds Number | Re | 20000 |
| Heave Amplitude | y0(m) | 0.1 |
| Strouhal number | Sr | 1.69 |
| Pitch axis | xp | 0.16c |
| Spring Stiffness Coefficient | k′ | 1.69 |
Table 4.
Parameter of sea conditions.
| Model | Lpp (m) | λ (m) | H (m) | f (Hz) | Cw ( m/s ) |
|---|---|---|---|---|---|
| DTMB 5415 | 5.72 | 6.864 | 0.1716 | 0.476931417 | 3.273657249 |
| KCS | 7.2786 | 8.73432 | 0.218358 | 0.422795173 | 3.692828332 |
| Wigley | 2.5 | 3 | 0.075 | 0.721412964 | 2.164238891 |
Table 5.
Parameters of ships and flapping foil.
| Model | H, c (m) | V ( m/s ) | Fr | Fe (Hz) |
k ( N ∙ m / rad ) |
k’ |
|---|---|---|---|---|---|---|
| DTMB 5415 | 0.4, 0.1 | 1.8578 | 0.248 | 0.64062606 | 40 | 909 ~ 962 |
| 1.9476 | 0.26 | 0.74758993 | ||||
| 2.09745 | 0.28 | 0.78250397 | ||||
| KCS | 0.53, 0.13 | 1.2675 | 0.15 | 0.56791236 | 90 | 900 ~ 1269 |
| 1.69 | 0.20 | 0.61628476 | ||||
| 2.197 | 0.26 | 0.67433164 | ||||
| Wigley | 0.13, 0.044 | 0.74286 | 0.15 | 0.96903296 | 4.5 | 768 ~ 1380 |
| 1.23805 | 0.25 | 1.134096210 | ||||
| 1.7333 | 0.35 | 1.299179630 |
Table 6.
Parameters of three types of ships with flapping foils under different sizes.
| Model | Speed (m/s) | Fr | Foil Size (h/B, c/Lpp) |
|---|---|---|---|
| DTMB 5415 | 2.09745 | 0.28 | Size-I (0.40, 0.0134); Size-II (0.52, 0.0175); Size-III (0.70, 0.0235) |
| KCS | 2.197 | 0.20 | |
| Wigley | 1.23805 | 0.25 |
Table 7.
Parameters of three types of ships with flapping foils under different sizes.
| Parameter | Physical Meaning |
|---|---|
| VA | Advance Velocity of the foil (VA = V) |
| Vpoint | Velocity of water particles |
| Vfoil | Velocity of flapping foils’ motion |
| Vw | Inflow velocity of foil considering the effect of water particles |
| FL | Lift of the foil considering the effect of water particles |
| Vw′ | Inflow velocity of foil without considering the effect of water particles (Vw′= -Vfoil) |
| FL′ | Lift of the foil without considering the effect of water particles |
Disclaimer/Publisher’s Note: The statements, opinions and data contained in all publications are solely those of the individual author(s) and contributor(s) and not of MDPI and/or the editor(s). MDPI and/or the editor(s) disclaim responsibility for any injury to people or property resulting from any ideas, methods, instructions or products referred to in the content. |
© 2026 by the authors. Licensee MDPI, Basel, Switzerland. This article is an open access article distributed under the terms and conditions of the Creative Commons Attribution (CC BY) license (http://creativecommons.org/licenses/by/4.0/).
Copyright: This open access article is published under a Creative Commons CC BY 4.0 license, which permit the free download, distribution, and reuse, provided that the author and preprint are cited in any reuse.


