

Submitted:
22 July 2026
Posted:
22 July 2026
You are already at the latest version
Abstract
This study investigates strategies regarding energy management in two selected manufacturing companies that focus on researching the load profile under the capacity market conditions. A case study of selected industrial plants is conducted to determine the adequate power and energy capacity of electrical energy storage systems to reduce load variability. The objective of this study is to manage industrial electricity demand by using energy storage to reduce the capacity fee, determined by the discrepancy between average energy consumption during peak and off-peak hours, and to improve the load profile in industrial facilities. The proposed approach combines high-resolution consumption data analysis with parametric evaluation of storage configurations. The impact of storage implementation is assessed by quantifying changes in peak and off-peak demand levels and the resulting capacity-related charges. The results indicate that properly sized energy storage systems effectively flatten load profiles and reduce capacity costs. The study provides practical insights into the integration of energy storage with industrial energy management and highlights its role in enhancing demand-side flexibility under capacity market mechanisms.
Keywords:
industrial energy management
; load profile
; capacity charge
; electrical energy storage
; capacity market
1. Introduction
Across the world, industries are increasingly rethinking their approach to alternative fuels and efficient electricity management. This shift is driven mainly by energy prices, the need to stabilize load profiles, and the transition toward sustainable industry[1,2,3]. The energy transition in industrial plants is further supported by the development of microgrids based on renewable energy sources, such as photovoltaic systems and wind turbines, combined with energy storage [4,5].
Capacity remuneration mechanisms have been introduced worldwide in response to growing concerns about generation adequacy and security of electricity supply. They are intended to reduce the risk of capacity shortages arising from the retirement of conventional power plants, the increasing share of variable renewable energy sources, and the growing role of demand-side flexibility. In the European Union, these mechanisms take several institutional forms, including centralized capacity markets, capacity obligations, and strategic reserves. They are generally regarded as interventionist instruments, justified when the energy-only market does not ensure an adequate level of supply security. Countries that have implemented capacity-market mechanisms or similar solutions include the United Kingdom, France, Italy, Belgium, Germany, Ireland, Greece, and Poland. The United Kingdom operates one of Europe’s most developed centralized auction-based models. France has adopted a capacity-obligation system based on market participants’ responsibility to secure adequate capacity. Germany and Belgium use strategic reserves activated only under critical system conditions, whereas Italy and Poland have implemented broader auction-based mechanisms covering generation, demand response, and other flexibility resources. Outside Europe, regional capacity markets in the United States also play an important role and provide a useful reference point for European institutional solutions [6,7,8,9,10].
The diversity of models adopted across countries shows that the design of capacity mechanisms depends strongly on the structure of the national power system, the regulatory environment, and broader energy policy objectives.
In Poland, the total electricity bill consists of energy purchase costs, distribution charges, and VAT. Distribution charges are divided into two groups: variable components, which depend on the customer’s electricity consumption, and fixed components, which are independent of consumption. The variable components include the variable network charge, quality charge, renewable energy charge, cogeneration charge, capacity charge, and transitional charge, whereas the fixed components include the subscription fee and the fixed network fee. Some cost components are related to electricity supply itself, while others depend on how electricity is used, the plant’s energy efficiency, and the optimization measures applied to electricity procurement [11].
Figure 1 presents a detailed breakdown of the distribution charge components.
The tariff group is the main determinant of electricity costs. Businesses are not required to use a local supplier and may choose any electricity provider, which gives them an opportunity to negotiate more favorable contract terms [14].
In Poland, the main tariff groups for commercial consumers, determined by voltage level and consumption characteristics, are as follows [11,15,16]:
- Tariff A is intended for customers supplied from the 220/400 kV extra-high voltage (EHV) network;
- Tariff B is applicable to customers who receive electricity from the 110 kV high-voltage (HV) network;
- Tariff C is applicable to customers supplied from both the medium voltage (MV) 15 kV and low voltage (LV) 0.4 kV networks.
Each tariff may have several variants, including a single-zone option with a fixed price throughout the day and night, as well as two-zone or three-zone options with rates that vary by time period (peak, off-peak, and night). Multi-zone tariffs differentiate electricity prices by time of use, allowing companies to reduce costs by scheduling energy-intensive operations during lower-price periods. Firms whose consumption is concentrated during peak hours and that have limited flexibility to shift loads may benefit more from a single-zone tariff with a constant rate. By contrast, companies with a large share of off-peak consumption can often lower total costs by choosing a multi-zone tariff, provided that their actual load profile matches the more favorable tariff periods offered by a given operator or supplier. Dynamic tariffs, combined with investments in energy storage and renewable energy sources such as photovoltaic systems or wind turbines, can further reduce electricity costs and increase energy autonomy. The selection of the billing tariff exerts a substantial influence on costs. If it does not align with the established load profile, this discrepancy can result in unwarranted increases in expenditure. The choice necessitates an analysis of the hourly and weekly consumption profile (the share of consumption in individual time zones). In addition, planned investments in energy storage and on-site energy generation methods should be considered. This enables the shifting of consumption from high-rate hours or its replacement by self-consumption [11,15,16,17,18,19,20,21,22,23,24,25].
Factor affecting a company’s electricity costs is contracted power. When connecting to the Distribution System Operator’s network, the customer selects not only the tariff group but also the level of contracted power. If the contracted power is set too high, the company bears the cost of unused capacity; if it is exceeded, penalties may apply [11].
Another distribution-cost component that consumers can influence is the capacity charge. In Poland, this charge was added to electricity bills in January 2021 as part of the distributor-collected fees. It stems directly from the Capacity Market Act [26] of 2017, which created a framework for compensating capacity providers for ensuring grid reliability. The main purpose of this mechanism is to maintain the stability and security of electricity supply and reduce the risk of blackouts. The capacity charge reflects payments to providers contracted through capacity auctions. Its value is calculated by the President of the Energy Regulatory Office (ERO) under the Capacity Market Act [26] and the Regulation of the Minister of Climate and Environment [27], and is published by the end of September each year [11,26,28,29,30,31,32,33,34,35,36,37,38].
The capacity charge differs from other components of a business electricity bill for two main reasons [12]:
- First, it can represent a significant share of a company’s operating costs. Its level depends on the amount of electricity drawn from the grid during peak hours, that is, when the plant is operating most intensively;
- Second, unlike many other charges, it can be reduced through active energy management. Companies can lower the capacity charge by shifting energy-intensive processes to off-peak periods, optimizing production schedules, or using energy storage.
The method used to calculate the capacity charge depends on the type of consumer. Under the current legal framework, two settlement models apply: a monthly flat rate based on annual consumption and a charge based on electricity consumed during specified hours of the day. The flat-rate model applies mainly to households and certain small consumers with contracted power up to 16 kW. For other consumers, the fee depends on electricity drawn from the grid on working days during the designated time window (7:00 a.m. to 9:59 p.m.) and on the shape of the daily load profile. The regulations distinguish four categories of consumption stability and assign each a coefficient that adjusts the base rate. Lower coefficients apply to flatter profiles, while higher coefficients apply to less stable ones. In practice, a more stable profile and a shift in consumption outside the designated hours lead to a lower capacity charge [26,34,39].
From January 1, 2028, Poland will phase out flat-rate settlements and apply the capacity charge to all consumers, including households, based on their consumption profiles. As a result, effective energy management will become increasingly important not only in industry but also in the municipal sector as a means of reducing both capacity and overall electricity charges [34].
These cost factors are among those that consumers can influence directly. They therefore highlight the importance of proactive energy cost management through appropriate tariff selection, supplier negotiations, and load-profile optimization.
The electricity consumption profile of an industrial plant depends on both technical and organizational factors, including the nature of the production process, the type and rated power of installed equipment, the time of day and year, weather conditions, the degree of automation, the number of working days per week, and the number of shifts. Accordingly, single-shift, two-shift, and three-shift plants exhibit different electricity consumption profiles [40,41,42].
Recent studies have proposed a range of decision-making frameworks that can be viewed as implicit or hybrid game-theoretic approaches to energy trading and management. For example, research on aggregation models and market mechanisms for virtual power plants (VPPs) participating in inertia and primary frequency response represents interactions among market participants through a centrally solved optimization problem that minimizes total system cost. In such models, the behavior of individual distributed energy resources is shaped indirectly by price signals and security constraints, creating a game-like structure coordinated by a VPP aggregator [59].
A different line of research is based on reinforcement learning, where the decision process is formulated as a sequential problem with feedback between planning and operation. This approach is illustrated by an operating-profit-oriented medium-term planning method for renewable-integrated cascaded hydropower systems, in which planning policies are trained directly on short-term operational profits without explicitly modelling market equilibrium among participants [60].
Another perspective is provided by robust and safe reinforcement-learning methods developed for hybrid electric–hydrogen energy systems. In these approaches, operational decisions are formulated within a generalized Markov decision process that accounts for risk, nonlinearity, and the dynamic efficiency of system components, while the interaction between the control agent and an uncertain environment can be interpreted as a safety-constrained decision game [61].
Against this background, the present study examines the decision problem faced by an energy market participant operating under real load profiles and system charge mechanisms, where the temporal structure of demand and the technical capabilities of energy storage are central. This perspective retains the economic interpretability of market-based models while enabling analysis of decision-making under uncertainty and temporal variability, without introducing fully developed multi-level game-theoretic formulations.
Peak loads, defined as periods of maximum power demand, increase electricity costs for businesses both directly and indirectly. Under multi-zone tariffs, where electricity prices are higher during peak hours than during off-peak hours, reducing consumption during those periods can lower energy costs. Contracted-power costs may also rise because they are linked to the highest power demand in a given period. High peaks can therefore force companies to contract more power and can also increase the capacity charge. Effective load-profile management can thus significantly reduce total electricity costs.
The objective of this study is to assess the use of energy storage for managing industrial electricity demand, reducing the capacity fee associated with differences between average electricity consumption during peak and off-peak hours, and improving the load profile od industrial facilities.
2. The Legal Foundation and Regulatory Framework Governing the Capacity Market
2.1. Power Market Objectives and Assumptions
In Poland, the capacity market's operational framework is delineated by the Capacity Market Act of December 8, 2017, on the capacity market (Journal of Laws 2018, item 9) [26] and the Capacity Market Rules [43]. The capacity market is a mechanism designed to ensure medium- and long-term security of electricity supply. It provides a service of readiness to supply capacity to the power system. The capacity fee, established under the provisions of this Act, is allocated for the financial support of the capacity market's operational expenses. The financial resources in question are allocated to two primary objectives: the maintenance and modernization of power generation units and the support of investments in new capacity. The capacity market is designed to ensure an appropriate balance between the electricity demand of consumers and its production by generators. According to [44], the capacity market is designed to guarantee the following: the stable operation of existing generation sources and encourage their modernization, ensure the safe development of renewable energy sources without negatively affecting the continuity of electricity supply to end users, contribute to the development of energy storage facilities and demand-side response (DSR) services, and increase investment in new power plants.
Capacity markets are operational in numerous European countries and other regions worldwide, representing a significant component of the energy market. The solutions employed in European Union (EU) countries vary considerably in numerous ways, including the mechanisms utilized, the level of energy costs, the origins of their creation, and so forth [33,45,46,47,48].
The regulatory framework governing the utilization of power mechanisms within the European Union is delineated in Regulation (EU) 2019/943 of the European Parliament and of the Council of June 5, 2019, which pertains to the internal market for electricity. It delineates the overarching principles that must be considered during the design of capacity mechanisms and electricity market support systems [48,49].
In accordance with Article 70a (4) [26], the transmission system operator is authorized to implement measures aimed at stabilizing the active power profile. These measures may include the utilization of energy storage facilities and other devices that contribute to grid stability. This provision facilitates the implementation of technical and organizational solutions that enhance system flexibility and assist in balancing active power, particularly in the context of the expanding share of renewable and distributed energy sources. It is imperative to stabilize the active power profile for the security of the National Power System, particularly in circumstances involving dynamic shifts in generation or abrupt surges in demand. Power market mechanisms and operator actions—including energy storage management and DSR activation—have been demonstrated to facilitate the maintenance of a balance between active energy production and consumption. This, in turn, has been shown to minimize the risk of network overload and improve the quality of energy supply [50].
Consequently, end users have the capacity to proactively contribute to the stabilization of the active power profile through DSR mechanisms. It is possible for companies to formally announce their intention to curtail electricity usage during periods when the power grid is anticipated to experience a supply deficit. This reduction in electricity demand has the effect of reducing the load on the system without necessitating a complete cessation of production. Consumers have the option of using their own energy sources, energy storage facilities, or shifting energy-intensive processes to other hours [18,51,52].
The utilization of capacity market mechanisms has been demonstrated to result in the enhancement of energy consumption, achieved through the alignment of consumption patterns. Appropriate production planning contributes to system stability and reduces capacity charges. These measures have been demonstrated to yield financial benefits for plants and to support the country's energy security [53,54].
Furthermore, companies may elect to collaborate with aggregators, who compile offers from multiple consumers and oversee their engagement in DSR programs. Aggregation is defined as a function performed by a natural or legal person who combines multiple consumer loads or generated electricity for the purpose of selling, purchasing, or auctioning on the electricity market. Power and energy aggregation facilitates the effective management of distributed resources (sources, storage facilities, consumers), thereby enhancing system balancing. Achieving substantial benefits necessitates the integration of diverse technological modalities, complemented by proactive management of consumer and producer flexibility. These solutions are particularly advantageous for companies that do not wish to participate in capacity auctions independently. The Act [26] stipulates that a capacity market unit may comprise multiple physical units, thereby facilitating capacity aggregation by a third party (the aggregator). Aggregators function as intermediaries, submitting consumer portfolios to the capacity market. This includes smaller companies that would not be able to meet the minimum participation thresholds on their own [55,56,57,58].
2.2. End-User Groups
The capacity charge for end users is determined depending on the type of user [26]:
1) Consumers are billed according to a flat-rate system.
The basis for distinguishing between these consumers is their annual electricity consumption. The fee rate is a monthly rate, depending on annual electricity consumption, payable per electricity consumption point. The qualification for the appropriate rate is determined by the quantity of electricity consumed by the customer during a one-year period, as indicated by the date of the final meter reading. In instances where the period is of a shorter duration, the determination of qualification is contingent upon the aggregate quantity of energy consumed until the date of the most recent meter reading.
2) Recipients who have not been selected for a lump-sum payment.
The capacity charge is determined as a rate applied to the volume of electricity consumed from the grid or supplied via a direct line during selected hours of the day. The population under study is divided into four groups, designated K1 through K4. The criterion for this division is the difference between the average electricity consumption during peak demand hours in the system—specifically, selected hours of the day—and the average electricity consumption during non-peak hours on working days from Monday to Friday, excluding public holidays. The discrepancy is calculated according to formula (1) during the qualification period, which extends from 0:00 to 23:59. In 2022, daily data was aggregated monthly. In 2023-2024, it was aggregated on a ten-day basis, i.e., 10 calendar days. Beginning on January 1, 2025, the method of calculating the capacity charge will undergo a change. Instead of the current method, a daily qualification period will be implemented.
where:
Δs – difference between average electricity consumption during peak hours in the qualification period and average electricity consumption during off-peak hours;
n – the hour falling within peak hours during the qualification period;
N – the number of hours falling within peak hours during the qualification period;
m – the hour falling outside peak hours on working days from Monday to Friday, excluding public holidays, during the qualification period;
M – number of hours falling outside peak hours, on working days from Monday to Friday, excluding public holidays, during the qualification period;
– the volume of electricity consumed from the grid or supplied by a direct line and consumed by the end user at hour n, expressed in MWh, accurate to three decimal places;
– the volume of electricity consumed by the end user at hour m, expressed in MWh, accurate to three decimal places, drawn from the grid or supplied via a direct line.
The subsequent groups are distinguished depending on the magnitude of the difference Δs [26]:
- The end recipient K1 is defined as the entity to which the difference is less than 5%.
- The final recipient, designated as K2, is characterized by a discrepancy that falls within the range of 5% to 10% of the total.
- The final recipient, designated as K3, is characterized by a discrepancy that falls within the range of 10% to 15% less than the reference value.
- The final recipient, designated as K4, is characterized by a discrepancy that exceeds 15% of the initial value.
The customer groups, distinguished according to the size of the difference (1), are listed in Table 1. The amount of the capacity charge is determined by coefficient A, which is a percentage of the base capacity charge rate set on an annual basis by the President of the Energy Regulatory Office (ERO). The capacity charge is determined by calculating the relevant percentage of the base rate, which is multiplied by consumption within a specified qualification period. The number of individual groups influences the calculation of the capacity charge. For K4, this is the full rate; for K3, it is 83%; for K2, it is 50%; and for K1, it is 17%.
The end users are divided into groups, designated K1-K4, for each metering point of a given end user or place of measurement. The amount of electricity for which the capacity charge is calculated is determined at the time of measurement.
3. Research Method
This chapter outlines the stages of the analysis of two industrial plants with different operating characteristics. Plant IP_A operates continuously, whereas plant IP_B follows a two-shift schedule. This comparison makes it possible to examine the problem in two distinct industrial settings. IP_A represents a stable operating profile, with power demand concentrated around the mean value typical of the chemical industry. By contrast, IP_B shows greater variability, with predominantly low power levels and irregular fluctuations resulting from the nature of its load and operating mode, which is typical of the metal industry. Tariff groups were determined based on the applicable legal regulations [26] and the analysis assessed the potential to reduce the capacity charge through the use of energy storage. The entire procedure was carried out in Python using Jupyter Notebook, which enabled flexible data handling and dynamic visualization of the results. The analysis relied on the panda’s library for tabular data processing, numpy for numerical calculations, and matplotlib—particularly the pyplot and patches modules—for generating advanced plots and visualizations. The procedure can also be replicated for other input datasets.
3.1. Source Data and Profile Characteristics
The analysis was based on detailed measurement data from two industrial plants with different operating profiles. Plant IP_A operates continuously, 24 hours a day, 7 days a week, and therefore requires a stable power supply regardless of the day or season. Plant IP_B operates on a two-shift schedule, resulting in regular production breaks at night, on weekends, and on public holidays.
The source data utilized in the study comprises time series of active power measurements, recorded at high resolution in 15-minute intervals throughout 2018. This results in a dataset comprising 35,040 records for each plant, thereby providing a substantial foundation for analysis at both the daily and weekly levels. Moreover, this approach facilitates the observation of both seasonal and annual variations. The material used in the setup allows for a precise representation of the plants' operating rhythms and the identification of peak power consumption periods.
Figure 2 illustrates the heatmap of active power changes at plant IP_A, while Figure 3 presents the heatmap of active power changes at plant IP_B over the course of a year. A comparison of the profiles of the two plants reveals significant disparities, manifesting in divergent patterns of energy consumption throughout both the diurnal and annual cycles. As indicated by the data, plant IP_A demonstrates a more uniform energy consumption profile.
Conversely, plant IP_B exhibits greater variability in power consumption. The profiles delineated in this manner exert a substantial influence on the magnitude of the power charge and the viability of implementing solutions to curtail energy expenditures in both corporate entities.
A thorough examination of the data presented in the charts reveals a stable power profile for the IP_A plant, which mirrors the continuous operation of the technological installations. In contrast, the IP_B profile is marked by substantial power reductions on Saturdays, Sundays, holidays, and during nocturnal hours when the plant is not in operation. This comparison enables the identification of specific features, such as the repeatability of daily and weekly cycles at IP_B or low power variability at IP_A.
As illustrated in Figure 4a,b, the histograms of industrial plants present the characteristics of active power in two different cases, thereby elucidating the disparities in the nature of operation and power distribution.
A thorough examination of the data presented in the charts reveals a stable power profile for the IP_A plant, which mirrors the continuous operation of the technological installations. In contrast, the IP_B profile is marked by substantial power reductions on Saturdays, Sundays, holidays, and during nocturnal hours when the plant is not in operation. This comparison enables the identification of specific features, such as the repeatability of daily and weekly cycles at IP_B or low power variability at IP_A.
As illustrated in Figure 4a,b, the histograms of industrial plants present the characteristics of active power in two different cases, thereby elucidating the disparities in the nature of operation and power distribution.
The distribution of the IP_A is evidently unimodal, indicating that a single operating mode with a distinct power value prevails. The power range of these devices is between 1 and 4.5 MW. The maximum frequency recorded occurred within the range of approximately 3.0–3.6 MW. The tails of the distribution are short, and the number of observations in the extreme classes (≤1.5 MW and ≥4.2 MW) is small. This characteristic is indicative of the plant's stable operation near typical values, with moderate daily and seasonal deviations. For IP_B, the distribution is multimodal and strongly skewed to the left. Low power levels predominate, particularly within the range of 0–200 kW, where the highest frequencies are recorded. In the context of higher power levels ranging from 0.3 to 0.5 MW, there have been documented instances of sporadic and intermittent operation. The substantial breadth and protracted duration observed in the rightward extension of the histogram are indicative of the variable and intermittent nature of the load. Frequent periods of idle or semi-idle operation are indicative of irregular power usage at the plant.
3.2. Processing and Aggregation of Measurement Data
In the subsequent phase of the study, the instantaneous power measurements were converted into energy consumption(s)in each distinct time interval. Given that individual measurements were recorded at 15-minute intervals, the energy corresponding to a given interval was calculated as the product of power and interval duration, according to equation (2).
where:
Δs – energy consumption [kWh]
Pi – measured power in the i-th interval [kW];
Δt – interval duration (0,25 h).
Subsequently, the energy values obtained (expressed in kWh) for all intervals during the day were aggregated, enabling the calculation of the total daily energy consumption for the analyzed profiles. The qualification period, which is currently daily, is understood here as the specified billing period implemented by the distribution system operator.
In accordance with the assumptions of the qualification period, the determination was made for each data record as to whether a given interval fell within the peak period or outside the peak period. The period of peak hours was delineated as working days from Monday to Friday (excluding public holidays) between 7:00 a.m. and 9:59 p.m., a definition that aligns with the prevailing power market regulations in Poland. The remaining time intervals were designated as off-peak hours. This classification was implemented by analyzing variables such as dates and times and assigning each record to the appropriate category. Consequently, data was obtained for both plants, which determined the total energy consumed during a 24-hour period by a given plant, the total energy consumed during peak quarter-hours in each 24-hour period, and the total energy consumed in other non-peak quarter-hours of the day. In the Python environment, the utilization of an aggregation statement facilitated the automation of grouping by date, thereby enabling the calculation of the aforementioned indicators and the allocation of the results to a newly generated, processed data frame.
3.3. Determination of the Average Electricity Consumption Difference Index
A fundamental component of the capacity charge analysis is the determination of the Δs coefficient for each qualification period, defined as the working days of the year. Its value is defined in the Act [16] on the functioning of the capacity market and settlements with end users as the difference in average electricity consumption according to formula (1).
The Δs index value was calculated for each working day of 2018 in the tested IP_A and IP_B profiles based on the available measurement data. The results are presented in Figure 5 and Figure 6, which illustrate the variability of the Δs index over time.
The IP_A profile demonstrates relatively minor fluctuations in the Δs index, with values approaching zero and exhibiting a moderate positive trend. This indicates that the plant's load remains stable and is distributed evenly throughout the day, without sudden spikes or changes in power. This behavior suggests that the equipment is operating continuously and predictably, which in turn indicates a systematic energy consumption. This, in turn, minimizes the risk of network overloads. Consequently, the IP_A profile is distinguished by its low load variability, a feature that is advantageous for both the operator and the plant. This property facilitates effective cost control and production planning. Conversely, the IP_B profile is distinguished by considerably elevated Δs values, signifying pronounced fluctuations in energy consumption throughout the day, with a notable intensity during peak hours. Such spikes indicate that the plant frequently operates with high power variability for brief periods, followed by periods of reduced or zero energy demand. This inherent characteristic of the system engenders elevated levels of load variability, a factor that has the potential to impose greater demands on the power grid and necessitates enhanced flexibility in the operational dynamics of power management systems. Furthermore, elevated Δs values suggest that the financial implications associated with the power charge for such a profile may be more substantial. The disparities in the characteristics of the Δs indicator between the IP_A and IP_B profiles are pivotal for their classification into disparate groups of electricity consumers, thereby determining the amount of the power charge.
3.4. Assignment to Recipient Groups
In order to ascertain the amount of the capacity charge to be remitted by end users, it was necessary to categorize each billing day into the appropriate user group (K1-K4). This classification is predicated on the designated Δs coefficient. The daily value of the difference in average consumption was calculated, and each day of the 2018 calendar year was classified into the appropriate consumer groups (K1-K4) for the surveyed plants IP_A and IP_B. The results of the aggregation of days into tariff groups are presented in Table 2.
In the case of industrial plant IP_A, there were 179 cases in group K1 with the lowest capacity charge rate and only 7 cases in group K4 with the highest capacity charge rate. For industrial plant IP_B, there were two cases in group K1 with the lowest capacity charge rate and 247 cases in group K4 with the highest capacity charge rate.
Figure 7 presents a graphical representation of the variation in average energy consumption for IP_A across different customer groups. Figure 8 shows a graph of the difference in average energy consumption for plant IP_B.
A thorough examination of the data exhibited in Figure 7 and Figure 8 and Table 2 reveals that plant IP_A, functioning in continuous mode, exhibits a substantially higher number of days with minimal energy consumption disparities (frequently observed in groups K1 and K2). A consideration of the operational characteristics of plant IP_B, which functions in two shifts, reveals a preponderance of days from group K4. This finding suggests that the plant experiences a substantial load during peak hours and exhibits minimal energy consumption during off-peak periods.
3.5. Energy Storage Sizing
The requisite storage capacity was ascertained to be the maximum daily amount of energy that had to be transferred from peak hours to off-peak hours during the analysis. To ensure the operational reserve is sufficient, it is necessary to increase this capacity by 20%. This will account for potential changes in storage efficiency and battery degradation over time. To facilitate the visualization of the effect, the algorithm was implemented with varying storage capacities to ascertain the break-even point of the investment. This determination was made based on storage capacity and the number of days in the K4 consumer group. In the case of the IP_A industrial plant, the augmentation of storage capacity led to an increase in the number of days in the K4 group, rather than a continuation of the previous decline. The graphs illustrating the number of days in each group for both analyzed profiles are presented in Figure 9 and Figure 10.
In the case of plant IP_A, with a continuous operating profile, it was observed that the effect of energy storage in the context of changing consumer groups was negative. The stability and relatively even distribution of energy consumption between peak and off-peak hours results in limited possibilities for shifting energy. Consequently, the utilization of substantial storage capacity does not result in a decrease in the number of days falling within the higher tariff group; rather, it leads to an increase in that number. The findings indicate a restricted capacity to diminish the capacity charge for the IP_A plant profile, which is distinguished by its relative equilibrium in energy consumption. The graph for the IP_B plant profile is distinctly different, exhibiting higher variability in consumption with dominant peaks during hours of maximum demand and significant drops in consumption during off-peak hours. In this case, the augmentation of storage capacity resulted in a substantial shift of days from the groups with higher capacity charges K3 and K4 to the groups with lower charges K2 and K1. Consequently, for a given profile, the energy storage system effectively mitigates average consumption, thereby enabling a reduction in the capacity charge. As illustrated in Figure 10, the maximum capacity of approximately 1100 kWh indicates the break-even point for this investment. An adverse outcome was noted during the augmentation of the energy storage capacity for plant IP_B, which resulted in an escalation in the number of days in group K4.
4. Results
In the case of plant IP_A, with a continuous operating profile, it was observed that the effect of energy storage in the context of changing consumer groups was negative. The stability and relatively even distribution of energy consumption between peak and off-peak hours results in limited possibilities for shifting energy. Consequently, the utilization of substantial storage capacity does not result in a decrease in the number of days falling within the higher tariff group; rather, it leads to an increase in that number. The findings indicate a restricted capacity to diminish the capacity charge for the IP_A plant profile, which is distinguished by its relative equilibrium in energy consumption. The graph for the IP_B plant profile is distinctly different, displaying higher consumption variability with dominant peaks during hours of maximum demand and significant drops in consumption during off-peak hours. In this case, the augmentation of storage capacity resulted in a substantial shift of days from the groups with higher capacity charges K3 and K4 to the groups with lower charges K2 and K1. Consequently, for a given profile, the energy storage system effectively mitigates average consumption, thereby enabling a reduction in the capacity charge. As illustrated in Figure 10, the maximum capacity of approximately 1100 kWh indicates the break-even point for this investment. An adverse outcome was noted during the augmentation of the energy storage capacity for plant IP_B, which resulted in an escalation in the number of days in group K4.
A thorough analysis was conducted to examine the impact of implementing an electricity storage facility on reducing capacity charges at two industrial plants with distinct work organization patterns. The findings of this analysis demonstrated a clear correlation between the effectiveness of this solution and the characteristics of the energy consumption profile. The results were evaluated for plant IP_A, which operates continuously, and plant IP_B, which operates in a two-shift system with weekend breaks. The assessment was based on financial analysis covering the entire accounting year.
In the case of the IP_A plant, the results obtained indicated that even with significant energy storage capacities, the implementation of this solution did not have a positive impact on the structure of days eligible for individual capacity charge groups. The characteristics of the plant's operating profile, as reflected in a single-mode and very stable daily and weekly load distribution, do not allow for the effective shifting of demand from peak hours to off-peak hours. This shift appears to be the fundamental prerequisite for achieving cost savings in the capacity charge settlement system. However, the study conducted revealed an undesirable phenomenon: an increase in the number of days billed at the highest rate (group K4). This increase had the potential to result in an increase in total charges compared to the initial situation. An analysis of the electricity consumption profile indicated that, under such a uniform schedule, there are no periods of significant power surpluses to be offset. The implementation of artificial interventions through storage mechanisms invariably culminates in the unfavorable equalization of profiles. This phenomenon precipitates the migration of a proportion of the load to non-peak periods, a shift that fails to engender quantifiable financial advantages. Consequently, given the necessity to allocate capital expenditures for the implementation of energy storage, in conjunction with the absence of a reduction in capacity charges, the implementation of this solution for facilities exhibiting a profile analogous to IP_A is not advised from an economic efficiency standpoint.
Conversely, the IP_B plant exhibited a distinctly divergent set of results, with its consumption profile marked by substantial daily and weekly fluctuations. The analysis of the load histogram revealed clear multimodality, with a dominant share of peak hours and significantly reduced consumption during non-production hours, especially at night and on weekends. This profile indicates that a substantial portion of the year is classified in the unfavorable K4 group, which has the highest capacity charge rate. To this end, a series of configurations were conducted to assess the impact of scalable energy storage capacities on the structure of days eligible for individual customer groups and on the total amount of annual charges. The findings of these analyses unequivocally substantiated that even modest storage capacities can substantially curtail the number of days in the K4 group by redistributing a portion of the consumption from peak hours to periods of reduced load. A marked shift in the distribution of days to the more favorable K3, K2, and K1 groups was observed, which is directly related to a reduction in the unit rate of the fee.
A critical element of the analysis was to determine the characteristic point beyond which further increases in energy storage capacity no longer translate into further savings and may even generate economically suboptimal effects due to the characteristics of power consumption distribution. As demonstrated by the study, the appropriate energy storage capacity for the IP_B plant, as determined by the objective of enhancement tariff structures, is estimated to be approximately 1,000 kWh. This is contingent upon a maximum instantaneous power consumption of 500 kW. Consequently, the most economically efficient storage facility for this profile should possess the following characteristics: an active power of 0.5 MW and a usable capacity of 1 MWh, corresponding to twice the maximum power of the plant. It is important to note that the power and capacity of the storage facility were not selected arbitrarily. Rather, these parameters were determined through multi-variant analysis that encompassed actual energy consumption profiles.
In consideration of the applicable unit capacity charges anticipated in 2025 and the frequency of events within tariff groups, the capacity charge was determined through a meticulous calculation process. The implementation of an energy storage facility with the specified parameters within the power supply structure of the IP_B plant leads to a measurable, direct economic effect. The amount of annual capacity charges decreases from PLN 232,080 to PLN 116,660, which represents a 50% reduction in costs while maintaining the same volume of electricity consumption and without the need to modify technological processes or production organization. This outcome should be regarded as highly significant not only in the economic context of the entity concerned, but also as evidence of the potential of demand management tools, which possess a genuine economic dimension under the current regulations on capacity charges in Poland.
As illustrated in Figure 11, there is a direct correlation between the total annual power charges incurred by plant IP_B and the capacity of the energy storage facility. The graph of total power charges as a function of energy storage capacity illustrates the economic optimum for implementing the storage system, which is 1070 kWh. Additionally, the study corroborates the notion that the profitability of the investment is contingent upon the accurate analysis of the annual active power profile. Attempts to implement solutions with excessive or insufficient storage capacity result in the underutilization of potential benefits or the incurrence of unnecessary expenses.
5. Discussion
The results of the analysis demonstrate the importance of diagnosing the individual power consumption profile as a fundamental criterion for decision-making when implementing new energy solutions in industrial enterprises. The transformation of the energy market and the evolution of the capacity charge system in Poland are compelling consumers to adopt a more proactive approach to improving electricity consumption and deploying tools that enhance operational flexibility. The findings indicate a clear relationship between the effectiveness of energy storage implementation within the capacity market framework and the specific daily and weekly load profile of the facility. In the case of stable, flat consumption profiles, where continuous technological operation predominates, the economic benefits of implementing energy storage are limited. Under such conditions, storage does not enable the transfer of substantial volumes of energy between periods with different tariff levels and therefore offers little potential to reduce capacity charges. The case of IP_A provides a clear illustration of the limitations of this technology in continuously operating facilities.
By contrast, companies operating on a shift basis and exhibiting clearly differentiated periods of high and low electricity consumption, as exemplified by IP_B, show a strong potential for load-profile management through energy storage. This results in a reduction in peak-period consumption and an improvement in the applicable tariff classification. The observed decline in the number of days billed in group K4, together with the increase in the number of more favorable days in group K1, translates into measurable and direct financial savings without requiring changes to the production system. This approach is consistent with the broader development of demand-side response mechanisms, and the findings support the hypothesis that the inherent flexibility of industrial consumers can be effectively used to reduce costs within the capacity market system.
When interpreting the study results, it is important to emphasize the significance of selecting appropriate technical parameters for the storage facility. The appropriate storage capacity should be determined based on a statistical analysis of the power profile and identification of the inflection point, that is, the point at which further increases in capacity no longer generate meaningful savings and may even lead to inefficient use of investment resources. This individualized approach highlights the need to move away from universal solutions and reinforces the role of analytical tools and computer modeling in industrial energy management. The findings also raise important questions regarding the long-term viability of storage solutions, the economic feasibility of investments under fluctuating energy prices and future regulatory changes, and the potential synergies with renewable energy development and industrial automation. In this context, further research should examine dynamic and seasonal changes in power consumption profiles and regularly update cost analyses so that companies can adapt their energy strategies to changing market and regulatory conditions.
6. Conclusions
The analysis of two industrial plants with different operating schedules led to the following conclusions:
- The economic effectiveness of investing in energy storage systems, as reflected in reductions in capacity charges, depends largely on the specific characteristics of a company’s power demand profile;
- The financial analysis indicates that there is no economic justification for implementing energy storage in continuously operating facilities with stable load profiles, where opportunities for cost optimization are limited;
- By contrast, in shift-based plants with a substantial share of electricity consumption during peak hours, investment in a properly sized energy storage system can significantly reduce total annual capacity charges without requiring the reorganization of technological processes or changes in the overall level of energy consumption;
- Any recommendation to implement energy storage solutions should be preceded by a detailed analysis of the historical active power profile over the course of a year, together with a comprehensive assessment of alternative storage-capacity and power configurations. Such an analysis should consider both actual energy prices and current as well as projected regulatory conditions. Given the long service life of these installations, investment decisions should be evaluated over an extended time horizon, with due consideration of potential changes in external factors;
- The results of this study may serve as a valuable reference point for further research on the role of demand-side flexibility in the energy transition of Polish industry, while also providing practical guidance for companies seeking effective energy cost management strategies in the contemporary electricity market.
This study has several limitations that should be acknowledged, as they may affect the interpretation of the results and indicate directions for future research. In the analyzed case, the operation of the energy storage system was controlled exclusively based on historical data. Consequently, the recommendations were based on the active power profile derived from a previous measurement period. In practice, however, electricity consumption patterns and their distribution may change in ways that are not captured by static historical data. These patterns are influenced by a range of factors, including changes in work organization, the introduction of new technological processes, weather variability, and evolving prices and regulations. As a result, although the applied storage control strategies provide valuable insights, they may not fully exploit the cost-optimization potential associated with the capacity charge.
Accordingly, future research should focus on integrating machine learning algorithms into the existing energy storage control framework. Such integration could support the prediction of both short-term and long-term variations in the power profile and enable dynamic, adaptive management of storage charging and discharging processes. This approach could incorporate demand forecasting, weather forecasts, as well as market and regulatory conditions, thereby improving operational efficiency and reliability. In turn, it may further enhance the reduction of the capacity charge and improve the alignment between storage utilization and the actual requirements of industrial facilities.
Author Contributions
Conceptualization, A.B, K.B., A.P.1, A.P.2, A.P.K. and M.P.; methodology, A.B., A.P.1. and A.P.2; software, A.P.1. and A.P.K.; validation, A.B., A.P.2. and Z.Z.; formal analysis, A.B. and A.P.1; investigation, A.P.K. and A.P.1; resources, K.B. and A.P.1; data curation, A.P.1.; writing—original draft preparation, K.B., A.P.1, A.P.2 and A.P.K; writing—review and editing, A.B., K.B., A.P1, A.P.K,; visualization, A.P.1.; supervision, A.B., M.P.; project administration, A.B, K.B., A.P.1, A.P.2, A.P.K.; funding acquisition, A.B, K.B., A.P.1, A.P.2, A.P.K. and M.P. All authors have read and agreed to the published version of the manuscript.
Funding
This research received no external funding.
Data Availability Statement
Restrictions apply to the availability of these data. Data were obtained from third party..
Declaration of generative AI and AI-assisted technologies in the writing process
During the preparation of this work the authors used GenAI to edit text. After using this tool/service, the authors reviewed and edited the content as needed and take full responsibility for the content of the publication.
Conflicts of Interest
The authors declare that they have no known competing financial interests or personal relationships that could have appeared to influence the work reported in this paper.
Abbreviations
The following abbreviations are used in this manuscript:
| RES | Renewable Energy Sources |
| IP_A | Industrial Plant A |
| IP_B | Industrial Plant B |
| ERO | Energy Regulatory Office |
| DSO | Distribution System Operator |
References
- Andersen, A.D.; Makitie, T.; Steen, M.; Wanzenbock, I. Conceptualizing the relationship between industrial transformation and accelerating sustainability transitions: A multi-sectoral perspective. Energy Res. Soc. Sci. 2026, 131, 104509. [Google Scholar] [CrossRef]
- Izdebski, M.; Małkowski, R.; Miller, P. New Performance Indices for Power System Stabilizers. Energies 2022, 15, 9582. [Google Scholar] [CrossRef]
- Nocon, A.; Paszek, S. A Comprehensive Review of Power System Stabilizers. Energies 2023, 16(4), 1945. [Google Scholar] [CrossRef]
- Delfino, F.; Prokopio, R.; Rossi, M.; Bracco, S.; Brignone, M.; Robba, M. Microgrid Design and Operation for Smart Cities; Artech House Publishers, 2018. [Google Scholar]
- Ibrahim, I.A.; Shafiee, M.; Hussain, A.; Moazzen, F. Microgrids Design and Operation: Guiding Insight and Best Practices for Microgrids Development. Power Systems; Springer: Singapore, 2025; Available online: https://link.springer.com/book/10.1007/978-981-96-4914-3.
- Roques, F.; Verhaeghe, C. Different approaches for capacity mechanisms in Europe: rationale and potential for coordination? In Capacity Mechanisms in the EU Energy Markets: Law, Policy, and Economics; Oxford University Press, 2022; pp. 107–122. [Google Scholar] [CrossRef]
- Traber, T. Capacity remuneration mechanisms for reliability in the integrated European electricity market: effects on welfare and distribution through 2023. Util. Policy 2017, 46, 1–14. [Google Scholar] [CrossRef]
- Komorowska, A.; Kaszyński, P.; Kamiński, J. Where does the capacity market money go? Lessons learned from Poland. Energy Policy 2023, 173, 113419. [Google Scholar] [CrossRef]
- Liu, Y. Demand response and energy efficiency in the capacity resource procurement: Case studies of forward capacity markets in ISO New England, PJM and Great Britain. Energy Policy 2017, 100, 271–282. [Google Scholar] [CrossRef]
- Simoglou, C.K.; Biskas, P.N. Capacity Mechanisms in Europe and the US: A Comparative Analysis and a Real-Life Application for Greece. Energies 2023, 16, 982. [Google Scholar] [CrossRef]
- Enea, How to optimize electricity costs in your company. Available online: https://www.enea.pl/dlafirm/enea-optima/ebook_01_2023.pdf (accessed on 21 May 2025).
- Czosnyka, M.; Wnukowska, B. The capacity market and its impact on electricity prices. Electrotech. Rev. 2022, 3, 136–140. [Google Scholar] [CrossRef]
- Act of 10 April 1997. Energy Law. Available online: https://isap.sejm.gov.pl/isap.nsf/download.xsp/WDU19970540348/U/D19970348Lj.pdf (accessed on 21 May 2025).
- Regulation of the Minister of Climate and Environment of 29 November 2022 on the method of shaping and calculating tariffs and the method of settlement in electricity trading. Available online: https://isap.sejm.gov.pl/isap.nsf/download.xsp/WDU20220002505/O/D20222505.pdf (accessed on 21 May 2025).
- Polish Power Grids. Electricity Tariff for 2025; Konstancin-Jeziorna, 2024. Available online: https://www.pse.pl/documents/20182/5816149363/Taryfa_PSE_SA_na_rok_2025.pdf (accessed on 21 May 2025).
- Energy Regulatory Office. Tariffs published in 2025. Available online: https://bip.ure.gov.pl/bip/taryfy-i-inne-decyzje-b/energia-elektryczna/4767,Taryfy-opublikowane-w-2025-r.html (accessed on 21 May 2025).
- Uddin, M.; Romlie, M.F.; Abdullah, M.F.; Halim, S.A.; Bakar, A.H.A.; Kwang, T.C. A review on peak load shaving strategies. Renew. Sustain. Energy Rev. 2018, 82, 3323–3332. [Google Scholar] [CrossRef]
- Zheng, M.; Meinrenken, C.J.; Lackner, K.S. Smart households: Dispatch strategies and economic analysis of distributed energy storage for residential peak shaving. Appl. Energy 2015, 147, 246–257. [Google Scholar] [CrossRef]
- Cossutta, M.; Pholboon, S.; McKechnie, J.; Sumner, M. Techno-economic and environmental analysis of community energy management for peak shaving. Energy Convers. Manag. 2022, 251, 114900. [Google Scholar] [CrossRef]
- Henni, S.; Becker, J.; Staudt, P.; Vom Scheidt, F.; Weinhardt, C. Industrial peak shaving with battery storage using a probabilistic forecasting approach: Economic evaluation of risk attitude. Appl. Energy 2022, 327, 120088. [Google Scholar] [CrossRef]
- Hong, Z.; Wei, Z.; Li, J.; Han, X. A novel capacity demand analysis method of energy storage system for peak shaving based on data-driven. J. Energy Storage 2021, 39, 102617. [Google Scholar] [CrossRef]
- Lei, K.; Chang, J.; Wang, X.; Guo, A.; Wang, Y.; Ren, C. Peak shaving and short-term economic operation of hydro-wind-PV hybrid system considering the uncertainty of wind and PV power. Renew. Energy 2023, 215, 118903. [Google Scholar] [CrossRef]
- Manojkumar, R.; Kumar, C.; Ganguly, S.; Catalão, J.P.S. Optimal Peak Shaving Control Using Dynamic Demand and Feed-In Limits for Grid-Connected PV Sources With Batteries. IEEE Syst. J. 2021, 15, 5560–5570. [Google Scholar] [CrossRef]
- Lange, C.; Rueß, A.; Nuß, A.; Öchsner, R.; März, M. Dimensioning battery energy storage systems for peak shaving based on a real-time control algorithm. Appl. Energy 2020, 280, 115993. [Google Scholar] [CrossRef]
- Engels, J.; Claessens, B.; Deconinck, G. Optimal combination of frequency control and peak shaving with battery storage systems. IEEE Trans. Smart Grid 2020, 11, 3270–3279. [Google Scholar] [CrossRef]
- Act of 8 December 2017 on the capacity market. Available online: https://isap.sejm.gov.pl/isap.nsf/download.xsp/WDU20180000009/U/D20180009Lj.pdf (accessed on 21 May 2025).
- Regulation of the Minister of Climate and Environment of 9 November 2020 on collecting the capacity fee and designating the hours of the day falling on the peak demand for power in the system. J. Laws 2020, Item 2009. [CrossRef]
- Andruszkiewicz, J.; Lorenc, J.; Weychan, A. Price elasticity of demand of consumers settled under zonal capacity charges and its application. Electrotech. Rev. 2024, 8, 10–13. [Google Scholar] [CrossRef]
- Będkowski-Kozioł, M. The Capacity Market as a New Instrument for Ensuring Energy Security in Poland. In Contemporary Energy Security Problems. Gas and Energy Sector; Pawełczyk, M., Ed.; Warsaw, 2018; pp. 125–144. [Google Scholar]
- Dąbrowski, T. The capacity market in Poland – the purpose of implementing the act, EU and Polish conditions, key assumptions of the concept and the act. Internet Q. Antitrust Regul. 2018, 5(7), 9–14. [Google Scholar] [CrossRef]
- Hajuk, R. The impact of the capacity market on the operations of energy companies and end users of electricity. New Energy 2018, 4(64), 110–112. [Google Scholar]
- Kozieł, D.; Pawłowski, S. The role of the capacity market in ensuring the country's energy security. Min. Rev. 2018, 28–32. [Google Scholar]
- Spasowska-Czarny, H. The Origins of the Capacity Market in Poland. Annals Leg. Sci.>, Vol. XXVIII 2018, 4, 179–189. [Google Scholar] [CrossRef]
- Energy Regulatory Office. Capacity Market: The President of the Energy Regulatory Office has calculated the fee for maintaining the country's energy security in 2024. Available online: https://www.ure.gov.pl/pl/urzad/informacje-ogolne/aktualnosci/11280,Rynek-mocy-Prezes-URE-wyliczyl-wysokosc-oplaty-za-utrzymanie-bezpieczenstwa-ener.html (accessed on 16 May 2025).
- Energy Regulatory Office. How will our electricity bills change next year? Available online: https://www.ure.gov.pl/pl/urzad/informacje-ogolne/aktualnosci/9163,Jak-zmienia-sie-nasze-rachunki-za-energie-elektryczna-w-przyszlym-roku.html?search=3702853002 (accessed on 16 May 2025).
- Regulation of the Minister of Climate and Environment of 9 November 2020 on collecting the capacity fee and designating the hours of the day falling on the peak demand for power in the system. J. Laws 2020 2009. [CrossRef]
- Kuźniak, R.; Pawelec, A.; Bartosik, A.; Pawełczyk, M. Determination of the Electricity Storage Power and Capacity for Cooperation with the Microgrid Implementing the Peak Shaving Strategy in Selected Industrial Enterprises. Energies 2022, 15(13), 4793. [Google Scholar] [CrossRef]
- Kuźniak, R.; Pawelec, A.; Bartosik, A.; Pawełczyk, M. Determining the Power and Capacity of Electricity Storage in Cooperation with the Microgrid for the Implementation of the Price Arbitration Strategy of Industrial Enterprises Installation. Energies 2022, 15(15), 5614. [Google Scholar] [CrossRef]
- Energy Regulatory Office. The President of the Energy Regulatory Office publishes the capacity fee rate for 2025. Available online: https://www.ure.gov.pl/pl/urzad/informacje-ogolne/aktualnosci/12183,Prezes-URE-publikuje-stawke-oplaty-mocowej-na-2025-r.html (accessed on 21 May 2025).
- Dyka, E.; Mróz-Radłowska, I. Economics in the Energy Sector, Selected Issues; Lodz University of Technology Publishing House: Lodz, 2014. [Google Scholar]
- Kochel, M.; Niestępski, S. Electric power networks and industrial equipment; Warsaw University of Technology Publishing House: Warsaw, 2003. [Google Scholar]
- Banasik, K.; Chojnacki, A.Ł.; Kaźmierczyk, A. Analysis of annual load variability in the Polish electric power system. Electrotech. Rev. 2023, 99, 1. [Google Scholar] [CrossRef]
- Capacity Market Regulations. Available online: https://www.pse.pl/regulamin-rynku-mocy (accessed on 21 May 2025).
- Kielerz, A. Coal-Based Commercial Power Generation and the Capacity Market. Scientific Papers, Mineral and Energy Economy Research Institute of the Polish Academy of Sciences 2019, 109, 31–44. [Google Scholar] [CrossRef]
- Bućko, P. The capacity market as a new settlement mechanism in the power system. Energy Mark. 2019, 6(145), 3–9. [Google Scholar]
- Leśniak, A.; Palacz, K.; Surma, T.; Zamasz, K. Evolution (reform) of the EU electricity market. Electrotech. Rev. 2024, 100(8), 52–55. [Google Scholar] [CrossRef]
- Bućko, P. Capacity mechanisms in electricity markets. Electrotech. Rev. 2019, 95(10), 40–43. [Google Scholar] [CrossRef]
- Rożek, R. The European Capacity Market Mosaic: Is Greater Harmonization Needed at the EU Level? WiseEuropa – Warsaw Institute of Economic and European Studies Foundation. Warsaw 2023. Available online: http://wise-europa.eu/wp-content/uploads/2024/07/RYNEK-MOCY.pdf (accessed on 21 May 2025).
- Andruszkiewicz, M. Poland's obligations in light of the European Commission's decision approving the capacity market. New Energy 2018, 5–6(65), 5–9. [Google Scholar]
- Energy Regulatory Office. Summary of the survey on the functioning of the public aid mechanism - Capacity Market in Poland; Warsaw, September 2024. [Google Scholar]
- Campana, P.E.; Cioccolanti, L.; François, B.; Jurasz, J.; Zhang, Y.; Varini, M.; Stridh, B.; Yan, J. Li-ion batteries for peak shaving, price arbitrage, and photovoltaic self-consumption in commercial buildings: A Monte Carlo Analysis. Energy Convers. Manag. 2021, 234, 113889. [Google Scholar] [CrossRef]
- Mair, J.; Suomalainen, K.; Eyers, D.M.; Jack, M.W. Sizing domestic batteries for load smoothing and peak shaving based on real-world demand data. Energy Build. 2021, 247, 111109. [Google Scholar] [CrossRef]
- Cienfuegos, C.; Rodrigo, P.M.; Cienfuegos, I.; Diaz-Ponce, A. Comparative analysis of battery energy storage systems’ operation strategies for peak shaving in industries with or without installed photovoltaic capacity. Renew. Energy Focus 2024, 49, 100574. [Google Scholar] [CrossRef]
- Braeuer, F.; Rominger, J.; McKenna, R.; Fichtner, W. Battery storage systems: An economic model-based analysis of parallel revenue streams and general implications for industry. Appl. Energy 2019, 239, 1424–1440. [Google Scholar] [CrossRef]
- Aggregation model in the context of energy storage, prepared on behalf of the Ministry of Climate and Environment. Available online: https://www.gov.pl/web/klimat/analiza-i-opracowanie-raportu-dotyczacego-wsparcia-technologii-magazynowania-energii-elektrycznej (accessed on 21 May 2025).
- Zheng, Y.; Shao, Z.; Lei, X.; Shi, Y.; Jian, L. The economic analysis of electric vehicle aggregators participating in energy and regulation markets considering battery degradation. J. Energy Storage 2022, 45, 103770. [Google Scholar] [CrossRef]
- Palade, D. Research on Power Aggregators within the European Internal Electricity Market. In Proceedings of the 17th International Conference on Business Excellence, Bucharest, Romania; 2023; pp. 129–138. [Google Scholar] [CrossRef]
- Wasilewski, J.; Karkoszka, K. Virtual power plants in capacity and energy markets – analysis of national conditions. Energy Policy– Energy Policy J. 2016, 19(1), 35–52. [Google Scholar]
- Feng, C.; Huang, Z.; Lin, J.; Wang, L.; Zhang, Y.; Wen, F. Aggregation Model and Market Mechanism for Virtual Power Plant Participation in Inertia and Primary Frequency Response. arXiv 2025. [Google Scholar] [CrossRef]
- Chen, X.; Liu, Y.; Fan, N.; Wu, L. An Operating Profit-Oriented Medium-Term Planning Method for Renewable-Integrated Cascaded Hydropower. Energy 2025, vol. 338. [Google Scholar] [CrossRef]
- Feng, J.; Ren, Z.; Li, W. A Robust Safe Reinforcement Learning-based Operation Method for Hybrid Electric-Hydrogen Energy System Risk-based Dispatch Considering Dynamic Efficiency Characteristics of Electrolysers. -Renewable Energy 2025, Volume 254, 123761. [Google Scholar] [CrossRef]
Figure 1.
Components of electricity distribution fees.
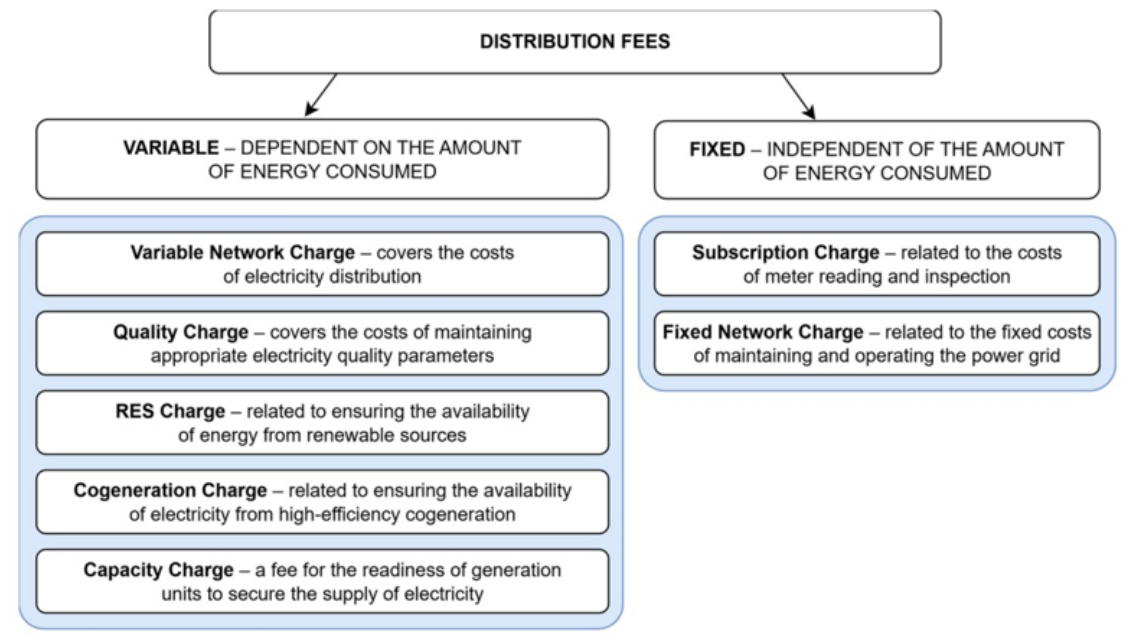
Figure 2.
Active power profile of industrial plant IP_A. Own work.
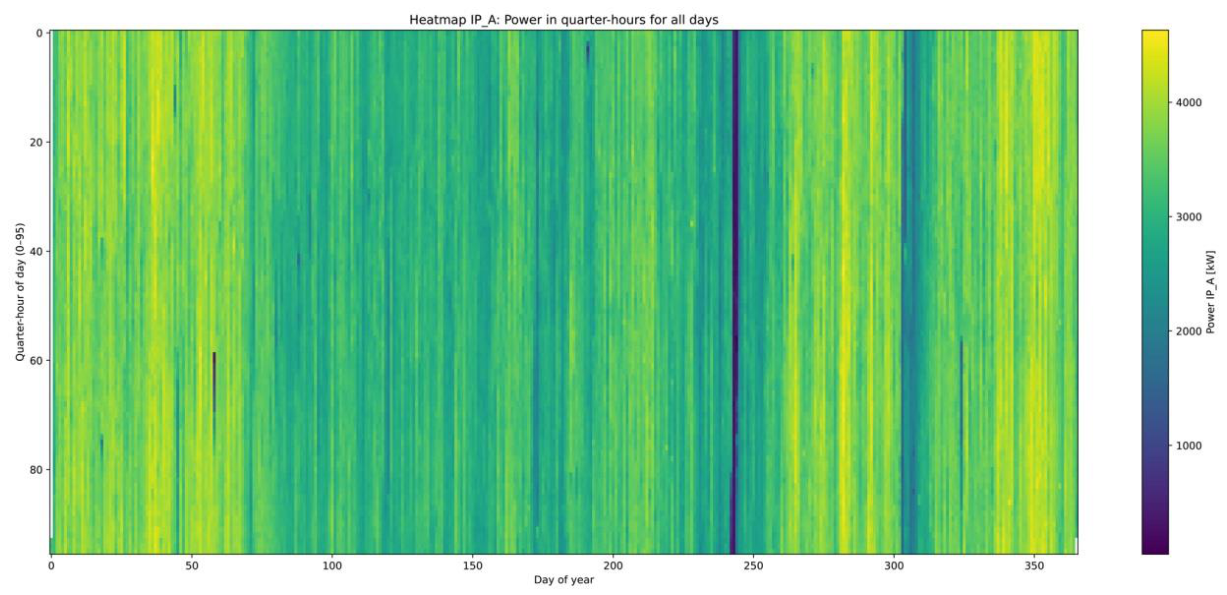
Figure 3.
Active power profile of industrial plant IP_B. Own work.
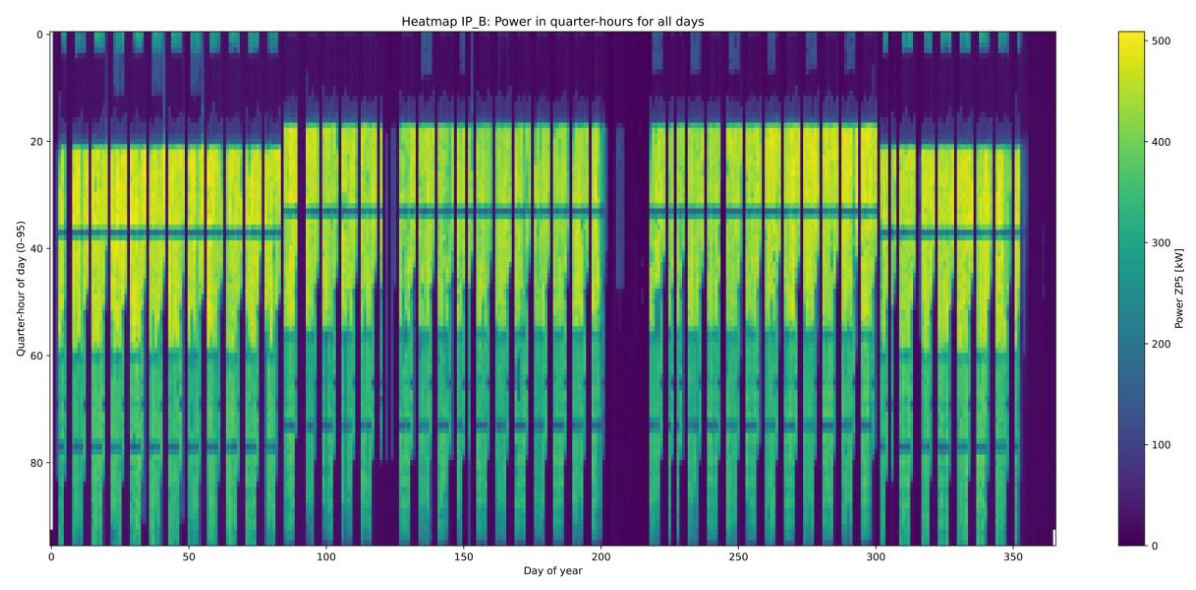
Figure 4.
(a) Active power profile histogram of plant IP_A. Own work. (b) Active power profile histogram of plant IP_B. Own work.
Figure 4.
(a) Active power profile histogram of plant IP_A. Own work. (b) Active power profile histogram of plant IP_B. Own work.
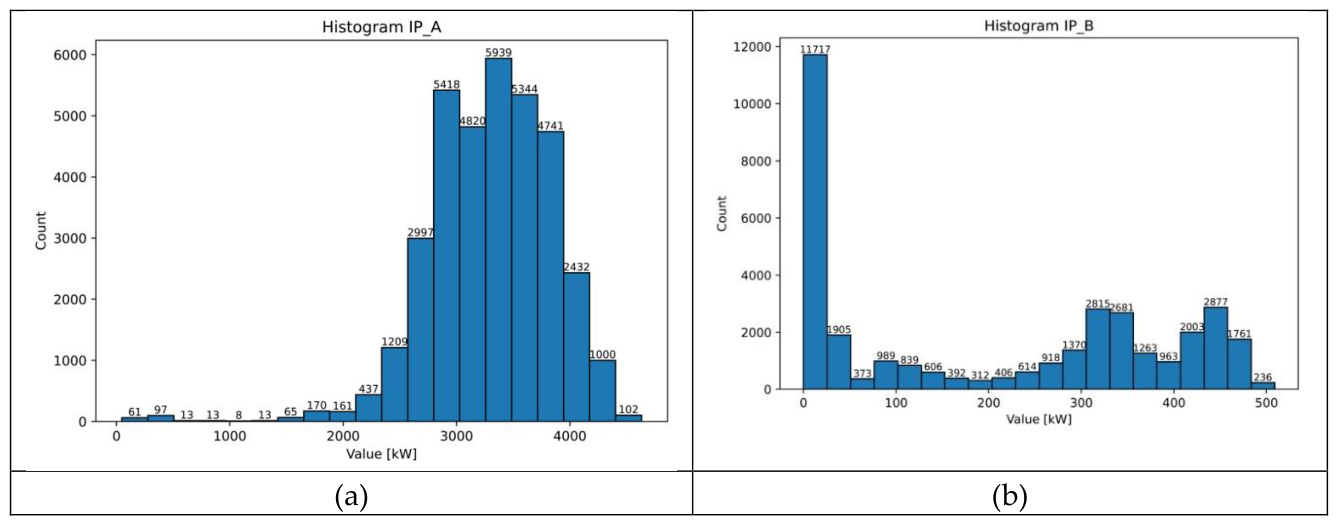
Figure 5.
Charts showing the difference in average energy consumption for IP_A. Own work.
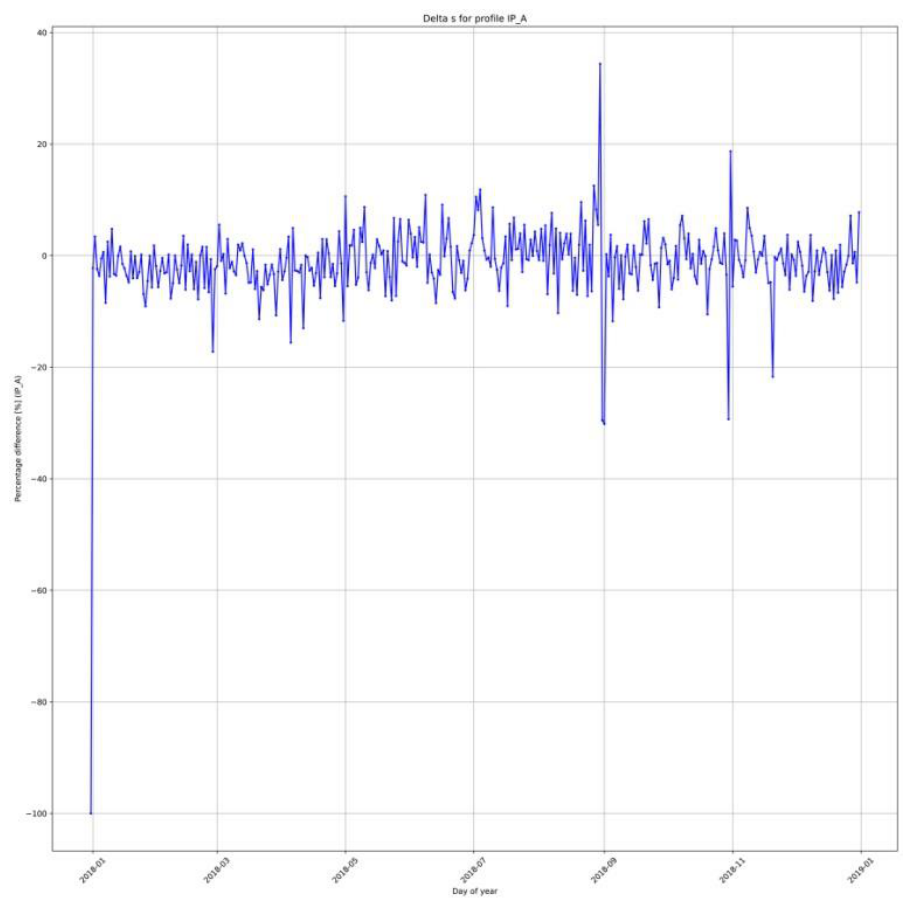
Figure 6.
Charts showing the difference in average energy consumption for IP_B. Own work.
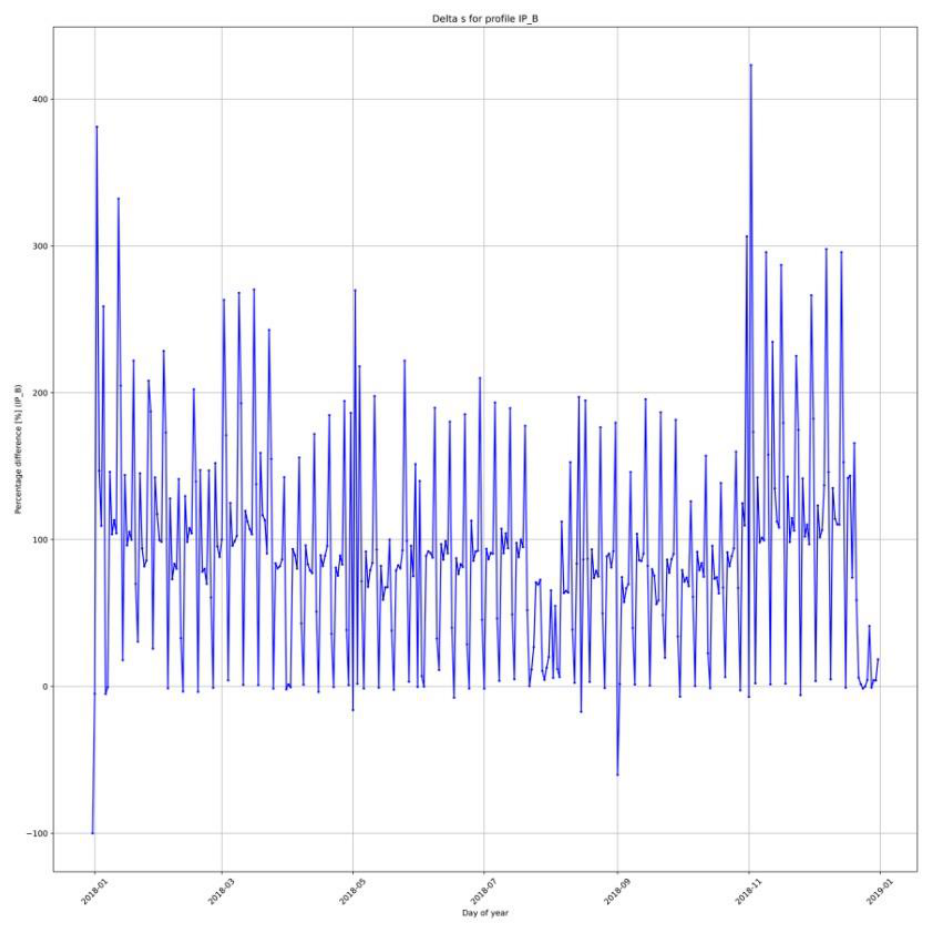
Figure 7.
Charts of the difference in average energy consumption for IP_A by group. Own work.
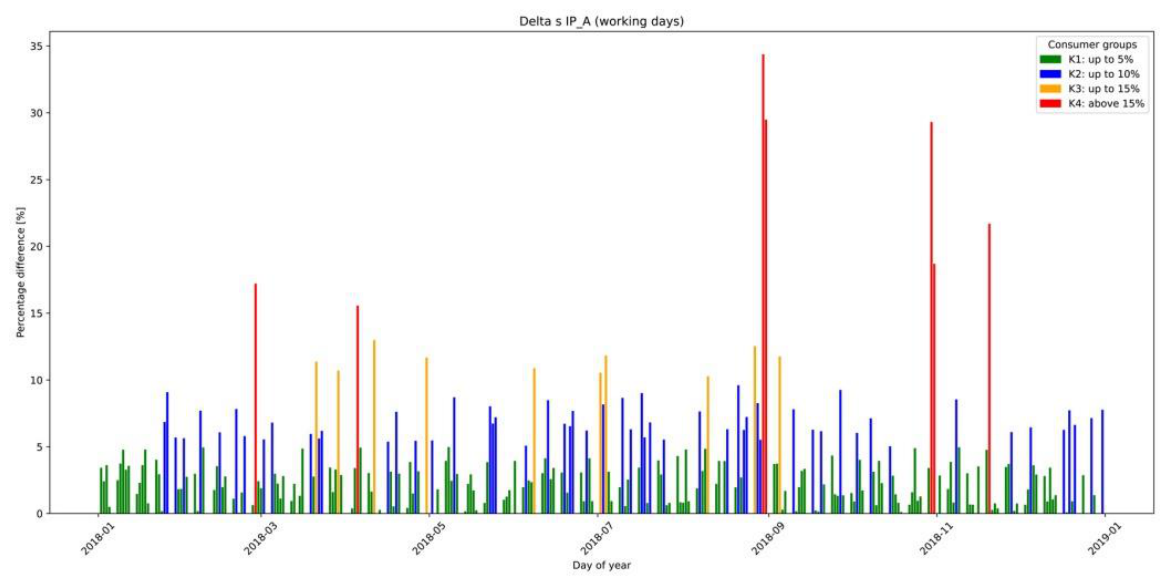
Figure 8.
Charts of difference in average energy consumption for IP_B by group. Own work.
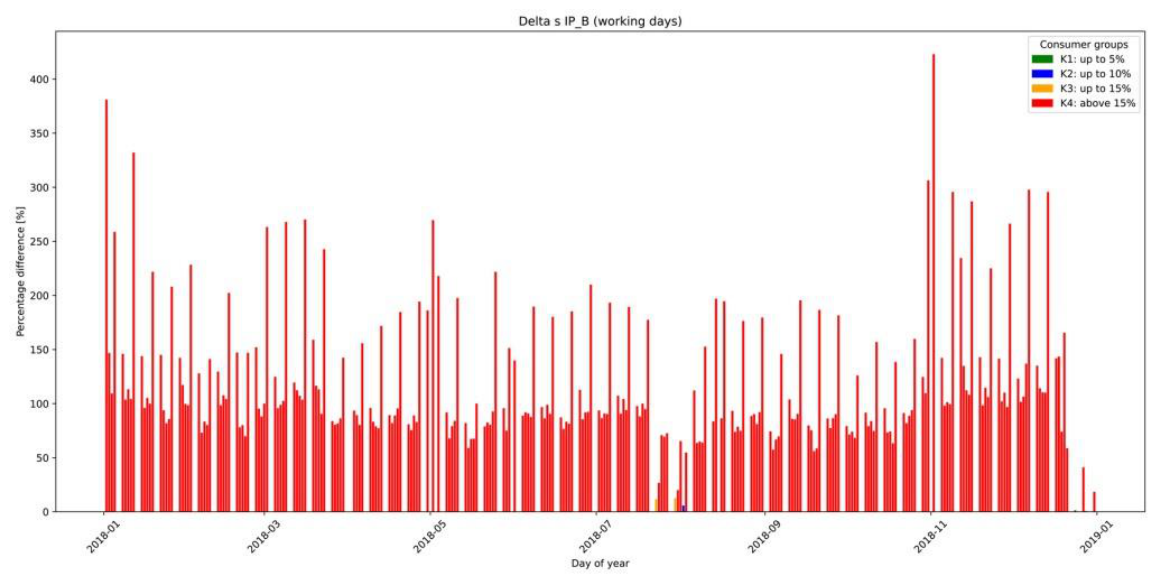
Figure 9.
Charts of the variation in the number of groups depending on the storage capacity for IP_A by group. Own work.
Figure 9.
Charts of the variation in the number of groups depending on the storage capacity for IP_A by group. Own work.
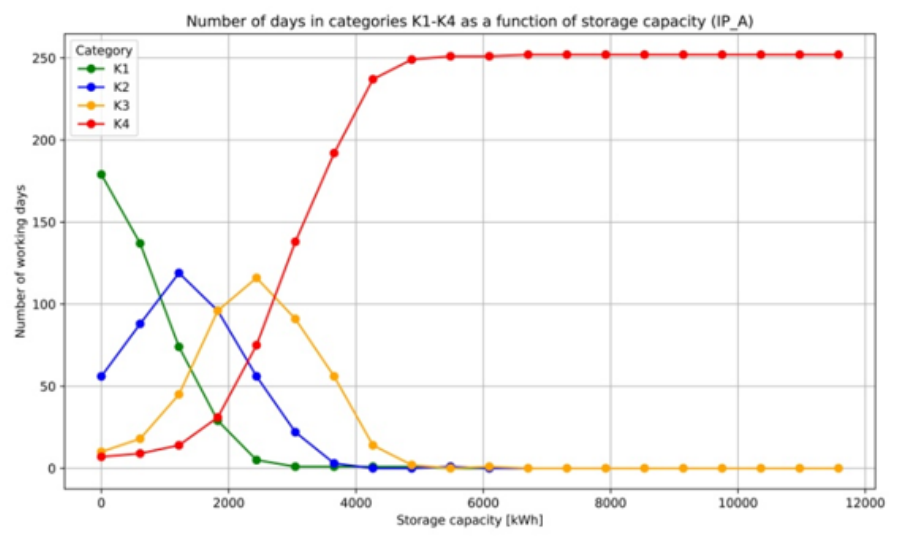
Figure 10.
Charts of the variation in the number of groups depending on the storage capacity for IP_B by group. Own work.
Figure 10.
Charts of the variation in the number of groups depending on the storage capacity for IP_B by group. Own work.
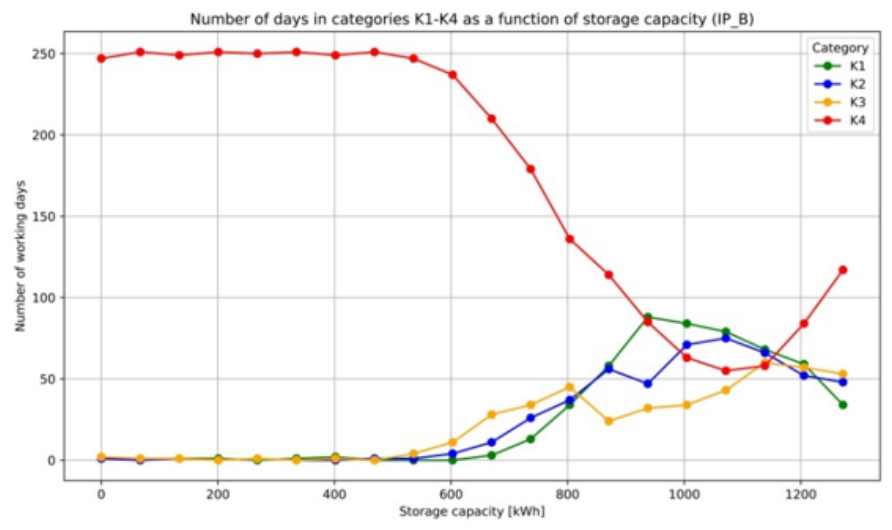
Figure 11.
The relationship between the total annual capacity fees incurred by IP_B and the capacity of the energy storage facility.
Figure 11.
The relationship between the total annual capacity fees incurred by IP_B and the capacity of the energy storage facility.
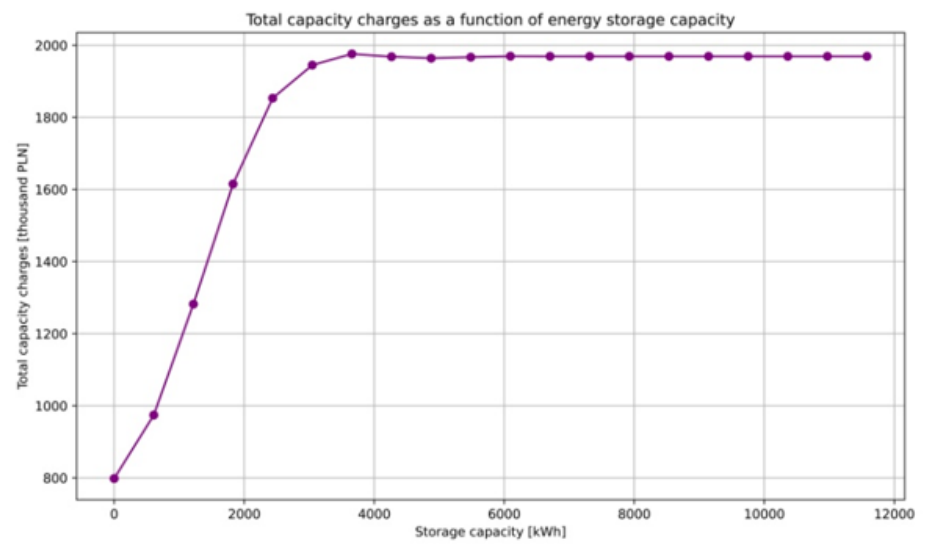

Table 1.
Classification of end users according to the difference between peak and off-peak energy consumption [26].
Table 1.
Classification of end users according to the difference between peak and off-peak energy consumption [26].
| Percentage difference between peak and off-peak consumption | Target group | Percentage of the full rate of the capacity charge (the so-called coefficient A) |
|---|---|---|
| less than 5% | K1 | 17% |
| not less than 5% and less than 10% | K2 | 50% |
| not less than 10% and less than 15% | K3 | 83% |
| not less than 15% | K4 | 100% |
Table 2.
Frequency of occurrence of qualification period groups.
| Target audience | IP_A | IP_B |
| K1 | 179 | 2 |
| K2 | 56 | 1 |
| K3 | 10 | 2 |
| K4 | 7 | 247 |
Disclaimer/Publisher’s Note: The statements, opinions and data contained in all publications are solely those of the individual author(s) and contributor(s) and not of MDPI and/or the editor(s). MDPI and/or the editor(s) disclaim responsibility for any injury to people or property resulting from any ideas, methods, instructions or products referred to in the content. |
© 2026 by the authors. Licensee MDPI, Basel, Switzerland. This article is an open access article distributed under the terms and conditions of the Creative Commons Attribution (CC BY) license (http://creativecommons.org/licenses/by/4.0/).
Copyright: This open access article is published under a Creative Commons CC BY 4.0 license, which permit the free download, distribution, and reuse, provided that the author and preprint are cited in any reuse.