

Submitted:
21 July 2026
Posted:
22 July 2026
You are already at the latest version
Abstract
The rising demand for low-carbon hydrogen has intensified interest in biogas reform-ing as a renewable, decentralized alternative to fossil-based routes. Biogas, principally methane (CH₄) and carbon dioxide (CO₂), can be converted to hydrogen via steam re-forming (SR), dry reforming (DR), partial oxidation (POX), and autothermal reforming (ATR). This study presents a harmonized comparison of these four pathways under identical system boundaries and assumptions, integrating thermodynamic, environ-mental, and techno-economic analysis (TEA), with uncertainty quantified through a 10,000-iteration Monte Carlo simulation. Steam reforming delivers the highest hydro-gen yield (2.5–3.0 mol H₂ mol⁻¹ CH₄) and the lowest mean LCOH (\(5.21 kg⁻¹ H₂) with the narrowest cost distribution, confirming its role as the benchmark despite its high external-heat demand. Steam reforming also attains the highest energy efficiency (75–85 %), with autothermal reforming comparably efficient (68–78 %) via internal heat integration and offering a tunable H₂/CO ratio; partial oxidation (60–72 %) and dry re-forming (55–68 %) are less efficient, and all three carry higher mean costs than SR (\)5.47, $5.82, and $6.10 kg⁻¹, respectively). Life-cycle evidence for biogas-fed routes in-dicates that steam reforming also attains the lowest global warming potential (5.59–6.50 kg CO₂-eq kg⁻¹ H₂), ahead of dry reforming (6.80–7.80) and autothermal reforming (7.24–7.89), with partial oxidation the highest (7.50–8.20); dry reforming uniquely consumes CO₂ but incurs the highest LCOH (\(6.10 kg⁻¹) and the greatest cata-lyst-deactivation risk. Plant scale and capacity factor dominate cost across all routes. As these costs remain above conventional grey SMR (< \)2 kg⁻¹ H₂), competitive low-carbon biogas hydrogen will require impurity-tolerant catalysts, improved heat integration, and life-cycle-verified CO₂ management.
Keywords:
biogas reforming
; steam reforming
; hydrogen production
; dry reforming
; partial oxidation
; autothermal reforming
; techno-economic analysis
; levelized cost of hydrogen
; Monte Carlo simulation
; life cycle analysis
1. Introduction
Global energy demand continues to rise, reflecting the intensification of human activities and economic growth [1]. Today, energy is not only a production factor but also a strategic resource influencing global politics and economics [2]. Since the 19th century, fossil fuels have dominated global power generation, accounting for about 81% of total energy, mainly from coal, oil, and natural gas [3]. However, rising fossil fuel prices have increased economic strain, inflation, and global debates on energy scarcity [4]. Meanwhile, environmental degradation has become a critical global issue. Advances in technology offer potential solutions, prompting researchers to develop efficient, cost-effective renewable energy sources as sustainable alternatives to conventional fuels [5].
1.1. Hydrogen as a Promising Energy Carrier for the Future
As traditional energy sources become limited and environmental concerns intensify, hydrogen emerges as a viable alternative to support a sustainable energy future. Hydrogen is a versatile gaseous element that can be produced through various methods, primarily by steam methane reforming of natural gas or from renewable sources such as wind, solar, and water via electrolysis [6]. Hydrogen is increasingly recognized as a cornerstone of the global transition toward low-carbon energy systems due to its versatility and potential to decarbonize hard-to-abate sectors such as transport, chemicals, and heavy industry [6]. Once produced, it serves multiple applications across transportation, heating, and electricity generation. In transport, hydrogen fuel cells power vehicles with water and heat as the only by-products, while in power generation, hydrogen can either be combusted or converted electrochemically in fuel cells to produce electricity efficiently and cleanly [7,8,9,10]. Hydrogen is categorized based on its production method and energy source into several types: grey, blue, green, black/brown, pink, turquoise, yellow, and white, each differing in environmental impact [11].
Grey hydrogen, the most common form, is produced via steam methane reforming (SMR) or autothermal reforming (ATR) of natural gas, releasing CO₂ directly into the atmosphere without capture, making it a high-emission process responsible for significant global carbon output [12,13]. Blue hydrogen is also produced from fossil fuels but incorporates carbon capture, utilization, and storage (CCUS) technology, preventing up to 90% of CO₂ emissions and making it a more environmentally friendly alternative [14,15]. Green hydrogen, the cleanest type, is generated through water electrolysis powered by renewable sources such as wind and solar, producing only oxygen as a by-product, though its high production cost remains a challenge [16,17,18].
Black and brown hydrogen, derived from coal or lignite gasification, represent the most carbon-intensive and polluting forms [19,20]. Pink hydrogen, produced through nuclear-powered electrolysis, offers a low-carbon option that uses both nuclear electricity and heat to enhance efficiency [21,22]. Turquoise hydrogen is obtained by methane pyrolysis, yielding solid carbon instead of CO₂, and could become a low-emission route if powered by renewable energy [23]. Yellow hydrogen refers to hydrogen produced via electrolysis using solar power [24]. White hydrogen naturally occurs underground in geological formations, though it is not yet exploited for energy use [25]. Together, these diverse hydrogen types represent a spectrum of technological pathways toward a cleaner and more sustainable energy future [9,26,27].
Despite rapid advances in water electrolysis and renewable integration, the majority of hydrogen today is still produced through fossil-based processes such as natural gas steam reforming and coal gasification, which collectively account for more than 85% of global production and emit nearly 10 kg of CO₂ per kilogram of H₂ generated [28,29,30]. The pursuit of sustainable hydrogen pathways has thus driven attention toward renewable feedstocks and circular-economy approaches, among which biogas represents a promising option [31,32,33].
The global hydrogen demand in 2026 (~ 100 Mt H₂ yr⁻¹) based on IEA data, alongside the sustainable biohydrogen potential in Europe (12.5 Mt H₂ yr⁻¹) from Rosa & Mazzotti (2022) [33,34], and a literature-informed global biohydrogen range (10–100 Mt H₂ yr⁻¹). Error bars indicate the uncertainty span for the global biohydrogen potential. Figure 1 also compares estimated biohydrogen production potential across major world regions. Asia shows the highest potential at roughly 25 Mt H₂ yr⁻¹, followed by Europe at about 12 Mt H₂ yr⁻¹. North America and South America exhibit moderate values (8 and 10 Mt H₂ yr⁻¹), while Africa and Australia show lower potentials (6 and ~1 Mt H₂ yr⁻¹). The chart highlights clear regional disparities in biomass-derived hydrogen capacity [33,34].
1.2. Biogas Production
Biogas production via anaerobic digestion (AD) is a cornerstone technology for converting organic waste streams into renewable energy carriers and digestate coproducts within circular economy schemes [38,39,40]. AD proceeds through the well-established sequence of hydrolysis, acidogenesis, acetogenesis, and methanogenesis, transforming complex polymers in feedstocks (municipal organic waste, food waste, sewage sludge, agricultural residues, and manure) into a methane-carbon dioxide mixture that can be directly used for heat and power, upgraded to biomethane, or further valorised into hydrogen via reforming routes [38]. The wide substrate flexibility of AD and its capacity for co-digestion (mixing complementary wastes to balance nutrients and biodegradability) make it particularly well suited to decentralized and regional waste-to-energy deployment [41]. Operational performance and biogas yield are susceptible to both substrate characteristics and process conditions. Key controlling parameters include the feedstock volatile solids content, carbon: nitrogen ratio, solids retention time (SRT) or hydraulic retention time (HRT), organic loading rate (OLR), temperature regime (mesophilic vs. thermophilic), pH, and the presence of inhibitory compounds such as ammonia, long-chain fatty acids, or toxic metals [42]. Reactor configurations (e.g., CSTR, UASB, fixed-bed, and two-stage systems) and pretreatment strategies (mechanical, thermal, chemical, or enzymatic hydrolysis) are therefore routinely optimised to increase hydrolysis rates and methane yields for lignocellulosic or heterogeneous wastes [43].
Beyond raw biogas production, gas cleaning and upgrading are essential bridging steps for high-value applications. Removal of hydrogen sulfide (H₂S), water, and trace organosilicon compounds (siloxanes) is required to protect downstream equipment and to meet biomethane specifications; established upgrading technologies include water scrubbing, pressure-swing adsorption, chemical absorption, and membrane separation, while emerging approaches (cryogenic separation, biological CO₂ conversion) are under active development to improve energy efficiency and reduce operating costs [40,44,45]. In particular, siloxane removal remains a persistent technical challenge. Recent reviews emphasise adsorptive media innovations (e.g., MOFs, engineered carbons, waste-derived adsorbents) and regeneration strategies as priority research areas for reliable industrial operation [46,47].
Circularity considerations further extend to digestate management and valorisation. Digestate is a nutrient-rich residue containing N, P, and K that can be processed into biofertilisers, soil conditioners, or feedstock for additional biorefinery operations (e.g., microalgae cultivation, nutrient extraction, biochar production). Effective solid–liquid separation and targeted nutrient recovery reduce environmental risks (ammonia and N₂O emissions, nutrient run-off) and enhance the overall sustainability of AD systems, yet economic and regulatory barriers for large-scale digestate valorisation persist [41,48,49]. Finally, macro-level assessments and geospatial potential studies by international agencies indicate substantial untapped sustainable potential for biogas and biomethane from residues and wastes, provided that projects are implemented with leak-tight operations, robust supply chains, and supportive policy frameworks [50].
Quantitatively, biogas yield and composition depend strongly on feedstock type, process configuration, and operating conditions. Typical volumetric methane yields from anaerobic digestion of organic wastes range between 0.35–0.60 m³ CH₄ kg⁻¹ VSₐdded for readily degradable substrates such as food and animal wastes, and 0.20–0.40 m³ CH₄ kg⁻¹ VSₐdded for lignocellulosic or mixed agricultural residues [45,51,52]. The resulting biogas typically comprises 55–70% CH₄, 30–45% CO₂ [53] and trace quantities of H₂S (50–10,000 ppm), NH₃, siloxanes, and volatile organic compounds [45]. Energy recovery efficiencies of full-scale digesters are reported between 70% and 85%, depending on heat integration and biogas utilization routes [47].
Process temperature also exerts a significant influence: mesophilic digestion (35–40 °C) generally achieves stable operation and moderate methane productivity, while thermophilic systems (50–55 °C) enhance reaction kinetics and organic matter conversion at the expense of higher energy input and increased sensitivity to inhibitors [54]. Co-digestion strategies, especially the blending of manure or sewage sludge with food waste, have demonstrated synergistic effects, yielding up to 25–40% higher biogas outputs compared with mono-digestion [55]. From a resource potential perspective, recent global assessments estimate the technically recoverable biogas potential at ≈570 billion Nm³ yr⁻¹, corresponding to approximately 10–12 EJ yr⁻¹ of primary energy and a mitigation potential of over 1 Gt CO₂-eq yr⁻¹ if sustainably mobilized [56].
Figure 2 presents the estimated regional and feedstock-based biogas production potential for 2025, derived from the International Energy Agency’s Outlook for Biogas and Biomethane (2025) [56]. Asia exhibits the highest potential (~250 Mtoe), followed by North America (~105 Mtoe) and Africa (~70 Mtoe), while Europe, South America, and Australia show comparatively lower values. Agricultural residues account for approximately 75% of the global potential, underscoring their dominance as a renewable substrate for biogas generation. The results highlight significant regional variability driven by differences in agricultural intensity and organic waste availability, emphasizing the need for tailored feedstock utilization strategies to enhance biogas deployment in global energy transitions.
Despite the growing body of literature investigating biogas as a renewable feedstock for hydrogen production, existing techno-economic analyses predominantly focus on single-reforming technologies, most notably Steam Methane Reforming (SMR) or Dry Reforming (DR) in isolation, or rely on natural gas-based baselines that fail to capture the specific compositional constraints of biogas. There remains a critical lack of systematic, head-to-head comparative assessments that evaluate SR, DR, Autothermal Reforming (AR), and Partial Oxidation (POX) under homogenized system boundaries and identical economic assumptions. Consequently, current research has yet to definitively map the techno-economic trade-offs between the endothermicity of SMR and DR versus the exothermic nature of POX and AR, specifically within the context of biogas upgrading, leaving a gap in identifying which reforming pathway offers the optimal balance of thermal efficiency, capital expenditure, and levelized cost of hydrogen (LCOH) for sustainable, decentralized applications [58].
1.3. Biogas-Reforming Technological Pathways
Biogas, when properly upgraded and reformed, has the potential to generate renewable hydrogen with a nearly neutral carbon footprint, particularly when implemented alongside carbon dioxide (CO₂) capture or utilization strategies [39,59]. The decentralized nature of biogas resources derived from agricultural residues, wastewater sludge, and municipal waste facilitates localized hydrogen production [60]. This characteristic enhances energy security while simultaneously reducing emissions associated with transportation [61].
Hydrogen production from biogas can be achieved through a range of thermochemical reforming technologies, each relying on the conversion of methane (CH₄) and carbon dioxide (CO₂) into a hydrogen-rich synthesis gas (syngas) [62,63]. The four primary reforming pathways, Steam Reforming (SR), Dry Reforming (DR), Partial Oxidation (POX), and Autothermal Reforming (ATR), differ in terms of energy requirements, reaction mechanisms, and environmental implications [64]. Understanding the fundamental principles and operational characteristics of biogas-to-hydrogen conversion is essential for optimizing efficiency, minimizing carbon emissions, and ensuring economic feasibility.
As shown in Figure 3, biogas-to-hydrogen production technologies follow an integrated process chain that encompasses biogas generation, gas cleaning and upgrading, and reforming. Initially, organic feedstocks such as agricultural residues, municipal waste, and livestock manure are anaerobically digested to produce raw biogas, which is subsequently purified to remove CO₂, H₂S, and other trace contaminants [64,65].
The upgraded biogas serves as the feedstock for hydrogen reforming via steam, dry, autothermal, or partial oxidation pathways, yielding high-purity hydrogen and a concentrated CO₂ stream suitable for capture or utilization. This integrated approach reflects the circular economy paradigm, in which waste-derived carbon is recycled into value-added energy carriers, contributing to greenhouse-gas mitigation and renewable hydrogen development [66].
1.3.1. Steam Reforming (SR)
Steam Reforming is the most widely adopted method for hydrogen generation, both industrially and at pilot scales [68,69]. The main reaction involves the conversion of methane and water vapor into carbon monoxide and hydrogen [64,69]:
This highly endothermic reaction requires external heat input, typically achieved at temperatures between 600–900 °C and moderate to elevated pressures (1–30 bar) [67]. A secondary water–gas shift (WGS) reaction further increases hydrogen yield:
Nickel-based catalysts supported on Al₂O₃ or MgAl₂O₄ are commonly used due to their cost-effectiveness and high activity [70]. However, SR is energy-intensive, sensitive to carbon deposition, and produces significant CO₂ emissions unless integrated with carbon capture and utilization (CCU) systems. Despite these drawbacks, SR remains the benchmark for hydrogen yield and process controllability in biogas reforming applications.
1.3.2. Dry Reforming (DR)
Dry Reforming directly utilizes the CO₂ fraction of biogas as the oxidant, offering a dual benefit of CO₂ valorization and hydrogen generation [71]:
DR is more endothermic than SR and typically operates at 700–950 °C. The resulting syngas has an H₂/CO ratio of approximately 1, making it suitable for Fischer–Tropsch or methanol synthesis after adjustment. Its key advantage lies in the direct consumption of CO₂, thus reducing net greenhouse gas emissions.
The major limitation is severe catalyst coking due to methane cracking and the Boudouard reaction (2CO → C + CO₂), leading to deactivation and pore blockage. Research efforts have focused on coke-resistant catalysts, such as Ni–CeO₂–ZrO₂ or Ni–La₂O₃–Al₂O₃, and on process intensification techniques, such as plasma-assisted or microwave-driven DR, to lower reaction temperatures and mitigate carbon deposition.
1.3.3. Partial Oxidation (POX)
Partial Oxidation utilizes limited oxygen to partially oxidize methane into CO and H₂ in an exothermic reaction [72]:
The process operates at 600–900 °C and is thermally self-sustaining, eliminating the need for external heat input [73]. POX offers fast kinetics, compact reactor designs, and high throughput, making it attractive for on-site or decentralized hydrogen production [74]. However, the main drawbacks are lower hydrogen yield, oxygen production costs, and potential hot-spot formation that can cause catalyst sintering. The technology’s efficiency depends largely on precise oxygen-to-methane ratios and uniform gas mixing to avoid over-oxidation and thermal runaway.
1.3.4. Autothermal Reforming (ATR)
Autothermal Reforming combines the endothermic steam reforming and exothermic partial oxidation reactions within a single reactor to achieve thermal self-sufficiency [63]:
ATR typically operates at 700–900 °C and produces a flexible H₂/CO ratio (1.5–3.0) suitable for downstream fuel synthesis or hydrogen separation.
Compared to SR and DR, ATR offers superior process stability, a compact reactor design, and simplified heat integration, making it well-suited for modular or integrated biogas reforming–fuel cell systems. Nonetheless, ATR’s practical challenges include oxygen infrastructure requirements, complex reaction control, and catalyst durability under thermal cycling.
Steam, dry, partial oxidation, and autothermal reforming differ markedly in conversion, selectivity, and practical H2 yield. Table 1 shows the summarized reported operational ranges and representative quantitative results from experimental and review studies.
2. Materials and Methods
This study evaluates and compares four major biogas-based hydrogen reforming technologies: Steam Reforming (SR), Dry Reforming (DR), Partial Oxidation (POX), and Autothermal Reforming (ATR). Each process was analyzed under comparable thermodynamic and economic conditions using standardized process boundaries and performance indicators. The assessment framework integrates reaction modeling, reactor performance simulation, and techno-economic evaluation (TEA).
2.1. System Boundary and Assumptions
The present techno-economic assessment adopts a gate-to-gate system boundary, encompassing all major process steps from biogas feedstock purification to hydrogen production and purification at 99.9% purity. Infrastructure construction, transportation, and downstream compression or storage are excluded from the economic boundary. The analysis assumes steady-state operation at nominal plant capacity with a lifetime of 20 years and a capacity factor of 90%. All costs are reported in 2025 USD per kilogram of hydrogen (USD kg⁻¹ H₂) and discounted to present value using the capital recovery factor. The Levelized Cost of Hydrogen (LCOH) is determined according to Eq. (6), [80],:
where:
– total capital investment (USD)
– annual operation and maintenance cost (USD yr⁻¹)
– annualized feedstock cost (USD yr⁻¹)
– annualized energy cost (USD yr⁻¹)
– catalyst replenishment cost (USD yr⁻¹)
– annual hydrogen output (kg H₂ yr⁻¹)
The LCOH formulation ensures that both fixed (capital-related) and variable (feedstock, energy, and maintenance) costs are consistently represented across all technologies [81].
where:
– discount rate (fraction, e.g., 0.10)
– plant lifetime (years)
where:
- annual feedstock expense (USD yr⁻¹)
- annual mass (or energy) of feedstock consumed (kg yr⁻¹ or GJ yr⁻¹
- unit price of feedstock (USD kg⁻¹ or USD GJ⁻¹)
- annualized cost of feedstock pretreatment (USD yr⁻¹)
- annual logistics and collection cost (USD yr⁻¹)
where:
– total annual energy use (kWh yr⁻¹ or GJ yr⁻¹)
– weighted average energy price (USD kWh⁻¹ or USD GJ⁻¹)
If multiple carriers are used (electricity, heat, natural gas) [82]:
2.2. Process Description and Technology Overview
Four thermochemical routes for biogas-to-hydrogen conversion were evaluated: Steam Reforming (SR), Dry Reforming (DR), Partial Oxidation (POX), and Autothermal Reforming (ATR) [83]. Their selection depends on process conditions, desired hydrogen yield, carbon management strategies, and integration potential with renewable heat or power sources.
Each pathway was modeled using literature-validated stoichiometric conversions and process efficiencies derived from recent techno-economic studies (2018–2026). The hydrogen yields, energy consumptions, and reactor conditions were harmonized to ensure comparability.
2.3. Techno-Economic Inputs
Comprehensive evaluation of biogas reforming pathways for hydrogen production, optimal operation at 750–1000 °C, methane conversions exceeding 90%, and techno-economic feasibility with 35–80% efficiencies and 4–8 year payback periods toward sustainable waste-to-hydrogen systems [63]. Table 2 summarizes the base-case techno-economic assumptions used for all four reforming technologies. Input data were compiled from peer-reviewed sources and recent techno-economic assessments, then cross-validated against the literature databases
2.4. Sensitivity Analysis Framework
A one-factor-at-a-time (OFAT) sensitivity analysis was conducted to evaluate the influence of key techno-economic parameters on LCOH [88]. Six variables, plant scale, feedstock cost, energy price, catalyst cost, capacity factor, and discount rate, were individually perturbed within the ranges listed in Table 2 while holding all others constant at their base values. The sensitivity coefficient was calculated according to [85]:
where, is the base-case cost, and is the parameter of interest. Positive values indicate direct proportionality (LCOH increases with parameter). The results were visualized as a six-panel sensitivity matrix (see Figure 8), allowing for the simultaneous comparison of parameter influence across all four reforming routes. This approach highlights which cost levers most strongly affect economic performance and guides optimization priorities.
2.5. Economic Scenario Analysis
To assess robustness under varying market conditions, four economic scenarios were defined [89]:
- Optimistic: Low feedstock and energy prices, high capacity factor, low discount rate (5%).
- Pessimistic: High feedstock and energy prices, low capacity factor, high discount rate (15%).
- High-Scale Scenario: 10× base plant capacity with moderate prices.
The LCOH for each scenario was calculated for all reforming routes, and relative technology rankings were determined to capture competitiveness across different market environments. Results are discussed in Section 3.5.
3. Results and Discussion
3.1. Key Performance Assessment Influencing Biogas-to-Hydrogen Conversion
The comparative evaluation of four major biogas reforming technologies, SR, DR, POX, and ATR, was conducted to assess their suitability for sustainable hydrogen production. The analysis included key performance indicators such as operating temperature, energy efficiency, methane conversion, hydrogen yield, and the hydrogen-to-carbon-monoxide ratio (H₂/CO).
3.1.1. Operating Temperature Ranges
Figure 4 presents the operating temperature ranges associated with the four major biogas reforming technologies: SR, DR, POX, and ATR. As shown in Figure 4, SR operates within a relatively wide temperature range of 600–900°C, reflecting the strong endothermicity of the steam methane reforming reaction and the need for substantial external heat input to sustain high catalytic activity. DR requires even higher temperatures, spanning 700–950 °C, due to the significant activation barrier associated with CO₂ participation in the reforming process; this elevated temperature regime is consistent with the thermodynamic limitations and slow intrinsic kinetics of CO₂ reforming. POX exhibits the same operational flexibility as SR (approximately 600–900 °C), but with reduced external heat demand owing to heat released through the partial oxidation of methane. ATR demonstrates a moderately high but narrower operating window of 700–900 °C, resulting from the intrinsic thermal balance achieved by coupling endothermic steam or CO₂ reforming with exothermic oxidation steps. This integrated heat management allows ATR to maintain stable temperatures without excessive external energy supply. Overall, the temperature profiles highlight the contrasting thermochemical characteristics of each reforming route: SR and DR are strongly heat-demanding processes requiring higher external energy input, whereas POX and, particularly, ATR benefit from internal heat generation, supporting improved thermal efficiency and greater operational stability.
3.1.2. Energy Efficiency Comparison
Figure 5a presents a comparative analysis of the overall energy (cold-gas) efficiency of the four biogas reforming technologies, defined as the ratio of the energy content of the hydrogen produced to that of the feedstock consumed. SR achieves the highest efficiency (75–85%): although it is endothermic and relies on external heat, it extracts hydrogen from both methane and steam and benefits from mature waste-heat recovery, so a large fraction of the feedstock energy is retained in the product. ATR performs comparably well (68–78%) because its internal coupling of exothermic oxidation and endothermic reforming removes the external-heat penalty while maintaining a high hydrogen output. POX is less efficient (60–72%): although it generates heat internally and needs no furnace, part of the feedstock is deliberately combusted, degrading chemical energy into heat and lowering the hydrogen yield per unit of methane. DR exhibits the lowest efficiency (55–68%), reflecting its strong endothermicity, the energy required for CO₂ activation, and the diluting effect of CO₂ in the feed. Overall, the results show that SR and ATR convert the largest fraction of input energy into hydrogen, whereas POX and, in particular, DR are penalized by combustion losses and high external-energy demand, respectively.
3.1.3. Hydrogen Yield
Figure 5b compares the hydrogen yield characteristics of the four biogas reforming pathways, highlighting significant variations arising from their underlying reaction mechanisms and thermodynamic drivers. SR exhibits the highest hydrogen production potential, yielding 2.5–3.0 mol H₂ per mol CH₄, attributable to the strong endothermicity of the steam–methane reforming reaction and the favorable shift in equilibrium toward hydrogen formation under high steam-to-carbon ratios. DR achieves moderate yields of 1.8–2.2 mol H₂ per mol CH₄, constrained by the stoichiometric limitation imposed by CO₂ as a reactant and the increased risk of carbon deposition that may suppress catalytic activity. POX delivers the lowest hydrogen output, ranging from 1.5–2.0 mol H₂ per mol CH₄, a result consistent with the incomplete oxidation of methane and the reduced participation of steam in hydrogen-forming reactions. ATR demonstrates a relatively broad and competitive yield range of 2.0–2.8 mol H₂ per mol CH₄, reflecting the synergistic interplay between exothermic oxidation and endothermic reforming pathways. This thermal integration promotes favorable reaction kinetics while maintaining high hydrogen productivity. Overall, the results indicate that SR remains the most effective route when maximum hydrogen generation is prioritized, whereas ATR provides an advantageous balance between hydrogen yield, thermal efficiency, and operational stability, making it particularly attractive for integrated and energy-flexible hydrogen systems.
3.1.4. H₂/CO Ratio Comparison
The comparative analysis of syngas quality across reforming technologies, as illustrated in the H₂/CO ratio plot, reveals distinct operational characteristics and product gas compositions. SR exhibits the highest H₂/CO ratio, ranging from 3.0 to 5.0, reflecting its strongly hydrogen-rich syngas output driven by the endothermic steam–methane reaction. In contrast, DR produces a significantly lower ratio of 0.8 to 1.2, consistent with its CO₂-utilizing pathway that inherently favors CO formation. POX generates intermediate values of 1.5 to 2.5, indicative of the balance between exothermic oxidation and reforming reactions that yield a moderately hydrogen-lean syngas. ATR, combining elements of POX and SR, presents a slightly broader intermediate range of 1.5 to 3.0, demonstrating its tunability depending on oxygen-to-carbon and steam-to-carbon ratios (see Figure 5c). Overall, Figure 5c highlights that SR is most suitable when high hydrogen production is required, whereas DR favors CO-rich synthesis gas, and both POX and ATR provide adjustable intermediate syngas compositions for flexible downstream applications.
Considered together, these performance indicators reveal complementary strengths across the pathways. SR excels in hydrogen yield, syngas quality, and energy efficiency, but requires the most external heat. POX offers fast kinetics and high methane conversion but a lower hydrogen output and lower energy efficiency. ATR achieves the most balanced overall performance, providing moderate-to-high values across all criteria, which underlines its versatility as a reforming route capable of meeting both technical and environmental requirements.
3.2. Environmental Impact Analysis
The environmental implications of each technology are summarized in Figure 6, which compares the global warming potential (GWP) of the four biogas reforming pathways. Steam biogas reforming (SR) exhibits the lowest carbon intensity, followed by dry biogas reforming (DR) and autothermal reforming (ATR), while partial oxidation (POx) shows the highest GWP. The ordering is governed principally by the hydrogen yield per unit of feedstock and by the external energy required to sustain each reaction, rather than by the direct process CO₂ balance alone; the reported ranges overlap appreciably for DR and ATR, so their relative position should be regarded as indicative.
In contrast to the fossil-fed benchmarks frequently cited in the literature, the values compiled here are drawn from life-cycle assessments of biogas-fed reforming. They are therefore directly comparable with one another. Bars denote the midpoint of each reported range and the error bars the reported minimum and maximum, reflecting genuine methodological variation between studies, principally differences in system boundary, in the treatment of biogenic carbon, in digestate fertilizer-displacement credits, and in the assumed electricity mix. The ranges should therefore be interpreted as indicative bands rather than as single deterministic values.
Steam biogas reforming achieves the lowest GWP of the four routes, at 5.59–6.50 kg CO₂-eq kg⁻¹ H₂ [90]. This advantage follows directly from its stoichiometry: because SR abstracts hydrogen from both methane and steam, it delivers the highest hydrogen yield per mole of methane (2.5–3.0 mol H₂ mol⁻¹ CH₄), so the process emissions are distributed across a larger quantity of product. Its life-cycle score is nonetheless sensitive to the hydrogen dilution effect associated with the CO₂ content of raw biogas and, in several studies, to upstream digestate fertilizer-displacement credits, which explains the width of the reported range.
Dry reforming records a GWP of 6.80–7.80 kg CO₂-eq kg⁻¹ H₂, ranking second behind steam reforming. The direct consumption of CO₂ in the reactor therefore does confer a measurable environmental benefit relative to the oxidation-based routes [62]. It is not, however, sufficient to make dry reforming the least carbon-intensive pathway, which qualifies an intuition frequently encountered in the literature, that a route consuming CO₂ must necessarily be the cleanest. Two counteracting effects explain why it does not overtake steam reforming.
First, the stoichiometry of dry reforming (CH₄ + CO₂ → 2CO + 2H₂) yields only about two moles of hydrogen per mole of methane, compared with three for steam reforming, so a given quantity of emissions is allocated across less hydrogen. Second, dry reforming is the most strongly endothermic of the four routes (ΔH₂₉₈ = +247 kJ mol⁻¹) and therefore imposes the largest external-heat demand; where that heat is supplied by combustion, the associated upstream emissions substantially erode the credit obtained from co-feeding CO₂. The CO₂ consumed by dry reforming may additionally be credited as an avoided or utilized emission when it is of biogenic or captured-anthropogenic origin, and the magnitude of that credit is strongly boundary- and accounting-dependent. Dry reforming thus retains genuine value as a carbon-utilization route, particularly where waste CO₂ streams and low-carbon process heat are available, and it outperforms both oxidation-based pathways on GWP. Under conventional life-cycle accounting, however, this benefit remains insufficient to displace steam reforming as the lowest-GWP option.
Autothermal reforming records a GWP of 7.24–7.89 kg CO₂-eq kg⁻¹ H₂, placing it third among the four routes and above dry reforming [91]. Although the internal coupling of exothermic oxidation and endothermic reforming removes the external-heat penalty, this thermal advantage is offset on a life-cycle basis by the substantial grid-electricity input required to operate the cryogenic air-separation unit that supplies pure oxygen. Where that electricity is drawn from a carbon-intensive grid, the associated upstream emissions contribute substantially to the life-cycle balance, and the thermal self-sufficiency that benefits ATR economically does not confer a corresponding environmental advantage.
Partial oxidation exhibits the highest GWP of the four routes, at 7.50–8.20 kg CO₂-eq kg⁻¹ H₂, because a portion of the feedstock is deliberately combusted and the hydrogen output per mole of feedstock is correspondingly lower, which inflates the emissions allocated to each kilogram of hydrogen; its range overlaps substantially with that of autothermal reforming [92]. Taken together, these results align the environmental ranking with the thermodynamic and economic findings of this study: steam reforming combines the highest hydrogen yield, the highest energy efficiency, the lowest levelized cost, and the lowest carbon intensity, and therefore emerges as the most favourable near-term route for biogas-derived hydrogen. Dry reforming ranks second on GWP and remains strategically relevant for carbon circularity. In contrast, autothermal reforming, despite its thermal flexibility and favourable efficiency, is penalized environmentally by its oxygen-supply electricity demand.
3.3. Economic Feasibility and Levelized Cost Analysis
A techno-economic evaluation was conducted for the four biogas-based hydrogen production pathways (SR, DR, POX, and ATR). Figure 7 presents the levelized cost of hydrogen (LCOH) and its cost composition, while Figure 8 presents the parameter-sensitivity analysis.
3.3.1. Levelized Cost of Hydrogen (LCOH) Comparison by Technology
The LCOH values, as shown in Figure 7a, range from approximately $4.2 to $6.0 per kilogram of hydrogen, reflecting the combined influence of capital and operational expenditures. Despite its substantial external-heat requirement, Steam Reforming achieves the lowest levelized cost, owing to its high hydrogen yield, mature reactor design, and moderate capital intensity. Partial Oxidation follows closely, benefiting from internal heat generation, whereas Autothermal Reforming incurs a modestly higher cost because of its oxygen-supply and process-integration demands. Dry Reforming is the most expensive pathway, penalized by its high energy demand and catalyst-deactivation risks. This ordering, SR < POX < ATR < DR, is confirmed by the probabilistic analysis in Section 3.4.
3.3.2. Cost Structure and Scale Cost Dynamics Analysis
The cost breakdown analysis presented in Figure 7b reveals that the Levelized Cost of Hydrogen (LCOH) is predominantly driven by fixed infrastructure expenses rather than variable feedstock or energy costs across all four reforming technologies. Specifically, the combined share of Capital Expenditures (CAPEX) and Operations and Maintenance (O&M) exceeds 65% for all evaluated pathways. This dominance of fixed costs is scientifically justified by the diseconomies of scale inherent to decentralized chemical processing, often described by the "six-tenths rule". At the modeled capacity, the cost denominator (mass of H2 produced) is small relative to the baseline expense of essential unit operations such as Pressure Swing Adsorption (PSA) units and compressors, which possess high minimum cost thresholds regardless of plant throughput. Consequently, the relative impact of feedstock prices is compressed, resulting in CAPEX-dominated profiles where feedstock contributes only 15% to 22% of the total LCOH.
Among the specific technologies, Dry Reforming (DR) is the most capital-intensive, with CAPEX accounting for 46% of the total cost, compared to 42% for Steam Reforming (SR). This economic disparity is rooted in reaction stoichiometry and thermodynamics: while SR (CH₄ + H₂O → CO + 3H₂) yields three moles of hydrogen per mole of methane, DR (CH₄ + CO₂ → 2CO + 2H₂) yields only two. Therefore, to achieve parity in hydrogen output, DR systems require significantly higher volumetric throughput, necessitating larger reactor sizing. Furthermore, the highly endothermic nature of DR and its susceptibility to catalyst deactivation via carbon deposition (Boudouard reaction) necessitates the use of specialized, cost-intensive alloy reactors and frequent catalyst regeneration, driving the O & M share to a high of 33%.
In contrast, Partial Oxidation (POX) displays the lowest relative capital burden at 38%, a structural advantage attributed to its exothermic reaction mechanism. The exothermicity eliminates the need for complex external heating furnaces and heat transfer surfaces required in endothermic SR and DR processes, thereby reducing the initial investment outlay. However, this CAPEX advantage is partially offset by a lower hydrogen yield per unit of fuel, which results in the highest relative feedstock cost share (22%) among the studied technologies. Ultimately, these results suggest that while feedstock optimization remains relevant for exothermic pathways like POX, the primary route to economic viability for endothermic pathways (SR and DR) at this scale lies in technological innovations that mitigate reactor complexity and extend catalyst lifespans to lower the dominant fixed burdens.
3.4. Parameter Sensitivity Analysis Matrix- LCOH Analysis
As shown in Figure 8(a–f), a comprehensive parameter sensitivity analysis was conducted to evaluate the relative influence of six key techno-economic parameters on the Levelized Cost of Hydrogen (LCOH, USD kg⁻¹ H₂) for four major thermochemical hydrogen production pathways: Steam Reforming (SR), Dry Reforming (DR), Partial Oxidation (POX), and Autothermal Reforming (ATR). Each subplot isolates one parameter while maintaining all others constant, thereby revealing the individual and comparative responses of each technology to variations in economic and operational conditions. Overall, the results depict nearly linear trends across all parameters, indicating predictable and proportionate behavior within the examined range. This matrix not only quantifies the relative sensitivities but also provides valuable insights into the most influential levers for cost reduction and process optimization in hydrogen production.
3.4.1. Sensitivity to Plant Scale
As illustrated in Figure 8a, the LCOH decreases consistently with increasing plant scale for all four pathways, reflecting the classical economies of scale whereby per-unit capital cost is amortized over greater output. The effect is strongest for the oxygen-based routes (POX and ATR) and for DR: their air-separation units and severe-duty equipment make them the most capital-intensive configurations and therefore the greatest beneficiaries of scale-up. SR, which requires no air-separation unit and operates under milder conditions, is the least capital-intensive route and exhibits the shallowest scale dependence; its cost advantage is consequently largest at the small, decentralized capacities typical of biogas plants. These results indicate that capacity expansion, modular integration, or clustering strategies are most decisive for the oxygen-based and dry-reforming routes, whereas SR remains comparatively economical even at modest scale.
3.4.2. Sensitivity to Feedstock Cost
The influence of biogas feedstock cost on LCOH is presented in Figure 8b, where a positive linear relationship is evident for all routes. Crucially, the gradient scales inversely with hydrogen yield: POX and DR, which produce the least hydrogen per mole of methane (1.5–2.0 and 1.8–2.2 mol H₂ mol⁻¹ CH₄, respectively), consume the most biogas per kilogram of hydrogen and are therefore the most exposed to feedstock-price fluctuations. SR, with the highest yield (2.5–3.0 mol H₂ mol⁻¹ CH₄), is the least feedstock-sensitive, reinforcing its economic resilience where biogas prices are variable. This highlights the value of a stable, low-cost biogas supply, secured through long-term contracts or waste-derived inputs, particularly for the lower-yield POX and DR routes.
3.4.3. Sensitivity to Energy Price
As shown in Figure 8c, LCOH increases linearly with energy price for all routes, but the slope tracks each pathway's external-energy demand. The strongly endothermic routes, DR (ΔH₂₉₈ = +247 kJ mol⁻¹) and SR (+206 kJ mol⁻¹), require the largest external heat input and are the most sensitive to rising energy prices. POX, being exothermic, supplies much of its own process heat and is the least energy-sensitive, while ATR occupies an intermediate position through its internally balanced thermal duty, its oxygen-supply electricity partially offsetting its low net heat demand. Energy-cost mitigation through process-heat recovery, renewable electricity, or waste-heat integration is therefore most valuable for the DR and SR routes.
3.4.4. Sensitivity to Catalyst Cost
The effect of catalyst cost is depicted in Figure 8d, where all routes exhibit only a mild positive slope, confirming that catalyst cost exerts a secondary influence on hydrogen economics within the examined range. DR shows the highest sensitivity, consistent with its severe reaction environment and rapid coking-induced deactivation, which shorten catalyst life and raise replacement frequency. Even so, the LCOH variation remains small for all routes, implying that catalyst innovation will yield incremental rather than transformative cost benefits; its greater value lies in improving durability and coke resistance, reducing replacement frequency and downtime, rather than in direct cost reduction, an effect especially relevant to DR.
3.4.5. Sensitivity to Capacity Factor
The relationship between capacity factor and hydrogen cost, presented in Figure 8e, is a distinct negative correlation: as utilization rises, fixed costs are spread over more output, and LCOH falls. Consistent with the scale results, the effect is most pronounced for the capital-intensive oxygen-based routes (ATR and POX) and DR, and least pronounced for SR. High plant availability is therefore especially critical for these routes and for hydrogen systems coupled to intermittent renewable supply, where low or variable utilization would disproportionately inflate production costs; maintaining high availability through efficient scheduling and, where appropriate, storage integration is a key strategy to stabilize LCOH.
3.4.6. Sensitivity to Discount Rate
The final subplot, Figure 8f, examines the effect of discount rate. As anticipated, a higher discount rate raises LCOH for all routes by increasing the annualized cost of capital recovery. The magnitude follows capital intensity: the oxygen-based routes and DR, with larger capital bases, are somewhat more exposed, whereas SR, the least capital-intensive route, shows the lowest sensitivity. This emphasizes the importance of financing conditions: access to low-interest capital, loan guarantees, and stable investment frameworks materially improves project bankability, with the greatest leverage for the more capital-intensive pathways.
The sensitivity analysis in Figure 8 provides a holistic view of how economic and operational parameters jointly shape hydrogen production cost. Plant scale and capacity factor emerge as the dominant levers: consistent with the six-tenths capital-scaling rule, an order-of-magnitude increase in plant scale lowers LCOH by roughly one-third, and higher capacity factors yield further fixed-cost savings, whereas catalyst cost exerts the least influence. The largely linear response to feedstock, energy, and discount-rate variation permits straightforward extrapolation and clear prioritization.
A consistent pattern emerges across parameters: SR is the most economically resilient route, least sensitive to scale, capacity factor, feedstock price, and financing cost, owing to its high hydrogen yield and comparatively low capital intensity, and is exposed mainly to energy price through its endothermic heat demand. DR is the most energy-exposed route; the oxygen-based POX and ATR are the most capital- and utilization-sensitive; and POX is additionally the most feedstock-exposed by virtue of its low yield. Economically sustainable biogas-to-hydrogen production therefore requires an integrated approach that matches each pathway to the cost drivers to which it is most exposed, alongside stable feedstock supply, high plant utilization, and favourable financing.
3.5. Monte Carlo Simulation: LCOH Uncertainty Analysis
To reflect the uncertainty that naturally arises in techno-economic assessments, a Monte Carlo simulation was carried out for each of the biogas reforming pathways. The five most influential inputs were treated as independent random variables, with distributions and bounds taken from Table 2: the biogas feedstock price as a triangular distribution (minimum 0.10, mode 0.25, maximum 0.40 USD Nm⁻³), the energy (heat/electricity) cost as triangular (0.04, 0.07, 0.12 USD kWh⁻¹), the CH₄-to-H₂ conversion efficiency as a normal distribution about each technology’s base value with a standard deviation of 5%, the discount rate as uniform over 5–15%, and the capacity factor as triangular (60, 90, 95%). Each pathway was simulated over 10,000 iterations with independent random sampling, producing a full range of possible LCOH outcomes. The resulting frequency distributions for SR, DR, POX, and ATR, together with their mean and P10–P90 values, are shown in Figure 9.
The SR cost distribution is close to a normal curve (Figure 9a), centered at a mean LCOH of $5.21/kg H₂ with a P10 of $4.32 and P90 of $6.10. The relatively narrow spread indicates that SR is less sensitive to parameter changes than the other routes. Most of the remaining variation is tied to fluctuations in biogas and energy prices. The nearly symmetric distribution also reflects SR’s long industrial history and predictable performance, even though its reliance on external heat still limits opportunities for major cost reductions.
The DR results show a wider and more right-skewed distribution (Figure 9b), with a mean LCOH of $6.10/kg H₂, P10 at $5.08, and P90 at $7.22. This broader spread indicates higher economic uncertainty, driven mainly by the high energy demand of DR and the effect of CO₂-rich feed compositions. The skew toward higher costs suggests a stronger likelihood of economically unfavorable scenarios. Improvements in heat integration and better strategies for CO₂ recycling could help reduce this variability in future systems. POX displays a relatively compact and symmetric distribution (Figure 9c), with a mean cost of $5.47/kg H₂, P10 of $4.57, and P90 of $6.41. These results point to moderate uncertainty and stable overall cost behavior. Because POX generates much of its required heat internally, it is less exposed to energy-price volatility, which contributes to its balanced cost profile.
ATR shows a mean LCOH of $5.82/kg H₂ (Figure 9c), with P10 at $4.90 and P90 at $6.72. Like POX and SR, ATR’s distribution is relatively tight and almost symmetric, indicating good economic resilience. By combining endothermic and exothermic reactions within the same reactor, ATR maintains a more stable heat balance, which helps buffer costs against variations in fuel composition or energy prices. Taken together, the results show that Steam Reforming offers the most favorable combination of the lowest mean LCOH ($5.21/kg H₂) and the narrowest uncertainty band, with Partial Oxidation ($5.47/kg H₂) a close second. Autothermal Reforming, although thermally flexible, carries a higher mean cost ($5.82/kg H₂), while Dry Reforming ($6.10/kg H₂) shows the highest economic risk owing to its dependence on high-temperature operation and sensitivity to feed composition.
From a probabilistic perspective, Steam Reforming is the most economically stable pathway, exhibiting both the lowest mean cost and the tightest distribution (P10–P90 of $4.32–6.10/kg H₂). Autothermal Reforming remains attractive for its thermal self-sufficiency and operational flexibility, but its wider cost spread ($4.90–6.72/kg H₂) makes it less predictable than SR or POX. Overall, SR combines cost leadership with the highest hydrogen yield, whereas ATR trades some cost predictability for thermal flexibility. When the deterministic and probabilistic results are considered together, a clear hierarchy emerges. Steam Reforming is the cost leader and industrial reference point, pairing the lowest LCOH with the highest hydrogen yield and the most predictable economics. Partial Oxidation is a close second on cost, though with moderate energy efficiency. Autothermal Reforming offers the greatest operational flexibility through internal heat integration but at a higher and more variable cost, while Dry Reforming provides CO₂-utilization benefits yet remains constrained by the highest operating cost and economic risk.
These outcomes suggest that near-term biogas-to-hydrogen deployment should build on Steam Reforming for its cost leadership, while Autothermal Reforming and Partial Oxidation merit attention where thermal flexibility or high efficiency is prioritized; Dry Reforming is best positioned as a longer-term, CO₂-valorizing option contingent on improved catalyst durability. Across all routes, supportive measures such as carbon credits, low-carbon hydrogen incentives, and renewable-gas tariffs could improve competitiveness and facilitate broader deployment as part of a low-carbon energy transition.
3.6. Current Challenges and Future Research Directions
Despite their promise, biogas reforming pathways face several barriers to large-scale deployment. The foremost is catalyst deactivation under real biogas conditions: nickel-based catalysts suffer carbon deposition, driven by methane cracking and the Boudouard reaction, and most severe in dry reforming, together with sulfur poisoning and siloxane fouling from biogas-specific impurities, and thermal sintering [9]. Closely related is thermal management, since the strongly endothermic steam and dry reforming reactions (ΔH₂₉₈ = +206 and +247 kJ mol⁻¹) require large external heat inputs that create hot spots and accelerate degradation, whereas partial oxidation and autothermal reforming ease this demand only at the cost of precise oxygen control.
Three further constraints compound these issues. Biogas composition varies on daily timescales, forcing reliance on upstream gas cleaning whose cost scales unfavourably at small capacity; syngas conditioning (water–gas shift, H₂/CO adjustment, and purification) adds parasitic energy and hydrogen losses that differ by pathway; and, as the sensitivity analysis in Section 3.4 showed, the sub-commercial scale of most biogas plants precludes the economies of scale enjoyed by conventional reformers. Consistent with the cost results of this study, biogas-derived hydrogen therefore remains more expensive than fossil-based hydrogen in the absence of carbon pricing or low-carbon-hydrogen incentives.
Overcoming these barriers will require advances on several fronts. Coke- and sulfur-tolerant catalysts, bimetallic Ni formulations promoted with noble metals, and basic, oxygen-mobile supports such as CeO₂–ZrO₂ or La₂O₃, are the highest priority, validated by long-duration testing under realistic, impurity-containing biogas rather than model mixtures [93]. In parallel, reactor and process intensification (microchannel, membrane, sorption-enhanced, and chemical-looping reforming) can raise conversion and hydrogen purity while lowering operating temperature [94] and coupling reforming with electrified or solar heating would decarbonize its endothermic heat demand.
Because reforming yields concentrated, largely biogenic CO₂, integration with carbon capture and utilization offers a route toward near-zero or net-negative emissions, although its net benefit is boundary-dependent and must be confirmed by rigorous life-cycle analysis. At the system level, harmonized techno-economic and life-cycle frameworks, such as that applied here, should be extended with pilot-plant data to replace literature-compiled parameters and to identify where each pathway is genuinely competitive. Realizing this potential will require sustained academia–industry–policy collaboration; provided the barriers identified above are resolved, biogas reforming remains a credible route to low-carbon hydrogen for decentralized and industrial applications.
4. Conclusions
This study evaluated four biogas reforming routes, steam reforming (SR), dry reforming (DR), partial oxidation (POX), and autothermal reforming (ATR), within a single, consistent techno-economic and environmental assessment framework, applying common system boundaries, cost methodology, and uncertainty analysis to the route-specific thermodynamic and operating parameters of each pathway, so that their trade-offs could be judged on a common basis rather than across the disparate boundaries of the existing literature. The central result is that steam reforming is not merely competitive but simultaneously optimal on four independent metrics: it delivers the highest hydrogen yield (2.5–3.0 mol H₂ per mol CH₄), the highest energy efficiency (75–85 %), the lowest levelized cost, and the lowest life-cycle global warming potential (5.59–6.50 kg CO₂-eq per kg H₂). It is this convergence, rather than any single figure of merit, that establishes SR as the reference pathway. The remaining routes occupy defensible niches: ATR exploits the internal coupling of oxidation and reforming to achieve thermal self-sufficiency and a tunable H₂/CO ratio; POX provides rapid, oxygen-driven conversion at lower efficiency; and DR alone consumes CO₂, yet its strong endothermicity (ΔH₂₉₈ = +247 kJ mol⁻¹) and low hydrogen yield prevent that consumption from translating into the lowest carbon intensity, while coking remains its defining operational liability.
Quantifying uncertainty through a 10,000-iteration Monte Carlo simulation preserved this ranking on a probabilistic basis: the mean levelized cost of hydrogen rises in the order SR ($5.21 kg⁻¹) < POX ($5.47 kg⁻¹) < ATR ($5.82 kg⁻¹) < DR ($6.10 kg⁻¹), and SR additionally shows the narrowest cost distribution, making it at once the cheapest and the least financially exposed option. Plant scale and capacity factor, not feedstock or energy price, emerged as the dominant cost levers, which explains both why decentralized biogas plants are economically penalized and why only an optimistic large-scale scenario drives the projected cost toward $3.5–4.0 kg⁻¹ H₂. Even in that best case, every biogas route remains above the sub-$2 kg⁻¹ cost of conventional grey steam methane reforming. The implication is therefore unambiguous: biogas-derived hydrogen will not undercut fossil hydrogen on cost, and its deployment case rests on monetizing its waste-valorization and low-carbon attributes through carbon pricing, low-carbon-hydrogen incentives, or long-term offtake agreements.
Two conclusions follow for technology selection and future work. First, the choice of pathway should be application-driven rather than universal, SR where yield, cost, and emissions are jointly decisive; ATR where thermal flexibility or a specific syngas ratio is required; POX where reactor compactness matters; and DR where an accessible CO₂ stream and low-carbon process heat make carbon utilization the governing objective. Second, across all four routes the binding constraint is identical: catalyst stability against sulfur poisoning, carbon deposition, and sintering under realistic biogas. Progress consequently depends less on the reforming chemistry itself than on impurity-tolerant catalysts of reduced critical-material content, heat-integrated reactor designs that hold thermal balance under a fluctuating feed, and life-cycle-verified CO₂ management. The harmonized techno-economic and environmental framework developed here supplies a consistent basis for that effort; its immediate next step is to replace the literature-derived parameters used in this analysis with operating data from biogas reforming pilot plants.
Author Contributions
Conceptualization, M.A. M.L., and K.P.; methodology, M.A., M.L., and K.P.; formal analysis, M.A.; investigation, M.A.; resources, K.P. and B.G.; writing—original draft preparation, M.A.; writing—review and editing, M.A., M.L., and P.K.; visualization, M.A. and K.P.; software, M.A.; validation, M.A.; supervision, K.P. and M.L.; funding acquisition, K.P.; All authors have read and agreed to the published version of the manuscript.
Funding
For the study, financial support was received from Silesian University of Technology. The publication was funded by the 2026 research subsidy (08/030/BK_26/0178).
Institutional Review Board Statement
Not applicable.
Informed Consent Statement
Not applicable.
Data Availability Statement
The original contributions presented in this study are included in the article. Further inquiries can be directed to the corresponding author.
Acknowledgments
The authors would like to express their gratitude to the Silesian University of Technology for its financial support and provision of research materials. During the preparation of this manuscript, the authors used a generative AI assistant (a large language model) to support language editing and internal consistency checking.
Conflicts of Interest
The authors declare no conflicts of interest.
Abbreviations
The following abbreviations are used in this manuscript:
| SMR | Steam methane reforming |
| SR | Steam reforming |
| DR | Dry reforming |
| POX | Partial oxidation |
| ATR | Autothermal reforming |
| LCOH | Levelized cost of hydrogen |
| LCA | Life-cycle assessment |
| TEA | Techno-economic analysis |
| CCU | Carbon capture, utilization |
| CCUS | Carbon capture, utilization, and storage |
| IEA | International Energy Agency |
| IRENA | International Renewable Energy Agency |
| AD | Anaerobic digestion |
| SRT | Solids retention time |
| HRT | Hydraulic retention time |
| OLR | Organic loading rate |
| CSTR | Continuous stirred tank reactor |
| UASB | Up-flow anaerobic sludge blanket |
| MOF | Metal-organic frameworks |
| OFAT | one-factor-at-a-time |
| CAPEX PSA |
Capital expenditures Pressure Swing Adsorption |
| O&M | Operation and Maintenance |
| NPV | Negative net present values |
References
- Zeng, Q.; Li, C.; Magazzino, C. Impact of Green Energy Production for Sustainable Economic Growth and Green Economic Recovery. Heliyon 2024, 10, e36643. [Google Scholar] [CrossRef] [PubMed]
- Hassan, Q.; Viktor, P.; J. Al-Musawi, T.; Mahmood Ali, B.; Algburi, S.; Alzoubi, H.M.; Khudhair Al-Jiboory, A.; Zuhair Sameen, A.; Salman, H.M.; Jaszczur, M. The Renewable Energy Role in the Global Energy Transformations. Renew. Energy Focus 2024, 48, 100545. [Google Scholar] [CrossRef]
- Wang, Z.; Li, S.; Jin, Z.; Li, Z.; Liu, Q.; Zhang, K. Oil and Gas Pathway to Net-Zero: Review and Outlook. Energy Strategy Rev. 2023, 45, 101048. [Google Scholar] [CrossRef]
- Chen, Y.; Dong, S.; Qian, S.; Chung, K. Impact of Oil Price Volatility and Economic Policy Uncertainty on Business Investment - Insights from the Energy Sector. Heliyon 2024, 10, e26533. [Google Scholar] [CrossRef] [PubMed]
- Bisht, G.S.; Pandey, S. Biofuels for a Sustainable Future: Generations, Technologies, and Key Challenges in Renewable Energy. Bioenerg. Res. 2025, 18, 43. [Google Scholar] [CrossRef]
- Vidas, L.; Castro, R. Recent Developments on Hydrogen Production Technologies: State-of-the-Art Review with a Focus on Green-Electrolysis. Appl. Sci. 2021, 11, 11363. [Google Scholar] [CrossRef]
- Ferraren-De Cagalitan, D.D.T.; Abundo, M.L.S. A Review of Biohydrogen Production Technology for Application towards Hydrogen Fuel Cells. Renew. Sustain. Energy Rev. 2021, 151, 111413. [Google Scholar] [CrossRef]
- A Review on the Use of Catalysis for Biogas Steam Reforming. Available online: https://www.mdpi.com/2073-4344/13/12/1482 (accessed on 3 November 2025).
- Hu, W.; Wu, J.; Huang, Z.; Tan, H.; Tang, Y.; Feng, Z.; Deng, R.; Zhang, H.; Zairov, R.; Pan, Z. Catalyst Development for Biogas Dry Reforming: A Review of Recent Progress. Catalysts 2024, 14, 494. [Google Scholar] [CrossRef]
- Wodołażski, A.; Magdziarczyk, M.; Smoliński, A. Techno-Economic Analysis of Hydrogen Production from Swine Manure Biogas via Steam Reforming in Pilot-Scale Installation. Energies 2023, 16, 6389. [Google Scholar] [CrossRef]
- Nikolaidis, P.; Poullikkas, A. A Comparative Overview of Hydrogen Production Processes. Renew. Sustain. Energy Rev. 2017, 67, 597–611. [Google Scholar] [CrossRef]
- Yu, M.; Wang, K.; Vredenburg, H. Insights into Low-Carbon Hydrogen Production Methods: Green, Blue and Aqua Hydrogen. Int. J. Hydrogen Energy 2021, 46, 21261–21273. [Google Scholar] [CrossRef]
- Economic and Environmental Comparison of Blue and Grey Hydrogen Production - Aras Energy 2025
- Carbon Capture and Sequestration (CCS) in the United States. Available online: https://www.congress.gov/crs-product/R44902 (accessed on 10 November 2025).
- Rashid, M.I.; Benhelal, E.; Rafiq, S. Reduction of Greenhouse Gas Emissions from Gas, Oil, and Coal Power Plants in Pakistan by Carbon Capture and Storage (CCS): A Review. Chem. Eng. Technol. 2020, 43, 2140–2148. [Google Scholar] [CrossRef]
- Proost, J. Critical Assessment of the Production Scale Required for Fossil Parity of Green Electrolytic Hydrogen. Int. J. Hydrogen Energy 2020, 45. [Google Scholar] [CrossRef]
- Jolly, S.S.; Twinkle, A.R.; Arun Sasi, B.S.; Reshma, R. Emerging Paradigms in Renewable Hydrogen Production: Technology, Challenges, and Global Impact. Next Energy 2025, 8, 100343. [Google Scholar] [CrossRef]
- Li, X.; Raorane, C.J.; Xia, C.; Wu, Y.; Tran, T.K.N.; Khademi, T. Latest Approaches on Green Hydrogen as a Potential Source of Renewable Energy towards Sustainable Energy: Spotlighting of Recent Innovations, Challenges, and Future Insights. Fuel 2023, 334, 126684. [Google Scholar] [CrossRef]
- Ajanovic, A.; Sayer, M.; Haas, R. The Economics and the Environmental Benignity of Different Colors of Hydrogen. Int. J. Hydrogen Energy 2022, 47, 24136–24154. [Google Scholar] [CrossRef]
- Cho, H.H.; Strezov, V.; Evans, T.J. A Review on Global Warming Potential, Challenges and Opportunities of Renewable Hydrogen Production Technologies. Sustain. Mater. Technol. 2023, 35, e00567. [Google Scholar] [CrossRef]
- Xu, D.; Huang, Y.; Ma, Q.; Qiao, J.; Guo, X.; Wu, Y. A 3D Porous Structured Cellulose Nanofibrils-Based Hydrogel with Carbon Dots-Enhanced Synergetic Effects of Adsorption and Photocatalysis for Effective Cr(VI) Removal. Chem. Eng. J. 2023, 456, 141104. [Google Scholar] [CrossRef]
- Nadaleti, W.C.; Lourenço, V.A.; Americo, G. Green Hydrogen-Based Pathways and Alternatives: Towards the Renewable Energy Transition in South America’s Regions – Part A. Int. J. Hydrogen Energy 2021, 46, 22247–22255. [Google Scholar] [CrossRef]
- Karmaker, S.C.; Chapman, A.; Sen, K.K.; Hosan, S.; Saha, B.B. Renewable Energy Pathways toward Accelerating Hydrogen Fuel Production: Evidence from Global Hydrogen Modeling. Sustainability 2023, 15, 588. [Google Scholar] [CrossRef]
- Adaikalam, K.; Vikraman, D.; Karuppasamy, K.; Kim, H.-S. Solar Hydrogen Production and Storage in Solid Form: Prospects for Materials and Methods. Nanomaterials 2024, 14, 1560. [Google Scholar] [CrossRef] [PubMed]
- Aimikhe, V.J.; Eyankware, O.E. Recent Advances in White Hydrogen Exploration and Production: A Mini Review. J. Energy Res. Rev. 2023, 13, 64–79. [Google Scholar] [CrossRef]
- Abd, A.A.; Othman, M.R.; Majdi, H.S.; Helwani, Z. Green Route for Biomethane and Hydrogen Production via Integration of Biogas Upgrading Using Pressure Swing Adsorption and Steam-Methane Reforming Process. Renew. Energy 2023, 210, 64–78. [Google Scholar] [CrossRef]
- Hrycak, B.; Mizeraczyk, J.; Czylkowski, D.; Dors, M.; Budnarowska, M.; Jasiński, M. Hydrogen Production by the Steam Reforming of Synthetic Biogas in Atmospheric-Pressure Microwave (915 MHz) Plasma. Sci. Rep. 2023, 13, 2204. [Google Scholar] [CrossRef] [PubMed]
- Gnanapragasam, N.V.; Rosen, M.A. A Review of Hydrogen Production Using Coal, Biomass and Other Solid Fuels. Biofuels 2017, 8, 725–745. [Google Scholar] [CrossRef]
- Hossain Bhuiyan, M.M.; Siddique, Z. Hydrogen as an Alternative Fuel: A Comprehensive Review of Challenges and Opportunities in Production, Storage, and Transportation. Int. J. Hydrogen Energy 2025, 102, 1026–1044. [Google Scholar] [CrossRef]
- Behera, U.; Purohit, B.; Byun, H.-S. A Comprehensive Review of Fossil-Based Hydrogen Production: Technological Integrations, Environmental Sustainability, and Economic Viability. Int. J. Hydrogen Energy 2025, 140. [Google Scholar] [CrossRef]
- Braga, L.B.; Silveira, J.L.; da Silva, M.E.; Tuna, C.E.; Machin, E.B.; Pedroso, D.T. Hydrogen Production by Biogas Steam Reforming: A Technical, Economic and Ecological Analysis. Renew. Sustain. Energy Rev. 2013, 28, 166–173. [Google Scholar] [CrossRef]
- Camacho, Y.S.M.; Bensaid, S.; Fino, D.; Trimis, D.; Herrmann, A.; Guilhaume, N.; Schuurman, Y.; Konsatndopoulos, A.G.; Lorentzou, S.; Gianella, S.; et al. Biogas Robust. Process. With Comb. Catal. Reform. Trap BioRobur Proj. 2015, 463–474.
- Rosa, L.; Mazzotti, M. Potential for Hydrogen Production from Sustainable Biomass with Carbon Capture and Storage. Renew. Sustain. Energy Rev. 2022, 157, 112123. [Google Scholar] [CrossRef]
- Global Hydrogen Review 2026 – Analysis. Available online: https://www.iea.org/reports/global-hydrogen-review-2026 (accessed on 19 July 2026).
- Global Energy Perspective 2023: Hydrogen Outlook | McKinsey. Available online: https://www.mckinsey.com/industries/oil-and-gas/our-insights/global-energy-perspective-2023-hydrogen-outlook?utm_source=chatgpt.com (accessed on 14 November 2025).
- Akram, F.; Fatima, T.; Ibrar, R.; ul Haq, I. Biohydrogen: Production, Promising Progressions and Challenges of a Green Carbon-Free Energy. Sustain. Energy Technol. Assess. 2024, 69, 103893. [Google Scholar] [CrossRef]
- Lou, Y.; Fan, Z.; Friedmann, D.J.; Corbeau, A.-S.; Agrawal, M.; Khatri, A. THE POTENTIAL ROLE OF BIOHYDROGEN IN CREATING A NET-ZERO WORLD: THE PRODUCTION AND APPLICATIONS OF CARBON-NEGATIVE HYDROGEN. [CrossRef] [PubMed]
- Prasanna Kumar, D.J.; Mishra, R.K.; Chinnam, S.; Binnal, P.; Dwivedi, N. A Comprehensive Study on Anaerobic Digestion of Organic Solid Waste: A Review on Configurations, Operating Parameters, Techno-Economic Analysis and Current Trends. Biotechnol. Notes 2024, 5, 33–49. [Google Scholar] [CrossRef] [PubMed]
- Alengebawy, A.; Ran, Y.; Osman, A.I.; Jin, K.; Samer, M.; Ai, P. Anaerobic Digestion of Agricultural Waste for Biogas Production and Sustainable Bioenergy Recovery: A Review. Env. Chem. Lett. 2024, 22, 2641–2668. [Google Scholar] [CrossRef]
- Francisco López, A.; Lago Rodríguez, T.; Faraji Abdolmaleki, S.; Galera Martínez, M.; Bello Bugallo, P.M. From Biogas to Biomethane: An In-Depth Review of Upgrading Technologies That Enhance Sustainability and Reduce Greenhouse Gas Emissions. Appl. Sci. 2024, 14, 2342. [Google Scholar] [CrossRef]
- Zielińska, M.; Bułkowska, K. Sustainable Management and Advanced Nutrient Recovery from Biogas Energy Sector Effluents. Energies 2024, 17, 3705. [Google Scholar] [CrossRef]
- Sher, F.; Smječanin, N.; Hrnjić, H.; Karadža, A.; Omanović, R.; Šehović, E.; Sulejmanović, J. Emerging Technologies for Biogas Production: A Critical Review on Recent Progress, Challenges and Future Perspectives. Process Saf. Environ. Prot. 2024, 188, 834–859. [Google Scholar] [CrossRef]
- Alengebawy, A.; Ran, Y.; Abdelkhalek, S.T.; Mahrous, T.; Ragheb, A.; Samer, M.; Ai, P. A Comprehensive Review of the Key Factors Affecting Biogas Production From Anaerobic Digestion of Organic Waste. CleanMat 2026, 3, 74–98. [Google Scholar] [CrossRef]
- Galloni, M.; Di Marcoberardino, G. Biogas Upgrading Technology: Conventional Processes and Emerging Solutions Analysis. Energies 2024, 17, 2907. [Google Scholar] [CrossRef]
- DelaVega-Quintero, J.C.; Nuñez-Pérez, J.; Lara-Fiallos, M.; Barba, P.; Burbano-García, J.L.; Espín-Valladares, R. Advances and Challenges in Anaerobic Digestion for Biogas Production: Policy, Technological, and Microbial Perspectives. Processes 2025, 13, 3648. [Google Scholar] [CrossRef]
- Vali, S.A.; Moral-Vico, J.; Font, X.; Sánchez, A. Adsorptive Removal of Siloxanes from Biogas: Recent Advances in Catalyst Reusability and Water Content Effect. Biomass Conv. Bioref. 2024, 14, 23259–23273. [Google Scholar] [CrossRef]
- Deena, S.R.; Vickram, A.S.; Manikandan, S.; Subbaiya, R.; Karmegam, N.; Ravindran, B.; Chang, S.W.; Awasthi, M.K. Enhanced Biogas Production from Food Waste and Activated Sludge Using Advanced Techniques – A Review. Bioresour. Technol. 2022, 355, 127234. [Google Scholar] [CrossRef] [PubMed]
- Martín-Sanz-Garrido, C.; Revuelta-Aramburu, M.; Santos-Montes, A.M.; Morales-Polo, C. A Review on Anaerobic Digestate as a Biofertilizer: Characteristics, Production, and Environmental Impacts from a Life Cycle Assessment Perspective. Appl. Sci. 2025, 15, 8635. [Google Scholar] [CrossRef]
- Nayak, J.K.; Ranade, V.V. Valorisation of Digestate: Characteristics, Products, Processes and Potential. Chem. Eng. J. Adv. 2025, 24, 100887. [Google Scholar] [CrossRef]
- Where in the World Is Biogas? A New IEA Tool Maps Its Potential – Analysis. Available online: https://www.iea.org/commentaries/where-in-the-world-is-biogas-a-new-iea-tool-maps-its-potential (accessed on 20 July 2026).
- Pilarski, K.; Pilarska, A.A. Kinetics and Energy Yield in Anaerobic Digestion: Effects of Substrate Composition and Fundamental Operating Conditions. Energies 2025, 18, 6262. [Google Scholar] [CrossRef]
- Iweka, S.C.; Owuama, K.C.; Chukwuneke, J.L.; Falowo, O.A. Optimization of Biogas Yield from Anaerobic Co-Digestion of Corn-Chaff and Cow Dung Digestate: RSM and Python Approach. Heliyon 2021, 7, e08255. [Google Scholar] [CrossRef] [PubMed]
- Hydrogen Production by Biogas Steam Reforming: A Technical, Economic and Ecological Analysis. Available online: https://www.researchgate.net/publication/281109219_Hydrogen_production_by_biogas_steam_reforming_A_technical_economic_and_ecological_analysis (accessed on 6 November 2025).
- Monteiro dos Santos, L.; Barbosa da Silva, J.C.; de Farias Silva, C.E.; Villar da Gama, B.M.; Almeida Medeiros, J.; Markou, G.; Rosas Garcia Almeida, R.M.; Abud; de S., A.K. Co-Cultivation between the Microalga Tetradesmus Obliquus and Filamentous Fungus Cunninghamella Echinulata Improves Tertiary Treatment of Cheese Whey Effluent in Semicontinuous Mode. Processes 2024, 12, 1573. [Google Scholar] [CrossRef]
- Alengebawy, A.; Ran, Y.; Osman, A.I.; Jin, K.; Samer, M.; Ai, P. Anaerobic Digestion of Agricultural Waste for Biogas Production and Sustainable Bioenergy Recovery: A Review. Env. Chem. Lett. 2024, 22, 2641–2668. [Google Scholar] [CrossRef]
- Outlook for Biogas and Biomethane: Prospects for Organic Growth – Analysis. Available online: https://www.iea.org/reports/outlook-for-biogas-and-biomethane-prospects-for-organic-growth (accessed on 12 November 2025).
- Biogases – Renewables 2025 – Analysis. Available online: https://www.iea.org/reports/renewables-2025/biogases (accessed on 19 November 2025).
- Lee, S.; Kim, H.; Park, J.; Kang, B.; Cho, C.-H.; Lim, H.; Won, W. Scenario-Based Techno-Economic Analysis of Steam Methane Reforming Process for Hydrogen Production. Appl. Sci. 2021, 11, 6021. [Google Scholar] [CrossRef]
- Yagüe, L.; Linares, J.I.; Arenas, E.; Romero, J.C. Biohydrogen Production through Biomethane Steam Reforming with CCUS for Decarbonizing Spain’s Tile Industry. Results Eng. 2024, 24, 103361. [Google Scholar] [CrossRef]
- Arshad, M.Y.; Hessel, V.; Halog, A.; Lewis, D.; Tran, N.N. Decentralisation Transition in the Chemical, Energy, and Waste Management Sectors: Innovations, Opportunities, and Sustainable Pathways – A Review. Sustain. Energy Technol. Assess. 2025, 76, 104307. [Google Scholar] [CrossRef]
- Maturi, K.C.; Madeti, S.R.K.; Sinha, S.; Saikia, S.; Srivastava, A.; Haq, I. Revolutionizing Bio-Hydrogen Production: Smart Integration of Nanotechnology, Microbial Engineering, and Circular Waste Valorisation. Bioresour. Bioprocess 2026, 13, 17. [Google Scholar] [CrossRef] [PubMed]
- Abawalo, M.; Pikoń, K.; Landrat, M. Comparative Life Cycle Assessment of Hydrogen Production via Biogas Reforming and Agricultural Residue Gasification. Appl. Sci. 2025, 15, 5029. [Google Scholar] [CrossRef]
- Kumar, R.; Kumar, A. Recent Advances of Biogas Reforming for Hydrogen Production: Methods, Purification, Utility and Techno-Economics Analysis. Int. J. Hydrogen Energy 2024, 76, 108–140. [Google Scholar] [CrossRef]
- Singh, D.; Sirini, P.; Lombardi, L. Review of Reforming Processes for the Production of Green Hydrogen from Landfill Gas. Energies 2025, 18, 15. [Google Scholar] [CrossRef]
- Abawalo, M.; Pikoń, K.; Landrat, M. Przegląd oceny cyklu życia produkcji biowodoru w procesie reformingu biogazu. Przem. Chem. 2024, T. 103, nr 12. [Google Scholar] [CrossRef]
- Bento, C.; Lopes, T.; Rodrigues, P.; Gírio, F.; Silva, C. Biogas Reforming as a Sustainable Solution for Hydrogen Production: Comparative Environmental Metrics with Steam-Methane Reforming and Water Electrolysis in the Portuguese Context. Int. J. Hydrogen Energy 2024, 66, 661. [Google Scholar] [CrossRef]
- Zhao, X.; Joseph, B.; Kuhn, J.; Ozcan, S. Biogas Reforming to Syngas: A Review. iScience 2020, 23, 101082. [Google Scholar] [CrossRef] [PubMed]
- Rossi, M.; Fanti, O.; Pacca, S.A.; Mancinelli, E.; Comodi, G. E-REFORMER for Sustainable Hydrogen Production: Enhancing Efficiency in the Steam Methane Reforming Process. Appl. Energy 2025, 401, 126625. [Google Scholar] [CrossRef]
- Kumar, R.; Kumar, A. Steam Reforming of Methane and Biogas: Thermodynamic and Kinetic Review for Hydrogen Production. Environ. Prog. Sustain. Energy 2026, 45, e70345. [Google Scholar] [CrossRef]
- Zheng, T.; Zhou, Y.; Cui, H.; Zhou, Z. Comparative Study on Ni/MgO-Al2O3 Catalysts for Dry and Combined Steam–CO2 Reforming of Methane. Catalysts 2025, 15, 659. [Google Scholar] [CrossRef]
- Aouad, S.; Labaki, M.; Ojala, S.; Seelam, P.K.; Turpeinen, E.; Gennequin, C.; Estephane, J.; Abi-Aad, E. A Review on the Dry Reforming Processes for Hydrogen Production: Catalytic Materials and Technologies 2018, 60–128.
- Babakouhi, R.; Alavi, S.M.; Rezaei, M.; Jokar, F.; Varbar, M.; Akbari, E. Hydrogen Production through Combined Dry Reforming and Partial Oxidation of Methane over the Ni/Al2O3–CeO2 Catalysts. Int. J. Hydrogen Energy 2024, 60, 503–514. [Google Scholar] [CrossRef]
- Muhammed, N.S.; Gbadamosi, A.O.; Epelle, E.I.; Abdulrasheed, A.A.; Haq, B.; Patil, S.; Al-Shehri, D.; Kamal, M.S. Hydrogen Production, Transportation, Utilization, and Storage: Recent Advances towards Sustainable Energy. J. Energy Storage 2023, 73, 109207. [Google Scholar] [CrossRef]
- Mohammadi, Z.; Allahyari, S.; Rahimi, S.; Fathi, M.; Mohammadi, S.; Mosaffa, A.H. Comprehensive Review of Hydrogen Production Technologies, Pathways, and Applications for Advancing Global Sustainable Energy Goals. Energy Convers. Manag. X 2025, 28, 101319. [Google Scholar] [CrossRef]
- Nogales-Delgado, S.; Álvez-Medina, C.M.; Montes, V.; González, J.F. A Review on the Use of Catalysis for Biogas Steam Reforming. Catalysts 2023, 13, 1482. [Google Scholar] [CrossRef]
- Azizan, M.T.; Aqsha, A.; Ameen, M.; Syuhada, A.; Klaus, H.; Abidin, S.Z.; Sher, F. Catalytic Reforming of Oxygenated Hydrocarbons for the Hydrogen Production: An Outlook. Biomass Conv. Bioref. 2023, 13, 8441–8464. [Google Scholar] [CrossRef] [PubMed]
- Enhancing Hydrogen Production from Biogas through Catalyst Rearrangements. Energies 2023, 16, 4058–4058. [CrossRef]
- Hönig, F.; Rupakula, G.D.; Duque-Gonzalez, D.; Ebert, M.; Blum, U. Enhancing the Levelized Cost of Hydrogen with the Usage of the Byproduct Oxygen in a Wastewater Treatment Plant. Energies 2023, 16, 4829. [Google Scholar] [CrossRef]
- Revinova, S.; Lazanyuk, I.; Ratner, S.; Gomonov, K. Forecasting Development of Green Hydrogen Production Technologies Using Component-Based Learning Curves. Energies 2023, 16, 4338. [Google Scholar] [CrossRef]
- Manual - Levelised Cost of Hydrogen (LCOH) Calculator. Pdf. [CrossRef]
- Yagüe, L.; Linares, J.I.; Arenas, E.; Romero, J.C. Levelized Cost of Biohydrogen from Steam Reforming of Biomethane with Carbon Capture and Storage (Golden Hydrogen)—Application to Spain. Energies 2024, 17, 1134. [Google Scholar] [CrossRef]
- Rezaei, M.; Akimov, A.; Gray, E.M. Levelized Cost of Dynamic Green Hydrogen Production: A Case Study for Australia’s Hydrogen Hubs. [CrossRef] [PubMed]
- Boscherini, M.; Storione, A.; Minelli, M.; Miccio, F.; Doghieri, F. New Perspectives on Catalytic Hydrogen Production by the Reforming, Partial Oxidation and Decomposition of Methane and Biogas. Energies 2023, 16, 6375. [Google Scholar] [CrossRef]
- Schiaroli, N.; Volanti, M.; Crimaldi, A.; Passarini, F.; Vaccari, A.; Fornasari, G.; Copelli, S.; Florit, F.; Lucarelli, C. Biogas to Syngas through the Combined Steam/Dry Reforming Process: An Environmental Impact Assessment. Energy Fuels 2021, 35, 4224–4236. [Google Scholar] [CrossRef]
- Rezaei, M.; Akimov, A.; Gray, E.MacA. Cost-Competitiveness of Green Hydrogen and Its Sensitivity to Major Financial and Technical Variables. Int. J. Hydrogen Energy 2024, 90, 1365–1377. [Google Scholar] [CrossRef]
- Abawalo, M.; Pikoń, K.; Landrat, M. Comparative Life Cycle Assessment of Hydrogen Production via Biogas Reforming and Agricultural Residue Gasification. Appl. Sci. 2025, 15, 5029. [Google Scholar] [CrossRef]
- Azzaoui, A.; Attiaoui, M.; Chaabelasri, E.; Silva, H.G.; Alami Merrouni, A. Techno-Economic Assessment of Linear Fresnel-Based Hydrogen Production in the MENA Region: Toward Affordable, Locally Driven Deployment for Enhanced Profitability and Reduced Costs. Energies 2025, 18, 3633. [Google Scholar] [CrossRef]
- Superchi, F.; Mati, A.; Carcasci, C.; Bianchini, A. Techno-Economic Analysis of Wind-Powered Green Hydrogen Production to Facilitate the Decarbonization of Hard-to-Abate Sectors: A Case Study on Steelmaking. Appl. Energy 2023, 342, 121198. [Google Scholar] [CrossRef]
- Vidal-Barrero, F.; Baena-Moreno, F.M.; Preciado-Cárdenas, C.; Villanueva-Perales, Á.; Reina, T.R. Hydrogen Production from Landfill Biogas: Profitability Analysis of a Real Case Study. Fuel 2022, 324, 124438. [Google Scholar] [CrossRef]
- Hajjaji, N.; Martinez, S.; Trably, E.; Steyer, J.-P.; Et., A. Life Cycle Assessment of Hydrogen Production from Biogas Reforming. Int. J. Hydrogen Energy 2016. [Google Scholar] [CrossRef]
- Battista, F.; Montenegro Camacho, Y.S.; Hernández, S.; Bensaid, S.; Herrmann, A.; Krause, H.; Trimis, D.; Fino, D. LCA Evaluation for the Hydrogen Production from Biogas through the Innovative BioRobur Project Concept. Int. J. Hydrogen Energy 2017, 42. [Google Scholar] [CrossRef]
- Comparison of the Emissions Intensity of Different Hydrogen Production Routes, 2021 – Charts – Data & Statistics. Available online: https://www.iea.org/data-and-statistics/charts/comparison-of-the-emissions-intensity-of-different-hydrogen-production-routes-2021 (accessed on 18 July 2026).
- You, X.; Wang, X.; Ma, Y.; Liu, J.; Liu, W.; Xu, X.-L.; Peng, H.; Li, C.; Zhou, W.; Yuan, P.; et al. Ni–Co/Al2O3 Bimetallic Catalysts for CH4 Steam Reforming: Elucidating the Role of Co for Improving Coke Resistance. ChemCatChem 2014, 6. [Google Scholar] [CrossRef]
- Ganguli, A.; Bhatt, V. Hydrogen Production Using Advanced Reactors by Steam Methane Reforming: A Review. Front. Therm. Eng. 2023, 3. [Google Scholar] [CrossRef]
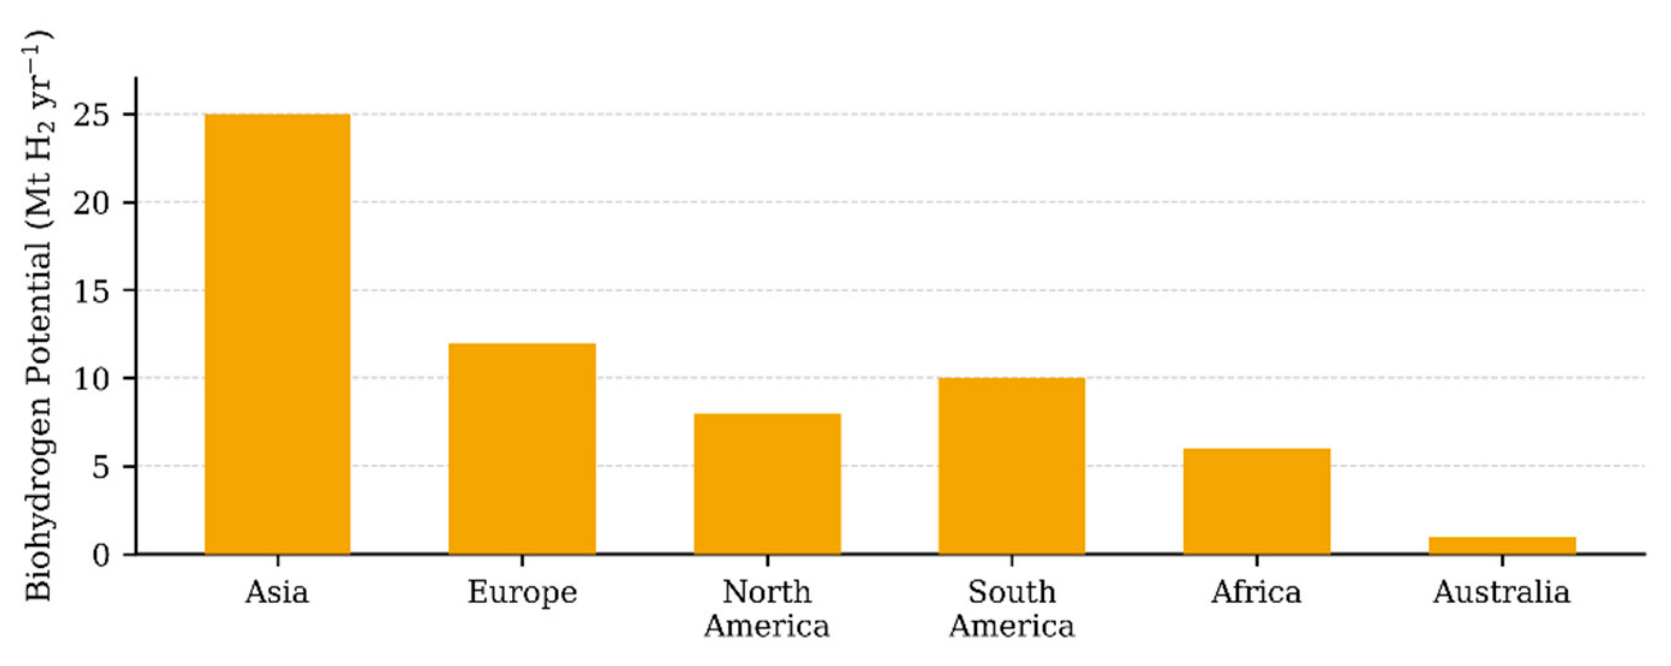
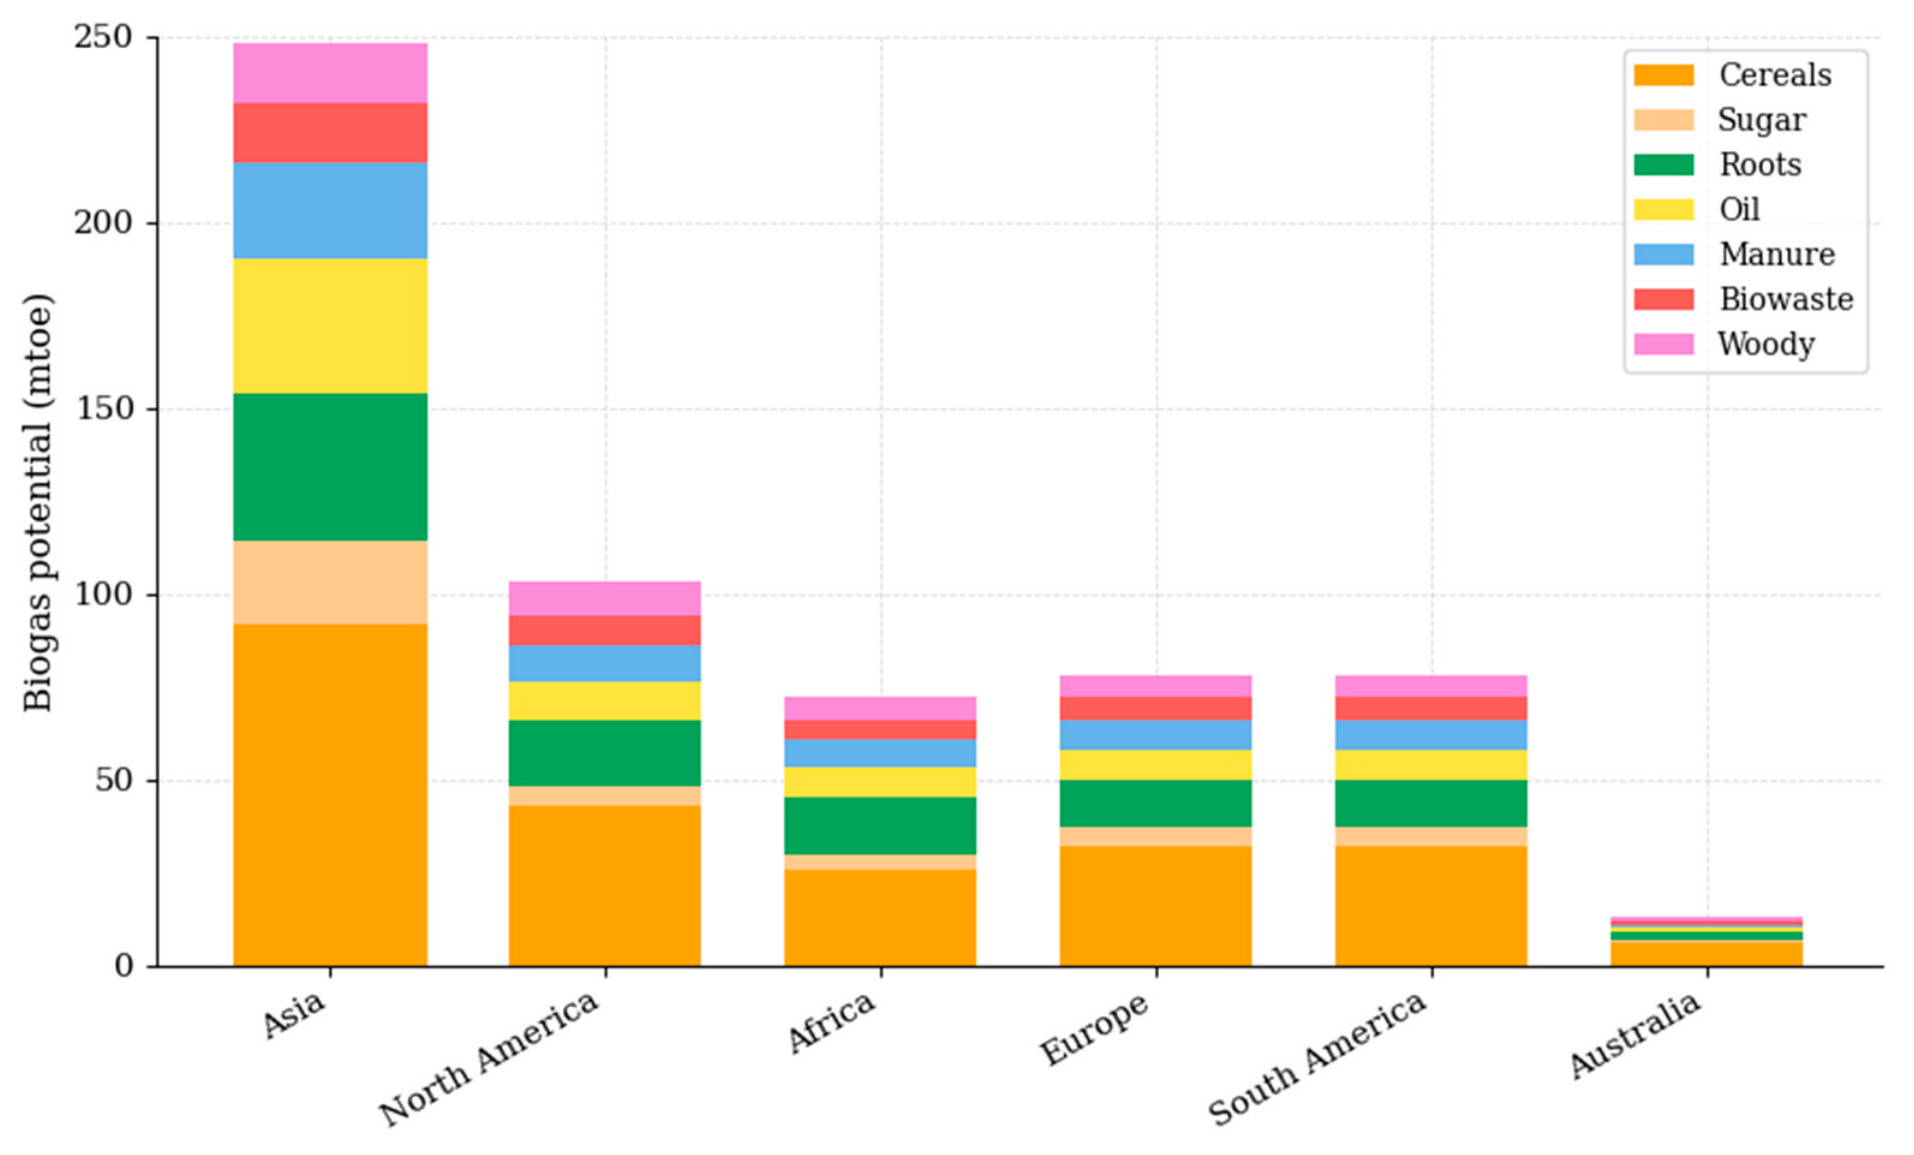
Figure 3.
Schematic representation of the integrated biogas-to-hydrogen production pathway [67].
Figure 3.
Schematic representation of the integrated biogas-to-hydrogen production pathway [67].
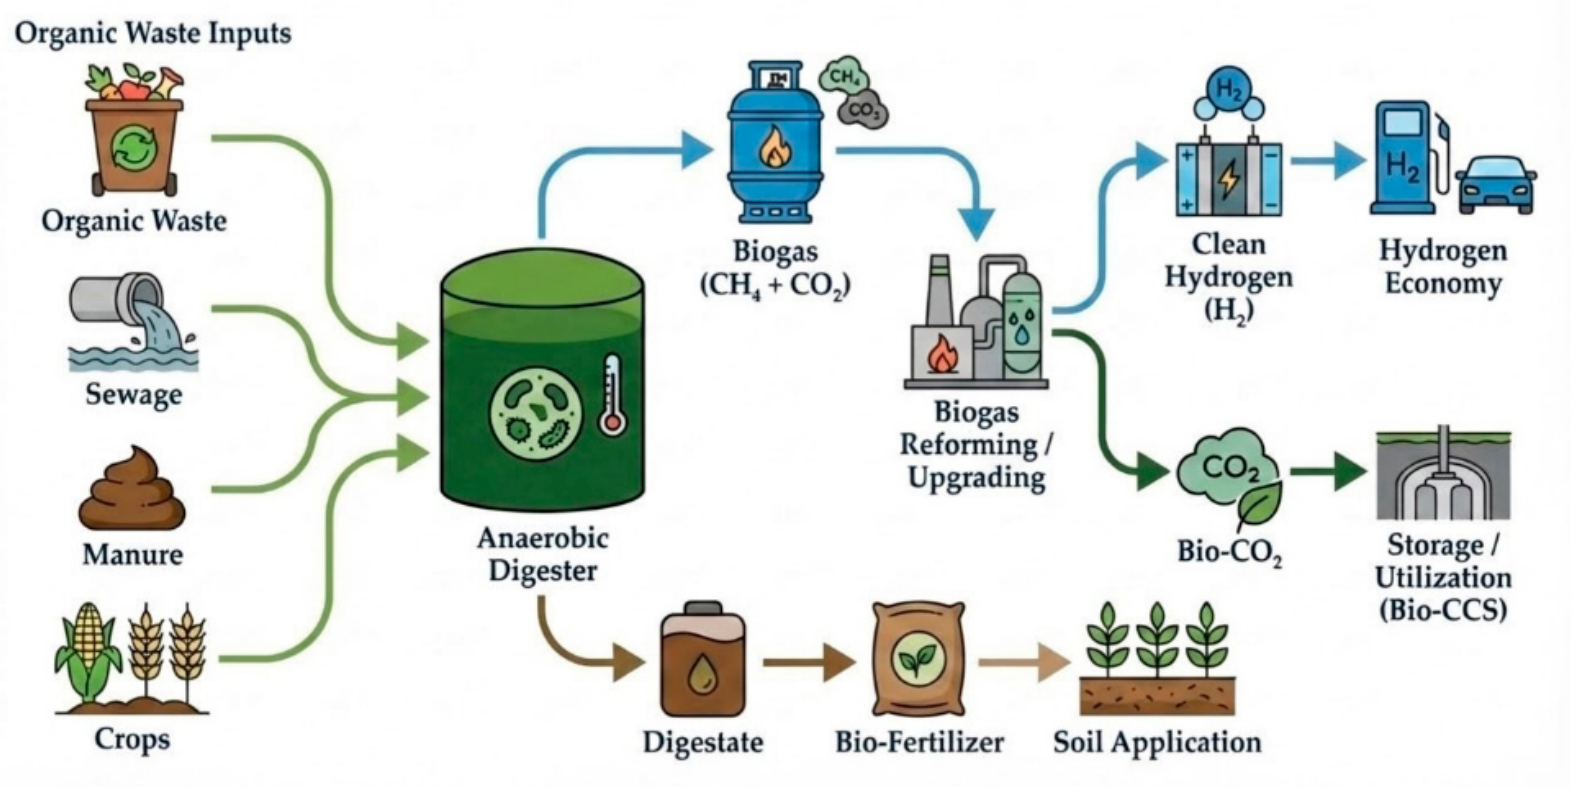
Figure 4.
Operating Temperature ranges of four Biogas Reforming Technologies.
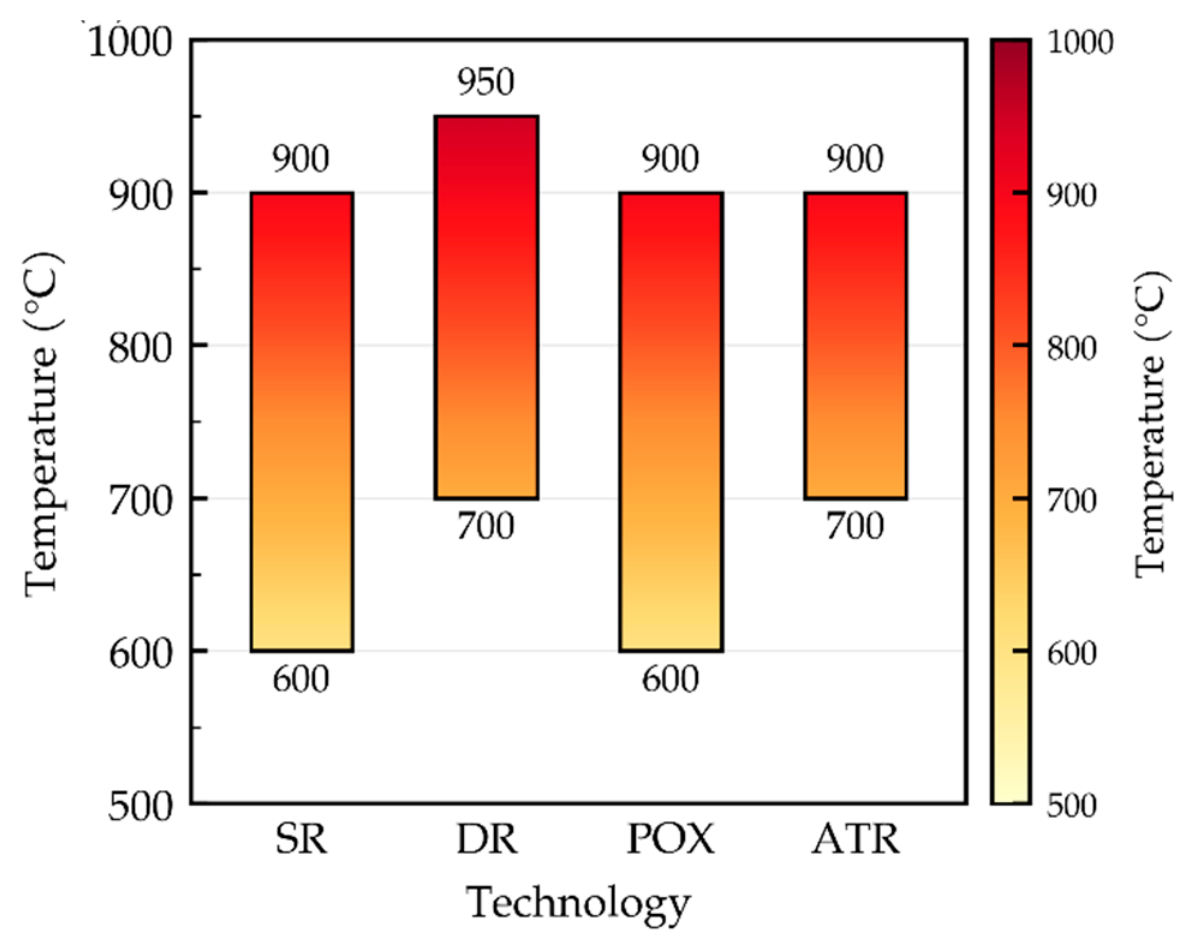
Figure 5.
Intrinsic performance of the four biogas reforming pathways: a) energy (cold-gas) efficiency; b) hydrogen yield; c) H₂/CO molar ratio. Colour denotes technology; markers indicate midpoint values and caps the reported range bounds.
Figure 5.
Intrinsic performance of the four biogas reforming pathways: a) energy (cold-gas) efficiency; b) hydrogen yield; c) H₂/CO molar ratio. Colour denotes technology; markers indicate midpoint values and caps the reported range bounds.

Figure 6.
Global warming potential (GWP) of the four biogas reforming pathways (kg CO₂-eq per kg H₂): steam biogas reforming (SR), dry biogas reforming (DR), autothermal reforming (ATR), and partial oxidation (POx). Bars denote the midpoint of the reported literature range and error bars the reported minimum and maximum.
Figure 6.
Global warming potential (GWP) of the four biogas reforming pathways (kg CO₂-eq per kg H₂): steam biogas reforming (SR), dry biogas reforming (DR), autothermal reforming (ATR), and partial oxidation (POx). Bars denote the midpoint of the reported literature range and error bars the reported minimum and maximum.
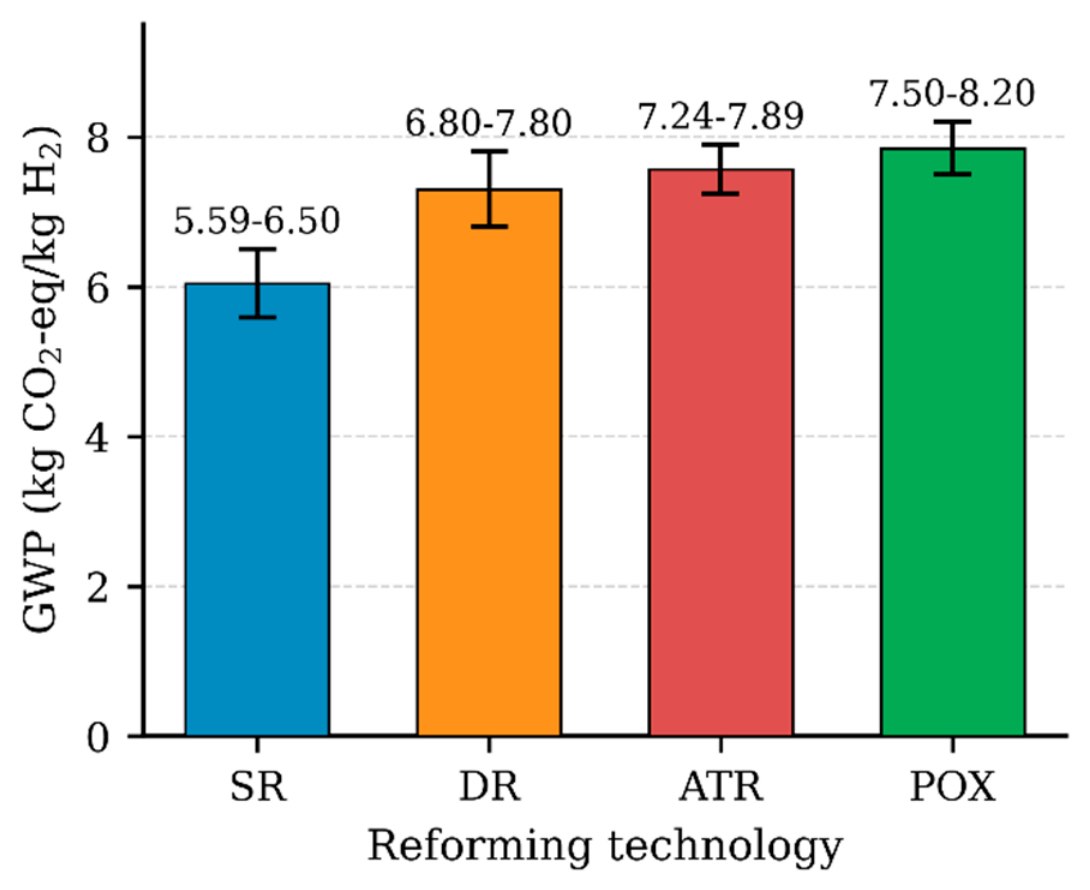
Figure 7.
a) Levelized cost of hydrogen by technology, b) Cost breakdown by technology.
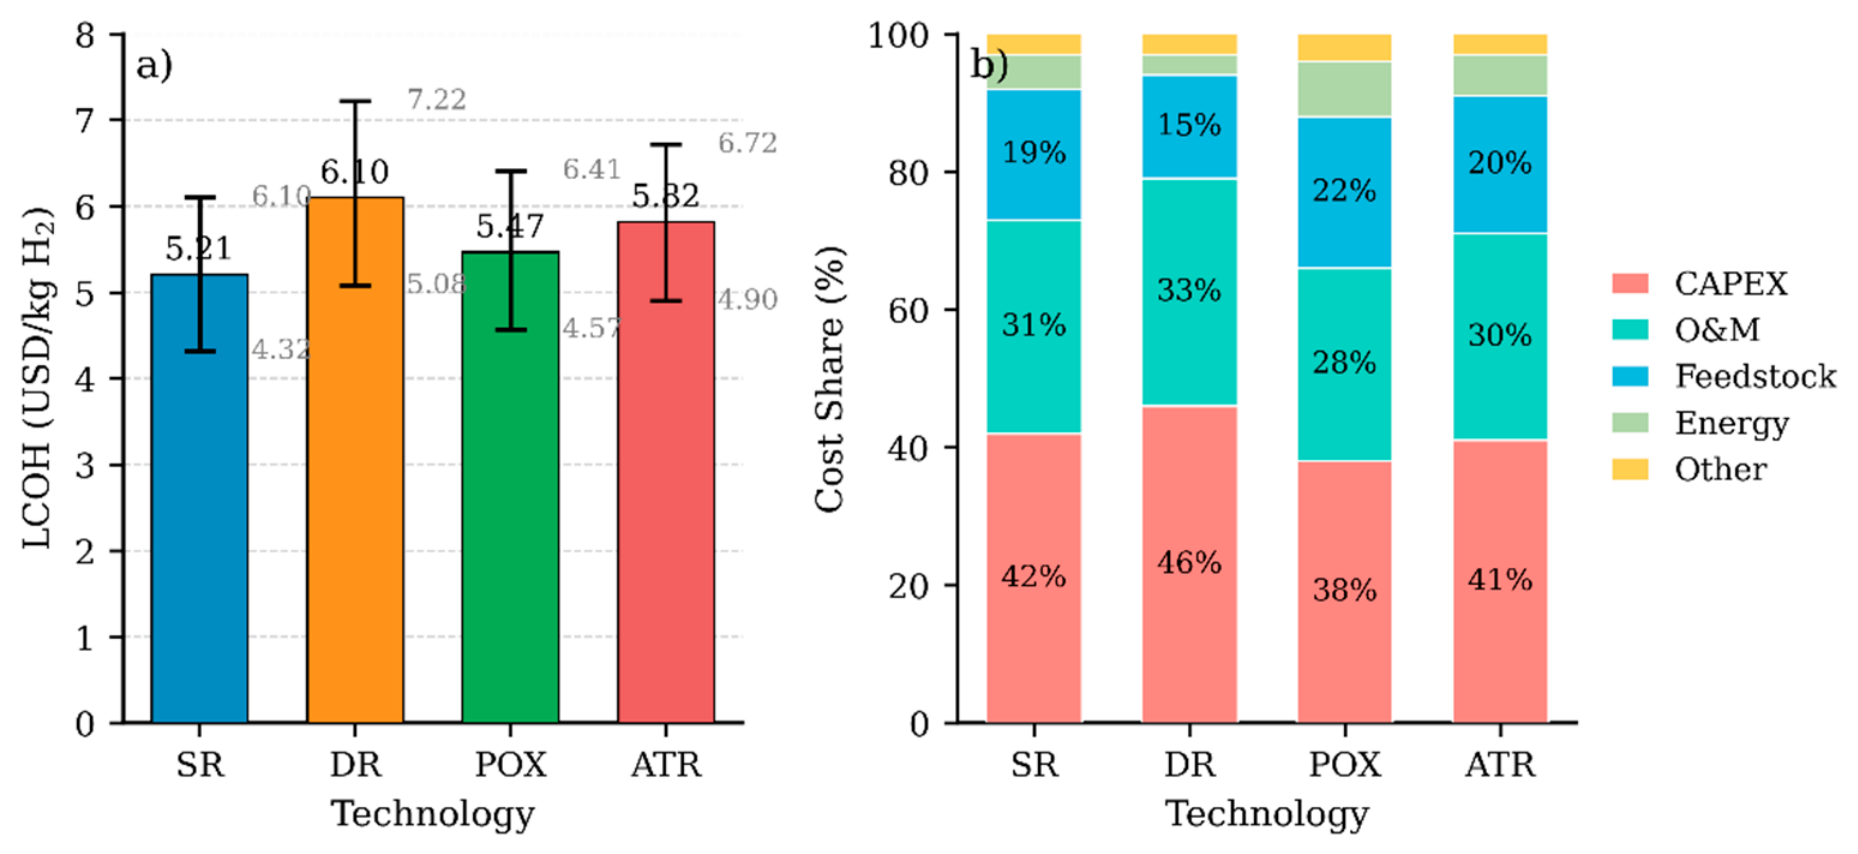
Figure 8.
Parameter Sensitivity Analysis Matrix: a) Sensitivity to plant scale, b) Sensitivity to feedstock cost, c) Sensitivity to energy price, d) Sensitivity to catalyst cost, e) Sensitivity to capacity factor, f) Sensitivity to discount rate. Generated using the LCOH model (Equation (6)) with the parameter ranges listed in Table 2.
Figure 8.
Parameter Sensitivity Analysis Matrix: a) Sensitivity to plant scale, b) Sensitivity to feedstock cost, c) Sensitivity to energy price, d) Sensitivity to catalyst cost, e) Sensitivity to capacity factor, f) Sensitivity to discount rate. Generated using the LCOH model (Equation (6)) with the parameter ranges listed in Table 2.
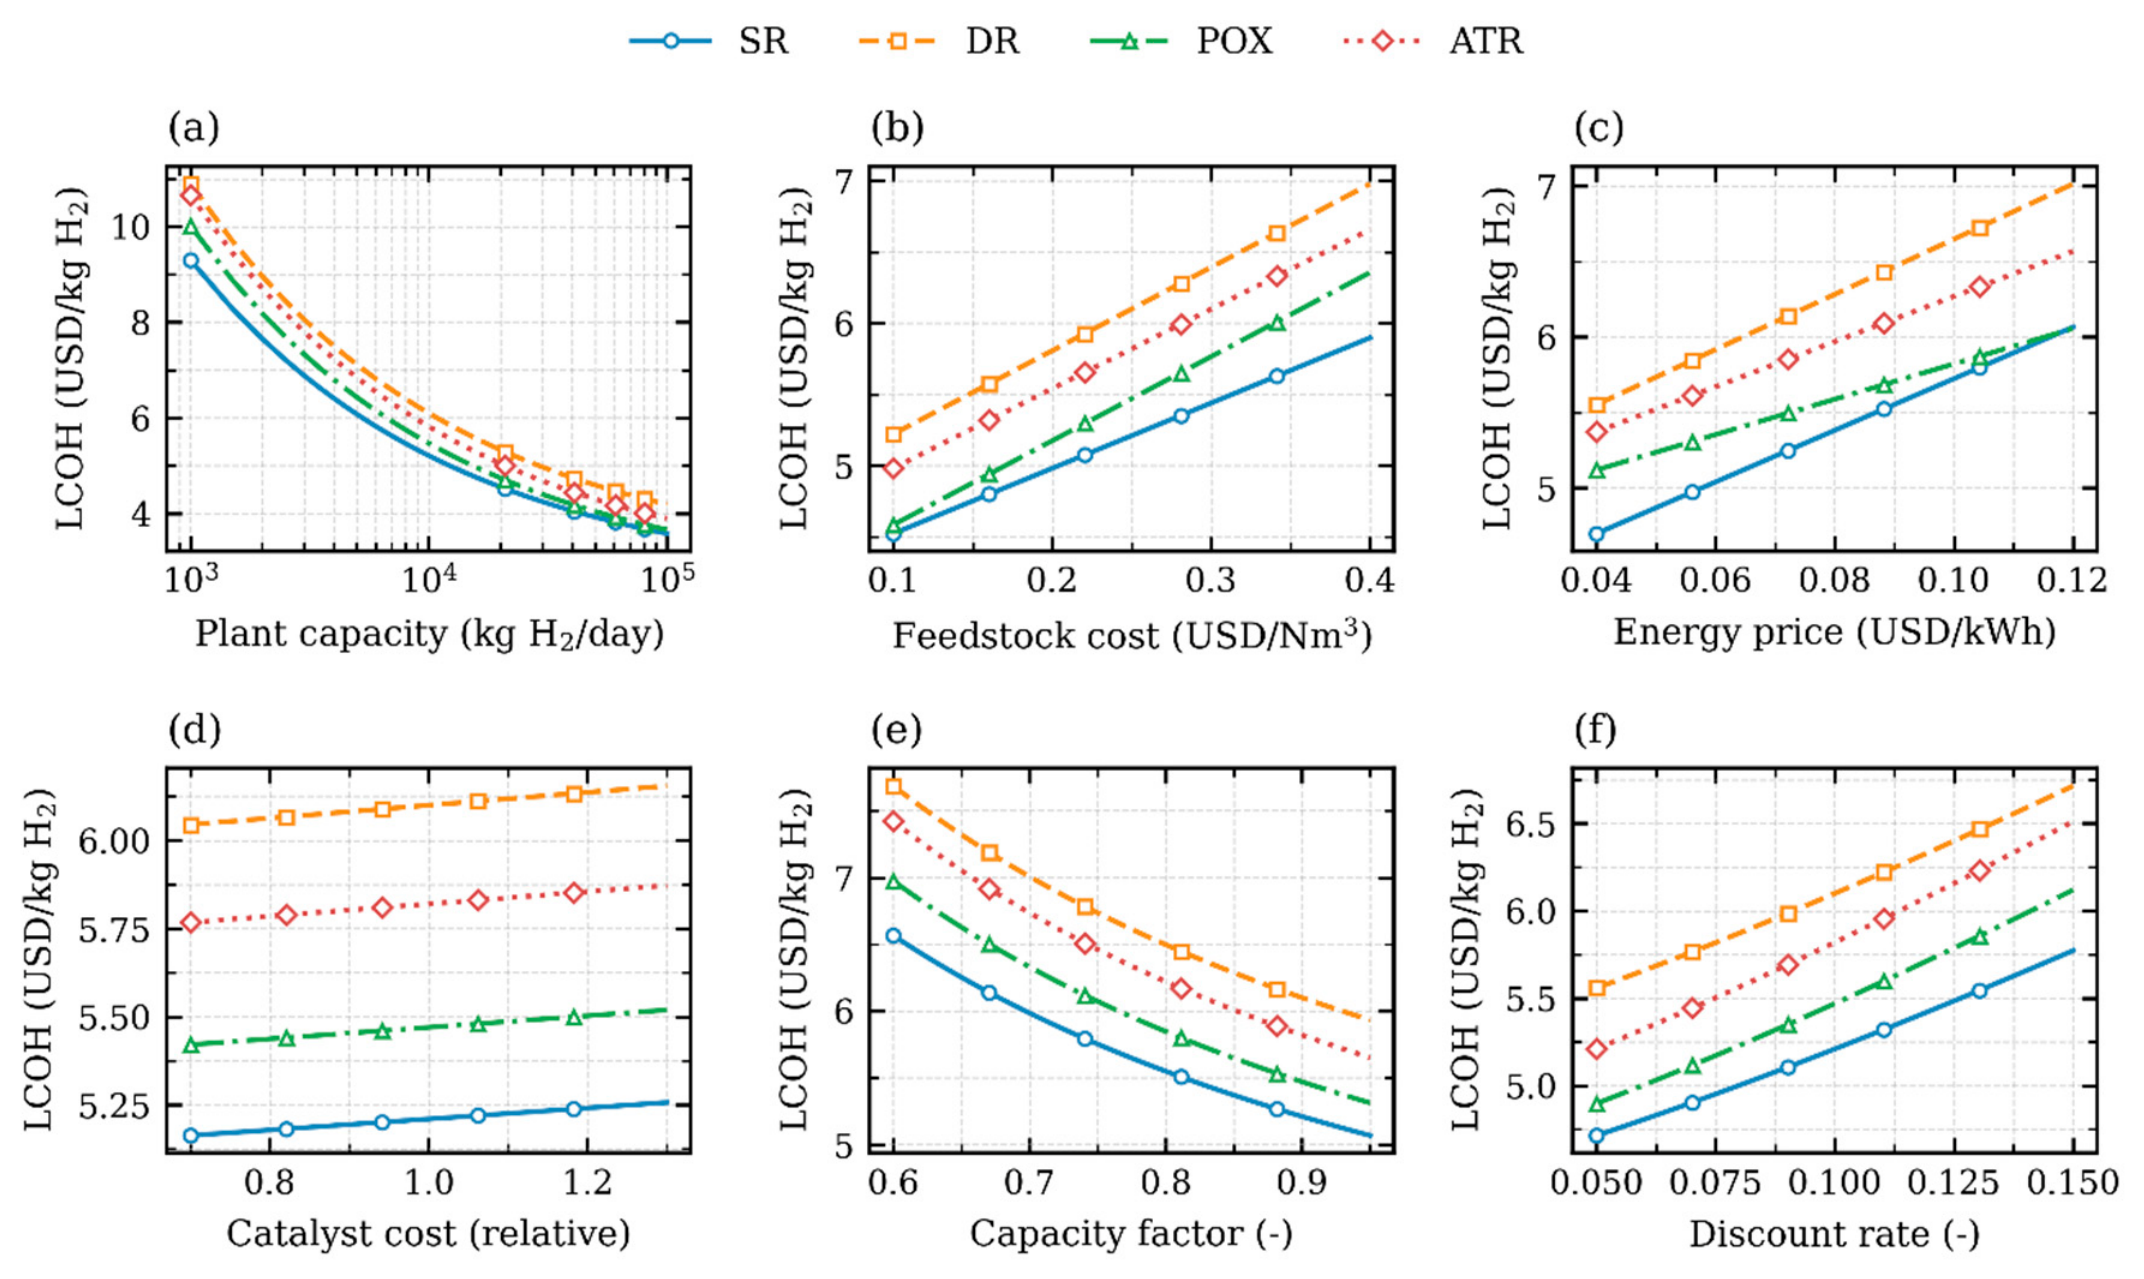
Figure 9.
Monte Carlo simulation of the levelized cost of hydrogen (LCOH): frequency distributions for SR, DR, POX, and ATR over 10,000 iterations, with mean and P10–P90 values. Based on 10,000 Monte Carlo iterations using the input distributions specified in Table 2.
Figure 9.
Monte Carlo simulation of the levelized cost of hydrogen (LCOH): frequency distributions for SR, DR, POX, and ATR over 10,000 iterations, with mean and P10–P90 values. Based on 10,000 Monte Carlo iterations using the input distributions specified in Table 2.
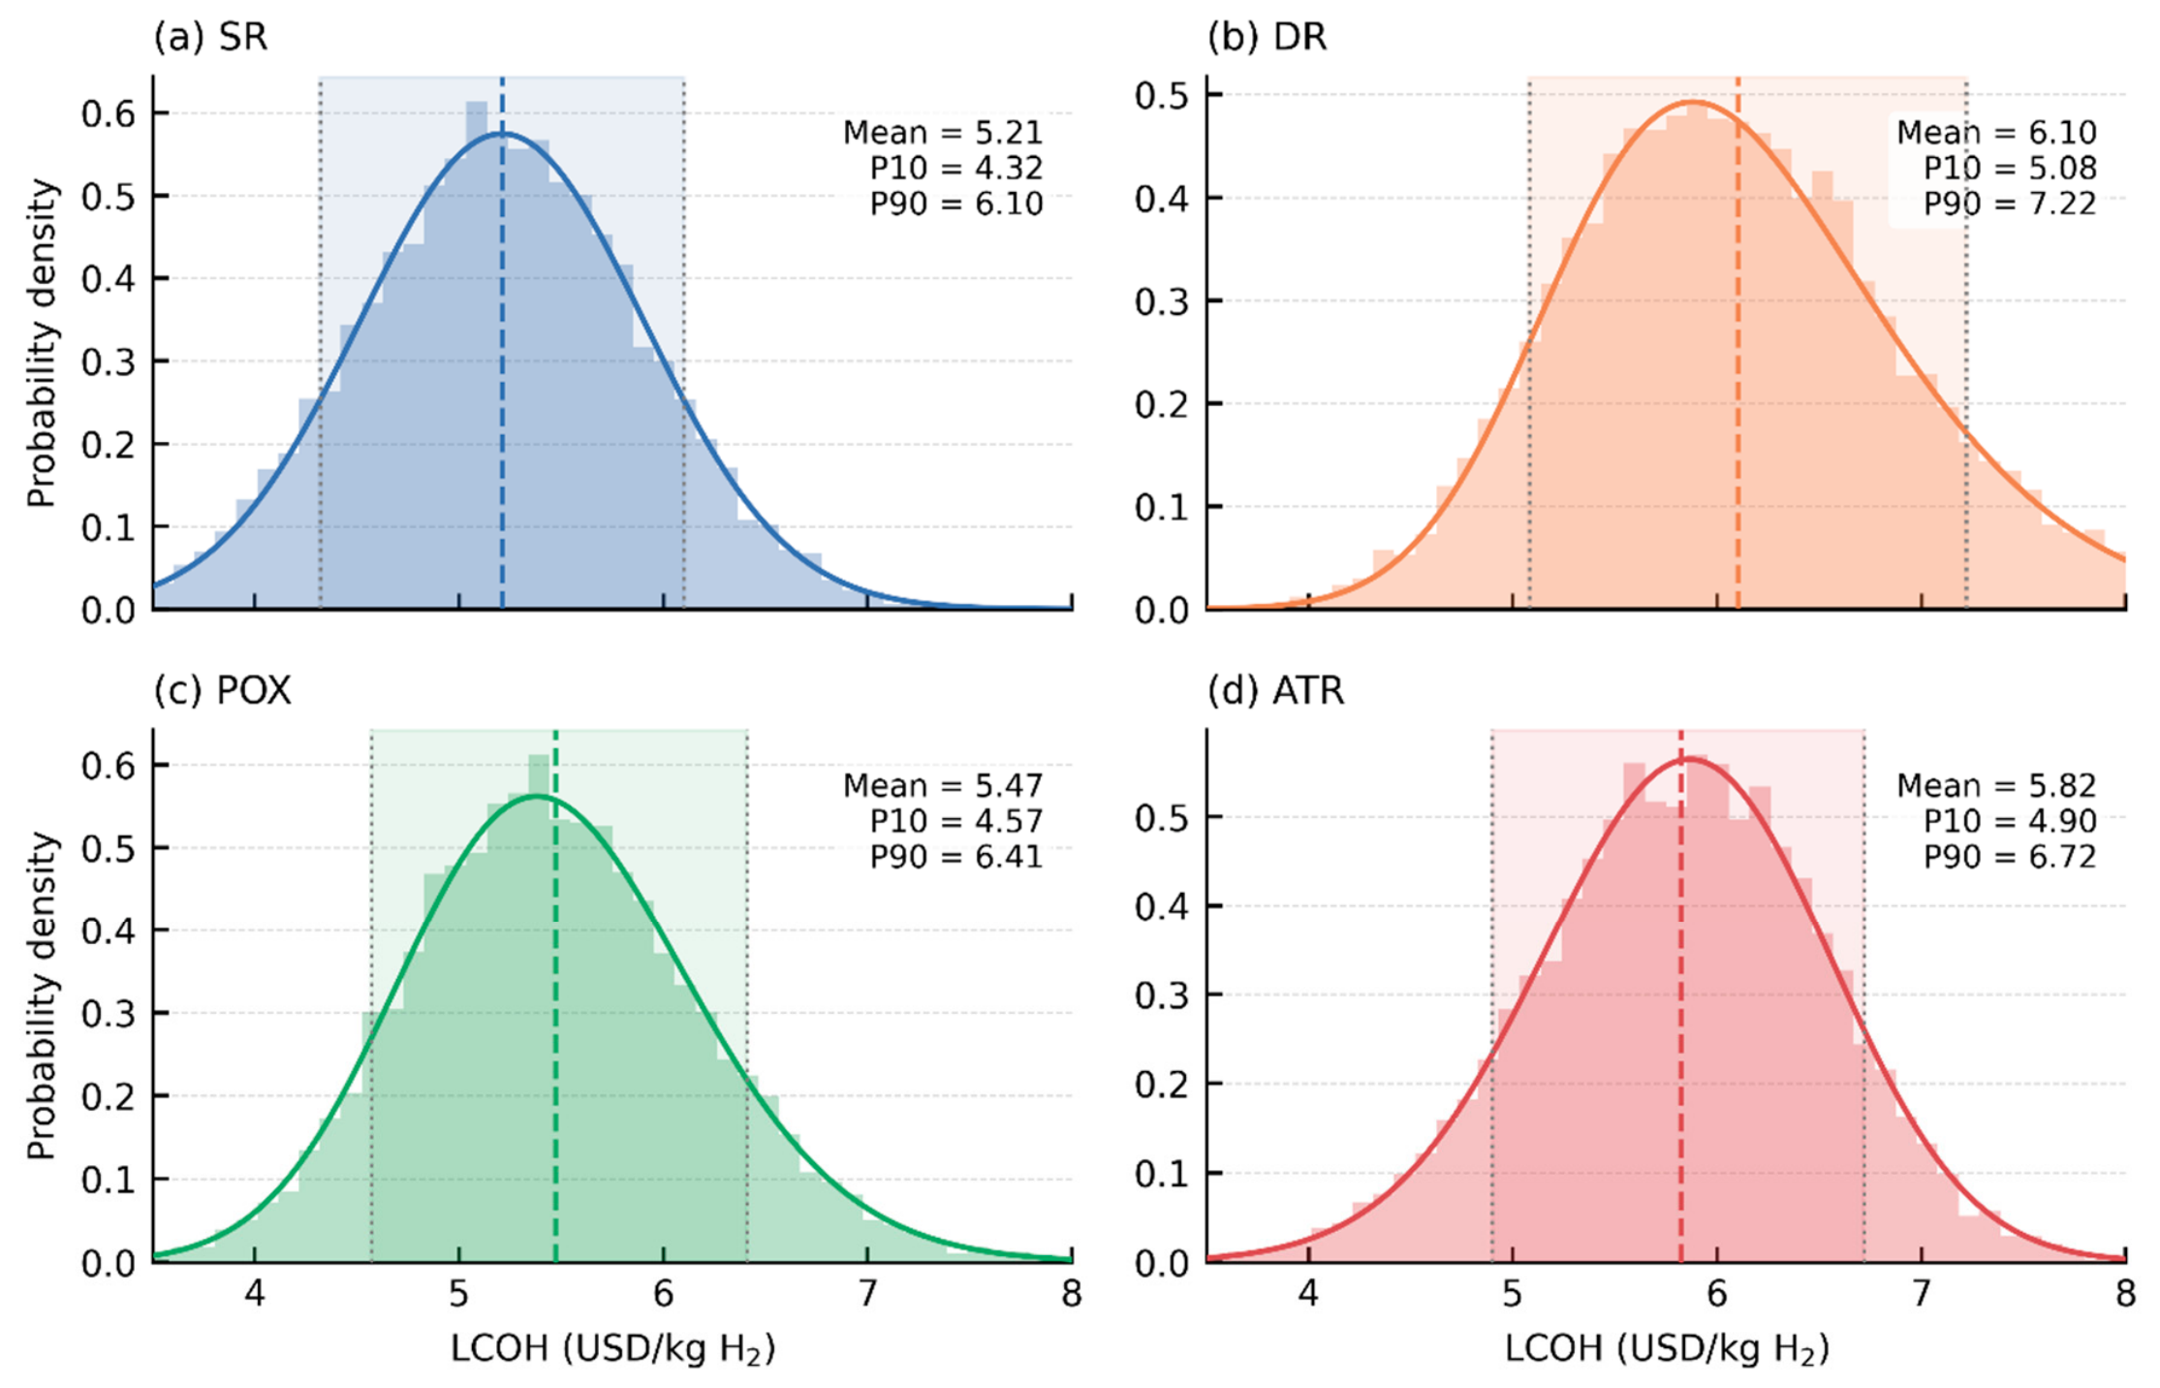

Table 1.
Summary of the operational characteristics and representative performance ranges of the four biogas reforming pathways [9,32,36,44,47,59,68,69,71,75,76,77,78,79].
| Metric | Steam reforming (SR) | Dry reforming (DR) | Partial oxidation (POX) | Autothermal reforming (ATR) |
|---|---|---|---|---|
| Main Oxidant | H₂O | CO₂ | O₂ | O₂ + H₂O |
| Reaction Type | Endothermic | Strongly Endothermic | Exothermic | Thermally Balanced |
| Typical reaction temperature | 600–900 °C as applied to methane/biogas reforming in reviews and pilot studies. | 700–950 °C in the literature for DR to reach reasonable conversions. | 600–900 °C in catalytic POX evaluations; often lower adiabatic-peak requirements than SR. | 700–900 °C depending on the air/steam ratio and reactor design. |
| Typical pressure | Atmospheric to several bar reported in reviews | Atmospheric to elevated pressures in research studies | Often near atmospheric; can be pressurized for integration | Applied at atmospheric to moderate pressures, depending on downstream use |
| Catalyst type | Ni-based supported catalysts most common; catalyst design strongly affects yields and deactivation behavior | Ni or noble-metal catalysts with supports tailored to limit coke (e.g., Ni/CeO2) | Noble metals (Pt, Rh) or supported catalysts for fast oxidation; catalyst choice controls selectivity | Typically, Ni or noble-metal catalysts in staged reactors; catalyst durability is critical |
| Representative methane conversion or H2 selectivity (reported) | Conversion example: 74% DME conversion and H2 selectivity ~60% by SR micro-reactor at 650 °C | Plasma-assisted DRM: methane conversion up to 86.5% and H2 selectivity 73.3% in microwave plasma tests at atmospheric pressure | Thermodynamic/equilibrium analyses and comparative studies indicate POX can be most energy-efficient for producing a fixed H2 amount in some analyses, but produces lower raw H2 purity without WGS/cleanup | Chemical-looping/ATR variants report autothermal syngas with high outlet purity and improved CO2 utilization in pilot studies (see next sections) |
| H₂/CO Ratio | 3.0–5.0 | 0.8–1.2 | 1.5–2.5 | 1.5–3.0 |
| Key Advantage | High H₂ yield | CO₂ utilization | Self-heating | Thermal balance, flexible H₂/CO |
Table 2.
Base-case techno-economic parameters and assumptions for biogas-to-hydrogen reforming pathways [70,78,81,82,84,85,86,87].
| Parameter | Symbol | Unit | Base Value | Variation Range | Data Source/Notes |
|---|---|---|---|---|---|
| Plant capacity | Nm³ h⁻¹ biogas | 1,000 | 100–10,000 | Typically distributed on a semi-industrial scale | |
| Plant lifetime | years | 20 | – | Standard for hydrogen reformers | |
| Capacity factor | CF | % | 90 | 60–95 | Operational reliability and downtime are considered |
| Discount rate | % | 10 | 5–15 | Reflects financing conditions | |
| Biogas feedstock cost | USD Nm⁻³ biogas | 0.25 | 0.10–0.40 | Market price range for upgraded biogas | |
| Energy cost (heat/electricity) | USD kWh⁻¹ | 0.07 | 0.04–0.12 | Electricity and fuel integration scenarios | |
| Catalyst cost | USD kg⁻¹ cat | 35 | 25–60 | Ni-based catalysts; periodic replacement considered | |
| CAPEX | USD kW⁻¹ | 1,200 | 800–2,500 | From recent TEA literature for small to medium plants | |
| O&M cost | % of CAPEX yr⁻¹ | 4 | 3–6 | Annual maintenance, labor, and consumables | |
| Hydrogen purity | – | % | 99.9 | – | PSA or membrane purification included |
Disclaimer/Publisher’s Note: The statements, opinions and data contained in all publications are solely those of the individual author(s) and contributor(s) and not of MDPI and/or the editor(s). MDPI and/or the editor(s) disclaim responsibility for any injury to people or property resulting from any ideas, methods, instructions or products referred to in the content. |
© 2026 by the authors. Licensee MDPI, Basel, Switzerland. This article is an open access article distributed under the terms and conditions of the Creative Commons Attribution (CC BY) license (http://creativecommons.org/licenses/by/4.0/).
Copyright: This open access article is published under a Creative Commons CC BY 4.0 license, which permit the free download, distribution, and reuse, provided that the author and preprint are cited in any reuse.