
Submitted:
20 July 2026
Posted:
22 July 2026
You are already at the latest version
Abstract
Hybrid renewable energy systems with photovoltaic generation, wind power, battery storage, and hydrogen pathways are becoming increasingly popular in off-grid and weak grid applications as they convert intermittent renewable energy sources into usable energy forms, thus decreasing dependency on fossil fuels. Traditional deterministic approaches to the system size may be unable to consider the risks associated with solar radiation, wind, ambient temperatures, and energy demand evolution due to climate-resource sensitivity analysis. In this research, HOMER Pro was used to apply least-cost sizing and resource availability sensitivity analysis for the sizing of hybrid photovoltaic–wind–battery-hydrogen system under four climate-resource sensitivity scenarios. Four different system layouts were compared based on the HOMER Pro optimization model using several evaluation criteria such as NPC, LCOE, renewable ratio, CO₂ emissions, unmet load ratio, and hydrogen energy production. Four different system layouts were compared based on the HOMER Pro optimization model using several evaluation criteria such as NPC, LCOE, renewable ratio, CO₂ emissions, unmet load ratio, and hydrogen energy production. The most appropriate design layout was identified as a PV-wind-battery-electrolyzer-hydrogen tank-fuel cell system with 900 kW PV, 350 kW wind power capacity, 1.85 MWh battery storage, 240 kW electrolyzer capacity, 520 kg hydrogen capacity and 180 kW fuel cell. At the base scenario, it produced the minimum LCOE equal to 0.246 USD/kWh, NPC of 4.38 million USD, renewable ratio of 98.7%, CO₂ emissions of 18 t/y and unmet load of 0.30%. In case of simultaneous pressure on resources due to climate, the LCOE rose to 0.253 USD/kWh while the unmet load did not exceed 0.43%. Thus, the inclusion of hydrogen allows one to ensure greater resilience compared to systems without hydrogen.
Keywords:
HOMER Pro
; Durban
; climate
; sensitivity
; solar PV
; wind turbine
; battery storage
; hydrogen storage
; fuel cell
; electrolyzer
; techno-economic analysis
; environmental assessment
1. Introduction
The increasing focus on low-carbon and climate-resistant energy production systems has made it imperative to develop power supply systems that, while being economically viable, also maintain technical reliability under varying climatic conditions. Solar PV panels and wind energy generators have come to be seen as vital for such a transition owing to their modularity, scalability and falling costs [1,2]. Their performance, however, is largely dictated by prevailing weather conditions and seasonal variation in energy resources [3,4]. The real problem with renewables has thus become how to ensure stable electrical supply, not how to generate electrical power using renewables, where weather and climatic factors like radiation levels, wind speeds, temperatures and electricity demands coincide [5,6].
The hybrid renewable energy system offers a solution to this problem by integrating different types of energy sources and storage methods in an integrated way [7]. The solar PV provides a large contribution to the supply of energy throughout daytime and seasons of abundant irradiation [8]. On the other hand, wind power could offer additional support in times where there are lower contributions from solar power. Battery energy storage would balance the production in shorter intervals through absorbing surplus energy and providing energy in case of a deficiency. Nonetheless, batteries could prove to be technologically and economically limiting in cases of extended autonomy times [9]. Green hydrogen opens another option; excess energy could be converted to hydrogen and used as fuel cell energy [10].
Nonetheless, the design of optimal solar-wind-hydrogen systems remains a multi-objective challenge [11]. While the most cost-effective design will not be optimal in terms of reducing emission levels, enhancing reliability, or minimizing renewable curtailment, a highly renewable design will involve more upfront investment, oversizing of generators and more storage capacity [12]. The optimization exercise would therefore consider a balance between the present cost, energy cost, and proportion of renewables used, hydrogen production, emissions reduction, and system reliability [13]. The multi-objective aspect of the optimization exercise becomes even more prominent in the case of hydrogen designs since electrolysis plants, hydrogen storage facilities and fuel cell technologies enhance system reliability and lower emissions; however, such designs tend to have higher capital costs [14].
The issue of climate sensitivity further complicates the sizing and operation of hybrid renewable systems [15]. Traditionally, feasibility analyses use the concept of either an average meteorological year or a deterministic data source regarding available resources [16]. Although this method provides a valuable basis for initial design considerations, it can overlook the risks faced by renewable-based systems in cases of years with reduced levels of solar insolation, insufficient wind resources, degraded performance and higher loads due to higher temperatures [17]. An ideal system may turn out to be less dependable and costly when subjected to climate impacts [18]. In order to properly assess the effects of such impacts on system performance, scenario analysis must be employed.
HOMER Pro and other techno-economic simulation packages are often employed to analyze hybrid micro grid designs, since they provide sizing, dispatch simulation, lifecycle costing, and sensitivity analysis. Nevertheless, the validity of a particular design is contingent upon the nature of the formulation of the underlying optimization problem [19]. In case when only a single set of resource availability is considered, a chosen system architecture will depend mostly on its immediate cost-efficiency and not long-term reliability or sustainability [13]. Taking sensitivity in climate variability into account can give an engineer an opportunity to compare various potential configurations of the hybrid micro grid not only in terms of base-level costs, but also in terms of reliability and emissions levels that can be achieved under unfavorable conditions [20,21]. It should be especially true for solar-wind-hydrogen systems, as the benefits of hydrogen storage might become obvious only under such circumstances.
Within this context, the current study proposes a least-cost HOMER Pro sizing approach combined with a post-hoc multi-criteria assessment of economic, environmental, renewable-energy, hydrogen-production, and reliability performance. This study compares different system designs based on their techno-economic, environmental, and reliability criteria, including net present cost, cost of electricity, renewable energy contribution ratio, carbon dioxide emission rate, lost load probability, and electricity/hydrogen generation rates. Resource availability sensitivity analysis are simulated by means of baseline and structured sensitivity scenarios involving solar energy shortage, low wind speed, elevated temperatures, and increased load demand. Through comparative analysis among the considered scenarios, a robust compromise system configuration is identified.
There are three major contributions from this study. First, it provides a systematic multi-criteria evaluation approach for the assessment of solar-wind-hydrogen hybrid systems, going beyond least cost optimality analysis of such systems. Second, it illustrates how the sensitivity analysis associated with climatic conditions and resource availability can be integrated into the design of such systems by conducting a techno economic evaluation of climate-resource sensitivity scenarios. Finally, it reveals the importance of adopting hydrogen as an additional storage mechanism compared to battery energy storage alone to improve system resilience.
Literature Review
Latest scientific literature has seen a growing trend of focusing on hybrid systems based on hydrogen use, especially when it comes to cases that have intermittency issues of renewables, need for long-term storage capacity, and multi-criteria analysis as primary factors in system design. This trend has been evidenced not just by single studies, but also through recent review articles and techno economic evaluations considering issues related to hydrogen-based solutions, hybrid micro grid optimization, resource availability sensitivity analysis considerations, and climate resilience plans. Therefore, this paper treats hydrogen not as a replacement for batteries, but rather as a complementary technology.
Designing hybrid solar-wind-hydrogen energy systems is at the heart of studies on renewable energy systems integration, energy storage, techno-economic optimization, and climate-proof infrastructures [11]. Recent literature shows increasing attention to hydrogen-enabled hybrid renewable energy systems as scholars and professionals look for energy systems which will be able to help minimize dependency on fossil fuels without compromising the electricity supply reliability amidst varying weather conditions. For the present study, the topics considered are seven in total: hybrid renewable energy systems, hydrogen as a long-term energy storage medium, techno-economic evaluation using HOMER Pro, multi-criteria decision-making, climate change sensitivity and renewable resource variation, relevance to South Africa, and the research gap that still exists.
Hybrid Renewable Energy Systems and the Need for Complementarity
The purpose of hybrid renewable energy systems is to compensate for the problems inherent in using renewable sources separately. The advantage of solar PV includes the modularity of the source, decreasing prices, and low maintenance. Yet the solar PV system’s production depends on diurnal patterns, clouds, and seasonal changes in the solar radiance level. In such situations, wind power would make up for solar inadequacies if there is wind outside the period of maximal solar availability or if the season is less favorable for the generation of solar electricity. The use of solar-wind resources can decrease the chance that the power generation will rely solely on the weather conditions at one given moment. But the complementarity is dependent on the location; therefore, the use of solar wind complementarity cannot be assumed.
Also from the literature, it is evident that hybrid renewable systems will be most effective if generation technologies are coupled with appropriate means of storage and dispatching of electricity [7,22]. While short-term storage can help balance the intra-day gap between supply and demand, long-term storage is vital for achieving self-reliance even under prolonged periods of insufficient generation capacity from renewable sources [23]. In case of off-grid and micro grid systems, evaluation has often focused on PV, wind, battery storage, and back-up generation technologies, since these technologies contribute to the amount of unmet load, proportion of renewables, curtailment, and total lifecycle cost [24,25]. The latest studies done using HOMER Pro have expanded on this technology combination to include the use of hydrogen and other related energy technologies where the research goal entails the use of renewable energy for clean back-up power or surplus generation [26]. For instance, in their work, Yasmin et al. used HOMER Pro to evaluate a hybrid energy off-grid system consisting of solar, wind, hydrogen, and biofuel [27].
Hydrogen Storage in Renewable-Dominant Hybrid Systems
The choice of hydrogen has risen to prominence in academic discourse due to the fact that hydrogen provides an energy storage solution that differs in its nature from the electrochemical battery storage solution. Electrochemical batteries provide highly efficient storage capacity for short-term energy balancing and quick response, but their use becomes difficult when one considers multi-day autonomy or season-based energy storage. On the other hand, the hydrogen system converts the excess energy obtained from an energy source to chemical energy with an electrolyzer and stores it in a container or another storage medium before converting back to electrical energy through the use of a fuel cell. The efficiency in energy conversion through the hydrogen pathway is lower compared to that in batteries; however, there are scenarios where the use of hydrogen is preferable.
Today, there is growing recognition that the use of hydrogen should be considered not as a universal battery alternative, but rather a supplement. In a carefully designed hybrid system, batteries will be responsible for high-frequency balancing, while hydrogen storage will take care of shortages and higher consumption periods, as well as greater use of renewable sources and less reliance on either diesel power or imports from the grid. The work done by Shi et al. in 2025 is applicable due to its application of HOMER Pro together with multi-criteria decision-making analysis to systems using wind/solar/hydrogen, with explicit mention of hydrogen-based large-scale renewable energy storage and multi-criteria assessment [33]. Another paper to apply here is one conducted by Xia et al., who analyzed an off-grid hybrid solar-wind-hydrokinetic power plant for production of both electrical and hydrogen energy under sensitivity analysis of various parameters (wind speed, radiation intensity, temperature, and water velocity) [42].
HOMER Pro-Based Techno-Economic Assessment of Hybrid Systems
HOMER Pro continues to be one of the most popular tools for hybrid micro grids due to its capability to provide simulation, optimization, and sensitivity analysis all within the same modeling framework. Based on the HOMER Pro User’s Manual, HOMER simulates the operation of a hybrid micro grid on an annual cycle through time periods of 1 min up to 1 hour, tests multiple configurations and ranks them based on various optimization criteria [4]. In the same manual, it is said that HOMER allows the user to perform sensitivity analysis by testing the influence of variables that cannot be controlled like wind speed and fuel price, while observing the best system configuration under such conditions [4].
The strengths of HOMER Pro-based research include the conversion of resource and component cost information as well as load requirements to metrics such as net present cost, cost per unit electricity, operating cost, renewable energy contribution percentage, emissions, and unmet load [28]. At the same time, it is implied by the literature that there is a significant limitation in using HOMER Pro analysis [29]. The accuracy of outcomes cannot be greater than the validity of the assumptions about resource conditions, load requirements, component costs, and sensitivity ranges. While deterministic analysis of the single annual resource profile can reveal least-cost optimal configuration, this approach is likely inadequate when dealing with climate variability.
Multi-Criteria Optimization and Decision-Making Approaches
A hybrid power system involving solar, wind, and hydrogen should not be evaluated based on just one parameter [30]. The optimal solution for costs may involve more emissions, increased unmet load, or even wasted renewable power [31]. Similarly, an almost zero-emission power generation plant may entail oversized generation and storage capacities, leading to high initial capital expenditure [32]. This leads to an optimization problem that involves multiple criteria such as cost, reliability, efficiency of renewable energy usage, emissions, and hydrogen production.
A prime example of this approach comes from Shi et al. [33], who modeled standalone and grid-connected wind-solar-hydrogen systems through HOMER Pro and assessed their viability via multi-criteria decision-making analysis. System specifications, energy production rates, costs, and levelized energy/hydrogen production costs were presented, which shows how multi-criteria assessment can be used to assess the performance of hydrogen systems [34]. Another related study is that conducted by Osifeko and Munda on stochastic optimal dispatch of renewable resources considering uncertainty in forecasting within a real-world power-system setting in South Africa, showing how scenario-based optimization approaches can become increasingly relevant for wind and solar-rich systems [35]. While the study does not focus on hydrogen micro grid sizing, it provides valuable information on uncertainty modeling within scenario-based optimization approaches for climate-influenced micro grid design.
Climate Sensitivity, Resource Variability and Renewable-System Resilience
It has now become evident that climate change poses challenges for the planning and design of renewable energy technologies owing to the fact that solar radiation, wind speed, temperature and water availability impact both the production and consumption of energy [36]. The relevant section on energy systems in the IPCC Working Group III report clearly indicates that in order to keep the increase in temperature limited, energy systems will need to be transformed substantially in terms of greater generation capacity from low and zero-carbon energy sources, greater electrification and the use of alternative fuels like hydrogen where electrification may not be possible [37].
This issue is further emphasized by recent literature on resilience. Xu et al. [38] examine the superimposed risks of climate change, extreme weather conditions, and renewable energy integration to resilience of the electricity system, arguing that the risks faced by electricity systems with high penetration of renewable energy under climate change may include damage to the infrastructure, reduced grid inertia, and slower recovery from extreme events. This point of view implies that distributed renewable energy, micro grids, distributed energy storage and modeling of climate-energy interactions should play a role in developing resilient zero-emission electricity systems. In the case of solar-wind-hydrogen systems, it implies that uncertainty around climate should not be considered a sensitivity analysis exercise but rather part of the design process.
The unpredictability of renewable energy is also reinforced in literature from the climate models domain. Effenberger and Knutti [39] point out that the projections for wind and solar energies are not yet certain, and an ensemble of regional and global climate models reveals large spread between projections of wind and solar energies. The significance of this fact for energy system planning lies in avoiding reliance on a single projection pathway. If there is no long-term data collected at a site, scientists usually use either satellite-based or reanalysis databases.
Relevance to South African Renewable Energy Planning
It is even more relevant to use climate-aware hybrid systems due to the particular South African environment. South Africa is characterized by its rich renewable-energy resource base, such as solar and wind energy, yet the implementation of renewable resources should take into account their variability, limitations of the grid, reliability and costs. As it was indicated in the stochastic optimization of South Africa’s power dispatch problem by Osifeko and Munda [35], renewable energy integration can only be approached in terms of the variability of both sources of energy and development of reliable, economical power dispatching.
For applications involving distributed generation or off-grid technologies, hybrid solar-wind-hydrogen systems might provide further benefits in that they would lessen reliance on fossil fuels and enhance energy independence. The addition of hydrogen could be most useful where excess renewable electricity could be used to produce a storable fuel, where clean fuel cells are required as backup power sources, or where the use of hydrogen itself could provide some value. Yet, for this type of system to become economically viable, one must consider the costs of system components, electrolyzer use rates, dispatching fuel cells, hydrogen storage capacity, and how much weight to place on reliability and environmental impacts.
Synthesis of Representative Literature
It can be concluded that the research presented in Table 1 provides illustrative examples of the growth in the research area and should not be taken alone as evidence of the development of the topic. In conjunction with other recent review papers focusing on hydrogen-based hybrid micro grids, HOMER Pro optimization, and assessment of climate risks, they point to an increasing trend to assess hybrid renewable energy systems based on various parameters. According to Yasmin et al. [27] and Shi et al. [33], hydrogen technologies become critical from an application point of view in terms of system reliability and multi-dimensional assessment of performance capabilities. The authors note that hydrogen technologies may serve as an effective solution to address intermittency problems associated with solar and wind generation and assist in meeting economic and environmental optimization criteria such as net present cost (NPC), levelized cost of energy (LCOE), and levelized cost of hydrogen (LCOH).
The importance of sensitivity analysis lies in the evaluation of system robustness [40]. Through sensitivity analysis of parameters of key climatic inputs, researchers have been able to observe the impact that relatively slight changes in the availability of renewable sources may exert on the performance capabilities of a system [41]. On a larger scale, Osifeko and Munda [35] applied their research results to discuss the potential of scenario-based stochastic modeling in managing uncertainty and designing energy policies in South Africa. Lastly, Xu et al. [38] widened the scope of analysis by stressing how the interplay of climate risks and extreme weather events influences the operation of renewable energy systems. The authors’ resilience-focused approach stresses the significance of planning hybrid energy systems that are not merely cost-efficient but also adaptive to climate risks and environmental threats.
In general, it becomes evident from the literature review that there is a consistent lack of studies that have considered all three factors (techno-economics, sustainability, and climate risks) in a holistic manner. This research gap explains the necessity of conducting this research that intends to design the solar-wind-hydrogen system through optimization under climate sensitivity. The present study uses a structured sensitivity analysis as a first-step robustness test.
Research Gap and Positioning of the Present Study
From the reviewed literature, it can be seen that the hybrid system using renewable energy, hydrogen storage, and techno-economic analysis by using HOMER Pro software are well established. Moreover, it also reveals that energy planning which accounts for uncertainties related to renewable variation, forecasting error, and climate change risks is receiving increasing interest. Nevertheless, three gaps are evident in the reviewed literature. Firstly, despite the increasing recognition of uncertainties associated with climate-resource variations, many applications of HOMER Pro still focus on least-cost design assuming the baseline resource condition. Secondly, while hydrogen is considered an additional part of the system, very few studies distinguish the long-term resilience benefit of hydrogen from the short-term balancing role played by battery storage.
To address these research gaps, this study introduces a design framework for a hybrid energy system combining solar, wind, battery storage, and hydrogen energy under resource availability sensitivity analysis. Instead of considering any particular combination simply based on its lowest levelized cost, this study performs a performance assessment of different combinations of technologies through technical, economic, and environmental criteria under normal and stressed climatic conditions. As a result, this study considers hydrogen energy not just a source of energy but a resilient element of renewable-based micro grids.
2. Materials and Methods
2.1. Case-Study System Boundary
In this investigation, the application is a case of renewable energy for a community near the coast of Durban, South Africa which enjoys plenty of solar resources and moderate coast wind speed. The load model is characterized by an average daily consumption of 2.8 MWh/day and a maximum load of 310 kW.
2.2. Resource and Sensitivity Scenarios
The monthly GHI, wind-speed, and ambient-temperature inputs used in HOMER Pro constitute the baseline resource profile for the Durban case-study system. To examine the robustness of system architectures, three structured sensitivity scenarios were imposed on the baseline profile. These scenarios were used as deterministic stress-test cases to evaluate how reduced renewable-resource availability and increased demand affect cost, renewable fraction, CO₂ emissions, unmet load, and hydrogen production. The values of monthly solar radiation, wind power and temperature used in the resource input for the hybrid system modelled using HOMER Pro are illustrated in Table 2. It can be seen from the solar radiation graph that there is a pronounced seasonality, whereby the highest monthly global horizontal irradiation (GHI) values occur in December (6.15 kWh/m²/day) and January (6.05 kWh/m²/day), while the lowest is observed in June (3.65 kWh/m²/day). This is critical because PV systems will be at their best during the summer when solar radiation is at its peak, while lower solar radiation levels during the winter months will put more pressure on the wind generator, the storage system and hydrogen systems.
The pattern seen for wind energy is slightly different. The wind speeds begin to rise after the middle part of the year, and peak in September (6.4 m/s). It is noted that there are also high wind speeds seen in August (6.2 m/s) and October (6.1 m/s). This indicates a favorable combination between wind and solar sources because there is a higher level of wind during the periods when solar energy is rising after the minimum experienced in winter months. In turn, this means that the use of these sources can be beneficial in terms of hybrid systems design and less dependence on any single renewable energy type.
Temperature levels range between 17.1 °C in July and 25.6 °C in January. The temperature regime is important in relation to PV technology due to the fact that increased temperatures lower the efficiency of photovoltaic energy conversion, and additionally, the level of electricity demand can be affected by high temperatures based on their use. In conclusion, the information provided in Table 2 forms a technically sound basis for modeling the resource.
Figure 1 depicts the monthly trend in global horizontal irradiance (GHI) and wind speed employed in the simulation. The solar profile shows a marked seasonal trend in which the irradiance level is relatively high in the initial and final months but low throughout the middle months. The GHI declines from an initial level of 6.05 kWh/m2/day in January to its minimum level of 3.65 kWh/m2/day in June and subsequently rises until December. This decline is significant in the design of the system since it suggests that the energy contribution of the photovoltaic system would be relatively low in the middle months.
On the other hand, the wind speed profile exhibits some different, yet complementing, characteristics. In the initial months, wind speed remains at an intermediate level, rising to peak during the middle part of the year and reaching its highest point of around 6.4 m/s during the month of September. This is highly beneficial since the availability of winds improves just when solar irradiation levels are increasing from their lowest winter values. Thus, there is a visual difference between the two profiles that validates the engineering justification behind integrating wind energy into the hybrid renewable energy system along with solar power plants.
In terms of planning, Figure 1 also reinforces the necessity of taking sensitivity scenario into account during the design process. The variability in GHI and wind speed is seen throughout the year, and even small fluctuations in the values assumed to occur each month will have an impact on generation adequacy, storage cycling, and hydrogen production, as well as the existence of any shortfall in generation. Figure 1 is therefore not simply a resource assessment but the physical justification for using a multi-criteria optimization approach in this research. A reliable solar-wind-hydrogen energy system must take into consideration the worst as well as the best months.
Table 4 presents four different climate and resource scenarios employed for the robust assessment of the candidate hybrid energy systems. The base case scenario, S0, reflects the reference operating point wherein no changes in solar resource, wind speed, and load have been made. All other climate and resource scenarios present different combinations of changes relative to the base case scenario that would correspond to various climate stresses and different power demand levels. Such scenario setting provides flexibility to go beyond deterministic sizing and to evaluate the robustness of each system configuration under unfavorable climate/resource conditions.
2.3. Basis and Interpretation of Climate-Resource Sensitivity Scenarios
The sensitivity scenarios for climate resources shown in Table 3 have been considered as stress test factors rather than deterministic projections for a particular climate year in the future. These stress test multipliers were chosen such that they represented modest deviations relative to the base-case Durban coastal resource conditions: lower solar, lower wind, higher ambient temperature, and higher electricity demand. The choice of this methodology follows from the aim of performing robustness tests, whereby each optimized solution is tested under adverse conditions, but it does not make the assumption that the specific stress condition is a projection into the future. This implies that the test set-up itself can be considered a sensitivity analysis exercise. The downside is that these multiplier values do not come from any downscaling or from a climatic time series.
In Table 4, Scenario S1 is defined with respect to the base case scenario S0 as follows: reduction in the solar resource multiplier by 0.08; an increase in temperature by 2.0 °C; an increase in load multiplier by 0.04. This particular scenario combination is significant as it takes into account the influence on the PV-dominated hybrid system configurations of the reduced availability of solar resource, increased operating temperatures and increased power consumption. Scenario S2 includes no change in the solar resource while reducing the wind speed multiplier to 0.88 and slightly increasing both temperature and load.

Table 4.
Climate-resource sensitivity scenarios used for robustness testing.
| Scenario | Solar resource multiplier | Wind speed multiplier | Ambient temperature increment (°C) | Load multiplier |
| S0 Baseline | 1.0 | 1.0 | 0.0 | 1.0 |
| S1 Low-solar / warm year | 0.92 | 1.0 | 2.0 | 1.04 |
| S2 Wind-deficit year | 1.0 | 0.88 | 1.0 | 1.02 |
| S3 Compound resource stress | 0.9 | 0.86 | 2.5 | 1.06 |
The S3 category under resource stress conditions represents the worst scenario, which incorporates a solar multiplication factor of 0.90, a wind speed multiplication factor of 0.86, and an increase in temperature by 2.5 °C, as well as an unmet load multiplication factor of 1.06. The value of scenario S3 lies in its potential utility in evaluating the robustness of configurations, since the objective is to assess their reliability under conditions of reduced supply and higher demand for renewable energy.
2.4. Systems Architectures and Decision Variables
Table 5 presents a comparison of four architectures of systems, which differ in their degree of renewable diversity, energy storage, and hydrogen inclusion. Architecture A is PV-battery combination with grid/diesel fallbacks. The PV capacity of this architecture equals 850 kW, while the capacity of battery storage reaches 2600 kWh. The system lacks wind turbine, electrolyzer, hydrogen tank and fuel cell. This combination of technologies is helpful as a point of comparison for other combinations due to its simplicity of design, although it offers limited flexibility in terms of energy storage.
Architecture B features 300 kW of wind turbines and lower capacities for PV (760 kW) and battery (2200 kWh). This architecture allows integrating different renewable energy sources into a single system, but still lacks hydrogen technology to convert excess renewable energy into storable form. In terms of the size of battery, this configuration has reduced it to 2200 kWh comparing to previous one. This indicates contribution of wind in covering part of load and decreasing the role of energy storage.
Hybrid system C consists of the entire hybrid combination: 900 kW solar power, 350 kW wind power, 1850 kWh of battery storage, an electrolyzer of 240 kW, a storage of hydrogen of 520 kg, and a fuel cell of 180 kW. This is the most optimal system configuration since it consists of short-term energy storage via batteries as well as long-term energy storage via hydrogen. In hybrid system D, the capacity for PV is 980 kW and that for wind is 420 kW. However, in addition to this, the capacity of the hydrogen system is also increased, but there is no battery at all.
Decision variables include photovoltaic capacity, wind turbine capacity, storage capacity, electrolyzer capacity, hydrogen tank capacity, and fuel cell capacity. For each architecture, HOMER Pro was used to identify the least-cost feasible component sizing within the specified decision-variable ranges. The resulting cost-optimal architectures were then compared using renewable fraction, CO₂ emissions, unmet load, hydrogen production, and a composite robustness index.
2.5. HOMER Pro Optimization Procedure and Design-Space Definition
The study used HOMER Pro for least-cost sizing and subsequently applies a multi-criteria comparison to assess whether the least-cost architecture also performs favorably in terms of emissions, renewable contribution, unmet load, and hydrogen production. While searching for the best capacities in HOMER Pro, we adopted architecture-based design space exploration rather than comparing a set of manual capacity configurations. In other words, for each architecture, the installed capacities of the existing components were considered as the decision variables and all possible configurations within the specified search limits were simulated by HOMER Pro. This software simulates chronological energy balance for each feasible configuration, computes lifecycle economic and technological performance indices, filters out infeasible systems in terms of reliability or operation constraints, and sorts feasible alternatives based on their net present cost. In this paper, however, the resulting architecture-based optimas were analyzed under resource-climate stresses and assessed using some environmental and reliability indicators. Thus, the component sizes shown in Table 6 should be considered as optimized within each specific architecture; the next stage of analysis focuses on robustness of the architecture-based optima under uncertainty conditions.
2.5. Objective Functions and Governing Equations
where is net present cost, is the capital cost, is the replacement cost, is the operation and maintenance cost, is the fuel cost and is the salvage value
where is the levelized cost of energy, is the total annual cost and is the total useful energy supplied to the load
where is the renewable fraction, is the energy generated from non-renewable sources and is the total energy generated by the system
where is the hydrogen production, is the electrolyzer efficiency, is the electrical energy supplied to the electrolyzer and is the lower heating value of the hydrogen
where is the unmet load percentage, is the energy demand that is failed to meet and
is the total energy demand
where is the normalized cost, is the normalized carbon emission and is the normalized unmet load
2.6. Optimization Constraints and Feasibility Criteria
The following constraints were used in HOMER Pro simulations and also during the post-processing analysis of the feasibility of the configurations. These constraints establish the feasible operating region for each configuration and guarantee that the generated results are feasible from a technical perspective.
Power balance:
where is the total power generated by the solar panels, is the total power generated by the wind turbines, is the total power generated by the fuel cell, is the total power generated by the grid/diesel generators, is the total battery discharging power, is the total power required by the electrical load, is the total power consumed by the electrolyzer to produce hydrogen, is the total battery charging power, is the total power dumped as excess and is the total power left unserved
Component capacity bounds:
where is the minimum capacity limit of the system component, is the maximum capacity limit of the system component, is the particular capacity limit. They both apply to the PV, wind turbine, battery, electrolyzer, H2 tank and fuel cell.
Battery State of Charge (SOC) limits:
is the minimum state of charge, is the maximum state of charge, is the state of charge at time t.
Battery transition:
where is the state of charge at time t, is the state of charge at time t – 1, is the charging efficiency, is the battery charging power, is the battery energy, is the battery discharging power, is the time step and is the battery discharging efficiency.
Hydrogen mass balance:
where is the total mass concentration of molecular hydrogen at a specific time t, is the total mass concentration of molecular hydrogen at a specific time t – 1, is the mass of hydrogen produced and is the mass of hydrogen consumed by the fuel cell.
Hydrogen storage limits:
where is the amount of hydrogen stored in the tank at time t, is the amount of hydrogen stored in the tank at maximum capacity.
Electrolyzer and fuel-cell limits:
where is the power consumed by the electrolyzer at time t, is the power rating of the electrolyzer, is the power generated by the fuel cell at time t and is the power rating of the fuel cell.
Reliability criterion:
where is the unserved energy, is the total load energy and is the maximum allowable unmet load ratio.
Renewable-fraction criterion:
where is the renewable fraction of the system and is the minimum required renewable energy threshold used in renewable-dominant scenarios.
3. Results
3.1. Baseline Multi-Criteria Performance of Cost-Optimized Architectures
Table 7 shows a summary of techno-economic, environmental, and reliability characteristics of the four designs. While configuration A has the lowest net present cost (3.82 million USD) and LCOE (0.214 kWh), it also has the lowest renewable contribution (76.4%), and the highest CO₂ emission rate (468 tons/year), as well as unmet load of 2.1%. This example demonstrates the drawback of a least-cost approach to design, where the lowest cost design may not be the most sustainable and reliable one in terms of emissions and adequacy of electricity generation.
Configuration B significantly increases the renewable share to 91.2%, and achieves the lowest level of emissions at only 109 tons/year, while also maintaining low LCOE of 0.228 USD per kWh. Therefore, addition of the wind turbines to PV-Batteries system proves to be very effective. However, even with this configuration no hydrogen is generated and a relatively high unmet load of 1.4% occurs. Configuration D generates the largest amount of hydrogen (45.6 tons/year), but due to the lack of batteries in the design it also experiences the largest unmet load of 1.8%, higher LCOE at 0.265 USD per kWh and lower composite robustness than Configuration C.
The configuration C stands out as the best compromise among all. Even though NPC and LCOE are relatively higher than the configurations A and B with $4.38 million and USD 0.246/kWh respectively, it offers the highest renewable energy fraction (98.7%), the least CO₂ emission rate (18 t/y), the lowest unmet load (0.3%) and the highest composite robustness index (0.713). This clearly indicates that the battery-hydrogen system has performed better than the standalone battery or hydrogen pathway systems. The multi-criteria analysis reveals that while the configuration C is not the most economical configuration, it is the most balanced one.
3.2. Weighting Rationale and Sensitivity of the Resilience Index
Resilience Index presented in Table 8 is considered a decision support index where normalized cost, carbon emission, and unmet load penalties are combined to create an index for comparative purposes. Baseline weights of 0.40, 0.35, and 0.25 have been adopted based on the consideration that, in planning, the cost still needs to be considered alongside environment and reliability factors to a large extent. Any weighted index might influence the result, which is why a sensitivity analysis has been conducted based on different weight scenarios. The aim here is not to establish the universal resilience index but to determine if the choice would change at all.
Among all the above-mentioned configurations for weighing, Configuration C stands out as the most optimal climate-resilient alternative because it entails the least unmet demand with very low emission levels while having a relatively modest LCOE. This index is hence applied to aid decision-making as opposed to being an indicator of resilience.
3.3. Pareto-Screening and Trade-Off Interpretation
Pareto screening presented in Table 9 was included as another perspective for interpreting the results in addition to the weighted resilience index. In Pareto screening, a configuration would be regarded as non-dominated if no other configuration offers lower LCOE, lower CO2 emissions, lower unmet load, and higher renewable share compared to the configuration being evaluated. This exercise is not intended to perform an exhaustive evolutionary Pareto front optimization but a simple screening process using only the HOMER Pro output data. On the basis of the baseline scenario, it can be observed that Configuration A stands out as the least-cost option, while Configuration C is the best combination of low-emission and reliable configuration. Configuration B finds itself somewhere in between while Configuration D faces competition from Configuration C because it involves a higher level of cost and unmet load despite the higher quantity of hydrogen production.
The relationship between LCOE and annual CO₂ emissions for the four optimized system configurations is depicted in Figure 2. It is evident from Figure 2 that the least-cost solution may not be the best for the environment. The configuration that results in the minimum LCOE, which is about 0.214 USD/kWh, is also characterized by the highest annual CO₂ emissions, amounting to roughly 468 t/y. It can, therefore, be inferred that although Configuration A is the economically optimal choice, this comes with a significant sacrifice for the environment.
On the other hand, Configuration B lies in an intermediary position on the LCOE vs. annual emissions plot, where the LCOE is slightly higher at 0.228 USD/kWh while emissions are reduced significantly to 109 t/y. The move from configuration A to configuration B is evidence of the benefits that accrue through the incorporation of wind power into the system design. While wind power helps reduce annual emissions, the resulting configuration does not fall within the low-emission regime observed in hydrogen integrated systems.
C and D configurations fall into the low-emissions part of the diagram, but Configuration C indicates the strongest cost–emission trade-off among the evaluated alternatives. Configuration C has LCOE value of roughly 0.246 USD/kWh with minimum emissions (18t/y), whereas Configuration D has more expensive LCOE (around 0.265 USD/kWh) with a little bit higher emissions rate (about 26t/y). Being placed as it is, Configuration C suggests that combining PV, wind, batteries, electrolyzer, hydrogen storage, and fuel cell will result in the best decarbonization process without causing the maximum expense cost increase. From the post-hoc multi-criteria comparison perspective, Figure 2 supports Configuration C as the preferred compromise for the baseline option because of its good compromise on costs and emission reduction.
3.4. Climate-Stress Sensitivity Results
Table 10 further builds upon the baseline comparison by analyzing all configurations in terms of their performance in the four climate-resource scenarios. All systems suffer performance losses under the impact of climatic stresses. Still, there are significant differences between the degrees of impact that various stress scenarios have on particular configurations. In this respect, the configuration A is the weakest from the environmental point of view. Thus, its renewable fraction decreases from 76.4% to 57.4%, its CO₂ emissions increase from 468.0 t/y to 823.7 t/y, and unmet load rises from 2.1% to 4.42%. It means that the system becomes less reliant on renewable sources of power supply under the influence of stress factors.
The configuration B demonstrates a higher level of stability compared to configuration A owing to the presence of wind generators. At the same time, it suffers noticeable loss in its performance under the compound stress scenario. Its renewable fraction is lower by 19%, while CO₂ emissions increase by 49.3% and unmet load grows from 1.4% to 2.95%. It shows the advantages of solar-wind complementary energy sources; however, the lack of hydrogen storage prevents achieving higher results.
The configuration C shows the highest stability within the scenario series. Its LCOE rises from 0.246 USD per kWh for the baseline scenario S0 to 0.254 USD per kWh for scenario S3, whereas the share of renewables reaches a level of 92.5% under stress. CO₂ emissions are somewhat higher, rising from 18.0 t/y to 22.8 t/y but still below 25 t/y for scenario S3, and the amount of unmet load stays under 0.5% in each case. Hydrogen production goes up as well, from 31.8 t/y to 37.8 t/y.
In all cases, Configuration D gives the highest production of hydrogen at 54.3 t/y when subject to compound stress; however, it also exhibits a significantly higher unmet load compared to Configuration C. When subjected to S3, the unmet load of Configuration D is 2.6%, while that of Configuration C is just 0.48%. One of the most important insights from the analysis of Table 6 is the finding that hydrogen storage is useful, but the lack of battery storage decreases flexibility and balance capacity. Hence, this analysis suggests the importance of adopting a hybrid storage approach, in which both batteries and hydrogen can be used. Generally, Table 6 provides evidence that Configuration C is the most climate-resilient configuration among the evaluated alternatives.
Figure 3 illustrates the impact of the sensitivity of LCOE under different scenarios for the four configurations. From the graph, one observes that there is an increase in the LCOE in the face of increasing difficulties as expected since the lower availability of renewable resources and increased load demands would result in higher stress on the generation/storage. It should be noted that the LCOE obtained in the compound resource-stress scenario was the highest of all scenarios, indicating that the conditions under this scenario were the toughest.
Nevertheless, the order in which the configurations rank is largely the same throughout all scenarios. Configuration A ranks first with regard to the lowest LCOE while Configuration D ranks last with respect to the highest LCOE. Nevertheless, cost considerations alone must not necessarily lead to a conclusion. Configuration A’s low LCOE must also be balanced with high emissions and low renewable share, while Configuration D’s high LCOE is due to the costly hydrogen-only storage with no gains in efficiency from using battery storage. This again supports the core message of the study that cost considerations alone cannot serve as a criterion for selecting the best system configuration.
Design C demonstrates relatively consistent and moderate sensitivity in terms of its LCOE relative to the different climate scenarios presented. While there is an increase in LCOE from the base case scenario to the combined stress scenario, such a shift is relatively small and is maintained at an intermediate level of the cost distribution while delivering high reliability and low emissions performance. In particular, this is an important consideration since it is not just sufficient for the resilient design to be effective during normal circumstances; it should also be cost-effective during a shortfall in renewable energy generation.
3.5. Recommended Design
Design C is considered the preferred compromise under the selected techno-economic, environmental and reliability criteria: 900 kW photovoltaics, 350 kW wind power, 1.85 MWh battery energy, 240 kW electrolysis capacity, 520 kg hydrogen storage, and 180 kW fuel cell. This design has been chosen since it achieves a high renewable share, low emissions, unmet load, and climate resilience.
4. Discussion
The value of the analysis is to show whether the relative performance of the system architectures changes when solar availability, wind availability, ambient temperature, and demand are stressed simultaneously or individually. The results of the above discussion have shown an integrative and clear vision on how hydrogen technology contributes to the operation of hybrid systems with solar, wind, and battery technologies while facing resource availability sensitivity in the climate. In line with previous discussions, hydrogen technology does not aim to substitute other technologies such as batteries. Instead, hydrogen serves as additional and long-term energy storage technology that improves resilience in hybrid systems with renewables. Batteries help overcome short-term variations and provide smooth system operation, while hydrogen helps to store excess renewable energy.
From a technical and economic viewpoint, hydrogen contributes to the increment of the Net Present Cost (NPC) and Levelized Cost of Energy (LCOE) due to higher capital costs of electrolysis units, hydrogen storage tanks, and fuel cells, as well as lower efficiency in the conversion of energy. Such a perspective, however, remains incomplete since environmental goals and reliability requirements cannot be neglected. Therefore, hybrid systems with hydrogen technology perform better than conventional solutions while incorporating environmental goals and reliability requirements.
Indeed, the findings emphasize the limitations associated with applying purely deterministic optimization techniques. It is evident from the sensitivity analysis with respect to the climate factors that solar irradiation, wind speed, and temperature variation affect the performance of the renewable system. The configurations which have been considered as optimal under constant climate conditions may become less efficient once subject to climate changes. Therefore, using the resource availability sensitivity-based model can be beneficial, especially when designing systems for prolonged planning horizons.
The inclusion of the resilience performance index, as the criterion for assessment and comparison, presents a broader range of options. Using the composite index, based on financial, environmental, and reliability measures, allows assessing various performance characteristics of energy generation units in an integrated manner. The obtained results indicate that those systems, which incorporate hydrogen storage facilities, provide better performance according to the resilience measure.
In addition, the implications of the results for energy planning in areas such as South Africa are important given the ongoing challenges related to variability of renewable resources and grid capacity. The capability of hydrogen-based systems to store energy seasonally and dispatch it during long periods of low renewable output makes them key elements in any low-carbon energy future. In this scenario, supportive policies, along with technological progress leading to reduced costs, will be key factors.
The current work thus provides an important contribution to the increasing number of studies stressing the importance of using a comprehensive approach to optimizing hybrid energy systems based on least cost sizing and multi-criteria assessment under climate-resource sensitivity scenarios. Indeed, future investigations should go beyond simply minimizing costs in their optimization strategies and consider more broadly sustainability criteria.
5. Conclusions
Indeed, the current analysis is an attempt to comprehensively evaluate the techno-economic performance, environmental impact, and reliability attributes of hybrid solar-wind-hydrogen energy systems in the context of resource availability sensitivity of climatic conditions. Based on the results of this work, there can be no doubt that incorporation of hydrogen into the energy storage process of such hybrid renewable systems greatly increases their operational efficiency. Unlike traditional storage techniques, hydrogen ensures effective use of excess energy from renewable sources which is critical to achieving maximum sustainability.
Discussing about the economic aspect of the problem in question, one should note that hydrogen systems are characterized by rather high initial capital cost compared to traditional energy systems. Moreover, it turns out that NPC and LCOE for the latter configuration can be lower than those calculated for systems based on hydrogen. However, as soon as one takes into account other attributes of system performance, such as reliability, reduction of unmet load, and carbon emissions, the use of hydrogen proves to be beneficial.
Further consideration of the variability in climate shows the relevance of moving away from deterministic system designs due to the high sensitivity of system performance to renewable sources like solar irradiance and wind speeds. In this regard, systems that may be considered ideal in terms of performance under deterministic conditions may not necessarily perform better in real life, especially considering climatic variations. Therefore, there is the need to incorporate stochastic-based design approaches in future research efforts.
Additionally, use of an integrated resilience index is an important step towards understanding the effectiveness of any system based on its capacity to adapt, recover, and cope with uncertainties. From the findings, it becomes evident that the use of hydrogen-based system designs leads to higher values of resilience indexes, making these designs more favorable than others. This approach to energy systems analysis allows for simultaneous consideration of the different aspects of performance.
Finally, for regions characterized by energy challenges such as South Africa, the insights from this study have significant implications on policy and infrastructure. Particularly, in light of the potential challenges in renewable integration into power grids, hydrogen-powered hybrid systems provide promising prospects for attaining sustainable and low-carbon energy systems.
In summary, the research presented here makes significant contributions to the increasing literature on designing hybrid renewable energy systems through the identification of the importance of hydrogen in creating sustainable energy transitions that are resilient. Further research should concentrate on lowering the costs associated with hydrogen systems, increasing electrolyzer efficiency, and implementing other optimization techniques including stochastic and multi-objective algorithms.
Author Contributions
M.E.: Conceptualization, Investigation, Methodology, Writing—original draft and preparation. O.B.: Investigation, Methodology, Writing—review and editing. O.O.: Methodology, Supervision, Funding acquisition. All authors have read and agreed to the published version of the manuscript.
Funding
This research was funded by the Institute of Systems Science, Durban University of Technology, Durban, South Africa.
Data Availability Statement
The data will be provided on request.
Acknowledgments
The authors wish to thank the Institute of Systems Science, Durban University of Technology, Durban, South Africa.
Conflicts of Interest
No conflict of interest.
Disclosure Statement on Generative AI
During the preparation of this work, the authors used ChatGPT to assist in the creation of scientific illustrations based on prompts designed by the re-search team. The final output of these figures was carefully reviewed and verified for scientific accuracy and originality by the authors, who take full responsibility for the content of the manuscript.
References
- M. U. Emezirinwune, I. A. Adejumobi, O. I. Adebisi, and F. G. Akinboro, “Off-grid PV/biomass/DG/battery hybrid renewable energy as a source of electricity for a farm facility,” e-Prime-Advances Electr. Eng. Electron. Energy, vol. 10, p. 100808, 2024. [CrossRef]
- E. Rezaee and S. R. P. Silva, “Solar energy in 2025: Global deployment, cost trends, and the role of energy storage in enabling a resilient smart energy infrastructure,” Energy Environ. Mater., vol. 9, no. 3, p. e70199, 2026. [CrossRef]
- M. U. Emezirinwune, I. A. Adejumobi, O. I. Adebisi, and F. G. Akinboro, “Synergizing Hybrid Renewable Energy Systems and Sustainable Agriculture for Rural Development in Nigeria,” e-Prime-Advances Electr. Eng. Electron. Energy, p. 100492, 2024. [CrossRef]
- R. Qu, R. Kou, and T. Zhang, “The impact of weather variability on renewable energy consumption: insights from explainable machine learning models,” Sustainability, vol. 17, no. 1, p. 87, 2025. [CrossRef]
- M. J. B. Kabeyi and O. A. Olanrewaju, “Sustainable energy transition for renewable and low carbon grid electricity generation and supply,” Front. Energy Res., vol. 9, p. 1032, 2022. [CrossRef]
- M. Ohba, Y. Kanno, and S. Bando, “Effects of meteorological and climatological factors on extremely high residual load and possible future changes,” Renew. Sustain. Energy Rev., vol. 175, p. 113188, 2023. [CrossRef]
- I. E. Atawi, A. Q. Al-Shetwi, A. M. Magableh, and O. H. Albalawi, “Recent advances in hybrid energy storage system integrated renewable power generation: Configuration, control, applications, and future directions,” Batteries, vol. 9, no. 1, p. 29, 2022. [CrossRef]
- L. Panagoda et al., “Advancements in photovoltaic (Pv) technology for solar energy generation,” J. Res. Technol. Eng, vol. 4, no. 3, pp. 30–72, 2023.
- Q. Meng, Y. Huang, L. Li, F. Wu, and R. Chen, “Smart batteries for powering the future,” Joule, vol. 8, no. 2, pp. 344–373, 2024. [CrossRef]
- S. W. Boettcher, “Introduction to green hydrogen,” Chemical Reviews, vol. 124, no. 23. ACS Publications, pp. 13095–13098, 2024. [CrossRef]
- S. G. Nnabuife, K. A. Quainoo, A. K. Hamzat, C. K. Darko, and C. K. Agyemang, “Innovative strategies for combining solar and wind energy with green hydrogen systems,” Appl. Sci., vol. 14, no. 21, p. 9771, 2024. [CrossRef]
- A. M. Garcia, J. Gallagher, J. A. R. Diaz, and A. McNabola, “An economic and environmental optimization model for sizing a hybrid renewable energy and battery storage system in off-grid farms,” Renew. Energy, vol. 220, p. 119588, 2024. [CrossRef]
- A. Khan, M. Bressel, A. Davigny, D. Abbes, and B. Ould Bouamama, “Comprehensive review of hybrid energy systems: challenges, applications, and optimization strategies,” Energies, vol. 18, no. 10, p. 2612, 2025. [CrossRef]
- M. Patin, S. Bégot, F. Gustin, and V. Lepiller, “Enhancing Residential Sustainability: Multi-objective optimization of hydrogen-based multi-energy system,” Int. J. Hydrogen Energy, vol. 67, pp. 875–887, 2024. [CrossRef]
- S. V. Tyagi and M. K. Singhal, “A comprehensive review of sizing and uncertainty modeling methodologies for the optimal design of hybrid energy systems,” Int. J. Green Energy, vol. 21, no. 7, pp. 1567–1612, 2024. [CrossRef]
- J. Jewell and A. Cherp, “The feasibility of climate action: Bridging the inside and the outside view through feasibility spaces,” Wiley Interdiscip. Rev. Clim. Chang., vol. 14, no. 5, p. e838, 2023. [CrossRef]
- M. Borunda, A. Ram\’\irez, R. Garduno, C. Garc\’\ia-Beltrán, and R. Mijarez, “Enhancing long-term wind power forecasting by using an intelligent statistical treatment for wind resource data,” Energies, vol. 16, no. 23, p. 7915, 2023. [CrossRef]
- R. Newman and I. Noy, “The global costs of extreme weather that are attributable to climate change,” Nat. Commun., vol. 14, no. 1, p. 6103, 2023. [CrossRef]
- O. K. Ajiboye, C. V. Ochiegbu, E. A. Ofosu, and S. Gyamfi, “A review of hybrid renewable energies optimisation: design, methodologies, and criteria,” Int. J. Sustain. Energy, vol. 42, no. 1, pp. 648–684, 2023. [CrossRef]
- E. S. Ali et al., “Intelligent Dispatch-Based Optimization of Hybrid Renewable Architectures Incorporating Electric Mobility and Hydrogen Storage for Commercial Energy Systems,” IEEE Access, vol. 14, pp. 22178–22210, 2026. [CrossRef]
- S. A. Shezan et al., “Evaluation of different optimization techniques and control strategies of hybrid microgrid: A review,” Energies, vol. 16, no. 4, p. 1792, 2023. [CrossRef]
- D. E. Babatunde, O. M. Babatunde, M. U. Emezirinwune, I. H. Denwigwe, T. E. Okharedia, and O. J. Omodara, “Feasibility analysis of an off-grid photovoltaic-battery energy system for a farm facility,” Int. J. Electr. Comput. Eng., vol. 10, no. 3, pp. 2874–2883, 2020. [CrossRef]
- F. J. M. Torres, M. Mateus, M. Jânio, and others, “Thermal Energy Storage in Renewable Energy Communities: A State-of-the-Art Review,” Energies, vol. 19, no. 5, p. 1363, 2026.
- O. M. Babatunde, J. L. Munda, and Y. Hamam, “A comprehensive state-of-the-art survey on power generation expansion planning with intermittent renewable energy source and energy storage,” Int. J. Energy Res., vol. 43, no. 12, pp. 6078–6107, 2019.
- R. Z. Falama, V. Dumbrava, A. S. Saidi, E. T. Houdji, C. Ben Salah, and S. Y. Doka, “A comparative-analysis-based multi-criteria assessment of on/off-grid-connected renewable energy systems: a case study,” Energies, vol. 16, no. 3, p. 1540, 2023. [CrossRef]
- P. Tiam Kapen, B. A. Medjo Nouadje, V. Chegnimonhan, G. Tchuen, and R. Tchinda, “Techno-economic feasibility of a PV/battery/fuel cell/electrolyzer/biogas hybrid system for energy and hydrogen production in the far north region of cameroon by using HOMER pro,” Energy Strateg. Rev., vol. 44, p. 100988, 2022. [CrossRef]
- R. Yasmin, M. N. Nabi, F. Rashid, and M. A. Hossain, “Solar, wind, hydrogen, and bioenergy-based hybrid system for off-grid remote locations: Techno-economic and environmental analysis,” Clean Technol., vol. 7, no. 2, p. 36, 2025.
- S. E. Nwachukwu, K. A. Folly, K. O. Awodele, S. O. Omogoye, and K. K. Adeyemo, “Hybrid Renewable Energy Optimization Using HOMER Pro: A Systematic Literature Review and Future Research Agenda for Emerging Economies,” IEEE Access, 2026. [CrossRef]
- M. Ur Rashid, I. Ullah, M. Mehran, M. N. R. Baharom, and F. Khan, “Techno-economic analysis of grid-connected hybrid renewable energy system for remote areas electrification using homer pro,” J. Electr. Eng. Technol., vol. 17, no. 2, pp. 981–997, 2022. [CrossRef]
- A. Alzahrani, S. K. Ramu, G. Devarajan, I. Vairavasundaram, and S. Vairavasundaram, “A review on hydrogen-based hybrid microgrid system: Topologies for hydrogen energy storage, integration, and energy management with solar and wind energy,” Energies, vol. 15, no. 21, p. 7979, 2022. [CrossRef]
- M. A. Binmahfouz, M. A. M. Ramli, and A. H. Milyani, “Optimal distributed PV system assessment for renewable energy based microgrid application in Makkah, Saudi Arabia,” Sci. Rep., vol. 15, no. 1, p. 38230, 2025. [CrossRef]
- A. Bhatt, W. Ongsakul, and others, “Optimal techno-economic feasibility study of net-zero carbon emission microgrid integrating second-life battery energy storage system,” energy Convers. Manag., vol. 266, p. 115825, 2022. [CrossRef]
- J. Shi et al., “Multi-Criteria Optimization and Techno-Economic Assessment of a Wind--Solar--Hydrogen Hybrid System for a Plateau Tourist City Using HOMER and Shannon Entropy-EDAS Models,” Energies, vol. 18, no. 15, p. 4183, 2025. [CrossRef]
- A. Peecock, R. Al Shabibi, D. Haro-Monteagudo, and A. Martinez-Felipe, “A new tool to assess the technical, economic, and environmental impacts of green hydrogen generation via water electrolysis using a multi-criteria decision analysis model,” Int. J. Hydrogen Energy, vol. 198, p. 152750, 2026. [CrossRef]
- M. Osifeko and J. Munda, “Scenario-Based Stochastic Optimization for Renewable Integration Under Forecast Uncertainty: A South African Power System Case Study,” Processes, vol. 13, no. 8, p. 2560, 2025. [CrossRef]
- N. Girgibo, E. Hiltunen, X. Lü, A. Mäkiranta, and V. Tuomi, “Risks of climate change effects on renewable energy resources and the effects of their utilisation on the environment,” Energy Reports, vol. 11, pp. 1517–1534, 2024. [CrossRef]
- L. Clarkero et al., “Energy Systems (Chapter 6),” IPCC 2022 Clim. Chang. 2022 Mitig. Clim. Chang. Contrib. Work. Gr. III to Sixth Assess. Rep. Intergov. Panel Clim. Chang., pp. 613–746, 2023.
- L. Xu et al., “Resilience of renewable power systems under climate risks,” Nat. Rev. Electr. Eng., vol. 1, no. 1, pp. 53–66, 2024. [CrossRef]
- N. Effenberger and R. Knutti, “Uncertainty in wind and solar projections depends on global and regional climate models,” arXiv Prepr. arXiv2603.20052, 2026.
- Y. Z. Alharthi, “An analysis of hybrid renewable energy-based hydrogen production and power supply for off-grid systems,” Processes, vol. 12, no. 6, p. 1201, 2024. [CrossRef]
- P. K. Kushwaha and C. Bhattacharjee, “An extensive review of the configurations, modeling, storage technologies, design parameters, sizing methodologies, energy management, system control, and sensitivity analysis aspects of hybrid renewable energy systems,” Electr. Power Components Syst., vol. 51, no. 20, pp. 2603–2642, 2023. [CrossRef]
- T. Xia et al., “Techno-economic assessment of a grid-independent hybrid power plant for co-supplying a remote micro-community with electricity and hydrogen,” Processes, vol. 9, no. 8, p. 1375, 2021. [CrossRef]
Figure 1.
Monthly renewable-resource profile used for the simulation case study.
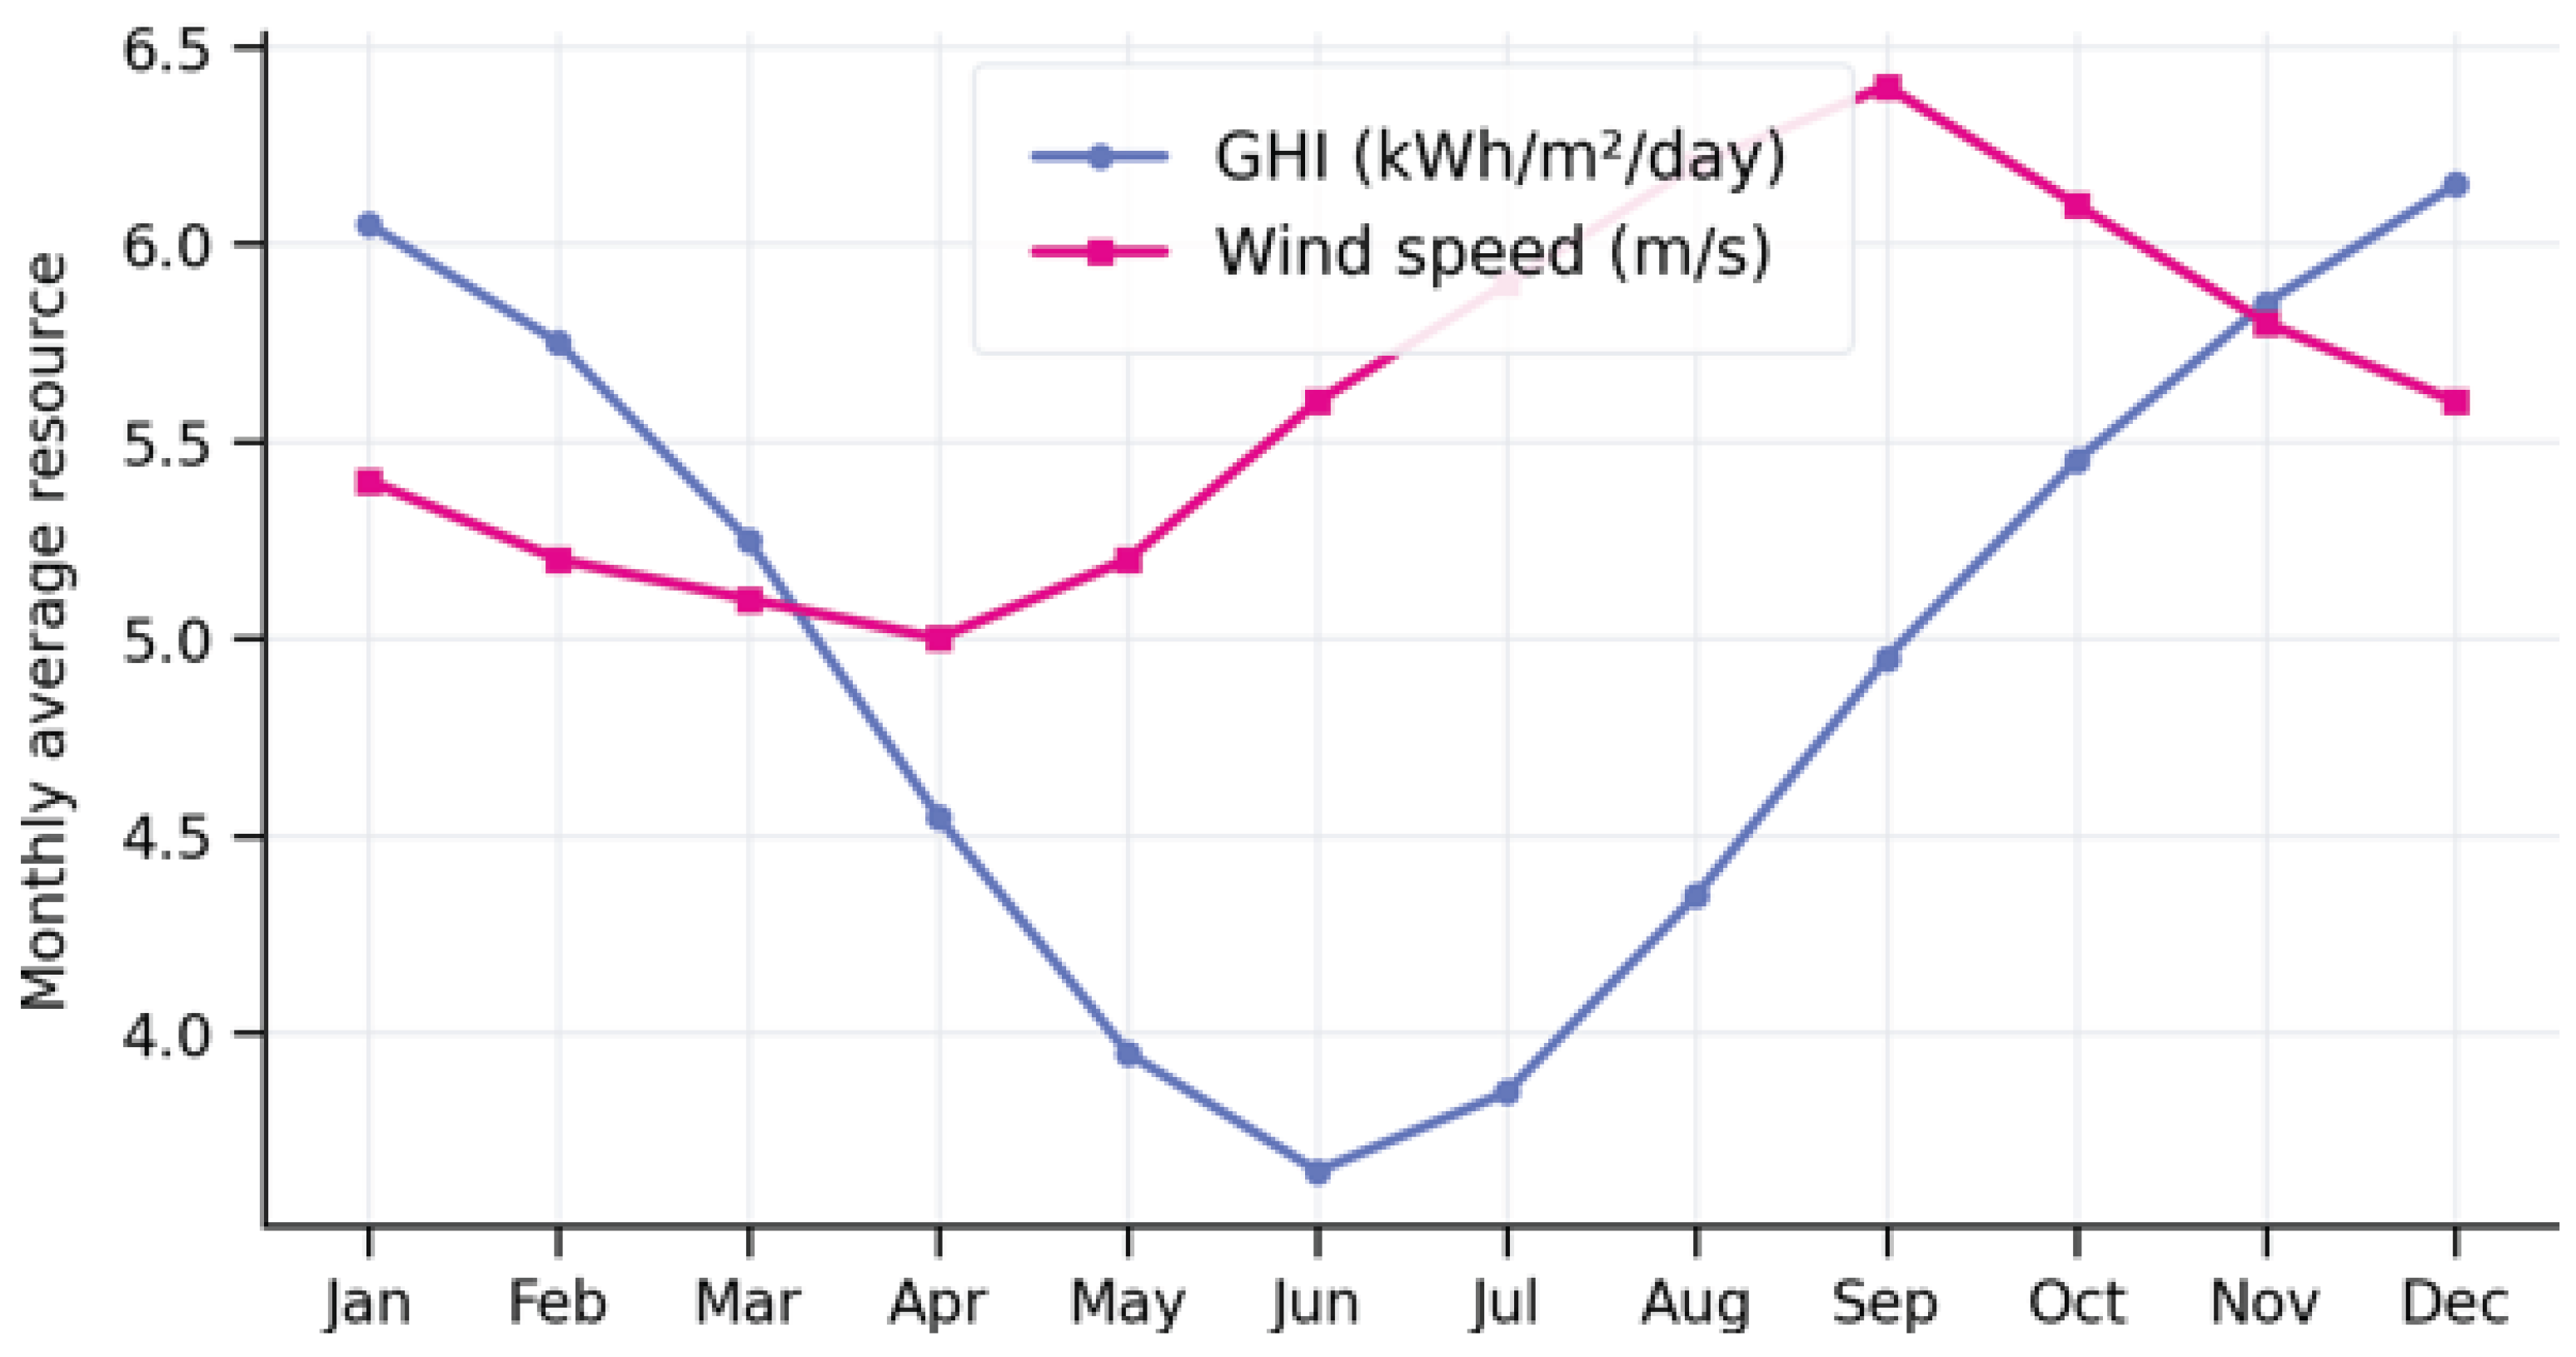
Figure 2.
Baseline cost–carbon trade-off among optimized system configurations.
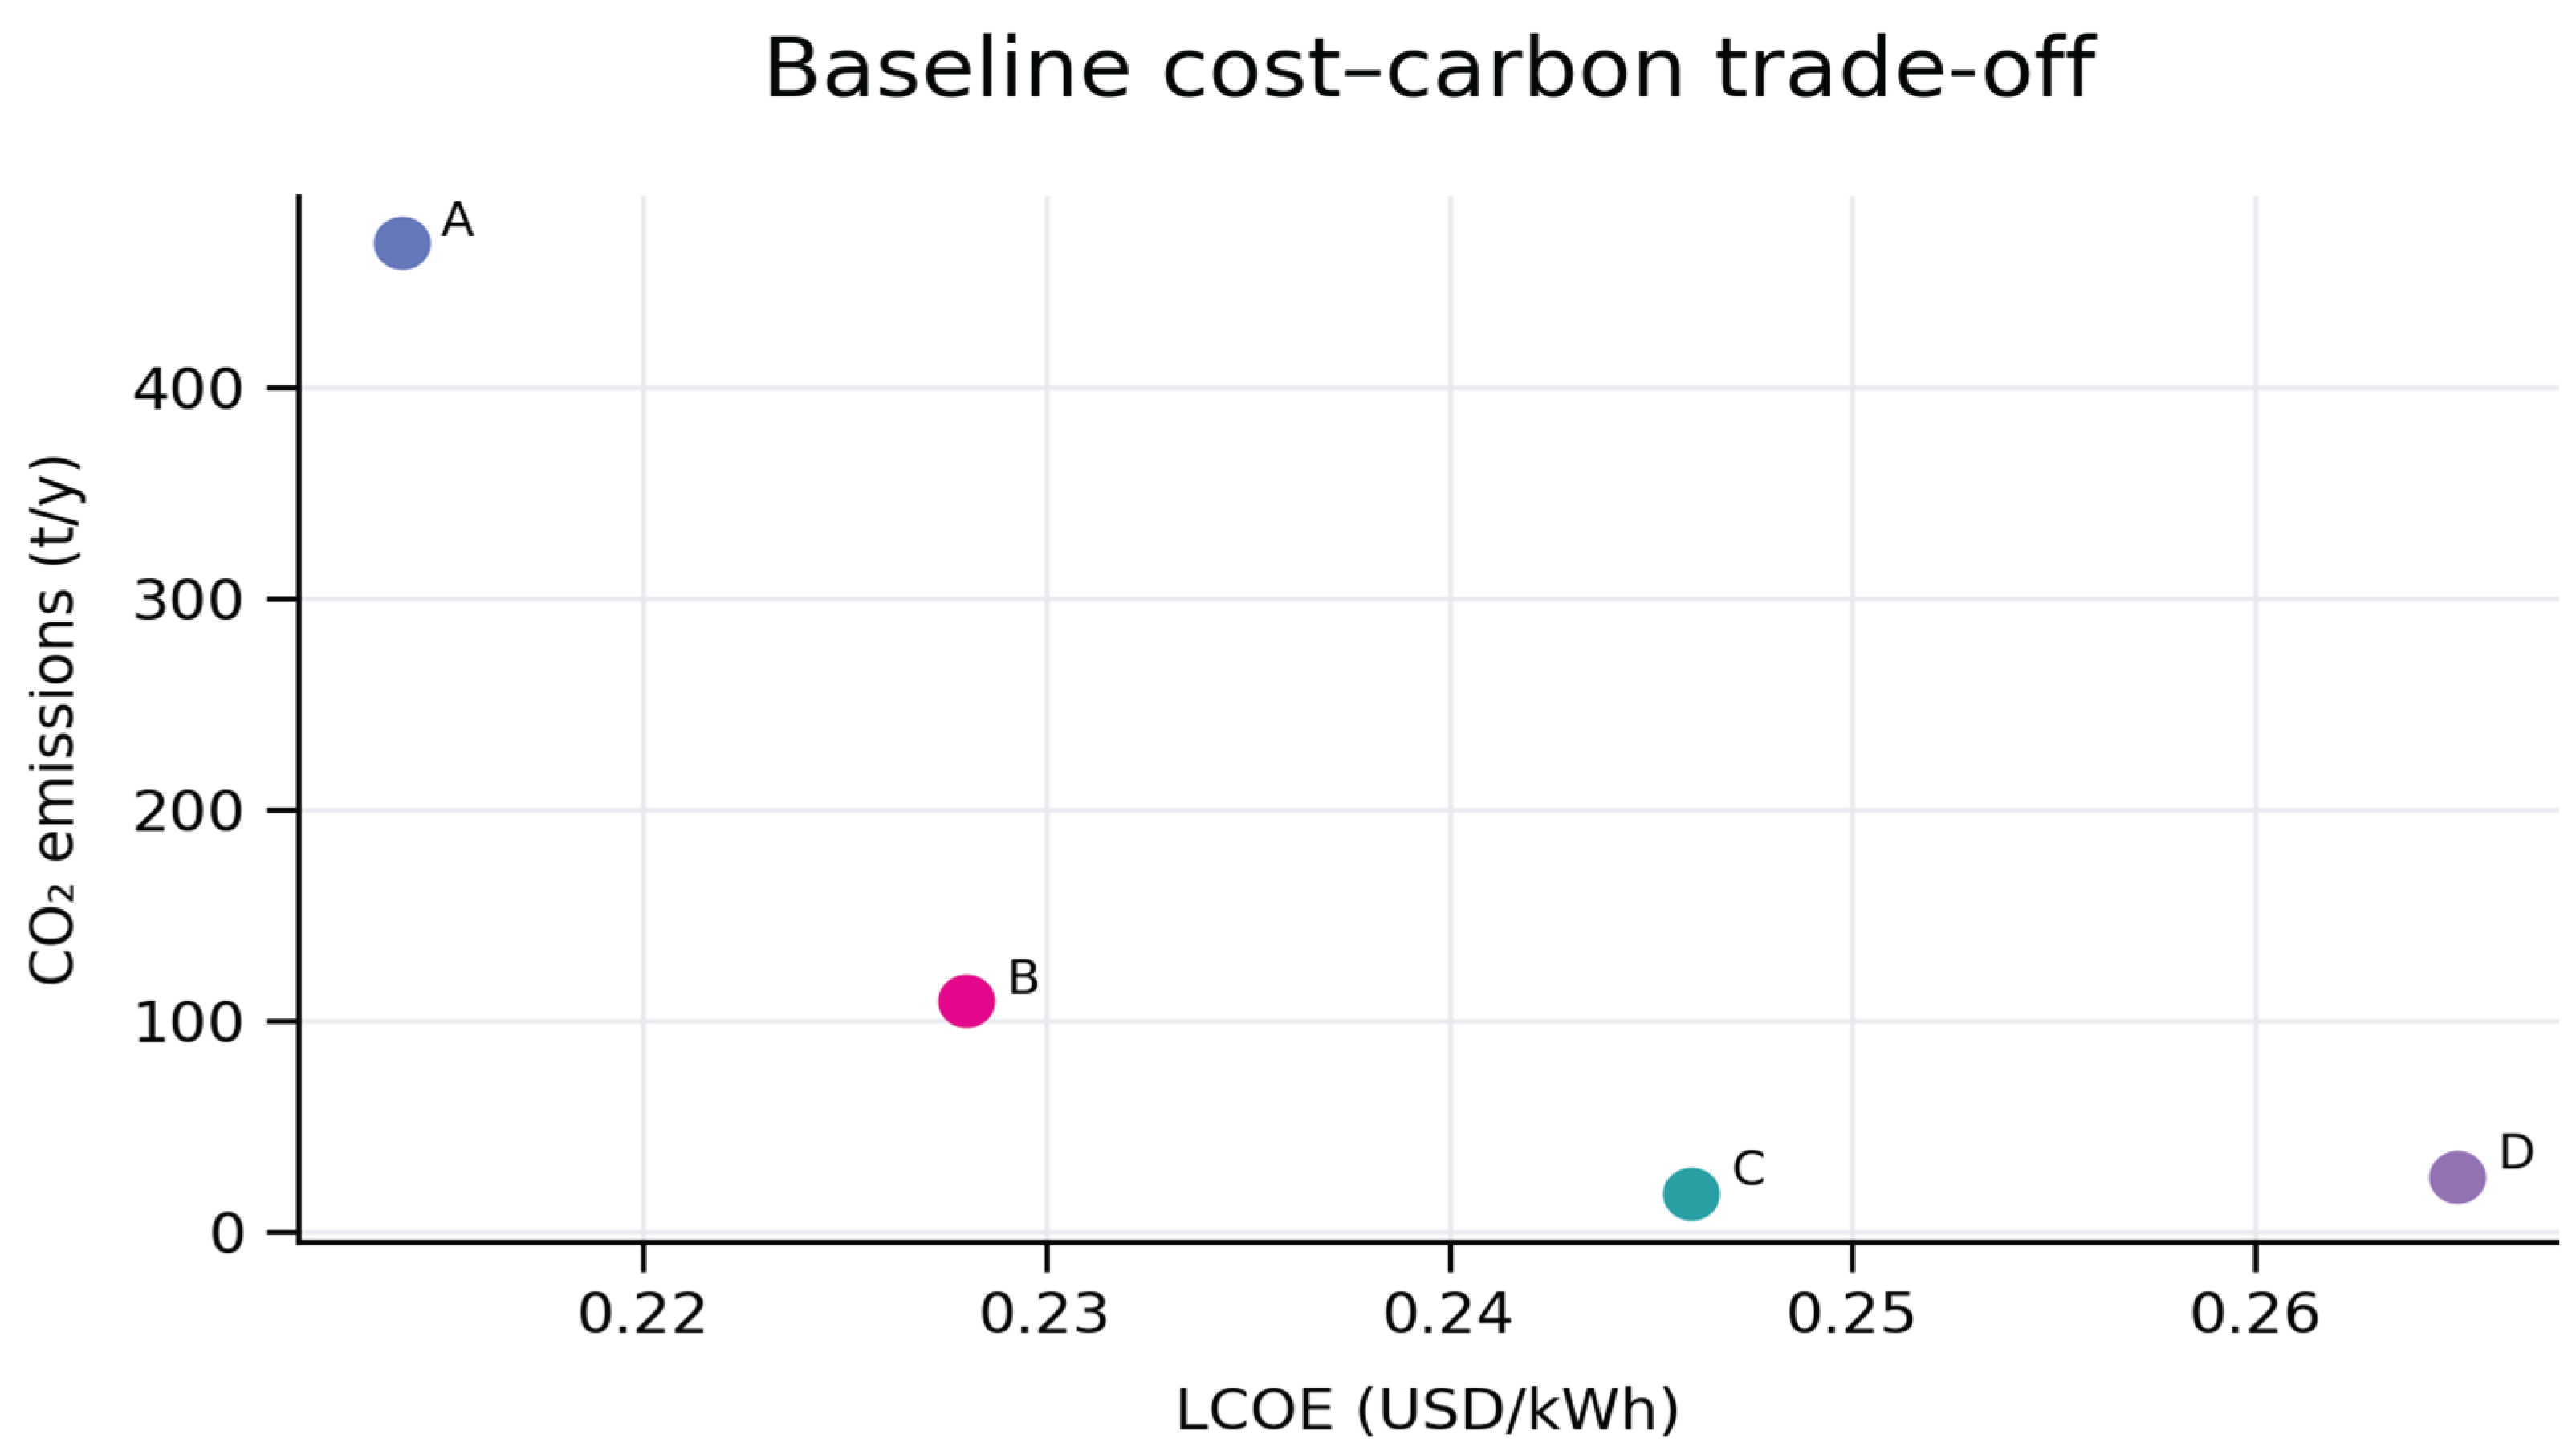
Figure 3.
Levelized cost sensitivity of each architecture under climate-resource uncertainty.
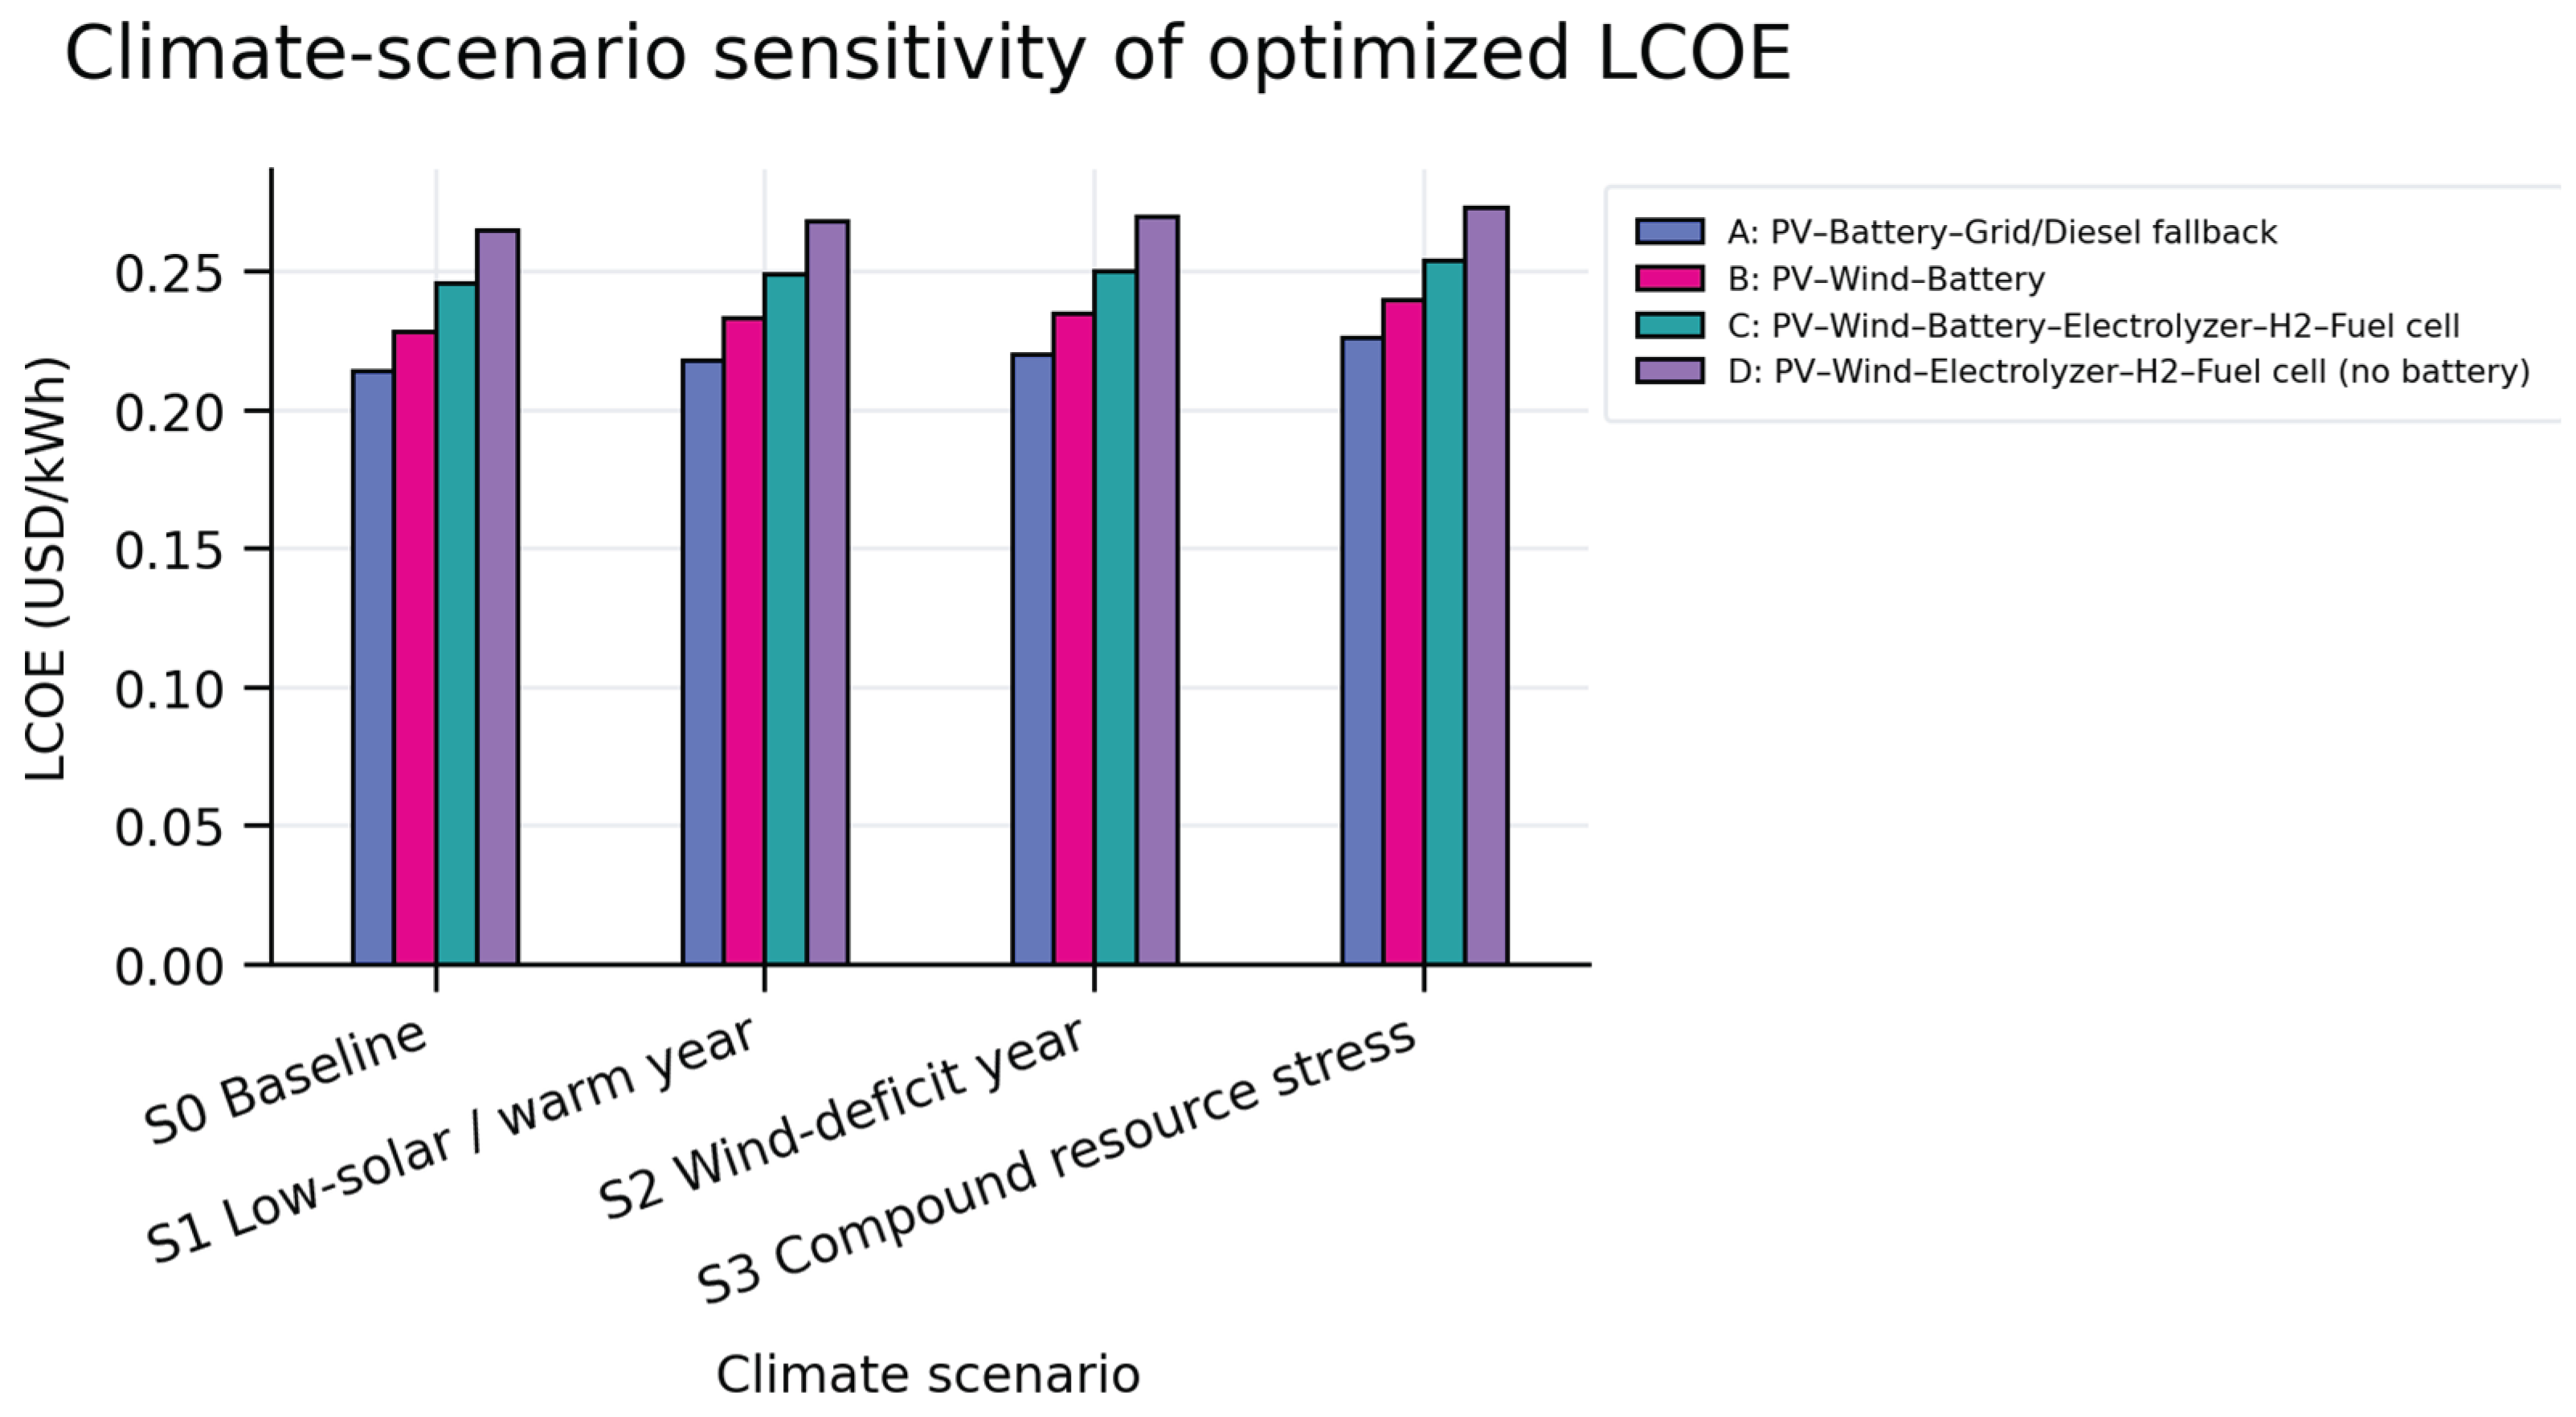
Table 1.
Synthesis of representative studies relevant to hybrid solar–wind–hydrogen design under climate-resource sensitivity scenarios.
Table 1.
Synthesis of representative studies relevant to hybrid solar–wind–hydrogen design under climate-resource sensitivity scenarios.
| Study | System/Context | Methodological focus | Relevance to the present topic |
| Yasmin et al. [27] | Solar–wind–hydrogen–biofuel off-grid system | HOMER Pro techno-economic and environmental assessment | Hydrogen-based fuel-cell backup contributed to reliability in the modeled off-grid system. |
| Shi et al. [33] | Wind–solar–hydrogen stand-alone and grid-connected systems | HOMER Pro with multi-criteria decision analysis | Evaluated electricity, hydrogen production, NPC, LCOE and LCOH for hydrogen-oriented hybrid systems. |
| Xia et al. [42] | Off-grid solar/wind/hydrokinetic electricity–hydrogen system | HOMER with sensitivity analysis | Tested impacts of ±10% fluctuations in wind speed, solar radiation, temperature and water velocity. |
| Osifeko and Munda [35] | South African renewable integration under uncertainty | Scenario-based stochastic optimization | Addressed variability of wind and solar generation and reliable dispatch under uncertainty. |
| Xu et al. [38] | Renewable power systems under climate risks | Perspective and resilience analysis | Discussed superimposed climate, extreme-weather and renewable-integration risks for power-system resilience. |
Table 2.
Monthly renewable-resource and temperature.
| Month | GHI (kWh/m²/day) | Wind speed at 50 m (m/s) | Ambient temperature (°C) |
| Jan | 6.05 | 5.4 | 25.6 |
| Feb | 5.75 | 5.2 | 25.4 |
| Mar | 5.25 | 5.1 | 24.3 |
| Apr | 4.55 | 5.0 | 22.3 |
| May | 3.95 | 5.2 | 19.8 |
| Jun | 3.65 | 5.6 | 17.5 |
| Jul | 3.85 | 5.9 | 17.1 |
| Aug | 4.35 | 6.2 | 18.2 |
| Sep | 4.95 | 6.4 | 20.1 |
| Oct | 5.45 | 6.1 | 21.6 |
| Nov | 5.85 | 5.8 | 23.0 |
| Dec | 6.15 | 5.6 | 24.7 |
Table 3.
Climate Resource Sensitivity Scenarios.
| Scenario element | Interpretation | Reason for inclusion |
| Solar sensitivity below 1.0 | Stress condition representing lower irradiance availability relative to baseline | Tests PV-dominated system vulnerability |
| Wind sensitivity below 1.0 | Stress condition representing lower wind-resource availability relative to baseline | Tests dependence on wind complementarity |
| Temperature increase | Warmer operating condition affecting PV performance and demand | Captures thermal and demand stress |
| Load sensitivity above 1.0 | Higher demand condition relative to the baseline load profile | Tests adequacy during increased consumption |
Table 5.
Systems architectures and optimized component sizes.
| Configuration | PV (kW) | Wind (kW) | Battery (kWh) | Electrolyzer (kW) | H2 tank (kg) | Fuel cell (kW) |
| A: PV–Battery–Grid/Diesel fallback | 850 | 0 | 2600 | 0 | 0 | 0 |
| B: PV–Wind–Battery | 760 | 300 | 2200 | 0 | 0 | 0 |
| C: PV–Wind–Battery–Electrolyzer–H2–Fuel cell | 900 | 350 | 1850 | 240 | 520 | 180 |
| D: PV–Wind–Electrolyzer–H2–Fuel cell (no battery) | 980 | 420 | 0 | 330 | 880 | 260 |
Table 6.
Systems architectures and retained optimized component sizes obtained after HOMER Pro design-space search and feasibility screening.
Table 6.
Systems architectures and retained optimized component sizes obtained after HOMER Pro design-space search and feasibility screening.
| Decision variable | Search range | Resolution/step | Purpose |
| PV array capacity | 0–1,200 kW | 20–50 kW | Lifecycle-cost minimization subject to reliability and renewable constraints |
| Wind turbine capacity | 0–600 kW | 50 kW | Solar–wind complementarity and fossil-backup reduction |
| Battery storage capacity | 0–3,000 kWh | 100–250 kWh | Short-duration balancing and unmet-load reduction |
| Electrolyzer capacity | 0–400 kW | 20–50 kW | Conversion of surplus renewable electricity to hydrogen |
| Hydrogen tank capacity | 0–1,000 kg | 50–100 kg | Long-duration chemical storage |
| Fuel-cell capacity | 0–300 kW | 20–50 kW | Hydrogen-to-electricity dispatch during renewable deficits |
Table 7.
Baseline multi-criteria simulation results.
| Configuration | NPC (MUSD) | LCOE (USD/kWh) | Renewable fraction (%) | CO2 emissions (t/y) | Unmet load (%) | Hydrogen produced (t/y) | Composite robustness index |
| A: PV–Battery–Grid/Diesel fallback | 3.82 | 0.214 | 76.4 | 468.0 | 2.1 | 0.0 | 0.4 |
| B: PV–Wind–Battery | 4.06 | 0.228 | 91.2 | 109.0 | 1.4 | 0.0 | 0.653 |
| C: PV–Wind–Battery–Electrolyzer–H2–Fuel cell | 4.38 | 0.246 | 98.7 | 18.0 | 0.3 | 31.8 | 0.713 |
| D: PV–Wind–Electrolyzer–H2–Fuel cell (no battery) | 4.71 | 0.265 | 97.9 | 26.0 | 1.8 | 45.6 | 0.379 |
Table 8.
Resilience Index.
| Weighting case | Cost weight | CO2 weight | Unmet-load weight | Purpose |
| Baseline planning preference | 0.40 | 0.35 | 0.25 | Balances economic, environmental and reliability penalties |
| Cost-priority case | 0.55 | 0.25 | 0.20 | Tests whether lower-cost systems dominate when cost receives stronger emphasis |
| Carbon-priority case | 0.30 | 0.50 | 0.20 | Tests whether the ranking changes when decarbonization is prioritized |
| Reliability-priority case | 0.30 | 0.25 | 0.45 | Tests whether low unmet load dominates the decision |
| Equal-weight case | 0.333 | 0.333 | 0.333 | Tests a neutral weighting assumption |
Table 9.
Pareto Screen Interpretation.
| Configuration | Trade-Off Interpretation From Baseline Results |
| A: PV–Battery–Grid/Diesel fallback | Lowest LCOE and NPC, but highest CO2 emissions and highest unmet load among the baseline alternatives. Relevant mainly for least-cost planning. |
| B: PV–Wind–Battery | Intermediate cost and emissions; improves renewable fraction relative to A but lacks hydrogen-based long-duration storage. |
| C: PV–Wind–Battery–Electrolyzer–H2–Fuel cell | Best low-carbon and reliability compromise; lowest unmet load and lowest emissions, with moderate cost increase. |
| D: PV–Wind–Electrolyzer–H2–Fuel cell | Highest hydrogen output but higher LCOE and unmet load than C, indicating that hydrogen-only storage does not provide the best operational flexibility. |
Table 10.
Scenario-based HOMER Pro numerical results for all configurations.
| Climate scenario | Configuration | NPC (MUSD) | LCOE (USD/kWh) | Renewable fraction (%) | CO2 emissions (t/y) | Unmet load (%) | Hydrogen produced (t/y) | Excess electricity (%) |
| S0 Baseline | A: PV–Battery–Grid/Diesel fallback | 3.82 | 0.214 | 76.4 | 468.0 | 2.1 | 0.0 | 11.3 |
| S0 Baseline | B: PV–Wind–Battery | 4.06 | 0.228 | 91.2 | 109.0 | 1.4 | 0.0 | 16.8 |
| S0 Baseline | C: PV–Wind–Battery–Electrolyzer–H2–Fuel cell | 4.38 | 0.246 | 98.7 | 18.0 | 0.3 | 31.8 | 7.4 |
| S0 Baseline | D: PV–Wind–Electrolyzer–H2–Fuel cell (no battery) | 4.71 | 0.265 | 97.9 | 26.0 | 1.8 | 45.6 | 19.6 |
| S1 Low-solar / warm year | A: PV–Battery–Grid/Diesel fallback | 3.88 | 0.218 | 69.2 | 601.8 | 2.97 | 0.0 | 11.6 |
| S1 Low-solar / warm year | B: PV–Wind–Battery | 4.12 | 0.233 | 84.0 | 127.7 | 1.98 | 0.0 | 17.2 |
| S1 Low-solar / warm year | C: PV–Wind–Battery–Electrolyzer–H2–Fuel cell | 4.42 | 0.249 | 96.4 | 19.8 | 0.37 | 34.1 | 7.2 |
| S1 Low-solar / warm year | D: PV–Wind–Electrolyzer–H2–Fuel cell (no battery) | 4.76 | 0.268 | 95.6 | 28.6 | 2.1 | 48.9 | 20.1 |
| S2 Wind-deficit year | A: PV–Battery–Grid/Diesel fallback | 3.9 | 0.22 | 66.0 | 662.6 | 3.37 | 0.0 | 11.7 |
| S2 Wind-deficit year | B: PV–Wind–Battery | 4.15 | 0.235 | 80.8 | 136.2 | 2.25 | 0.0 | 17.4 |
| S2 Wind-deficit year | C: PV–Wind–Battery–Electrolyzer–H2–Fuel cell | 4.44 | 0.25 | 95.3 | 20.6 | 0.4 | 35.1 | 7.1 |
| S2 Wind-deficit year | D: PV–Wind–Electrolyzer–H2–Fuel cell (no battery) | 4.78 | 0.27 | 94.5 | 29.8 | 2.24 | 50.3 | 20.3 |
| S3 Compound resource stress | A: PV–Battery–Grid/Diesel fallback | 3.97 | 0.226 | 57.4 | 823.7 | 4.42 | 0.0 | 12.1 |
| S3 Compound resource stress | B: PV–Wind–Battery | 4.22 | 0.24 | 72.2 | 158.7 | 2.95 | 0.0 | 18.0 |
| S3 Compound resource stress | C: PV–Wind–Battery–Electrolyzer–H2–Fuel cell | 4.49 | 0.254 | 92.5 | 22.8 | 0.48 | 37.8 | 6.8 |
| S3 Compound resource stress | D: PV–Wind–Electrolyzer–H2–Fuel cell (no battery) | 4.83 | 0.273 | 91.7 | 32.9 | 2.6 | 54.3 | 21.0 |
Disclaimer/Publisher’s Note: The statements, opinions and data contained in all publications are solely those of the individual author(s) and contributor(s) and not of MDPI and/or the editor(s). MDPI and/or the editor(s) disclaim responsibility for any injury to people or property resulting from any ideas, methods, instructions or products referred to in the content. |
© 2026 by the authors. Licensee MDPI, Basel, Switzerland. This article is an open access article distributed under the terms and conditions of the Creative Commons Attribution (CC BY) license (http://creativecommons.org/licenses/by/4.0/).
Copyright: This open access article is published under a Creative Commons CC BY 4.0 license, which permit the free download, distribution, and reuse, provided that the author and preprint are cited in any reuse.


