

Submitted:
21 July 2026
Posted:
21 July 2026
You are already at the latest version
Abstract
Mine drainage containing manganese (Mn) and zinc (Zn) poses a major environmental challenge. In Japan, Mn-rich mine drainage frequently exceeds the discharge standards of 10 mg/L for Mn and 2 mg/L for Zn. This study evaluated laboratory-scale continuous-flow constructed wetlands (CWs) for the treatment of both synthetic and actual mine drainage without external carbon addition. Two limestone-filled CWs (2 L), one planted with Phragmites australis and the other unplanted, were operated at hydraulic retention times of 1–2 d. The influent mine drainage contained approximately 66 mg/L Mn and 10–15 mg/L Zn together with Fe, Cu, Cd, and Pb. During 170 days of continuous operation, the planted CW consistently achieved lower effluent Mn and Zn concentrations than the unplanted CW under both synthetic and actual mine drainage conditions. Effluent Mn concentrations in the planted CW ranged from 5.5 to 20.0 mg/L, compared with 46.1–54.2 mg/L in the unplanted CW. Likewise, effluent Zn concentrations ranged from 0.21 to 3.0 mg/L in the planted CW and from 2.4 to 10.1 mg/L in the unplanted CW. The superior performance of the planted CW was associated with enhanced limestone dissolution, elevated pH, and favorable rhizosphere conditions that likely promoted biologically mediated Mn(II) oxidation and the formation of Mn oxides, while Mn carbonate precipitation may also have contributed to Mn removal. These findings demonstrate that limestone-based planted CWs can effectively treat Mn-rich mine drainage without external carbon addition and highlight their potential as sustainable, low-energy passive treatment systems for the long-term management of abandoned mine drainage.
Keywords:
constructed wetland
; mine drainage
; manganese oxidation
; limestone
; rhizosphere
; passive treatment
1. Introduction
The mining industry generates large volumes of wastewater containing elevated concentrations of dissolved metals. In Japan, mine drainage can be broadly classified into several categories based on its chemical composition, one of which is characterized by elevated manganese (Mn) concentrations [1,2]. Typical Mn-rich mine drainage in Japan is acidic (pH 3.5–6.5) and contains elevated levels of not only Mn but also zinc (Zn), often exceeding the Japanese discharge standards (10 mg/L for Mn and 2 mg/L for Zn) by 3–7 and 1.5–6 times, respectively [2]. Elevated Mn and coexisting Zn concentrations pose potential risks to aquatic ecosystems and water quality; therefore, the development of effective and low-cost treatment technologies remains a critical challenge.
Physicochemical methods such as neutralization, coagulation, and filtration have been widely applied for mine drainage treatment; however, these approaches require high capital and operational costs [3]. Mn removal typically involves oxidation of Mn(II) followed by precipitation as Mn oxides such as MnO₂ or MnOOH. However, direct oxidation by dissolved oxygen (DO) is extremely slow under circumneutral pH conditions and becomes appreciable only above pH 8.5. In contrast, Mn-oxidizing bacteria (MnOB) can rapidly oxidize Mn(II) within a pH range of 6.5–8.5 [4,5,6]. During biological oxidation, Mn(II) is converted to Mn(III, IV) and subsequently forms biogenic Mn oxides, which can adsorb Mn(II) and coexisting metals [7]. Compared with physicochemical methods, biological processes offer advantages such as reduced chemical input and lower operational costs. However, MnOB are typically heterotrophic, and their activity in mine drainage is often limited by low organic carbon availability.
Constructed wetlands (CWs), as a biological treatment technology, have attracted increasing attention as a low-cost and environmentally sustainable approach for acid mine drainage (AMD) treatment [8]. CWs remove metals through the combined actions of substrates, microorganisms, and vegetation. Alkaline substrates increase pH and promote the adsorption and precipitation of metal hydroxides and oxides, including Zn(OH)₂, Fe(OH)₃, and Mn oxides. In addition, plants enhance microbial activity by supplying oxygen and releasing organic compounds into the rhizosphere, which can serve as carbon sources for MnOB. These processes also modify environmental conditions such as pH and oxidation–reduction potential (ORP), thereby facilitating Mn oxidation and metal removal.
Several studies have demonstrated the applicability of CWs for treating Mn-containing wastewater (Table 1). For example, a pilot-scale surface-flow CW in the USA using soil and compost substrates reduced Mn concentrations in coal combustion leachate containing up to 3.3 mg/L Mn to 0.0005–0.44 mg/L [9]. A pilot-scale CW and prototype bioreactors in the UK treated AMD containing 10–40 mg/L Mn, achieving Mn concentrations below 1 mg/L only when circumneutral pH conditions were successfully maintained [10]. A full-scale CW in the UK achieved 76.8% Mn removal from AMD containing 2 mg/L Mn and 45 mg/L Fe [11]. In China, a pilot-scale CW using gravel and Mn ore as substrates was applied to steel wastewater containing 0.11–2.23 mg/L Mn and 0.16–2.24 mg/L Fe, reducing both metals to <0.05 mg/L at a hydraulic retention time (HRT) of 2–5 days [12]. A bench-scale hydroponic CW treating synthetic wastewater containing 1.0 mg/L Mn reduced Mn concentrations to <0.1 mg/L, although Mn re-release was observed after 7 days [13]. A lab-scale Mn polishing CW treating synthetic AMD and domestic sewage reduced Mn concentrations from 4.8 mg/L to 0.12 ± 0.11 mg/L at an HRT of 4 d under neutral to alkaline conditions using limestone-based substrates and aquatic plants [14]. More recently, a full-scale CW in France treating mine drainage containing 3.6 ± 0.5 mg/L Mn achieved Mn removal efficiencies of 43–92% [15]. However, most previous studies have focused on relatively low Mn concentrations, and treatment of high-strength Mn-rich AMD without external carbon addition remains insufficiently investigated.
In this study, a continuous-flow CW system using limestone as a substrate was developed to treat AMD containing approximately 66 mg/L Mn and 12 mg/L Zn, representing high-strength Mn-rich AMD in Japan. Two parallel systems were operated: a planted system with reeds and an unplanted system, to evaluate the effect of vegetation. Both synthetic AMD and actual mine drainage collected from a mine in Japan were treated under HRTs of 1 and 2 d and seasonal conditions. The objectives of this study were: (i) to assess the applicability and robustness of CWs for treating complex actual AMD, particularly Mn-rich mine drainage commonly observed in Japan; (ii) to evaluate the effect of plant presence on Mn and Zn removal in CWs; and (iii) to investigate the influence of temperature and HRT on treatment performance.
2. Materials and Methods
2.1. Synthetic and Actual Mine Drainage
Actual mine drainage was collected from an anonymous mine located in the Tohoku region of Japan in 2023. The actual mine drainage exhibited a near-neutral pH of approximately 6.5. Although this water is more appropriately classified as neutral mine drainage, the term "AMD" is used hereafter for convenience and consistency with the terminology commonly used in the literature.
Synthetic AMD was used to provide a controlled and reproducible influent composition, enabling systematic evaluation of the effects of HRT, seasonal conditions, and plant presence on metal removal. In contrast, actual mine drainage varies depending on site conditions, making it difficult to isolate the effects of individual operational factors. The composition was designed to represent Mn-rich mine drainage typically found in Japan [2] as follows: MnSO₄·5H₂O, 290.71 mg/L; ZnCl₂, 24.46 mg/L; FeSO₄·7H₂O, 44.81 mg/L; PbCl₂, 0.15 mg/L; CuSO₄·5H₂O, 0.08 mg/L; and CdCl₂, 0.03 mg/L. These corresponded to dissolved metal concentrations of Mn (66.4 mg/L), Zn (11.7 mg/L), Fe (6.5 mg/L), Pb (0.05 mg/L), Cu (0.03 mg/L), and Cd (0.02 mg/L). The concentrations of Mn and Zn exceeded the Japanese discharge standards (10 and 2 mg/L, respectively), whereas those of Fe, Pb, Cu, and Cd were below the corresponding standards (10, 0.1, 3, and 0.03 mg/L, respectively). To evaluate the robustness of the CWs under acidic conditions, the pH of the synthetic AMD was adjusted to 5.0 using diluted hydrochloric acid (1:30, v/v), which was lower than the Japanese discharge standard range (pH 5.8–8.6).
2.2. CWs Set up
To evaluate the effect of vegetation on Mn removal, two CWs were established: a planted CW using common reed (Phragmites australis) and an unplanted CW. Plants were obtained from a commercial nursery (Tojaku Engei Co., Ltd., Joyo, Japan). All CWs were constructed using plastic containers (W655 × L230 × D180 mm) and filled with 5 kg of limestone (particle size: 10 mm, Tokai Jari Co., Ltd., Hamamatsu, Japan). The working volume of each CW was approximately 2 L. In the planted CW, four reed seedlings (shoot height, 45 cm; root length, 13 cm) were introduced on May 26, 2023.
AMD was continuously pumped into the bottom of each CW using a cassette tube pump (SMP-23, EYELA, Tokyo Rikakikai Co., Ltd., Tokyo, Japan). The influent flowed upward through the limestone bed and was discharged from the outlet, approximating plug-flow conditions. A single pump equipped with a flow splitter was used to supply both CWs at identical flow rates. To minimize the effects of rainfall and other environmental factors, all CWs were installed in a greenhouse at the Biwako Kusatsu Campus, Ritsumeikan University, Japan.
2.3. Operating Conditions of the CWs
To allow plant acclimation, all CWs were operated with tap water for one week before the mine drainage treatment. The experiment was conducted over 170 d, from June 4 to November 21, 2023. As summarized in Table 2, the operation was divided into five phases according to the wastewater type and hydraulic loading conditions. Synthetic AMD was treated during Phases I, III, and IV, whereas actual AMD was treated during Phases II and V. The influent flow rate was maintained at 1 L/d during Phases I–III and V, corresponding to a hydraulic loading rate of 6.6 mm/d and an HRT of 2 d, assuming no evapotranspiration. In Phase IV, the influent flow rate was increased to 2 L/d, corresponding to a hydraulic loading rate of 13.2 mm/d and an HRT of 1 d.
2.4. Sampling and Analysis
Greenhouse air temperature and illuminance were recorded at 10-min intervals using a data logger (TR-74Ui, T&D Corporation, Matsumoto, Japan). Daily integrated illuminance was calculated from the 10-min interval illuminance measurements.
Water samples (50 mL) were collected from the influent and effluent of each CW. The pH, ORP, and total dissolved solids (TDS) were measured using a pH meter (LAQUA, Horiba Ltd., Kyoto, Japan), a portable DO meter (HQ30d equipped with an LDO101 luminescent DO probe, Hach, Loveland, CO, USA), an ORP meter (ORP57, Milwaukee Electronics, Rocky Mount, NC, USA), and a TDS meter (ASTDS1, AS ONE Corporation, Osaka, Japan), respectively.
For metal analysis, a 10-mL aliquot of each sample was filtered through a 1.0-μm pore-size filter and analyzed for Mn, Fe, Zn, Cu, Pb, and Cd using inductively coupled plasma–optical emission spectrometry (ICP–OES; 700 Series, Agilent Technologies, Santa Clara, CA, USA).
Statistical analyses were performed using one-way analysis of variance (ANOVA) followed by Tukey's honestly significant difference (HSD) test for multiple comparisons. Differences were considered statistically significant at p < 0.05.
3. Results
3.1. Performance of CWs During Phased Operation
The CWs were operated under five experimental phases using either synthetic or actual AMD. Table 2 summarizes the operational conditions, including mean air temperature and daily integrated illuminance. During summer daytime, the greenhouse air temperature occasionally exceeded 50°C because of solar heat accumulation within the enclosed greenhouse. The observed flow rate during each operational phase is shown in Figure S1, whereas pH, ORP, DO, and TDS are summarized in Figure S2. Temporal changes in pH, Mn, and Zn concentrations are presented in Figure 1, and those of Fe, Cu, Pb, and Cd are shown in Figure S3. The appearance of the CWs during the experimental period is shown in Figure 2.
3.1.1. Phase I
During Phase I (Day 0–85), the CWs treated synthetic AMD under hot conditions (30.7 ± 8.7 °C). The influent flow rate averaged 933 ± 99 mL/d, whereas the effluent flow rates were 499 ± 125 and 407 ± 144 mL/d for the planted and unplanted CWs, respectively, corresponding to water losses through evapotranspiration and evaporation of 56.9 ± 11.2% and 46.7 ± 12.0%. Correspondingly, the TDS increased from 214 ± 28 mg/L in the influent to 267 ± 27 mg/L in the unplanted CW and 343 ± 37 mg/L in the planted CW, indicating concentration of dissolved constituents in the effluent. The influent pH averaged 5.1 ± 0.4 and increased to 7.9 ± 0.3 in the planted CW and 7.0 ± 0.2 in the unplanted CW. ORP decreased from 236 ± 31 mV in the influent to 129 ± 40 mV in the planted CW and 160 ± 33 mV in the unplanted CW. DO concentrations remained approximately 8 mg/L in both CW effluents.
The influent Mn concentration averaged 67.5 ± 3.0 mg/L, which was consistent with the target concentration. The effluent Mn concentration averaged 48.6 ± 6.4 mg/L in the unplanted CW and 7.9 ± 3.2 mg/L in the planted CW. The Mn concentration in the planted CW remained below the Japanese discharge standard (10 mg/L) for most of Phase I. The influent Zn concentration averaged 15.7 ± 2.6 mg/L, slightly exceeding the target concentration. The effluent Zn concentration gradually decreased to 5.2 ± 2.0 mg/L in the unplanted CW and to 0.7 ± 0.5 mg/L in the planted CW. The Zn concentration in the planted CW remained below the discharge standard (2 mg/L) throughout Phase I, whereas that in the unplanted CW exceeded the standard. The limestone substrate was initially white (Figure 2A), but brown precipitates, presumably containing Mn oxides, gradually accumulated on its surface during Phase I (Figure 2B).
The effluent Fe, Pb, and Cu concentrations remained consistently low, averaging less than 0.1, 0.06, and 0.025 mg/L, respectively, in both CWs. The effluent Cd concentration averaged 0.0085 ± 0.0047 mg/L in the unplanted CW and 0.0015 ± 0.0012 mg/L in the planted CW.
3.1.2. Phase II
During Phase II (Day 86–101), actual AMD was treated under warm conditions (27.9 ± 7.4 °C). The reeds continued to grow and exhibited vigorous growth by day 101 (Figure 2C). The influent flow rate averaged 938 ± 62 mL/d, whereas water losses through evapotranspiration and evaporation were 46.7 ± 7.5% and 42.1 ± 9.2% in the planted and unplanted CWs, respectively. Compared with the synthetic AMD, the actual AMD exhibited higher TDS values, averaging 408 ± 70 mg/L in the influent, 409 ± 95 mg/L in the unplanted CW, and 464 ± 64 mg/L in the planted CW. The influent pH averaged 6.4 ± 0.7 and increased to 7.9 ± 0.2 in the planted CW and 7.0 ± 0.1 in the unplanted CW. ORP decreased from 164 ± 9 mV in the influent to 126 ± 9 mV in the planted CW and 146 ± 13 mV in the unplanted CW.
The influent Mn concentration averaged 63.5 ± 2.8 mg/L. The effluent Mn concentration averaged 48.1 ± 2.3 mg/L in the unplanted CW and 5.5 ± 2.8 mg/L in the planted CW. The Mn concentration in the planted CW remained below the discharge standard. The influent Zn concentration averaged 9.3 ± 2.2 mg/L. The effluent Zn concentration averaged 2.4 ± 1.4 mg/L in the unplanted CW and 0.21 ± 0.17 mg/L in the planted CW. The Zn concentration in the planted CW remained below the discharge standard.
The influent Fe concentration averaged 2.0 ± 1.6 mg/L, which was lower than expected, whereas the effluent Fe concentration averaged 0.04 mg/L in both CWs. The effluent Cu concentration remained below 0.004 mg/L in both CWs. The influent Pb concentration averaged 0.18 ± 0.07 mg/L, which was higher than expected, whereas the effluent Pb concentration remained below 0.04 mg/L in both CWs. The influent Cd concentration averaged 0.014 ± 0.005 mg/L, whereas the effluent Cd concentrations averaged 0.013 ± 0.008 mg/L in the unplanted CW and 0.0089 ± 0.0084 mg/L in the planted CW.
3.1.3. Phase III
During Phase III (Day 102–121), synthetic AMD was treated under moderate temperatures (24.9 ± 5.0 °C). The influent flow rate averaged 966 ± 53 mL/d, whereas water losses through evapotranspiration and evaporation were 44.6 ± 4.0% and 38.0 ± 5.0% in the planted and unplanted CWs, respectively. The influent pH averaged 5.0 ± 0.5 and increased to 7.4 ± 0.2 in the planted CW and 6.7 ± 0.2 in the unplanted CW. ORP decreased from 255 ± 10 mV in the influent to 187 ± 16 mV in the planted CW and 223 ± 30 mV in the unplanted CW. The reeds continued to grow, while brown precipitates accumulated on the surface of the limestone substrate in both CWs (Figure 2D).
The influent Mn concentration averaged 67.1 ± 3.0 mg/L. The effluent Mn concentration averaged 54.2 ± 2.8 mg/L in the unplanted CW and 14.5 ± 1.8 mg/L in the planted CW. Neither CW achieved the discharge standard. The influent Zn concentration averaged 15.3 ± 1.2 mg/L. The effluent Zn concentration averaged 8.9 ± 1.7 mg/L in the unplanted CW and 1.3 ± 0.4 mg/L in the planted CW. The planted CW met the discharge standard, whereas the unplanted CW did not. The effluent Fe, Pb, Cu, and Cd concentrations remained consistently low, averaging less than 0.03, 0.008, 0.02 and 0.007 mg/L, respectively, in both CWs.
3.1.4. Phase IV
During Phase IV (Day 122–142), the influent flow rate of synthetic AMD was increased from 1 to 2 L/d, reducing the HRT from 2 d to 1 d. The influent flow rate averaged 1,940 ± 26 mL/d, whereas water losses through evapotranspiration and evaporation were 37.5 ± 6.4% and 30.7 ± 6.1% in the planted and unplanted CWs, respectively. The mean air temperature decreased to 20.8 ± 4.2 °C. The influent pH averaged 5.0 ± 0.7 and increased to 7.0 ± 0.3 in the planted CW and 6.5 ± 0.3 in the unplanted CW. ORP decreased from 236 ± 53 mV in the influent to 217 ± 47 mV in the planted CW and 218 ± 41 mV in the unplanted CW. DO concentrations ranged from 8.4 to 8.8 mg/L in both CW effluents.
The influent Mn concentration averaged 66.3 ± 3.7 mg/L. The effluent Mn concentration averaged 52.7 ± 3.2 mg/L in the unplanted CW and 20.0 ± 4.3 mg/L in the planted CW. Neither CW achieved the discharge standard. The influent Zn concentration averaged 13.1 ± 2.0 mg/L. The effluent Zn concentration averaged 10.1 ± 0.5 mg/L in the unplanted CW and 3.0 ± 0.6 mg/L in the planted CW. Neither CW achieved the discharge standard. The effluent Fe, Cu, and Pb concentrations remained consistently low throughout Phase IV in both CWs. The effluent Cd concentrations averaged 0.016 ± 0.005 mg/L in the unplanted CW and below 0.006 mg/L in the planted CW.
3.1.5. Phase V
During Phase V (Day 143–170), the HRT was increased from 1 d to 2 d, and actual AMD was treated under relatively low-temperature conditions (15.1 ± 7.6 °C). The influent flow rate averaged 964 ± 32 mL/d, whereas water losses through evapotranspiration and evaporation were 31.5 ± 5.1% and 28.6 ± 4.8% in the planted and unplanted CWs, respectively. The aboveground parts of the reeds had substantially senesced by day 170, likely because of the decrease in temperature (Figure 2E). The influent pH averaged 6.3 ± 0.4 and increased to 7.6 ± 0.3 in the planted CW and 7.1 ± 0.5 in the unplanted CW. ORP increased slightly from 209 ± 18 mV in the influent to 226 ± 28 mV in the planted CW and 225 ± 20 mV in the unplanted CW. DO concentrations increased to 9.7–9.8 mg/L in both CW effluents.
The influent Mn concentration averaged 66.6 ± 3.6 mg/L. The effluent Mn concentration averaged 46.1 ± 1.8 mg/L in the unplanted CW and 11.2 ± 4.0 mg/L in the planted CW. Neither CW achieved the discharge standard, although the planted CW approached the standard. The influent Zn concentration averaged 10.7 ± 0.8 mg/L. The effluent Zn concentration averaged 6.1 ± 1.1 mg/L in the unplanted CW and 1.9 ± 1.2 mg/L in the planted CW. The planted CW met the discharge standard, whereas the unplanted CW did not. The effluent Fe, Cu, Pb, and Cd concentrations remained consistently low throughout Phase V, with Cd concentrations below 0.01 mg/L in the unplanted CW and below 0.004 mg/L in the planted CW.
At the end of the experiment, abundant black precipitates were observed on the reed roots in the planted CW (Figure 2F).
3.2. Comparison of Treatment Performance Among Phases
Based on the phase-averaged effluent concentrations, treatment performance was compared under different operational conditions (Figure 3). The planted CW consistently produced significantly lower effluent Mn concentrations than the unplanted CW throughout the study (p < 0.05). The lowest Mn concentrations were observed during Phases I and II, when the HRT was 2 d and air temperatures were relatively high. In contrast, effluent Mn concentrations increased during Phase III and reached the highest values during Phase IV, in which the HRT was reduced to 1 d. During Phase V, when the HRT was restored to 2 d under lower-temperature conditions, the effluent Mn concentration decreased compared with Phase IV but remained higher than those observed during Phases I and II.
A similar trend was observed for Zn. The planted CW maintained significantly lower effluent Zn concentrations than the unplanted CW throughout the experiment (p < 0.05). The lowest Zn concentrations were observed during Phases I–III and V, whereas Phase IV exhibited the highest effluent Zn concentrations in both CWs.
In contrast, the effluent Fe, Cu, Pb, and Cd concentrations remained consistently low throughout the study (Figure S3).
3.3. Relationship Between pH and Metal Removal
Figure 4 shows the relationships between pH and Mn and Zn concentrations. For Mn, precipitation as Mn(OH)₂ is governed by the following equilibrium (1):
Mn²⁺ + 2OH⁻ ⇌ Mn(OH)₂(s),
The solubility product of Mn(OH)₂ (Ksp ≈ 1.6 × 10⁻¹³ at 25 °C) indicates that a pH of approximately 9.5 is required to achieve the discharge standard by hydroxide precipitation alone.
Similarly, precipitation as Zn(OH)₂ is governed by the following equilibrium (2):
Zn²⁺ + 2OH⁻ ⇌ Zn(OH)₂(s),
Using the solubility product (Ksp ≈ 3 × 10⁻¹⁷ at 25 °C), the pH required to reduce the Zn concentration to the discharge standard was estimated to be approximately 7.8–8.0, as indicated by the solubility curve in Figure 4.
The relationships between pH and the concentrations of Fe, Cu, Pb, and Cd are shown in Figure S4. These metals generally decreased with increasing pH, with the planted CW exhibiting lower concentrations than the unplanted CW. Throughout the study, the effluent concentrations of Fe, Cu, Pb, and Cd remained low in both CWs. Based on the solubility products of Cu(OH)₂ (Ksp ≈ 2.2 × 10⁻²⁰), Pb(OH)₂ (Ksp ≈ 1.2 × 10⁻¹⁵), and Cd(OH)₂ (Ksp ≈ 2.5 × 10⁻¹⁴) at 25 °C, the pH values required to achieve the Japanese discharge standards by hydroxide precipitation alone were estimated to be approximately 6.3, 9.7, and 10.5, respectively. Although Fe was introduced as Fe(II) in the synthetic AMD, it was expected to be oxidized to Fe(III) under the aerobic conditions in the CWs. If Fe removal is governed by precipitation as Fe(OH)₃ after Fe(II) oxidation, Fe can theoretically precipitate at relatively low pH, approximately 3–4, because Fe(OH)₃ is extremely insoluble.
4. Discussion
4.1. Applicability and Robustness of CWs for Actual Mine Drainage
This study demonstrated that planted CWs can effectively treat high-strength Mn-rich AMD under both synthetic and actual conditions. Compared with synthetic AMD, actual AMD generally exhibits more complex and site-specific water chemistry, including higher ionic strength and coexisting dissolved constituents that may influence treatment processes. This complexity was reflected by the higher TDS values observed during Phases II and V than during the phases treating synthetic AMD (Figure S2). Nevertheless, the planted CW maintained comparable treatment performance for both mine drainage types, indicating that variations in water chemistry had little influence on the overall treatment performance.
Most previous studies have evaluated CWs using relatively low Mn concentrations, typically below 10 mg/L [9,11,12,13,14,15] as shown in Table 1. In contrast, the present study successfully treated AMD containing over 65 mg/L Mn together with elevated Zn concentrations. Throughout the study, the planted CW consistently reduced Mn and Zn concentrations to levels substantially lower than those achieved by the unplanted CW, and the Japanese discharge standards were satisfied during most operational phases.
The comparable treatment performance obtained for both synthetic and actual AMD suggests that the major treatment mechanisms, including limestone-induced neutralization and subsequent metal immobilization, were not strongly affected by differences in wastewater composition. These findings demonstrate the robustness of the planted CW against variations in influent characteristics and support its practical application for treating Mn-rich AMD. This is particularly relevant in Japan, where high-Mn mine drainage has been reported at numerous abandoned mine sites [2]. These findings indicate that planted limestone-based CWs provide a practical low-cost treatment option for high-strength AMD.
4.2. Removal Mechanisms for Mn and Zn in CWs
The results indicate that pH played a central role in controlling Mn and Zn removal in the CWs. As shown in Figure 4 and Figures S4, the metal concentrations decreased with increasing pH, and consistently lower concentrations were observed in the planted CW than in the unplanted CW. Zn removal can largely be explained by hydroxide precipitation. Based on the solubility product of Zn(OH)₂, a pH of approximately 7.8–8.0 is required to reduce the Zn concentration to the discharge standard, which agrees well with the observed decrease in Zn concentrations at higher pH values (Figure 4).
In contrast, Mn removal cannot be explained solely by hydroxide precipitation. The solubility product of Mn(OH)₂ indicates that a pH of approximately 9.5 is theoretically required to achieve the discharge standard. However, substantial Mn removal was observed at pH values of approximately 7.5–8.0, particularly in the planted CW, indicating that additional removal mechanisms were involved. A possible mechanism is the precipitation of Mn carbonate (MnCO₃) [15]. Dissolution of the limestone (CaCO₃) increased alkalinity and bicarbonate concentrations in the CWs, creating conditions favorable for carbonate precipitation [14,16]. Because Mn carbonate is less soluble than Mn(OH)₂ under circumneutral conditions, MnCO₃ precipitation may also have contributed to Mn immobilization, although mineralogical analyses were not conducted in the present study. Another important pathway is the biological oxidation of Mn(II) to insoluble Mn oxides by MnOB. This reaction is favored under alkaline and aerobic conditions. In the planted CW, elevated pH together with oxygen release from reed roots likely created favorable conditions for biologically mediated Mn oxidation and the subsequent formation of Mn oxides.
Mn oxides are effective sorbents for trace metals and may also contribute to Zn removal through adsorption, co-precipitation, and structural incorporation [17,18]. The close relationship between Mn and Zn concentrations observed in the planted CW supports this interpretation, suggesting that Zn removal was closely associated with Mn oxide formation. Because Mn oxidation is strongly influenced by pH [4,5,6], the higher pH achieved in the planted CW likely promoted both Mn oxide formation and the subsequent immobilization of Zn.
4.3. Effects of Vegetation on Metal Removal
Species of the genus Phragmites are the most widely used emergent macrophytes in CWs for Mn-rich AMD treatment because of their high tolerance to metal-rich environments and their ability to modify rhizosphere conditions [11,12,15]. The planted CW consistently produced lower effluent Mn and Zn concentrations than the unplanted CW. This improvement was accompanied by consistently higher pH values, indicating that vegetation created physicochemical conditions favorable for metal removal. The higher pH observed in the planted CW was likely associated with rhizosphere processes. Carbon dioxide released through root respiration can enhance dissolution of the limestone substrate, thereby increasing alkalinity and buffering capacity. Root-mediated ion exchange may also contribute to local increases in pH. These processes are consistent with the higher TDS observed in the planted CW and likely promoted Mn and Zn immobilization.
Plant roots may enhance biologically mediated Mn(II) oxidation by increasing DO availability in the rhizosphere. Although MnOB are generally heterotrophic and their activity is often limited by the low organic carbon availability in AMD, root exudates and decaying plant biomass may provide localized carbon sources that support MnOB activity. These endogenous organic compounds may include low-molecular-weight organic acids (e.g., acetate and lactate), sugars, and amino acids released from plant roots [19], all of which can serve as carbon sources for MnOB. Root surfaces also provide favorable sites for biofilm development and metal accumulation. Previous studies have shown that Mn oxides accumulate on root surfaces as coatings or plaques, which subsequently adsorb trace metals such as Zn [20,21]. At the end of the experiment, abundant black precipitates were observed on reed roots. These deposits were considered to consist primarily of Mn oxides, providing qualitative evidence for Mn oxide formation on the root surface.
This mechanism differs fundamentally from that of anaerobic sulfate-reducing systems used for AMD treatment. In such systems, external organic carbon is supplied to stimulate sulfate-reducing bacteria, resulting in the precipitation of metal sulfides such as ZnS and CdS. However, sulfide precipitation generally contributes less to Mn removal because Mn sulfide is considerably less stable than the sulfides of Zn, Cd, Cu, and Pb [14]. In contrast, the planted CW maintained aerobic conditions while supplying limited amounts of root-derived organic carbon, creating a rhizosphere environment favorable for MnOB activity without inducing anaerobic conditions. This combination of oxygen release and localized carbon supply may represent a key advantage of vegetated limestone-based CWs for Mn-rich AMD treatment.
The superior performance of the planted CW was therefore likely attributable to the combined effects of enhanced limestone dissolution, elevated pH, localized carbon and oxygen supply in the rhizosphere, biologically mediated Mn oxidation, and Mn oxide formation on root surfaces, which together promoted the removal of Mn and Zn. While no clear differences were observed for Fe and Cu, slightly lower Pb and Cd concentrations were obtained in the planted CW than in the unplanted CW (Figure S4), suggesting a modest contribution of vegetation to the removal of these trace metals.
4.4. Effects of Temperature and HRT on Metal Removal
Temperature and HRT both influenced the treatment performance of the CWs. The lowest effluent Mn and Zn concentrations were observed during Phases I and II, when the HRT was maintained at 2 d and air temperatures were relatively high. The HRT of 2 d adopted in the present study is comparable to those reported for CWs treating Mn-containing wastewater [12,14] as shown in Table 1, whereas the results obtained at an HRT of 1 d demonstrate the feasibility and limitations of operating under shorter HRTs. In contrast, reducing the HRT from 2 d to 1 d (Phase IV) resulted in the highest effluent Mn and Zn concentrations, indicating that shorter HRTs limited metal removal. When the HRT was restored to 2 d (Phase V), treatment performance improved despite the lower temperatures, although Mn concentrations remained slightly higher than those observed during the warmer phases. These results suggest that HRT exerted a stronger influence on treatment performance than seasonal temperature within the range investigated.
Nevertheless, temperature may also influence CW performance through its effects on vegetation and microbial activity. Although water temperature was not monitored in the present study, the greenhouse air temperature ranged approximately from 15 to 30 °C, which is comparable to the water temperatures reported for CWs treating mine drainage [8,15]. As temperatures decrease, reed growth and physiological activity decline, potentially reducing oxygen release from the rhizosphere and consequently slowing biologically mediated Mn oxidation. Similar reductions in Mn removal under low-temperature conditions have been reported for planted CWs treating mine drainage [10]. In addition, mature vegetation can increase hydraulic resistance, thereby reducing flow velocity and increasing the effective hydraulic retention time within CWs [22,23]. Future studies should include continuous monitoring of water temperature to clarify its influence on Mn oxidation and seasonal treatment performance.
4.5. Implications for Practical Applications
Japan has a large number of abandoned and inactive mines that continue to generate AMD long after mine closure [1]. Because these sites no longer provide economic benefits, the long-term operation of conventional active treatment systems represents a considerable economic burden. Therefore, promoting the wider adoption of low-energy passive treatment technologies remains an important challenge for sustainable AMD management in Japan. In addition to Mn-rich AMD, CWs have also been investigated for the treatment of mine drainage containing elevated concentrations of Cd [24] as well as Fe and Zn [25], suggesting that the findings of this study may also contribute to the broader application of passive treatment technologies for various types of mine drainage.
Several issues should nevertheless be addressed before pilot- and full-scale implementation. First, the role of biologically mediated Mn oxidation was inferred from the treatment performance but was not directly verified. Future studies incorporating microbial community analyses and functional gene characterization are needed to clarify the contribution of microorganisms to Mn oxidation in CWs. Second, the composition, stability, and long-term fate of the Mn-rich precipitates require further investigation. Mineralogical analyses are needed to distinguish the relative contributions of hydroxide precipitation, carbonate precipitation, and Mn oxide formation. In addition, the recovery, handling, and potential reuse of Mn-rich precipitates should be evaluated from the perspectives of resource recovery and long-term sustainability. Finally, long-term operational issues, including substrate durability, seasonal vegetation dynamics, hydraulic variability, and maintenance requirements, should be investigated under pilot- and full-scale field conditions.
5. Conclusions
Continuous-flow limestone-based CWs were successfully operated for 170 d to treat high-strength AMD containing over 65 mg/L Mn and 10–15 mg/L Zn. Effluent Mn concentrations in the planted CW ranged from 5.5 to 20.0 mg/L, compared with 46.1–54.2 mg/L in the unplanted CW. Likewise, effluent Zn concentrations ranged from 0.21 to 3.0 mg/L in the planted CW and from 2.4 to 10.1 mg/L in the unplanted CW. The planted CW consistently outperformed the unplanted CW under both synthetic and actual AMD conditions, demonstrating the applicability of the system to complex mine drainage.
Mn removal was governed by multiple interacting mechanisms, including hydroxide precipitation, possible carbonate precipitation, and biologically mediated Mn oxidation, whereas Zn removal was primarily controlled by hydroxide precipitation and adsorption onto Mn oxides. Vegetation enhanced treatment performance by promoting limestone dissolution, increasing pH, and creating favorable rhizosphere conditions for Mn oxidation. Treatment performance was also influenced by HRT, with the 2-d HRT providing more efficient Mn and Zn removal than the 1-d HRT, whereas seasonal conditions had comparatively smaller effects.
Overall, the present study demonstrates that planted limestone-based CWs provide a promising low-energy passive treatment technology for Mn-rich AMD. Given the large number of abandoned mine sites in Japan, where Mn-rich AMD remains an important environmental issue, these findings provide a scientific basis for the design and optimization of practical CW systems. Furthermore, the proposed approach may also be applicable to other types of mine drainage, including Cd- and Zn-rich mine drainage, thereby contributing to the broader implementation of passive mine water treatment systems.
Supplementary Materials
The following supporting information can be downloaded at the website of this paper posted on Preprints.org.
Author Contributions
Conceptualization, S.S.; methodology, Z.C., T.T.N. and S.S.; validation, Z.C. and T.T.N.; formal analysis, Z.C.; investigation, Z.C. and T.T.N.; resources, Y.S., T.H., and S.S.; data curation, Z.C.; writing—original draft preparation, Z.C.; writing—review and editing, T.T.N., Y.S., T.H., and S.S.; visualization, Z.C.; supervision, S.S.; project administration, S.S.; funding acquisition, S.S. All authors have read and agreed to the published version of the manuscript.
Funding
This research received no external funding.
Data Availability Statement
The data presented in this study are available from the corresponding author upon reasonable request.
Acknowledgments
The authors gratefully acknowledge the anonymous mining company for providing the mine drainage samples used in this study. The authors also thank Mr. Yuto Takeshita, an undergraduate student in the College of Science and Engineering at Ritsumeikan University, for his assistance with the experimental work.
Conflicts of Interest
The authors declare no conflicts of interest.
Abbreviations
The following abbreviations are used in this manuscript:
| CW | Constructed wetland |
| DO | Dissolved oxygen |
| HRT | Hydraulic retention time |
| MnOB | Manganese-oxidizing bacteria |
| ORP | Oxidation-reduction potential |
| TDS | Total dissolved solids |
References
- Iwasaki, Y.; Fukaya, K.; Fuchida, S.; Matsumoto, S.; Araoka, D.; Tokoro, C.; Yasutaka, T. Projecting future changes in element concentrations of approximately 100 untreated discharges from legacy mines in Japan by a hierarchical log-linear model. Sci. Total Environ. 2021, 786, 147500. [Google Scholar] [CrossRef]
- Soda, S.; Nguyen, T.T. Classification of mine drainages in Japan based on water quality: Consideration for constructed wetland treatments. Water 2023, 15(7), 1258. [Google Scholar] [CrossRef]
- Tong, L.; Fan, R.; Yang, S.; Li, C. Development and status of the treatment technology for acid mine drainage. Min. Metall. Explor. 2021, 38, 315–327. [Google Scholar] [CrossRef]
- Tebo, B. M.; Johnson, H. A.; McCarthy, J. K.; Templeton, A. S. Geomicrobiology of manganese (II) oxidation. Trends Microbiol. 2005, 13(9), 421–428. [Google Scholar] [CrossRef] [PubMed]
- Cai, Y.; Yang, K.; Qiu, C.; Bi, Y.; Tian, B.; Bi, X. A review of manganese-oxidizing bacteria (MnOB): Applications, future concerns, and challenges. Int. J. Environ. Res. Public Health 2023, 20, 1272. [Google Scholar] [CrossRef] [PubMed]
- Mo, W.; Wang, H.; Wang, J.; Wang, Y.; Liu, Y.; Luo, Y.; He, M.; Cheng, S.; Mei, H.; He, J.; Su, J. Advances in research on bacterial oxidation of Mn(II): A visualized bibliometric analysis based on CiteSpace. Microorganisms 2024, 12, 1611. [Google Scholar] [CrossRef] [PubMed]
- Tojo, F.; Kitayama, A.; Miyata, N.; Okano, K.; Fukushima, J.; Suzuki, R.; Tani, T. Molecular cloning and heterologous expression of manganese (II)-oxidizing enzyme from Acremonium strictum strain KR21-2. Catalysts 2020, 10, 686. [Google Scholar] [CrossRef]
- Pat-Espadas, A.M.; Loredo-Portales, R.; Amabilis-Sosa, L.E.; Gómez, G.; Vidal, G. Review of constructed wetlands for acid mine drainage treatment. Water 2018, 10, 1685. [Google Scholar] [CrossRef]
- Ye, Z. H.; Whiting, S. N.; Lin, Z. Q.; Lytle, C. M.; Qian, J. H.; Terry, N. Removal and distribution of iron, manganese, cobalt, and nickel within a Pennsylvania constructed wetland treating coal combustion byproduct leachate. J. Environ. Qual. 2001, 30(4), 1464–1473. [Google Scholar] [CrossRef] [PubMed]
- Hallberg, K.B.; Johnson, D.B. Biological manganese removal from acid mine drainage in constructed wetlands and prototype bioreactors. Sci. Total Environ. 2005, 338(1–2), 115–124. [Google Scholar] [CrossRef] [PubMed]
- Batty, L.C.; Hooley, D.; Younger, P.L. Iron and manganese removal in wetland treatment systems: rates, processes and implications for management. Sci. Total Environ. 2008, 394(1), 1–8. [Google Scholar] [CrossRef] [PubMed]
- Xu, J.C.; Chen, G.; Huang, X.F.; Li, G.M.; Liu, J.; Yang, N.; Gao, S.N. Iron and manganese removal by using manganese ore constructed wetlands in the reclamation of steel wastewater. J. Hazard. Mater. 2009, 169(1–3), 309–317. [Google Scholar] [CrossRef] [PubMed]
- Kularatne, R.K.A.; Kasturiarachchi, J.C.; Manatunge, J.M.A.; Wijeyekoon, S.L.J. Mechanisms of manganese removal from wastewaters in constructed wetlands comprising water hyacinth (Eichhornia crassipes (Mart.) Solms) grown under different nutrient conditions. Water Environ. Res. 2009, 81(2), 165–172. [Google Scholar] [CrossRef] [PubMed]
- Wang, H.; Zhang, M.; Lv, Q.; Xu, J.; Zhao, Y.; Li, Y. Effective co-treatment of synthetic acid mine drainage and domestic sewage using multi-unit passive treatment system supplemented with silage fermentation broth as carbon source. J. Environ. Manag. 2022, 310, 114803. [Google Scholar] [CrossRef] [PubMed]
- Lafont, C.; Vaxelaire, S.; Gelabert, A.; Joulian, C.; Thouin, H.; Duré, F.; Charron, M.; Gorny, J.; Vantelon, D.; Battaglia-Brunet, F.; van Hullebusch, E.D. Manganese removal in a full-scale constructed wetland for passive mine water treatment: Environmental factors and microbial communities. Water Res. 2026, 295, 125539. [Google Scholar] [CrossRef] [PubMed]
- Silva, A.M.; Cruz, F.L.S.; Lima, R.M.F.; Teixeira, M.C.; Leão, V.A. Manganese and limestone interactions during mine water treatment. J. Hazard. Mater. 2010, 181, 514–520. [Google Scholar] [CrossRef] [PubMed]
- Okeme, I.C.; Srivastava, P.; Sapsford, D.J. Highly efficient co-removal of zinc and manganese during passive treatment of mine drainage: Mechanisms, microbiology and application. Ecol. Eng. 2025, 219, 107681. [Google Scholar] [CrossRef]
- Catts, J.G.; Langmuir, D. Adsorption of Cu, Pb and Zn by δMnO₂: Applicability of the site binding–surface complexation model. Appl. Geochem. 1986, 1, 255–264. [Google Scholar] [CrossRef]
- Campbell, C.D.; Grayston, S.J.; Hirst, D.J. Use of rhizosphere carbon sources in sole carbon source tests to discriminate soil microbial communities. J. Microbiol. Methods 1997, 30, 33–41. [Google Scholar] [CrossRef]
- Lesage, E.; Rousseau, D.P.L.; Meers, E.; Van de Moortel, A.M.K.; Du Laing, G.; Tack, F.M.G.; Verloo, M.G. Accumulation of metals in the sediment and reed biomass of a combined constructed wetland treating domestic wastewater. Water Air Soil Pollut. 2007, 183, 253–264. [Google Scholar] [CrossRef]
- Mays, P.A.; Edwards, G.S. Comparison of heavy metal accumulation in a natural wetland and constructed wetland receiving acid mine drainage. Ecol. Eng. 2001, 16, 487–500. [Google Scholar] [CrossRef]
- Ioannidou, V.G.; Pearson, J.M. The effects of flow rate variation and vegetation ageing on the longitudinal mixing and residence time distribution (RTD) in a full-scale constructed wetland. Ecol. Eng. 2019, 138, 248–263. [Google Scholar] [CrossRef]
- Kretz, L.; Koll, K.; Seele-Dilbat, C.; van der Plas, F.; Weigelt, A.; Wirth, C. Plant structural diversity alters sediment retention on and underneath herbaceous vegetation in a flume experiment. PLoS ONE 2021, 16, e0248320. [Google Scholar] [CrossRef] [PubMed]
- Nguyen, T.T.; Soda, S.; Kanayama, A.; Hamai, T. Effects of cattails and hydraulic loading on heavy metal removal from closed mine drainage by pilot-scale constructed wetlands. Water 2021, 13, 1937. [Google Scholar] [CrossRef]
- Nguyen, T.T.; Soda, S.; Horiuchi, K. Removal of heavy metals from acid mine drainage with lab-scale constructed wetlands filled with oyster shells. Water 2022, 14, 3325. [Google Scholar] [CrossRef]
Figure 1.
Changes in (A) pH, (B) Mn concentration, and (C) Zn concentration during the operation of the CWs. Circles, triangles, and squares represent the influent (AMD), the effluent from the unplanted CW, and the effluent from the planted CW, respectively. Vertical dashed lines indicate transitions between operational phases (Phases I–V). Horizontal dashed lines indicate the Japanese discharge standards for pH (5.8–8.6), Mn (10 mg/L), and Zn (2 mg/L).
Figure 1.
Changes in (A) pH, (B) Mn concentration, and (C) Zn concentration during the operation of the CWs. Circles, triangles, and squares represent the influent (AMD), the effluent from the unplanted CW, and the effluent from the planted CW, respectively. Vertical dashed lines indicate transitions between operational phases (Phases I–V). Horizontal dashed lines indicate the Japanese discharge standards for pH (5.8–8.6), Mn (10 mg/L), and Zn (2 mg/L).
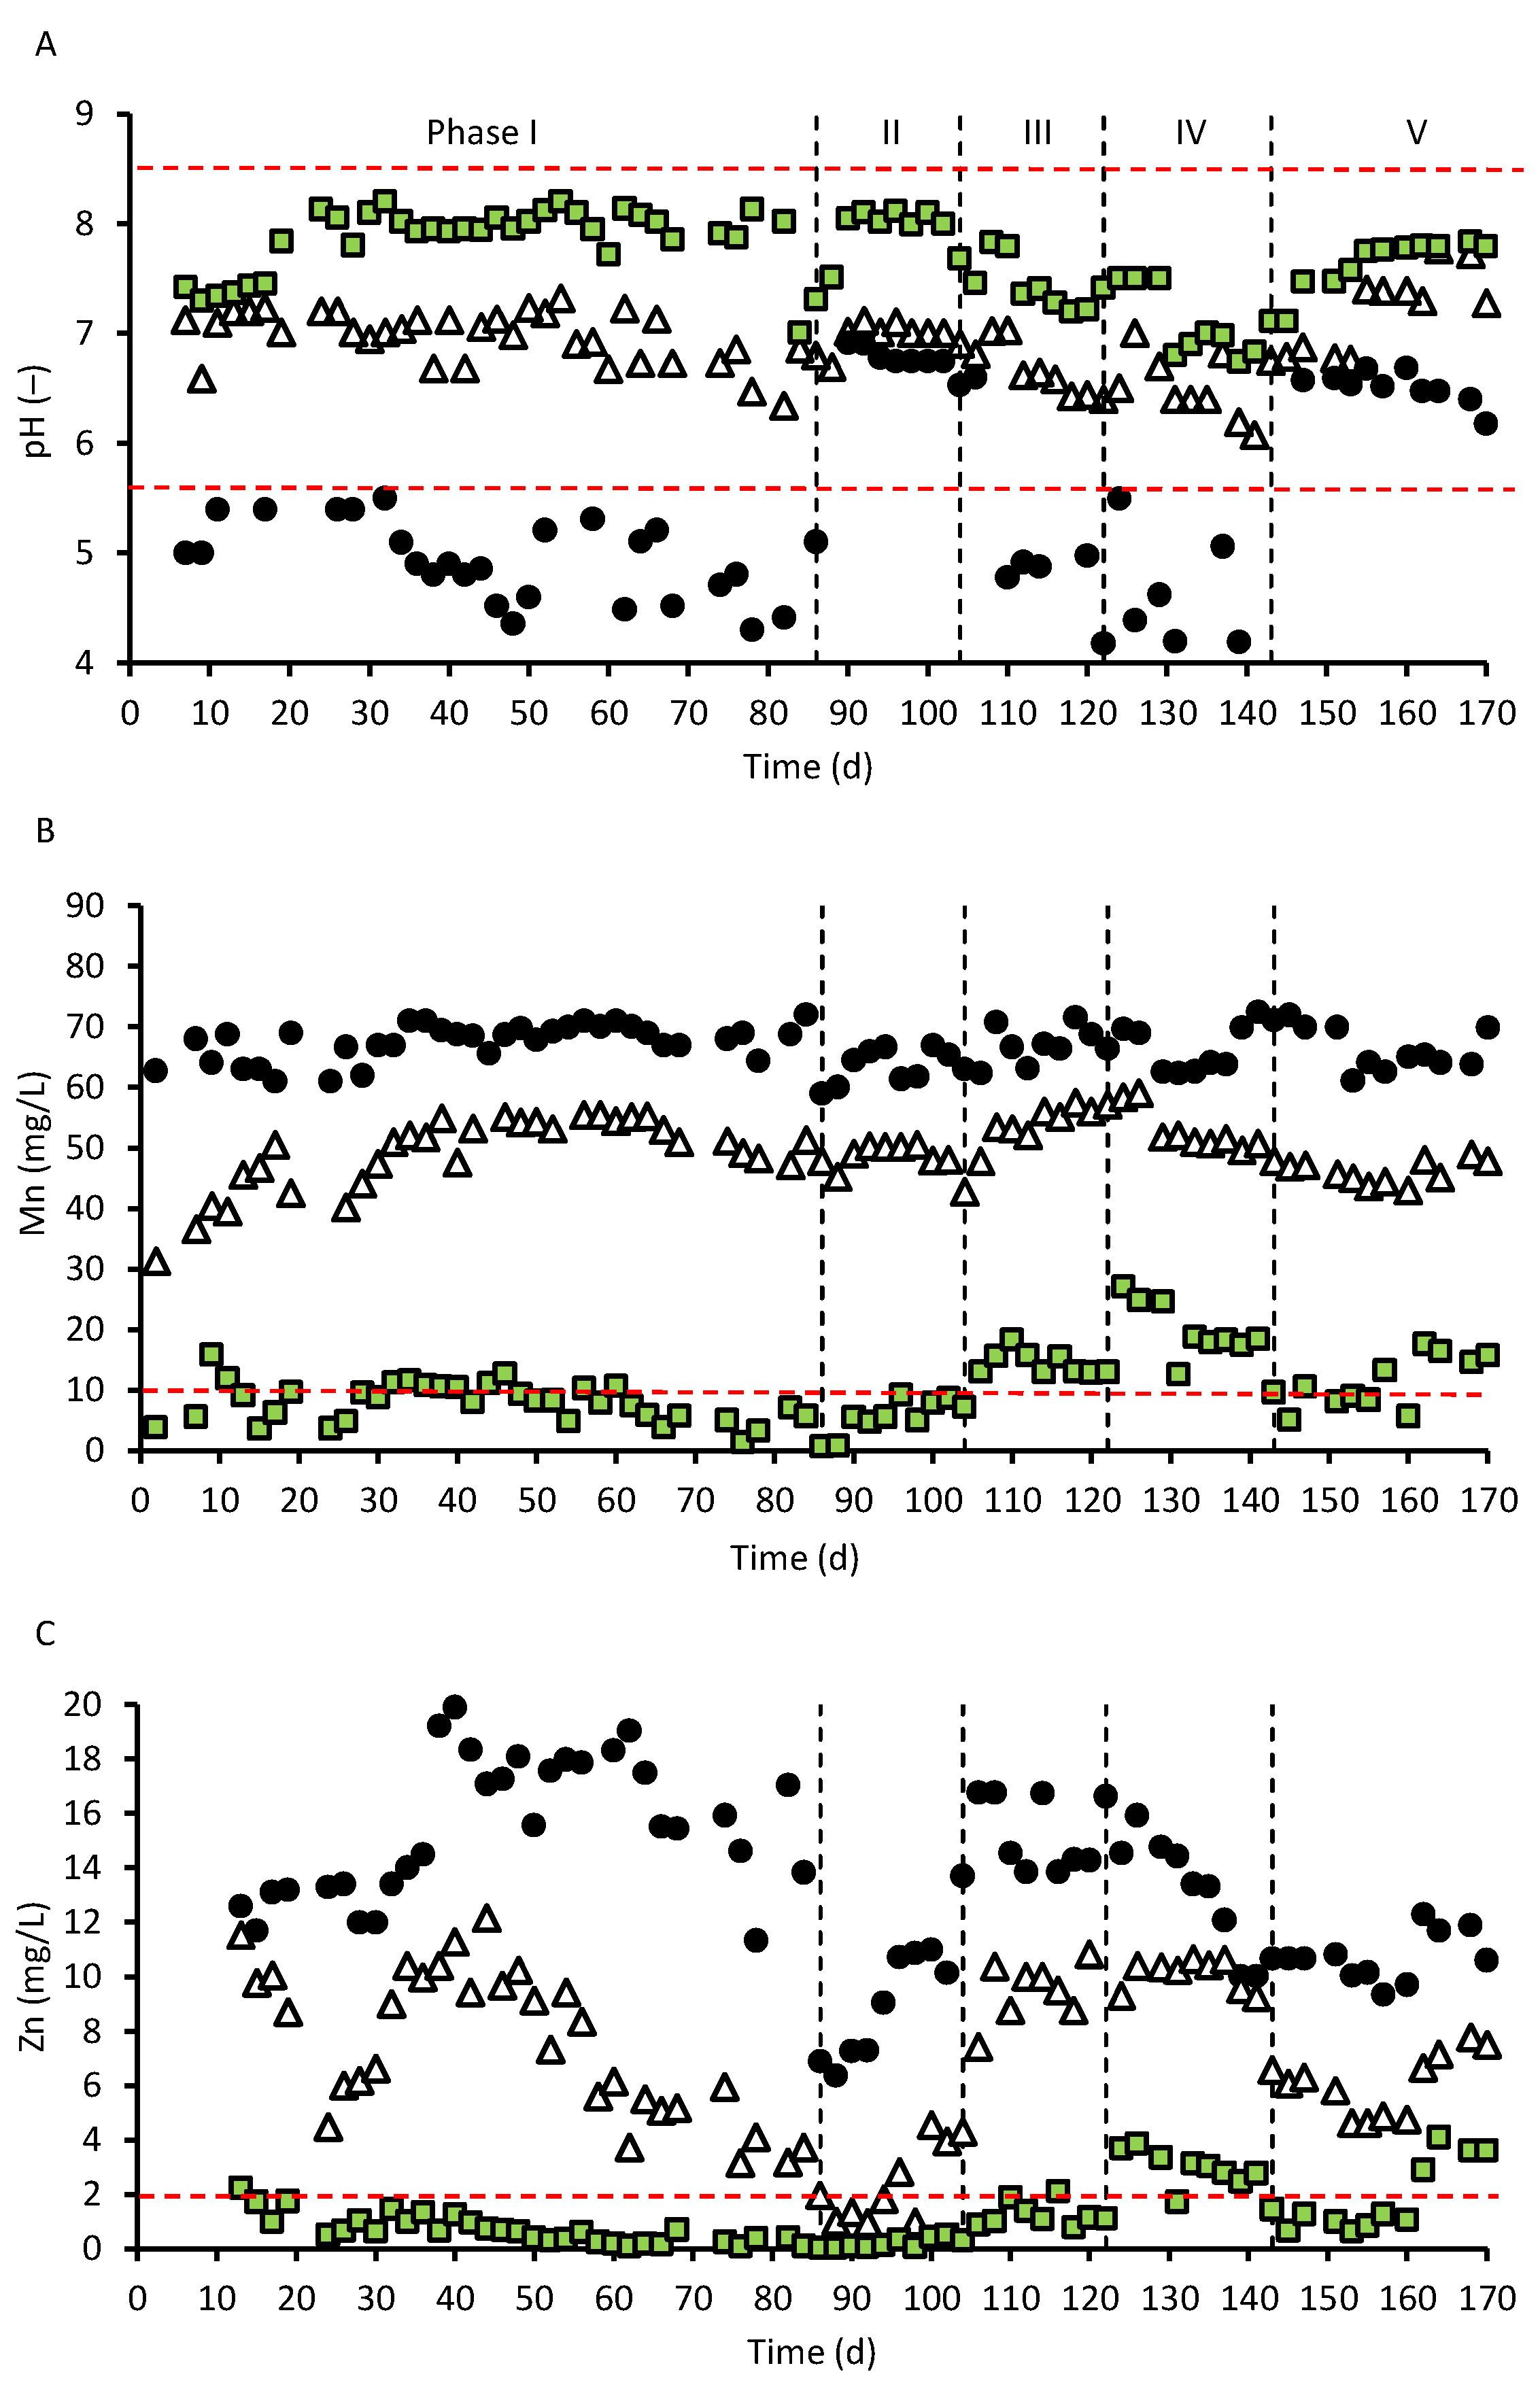
Figure 2.
Photographs of the CWs used for the treatment of Mn-containing AMD and the harvested belowground plant biomass. The planted CW (left) and unplanted CW (right) on (A) day 0, (B) day 85, (C) day 101, (D) day 121, and (E) day 170; and (F) roots and rhizomes recovered from the planted CW at the end of the experiment.
Figure 2.
Photographs of the CWs used for the treatment of Mn-containing AMD and the harvested belowground plant biomass. The planted CW (left) and unplanted CW (right) on (A) day 0, (B) day 85, (C) day 101, (D) day 121, and (E) day 170; and (F) roots and rhizomes recovered from the planted CW at the end of the experiment.
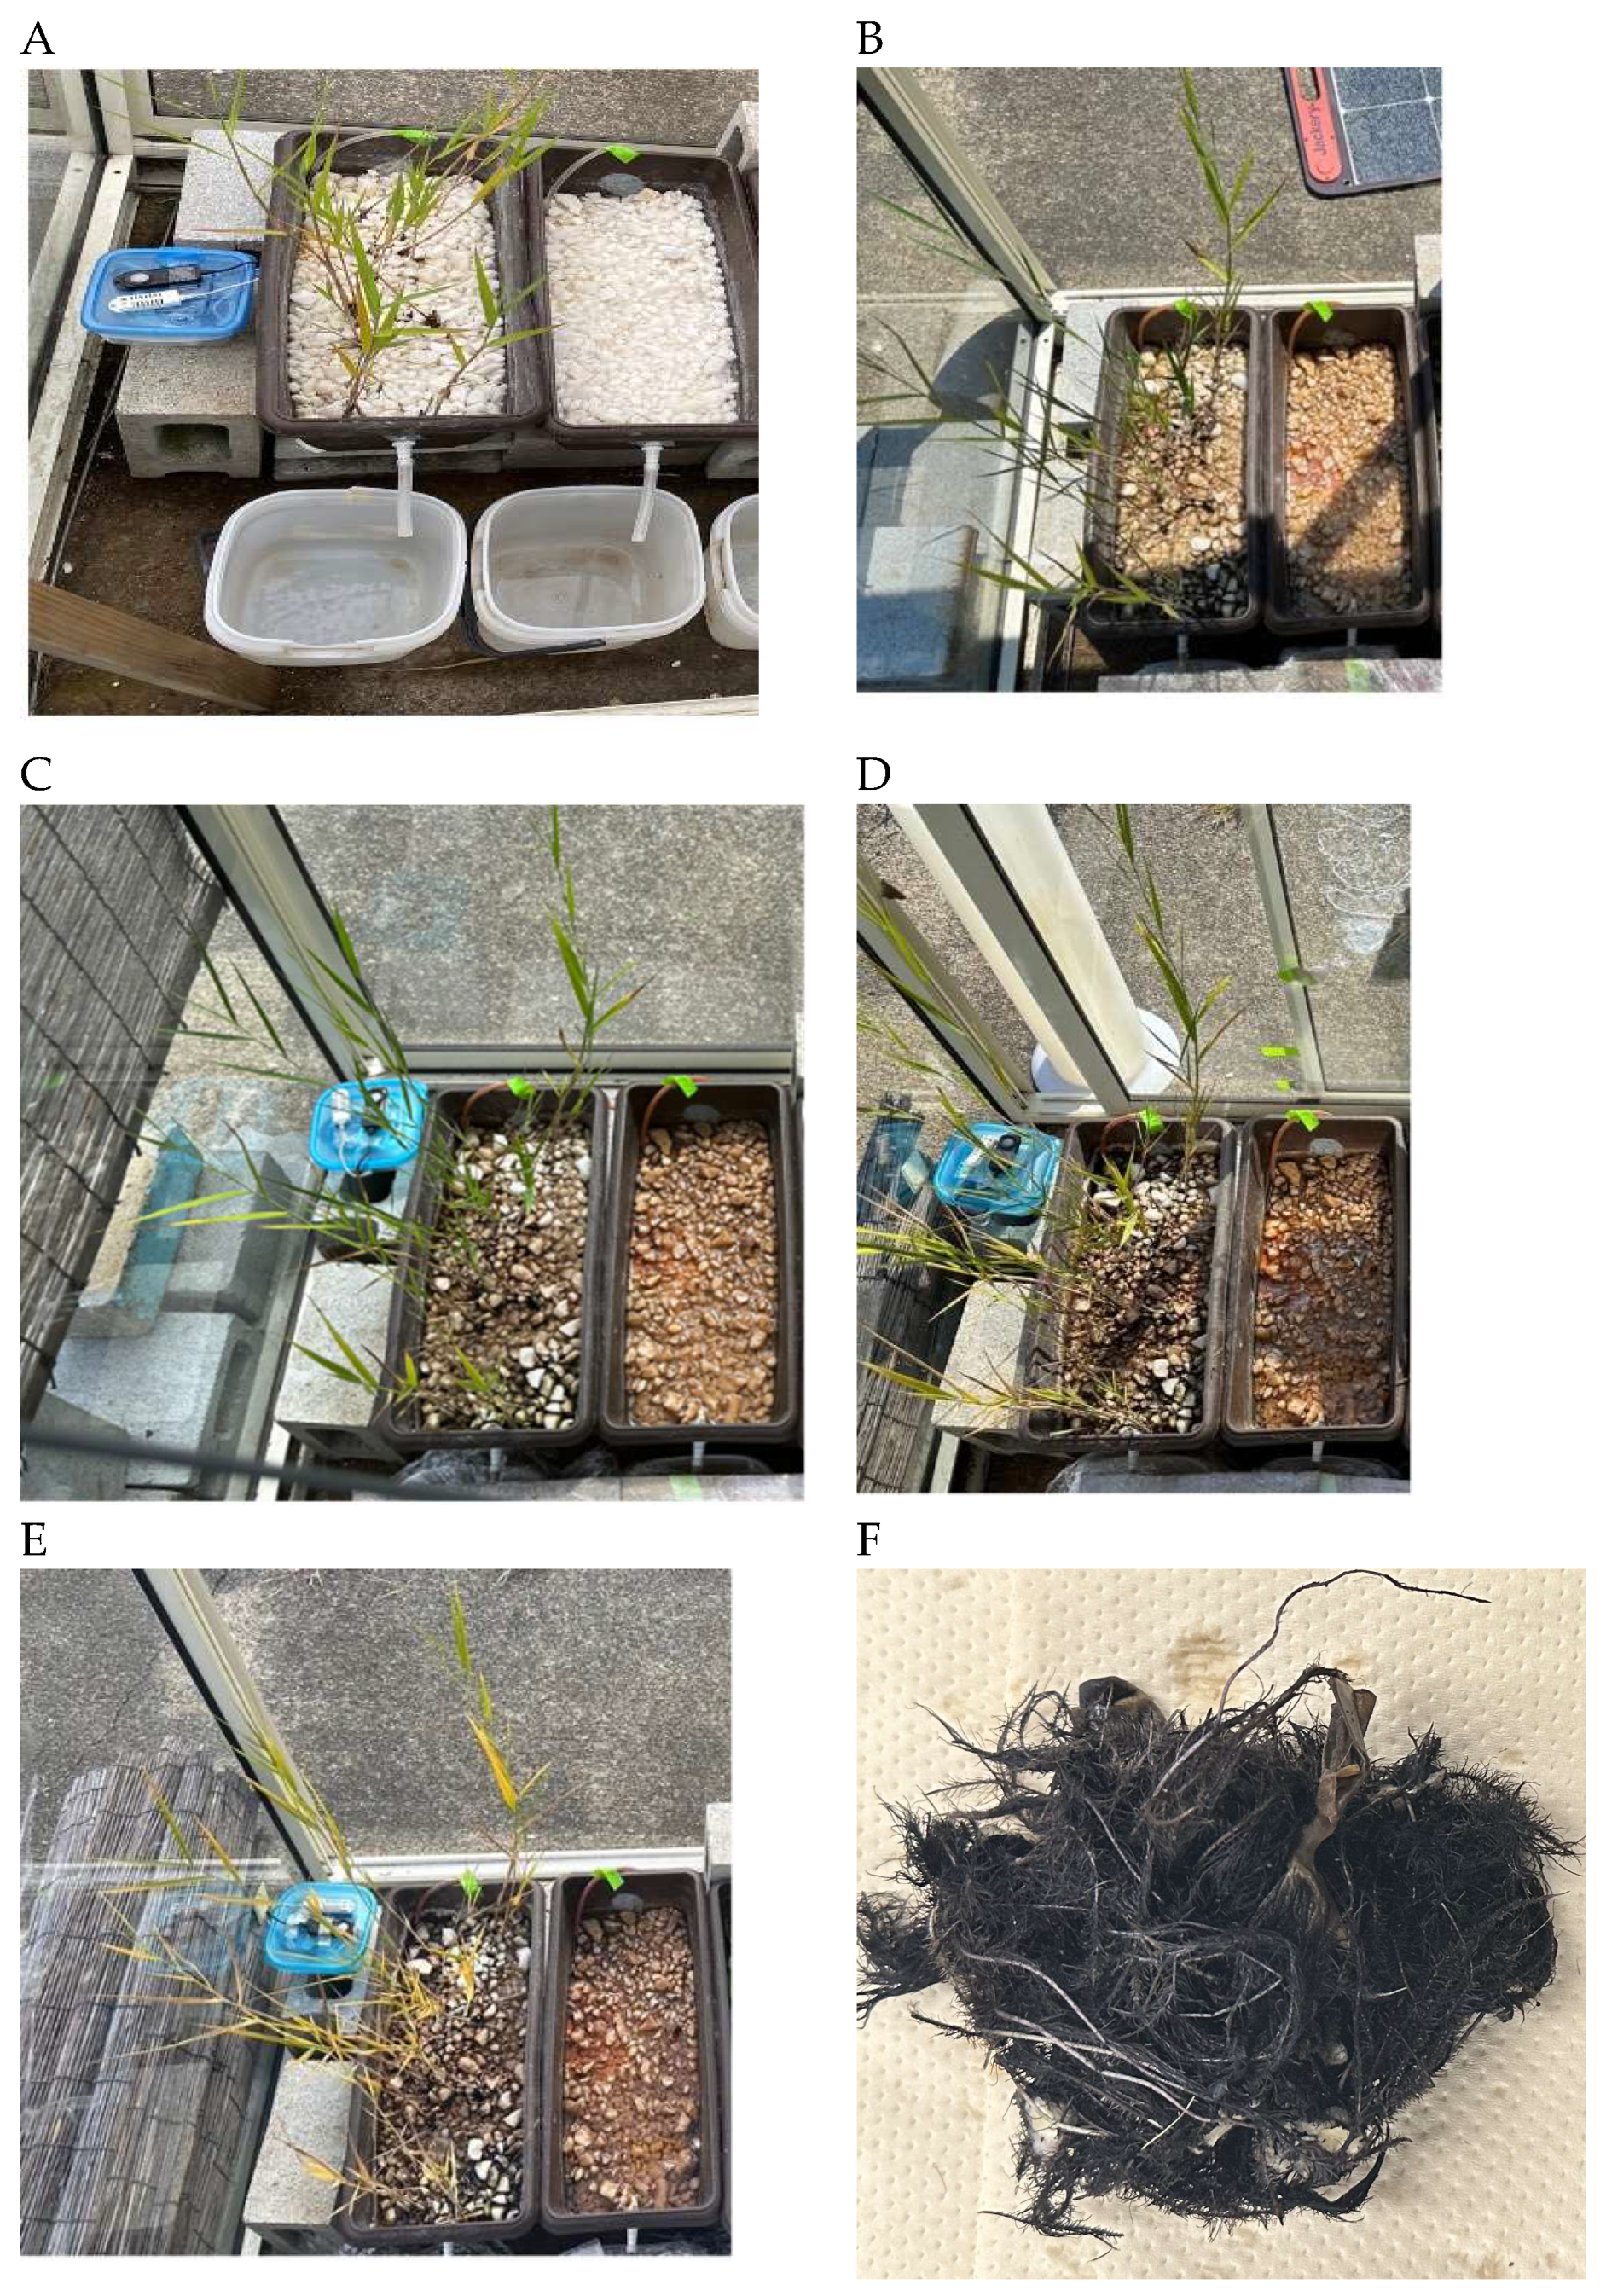
Figure 3.
Box plots of (A) Mn and (B) Zn concentrations in the influent, effluent of unplanted CW (UP-CW), and planted CW (P-CW) during each operational phase. Boxes represent the interquartile range, the horizontal line within each box indicates the median, and whiskers indicate the minimum and maximum values. Horizontal dashed lines indicate the discharge standards. Different lowercase letters indicate significant differences among groups (p < 0.05, Tukey's multiple comparison test).
Figure 3.
Box plots of (A) Mn and (B) Zn concentrations in the influent, effluent of unplanted CW (UP-CW), and planted CW (P-CW) during each operational phase. Boxes represent the interquartile range, the horizontal line within each box indicates the median, and whiskers indicate the minimum and maximum values. Horizontal dashed lines indicate the discharge standards. Different lowercase letters indicate significant differences among groups (p < 0.05, Tukey's multiple comparison test).
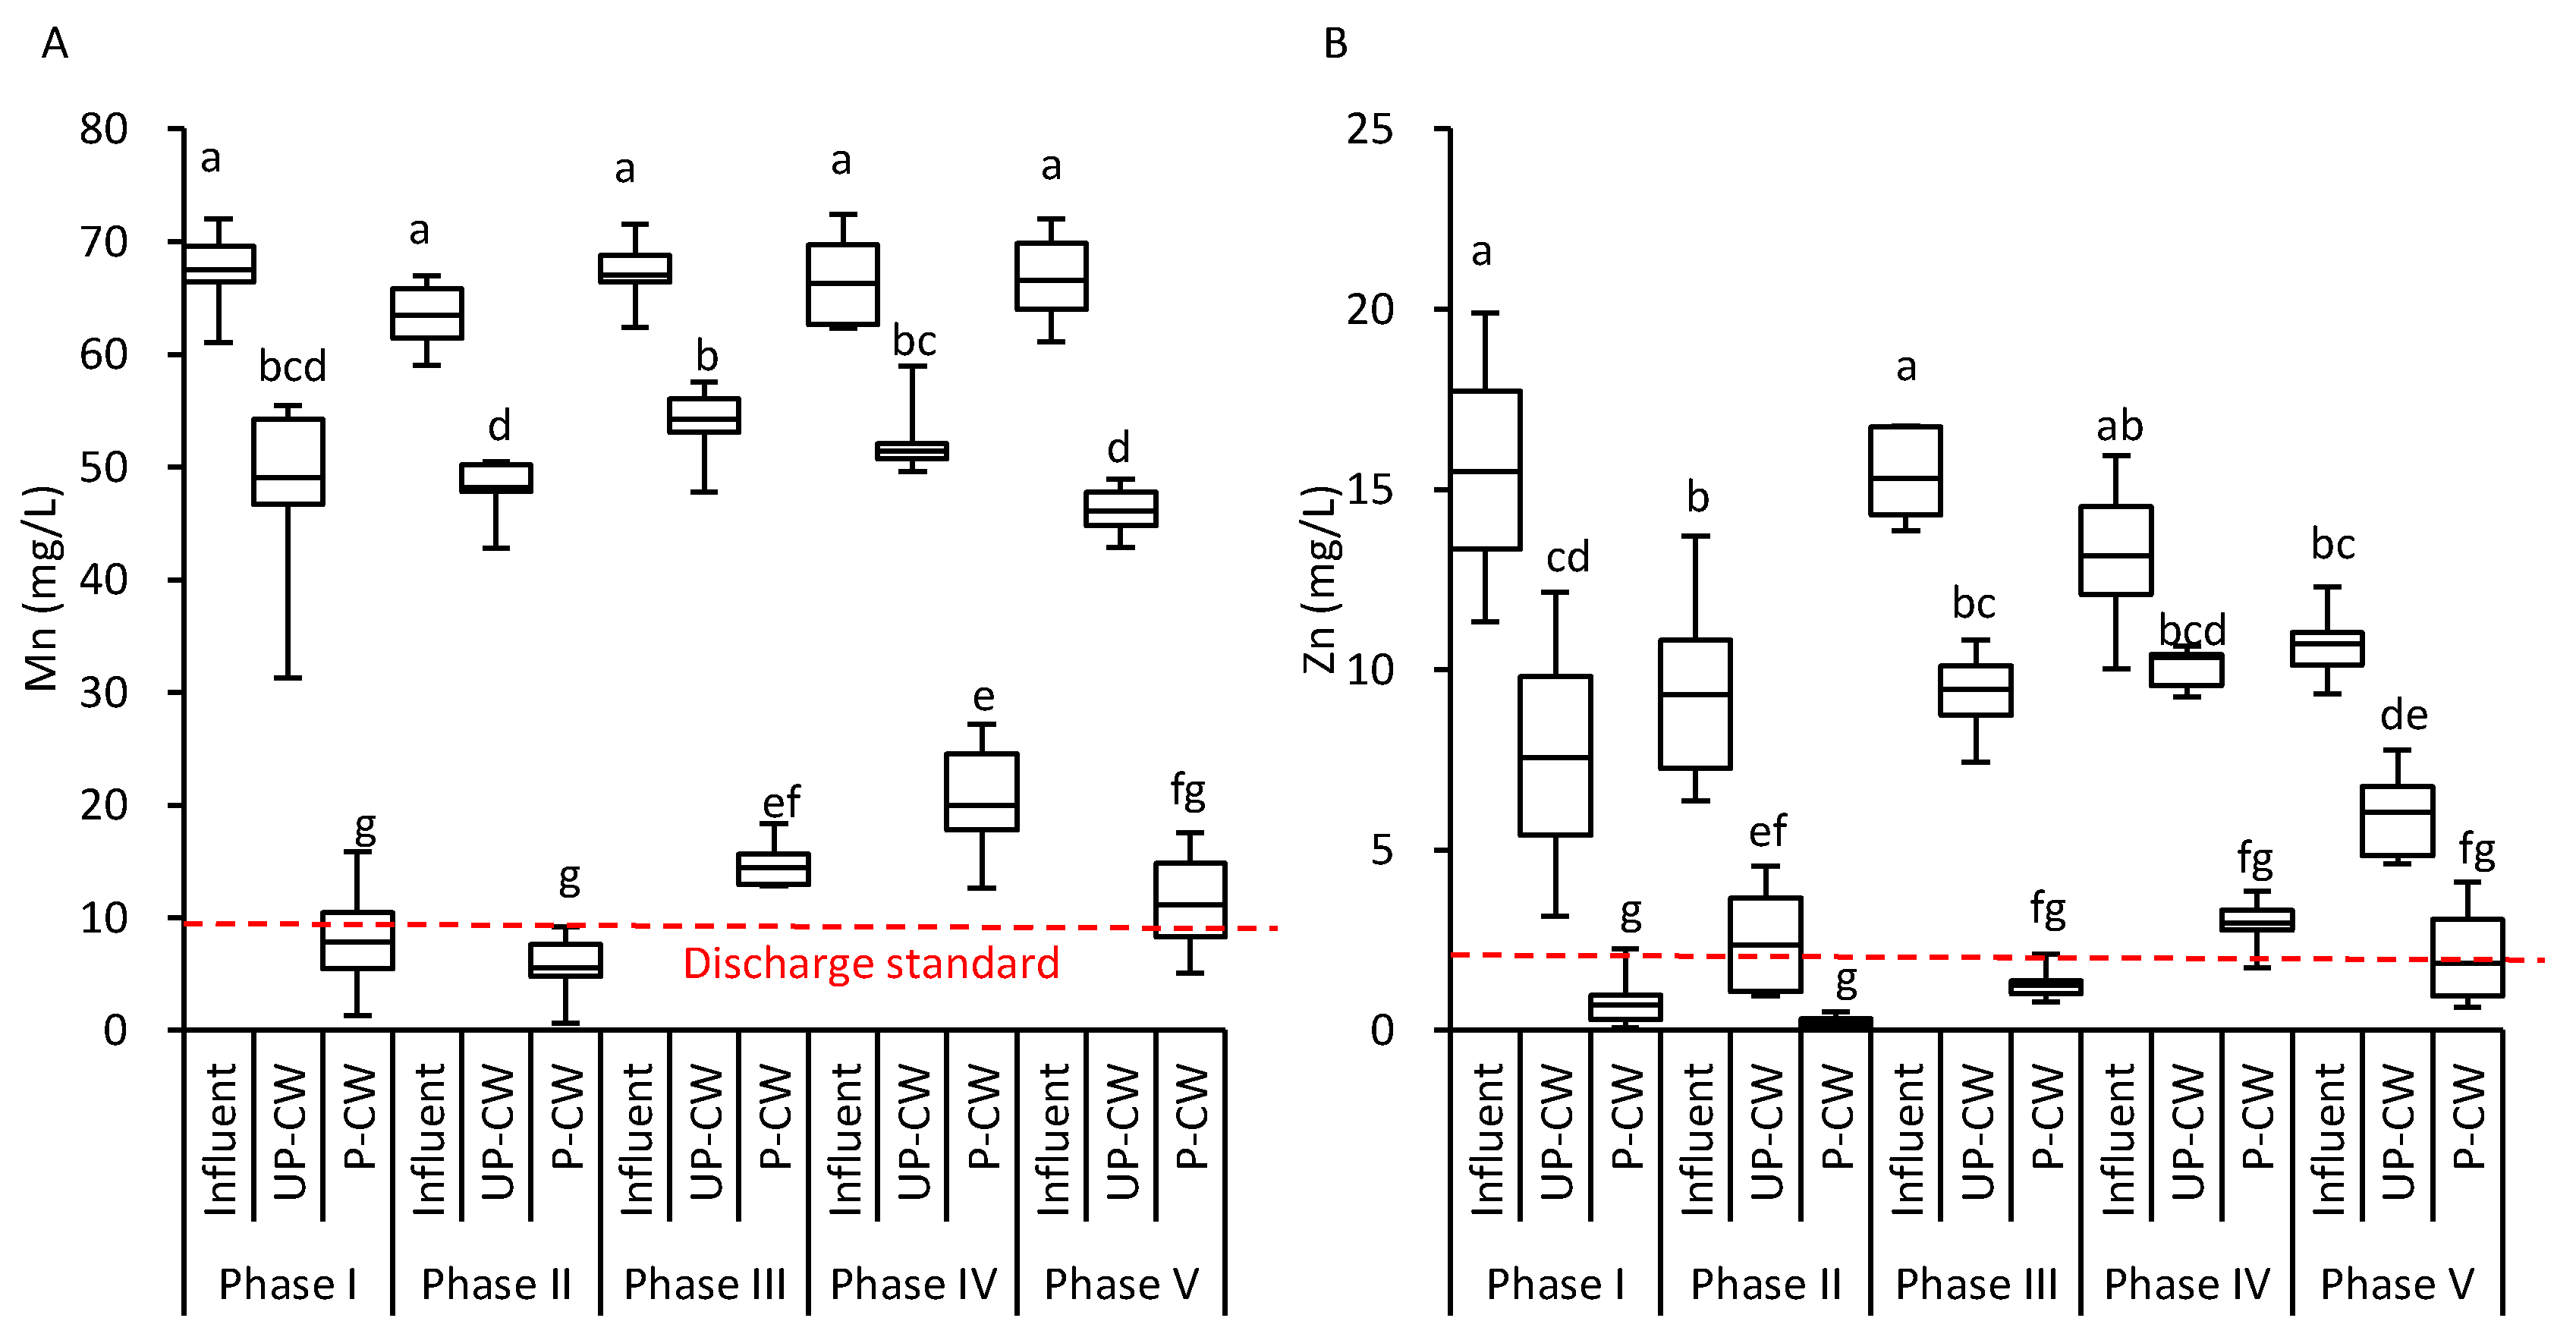
Figure 4.
Relationship between pH and (A) Mn concentration and (B) Zn concentration. Circles, triangles, and squares represent the influent (AMD), the effluent from the unplanted CW, and the effluent from the planted CW, respectively. Horizontal dashed lines indicate the discharge standards. The black dashed curve in (B) represents the theoretical solubility of Zn based on the solubility product of Zn(OH)₂.
Figure 4.
Relationship between pH and (A) Mn concentration and (B) Zn concentration. Circles, triangles, and squares represent the influent (AMD), the effluent from the unplanted CW, and the effluent from the planted CW, respectively. Horizontal dashed lines indicate the discharge standards. The black dashed curve in (B) represents the theoretical solubility of Zn based on the solubility product of Zn(OH)₂.
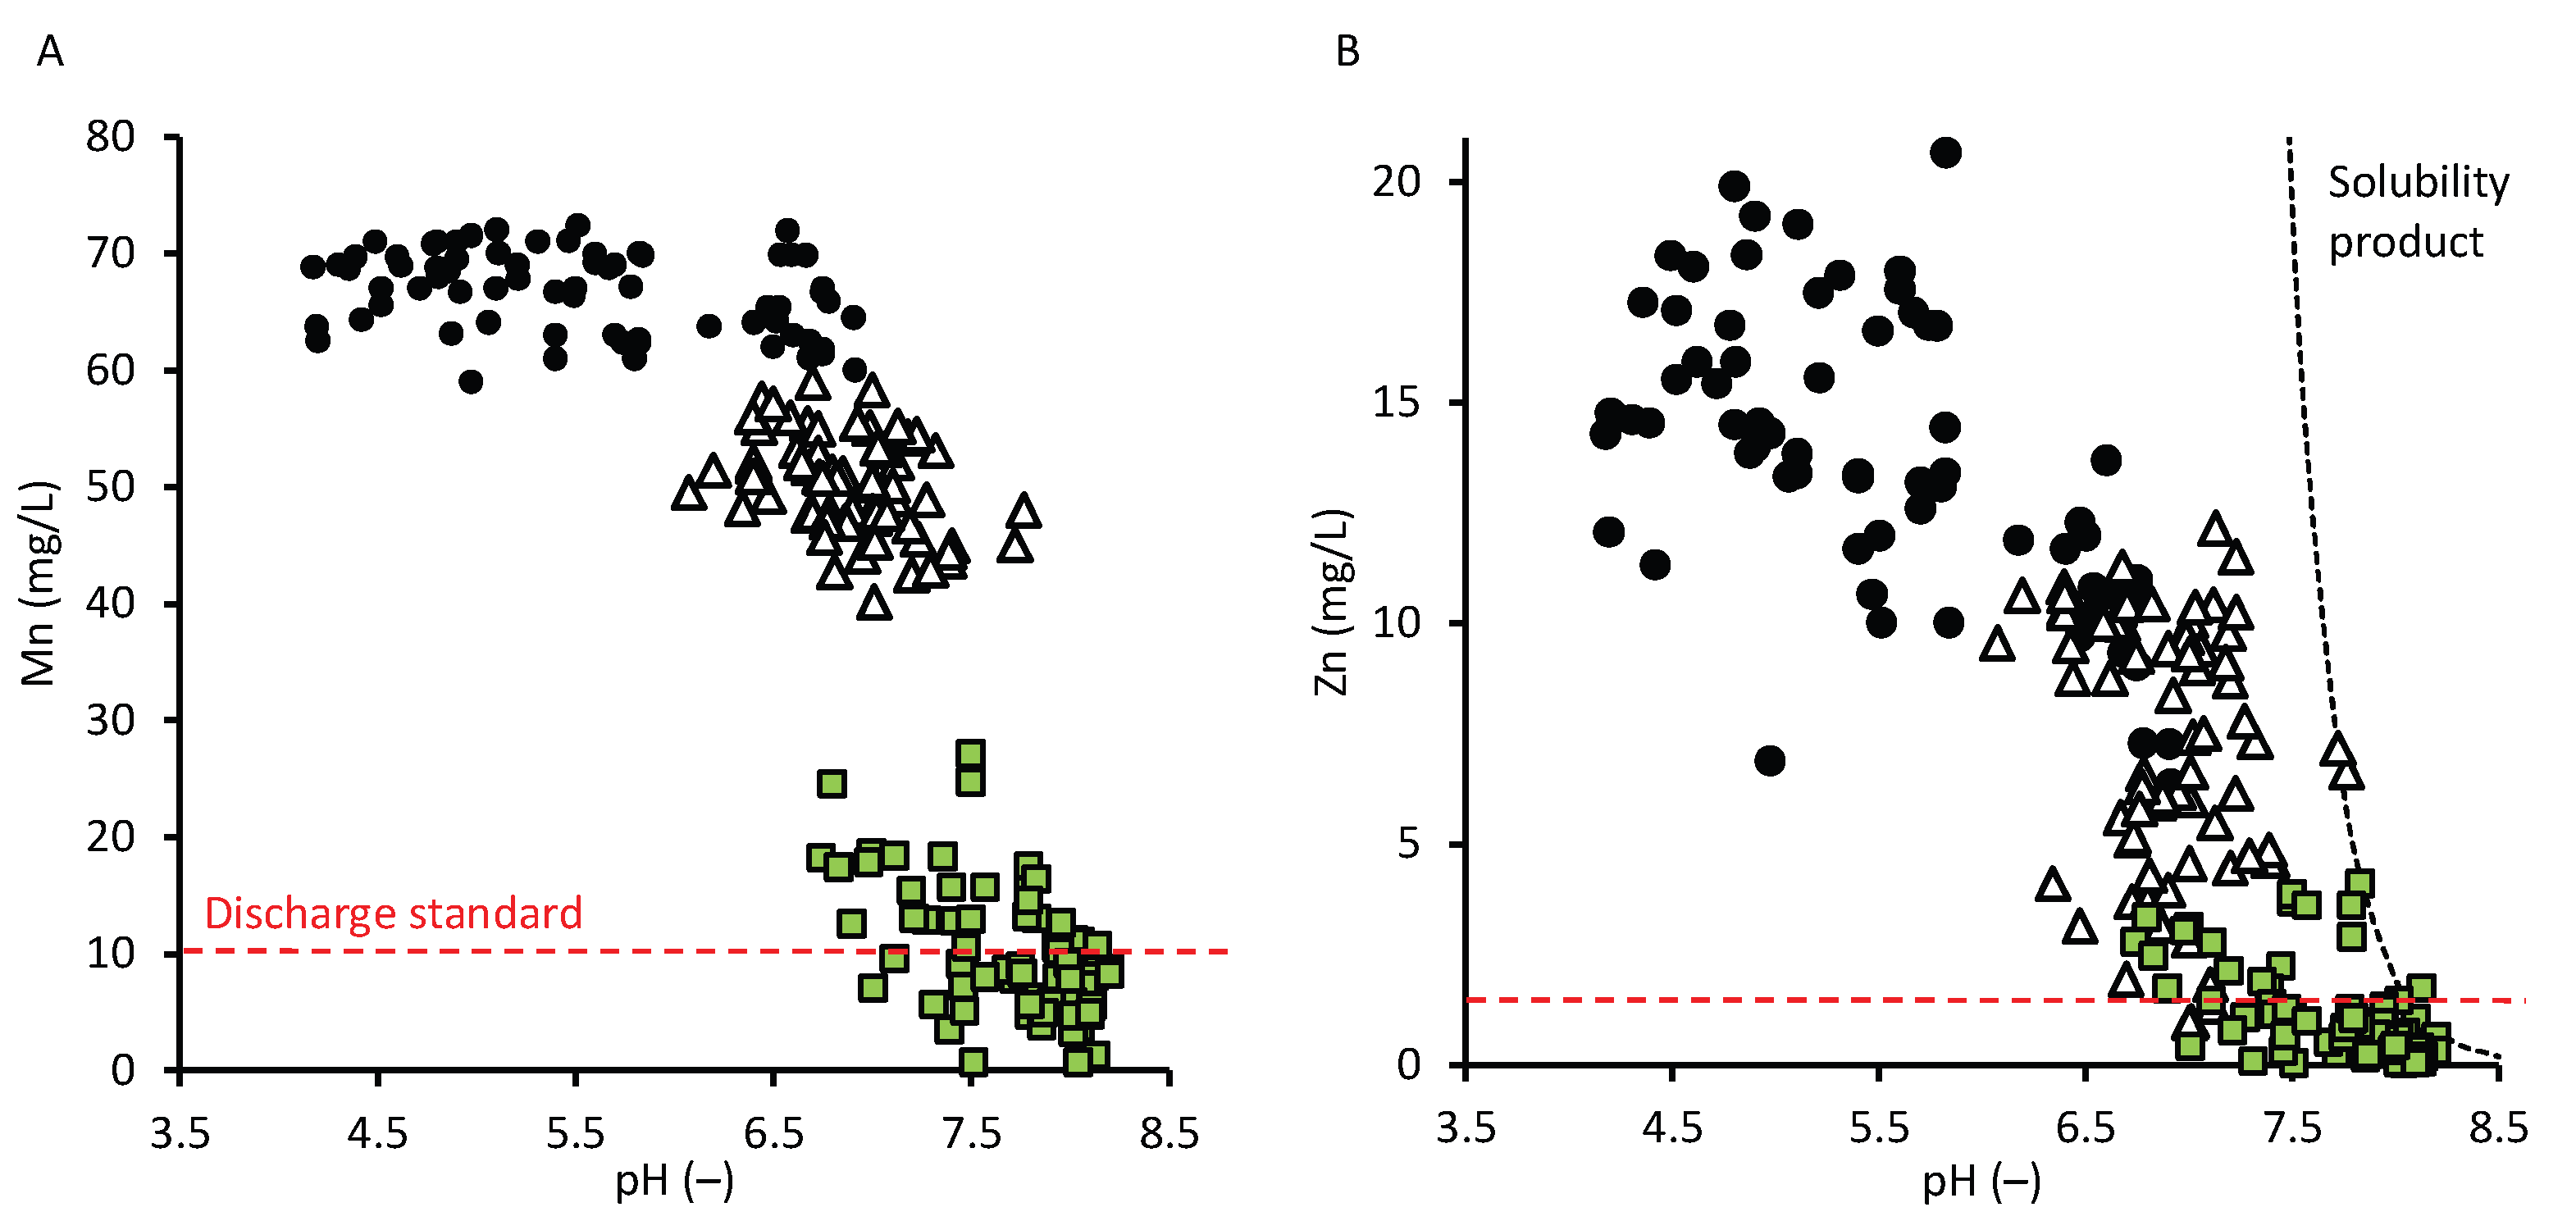

Table 1.
Constructed wetlands (CWs) for removing Mn from wastewater.
| Wastewater | CW configuration | Effluent | References |
|---|---|---|---|
| Coal combustion leachate in USA (Mn < 3.3 mg/L, Fe < 4.7 mg/L, pH 6.2-7.7) | A pilot-scale surface flow CW; compost + soil; Typha, Scirpus, Carex; HRT 20 h; 0–30°C | Mn 0.0005–0.44 mg/L, Fe 0.002–0.49 mg/L, pH 6.2-7.7 | [9] |
| Pretreated AMD in UK (Mn 10—40 mg/L, pH 5.0-7.0) | Pilot-scale rock filters following pretreatment; granite; algae; HRT 21h; 5–13 °C | Mn < 1 mg/L (pH 7.0), unchanged (pH <5.0) | [10] |
| Alkaline mine waters in UK (Mn 2 mg/L, Fe 45 mg/L, sulfate 3000 mg/L, pH≈ 7) | Full-scale lagoon + surface-flow CWs; natural sediments; Typha, Phragmites | Mn < 0.4 mg/L, pH 7.8, Fe < 1 mg/L | [11] |
| Steel wastewater in China (Mn 0.11—2.23 mg/L, Fe 0.16—2.24 mg/L, pH 6.5-7.2) | Lab-scale vertical flow CWs; Mn ore or gravel; Phragmites; HRT 2—5 d | Mn < 0.05 mg/L, Fe < 0.05 mg/L, pH 7.5—8.2 | [12] |
| (Mn < 2.23 mg/L) | A pilot-scale subsurface horizontal flow CW; gravel Mn ore; Phragmites; HRT 1.5—3 d | Mn < 0.1 mg/L, Fe removal 94%, pH 6.5—7.2 | |
| Synthetic wastewater in Sri Lanka (Mn 1.0 mg/L, pH 6.2—7.1) | Bench-scale hydroponic CWs; water hyacinth; 3-week cycle batch; 2–22°C | Mn < 0.1 mg/L (re-release after 7d); 0.2—0.4 mg/L (nutrient deficient), pH 7.3—7.8 | [13] |
| Synthetic AMD and domestic sewage in China (Mn 4.8 mg/L, Fe < 1 mg/L, pH 7.4—8.0) | Lab-scale polishing CW after anaerobic pretreatment; limestone, cobblestone; Salvinia, Alternanthera; HRT 4 d | Mn 0.12 ± 0.11 mg/L, Fe < 0.1 mg/L, Zn < 0.1 mg/L, pH 7.8—8.6 | [14] |
| Mine wastewater in France (Mn 3.6 mg/L, Fe 28.4 mg/L, pH 6.5) | Full-scale surface-flow CWs; natural sediments; Phragmites 11–28°C | Mn removal 43—92 % | [15] |
| Synthetic and actual AMD in Japan (Mn 66 mg/L, Zn 10—15 mg/L, pH 5.0–6.5) | Lab-scale horizontal subsurface-flow CWs; limestone; Phragmites; HRT 1–2 d; Greenhouse temperature 15–30 °C | Mn 5.5–20.0 mg/L, Zn 0.2–3.0 mg/L, pH 7.0–7.9 | This study |
Table 2.
Operating period and operational conditions of CWs.
| Phase | Date | Influent flow rate (L/d) | Mine drainage |
Mean air temperature (°C) |
Mean daily integrated illuminance (klux·h d⁻¹) |
|---|---|---|---|---|---|
| I | 2023/6/4- 8/26 (Day 0-85) | 1.0 (HRT = 2 d) | Synthetic | 30.7 ± 8.7 | 306 ± 126 |
| II | 2023/8/27- 9/15 (Day 86-101) | Actual | 27.9 ± 7.4 | 241 ± 98 | |
| III | 2023/9/16-10/3 (Day 102-121) | Synthetic | 24.9 ± 5.0 | 186 ± 74 | |
| IV | 2023/10/4-10/22 (Day 122-142) | 2.0 (HRT = 1 d) | Synthetic | 20.8 ± 4.2 | 121 ± 59 |
| V | 2023/10/23-11/21 (Day 143-170) | 1.0 (HRT = 2 d) | Actual | 15.1 ± 7.6 | 196 ± 82 |
Disclaimer/Publisher’s Note: The statements, opinions and data contained in all publications are solely those of the individual author(s) and contributor(s) and not of MDPI and/or the editor(s). MDPI and/or the editor(s) disclaim responsibility for any injury to people or property resulting from any ideas, methods, instructions or products referred to in the content. |
© 2026 by the authors. Licensee MDPI, Basel, Switzerland. This article is an open access article distributed under the terms and conditions of the Creative Commons Attribution (CC BY) license (http://creativecommons.org/licenses/by/4.0/).
Copyright: This open access article is published under a Creative Commons CC BY 4.0 license, which permit the free download, distribution, and reuse, provided that the author and preprint are cited in any reuse.