
Submitted:
13 July 2026
Posted:
21 July 2026
You are already at the latest version
Abstract
As de-icing and anti-icing blade heating systems for wind turbines continue to mature, operators have developed a clearer understanding of both their benefits and their limitations. This growing operational experience has increased the need for warranty frameworks that can verify whether such systems perform as intended under real icing conditions. This paper reviews existing approaches to blade heating system warranties and, based on case studies, proposes practical methods to improve them. The principal challenge lies in separating meteorological risk, namely the frequency and severity of icing events, from technological risk, namely the availability and effectiveness of the blade heating system. This paper reviews existing approaches to blade heating system warranties and proposes a practical self-comparison methodology for evaluating turbine-level performance using measured operational data. The method defines the applicable warranty period from external icing measurements, excludes periods of active meteorological icing to reduce the influence of site-specific exposure, and evaluates the remaining production shortfall using the Warranted Icing Compensable Energy, WICE. The methodology is applied to five case studies from four wind farms, four turbine manufacturers, and four blade heating technologies. The proposed framework provides a transparent and operationally applicable bridge between existing warranty guidelines and the detailed implementation rules required for commercially meaningful performance assessment of wind turbine blade heating systems.
Keywords:
wind energy
; icing
; blade heating
1. Introduction
As wind power accounts for an increasing share of total electricity production, the predictability of wind generation becomes increasingly important [11]. In cold climates, which represents 27% of the total onshore wind energy installed capacity [14], one of the main threats to this predictability is atmospheric icing and its impact on wind turbine production [29]. The key challenge is no longer only how much energy is produced over a season, but also when that energy is produced. Hence, icing affects not only the total annual energy yield, but also the timing of power delivery, thereby creating additional uncertainty for grid operators and energy traders and therefore imbalance costs [11]. One of the main tools available to reduce this uncertainty is the use of ice protection systems (IPS), which aims to prevent ice from forming onto the blades and reduce icing-related losses and downtime [16]. However, field experience has shown that IPS performance often falls short of operators expectations [9]. In a 2020 survey of 19 operators from nine countries, 42% of respondents reported operating without an IPS and, among the remaining operators, only 16% were satisfied with the performance of their system [9]. The main sources of dissatisfaction were insufficient robustness and lower-than-expected performance [9]. This dissatisfaction has increased pressure on original equipment manufacturers, OEMs, to provide IPS performance warranties that better reflect operational reality and incentivize further technological improvement.
Early contributions focused primarily on the physical effectiveness of IPS under real icing conditions. These studies showed that IPS performance depends strongly on ambient temperature, wind speed, and icing severity, which motivated the use of IPS performance envelopes rather than single-point efficiency claims [22,24]. A benchmark study from the VTT Technical Research Centre of Finland reinforced this conclusion by showing that only two of four evaluated IPS cases delivered a production gain relative to reference icing losses. The average gain was % at the two successful sites with substantial residual icing losses still remaining [13,17]. These findings are highly relevant for warranty design because they demonstrate that installed heating capacity, or even simple system availability, is not an adequate proxy for recoverable energy performance during real icing events. It also highlights that IPS cannot cope with all icing conditions and this situation can lead to problematic situations if expectations are not well scoped.
The first systematic effort to formalize warranty practice emerged through IEA Wind Task 19 [8]. IEA Task 19 sought to establish a common language for turbines operating in icing climates, define a framework for performance warranties, and move toward fewer and more standardized warranty options and test methods [33]. The resulting guideline requires a clearly defined operational envelope, explicit data-selection and filtering rules, a measurement methodology, warranted performance criteria, and predefined consequences in the event of test failure [8]. A key contribution of the guideline is the distinction between meteorological risk and technological risk. In this framework, the developer is responsible for selecting a site and takes responsibility of the icing and other meteorological risks, requiring a characterization of the icing climate. Whereas the OEM or IPS supplier is responsible for the selected technology within the agreed operational envelope [8]. IEA Task 19 further recommends that the IPS be integrated into the turbine procurement process and covered by both an availability warranty and a separate performance warranty. The lack of energy production due to icing can no longer be treated as a rare event (act of god) by the manufacturer as icing happens every winter in cold climate. A warranty proposal might include an availability aspect to confirm that the IPS is technically capable of activating when icing occurs, as opposed to a performance warranty that shall evaluate whether the complete turbine system, including the IPS, the detection method, and the control strategy, is able to maintain production during and after icing events [8].
The IEA Task 19 guideline distinguishes two different approaches for IPS performance warranties:
- The first and preferred option is a turbine performance warranty in icing climates, which evaluates the energy production of the complete turbine system during and after icing events.
- The second option is an ice protection technology (IPT) performance warranty proposal focusing only on the physical performance of the heating system itself, for example the time needed to remove ice or to reach a specified blade temperature threshold.
The guidelines do not recommend IPT-only warranties as the primary contractual approach for OEM-provided IPS, because they may verify heater function without demonstrating meaningful turbine-level energy recovery. In other words, the guideline shifts the warranty discussion away from component functionality alone and toward system-level production performance under defined icing conditions [8].
For the turbine performance warranties, the guidelines identify two main test methods: turbine self-comparison and side-by-side comparison [8]. The report also stresses that a warranty without a clearly defined test method or methodology is incomplete [8]. The guidelines also make clear that the preferred method is not necessarily the one with the lowest direct cost, since cost-effectiveness must be balanced against measurement uncertainty and statistical relevance [8]. In all cases, the warranty should define the operational envelope, icing-event definition, exclusions, required data coverage, minimum number of turbines, and pass/fail threshold before testing begins [34].
1.1. Self-Comparison
In this method, the turbine SCADA data are used to construct a reference power curve under non-icing conditions, and the turbine performance during filtered icing periods is then evaluated against the potential energy production estimated from that reference. One must be careful when estimating the expected power from the wind speed as it can be influenced by other factors, such as turbine status, wake effects and ambient temperature [23]. IEA Task 19 therefore frames self-comparison as a maintained-energy test, that is, a test of how much of the turbine’s no-ice potential production is preserved during icing conditions.
Pros:
- One of the most practical approaches as it is only using the data from the analyzed turbine.
- It does not require an external reference turbine, all turbines can continue operating with the IPS activated during winter (no extra losses).
- The method can be applied across many turbines at the same site, which improves statistical relevance.
Cons:
- It is sensitive to seasonal and inter-annual changes in wind and icing conditions.
- It can suffer from data-availability issues when seasonal wind regimes differ strongly.
- It does not directly show how much production the IPS recovers relative to a turbine without IPS.
- Because the reference is estimated rather than directly measured, the method also introduces additional uncertainty into the performance metric (IEA Wind Task 19, 2020).
1.2. Side-by-Side Comparison
The side-by-side comparison method addresses some of these weaknesses by comparing one or more turbines operating with an active IPS against matched turbines operating with a deactivated IPS, or with no IPS at all, under similar wind and icing conditions.
Pros:
- Its main advantage is that it gives a clearer measure of recovered energy, that is, how much icing loss is actually regained relative to an unprotected turbine,
- It offers a more intuitive basis for commercial valuation and return-on-investment assessments.
- Side-by-side testing can provide both maintained-energy and recovered-energy metrics.
Cons:
- The method is less scalable than self-comparison.
- It can introduce bias and uncertainty through turbine pairing.
- It can be difficult to implement on complex sites where neighboring turbines do not experience sufficiently similar inflow and icing conditions.
- For new sites where all turbines are equipped with IPS, an additional drawback is that one or multiple wind turbines must effectively serve as a sacrificial reference by operating with deactivated IPS, which reduces production during the test period [8].
Warranted levels derived from self-comparison and side-by-side testing are not directly comparable, because they are based on different quantities. The maintained-energy metric will generally yield higher numerical values than the recovered-energy metric for the same physical case, while the recovered-energy metric also depends on how the reference turbine behaves during icing without IPS. This distinction is highly relevant for contract drafting, because a nominally similar percentage can represent very different technical and commercial commitments depending on whether it refers to maintained energy or recovered energy [8,27].
1.3. Public Records of IPS Performance Warranties
Publicly available records of IPS performance warranties remain limited. In 2015, Siemens indicated that future IPS warranties should address turbine-level outcomes such as decreased downtime caused by icing, increased energy production, or reduced energy loss [18]. Since 2018, Vestas has stated that its anti-icing solution ensures 90% production retention and complies with the warranty guidelines, although no public documentation appears to explain how this value is calculated [30]. In 2020, Nordex explicitly distinguished between an ice-loss-recovery warranty and a warranted power-curve level during icing, and showed that the two concepts can lead to materially different annual-energy outcomes even when the nominal warranted percentage is the same [27]. In 2022, Nordex provided one of the first public examples of a structured IPS performance warranty, defining applicability for active icing between +3∘C and -20∘C and warranting a minimum of 80% of AEP during hours when the anti-icing system is active [28]. Enercon’s 2021 fleet assessment similarly proposed the Ice Production Ratio, IPR, as a practical SCADA-based metric and reported an average IPR of 71% over approximately 1,000 turbine-years, while also emphasizing that IPR is site- and technology-specific [4].
During the 2018 Winterwind International conference, a panel composed of all four major cold-climate Original Equipment Manufacturers (OEMs) represented in the panel, Enercon, Nordex, Siemens Gamesa, and Vestas discussed the technicalities surrounding performance warranties in cold climate. All OEMs represented in the panel, agreed broadly that icing-related risk should be shared between the developer and the OEM, but they differed in how that principle should be implemented. Enercon and Nordex both stated that residual icing losses cannot be eliminated entirely and should therefore remain partly with the owner, while Nordex further distinguished owner-managed health and safety risk from OEM-warranted winter power curve and availability performance. Siemens Gamesa argued that risk should be allocated according to competence, with the developer responsible for site climate characterization and the OEM responsible for product performance. Vestas proposed a system-level warranty logic in which the guaranteed performance is referenced to predicted icing losses and any penalty is tied to the measured shortfall relative to that prediction [12]. The same panel also revealed substantial divergence in preferred verification philosophy. Enercon favored simple component-level verification using existing installed sensors and clearly defined thresholds, and regarded winter power curve testing as site-specific, expensive, and highly uncertain. Nordex preferred IEC-based winter power curve verification with a met mast and supported ongoing standardization through IEA Task 19. Siemens Gamesa favored side-by-side field comparison between turbines with and without cold-climate functionality, using relative ice-loss recovery as the core metric. Vestas emphasized full-scale product-level testing with reference turbines, complemented by structural and functional verification. These responses show that, by 2018, OEM practice had not yet converged on a common IPS test methodology and instead ranged from low-cost functionality checks to comprehensive field-performance validation [12].
More recent work suggests that the field is converging toward a more operationally explicit view of what should be warranted. Operational envelopes are now being defined more explicitly in terms of wind speed, air temperature, and liquid water content (LWC), while heating-trigger strategy and IPS availability have emerged as contract-critical variables rather than secondary operational details [1,3,7,32]. This development is consistent with the logic of IEA Task 19: a practical warranty framework must separate site-dependent meteorological exposure from the technology-dependent ability of the IPS and turbine control system to convert that exposure into recoverable production. However, publicly available warranty formulations remain heterogeneous and often ambiguous, particularly with respect to how icing events are defined, whether warranted values refer to maintained or recovered energy, and how technology risk is isolated from meteorological variability. The present paper addresses this gap by reviewing existing approaches to blade heating system warranties and proposing practical methods, with different levels of complexity and data requirements, for evaluating warranted performance under real operating conditions.
The contribution of this paper is to translate existing IPS warranty principles into an operationally applicable assessment framework that can be implemented using field data from operating wind farms. Specifically, the paper proposes a self-comparison methodology in which external icing measurements are used to define the applicable icing period, while active meteorological icing periods are excluded to reduce the influence of site-specific meteorological exposure on the warranty outcome. The method then evaluates turbine-level maintained energy during the resulting warranted period and expresses any performance shortfall through the Warranted Icing Compensable Energy, WICE, a directly compensable energy metric. By applying this framework to five case studies from four wind farms, four turbine manufacturers, and four blade heating technologies, the paper demonstrates how the definition of the warranted period can materially affect warranty compliance while preserving sensitivity to genuine IPS underperformance. The proposed framework therefore provides a practical bridge between high-level warranty guidelines and the detailed implementation rules needed for transparent, reproducible, and commercially meaningful IPS performance assessments.
2. Methodology
The five case studies are drawn from four wind farms using four different turbine manufacturers and blade heating technologies. Each one of the 7-day case study was selected to be representative of the conditions observed in a large variety of wind farms. The objective is to define a self-comparison methodology that is both rigorous and broadly applicable in practice. Although side-by-side comparison generally provides more accurate results, few operators are willing to sacrifice the production of a subset of turbines to evaluate an IPS warranty. Previous work by Roberge et al. [25] proposed a complete methodology for accurately evaluating IPS performance using side-by-side comparison. Among the metrics proposed in that work, three are also applicable to self-comparison: produced energy, energy losses, and energy efficiency.
Produced energy is not a suitable metric for self-comparison because it depends strongly on the available wind resource. Energy losses are less sensitive to the wind resource, but they still lack normalization with respect to the expected production. The most appropriate metric is therefore turbine energy efficiency, defined as the ratio of produced energy to expected energy. This metric is equivalent to the Ice Production Ratio, IPR, defined in the warranty guidelines [8]. However, its value depends strongly on the period over which it is calculated, which makes the definition of the reference period critical.
One option is to compute energy efficiency over a full year, yielding a value similar to losses expressed as a percentage of annual energy production. Evaluating the metric over a full winter remains problematic at sites with infrequent icing, where the seasonal efficiency may remain high regardless of the actual IPS performance. In these cases, the metric does not adequately decouple meteorological risk from technological risk.
A more suitable approach is therefore to compute energy efficiency only during icing events. Under this formulation, a poorly performing IPS in a mild icing climate would still yield a low efficiency if the few icing events it experiences are isolated and evaluated separately. This shifts the problem to the definition of the icing events themselves. Ideally, these events would correspond to the rotor-icing periods of an equivalent unheated turbine. In a self-comparison framework, however, no such reference turbine is available. It is also not appropriate to define events using rotor-icing indicators from the heated turbine itself, such as SCADA signals or blade-based icing sensors, because IPS performance would then directly influence the event definition, creating a circular evaluation [31].
The challenge is therefore to estimate the rotor-icing periods of an unheated turbine using only external information. In principle, this could be attempted with advanced models, including AI-based or digital-twin approaches, but even state-of-the-art methods are not yet able to reproduce turbine performance with sufficient accuracy in a time-series sense [5,6]. A more practical alternative is to simplify the problem and define icing events using instrumental icing. Although instrumental icing is not a precise estimator of icing losses, it generally begins at approximately the same time as rotor icing and typically ends later, thereby providing a conservative upper bound for the event duration. The validity of these assumptions is examined in the following case studies.
Another important effect that needs to be considered is the impact of the meteorological conditions on the IPS performance. The warranty guidelines state that the ambient conditions need to be considered in the form of an operational envelope where ambient temperature, wind speed and LWC are used to define conditions for which the warranty can be evaluated [21]. However, the practical implementation of these envelopes is not defined in the guidelines. This is another point where the meteorological risk and the technological risk need to be decoupled. The proposed methodology aims at providing a solution that is both applicable and representative of the turbine performance.
To simplify the problem, it is hypothesized that whenever there is meteorological icing (i.e. LWC not equal to zero and temperature below the freezing point) the IPS is not expected to be efficient. These periods should then be excluded from the calculation of the energy efficiency as these are associated with the meteorological risk. Moreover, it has been observed that turbines might continue to underproduce or remain stopped due to icing beyond the instrumental icing period. Such cases may be due to turbine controller failing to restart after long icing stoppages. Therefore, the turbine production, beyond instrumental icing, still need to be assessed in the calculation of the warranty. This means that in this simplified proposal, the warranted period () is defined as the union of instrumental icing periods and turbine underproduction periods due to icing, excluding meteorological icing periods. In the vast majority of the cases, turbine underproduction will be included inside the instrumental icing periods. Figure 1 provides a graphical representation of the warranted period in the form of a Venn diagram, shown by the dark shaded area, relative to the instrumental icing (purple), turbine underproduction (yellow), and meteorological icing (blue) periods.
The proposed compensation should be based on the Warranted Icing Compensable Energy (WICE). This metric, defined in Equation 1, represents the positive difference, over the warranted period, between the warranted energy production and the measured energy production (). The warranted energy production is defined as the product of the warranted energy efficiency () and the expected energy production () based on the wind speed and power curve over the same period. The turbine underproduction is defined using the IEA Task 19 Ice Loss Method with a low-sensitivity threshold (P5) and a temperature threshold of 5∘C [10]. The warranted period should comprise all icing events of the winter. Hence, the WICE metric is defined to remain positive over a full winter justifying the maximum operator in Equation 1. This equation can be rearranged in a more detailed way into Equation 2 where t is the timestamp, is the expected power and is the produced power at the given timestamp.
For each of the five case studies shown in Figure 2, Figure 3, Figure 4, Figure 5 and Figure 6, the event is illustrated using two subplots. The upper subplot presents turbine performance. The red shaded area represents the expected power, estimated from the wind speed and from a turbine-specific power curve derived from SCADA data using a procedure similar to the IceLossMethod proposed by IEA Wind TCP Task 19 [10]. The green shaded area superposed on the red area represents the measured turbine production, also refered as the active power. Diagonal hatching in the red area indicates periods during which the turbine was stopped because of faults. The orange background indicates periods when the IPS was active. The blue-to-purple band shows meteorological icing detected by the IC-1 ice sensor [2]. This band is transparent when no meteorological icing is present and is colored from light blue at an icing intensity of 0.01 g/m2s to purple at an icing intensity of 2 g/m2s. To preserve the anonymity of our industrial partners, all results were normalized to an equivalent 5 MW turbine.
The lower subplot presents the same event in terms of icing-state selection. Meteorological icing is shown as a light blue band and instrumental icing as a pink band, both derived from the IC-1 ice sensor. Turbine underproduction is presented as a yellow band while the black band represents the proposed warranted period for the particular case study.
A summary of the case studies is provided in Table 1, including the turbine type associated with each event, the dominant ice type observed, and the maximum ice thickness recorded during the event.
3. Results
The proposed methodology was applied to five case studies representing four wind farms, four turbine manufacturers, and four blade heating technologies. Figure 2 to Figure 6 show that, in all cases, the warranted period defined in the methodology is shorter than the full instrumental icing period because intervals with meteorological icing are excluded from the evaluation. As intended, the resulting warranted period mainly captures the persistence and ablation phases, where IPS performance can be assessed without including the meteorological risk associated with ongoing accretion.
The quantitative impact of this filtering is shown in Table 2 and Table 3. The numbers in these tables have been scaled to a 5 MW turbine to preserve data anonymity. When the proposed warranted period is used, the measured energy efficiency is 93%, 12%, 83%, 37%, and 48% for case studies 1 to 5, respectively. Over the full instrumental icing period, the corresponding values are 81%, 17%, 63%, 31%, and 44%. Thus, the proposed methodology increases the measured efficiency in four of the five case studies and, more importantly, changes the interpretation of several events in terms of warranty compliance. Another important observation is that in all cases the WICE is reduced with the usage of the proposed warranted period as opposed to the full instrumental icing and underproduction period.
Case study 1 represents a high-performing IPS event. Over the proposed warranted period, the turbine produced 177 MWh against an expected 190 MWh, corresponding to an efficiency of 93%. Under this definition, the event satisfies both the 80% and 90% warranty levels, yielding a WICE of 0 MWh. In contrast, when the full instrumental icing period is used, the measured efficiency decreases to 81%, and a compensation of 36 MWh appears at the 90% warranty level. This case shows that including the full instrumental icing period can penalize a system that performs adequately during the part of the event that is most relevant to IPS operation.
Case study 2 represents a clear underperformance case. The measured efficiency is only 12% during the proposed warranted period, with WICE values of 174 MWh and 199 MWh for warranty levels of 80% and 90%, respectively. The event also performs poorly when evaluated over the full instrumental icing period. This indicates that the proposed methodology does not mask severe underperformance and still identifies events in which the IPS fails to maintain an acceptable level of production. At the end of the seventh day of the event, the turbine does not attempt to restart when the instrumental icing period ends and instead remains stopped until the end of its de-icing cycle. Consequently, the end of the warranted period is determined by the underproduction period rather than by instrumental icing. Among the five presented case studies, this is the only event in which the underproduction period affects the definition of the warranted period. This highlights the importance of considering turbine underperformance in the definition of the warranted period.
Case study 3 is an intermediate case. Over the proposed warranted period, the turbine reaches 83% efficiency, which is sufficient to satisfy an 80% warranty and yields only 6 MWh of compensation at a 90% warranty level. Over the full instrumental icing period, however, the efficiency falls to 63%, leading to compensable energy of 31 MWh at 80% and 50 MWh at 90%. This case highlights that the warranty outcome can change drastically depending on whether meteorological icing periods are included in the calculation.
Case study 4 also remains underperforming after filtering, but the magnitude of the shortfall is reduced. Under the proposed warranted period, the measured efficiency is 37%, with WICE values of 163 MWh and 200 MWh for warranty levels of 80% and 90%. Over the full instrumental icing period, the efficiency decreases further to 31%, and the corresponding compensable energy rises to 305 MWh and 366 MWh. This case suggests that a significant share of the production deficit occurred during intervals that should reasonably be attributed to meteorological exposure rather than to the recoverable performance of the IPS.
Case study 5 provides another example of a moderately underperforming IPS event. Over the proposed warranted period, the turbine produced 108 MWh against an expected 225 MWh, corresponding to a measured efficiency of 48%. This results yields a WICE of 73 MWh for a warranty level of 80% and 95 MWh for a warranty level of 90%. When the full instrumental icing period is used instead, the produced and expected energies increase to 138 MWh and 313 MWh, respectively, but the measured efficiency decreases to 44%. Under this broader event definition, the compensable energy rises to 113 MWh at 80% and 144 MWh at 90%. As in case studies 1, 3, and 4, excluding periods with meteorological icing reduces the apparent shortfall and yields a warranty outcome that is more representative of IPS performance during the persistence and ablation phases. However, unlike case studies 1 and 3, the event remains clearly below both warranty thresholds even after filtering, indicating that the methodology reduces meteorological bias without masking genuine underperformance.
Overall, the proposed methodology systematically reduces the compensable energy relative to a calculation based on the full instrumental icing period, while still preserving sensitivity to genuinely poor IPS performance. For the 90% warranty level, WICE is reduced from 36 to 0 MWh in case study 1, from 50 to 6 MWh in case study 3, from 366 to 200 MWh in case study 4, and from 144 to 95 MWh in case study 5. For the 80% warranty level, the proposed methodology eliminates compensation entirely in case studies 1 and 3 and substantially reduces it in case study 4 and 5. These results show that the definition of the warranted period is a first-order driver of the warranty outcome.
4. Discussion
The main result of this study is that the outcome of an IPS performance warranty is highly sensitive to how icing events are defined. A direct use of the full instrumental icing period mixes together the accretion, persistence, and ablation phases of icing and therefore tends to combine meteorological risk with technological risk. In practice, this leads to warranty metrics that may over-penalize the IPS for periods during which ongoing meteorological icing makes efficient operation intrinsically difficult. By excluding periods with meteorological icing, the proposed methodology provides a simplified separation between meteorological risk and technological risk, which is consistent with the intent of the IEA Wind Task 19 warranty framework.
Case studies 1 and 3 illustrate this point particularly clearly. In both cases, the IPS performs adequately once the evaluation is restricted to the warranted period, but appears much less effective when the full instrumental icing period is used. This indicates that a substantial fraction of the apparent losses occurred during intervals associated with active meteorological icing rather than during the persistence or ablation phases that better reflect the system’s ability to recover production. From a contractual perspective, this distinction is essential because it determines whether the OEM is being evaluated on controllable technology performance or on site-specific icing severity.
Case study 2 shows the complementary strength of the method. Even after excluding meteorological icing, the event remains strongly underperforming. The proposed filtering therefore does not artificially improve all outcomes, nor does it conceal events in which the IPS fails to deliver meaningful production retention. This is an important property for a warranty methodology, since it must remain capable of identifying true technological underperformance while avoiding compensation claims driven mainly by weather severity.
Case study 4 represents an intermediate situation in which underperformance persists after filtering, but the compensable energy is materially reduced. This suggests that the methodology is able to distinguish between events in which the IPS is fundamentally ineffective and events in which the observed production loss is partly driven by meteorological conditions outside the simplified operational envelope. In this sense, the proposed methodology does not remove the performance signal, but rather refines it.
Case study 5 presented a combination of both behaviors, with underperformance persisting for more than one day after the end of meteorological icing during the first event, while the losses observed during the second event were largely confined to the meteorological icing period. This case therefore illustrates how the proposed methodology can distinguish between residual technological underperformance during the persistence and ablation phases and losses that are primarily attributable to active meteorological icing.
A second important result is that warranty level strongly affects the interpretation of borderline events. The difference between an 80% and a 90% warranted efficiency is small in relative terms, but it can lead to qualitatively different outcomes. For example, case study 3 passes at 80% and is associated with only 6 MWh of compensation at 90%. This shows that higher warranty thresholds are more sensitive to the exact event definition and may lead to compensation claims even when the IPS performs reasonably well in operational terms. The choice of warranty threshold should therefore be aligned with the maturity of the technology, the severity of the icing climate, and the intended allocation of risk between operator and OEM.
From a practical standpoint, the proposed methodology offers a useful compromise between rigor and implementability. It can be applied in a self-comparison framework using only SCADA data and external icing measurements, without the need for sacrificial reference turbines or dedicated side-by-side campaigns. This makes it considerably easier to deploy at operating wind farms, where production losses associated with side-by-side testing are often commercially unacceptable. At the same time, the proposed WICE metric provides an intuitive basis for compensation, because it expresses the shortfall directly in energy terms over the warranted period.
Excluding periods of meteorological icing would allow IPS manufacturers to warrant higher efficiency levels, since performance during these periods is largely controlled by atmospheric conditions rather than by the technology itself. The warranted value would therefore be more representative of IPS quality. Operators could also benefit from this approach, as a higher warranted efficiency may compensate for the shorter evaluation period in cases where the IPS is not performing efficiently.
The methodology also has important limitations. First, the event definition remains dependent on instrumental icing and meteorological icing measured by an external sensor, which are only proxies for the unheated rotor-icing period. Instrumental icing provides a conservative upper bound, but it does not reproduce the exact timing or severity of rotor icing on the turbine blades. Second, the operational envelope was simplified here by excluding all periods with meteorological icing, rather than explicitly accounting for wind speed, temperature, and LWC thresholds. This simplification is practical, but it does not yet exploit the full structure of the operational-envelope concept proposed in recent literature [24]. Third, the present study is based on five case studies only, which is sufficient to demonstrate the methodology but not to establish universal quantitative thresholds across all IPS technologies and icing climates.
These limitations also point to the next steps for future work. A natural extension would be to incorporate a more explicit operational envelope filter based on meteorological variables, rather than using a binary exclusion of all meteorological icing periods. Another important next step would be to compare the proposed self-comparison methodology against results obtained from side-by-side assessments at the same sites, in order to quantify the residual bias introduced by using instrumental icing as a proxy for the unheated reference condition. Additional case studies covering a broader range of icing climates, control strategies, and IPS technologies would also help determine how robust the proposed WICE formulation is across the wider cold-climate wind sector.
Another important limitation concerns the assessment of instrumental icing, which can be measured in several ways. A common approach is double anemometry, in which two anemometers are installed and only one is heated. Instrumental icing is then inferred from the deviation between the two wind speed measurements. However, this method has limited sensitivity and cannot reliably detect icing at low wind speeds [20]. Instrumental icing can be assessed with different methods such as camera images or other sensors.
Other aspects must also be clarified in these warranties, particularly the definition of faults that are excluded from the warranted period. For example, icing can generate additional vibrations on the blades and tower, which may trigger an automatic turbine shutdown. Since the cause of the vibration-related stoppages is not always icing, such events should not be excluded systematically from the warranted period. In situations such as the one discussed above, the icing vibration stoppages periods should be included when the shutdown is attributable to icing. It is therefore essential to define precisely which turbine status codes and fault codes are excluded from the warranted period. Additionally, although the proposed methodology does not explicitly assess IPS availability, poor IPS availability will still be reflected indirectly in the performance metric presented in this paper.
Overall, the results support the use of a filtered self-comparison approach for practical IPS warranty assessment. The proposed methodology improves the separation between meteorological exposure and technological performance, reduces the risk of over-penalizing the IPS during active accretion, and remains sensitive to genuine underperformance. It therefore provides a realistic basis for transparent and operationally applicable warranty frameworks in situations where side-by-side comparison is not feasible.
5. Conclusions
This paper proposed a practical methodology for assessing wind turbine blade heating performance warranties using a self-comparison approach. The method was developed to address one of the main challenges identified in existing warranty frameworks, namely the need to separate meteorological risk, which is to be borne by the operator, from technological risk, which is to be borne by the OEM or IPS supplier. To do so, the methodology combines a turbine-level energy-efficiency metric with an event-selection procedure based on instrumental icing, while excluding periods of meteorological icing from the warranty calculation. The resulting compensation metric, the Warranted Icing Compensable Energy (WICE), provides a direct and operationally meaningful measure of underperformance.
The methodology was applied to five case studies representing four wind farms, four turbine manufacturers, and four blade heating technologies. The results showed that the definition of the warranted period has a strong influence on the warranty outcome. In four of the five case studies, the proposed filtering increased the measured energy efficiency relative to an evaluation based on the full instrumental icing period and substantially reduced the compensable energy. In the remaining case, severe underperformance was still clearly identified. These results indicate that the proposed methodology does not hide poor IPS performance, but rather avoids penalizing the system for periods dominated by active meteorological icing, during which efficient operation may not be realistically achievable.
The case studies also showed that self-comparison can provide a robust basis for IPS warranty assessment when side-by-side testing is not feasible. Although side-by-side comparison remains the more direct method for quantifying recovered energy, its implementation is often impractical because it requires sacrificial reference turbines and associated production losses. By contrast, the proposed self-comparison framework relies only on SCADA data, turbine status signals, and external icing measurements, making it much easier to apply at operating wind farms. This makes it particularly attractive for commercial warranty assessments, where practical implementation is key.
At the same time, the study highlights several limitations. Instrumental icing remains only a proxy for the icing behavior of an equivalent unheated rotor, and the simplified treatment of the operational envelope, based on exclusion of meteorological icing periods, does not yet fully account for the combined effects of temperature, wind speed, and LWC. In addition, the methodology has been demonstrated here on five case studies, which is sufficient to illustrate its applicability but not to establish universal thresholds across all turbine platforms and icing climates.
Overall, the proposed methodology provides a transparent and operationally realistic framework for IPS performance warranties. It improves the separation between meteorological exposure and technological performance, preserves sensitivity to genuine underperformance, and expresses the warranty outcome in directly compensable energy terms. As such, it offers a practical pathway toward more consistent and mutually acceptable blade heating warranty frameworks for both operators and manufacturers. Future work should focus on extending the methodology to a larger number of case studies and on incorporating more explicit operational-envelope criteria based on meteorological variables.
Author Contributions
Conceptualization, P.R, P.G. and A.B.D.; methodology, P.R, P.G. and A.B.D.; software, P.R.; validation, P.R and P.G,; formal analysis, P.R..; investigation, P.R.; data curation, P.R.; writing—original draft preparation, P.R.; writing—review and editing, P.R, P.G. and A.B.D.; visualization, P.R.; supervision, A.B.D.; project administration, A.B.D. All authors have read and agreed to the published version of the manuscript.
Funding
This research was funded by the Natural Sciences and Engineering Research Council of Canada (NSERC) (RGPIN-2025-04282).
Acknowledgments
The authors would like to acknowledge the openness and active participation of their industrial partners for giving us the opportunity to use their data in this research. During the preparation of this manuscript/study, the authors used ChatGPT 5.1 for the purposes of text refining. The authors have reviewed and edited the output and take full responsibility for the content of this publication.”
Conflicts of Interest
All three authors are employees of Instrumentation Icetek, which manufactures the IC-1 sensor used in this study.
Abbreviations
The following abbreviations are used in this manuscript:
| OEM | Original Equipment Manufacturer |
| IPS | Ice protection system |
| IPT | Ice protection technology |
| LWC | Liquid water content |
| WICE | Warranted Icing Compensable Energy |
References
- Baxter, D.; Roeper, D. Triggering ice protection systems with weather forecasts. Winterwind 2025, Skellefteå, Sweden, 3-5 February 2025. [Google Scholar]
- Bégin-Drolet, A.; Ruel, J.; Lemay, J. Washington, DC: U.S. Patent and Trademark Office. U.S. Patent No. 9,846,261, 2017. [Google Scholar]
- Bégin-Drolet, A.; Guay, P.; Roberge, P. Global insights on wind turbine icing, operational envelopes and ice protection system efficiency across diverse climates. Winterwind 2025, Skellefteå, Sweden, 3-5 February 2025. [Google Scholar]
- Boesch, G.; Daqoune, T.; Barup, S.; Schödler, J. Assessment of ENERCON blade heating performance in various conditions. Winterwind 2021, Online, 19-21 April 2021. [Google Scholar]
- Dai, J.; Zhang, Y.; Rotea, M.; Kehtarnavaz, N. A review of machine learning approaches for prediction of icing on wind turbines. In 2024 IEEE 19th Conference on Industrial Electronics and Applications (ICIEA); IEEE, August 2024; pp. 1–7. [Google Scholar]
- Davis, N. N.; Pinson, P.; Hahmann, A. N.; Clausen, N. E.; Žagar, M. Identifying and characterizing the impact of turbine icing on wind farm power generation. Wind Energy 2016, 19(8), 1503–1518. [Google Scholar]
- Grenholm, S. Availability of ice mitigation systems: A key driver for performance and revenue. Winterwind 2025, Skellefteå, Sweden, 3-5 February 2025. [Google Scholar]
- Godreau, C.; Wickman, H.; Karlsson, T.; Soderberg, S. Performance Warranty Guidelines for Wind Turbines in Icing Climates. IEA Wind TCP Task 19 Technical Report, Sep 2020. [Google Scholar]
- Godreau, C.; Tete, K. Ice Protection Systems and Retrofits: Performance and Experiences. Winterwind 2020, Åre, Sweden, 3-5 February 2020. [Google Scholar]
- IEA Wind TCP Task 19 T19IceLossMethod: Method for estimating icing losses from wind turbine SCADA data (Version 1.0) [Computer software]. GitHub. GitHub, 2019. Available online: https://github.com/IEAWind-Task19/T19IceLossMethod.
- Isolähteenmäki, P. Assessing benefits of icing loss forecast in wind power forecasting. 2025. [Google Scholar] [CrossRef]
- Jeppsson, C.; Lehming, N.; Egedal, P.; Daugbjerg Nielsen, B. Panel discussion with manufacturers: Offering production warranties in cold climates, is it even possible? Winterwind 2018. Winterwind 2018, Åre, Sweden, 5-7 February 2018. [Google Scholar]
- Karlsson, T. Performance benchmark analysis of four ice prevention systems. Winterwind 2019, Umeå, Sweden, 4-6 February 2019; 2019. [Google Scholar]
- Karlsson, T. IEA Wind TCP Task 54 Cold Climate Wind Market study 2025. Winterwind 2026, Sundvall, Sweden, 2-4 February 2026; 2026. [Google Scholar]
- Kelly, A.; Baxter, D. Operational envelopes for the design, sourcing, and operation of IPS. Winterwind 2026, Sundsvall, Sweden, 2-4 February 2026; 2026. [Google Scholar]
- Lehming, N. Field validation Nordex Delta4000 anti-icing system. Winterwind 2026, Sundsvall, Sweden, 2-4 February 2026; 2026. [Google Scholar]
- Lehtomäki, V.; Karlsson, T.; Rissanen, S. Wind Turbine Ice Protection system Benchmark Analysis. In VTT Technical Research Centre of Finland VTT Technology No. 341; 2018; Available online: https://publications.vtt.fi/pdf/technology/2018/T341.pdf.
- Levati, D. Siemens blade de-icing. IWAIS 2015, Uppsala, Sweden, 28 June-3 July 2015; 2015. [Google Scholar]
- Makkonen, L. Models for the growth of rime, glaze, icicles and wet snow on structures. Philosophical Transactions of the Royal Society of London. Series A: Mathematical, Physical and Engineering Sciences 2000, 358(1776), 2913–2939. [Google Scholar] [CrossRef]
- Parent, O.; Ilinca, A. Anti-icing and de-icing techniques for wind turbines: Critical review. Cold Reg. Sci. Technol. 2011, 65(1), 88–96. [Google Scholar] [CrossRef]
- Rittinghaus, C.; Godreau, C.; Roberge, P.; Bégin-Drolet, A.; Roeper, D.; Gerber, F.; Froidevaux, P.; Kim, T.; Rehfeld, N.; Wallenius, T.; Pettersson, J. Performance envelopes of blade heating systems: A subtask of IEA Wind TCP Task 54 cold climate wind power. Winterwind 2024, Åre, Sweden, 18-20 March 2024; 2024. [Google Scholar]
- Roberge, P.; Lemay, J.; Ruel, J.; Bégin-Drolet, A. Field analysis, modeling and characterization of wind turbine hot air ice protection systems. Cold Reg. Sci. Technol. 2019, 163, 19–26. [Google Scholar] [CrossRef]
- Roberge, P.; Lemay, J.; Ruel, J.; Bégin-Drolet, A. Towards standards in the analysis of wind turbines operating in cold climate – Part A: Power curve modeling and rotor icing detection. Cold Reg. Sci. Technol. 2022, 196, 103436. [Google Scholar] [CrossRef]
- Roberge, P.; Lemay, J.; Ruel, J.; Bégin-Drolet, A. The effect of icing severity on wind turbine ice protection systems efficiency. Cold Reg. Sci. Technol. 2023, 207, 103774. [Google Scholar] [CrossRef]
- Roberge, P.; Baxter, D.; Ruel, J.; Roeper, D.; Lemay, J.; Bégin-Drolet, A. Towards standards in the analysis of wind turbines operating in cold climate. Part B: Methodology for evaluating wind turbine alternative operational strategies. Cold Reg. Sci. Technol. 2022, 196, 103494. [Google Scholar] [CrossRef]
- Roberge, P.; Lemay, J.; Ruel, J.; Bégin-Drolet, A. In situ estimation of effective liquid water content on a wind turbine using a thermal based sensor. Cold Reg. Sci. Technol. Vol. 184 2021, 2021, 103235. [Google Scholar] [CrossRef]
- Sachse, K. Advanced Anti-Icing System for N149 wind turbines. Winterwind 2020, Åre, Sweden, 3-5 February 2020; 2020. [Google Scholar]
- Sachse, K. Nordex advanced anti-icing system for N163 turbines. Winterwind 2022, Skellefteå, Sweden, 19-21 April 2022; 2022. [Google Scholar]
- Sjökvist, E. Improvement of Wind Power Forecasting and Prediction of Production Losses Caused by Ice Formation on Wind Turbine Blades:-A Machine Learning Approach. 2023. [Google Scholar]
- Vestas. To maximise wind energy production in cold climates, Vestas introduces new anti-icing system and ice assessment tool. Vestas 2018. [Google Scholar]
- Wallenius, T.; Heinonen, M. On the importance of control for the performance of ice protection systems and wind turbines. Winterwind 2024, Åre, Sweden, 18-20 March 2024; 2024. [Google Scholar]
- Wallenius, T.; Roeper, D. Blade heating system performance envelope field validation: Practical experiences. Winterwind 2025, Skellefteå, Sweden, 3-5 February 2025; 2025. [Google Scholar]
- Wickman, H.; Godreau, C.; Karlsson, T.; Söderberg, S. Task 19: Performance warranty guidelines for wind turbines in icing climates workshop at Winterwind 2020. Winterwind 2020, Åre, Sweden, 3-5 February 2020; 2020. [Google Scholar]
- Wickman, H.; Godreau, C.; Karlsson, T.; Söderberg, S. Summary of IEA Wind Task 19 report update. Winterwind 2021, Online, 19-21 April 2021; 2021. [Google Scholar]
Figure 1.
Venn diagram defining the warranted period.
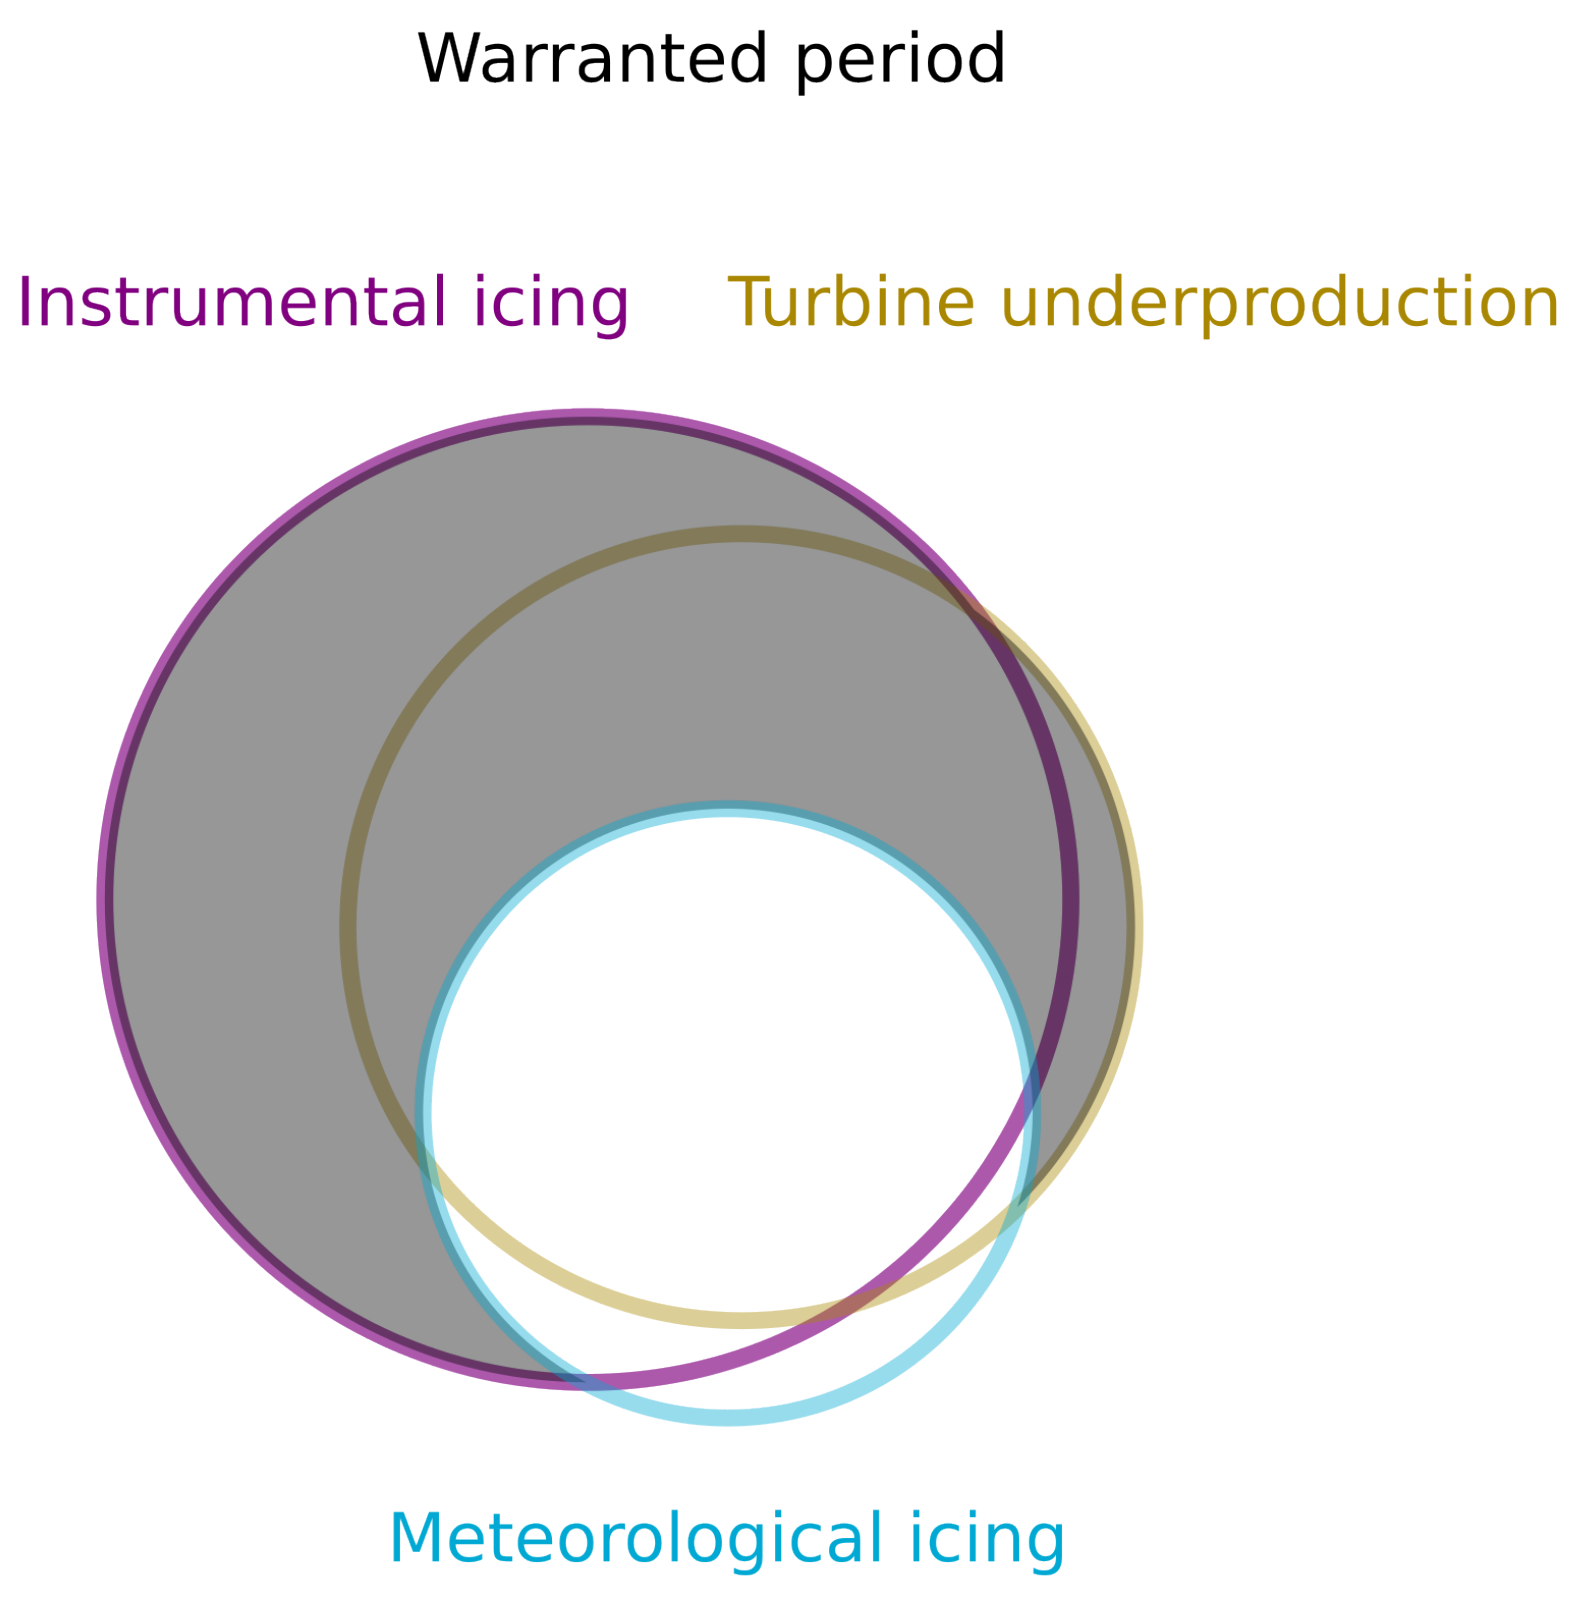
Figure 2.
First case study used to evaluate the proposed IPS warranty methodology. The upper panel shows the turbine performance while the lower panel compares instrumental icing, meteorological icing, turbine underproduction, and the final warranted period used for assessment.
Figure 2.
First case study used to evaluate the proposed IPS warranty methodology. The upper panel shows the turbine performance while the lower panel compares instrumental icing, meteorological icing, turbine underproduction, and the final warranted period used for assessment.
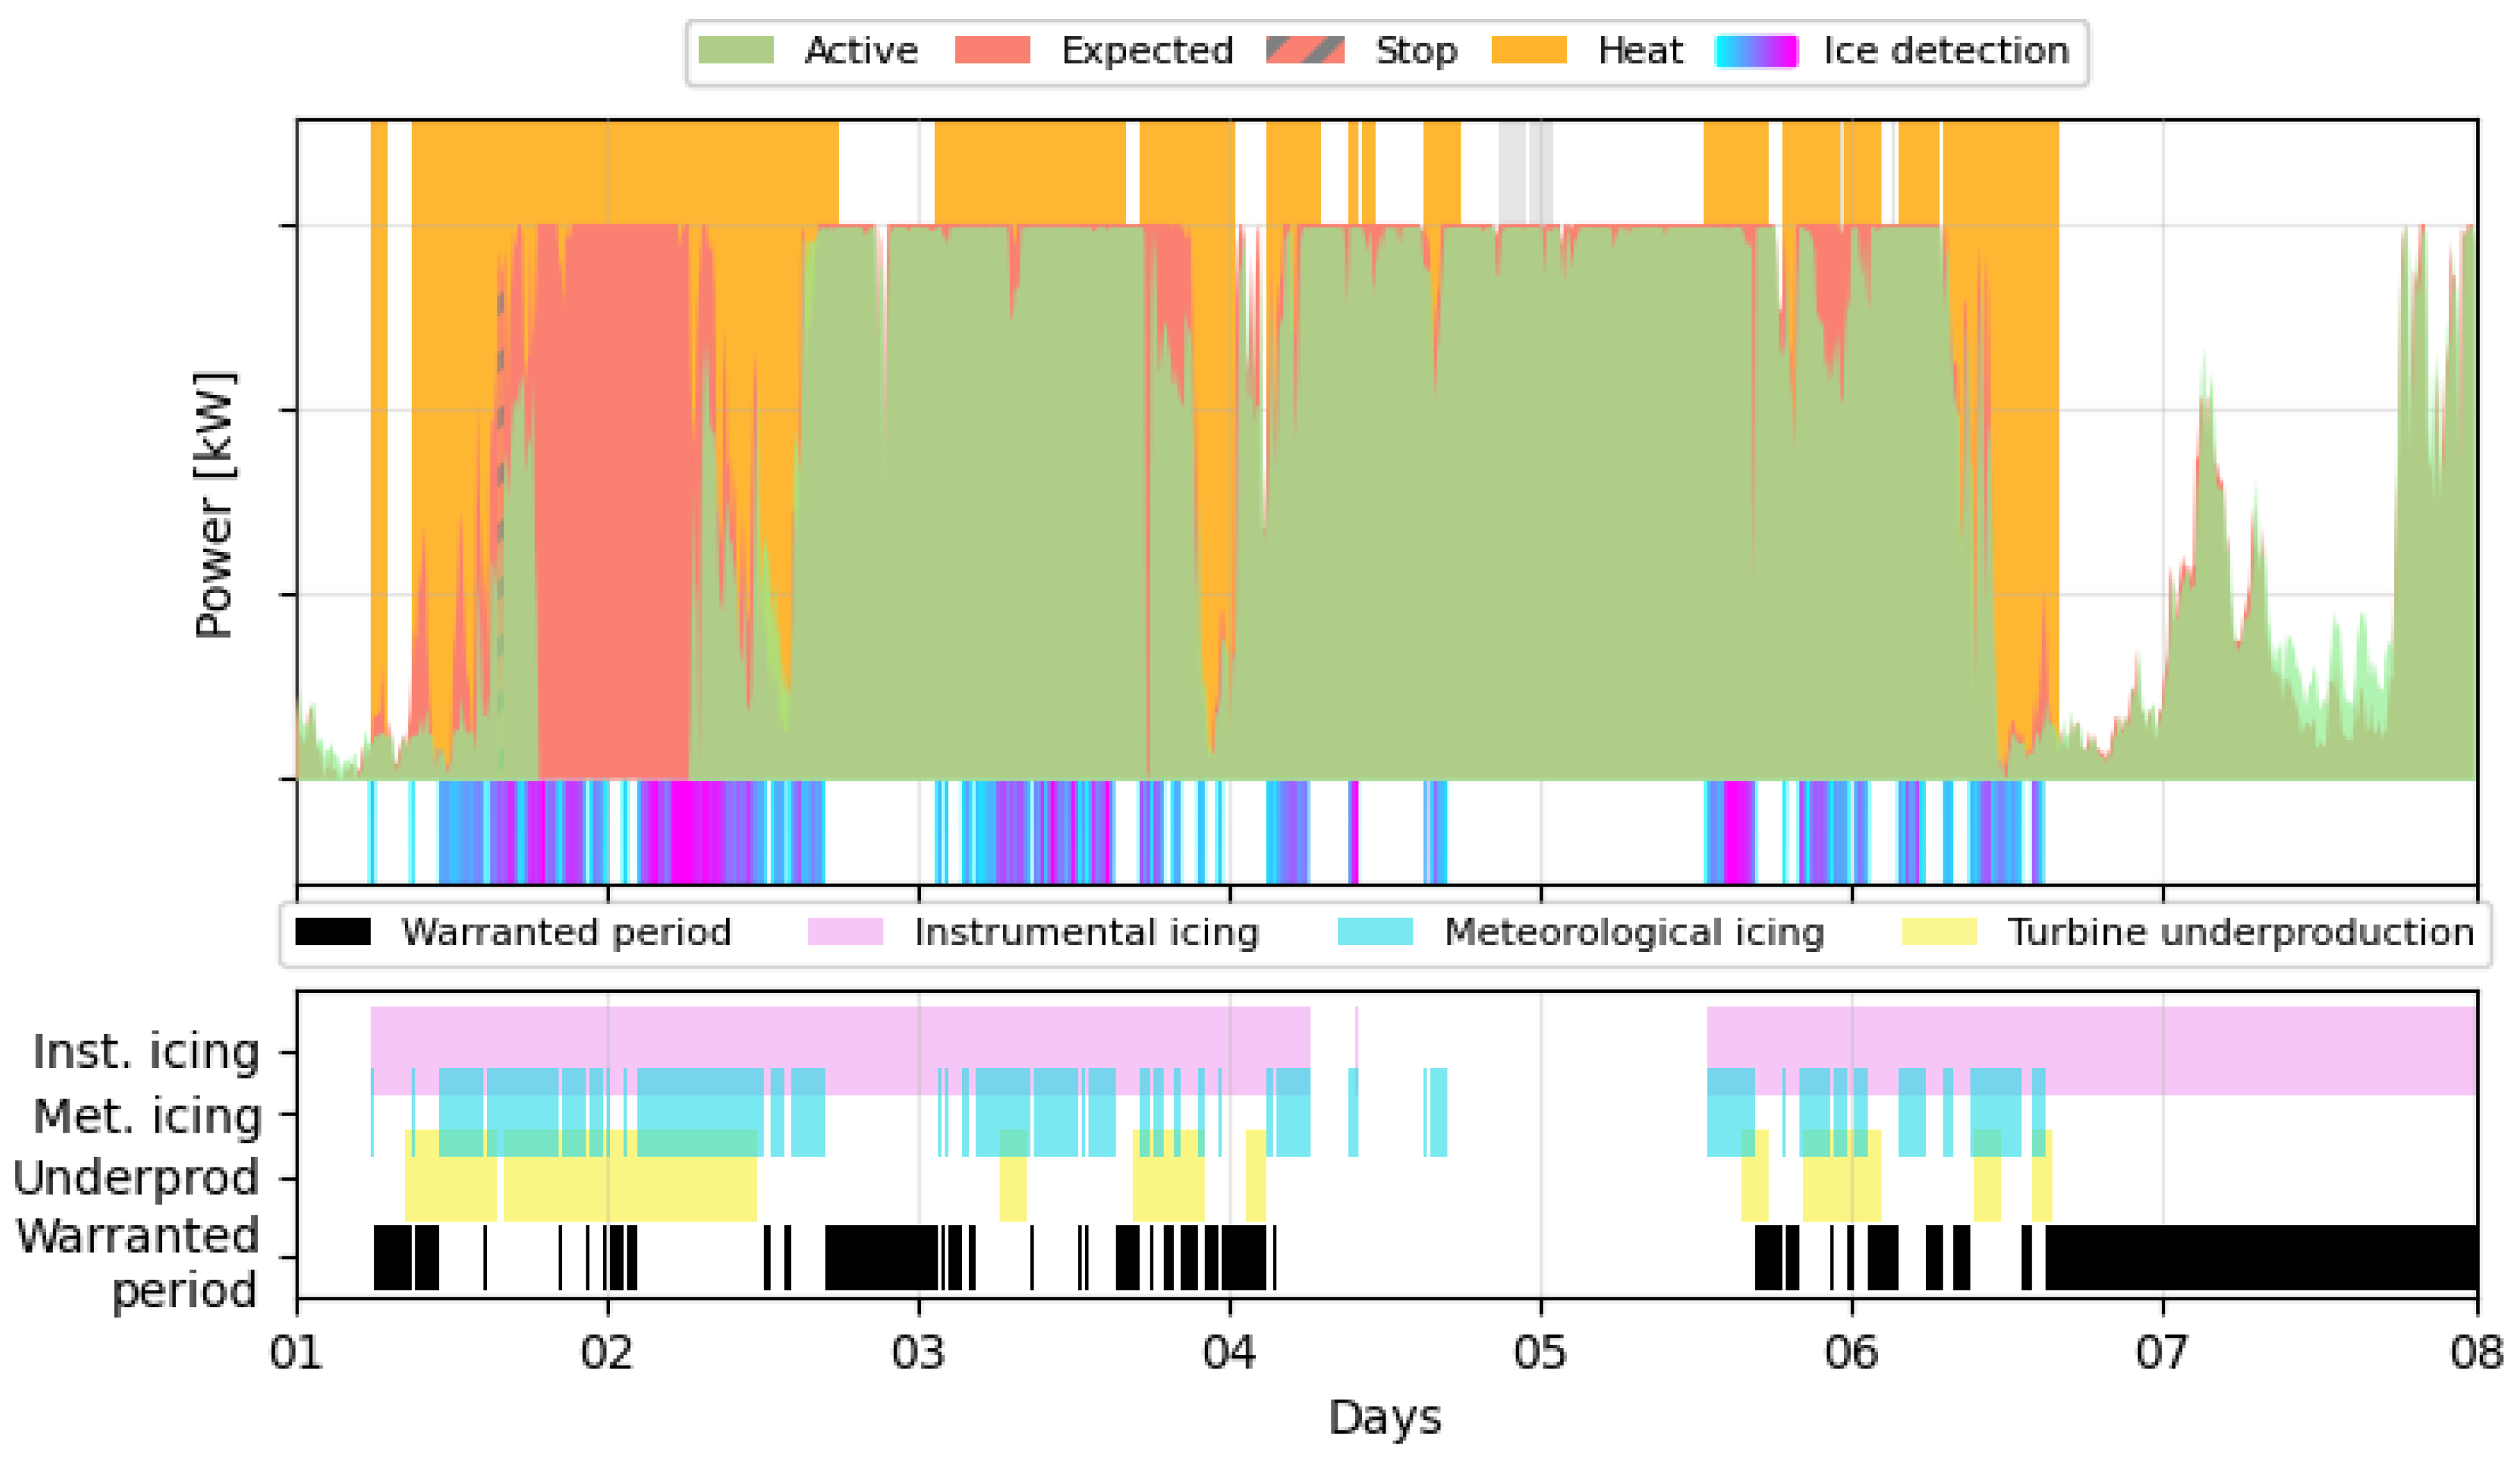
Figure 3.
Second case study used to evaluate the proposed IPS warranty methodology. The upper panel shows the turbine performance while the lower panel compares instrumental icing, meteorological icing, turbine underproduction, and the final warranted period used for assessment.
Figure 3.
Second case study used to evaluate the proposed IPS warranty methodology. The upper panel shows the turbine performance while the lower panel compares instrumental icing, meteorological icing, turbine underproduction, and the final warranted period used for assessment.
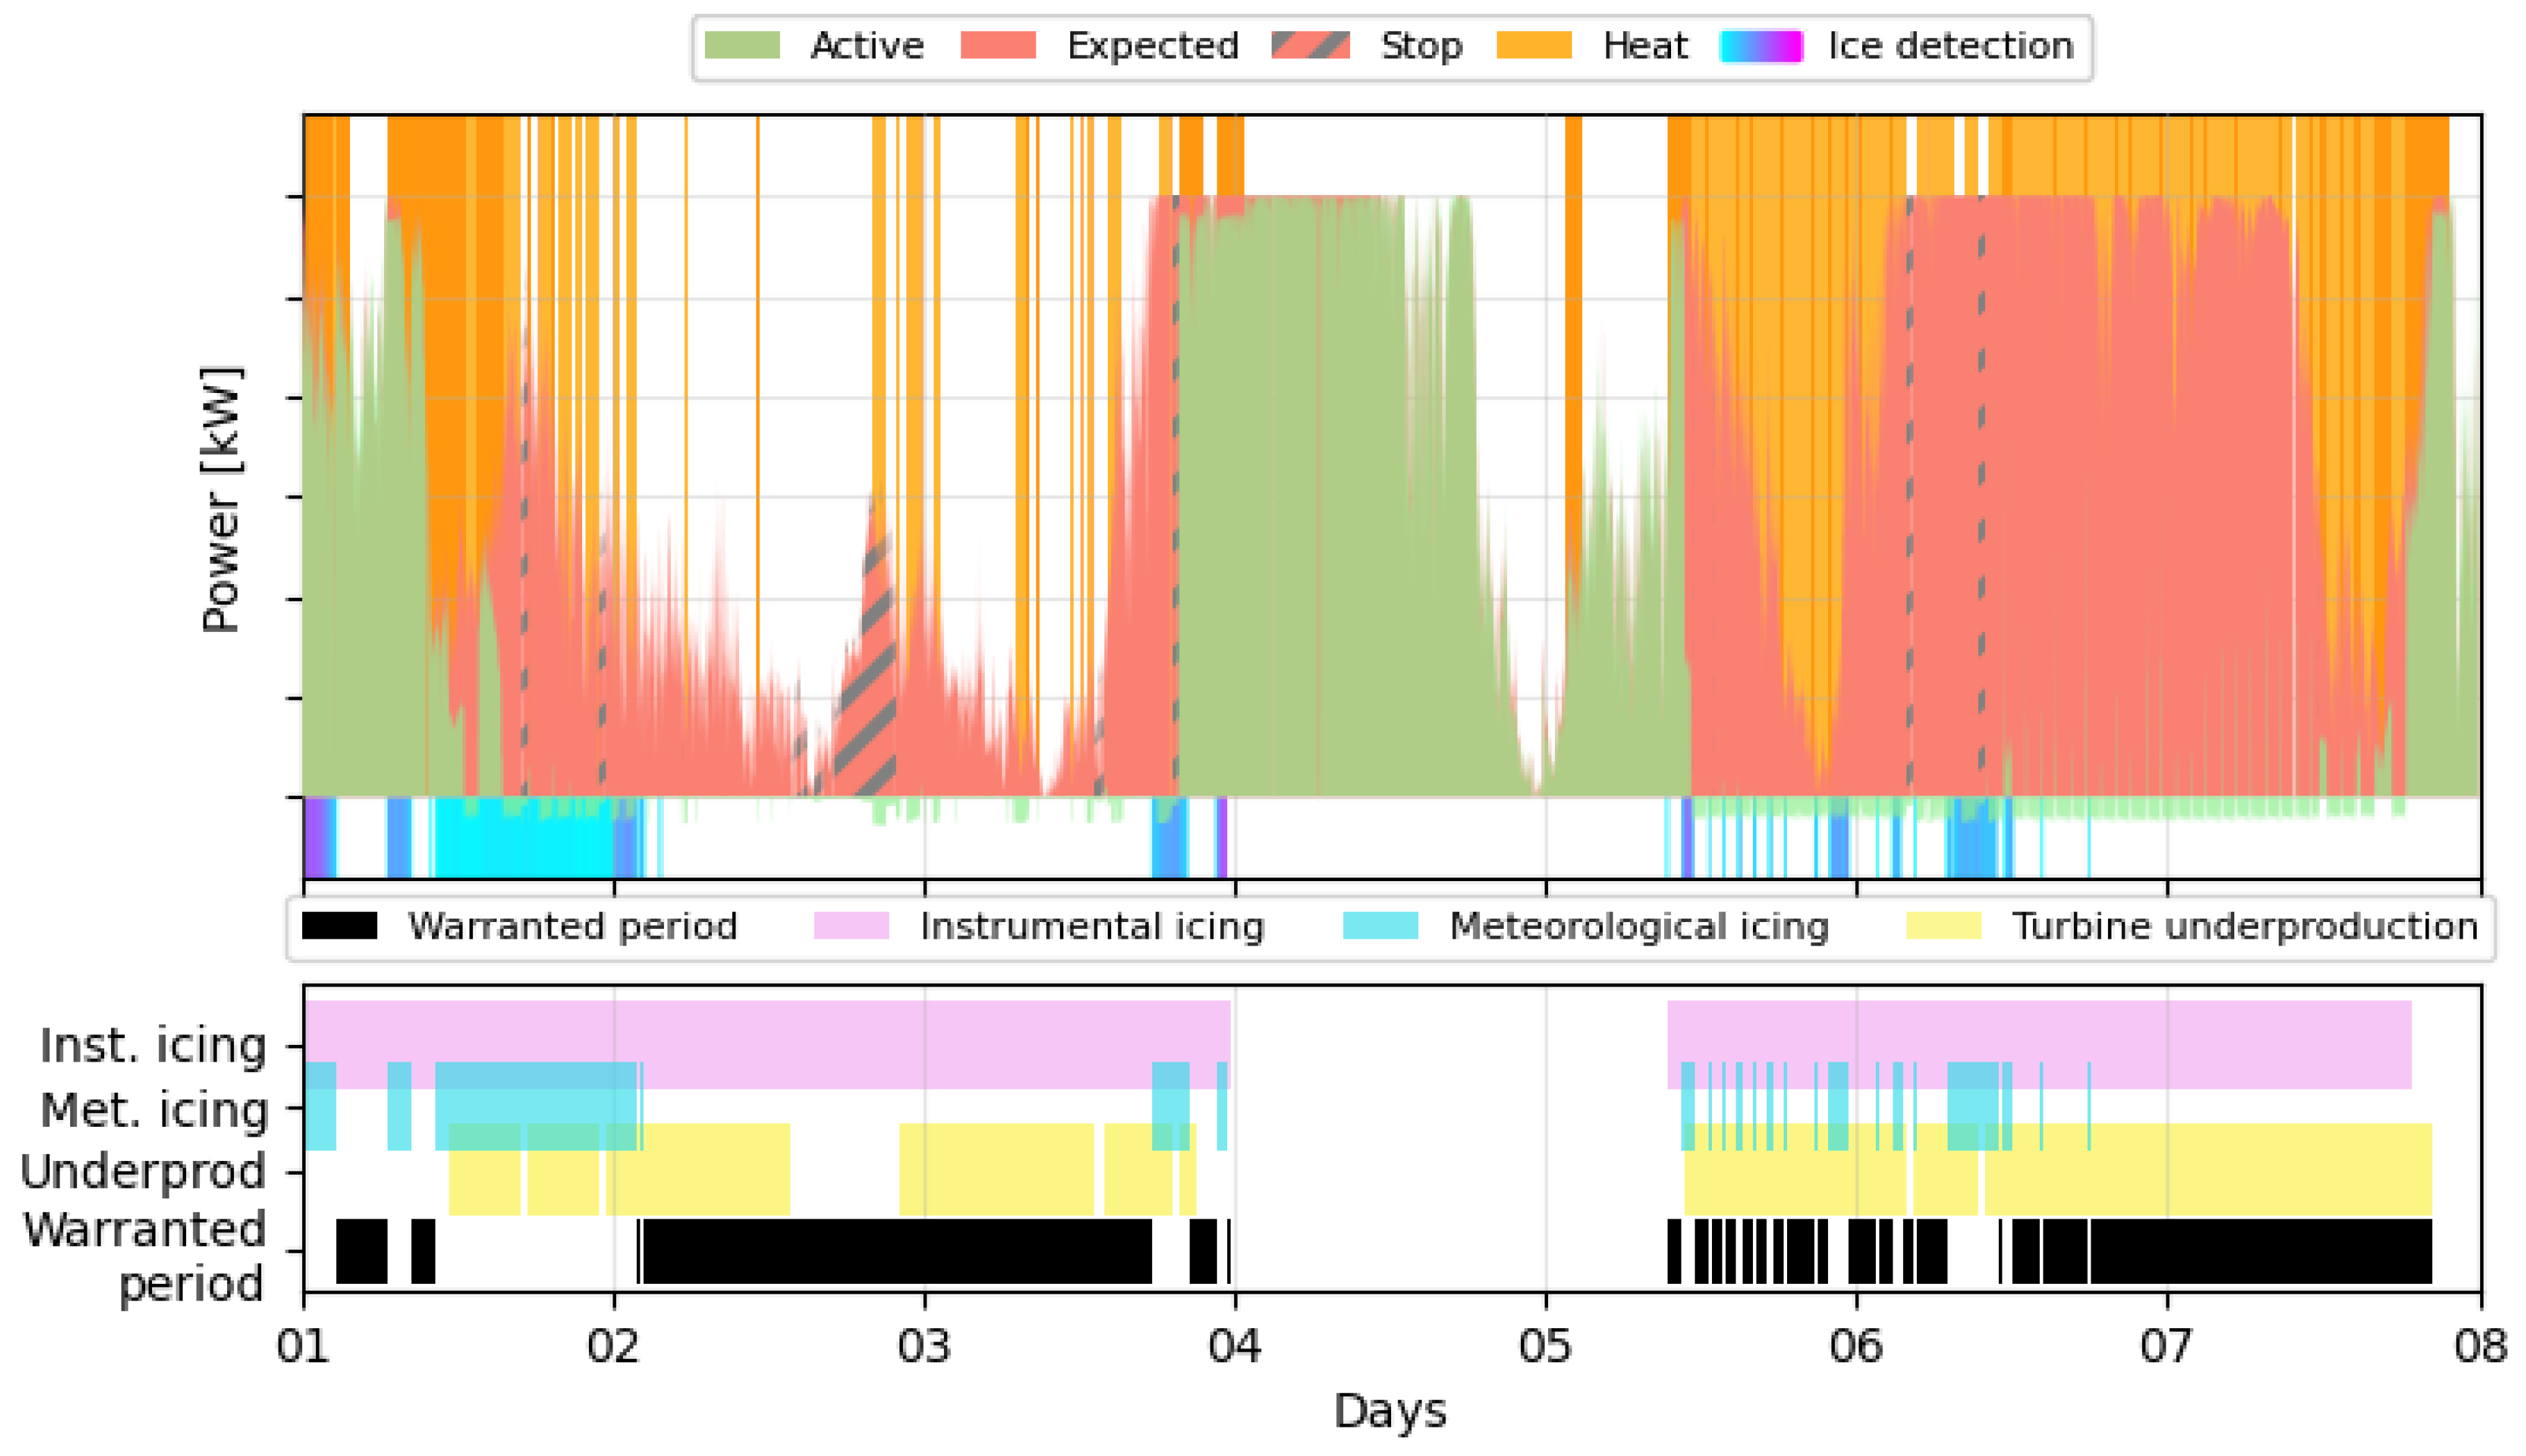
Figure 4.
Third case study used to evaluate the proposed IPS warranty methodology. The upper panel shows the turbine performance while the lower panel compares instrumental icing, meteorological icing, turbine underproduction, and the final warranted period used for assessment.
Figure 4.
Third case study used to evaluate the proposed IPS warranty methodology. The upper panel shows the turbine performance while the lower panel compares instrumental icing, meteorological icing, turbine underproduction, and the final warranted period used for assessment.
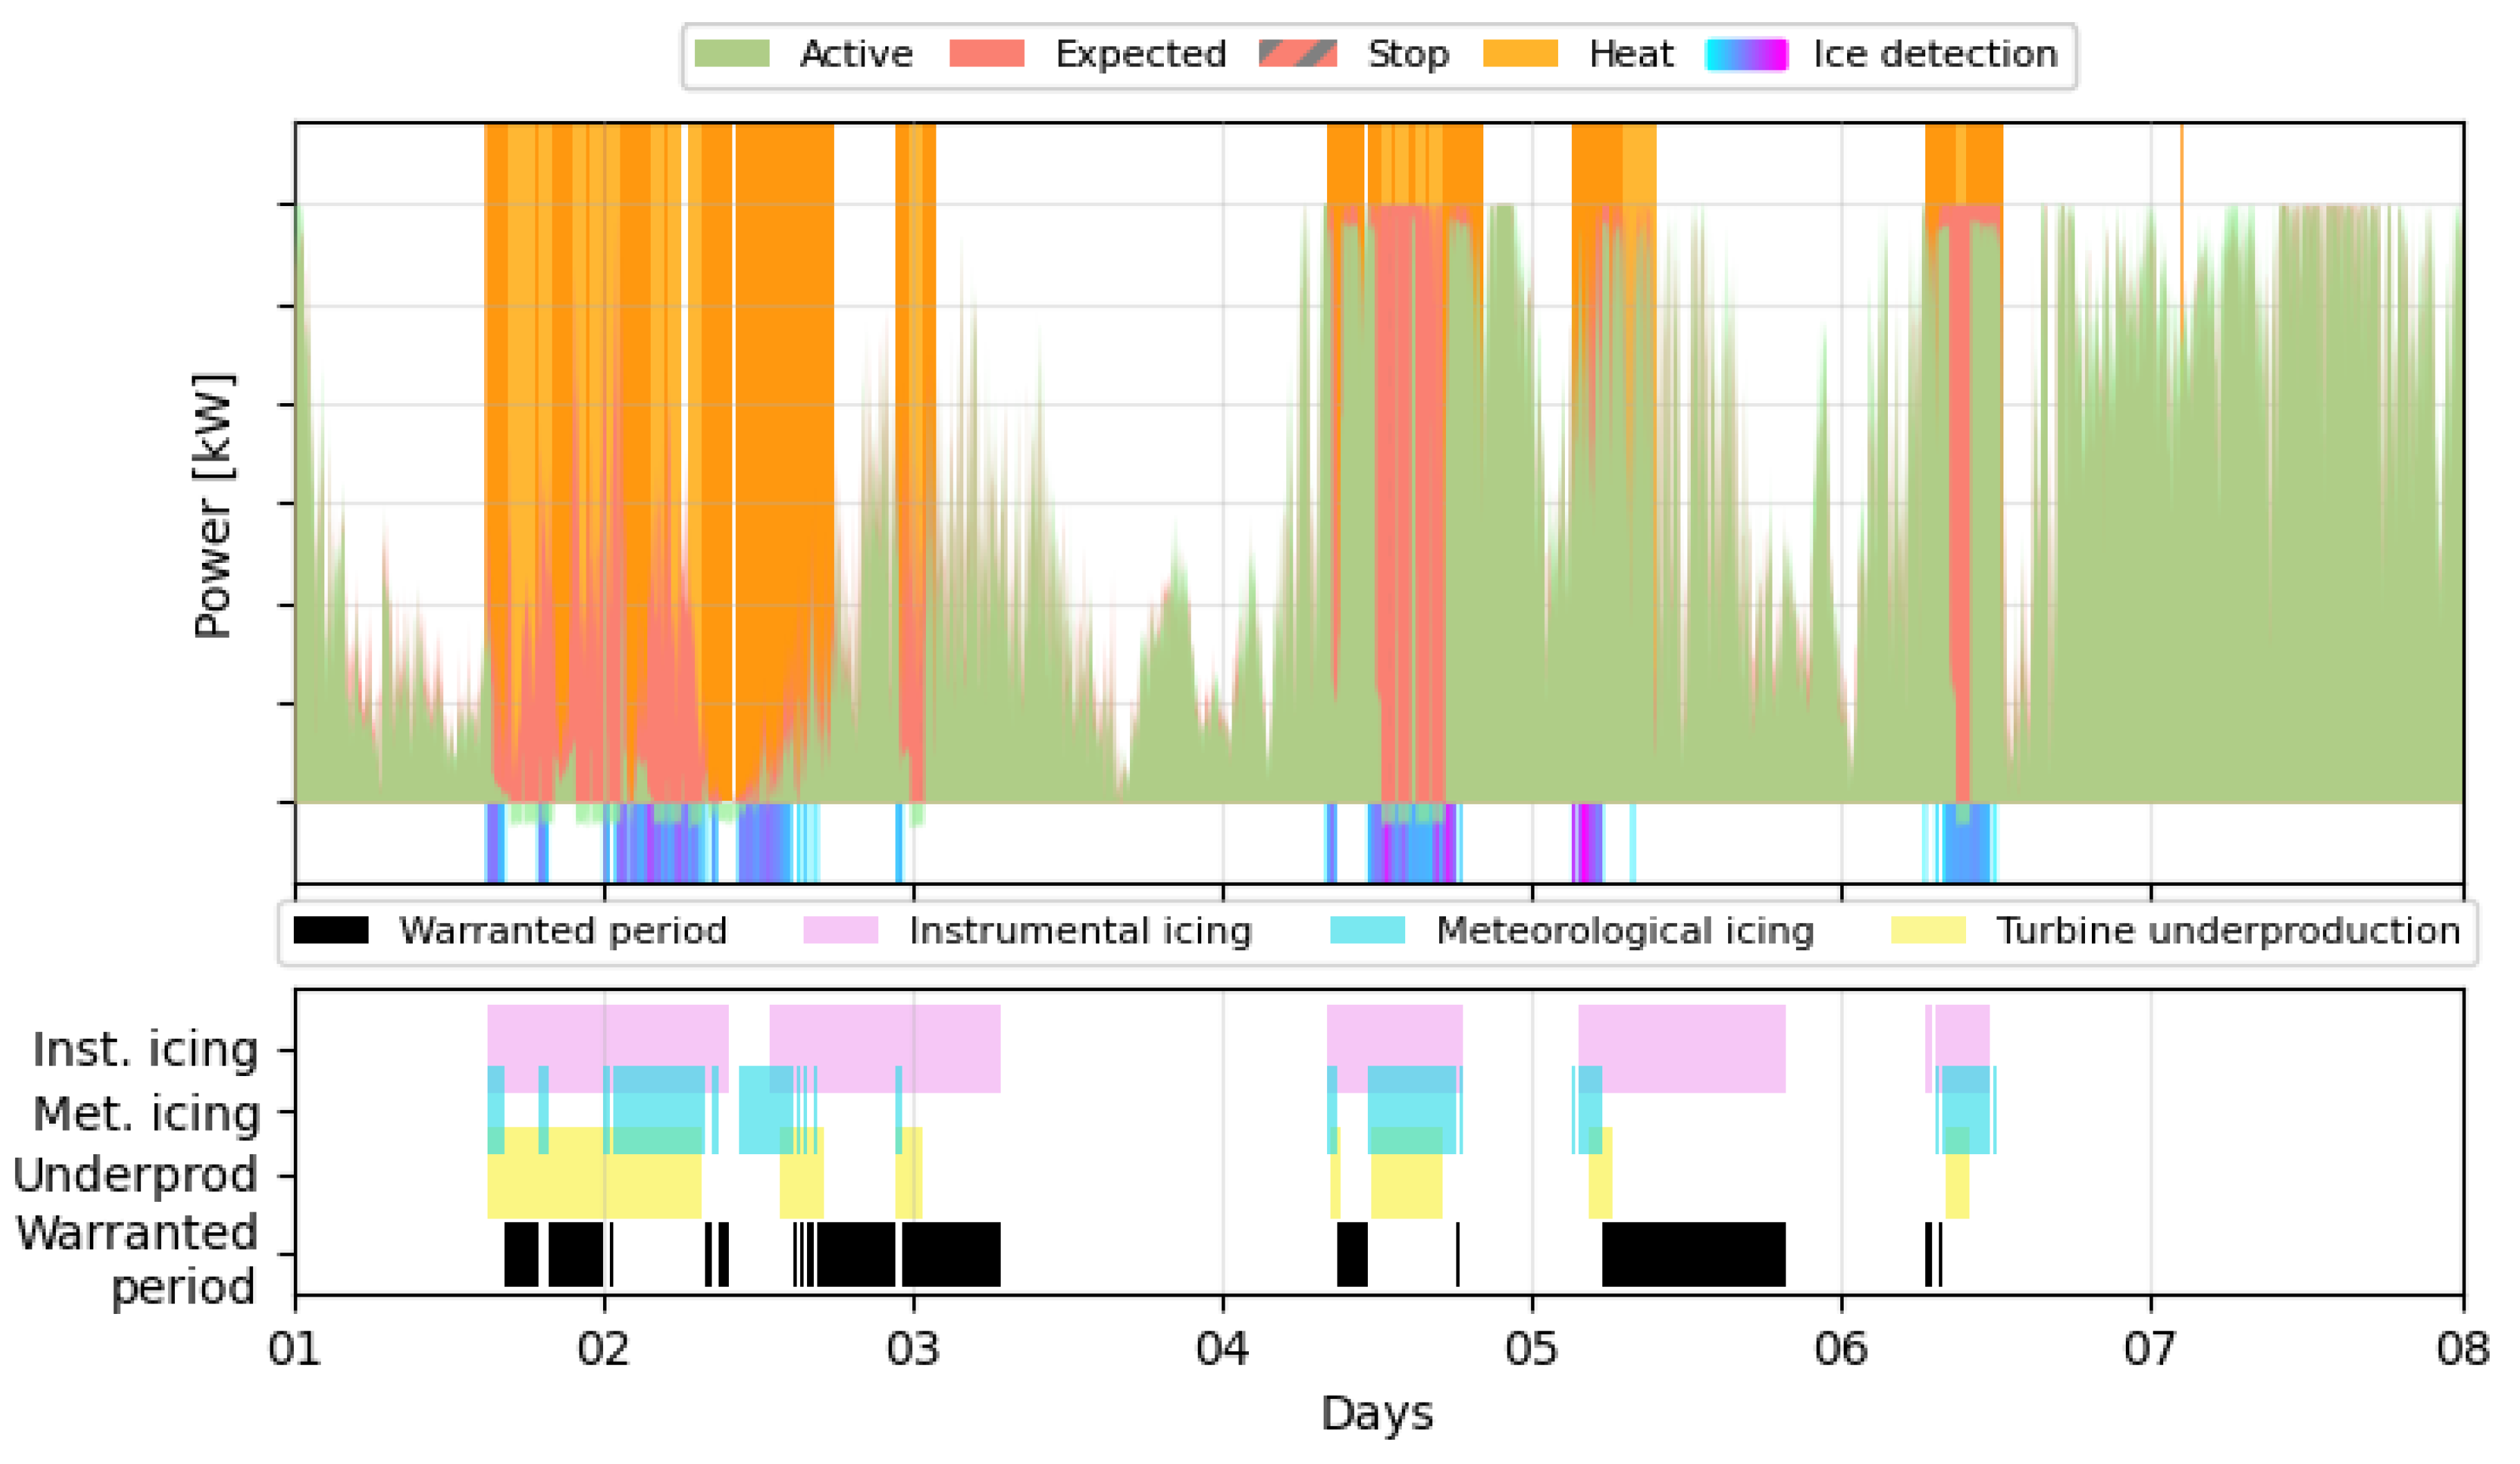
Figure 5.
Fourth case study used to evaluate the proposed IPS warranty methodology. The upper panel shows the turbine performance while the lower panel compares instrumental icing, meteorological icing, turbine underproduction, and the final warranted period used for assessment.
Figure 5.
Fourth case study used to evaluate the proposed IPS warranty methodology. The upper panel shows the turbine performance while the lower panel compares instrumental icing, meteorological icing, turbine underproduction, and the final warranted period used for assessment.
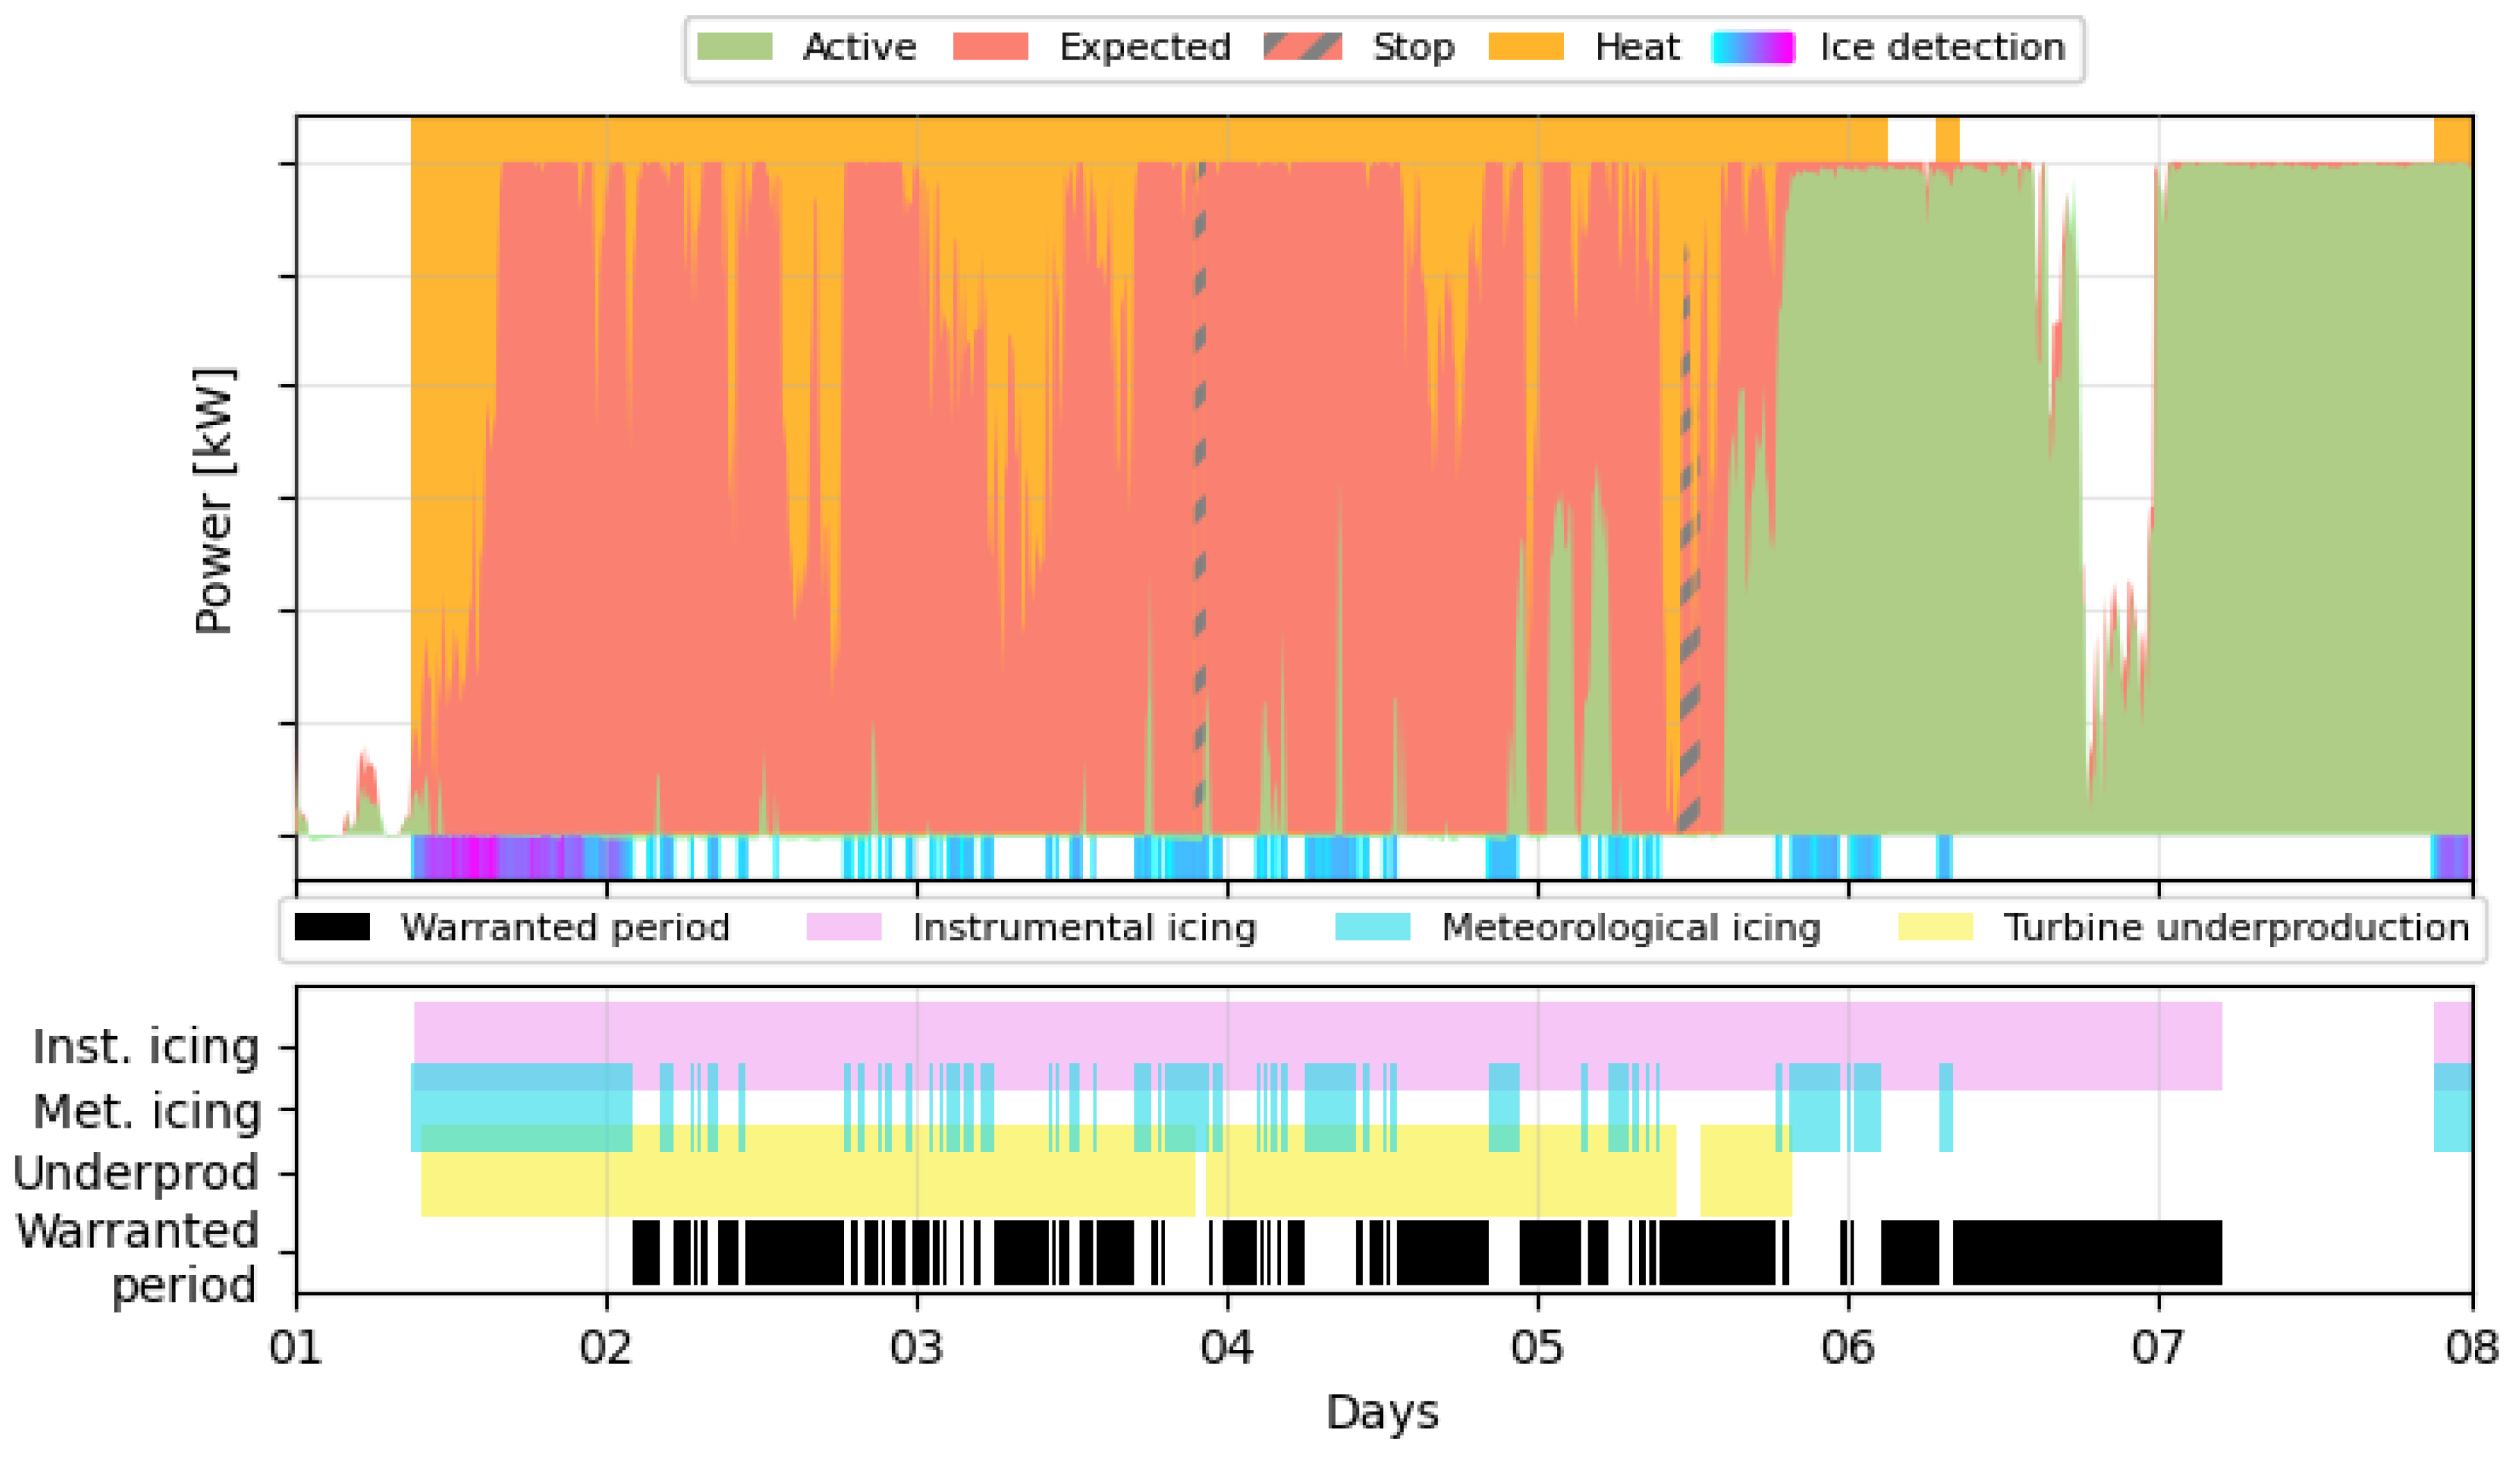
Figure 6.
Fifth case study used to evaluate the proposed IPS warranty methodology. The upper panel shows the turbine performance while the lower panel compares instrumental icing, meteorological icing, turbine underproduction, and the final warranted period used for assessment.
Figure 6.
Fifth case study used to evaluate the proposed IPS warranty methodology. The upper panel shows the turbine performance while the lower panel compares instrumental icing, meteorological icing, turbine underproduction, and the final warranted period used for assessment.
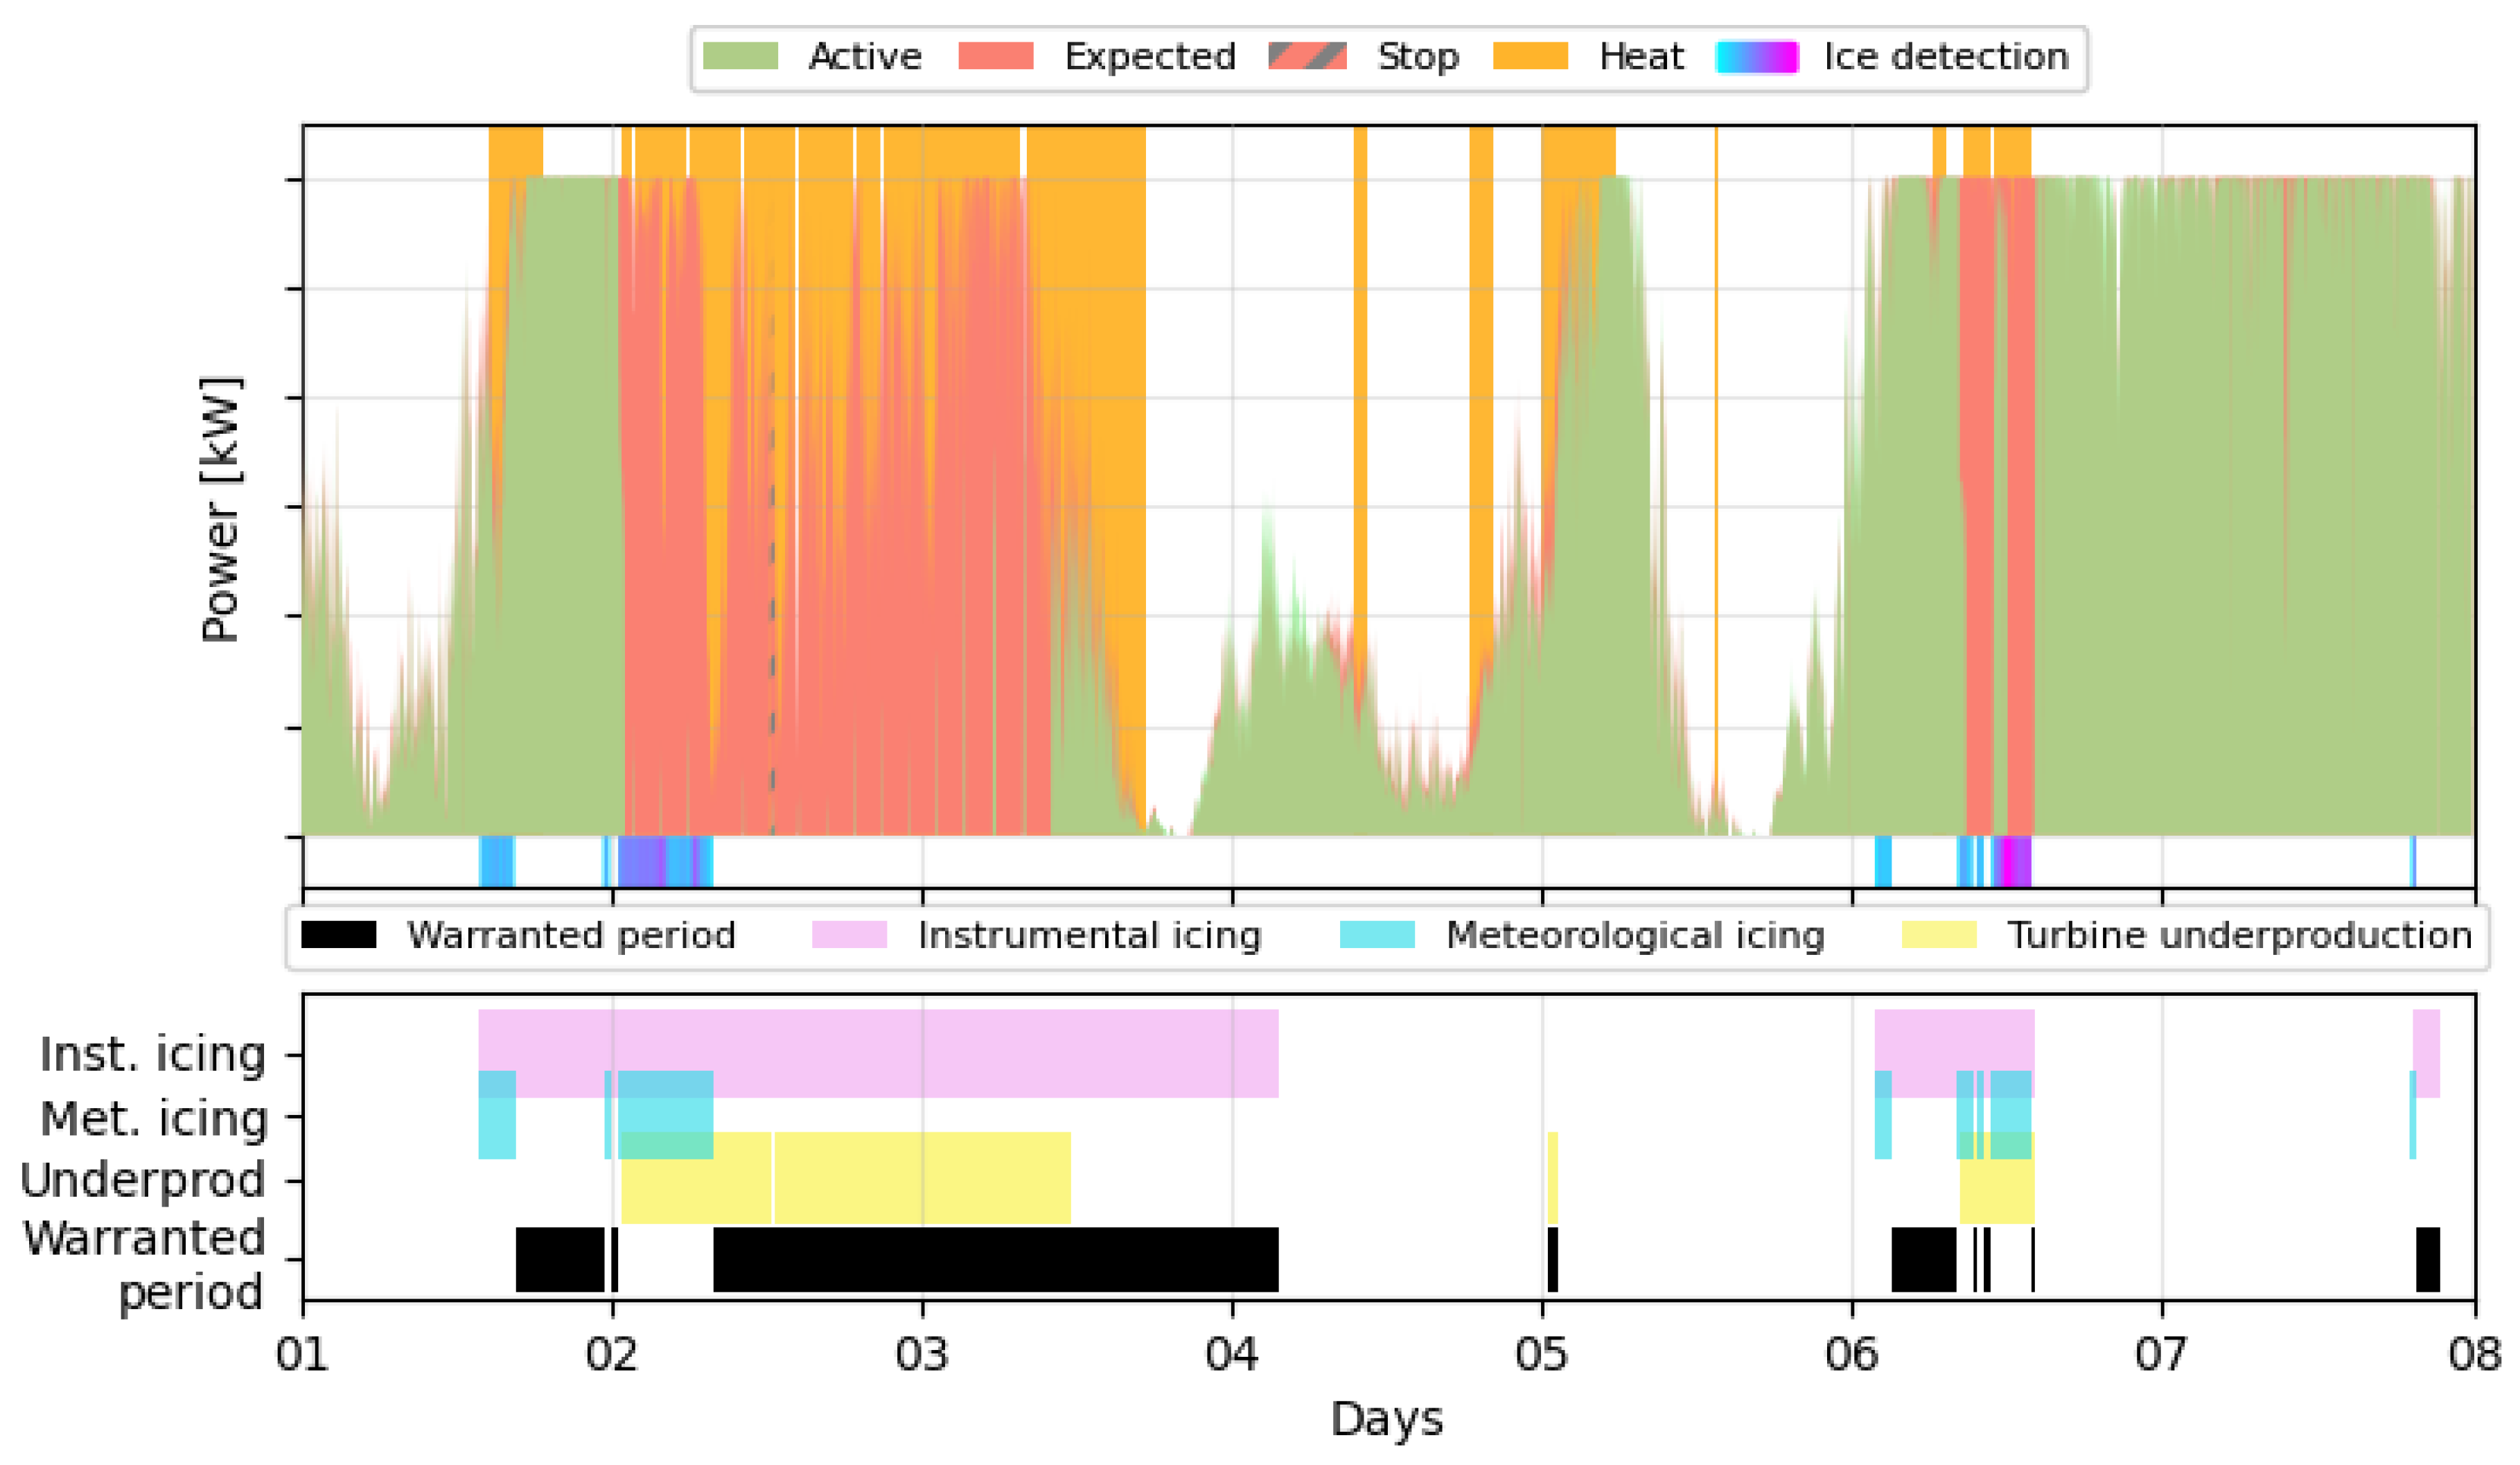

Table 1.
Summary of the five case studies used to evaluate the proposed IPS warranty methodology, including turbine type, dominant ice type, and maximum observed ice thickness. HR denotes hard rime, SR denotes soft rime, and GZ denotes glaze.
Table 1.
Summary of the five case studies used to evaluate the proposed IPS warranty methodology, including turbine type, dominant ice type, and maximum observed ice thickness. HR denotes hard rime, SR denotes soft rime, and GZ denotes glaze.
| Case study | Turbine type | Ice type | Max ice thickness [t] |
|---|---|---|---|
| [mm] [b] | |||
| 1 | A | HR | 110 |
| 2 | B | GZ/HR | 55 |
| 3 | B | GZ | 35 |
| 4 | C | SR | 80 |
| 5 | D | SR/HR | 40 |
Table 2.
Energy production, expected energy, measured efficiency, and WICE computed over the proposed warranted period. The values have been scaled to a 5 MW turbine to preserve data anonymity.
Table 2.
Energy production, expected energy, measured efficiency, and WICE computed over the proposed warranted period. The values have been scaled to a 5 MW turbine to preserve data anonymity.
| Case study | Produced | Expected | WICE [t] | ||
|---|---|---|---|---|---|
| = 80% | = 90% | ||||
| [MWh] | [MWh] | [%] | [MWh] | [MWh] [b] | |
| 1 | 177 | 190 | 93 | 0 | 0 |
| 2 | 31 | 256 | 12 | 174 | 199 |
| 3 | 83 | 99 | 83 | 0 | 6 |
| 4 | 135 | 373 | 37 | 163 | 200 |
| 5 | 108 | 225 | 48 | 73 | 95 |
Table 3.
Energy production, expected energy, measured efficiency, and WICE computed over the full instrumental icing and underproduction periods. The values have been scaled to a 5 MW turbine to preserve data anonymity.
Table 3.
Energy production, expected energy, measured efficiency, and WICE computed over the full instrumental icing and underproduction periods. The values have been scaled to a 5 MW turbine to preserve data anonymity.
| Case study | Produced | Expected | WICE [t] | ||
|---|---|---|---|---|---|
| = 80% | = 90% | ||||
| [MWh] | [MWh] | [%] | [MWh] | [MWh] [b] | |
| 1 | 337 | 414 | 81 | 0 | 36 |
| 2 | 63 | 371 | 17 | 235 | 272 |
| 3 | 118 | 186 | 63 | 31 | 50 |
| 4 | 190 | 618 | 31 | 305 | 366 |
| 5 | 138 | 313 | 44 | 113 | 144 |
Disclaimer/Publisher’s Note: The statements, opinions and data contained in all publications are solely those of the individual author(s) and contributor(s) and not of MDPI and/or the editor(s). MDPI and/or the editor(s) disclaim responsibility for any injury to people or property resulting from any ideas, methods, instructions or products referred to in the content. |
© 2026 by the authors. Licensee MDPI, Basel, Switzerland. This article is an open access article distributed under the terms and conditions of the Creative Commons Attribution (CC BY) license (http://creativecommons.org/licenses/by/4.0/).
Copyright: This open access article is published under a Creative Commons CC BY 4.0 license, which permit the free download, distribution, and reuse, provided that the author and preprint are cited in any reuse.