

Submitted:
20 July 2026
Posted:
21 July 2026
You are already at the latest version
Abstract
Transmission spectroscopy with the James Webb Space Telescope (JWST) has opened a new regime for the atmospheric characterization of temperate sub-Neptunes and Hycean candidates. However, atmospheric inferences remain sensitive to the methodological assumptions adopted in retrieval frameworks. We perform a multi-framework retrieval analysis of the transmission spectrum of K2-18 b, combining synthetic noise simulations consistent with NIRISS and NIRSpec observations from program GO-2722 with atmospheric retrievals using TauREx 3, petitRADTRANS, and PSG-OEM. We quantify how differences in opacity databases, aerosol parameterizations, and statistical inference methods propagate into retrieved atmospheric properties. All frameworks favor a hydrogen-dominated atmosphere with robust signatures of methane and carbon dioxide, while additional species such as water vapor, ammonia, and hydrogen cyanide remain weakly constrained. We find systematic framework-dependent differences of 0.3–0.7 dex in retrieved molecular abundances, demonstrating that the current JWST transmission spectrum of K2-18 b lies in a regime where retrieval degeneracies remain significant. In particular, we show that the reported evidence for dimethyl sulfide (DMS) is not robust under reasonable variations in retrieval methodology. These results highlight the importance of multi-model retrieval validation for reliable atmospheric interpretation of JWST spectra.
Keywords:
JWST
; transmission spectroscopy
; K2-18 b
; atmospheric retrieval
; TauREx 3
; petitRADTRANS
; PSG-OEM
; model dependence
; molecular abundances
; DMS
1. Introduction
Transmission spectroscopy with the James Webb Space Telescope (JWST) has initiated a new era in the atmospheric characterization of transiting exoplanets. The unprecedented spectral precision of JWST enables the detection of molecular absorption features in temperate sub-Neptunes and potentially habitable planets with amplitudes of only a few hundred parts per million.
Among the most intriguing targets is K2-18 b, a temperate sub-Neptune exoplanet orbiting the M dwarf K2-18 at a distance of approximately 38 pc [1]. With a radius of and a mass near , K2-18 b lies in the regime of volatile-rich sub-Neptunes. Its equilibrium temperature of K places the planet within the habitable zone of its host star.
Recent JWST observations combining the Near Infrared Imager and Slitless Spectrograph (NIRISS) and the Near Infrared Spectrograph (NIRSpec) have revealed transmission spectra consistent with a hydrogen-rich atmosphere containing methane and carbon dioxide. These observations have also motivated the hypothesis that K2-18 b may belong to the class of “Hycean” planets proposed by Madhusudhan et al. [2], i.e., ocean-bearing worlds with H2-dominated atmospheres.
Despite these advances, the interpretation of transmission spectra remains fundamentally limited by degeneracies inherent to atmospheric retrieval. Different forward models, opacity databases, cloud parameterizations, and statistical inference methods can produce significantly different posterior distributions even when applied to the same observational dataset.
In this work, we perform a systematic multi-framework retrieval analysis of the JWST transmission spectrum of K2-18 b. Using three independent retrieval frameworks—TauREx 3, petitRADTRANS, and PSG-OEM—we quantify how differences in radiative-transfer implementations, opacity databases, and inference formalisms affect the retrieved atmospheric properties.
Our goal is not to propose a new atmospheric composition for K2-18 b, but rather to assess the robustness of molecular detections and to quantify the level of model dependence in current JWST retrieval analyses.
2. Materials and Methods
2.1. JWST Observations and Data Processing
The observational data analyzed in this work were obtained as part of the JWST GO-2722 program (PI: N. Madhusudhan; [2]), whose primary objective was to acquire high-precision transmission spectroscopy of K2-18 b during a full transit using both NIRSpec/G395H and NIRISS/SOSS. The NIRSpec observations were conducted in Bright Object Time Series (BOTS) mode with the G395H grating and F290LP filter, providing wavelength coverage from 2.9 to 5.2 m at a resolving power of . Complementary NIRISS/SOSS observations were obtained in order 1 using the CLEAR/GR700XD configuration, covering 0.9–2.8 m at a resolving power of .
Level 3 calibrated data products were retrieved from the Mikulski Archive for Space Telescopes (MAST; [3]), including extracted one-dimensional spectra (x1d), broadband white-light curves, and associated instrumental metadata. Although these products have been processed through the standard JWST calibration pipeline [4], they do not incorporate the specialized time-series analysis required for exoplanet spectroscopy, limiting their direct applicability for reconstructing transmission spectra.
As an initial methodological test, we attempted to reconstruct an independent transmission spectrum using only Level 3 products. The NIRSpec and NIRISS spectra were interpolated onto a common wavelength grid, temporally combined to produce a mean spectrum, and uniformly binned to achieve continuous spectral coverage from 0.9 to 5.2 m. The calibrated fluxes were converted into wavelength-dependent transit depths using the geometric relation , normalized by the white-light curves. The resulting spectrum, however, exhibited significant discrepancies in both amplitude and spectral morphology relative to the published GO-2722 transmission spectrum [2]. This demonstrates that Level 3 calibrations alone are insufficient to recover the transmission signal without channel-by-channel light-curve modeling using dedicated time-series pipelines such as Eureka! [5]. Consequently, we adopt as our observational reference the combined NIRISS+NIRSpec transmission spectrum reported by the GO-2722 collaboration, which represents the most robust reduction currently available.
The stellar and planetary parameters adopted throughout this work are summarized in Table 1. These parameters define the physical framework for both forward modeling and atmospheric retrieval analyses.
Prior to its use in atmospheric retrieval analyses, the consistency of the observed spectrum was evaluated through forward modeling with the Planetary Spectrum Generator (PSG; [9,10]). Using the system parameters listed in Table 1, we constructed a hydrogen-dominated (H2/He) atmosphere containing trace abundances of CH4, H2O, CO2, and CO, and adopted a standard equilibrium temperature structure. The atmosphere was discretized into 50 layers spanning pressures from to 10 bar, incorporating high-temperature molecular absorption, collision-induced absorption, and Rayleigh scattering. High-resolution transmission spectra were generated with PSG and subsequently degraded to the instrumental resolving powers and resampled onto the NIRISS and NIRSpec wavelength grids.
To assess whether the observed spectral scatter is consistent with the expected instrumental noise for a single transit, synthetic noisy spectra were generated using two independent approaches: the internal PSG noise model and simulations performed with PandExo [10], configured with the exact observational setup of GO-2722 [2]. Both approaches successfully reproduce the amplitude and wavelength dependence of the dispersion observed in the published transmission spectrum, confirming its consistency with JWST instrumental performance.
Atmospheric retrievals were performed using three conceptually distinct frameworks: TauREx 3 [11], petitRADTRANS [12], and PSG-OEM [9]. To ensure consistency, all frameworks were configured with a common set of physical assumptions: an isothermal temperature–pressure profile with K; a hydrogen-dominated background atmosphere including collision-induced absorption; and a shared set of retrieved molecular species (H2O, CH4, CO2, CO, NH3, HCN, and H2S). Aerosols were treated uniformly by including an opaque gray cloud deck with a free cloud-top pressure and a haze component parameterized as a power law with free amplitude and spectral slope. A common logarithmic pressure grid was adopted, while the planetary mass, planetary radius, and stellar radius were fixed to the values listed in Table 1.
In TauREx 3, a free-chemistry retrieval was performed using opacity data from HITRAN [13], HITEMP [14], and POKAZATEL [15], together with collision-induced absorption. Parameter estimation was carried out using the MultiNest nested sampler [16] with approximately 500 live points, yielding posterior distributions for molecular abundances, temperature, and aerosol properties. In petitRADTRANS, high-temperature molecular line lists were employed within a Bayesian framework to retrieve atmospheric parameters. Finally, PSG-OEM solved the inverse problem using a Gauss–Newton optimal estimation approach, providing the maximum-likelihood state vector and the associated covariance matrix.
The retrieved molecular abundances, characteristic temperature, aerosol properties, and best-fitting transmission spectra from the three frameworks were systematically compared with one another and with the results reported by Madhusudhan et al. [2], obtained using the AURA retrieval framework [22]. This multi-framework comparison enables a robust assessment of molecular detections and provides a quantitative evaluation of the sensitivity of atmospheric inferences to opacity databases, vertical parameterizations, and aerosol treatments.
2.2. Statistical Framework
Atmospheric retrieval is formulated as a Bayesian inverse problem. Given a vector of observed transit depths and a forward model parameterized by atmospheric parameters , the posterior distribution is
where represents the prior distribution and the likelihood function.
Assuming independent Gaussian uncertainties, the likelihood can be written as
Posterior sampling in TauREx was performed using the nested-sampling algorithm MultiNest with 500 live points. Convergence was assumed when the estimated change in Bayesian evidence satisfied .
2.3. Model Comparison
To quantify the statistical significance of individual molecular species, we computed the Bayesian evidence for models including and excluding each molecule. The Bayes factor between two models and is
where Z denotes the marginal likelihood.
Following the commonly adopted Jeffreys scale, indicates strong evidence, moderate evidence, and weak evidence.
For the JWST spectrum of K2-18 b, we find:
- CH4 detection: ;
- CO2 detection: ;
- DMS detection: .
These values indicate that the presence of DMS is not statistically favored.
2.4. Atmospheric Retrieval Frameworks
To assess the robustness of atmospheric inferences for K2-18 b, we performed a comparative analysis using three independent atmospheric retrieval frameworks: TauREx 3, petitRADTRANS, and the Planetary Spectrum Generator in optimal estimation mode (PSG-OEM). These frameworks differ in their radiative-transfer implementations, opacity databases, and statistical inference methods, providing a suitable basis for evaluating model dependence.
All retrievals were conducted under a common set of physical assumptions to ensure a consistent comparison. The planetary and stellar parameters were fixed to the values listed in Table 1. The atmosphere was assumed to be hydrogen-dominated (H2/He), and the temperature–pressure structure was parameterized as isothermal, with the temperature allowed to vary within the range 200–300 K. The atmospheric composition was described using a free-chemistry approach, retrieving the volume mixing ratios (VMRs) of H2O, CH4, CO2, CO, NH3, HCN, and H2S.
Aerosols were included through a parameterized treatment consisting of (i) an opaque gray cloud deck characterized by a cloud-top pressure, and (ii) a wavelength-dependent haze component described by a power-law opacity of the form , where the amplitude and slope were free parameters. The vertical structure of the atmosphere was discretized using a logarithmically spaced pressure grid spanning to 10 bar.
2.4.1. TauREx 3
Retrievals with TauREx 3 were performed using a Bayesian nested-sampling approach implemented through the MultiNest algorithm. The forward model includes line-by-line radiative transfer with molecular opacities drawn from the HITRAN, HITEMP, and ExoMol databases, including the POKAZATEL line list for water vapor. Collision-induced absorption (CIA) from H2–H2 and H2–He pairs was also included.
The parameter space was explored using approximately 500 live points, and convergence was assessed through the change in Bayesian evidence, with a stopping criterion of . The retrieval returned posterior distributions for all atmospheric parameters, including molecular abundances, temperature, and aerosol properties.
2.4.2. petitRADTRANS
The petitRADTRANS retrieval framework employs a line-by-line radiative-transfer solver optimized for exoplanet atmospheres, using high-temperature molecular opacity databases. In this work, we used the POKAZATEL line list for H2O, YT34to10 for CH4, UCL-4000 for CO2, and additional ExoMol-based line lists for NH3, HCN, and H2S.
Bayesian inference was performed using a nested-sampling approach similar to that adopted in TauREx, allowing for direct comparison of posterior distributions. The retrieval simultaneously constrained molecular abundances, atmospheric temperature, and aerosol parameters under the same physical assumptions described above.
2.4.3. PSG-OEM
The PSG-OEM framework solves the inverse problem using a deterministic optimal estimation method based on the Gauss–Newton algorithm. Unlike nested-sampling approaches, which explore the full posterior distribution, optimal estimation seeks the maximum-likelihood solution while accounting for prior constraints and observational uncertainties.
The retrieval returns the best-fit state vector along with an estimate of the posterior covariance matrix, enabling a direct assessment of parameter uncertainties and correlations. Molecular opacities in PSG are based primarily on HITRAN and HITEMP databases and include collision-induced absorption and Rayleigh scattering processes.
2.4.4. Consistency of Retrieval Assumptions
To ensure a controlled comparison between frameworks, all retrievals were configured to use identical input data, wavelength coverage, and instrumental uncertainties. The same set of molecular species, pressure grid, and aerosol parameterizations were adopted across all models.
Differences in the retrieved atmospheric properties can therefore be attributed to intrinsic variations in radiative-transfer implementations, opacity databases, and statistical inference methods, rather than to differences in the underlying physical assumptions.
3. Results
3.1. Multi-Framework Atmospheric Retrieval Results
Figure 1 presents the combined transmission spectrum of K2-18 b obtained with NIRISS/SOSS and NIRSpec/G395H as part of the GO-2722 program [2]. The dataset provides nearly continuous wavelength coverage from 0.9 to 5.2 m, with the exception of a narrow gap between 3.72 and 3.82 m. This discontinuity is not astrophysical in origin, but instead results from an instrumental limitation associated with the transition between grating orders in the G395H+F290LP configuration at . While this setup is optimal for bright targets such as K2-18 b—mitigating detector saturation while preserving high spectral resolution—the throughput drops sharply in this region, and the JWST pipeline does not provide sufficiently stable spectrophotometric products for time-series analysis. Consequently, no reliable in-transit data are available within this wavelength interval.
Outside this instrumental gap, the transmission spectrum exhibits a morphology consistent with a hydrogen-dominated (H2/He) atmosphere containing molecular trace species. The NIRISS/SOSS range (0.9–2.8 m) is characterized by low noise levels and excellent temporal stability, whereas the NIRSpec range (3.8–5.2 m) shows increased scatter due to detector performance limitations and the rising contribution of thermal background at longer wavelengths. Despite this, clear spectral modulations are evident, including CH4 absorption bands near 3.3 m and 4.0–4.2 m, as well as CO2 absorption around 4.25 m. The overall amplitude of the transmission signal, of order , indicates a relatively large atmospheric scale height, consistent with a low mean molecular weight envelope.
A comparison with the best-fitting spectra produced by TauREx 3, petitRADTRANS, and PSG-OEM shows that all three frameworks successfully reproduce the global spectral structure, particularly in regions dominated by CH4 and CO2 absorption [2]. However, systematic differences are evident in the amplitudes of spectral features and in the retrieved molecular abundances. These discrepancies, typically at the level of – dex, persist even under homogeneous modeling assumptions and arise from differences in radiative-transfer implementations, opacity databases, aerosol parameterizations, and statistical inference approaches.
Table 2 summarizes these differences quantitatively across frameworks. To visualize this scatter more clearly, it is useful to represent the abundances as horizontal bands for each molecule and retrieval code, allowing systematic variations between AURA, TauREx, petitRADTRANS, and PSG-OEM to be immediately identified.
Figure 2 summarizes the retrieved molecular abundances and atmospheric parameters obtained with the different retrieval frameworks. The comparison highlights that CH4 and CO2 remain relatively stable across models, supporting their interpretation as the most robustly detected species in the atmosphere of K2-18 b. In contrast, H2O, NH3, HCN, and DMS exhibit significantly larger dispersion between retrieval codes, indicating a stronger dependence on the adopted opacity databases, cloud and haze parameterizations, and statistical inference methods.
The largest discrepancies are observed for DMS and H2O. For DMS, the retrieved abundances span a wider range than those obtained for the carbon-bearing species, suggesting that its inferred contribution is highly sensitive to model assumptions. This behavior is consistent with previous studies of K2-18 b, which have emphasized that the spectral regions associated with DMS are affected by strong degeneracies involving CH4, CO2, and aerosol opacity. Consequently, the present comparison does not support a robust detection of DMS, but rather indicates that its retrieval remains model-dependent.
The temperature estimates show overall consistency among frameworks and are compatible with the temperate atmospheric conditions expected for a Hycean candidate. Similarly, the agreement obtained for CH4 and CO2 reinforces the interpretation of K2-18 b as a planet possessing a hydrogen-rich atmosphere containing carbon-bearing molecules, in agreement with the conclusions reported from the original JWST observations.

| Molecule/Process | AURA opacity | PSG opacity | petitRADTRANS opacity | TauREx 3 opacity |
|---|---|---|---|---|
| H2O | Not published | HITRAN/HITEMP | POKAZATEL.R1000 | POKAZATEL |
| CH4 | Not published | HITRAN | YT34to10.R1000 | YT34to10 |
| NH3 | Not published | HITRAN | CoYuTe.R1000 | CoYuTe |
| CO | Not published | HIT/HITEMP | CO_HITEMP.R1000 | HITEMP |
| CO2 | Not published | HIT/HITEMP | UCL-4000.R1000 | UCL-4000 |
| HCN | Not published | HIT / Harris | HCN_Harris.R1000 | Harris |
| H2S | Not published | AYT2 | AYT2.R1000 | AYT2 |
| DMS | Not published | — | HIT.R1000 | HIT |
| CIA: H2–H2 | Not published | CIA H2–H2 | H2–H2 CIA (Richard et al.) | CIA-H2-H2 |
| CIA: H2–He | Not published | CIA H2–He | H2–He CIA (Richard et al.) | CIA-H2-He |
3.2. Corner Plot
The corner plot summarizes the region of parameter space compatible with the JWST transmission spectrum and allows one to identify both well-constrained parameters and intrinsic degeneracies of the model. The temperature shows a relatively narrow distribution, consistent with a temperate atmosphere. The abundances of CH4 and CO2 appear comparatively well defined, confirming their dominant role in the spectral opacity and their contribution to the main modulations of the transmission spectrum.
In contrast, H2O, NH3, CO, HCN, and H2S show broader posterior distributions and stronger correlations with other parameters, indicating that their abundances are not independently and tightly constrained. These degeneracies reflect the overlap of spectral bands and the sensitivity of the fit to the adopted parameterization.
The correlations between molecular abundances and aerosol parameters reveal a significant coupling between atmospheric composition and atmospheric structure. The presence of clouds and hazes reduces the spectral contrast and allows compensation between continuum opacity and molecular absorption, thereby widening the range of solutions compatible with the data.
DMS does not exhibit a clearly isolated posterior distribution or a well-defined independent structure. In the corner plot, its abundance is strongly correlated with CH4, CO2, and aerosol parameters, indicating that its spectral contribution is not unique. This is consistent with the main interpretation of this work: the spectral regions in which DMS has been suggested can also be explained by alternative combinations of molecules and aerosol effects.
Figure 3.
Posterior distributions of the atmospheric parameters of K2-18 b obtained from the Bayesian retrieval of the JWST transmission spectrum (NIRISS/SOSS + NIRSpec/G395H). The diagonal panels show the marginal distributions of each parameter, while the off-diagonal panels represent the joint distributions and correlations between them. The retrieved parameters include temperature, molecular abundances in log10(VMR) (H2O, CH4, CO, CO2, NH3, HCN, H2S, and DMS), and aerosol parameters.
Figure 3.
Posterior distributions of the atmospheric parameters of K2-18 b obtained from the Bayesian retrieval of the JWST transmission spectrum (NIRISS/SOSS + NIRSpec/G395H). The diagonal panels show the marginal distributions of each parameter, while the off-diagonal panels represent the joint distributions and correlations between them. The retrieved parameters include temperature, molecular abundances in log10(VMR) (H2O, CH4, CO, CO2, NH3, HCN, H2S, and DMS), and aerosol parameters.
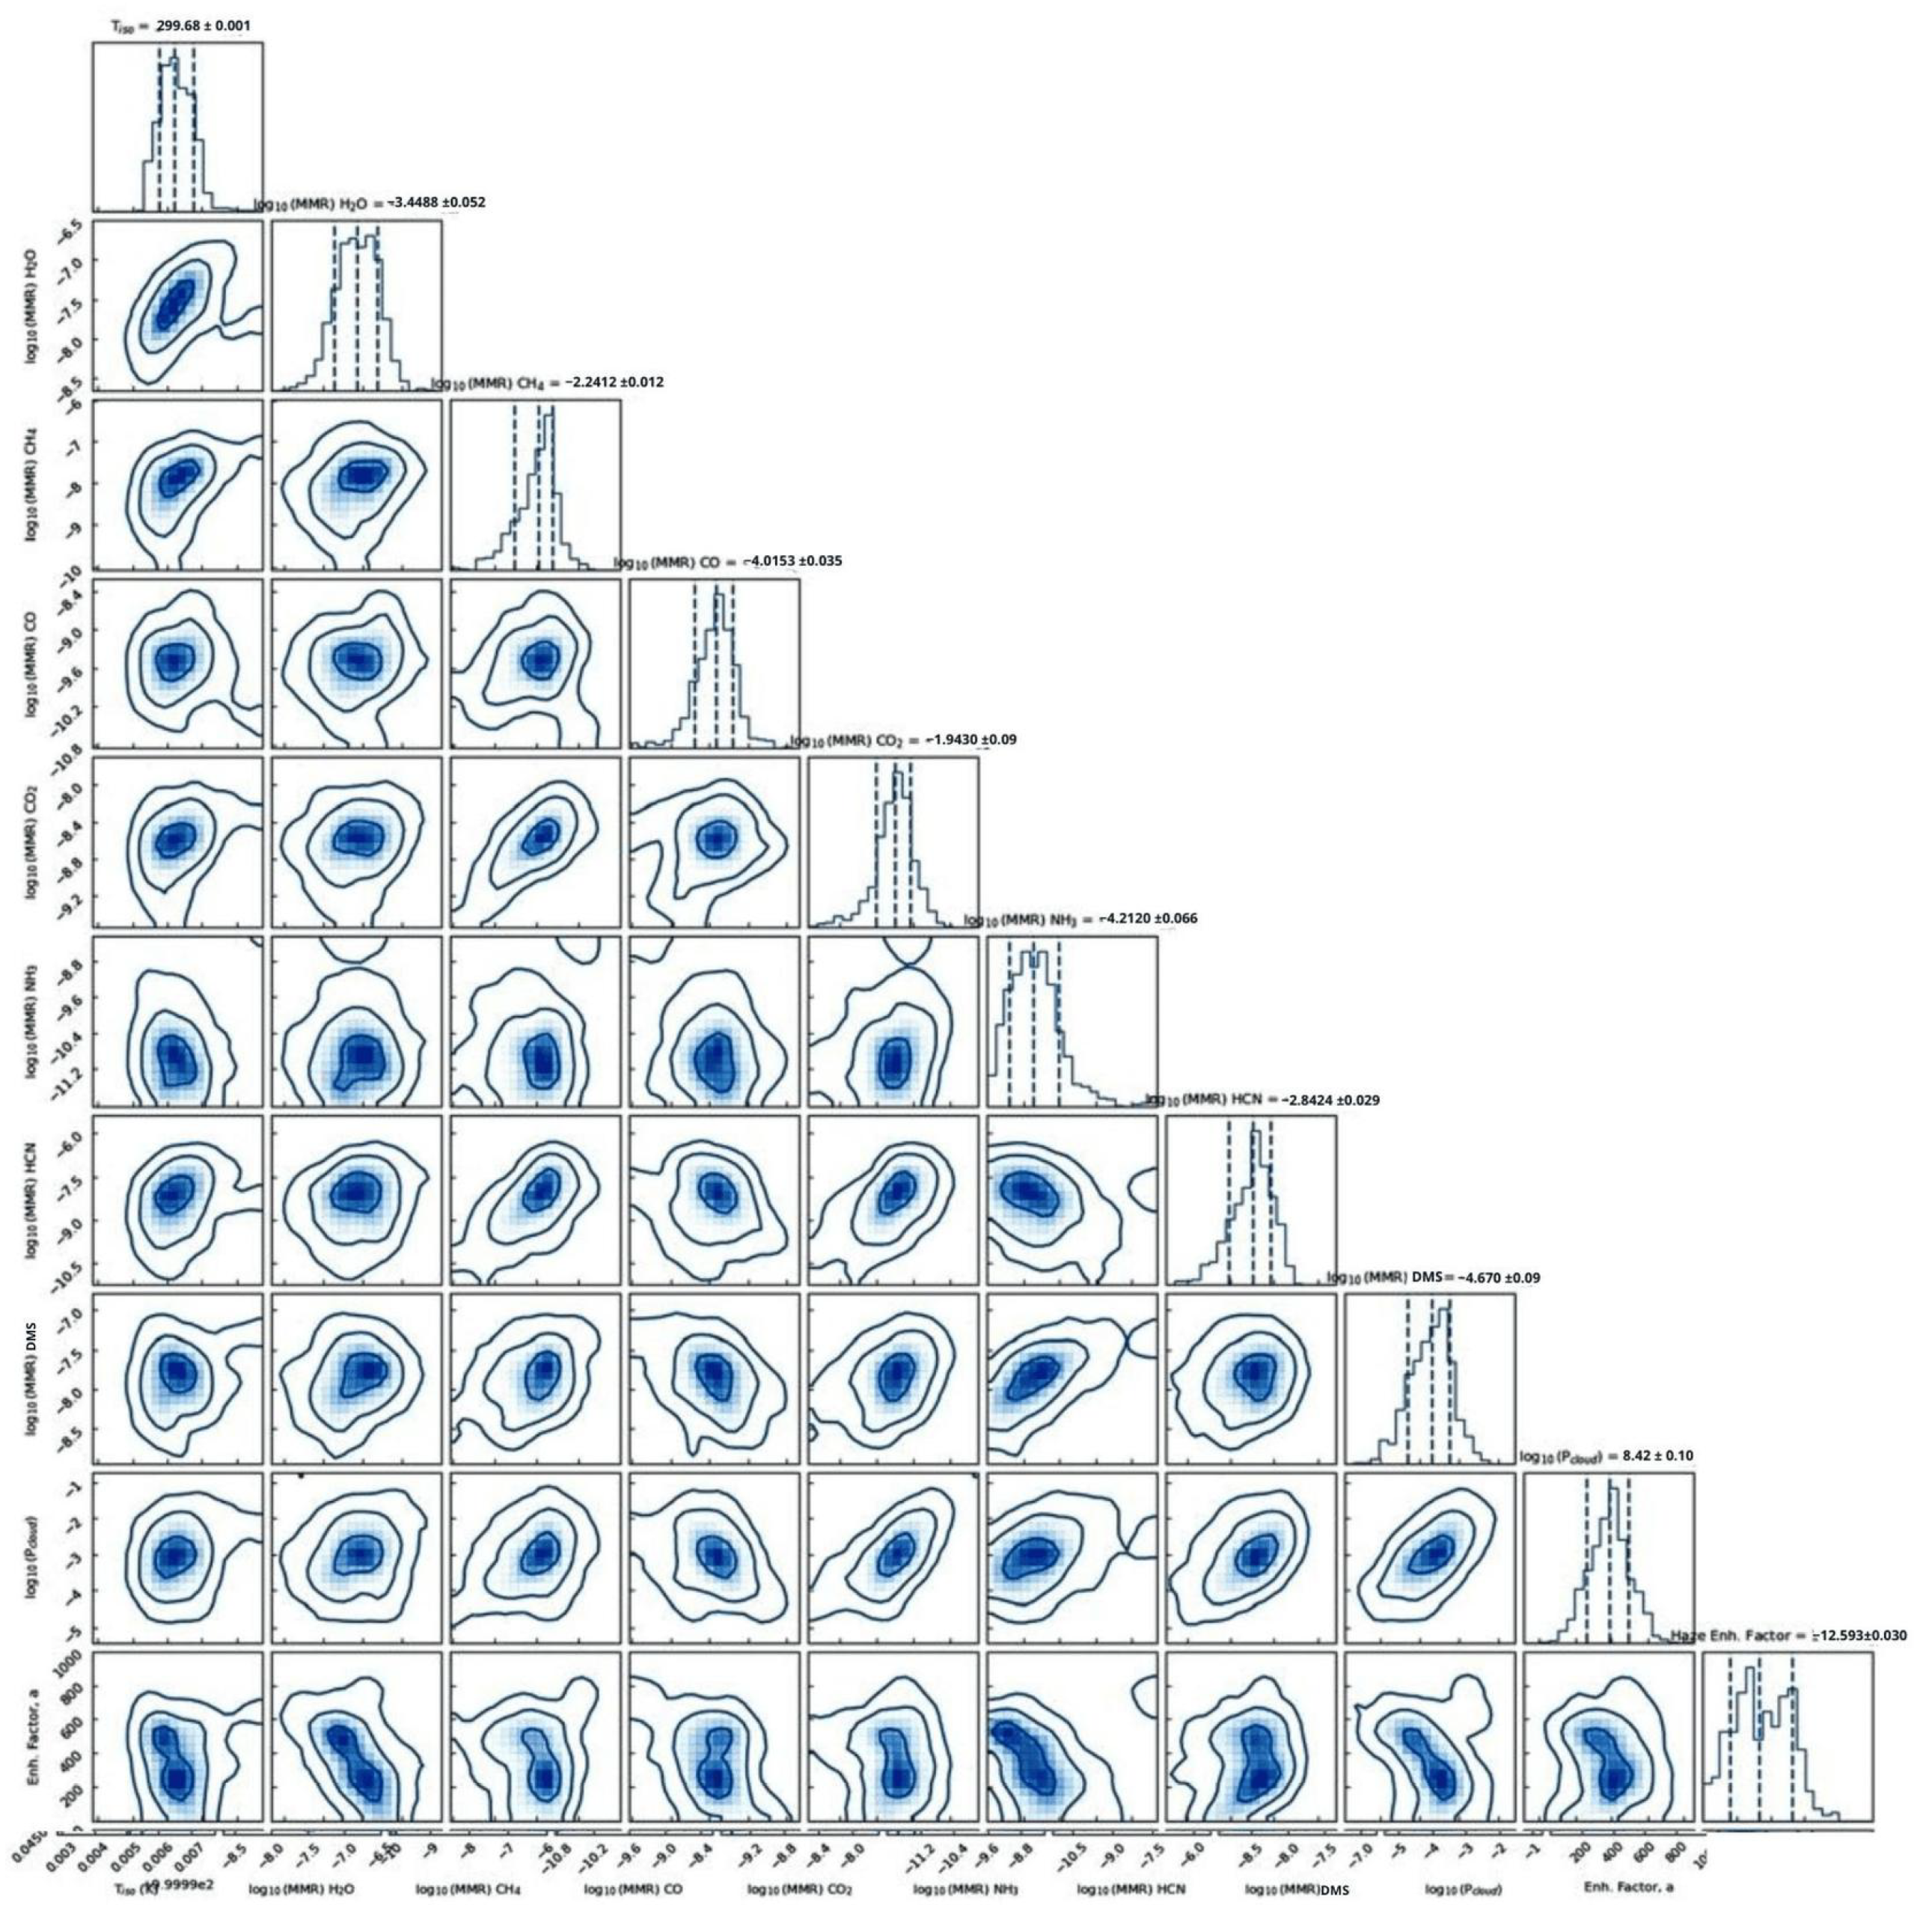
Moreover, the inferred abundances of DMS reach values that are not clearly supported by physico-chemical models under Hycean-like conditions. In this context, DMS cannot be regarded as detected, but rather as part of a degenerate regime within the atmospheric retrieval parameter space.
Taken together, the analysis indicates that CH4 and CO2 are robustly supported by the data, whereas the identification of minor species, particularly DMS, remains limited by model degeneracies and by the currently available spectral information.
3.3. Information Content Analysis
To quantify the intrinsic parameter degeneracies present in the JWST transmission spectrum of K2-18 b, we performed an information-content analysis following the formalism developed for inverse problems in atmospheric remote sensing.
The forward model describing the transmission spectrum can be written as
where represents the vector of atmospheric parameters (e.g., molecular abundances, temperature, and cloud properties). The Jacobian matrix describes the sensitivity of the spectrum to these parameters,
which quantifies the change in the modeled spectrum at wavelength with respect to a perturbation in parameter .
Assuming Gaussian observational uncertainties with covariance matrix , the Fisher information matrix is
The inverse of this matrix provides an estimate of the minimum retrievable covariance for the atmospheric parameters,
Strong correlations between parameters appear as large off-diagonal elements in , indicating degeneracies in the retrieval.
The total Shannon information gained from the observations relative to the prior state is given by
where represents the prior covariance matrix. For the JWST spectrum of K2-18 b, we find that the total information content is limited, implying that only a small number of atmospheric parameters can be independently constrained by the data.
In particular, the Jacobian analysis shows that the spectral signatures of CH4, CO2, and cloud opacity exhibit significant overlap across the 3–5 m region. As a result, variations in molecular abundances can be partially compensated by changes in aerosol opacity or temperature structure, leading to the degeneracies observed in the multi-framework retrieval analysis.
4. Discussion
The analysis of the combined NIRISS/SOSS and NIRSpec/G395H transmission spectrum of K2-18 b reveals a coherent atmospheric signal characterized by smooth spectral modulations primarily driven by CH4 and CO2, and partially muted by the presence of high-altitude aerosols. The only apparent discontinuity, located between 3.72 and 3.82 m, is fully explained by the reduced throughput of the G395H grating in combination with the F290LP filter and does not reflect any intrinsic atmospheric property. The continuity of the spectrum outside this narrow interval supports its use as a reliable benchmark for comparative atmospheric retrieval analyses.
All retrieval frameworks considered—TauREx 3, petitRADTRANS, and PSG-OEM—successfully reproduce the global morphology of the observed spectrum. However, they yield systematically different solutions for molecular abundances, temperature structure, and aerosol properties. These discrepancies, typically at the level of 0.3–0.7 dex, arise from a combination of physical degeneracies and methodological differences. In particular, strong spectral overlap between CH4, CO2, and H2O bands, together with the smoothing effect of vertically extended hazes, leads to a highly non-unique inversion problem. As a result, multiple regions of parameter space provide statistically comparable fits, making the inferred atmospheric properties intrinsically model-dependent.
This degeneracy is especially critical in the context of minor species such as DMS (dimethyl sulfide) [2]. While some retrieval frameworks admit solutions in which DMS contributes marginally to the spectral fit, none require its presence in a statistically significant manner. Moreover, the inferred abundances, when non-zero, tend to be unrealistically high compared to both known biological production rates and plausible abiotic mechanisms, such as hydrothermal or photochemical processes [8,26]. This suggests that the apparent detection of DMS is not physically motivated, but instead reflects the flexibility of the retrieval algorithms in redistributing spectral contributions among overlapping molecular features and aerosol opacity.
From a methodological perspective, the differences between frameworks further illustrate this behavior. TauREx 3, employing the MultiNest nested sampler, efficiently explores multimodal posterior distributions and can converge toward extreme solutions in highly degenerate regimes. In contrast, petitRADTRANS adopts detailed opacity treatments combined with a more constrained Bayesian exploration, leading to smoother but still degenerate solutions [11,12]. The PSG-OEM framework, based on a Gauss–Newton optimal estimation scheme, imposes stronger regularization and tends to favor more conservative, near-linear solutions. These differences in statistical inference and forward modeling propagate directly into systematic offsets in the retrieved atmospheric parameters.
Overall, our results demonstrate that the current JWST transmission spectrum of K2-18 b can be reproduced by a wide range of atmospheric configurations, all providing comparably good fits to the data. Consequently, inferences regarding minor species—and in particular potential biosignatures such as DMS—remain highly uncertain and lack statistical robustness under reasonable variations in model assumptions. This highlights the fundamental limitations imposed by spectral degeneracies and underscores the need for higher signal-to-noise observations, broader wavelength coverage, and improved opacity consistency across retrieval frameworks before drawing firm conclusions about the atmospheric composition and potential habitability of K2-18 b.
5. Conclusions
The multi-framework analysis of the NIRISS/SOSS and NIRSpec/G395H transmission spectrum of K2-18 b consistently supports the presence of a hydrogen-dominated (H2/He) atmosphere, with robust spectral signatures of CH4 and CO2. These species are reliably identified across all retrieval frameworks and in spectral regions consistently reproduced between instruments, in agreement with the main conclusions of Madhusudhan et al. [2]. However, while their qualitative detection is robust, the inferred abundances exhibit systematic dispersion between models, reflecting a non-negligible sensitivity to opacity treatments, aerosol parameterizations, and statistical inference schemes.
In contrast, our results indicate that additional molecules such as H2O, NH3, and HCN are not strictly required by the current data. Their spectral signatures are weak and strongly degenerate with both the atmospheric thermal structure and the continuum opacity introduced by high-altitude hazes. Consequently, their retrieved abundances vary significantly across frameworks, suggesting that these species should be interpreted as marginal detections or, more conservatively, as model-dependent upper limits rather than firmly established atmospheric constituents.
The case of dimethyl sulfide (DMS) is particularly illustrative. While Madhusudhan et al. [2] report suggestive evidence for DMS as a potential carbon-bearing species, our analysis shows that its inference is not robust under reasonable variations in the retrieval framework. When present, DMS appears with elevated abundances that are strongly correlated with aerosol properties and dominant molecular species, indicating that its spectral contribution is not uniquely identifiable. Furthermore, even under optimistic abiotic scenarios such as hydrothermal production, the inferred abundances exceed expectations based on plausible physico-chemical conditions, and would likely be suppressed by rapid photochemical destruction in an H2-rich atmosphere.
Overall, this work reinforces the classification of K2-18 b as a temperate sub-Neptune with a hydrogen-rich atmosphere containing simple carbon-bearing molecules, consistent with previous studies [2,8]. At the same time, it demonstrates that inferences regarding minor species—particularly potential geochemical or biological tracers—remain highly model-dependent and lack statistical robustness with the current data. A key outcome of this study is to highlight the necessity of multi-framework retrieval analyses to properly assess the reliability of molecular detections. Future observations with broader wavelength coverage, improved constraints on aerosol properties, and more consistent opacity treatments will be essential to break current degeneracies and to robustly characterize the atmospheric composition of K2-18 b.
Supplementary Materials
The following supporting information can be downloaded at the website of this paper posted on Preprints.org, Figure S1: Full corner plot showing the posterior distributions and parameter correlations for the atmospheric retrieval of K2-18 b.
Author Contributions
Conceptualization, H.B., E.L., D.R., and I.B.; methodology, H.B., E.L., D.R., I.B. and D.M.; software, H.B.,D.R., I.B. and D.M.; validation, H.B., E.L., D.R., I.B. and D.M.; formal analysis, H.B., E.L., D.R., I.B. and D.M.; investigation, H.B., E.L., D.R., I.B. and D.M.; data curation, H.B., E.L., D.R., I.B. and D.M.; writing—original draft preparation, H.B., E.L., D.R., I.B. and D.M.; writing—review and editing, H.B., E.L., and D.R.; visualization, H.B., E.L., and D.R. All authors have read and agreed to the published version of the manuscript.
Funding
This research received no external funding.
Institutional Review Board Statement
Not applicable.
Informed Consent Statement
Not applicable.
Data Availability Statement
The JWST transmission spectrum of K2-18 b used in this work is based on publicly available observations obtained as part of program GO-2722 (PI: N. Madhusudhan). The reduced data products, including extracted one-dimensional spectra and associated calibration files, are available from the Mikulski Archive for Space Telescopes (MAST). Synthetic spectra and noise simulations were generated using the Planetary Spectrum Generator (PSG) and PandExo, configured to match the observational setup of the JWST instruments used in this study. The atmospheric retrievals were performed using the publicly available codes TauREx 3, petitRADTRANS, and PSG in optimal estimation mode (PSG-OEM). All input configurations, model parameters, and assumptions are described in detail within the manuscript. Custom scripts used for data processing, retrieval configuration, and figure generation are available from the corresponding author upon reasonable request.
Acknowledgments
The authors acknowledge the availability of public JWST data products and the open-source atmospheric retrieval tools used in this work.
Conflicts of Interest
The authors declare no conflicts of interest.
Abbreviations
The following abbreviations are used in this manuscript:
| JWST | James Webb Space Telescope |
| NIRISS | Near Infrared Imager and Slitless Spectrograph |
| NIRSpec | Near Infrared Spectrograph |
| SOSS | Single Object Slitless Spectroscopy |
| VMR | Volume Mixing Ratio |
| DMS | Dimethyl Sulfide |
| PSG-OEM | Planetary Spectrum Generator–Optimal Estimation Mode |
| CIA | Collision-Induced Absorption |
References
- Akeson, R.L.; Chen, X.; Ciardi, D.; Crane, M.; Good, J.; Harbut, M.; Jackson, E.; Kane, S.R.; Laity, A.C.; Leifer, S.; et al. The NASA Exoplanet Archive: Data and Tools for Exoplanet Research. Publ. Astron. Soc. Pac. 2013, 125, 989–999. [Google Scholar] [CrossRef]
- Madhusudhan, N.; Sarkar, S.; Constantinou, S.; Holmberg, M. Carbon-bearing Molecules in a Possible Hycean Atmosphere. Astrophys. J. Lett. 2023, 956, L13. [Google Scholar] [CrossRef]
- White, R.L. MAST: The Mikulski Archive for Space Telescopes. In Proceedings of the NRC Space Science Week / Committee on Biological and Physical Sciences in Space (CBPSS), Space Telescope Science Institute, Washington, DC, 2015. Conference presentation. [Google Scholar]
- Albert, L.; et al. Performance and Calibration of NIRISS/SOSS on the James Webb Space Telescope. Publ. Astron. Soc. Pac. 2023, 135, 045001. [Google Scholar] [CrossRef]
- Bell, T.J.; Brande, J.; Stevenson, K.B.; et al. Eureka!: An End-to-End Pipeline for Time-Series Observations with JWST. Astron. J. 2022, 163, 87. [Google Scholar] [CrossRef]
- Benneke, B.; et al. Water Vapor on the Habitable-Zone Exoplanet K2-18 b. Astrophys. J. Lett. 2019, 887, L14. [Google Scholar] [CrossRef]
- Cloutier, R.; et al. Confirmation of the Radial Velocity Super-Earth K2-18 b. Astron. Astrophys. 2019, 629, A111. [Google Scholar] [CrossRef]
- Madhusudhan, N.; et al. Habitability and Biosignatures of Hycean Worlds. Astrophys. J. 2021, 918, 1. [Google Scholar] [CrossRef]
- Villanueva, G.L.; Smith, M.D.; Protopapa, S.; Faggi, S.; Mandell, A.M. Planetary Spectrum Generator: An Accurate Online Radiative Transfer Suite for Atmospheres, Comets, Small Bodies and Exoplanets. Icarus 2018, 299, 290–307. [Google Scholar] [CrossRef]
- Batalha, N.E.; Mandell, A.M.; Pontoppidan, K.M.; Stevenson, K.B.; Lewis, N.K. PandExo: A Community Tool for Transiting Exoplanet Science with JWST and WFIRST. Publ. Astron. Soc. Pac. 2017, 129, 064501. [Google Scholar] [CrossRef]
- Al-Refaie, A.F.; Changeat, Q.; Waldmann, I.P.; Tinetti, G. TauREx 3: A Fast, Dynamic and Extendable Framework for Retrievals. Mon. Not. R. Astron. Soc. 2021, 505, 3797–3815. [Google Scholar] [CrossRef]
- Mollière, P.; Wardenier, J.P.; van Boekel, R.; et al. petitRADTRANS: A Python Package for Computing Transmission and Emission Spectra of Exoplanets. Astron. Astrophys. 2019, 627, A67. [Google Scholar] [CrossRef]
- Gordon, I.E.; Rothman, L.S.; Hargreaves, R.J.; Hashemi, R.; Karlovets, E.V.; Skinner, F.M.; Conway, E.K.; Hill, C.; Kochanov, R.V.; Tan, Y.; et al. The HITRAN2020 Molecular Spectroscopic Database. J. Quant. Spectrosc. Radiat. Transf. 2021, 277, 107949. [Google Scholar] [CrossRef]
- Hargreaves, R.J.; Gordon, I.E.; Kochanov, R.V.; Rothman, L.S. An Update of the HITEMP Database for High-Temperature Molecular Spectroscopy. J. Quant. Spectrosc. Radiat. Transf. 2020, 251, 107017. [Google Scholar] [CrossRef]
- Polyansky, O.L.; Kyuberis, A.A.; Zobov, N.F.; Tennyson, J.; Yurchenko, S.N.; Lodi, L. ExoMol Molecular Line Lists XXX: A Complete High-Accuracy Line List for Water. Mon. Not. R. Astron. Soc. 2018, 480, 2597–2608. [Google Scholar] [CrossRef]
- Feroz, F.; Hobson, M.P.; Bridges, M. MultiNest: An Efficient and Robust Bayesian Inference Tool for Cosmology and Particle Physics. Mon. Not. R. Astron. Soc. 2009, 398, 1601–1614. [Google Scholar] [CrossRef]
- Yurchenko, S.N.; Tennyson, J. ExoMol Molecular Line Lists for Methane. Mon. Not. R. Astron. Soc. 2014, 440, 1649–1661. [Google Scholar] [CrossRef]
- Coles, P.A.; Yurchenko, S.N.; Tennyson, J. A Variationally Computed Line List for Hot Ammonia. Mon. Not. R. Astron. Soc. 2019, 490, 4638–4647. [Google Scholar] [CrossRef]
- Harris, G.J.; Polyansky, O.L.; Tennyson, J. Opacity Data for the HCN and HNC Molecules. Astrophys. J. 2006, 640, 1173–1178. [Google Scholar] [CrossRef] [PubMed]
- Yurchenko, S.N.; Tennyson, J. ExoMol Line Lists for Carbon Dioxide. Mon. Not. R. Astron. Soc. 2020, 493, 686–700. [Google Scholar] [CrossRef]
- Azzam, A.A.A.; Yurchenko, S.N.; Tennyson, J. ExoMol Line Lists for Hydrogen Sulfide. Mon. Not. R. Astron. Soc. 2016, 460, 4063–4074. [Google Scholar] [CrossRef]
- Madhusudhan, N. Exoplanetary Atmospheres: Key Insights, Challenges, and Prospects. Annu. Rev. Astron. Astrophys. 2018, 56, 391–442. [Google Scholar] [CrossRef]
- Tennyson, J.; Yurchenko, S.N. ExoMol: Molecular Line Lists for Exoplanet and Other Atmospheres. Mon. Not. R. Astron. Soc. 2012, 425, 21–33. [Google Scholar] [CrossRef]
- Gordon, L.S.; Rothman, L.S.; Hill, C.; et al. The HITRAN2016 Molecular Spectroscopic Database. J. Quant. Spectrosc. Radiat. Transf. 2017, 203, 3–69. [Google Scholar] [CrossRef]
- Richard, C.; Gordon, L.S.; Rothman, L.S.; et al. New Section of the HITRAN Database: Collision-Induced Absorption (CIA). J. Quant. Spectrosc. Radiat. Transf. 2012, 113, 1276–1285. [Google Scholar] [CrossRef]
- Shock, E.L.; Schulte, M.D. Organic Synthesis during Fluid Mixing in Hydrothermal Systems. J. Geophys. Res. 1998, 103, 28513–28527. [Google Scholar] [CrossRef]
Figure 1.
Combined transmission spectrum of K2-18 b observed with NIRISS/SOSS (0.9–2.8 m) and NIRSpec/G395H (2.9–5.2 m) as part of the GO-2722 program. The data gap between 3.72 and 3.82 m arises from an instrumental limitation of the G395H grating used in combination with the F290LP filter.
Figure 1.
Combined transmission spectrum of K2-18 b observed with NIRISS/SOSS (0.9–2.8 m) and NIRSpec/G395H (2.9–5.2 m) as part of the GO-2722 program. The data gap between 3.72 and 3.82 m arises from an instrumental limitation of the G395H grating used in combination with the F290LP filter.
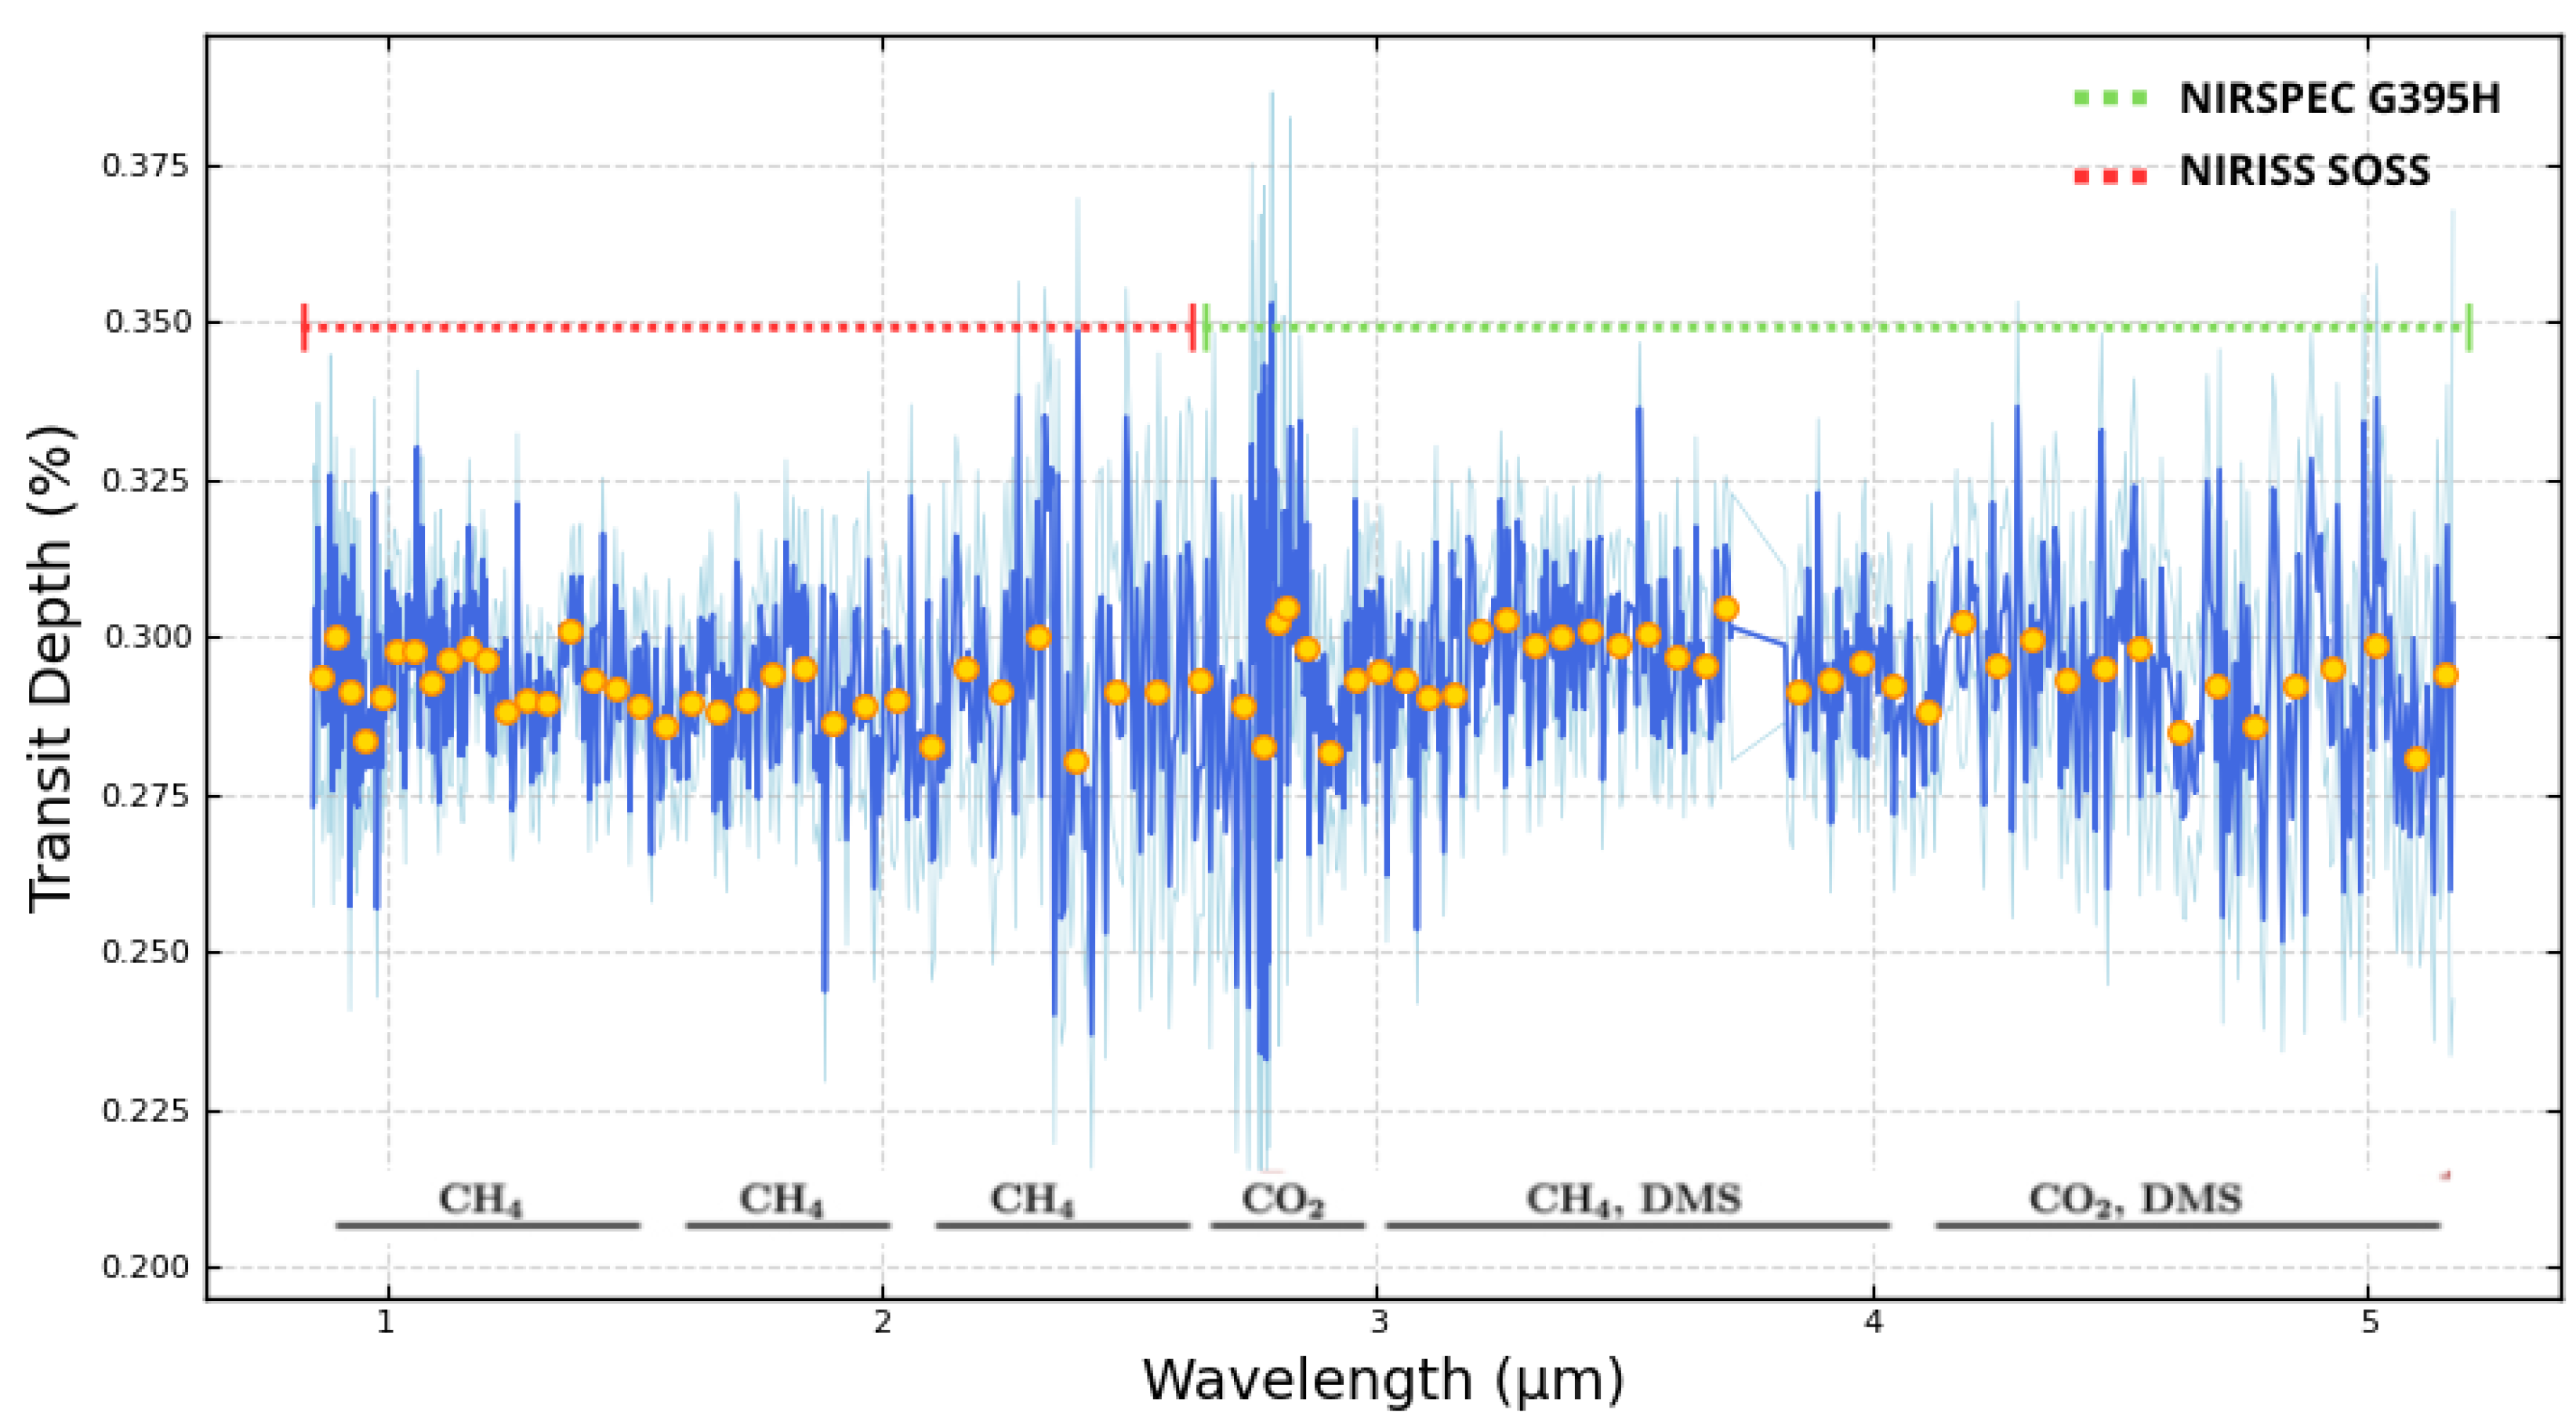
Figure 2.
Comparison of the retrieved atmospheric parameters of K2-18 b obtained with AURA, TauREx 3, petitRADTRANS, and PSG-OEM. Each panel shows the posterior estimate of a molecular abundance or atmospheric parameter. Colored bands represent the reported uncertainties around the retrieved values, while the markers indicate the corresponding best-fit solutions. The comparison reveals a generally good agreement for CH4 and CO2, whereas larger inter-framework variations are observed for H2O, NH3, HCN, and DMS, reflecting the impact of retrieval assumptions, opacity databases, and aerosol parameterizations on the inferred atmospheric composition.
Figure 2.
Comparison of the retrieved atmospheric parameters of K2-18 b obtained with AURA, TauREx 3, petitRADTRANS, and PSG-OEM. Each panel shows the posterior estimate of a molecular abundance or atmospheric parameter. Colored bands represent the reported uncertainties around the retrieved values, while the markers indicate the corresponding best-fit solutions. The comparison reveals a generally good agreement for CH4 and CO2, whereas larger inter-framework variations are observed for H2O, NH3, HCN, and DMS, reflecting the impact of retrieval assumptions, opacity databases, and aerosol parameterizations on the inferred atmospheric composition.
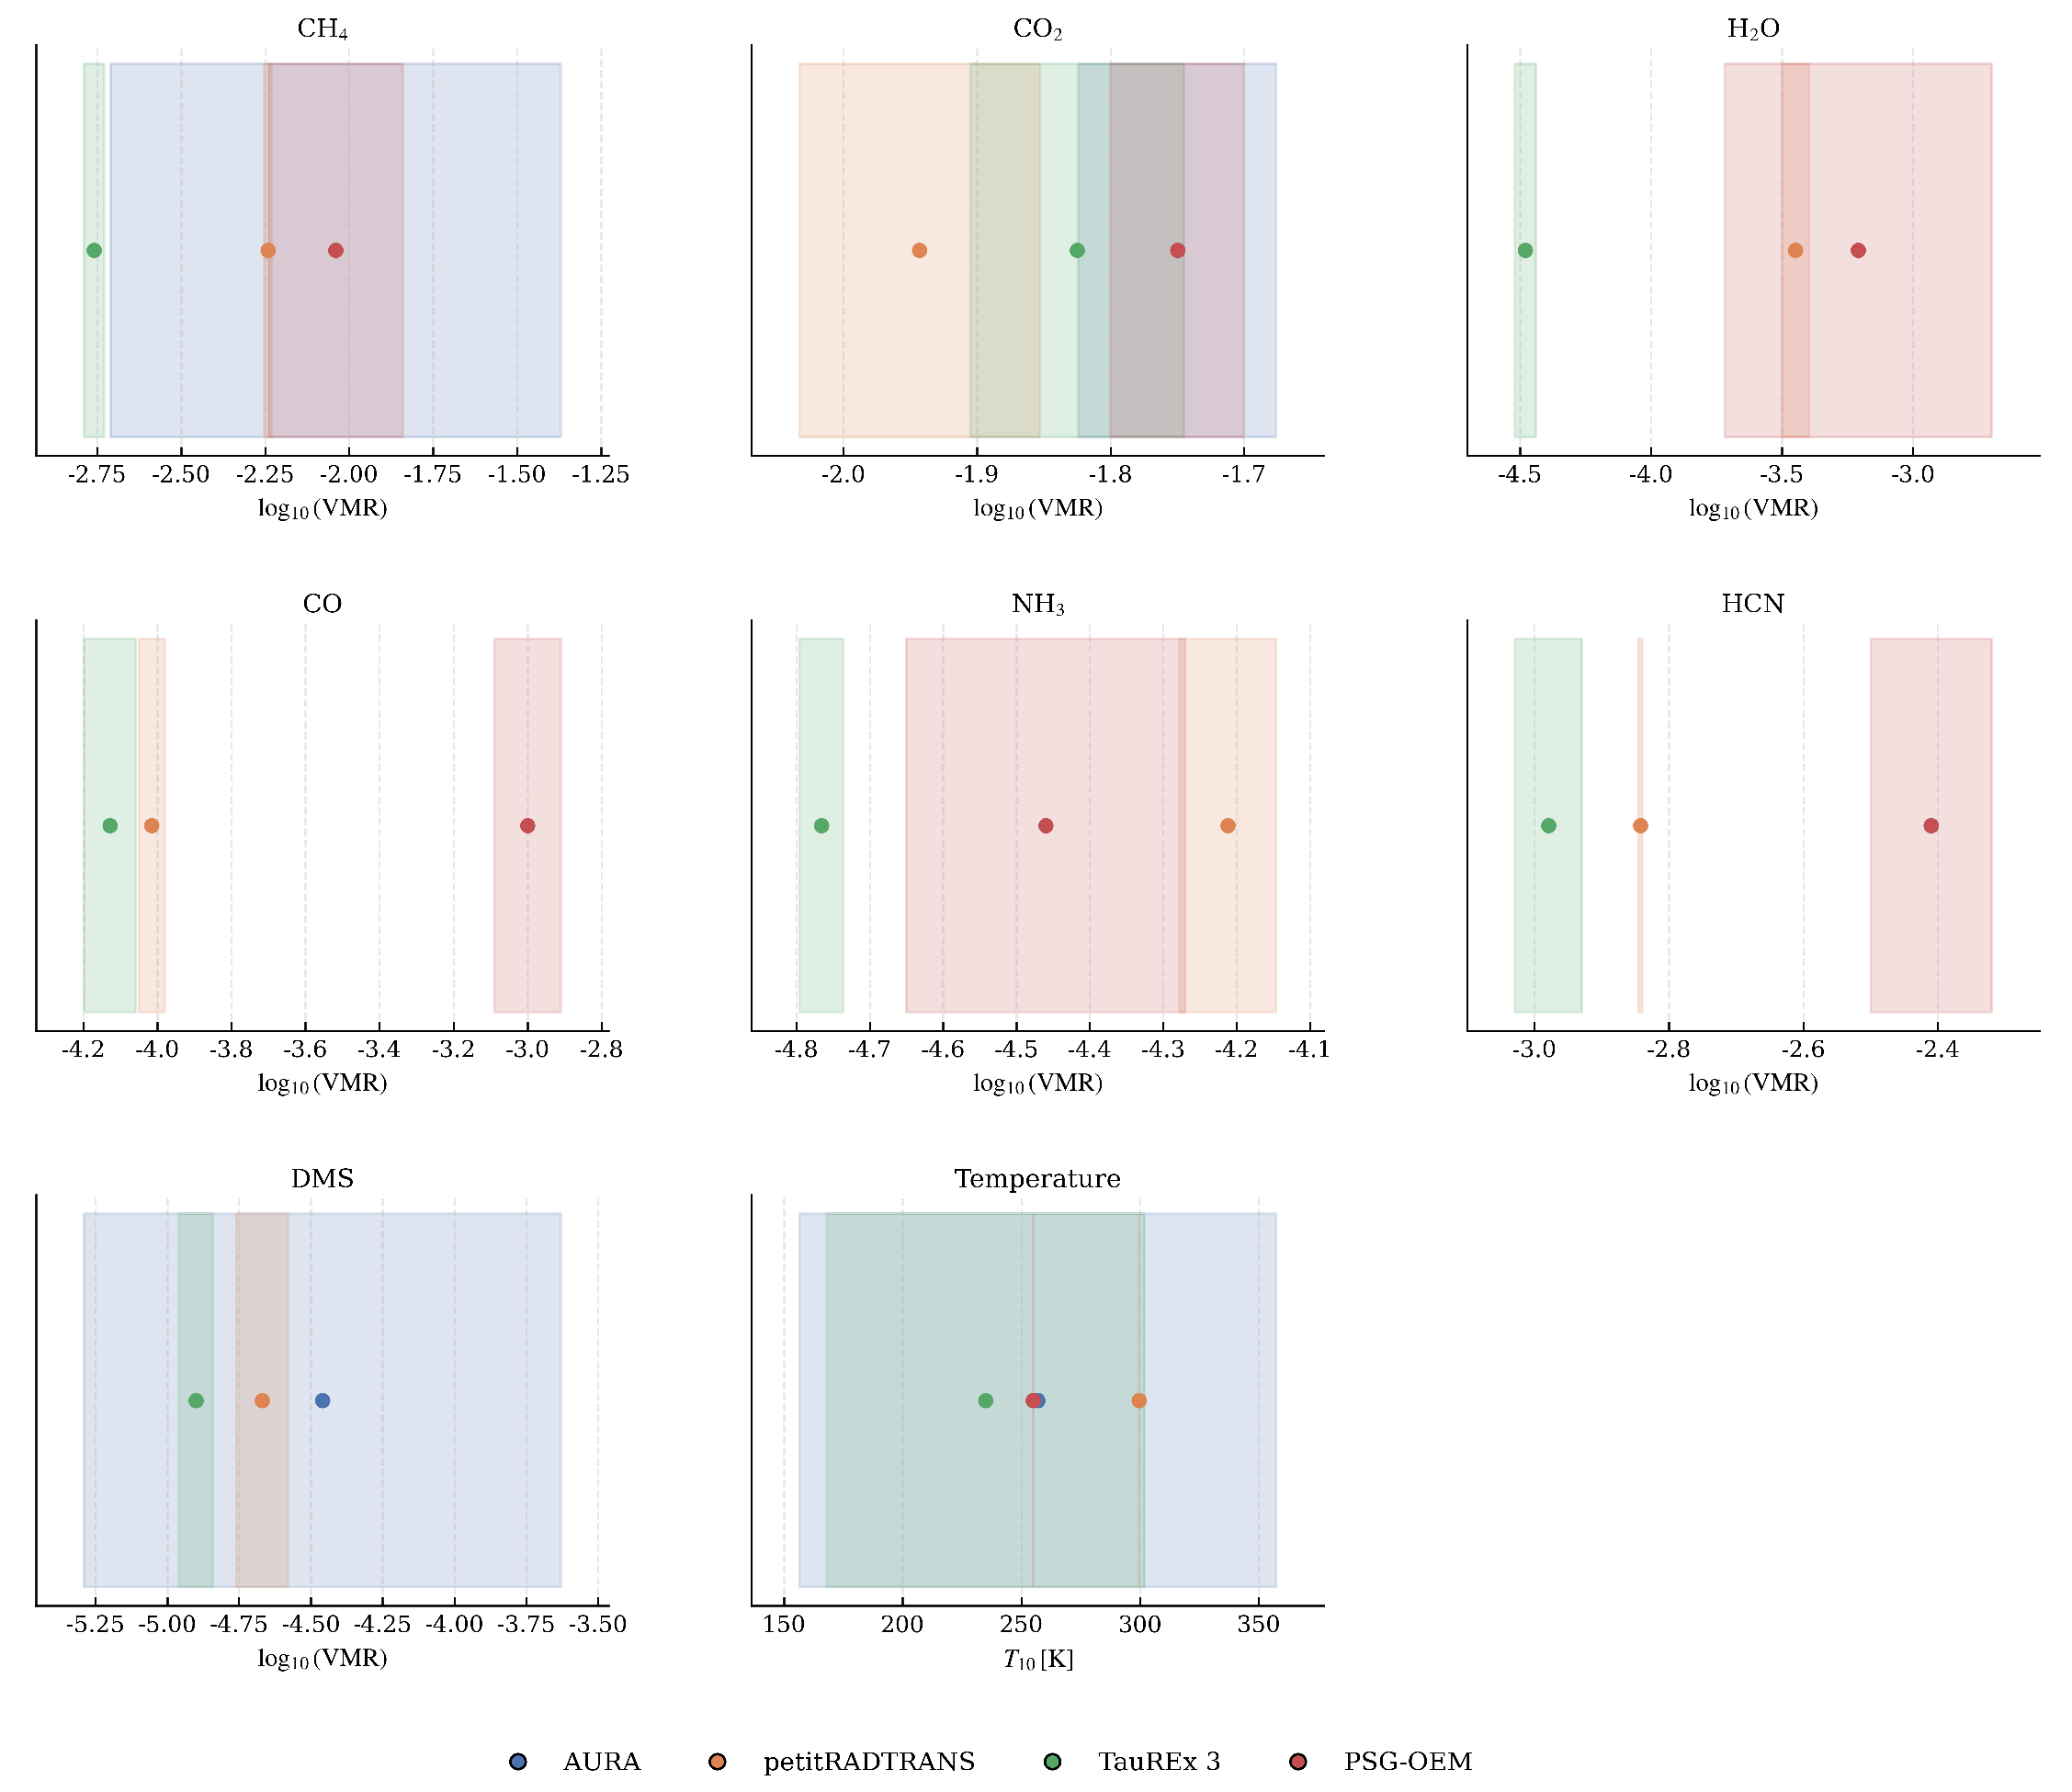
Table 1.
Adopted stellar and planetary parameters for the K2-18 system. Values are primarily taken from the NASA Exoplanet Archive and complementary literature.
Table 1.
Adopted stellar and planetary parameters for the K2-18 system. Values are primarily taken from the NASA Exoplanet Archive and complementary literature.
| Category | Parameter (symbol) | Value | Reference |
|---|---|---|---|
| Host star: K2-18 | |||
| Stellar | Spectral type | M2.5V | [6] |
| Stellar | Effective temperature () | K | [1] |
| Stellar | Stellar mass () | [7] | |
| Stellar | Stellar radius () | [1] | |
| Stellar | Metallicity ([Fe/H]) | dex | [1] |
| Stellar | Surface gravity () | (cgs) | [7] |
| Stellar | Distance (d) | pc | [1] |
| Planet: K2-18 b | |||
| Planetary | Planet mass () | [7] | |
| Planetary | Planet radius () | [1] | |
| Planetary | Bulk density () | Derived | |
| Orbital | Orbital period (P) | d | [1] |
| Orbital | Semi-major axis (a) | au | [1] |
| Orbital | Orbital eccentricity (e) | [7] | |
| Orbital | Inclination (i) | [1] | |
| Orbital | Impact parameter (b) | [1] | |
| Transit | Radius ratio () | [1] | |
| Thermal | Equilibrium temperature () | K | [6] |
| Atmosphere | Atmospheric regime | H2-rich | [8] |
Table 2.
Comparison of retrieved molecular abundances for K2-18 b across different retrieval frameworks. All values are expressed as .
Table 2.
Comparison of retrieved molecular abundances for K2-18 b across different retrieval frameworks. All values are expressed as .
| Molecule | AURA | petitRADTRANS | TauREx 3 | PSG-OEM |
|---|---|---|---|---|
| CH4 | ||||
| CO2 | ||||
| H2O | ||||
| CO | ||||
| NH3 | ||||
| HCN | ||||
| DMS | — | |||
| mbar [K] | ||||
| (haze amplitude) | — | |||
| (haze slope) | — |
Note: All abundances are expressed as . The DMS abundance for PSG-OEM could not be retrieved because this molecule is not included in the software database. Likewise, the haze component is not available in that implementation and therefore its value could not be determined.
Disclaimer/Publisher’s Note: The statements, opinions and data contained in all publications are solely those of the individual author(s) and contributor(s) and not of MDPI and/or the editor(s). MDPI and/or the editor(s) disclaim responsibility for any injury to people or property resulting from any ideas, methods, instructions or products referred to in the content. |
© 2026 by the authors. Licensee MDPI, Basel, Switzerland. This article is an open access article distributed under the terms and conditions of the Creative Commons Attribution (CC BY) license (http://creativecommons.org/licenses/by/4.0/).
Copyright: This open access article is published under a Creative Commons CC BY 4.0 license, which permit the free download, distribution, and reuse, provided that the author and preprint are cited in any reuse.


