
Submitted:
19 July 2026
Posted:
21 July 2026
You are already at the latest version
Abstract
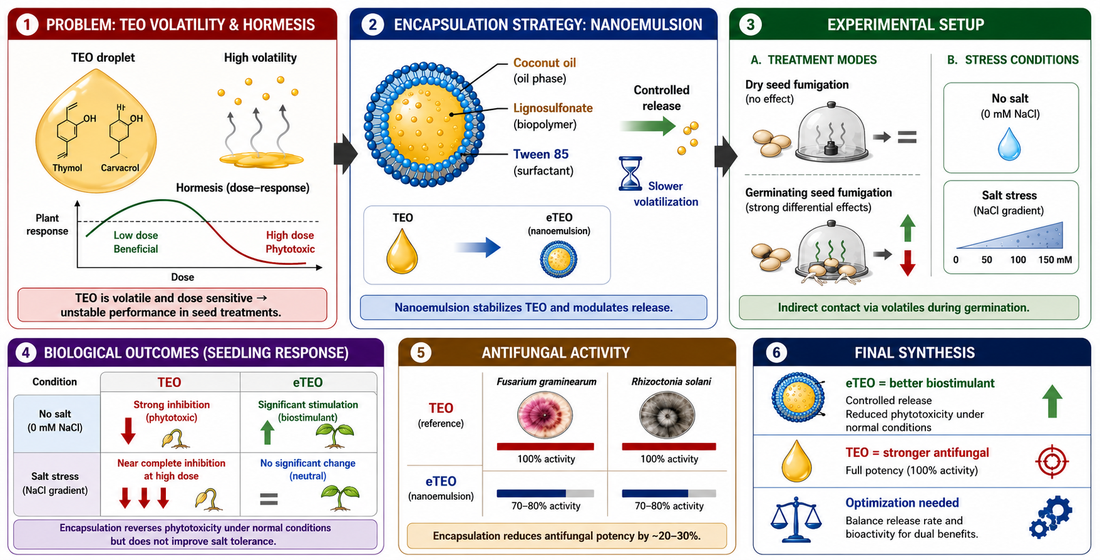
Thyme essential oil (TEO), rich in bioactive compounds such as thymol and carvacrol, has been proposed for seed treatments to control biotic and abiotic stress. Essential oils are highly unstable due to their volatile nature, and they were shown to have a hormetic response, with higher antimicrobial doses being considered phytotoxic. To overcome this, one solution could be to encapsulate them in nanostructured delivery systems, thereby ensuring a slower, controlled release of the bioactive compound. In this study, we investigated the effects of encapsulated and non-encapsulated TEO on mung bean seed germination and seedling growth parameters, as well as on seed tolerance to saline stress, under various conditions. The encapsulated formulation was a nanoemulsion that contained coconut oil, lignosulfonate, and Tween 85. We applied the treatment as indirect contact by fumigation with released volatiles, either to dry seeds or to germinating seeds. The pre-treatment of dry seeds did not have any significant effect. The TEO volatiles released during seed germination had significant inhibitory effects on seedlings, whereas encapsulated TEO (eTEO) significantly stimulated seedling development in the absence of salt stress. Under salt stress, eTEO did not significantly affect salt tolerance, whereas TEO almost completely inhibited seedling development at the highest dose tested or at higher salt concentrations. The better eTEO dose had antifungal activity against Fusarium graminearum and Rhizoctonia solani, but 20-30% lower than TEO. In conclusion, the nanoemulsion eTEO has the potential to be a better biostimulant than TEO under certain conditions, due to the controlled release of active ingredients, but further optimization is needed in order to maximize the antifungal effects.
Keywords:
thymol
; lignosulphonate
; coconut oil
; tween 85
; Vigna radiata
; seed germination
; seedling growth
; Fusarium graminearum
; Rhizoctonia solani
1. Introduction
Plant biostimulants (PB) have gained considerable attention as innovative solutions that support sustainable crop production. PB are defined by the EU Regulation 2019/1009, as “products that aim solely at improving the plants’ nutrient use efficiency, tolerance to abiotic stress, quality traits or increasing the availability of confined nutrients in the soil or rhizosphere” [1]. The category of PB includes a large variety of organic and anorganic compounds with remarkable potential in triggering beneficial physiologic responses in plants, significantly improving plant’s ability to resist both abiotic [2] and biotic stress [3]. Among the abiotic stresses, high soil salinity was found responsible for reducing seed germination and root development by reducing nutrient availability [4]. Fungal phytopathogens induce major biotic stress with impact on human health and species like Fusarium graminearum and Rhizoctonia solani are among the most significant soil born plant phytopathogens causing root rot, damping off and yield losses [5]. Seed priming increasingly arises as highly sustainable method to increase germination rate (GR), enhance stress tolerance and ultimately improve plant growth [6].
Among the large variety of organic compounds known to possess biostimulant activity, essential oils (EO) have attracted intensive interest. From a chemical point of view, they are complex matrices containing more than 200 volatile and semi volatile compounds. From the biological point of view, they were found to possess antioxidant, antibacterial, antimicrobial, anti-inflammatory and antifungal activities [7].
Essential oils have been tested by various means on plants, from seed fumigation and effects on seed germination to foliar application on mature plants. Among the positive results, recently, Piga et al [8] investigated the biostimulant effect of Lavandula angustifolia essential oil, proving its potential to enhance growth of radish at a maximal dose of 2%, while having a phytotoxic effect at doses higher than 4%. The antimicrobial effect was also investigated, the inhibition index increasing proportional to essential oil concentration. Rosmarinus officinalis L. essential oil was found to enhance salt stress tolerance of durum wheat seedlings [9] when using concentrations up to 5 ppm. Bean seed primed with 0.05 mL/L Lippia alba EO showed increased salt tolerance during germination, and the mature plants exhibited higher water uptake, increased chlorophylls, proline content and salt tolerance index [10].
Thymus vulgaris EO (TEO) was demonstrated to have antifungal activity against plant pathogens [11], i.e., it inhibited mycelium growth of R. solani up to 100% at a 4 μL/Petri dose. Omar et al. demonstrated that TEO inhibited the growth of Fusarium oxysporum at concentrations of 75.5 mg/mL [12]. Growth enhancing effects of TEO on wheat seeds under drought stress were demonstrated by Ben-Jabeur et al [13]. These properties are associated with the chemical composition of TEO. A plethora of studies were conducted in this regard, all pointing that the volatile active ingredients belong to the chemical classes of phenolic derivatives (thymol, carvacrol), terpenoids (p-cymene, γ-terpinene), terpene alcohols (linanool, geraniol), ketones (thymolquinone) and ethers (thymol methyl-ether, carvacrol methyl-ether) [14]. It is worth mentioning that the chemical composition of EO varies significantly from one study to another, depending on geographical and environmental conditions, as well as on factors such as genetic diversity, harvesting period or EO extraction method [15].
Using essential oils has some major disadvantages owing to their highly volatile nature, i.e., are prone to degradation and have a dose dependent hormetic response where higher, antimicrobial, doses could have phytotoxic effects [16]. To overcome this disadvantages, various encapsulation techniques have been developed in recent years, to ensure a controlled release of volatiles as well as its protection. Reducing the size of encapsulated EO to nanometer scale is well known to improve their bioactivity and bioavailability [17]. Haghaninia et al. [18] encapsulated rosemary essential oil in a chitosan matrix that significantly improved lettuce growth under salinity stress when applied foliar at a concentration up to 500 ppm. In another study, β-cyclodextrin inclusion complexes of fennel and basil EO were found to have insecticidal properties when tested on the Colorado potato beetle as a model pest [19]. There were also negative effects of some encapsulated EO reported, e.g., inhibition of seed germination by EO encapsulated through coacervation [20,21]. There are not many studies that reported seedling growth stimulation by EO, either encapsulated or non-encapsulated.
Nanoemulsions (NE) emerged in recent years as promising delivery systems in the medical, food, and agricultural industry. NE are considered kinetically stable systems, containing oil, water, and surfactant in different proportions, with droplet (particle) sizes ranging from 20 to 200 nm [22] due to their ability to assure a slow, controlled release of the active ingredients, which prevents excessive accumulation, and protects it against degradation.
TEO NE were found to have antifungal activities against pathogens like Candida albicans, Candida glabrata, Aspergillus fumigatus [23], Solanum lycopersicum [24] or Botrytis cinerea [25]. Kourdova et al [26] developed a rhamnolipid-stabilized TEO NE that stimulated Arabidopsis thaliana immune system. Maize growth was also found to be promoted by a TEO NE in a study conducted by Zaki et al [27].
To the best of our knowledge, few studies investigated the antifungal activity of TEO NE together with the impact on seed germination. Guedes et al. proved that a TEO NE was able to completely inhibit Fusarium oxysporum mycelial growth at concentration values higher than 0.750 mg/mL, with no phytotoxic effects on tomato seeds [28]. In another study [29], commercially available thymol based nanoemulsions showed the same behaviour against the same pathogen and model plant, at a concentration of 0.375 mg/mL. In these studies, the seed incubation with the TEO NE was only 10 min., accounting as short-period seed priming. The TEO NE dose during germination could only be estimated and it is not very evident how the fungal inhibitory doses correlate with the seed germination. Foliar application of TEO NE reduced Alternaria radicina growth at a concentration of 75 µL/100 mL and promoted growth of coriander plants at a concentration of 50 µL/100 mL [30]. No studies that address the antifungal and biostimulant effect of TEO under saline stress were found.
Although providing valuable information, many studies lack details with respect to the exact dose applied (for example, they provide only concentration and not total volume or dose). Many studies only monitored the impact on the germination parameters, without assessing effects on seedling growth. It is generally observed that germination is much less affected by EO compared with seedling development, therefore the conclusions might be biased. Moreover, most studies applied the encapsulated EO by direct contact with the seeds/plants, with contributing effects by less/non-volatile compounds and/or other components of the formulations. Less studies tested the effects of EO through fumigation by released volatiles, either ante- or during seed germination [31,32,33].
Considering the aspects mentioned above, the aim of this study was to investigate the fumigation effects of volatiles released from the encapsulated (eTEO) and non-encapsulated TEO on Mung bean seed germination and seedling growth parameters in the presence and absence of saline stress, at doses that induce high phytopathogen inhibition.
For encapsulation, we considered the valorization of sodium lignosulphonate (NaLS), which is a byproduct of wood sulphite pulping, a process that depolymerizes the lignin structure by introducing sulphonate groups onto the fragments [34]. Since the lignin structure is mostly preserved, the lignosulphonates obtained from the sulphite process are amphiphilic in nature, being able to decrease the surface tension of water, which allows them to stabilize water-in oil (nano)emulsions [35]. Lignosulfonates have several advantages, such as costs and lower environmental impacts, that compensate their lower efficiency as surfactants. There are not many studies that use NaLS for essential oil encapsulation. NaLS was used to encapsulate thymol [36], eucalyptus oil [37], tea tree oil [38], and limonene, a monocyclic monoterpene found in high amounts in the essential oils of various citric peels [39].
2. Results
2.1. Sodium Lignosulphonate Characterization
2.1.1. Fourier Transform Infrared Spectroscopy (FTIR) Analysis
The FTIR spectrum of the NaLS powder is presented in Figure 1A and the most important identified bands are summarized in Table 1.
The broad band at 3363 cm-1 corresponds to phenolic -OH stretching vibrations. Aliphatic and aromatic C-H stretching vibrations are present at 2935 and 2846 cm-1, respectively. C=C and C=O stretching vibrations corresponding to guaiacyl and syringyl lignin units are present in the region 1600-1500 cm-1 [40]. At 1415 cm-1 the characteristic absorption band for aromatic C=C breathing vibration is present [41]. Characteristic bands of sulphonate group are seen at 1031 cm-1 (S=O stretching vibration) [42] and at 621 cm-1 (C-S stretching vibration [43]. The identified bands in FTIR analysis reveal that the analyzed compound has a lignin backbone with attached sulphonate groups.
2.1.2. Critical Aggregation Concentration of NaLS
For the determination of the critical aggregation concentration of NaLS, UV-Vis spectrometry was used. In the concentration range between 0 and 0.025% w/v a sharp increase in the absorbance values was observed. The inflection point was found to be at a concentration value of 0.025% w/v. At higher concentration values (0.05-0.2% w/v) the absorbance values increased in a less pronounced manner, as seen in Figure 1B.
At lower NaLS concentrations (0-0.025% w/v), the molecules start to orient in a manner favorable to aggregation. The hydrophobic moieties participate to hydrophobic interactions, reducing the hydrophobic functional groups exposure to aqueous environment. At critical aggregation concentration (0.025% w/v) the molecules begin to assemble. In the higher concentration domain, H-bonds participate as well in the formation of larger structures, and the absorbance values increase slower. The obtained value for the critical aggregation concentration was close to the ones presented in the literature [44].
2.1.3. Tensioactive Properties of NaLS
Surface tension measurements at the water-air interface were performed in order to determine the tensioactive behavior of NaLS. A decrease in the surface tension values from 73.306 ± 0.053 mN/m to 43.090 ± 0.325 mN/m was observed when the concentration of NaLS increased from 1 to 10% w/v.
The reduction of the surface tension of water observed is caused by the aggregation of NaLS molecules in aqueous environment. Due to its amphiphilic structure, the hydrophilic groups (like sulphite and hydroxyl) concentrate at the surface of the aggregate and the hydrophobic groups (such as aromatic lignin backbone) form the core of the aggregate [34]. These results highlight the possibility to use NaLS as an adjuvant in systems where decreasing the surface tension is needed, such as nanoemulsions.
2.2. Nanoemulsion Preparation and Characterization
One objective of this study was to prepare a homogenous NE containing TEO, with particle size lower than 200 nm, and good stability, for the slow release of volatiles. A phase inversion strategy was chosen for the preparation of the TEO nanoemulsions. This type of emulsification has the advantages of being a low energy method that implies the spontaneous formation of fine oil droplets dispersed in an aqueous continuous phase [45]. Tween 85 (polyoxyethylene sorbitan trioleate) was selected as an emulsifying agent in this study. Tween 85 is a nonionic surfactant with hydrophilic polyethylene glycol chain and three hydrophobic oleic acid tails. It has a hydrophilic–lipophilic balance (HLB) value of 11, close to the one required by essential oils [46]. Thyme essential oil was diluted in the fractionated coconut oil (MCT), which contains medium chain triglycerides. This dilution was essential to minimize density differences between the two phases, which could destabilize the emulsion through gravitational forces [47]. The aqueous phase consisted of a 0.1% v/v NaLS solution. NaLS was used as a negatively charged adjuvant, to enhance the stability of the nanostructured system. Its concentration for this study was selected higher than the critical aggregation concentration value.
The effect of the aqueous phase fraction on the emulsion parameters was studied at constant surfactant concentration (10% v/v). The effect of the surfactant fraction was studied at constant aqueous phase composition (65% v/v). Particle size (PS), polydispersity index (PDI) and Zeta potential (ZP) were investigated.
Table 2 presents the composition of the prepared nanoemulsions as well as their physicochemical properties immediately after preparation (t0) and after twenty-four hours (t24).
The parameters presented in Table 2 are representative for addressing NE stability. The results obtained in the first optimization step revealed that the aqueous phase fraction had a major influence on the emulsion stability. The first set of optimizations, i.e., variation of the aqueous phase fraction, revealed that the aqueous phase fraction had a major influence on the emulsion stability, i.e., an intermediate aqueous phase composition was required to form stable systems. In this step, the aqueous phase varied between 50 and 75%, keeping the surfactant concentration constant at 10% and varying the oil phase composition.
At the lowest (50%, NE1) and highest (75%, NE3) aqueous phase composition, the initial PS and PDI were 815.430 ± 131.525 nm and 0.390 ± 0.201, respectively, for NE1, and 120.333 ± 5.165 nm and 0.186 ± 0.068, respectively, for NE3. The Zeta potential value was −3.750 ± 0.000 mV for NE1 and −11.260 ± 0.000 mV for NE3. Both formulations, NE1 and NE3, presented creaming instability phenomenon in less than 24 hours. At low water content and high oil phase (NE1) the surfactant cannot stabilize the interface between the aqueous and the oil phase and it is unable to complete the emulsification process. This results in large droplets, high PDI values and a low absolute value of ZP, which reveals that coalescence cannot be suppressed by electrostatic repulsions. At high aqueous fraction and low oil content (NE3), all tested parameters decreased. Although an improvement in the zeta potential value is observed, creaming occurs within 24 h.
NE2, with 65% aqueous phase, exhibited the particle sizes in the nanometer range (175.996 ± 2.381 nm) and ZP (−16.896 ± 0.012 mV) and acceptable PDI value (0.216 ± 0.023). In 24 hours, the PS and PDI decreased to 165.390 ± 2.771 nm and 0.170 ± 0.040, respectively, whereas ZP remained stable. Intermediate aqueous fraction and oil content provides the optimal composition for colloidal stability. Particle size lower than 200 nm positions the formulation within the nanotechnology standards, much lower than some of those presented in the literature for Tween 85 stabilized nanoemulsions [48]. PDI values lower than 0.300 are characteristic for homogenous systems, with a monodisperse distribution of the oil within the aqueous phase. In this regard, a key component is MCT, well known to act as Ostwald ripening inhibitor, which alleviates NE instability associated phenomena. The decrease of PS and PDI values observed from 0 to 24h may be attributed to the rearrangement of the surfactant and NaLS orientation at the surface of the NE oil droplets. The constant values of ZP over the tested 24 hours indicate a stable system. Since Tween 85 is a nonionic surfactant, the negative charge presented at the surface of the droplets is attributed to the sulphonate groups of NaLS present in the aqueous phase.
Taking the observations from above into account, the effect of the surfactant fraction (v/v) was further investigated. NE2, containing 65% v/v aqueous phase was chosen as the starting point for the next optimizations, regarding the surfactant content. NE4, containing 5% v/v Tween 85 presented phase separation, i.e., instability, within 15 min. from preparation. This indicated that a higher surfactant to oil ratio was needed. Higher (15% v/v) surfactant concentration in NE5 gave acceptable values for all investigated parameters. PS varied from 134.086 ± 25.921 to 115.833 ± 1.085 nm, PDI from 0.160 ± 0.113 to 0.189 ± 0.006, and zeta potential from -15.556 ± 1.258 to -14.993 ± 1.875 mV in 24 h. Nevertheless, we chose NE2 for further tests, as a higher content of surfactant in NE5 compared to NE2 would increase the cost of NE, and might have higher toxic effects in certain applications. Another criterion was that NE2 accommodated more TEO than NE5 (1.19% and 0.95%, respectively).
In conclusion, the nanoemulsion (NE2) used for further tests had the following composition: 65 % (v/v) aqueous phase, 10% (v/v) surfactant, 23.81 % (v/v) carrier oil and 1.19 % (v/v) essential oil.
Optical microscopy analysis of NE2 (thereafter named eTEO) revealed a homogeneous distribution of small particles in both the undiluted and diluted samples (Figure S1A, B). These observations are consistent with the reported findings on nanoemulsions based on thyme essential oil stabilized with non-ionic surfactants, which describe the formation of homogeneous systems with uniform droplet distribution and high physical stability [49].
2.3. Composition Profile and Rate of Volatile Release from TEO and eTEO
The diversity of volatile compounds found in essential oil matrices are of great importance, directly influencing their biological activities. Therefore, accurate identification of the volatile compound composition is essential. Volatile compound analysis was performed using a SPME-GC-MS assay (chromatograms in Figure S2). The volatile constituents identified (Table 3) represent a total of 99.87 % of the total TEO composition. The major components identified were γ-terpinene (33%), m-cymene (29.05 %), thymol (21.51 %) and carvacrol (8.64 %). These results agree with previous reported studies, where the major components of TEO were also γ-terpinene, m-cymene, thymol, and carvacrol [50,51]. Variability from literature may result from a large range of factors such as harvest time, genotype, plant growth stage, geographic origin, soil composition and extraction methods, among others [15]. For example, Hudaib et al [52] reported that when harvesting thyme plants during winter season high content of γ-terpinene, m-cymene and low content of thymol and carvacrol are present in the analyzed TEO. Considering the fact that γ-terpinene and m-cymene are considered thymol and carvacrol precursors, it is expected that environmental winter conditions (such as reduced temperature and light) may affect the biosynthesis of thymol, favoring the accumulation of the hydrocarbon precursors over the phenolic products.
Thymol release from TEO and eTEO was monitored initially (t0 = 0 h) and at (t24 = 24 h, by SPME-GC-MS (Figure S2). In the case of TEO, the released thymol varied from 487.24 ± 25.49 µg/ mL (t0) to 2486.02 ± 94.89 µg/ mL (t24), whereas for eTEO it varied from 285.46 ± 11.45 µg/ mL (t0) to 319.04 ± 7.09 µg/ mL (t24), as shown in Figure 2. The values indicate that within the first 24 h, TEO and eTEO released approx. 2000 µg/ mL and 34 µg/ mL thymol, respectively, i.e., TEO released approx. 60× more thymol than eTEO.
The encapsulating agent modifies both the partitioning pattern of volatile compounds across the oil – water interface and their diffusion from the encapsulation system into the headspace. This behavior supports the eTEO contribution to avoid premature release of volatile components of essential oil, assuring their slow and controlled release.
2.4. Seed Germination Assay
2.4.1. Indirect Contact, 72h Pretreatment by Volatile Fumigation of the Dry Seeds
For the indirect approach (fumigation) of pretreatment of the dry Mung bean seeds, we selected three doses within a large interval, including a dose with fungistatic and fungicide effects on phytopathogens, based on our previous results [53]. When a 72-h pretreatment with the volatile compounds released from TEO or eTEO was applied to the dry seeds, the germination percentage (GP) was 100% for all the tested treatments (Figure 3A).
The germination energy (GE) measured at one third of the tested period (Figure 3B) was 100% for most cases, with the lowest value (93.333%) obtained for the highest dose of TEO. GR fluctuations from 87.0 ± 4.7%/day (O1) to 97.777 ± 1.111%/day (E2) were observed (Figure 3C). The mean germination time (MGT) varied from 1.030 ± 0.016 (E2) to 1.183 ± 0.060 days (E1) as seen in Figure 3C. For the vigour index (Figure 3D), the highest value was obtained at the highest dose of eTEO, E3 (486.443 ± 55.748) and the lowest for the lowest dose of TEO, O1 (368.520 ± 30.390).
No significant differences were observed for any of the morphological parameters studied. Seedling length (Figure 4C) varied from 3.685 ± 0.303 cm (O1, the lowest TEO dose) to 4.864 ± 0.557 cm (E3, the highest eTEO dose). Same trend was observed for root length (Figure 4A), and the values varied between 2.596 ± 0.176 cm (O1) and 3.630 ± 0.466 cm (E3). The values for shoot length (Figure 4B) varied between 1.065 ± 0.118 cm (O1) and 1.406 ± 0.171 cm (O2).
The results are in line with the observation from the Introduction that most studies reported minimal effect of fumigation pre-treatment on seed germination and seedling development.
2.3.2. Indirect Contact–Fumigation During Seed Germination, no Pretreatment
We selected the highest dose from the experiment above D1 = 0.439 µL/cm3, as well as a 4× higher dose (D2 = 1.756 µL/cm3) based on our previous antifungal reported effects of TEO [53], in order to test if the fumigation had an effect during seed germination, in the absence or presence of salt stress. The seedling aspects can be seen in Figure S3.
In the absence of the salt stress, TEO significantly decreased most of the growth parameters (vigour index, length, weight), and at the 1.756 µL/cm3 dose it completely inhibited the shoot development. eTEO significantly increased the vigour index, root, shoot, and seedling length and did not affect significantly the weight compared to the control, at both treatment doses (Figure 5, Figure 6 and Figure 7). The lower dose of eTEO slightly stimulated the root weight. The germination percentage was not significantly affected (Figure 5A-D).
Salt stress did not have a major impact on GP. In the presence of 50 mM salt stress, both TEO (OS) and eTEO (ES) at the 0.439 µL/cm3 dose increased GP compared to control (CS), which was slightly decreased. GP varied from 86.666 ± 3.333% for CS to 100.000 ± 0.000% for both TEO and eTEO treatments (Figure 5A). At the higher dose tested (1.756 µL/cm3) and 50 mM NaCl, TEO slightly decreased GP, whereas eTEO had a level closer to the control, but not statistically significant for neither TEO nor eTEO. GP varied from 86.667 ± 8.819% (OS) to 100.000 ± 0.000% (ES) (Figure 5B). At 100 mM NaCl, OS significantly inhibited GP compared to CS, especially at the 0.439 µL/cm3 dose, whereas ES did not have a significant impact (Figure 5C, D).
Salt stress significantly reduced the vigor index (VI) compared to the control CS, both at 50 and at 100 mM NaCl (Figure 5E-H). In the case of 50 mM NaCl, the two doses tested behaved differently with respect to the VI induced: at the lower dose (0.439 µL/cm3), TEO induced a similar VI value as the control CS (178.962 ± 32.721) and eTEO slightly increased the value to 267.786 ± 29.572 (ES), but not statistically significant (Figure 5E); at the higher dose (1.756 µL/cm3), TEO significantly inhibited VI from the control value CS (387.534 ± 36.458) down to 33.025 ± 2.416 (OS), whereas eTEO stimulated VI up to 433.530 ± 17.476 (Figure 5F).
At 100 mM NaCl, the two doses behaved similarly, i.e., TEO significantly reduced VI (from 213.795 ± 6.088 to 6.575 ± 3.796 at 0.439 µL/cm3 TEO and to 20.490 ± 0.502 at 1.756 µL/cm3 TEO), whereas eTEO reduced much less VI – 184.155 ± 6.712 at 0.439 µL/cm3 eTEO and 163.940 ± 7.332 at 1.756 µL/cm3 TEO (Figure 5G, H).
The salt stress negatively affected most of the growth parameters, with the lowest decrease induced to shoot and seedling weight (Figure 6 and Figure 7).
In the presence of moderate salt stress (50 mM NaCl), the 0.439 µL/cm3 dose did not have a significant impact on either of the growth parameters (length, weight), although eTEO (ES) induced a slight increase (Figure 6, 7A, E, I). The root length varied from 1.328 ± 0.425 cm (OS) to 1.930 ± 0.249 cm (ES), the shoot length varied from 0.533 ± 0.062 cm (CS) to 0.747 ± 0.046 cm (ES), and the seedling length varied from 1.874 ± 0.486 cm (OS) to 2.677 ± 0.295 cm (ES). The root weight varied between 0.014 ± 0.005 g (OS) and 0.028 ± 0.004 g (ES), the shoot weight varied between 0.157 ± 0.006 g (CS) and 0.170 ± 0.008 g (ES), and the seedling weight varied from 0.174 ± 0.031 g (OS) to 0.199 ± 0.012g (ES).
At higher salt concentration (100 mM NaCl) or higher fumigation dose (1.756 µL/cm3) in the presence of salt, TEO and eTEO had different behavior, similarly to that in the absence of salt. TEO significantly inhibited almost all the growth parameters, especially the shoot, whereas eTEO did not affect significantly the seedling growth, compared to the control CS.
In the presence of 50 mM NaCl and 1.756 µL/cm3 treatment dose (Figure 6B), the root length had the following values: 2.956 ± 0.144 cm (CS), 0.392 ± 0.012 cm (OS), 3.346 ± 0.158 cm (ES); the seedling length (Figure 6J) had the values 4.056 ± 0.261 cm (CS), 0.392 ± 0.012 cm (OS), 4.335 ± 0.175 cm (ES). TEO completely inhibited the shoot development, and the length could not be measured (Figure 6F), whereas eTEO did not affect significantly the shoot length (0.990 ± 0.017 cm versus 1.10 ± 0.12 cm for CS). The root weight (Figure 7B) had the following values: 0.045 ± 0.003 g (CS), 0.005 ± 0.001 g (OS), and 0.057 ± 0.008 (ES). The shoot weight values (Figure 7F) were 0.205 ± 0.008 g (CS), 0 ± 0 (OS), and 0.252 ± 0.029 g (ES), and the seedling weight values were 0.250 ± 0.010 g (CS), 0.005 ± 0.001 g (OS), and 0.310 ± 0.037 g (ES), as depicted in Figure 7J.
At 100 mM NaCl and 0.439 µL/cm3 dose (Figure 6C), the root length values were: 1.511 ± 0.079 cm (CS), 0.066 ± 0.038 cm (OS), and 1.444 ± 0.046 cm (ES); the shoot length values (Figure 6G) were: 0.627 ± 0.018 cm (CS) and 0.398 ± 0.021 (ES). For the seeds treated with 0.439 µL/cm3 TEO (OS) no shoot length could be measured. The seedling length values (Figure 6K) were: 2.138 ± 0.061 cm (CS), 0.066 ± 0.038 cm (OS), and 1.842 ± 0.067 (ES).
The root weight had the following values (Figure 7C): 0.030 ± 0.001 g (CS), 0.005 ± 0.003 g (OS), and 0.027 ± 0.001 g (ES). The shoot weight values (Figure 7G) were: 0.206 ± 0.011 g (CS), 0 ± 0 g (OS), and 0.196 ± 0.008 g (OS). The seedling weight values (Figure 7K) were: 0.236 ± 0.010 g (CS), 0.005 ± 0.003 g (OS) and 0.223 ± 0.009 g (ES).
At 100 mM NaCl and 1.756 µL/cm3 dose (Figure 6D) the root length values were: 1.511 ± 0.079 cm (CS), 0.205 ± 0.005 cm (OS), and 1.134 ± 0.054 cm (ES); the shoot length values (Figure 6H) were: 0.0627 ± 0.018 cm (CS) and 0.505 ± 0.019 cm (ES). For the seeds treated with TEO (OS) no shoot length could be measured. The seedling length values (Figure 6L) were: 2.138 ± 0.061 cm (CS), 0.205 ± 0.005 cm (OS), and 1.639 ± 0.073 cm (ES).
The root weight had the following values (Figure 7D): 0.030 ± 0.001 g (CS), 0.008 ± 0.000 g (OS), 0.033 ± 0.001 g (ES). The shoot weight values (Figure 7K) were: 0.206 ± 0.011 g (CS), 0 ± 0 (OS), and 0.213 ± 0.001 g (ES). The seedling weight values (Figure 7L) were: 0.223 ± 0.023 cm (CS), 0.008 ± 0.000 cm (OS), and 0.246 ± 0.001 cm (ES).
The results indicate that the developed emulsion eTEO could be used at least up to 1.756 µL/cm3 for volatile release with positive or at least no/minimal effects on Mung seed germination and seedling development. This observation is in contrast to the non-encapsulated TEO, which inhibited the Mung seedling development under most of the tested conditions. The difference is most probably due to the much slower release from eTEO compared to TEO, as evidenced by GC-MS.
2.4. Antifungal Effects
The optimal plant treatment based on essential oils should ideally have both a beneficial effect on the plants, and an inhibitory effect on plant pathogens. Therefore, we tested the effect of the volatiles released from TEO and eTEO at several doses of essential oil equivalents on two fungal pathogens, F. graminearum and R. solani. These species are known to infect mung beans, therefore are relevant for the seed experiments employed. As can be seen in Figure 8, TEO inhibited almost completely the growth of both strains, at TEO doses higher than D4 (0.122 µL TEO/cm3 air). F. graminearum was more sensitive than R. solani to TEO, at doses lower than D3. The inhibition induced by eTEO was lower than that of TEO at all doses, but the difference between eTEO and TEO decreased as the dose increased. At the highest dose tested on the fungi (D7 = 0.439 µL TEO/cm3), which corresponded to the lower dose tested on mung seeds, eTEO inhibited F. graminearum 86 ± 3% and R. solani 81 ± 6%. This inhibition corresponded to a D3 dose of TEO (0.049 µL/cm3) in the case of F. graminearum and to a dose between D2 and D3 (between 0.027 and 0.049 µL/cm3) in the case of R. solani). The lower inhibition by eTEO compared to TEO is due to the slower release of volatiles. Although apparently a disadvantage, the slower release could have an effect on longer term under real life conditions, such as more open environments. Unfortunately, we could not perform under the same conditions, the test at the 4× higher dose tested on seeds, due to technical restrictions imposed by the high volume of emulsion needed. We estimate that at this dose, which did not have a negative effect on the seedlings, the fungal inhibition induced by eTEO should approach 100%.
Optical microscopy images (Figure 9) highlighted the morphological differences between the phytopathogenic fungi grown in the absence of TEO or eTEO and in the presence of D7 – 0.439 µL/cm3 eTEO. F. graminearum control culture revealed a well-developed mycelium consisting of hyaline, septate, and branched hyphae, with numerous vacuolated hyphal compartments and spherical vesicles. In contrast, the culture exposed to D7 – 0.439 µL/cm3 eTEO presented a reduction in enlarged hyphal structures. Because similar differentiated cells have been associated with trichothecene biosynthesis in F. graminearum, their reduced occurrence may indicate that eTEO interferes not only with mycelial growth but also with cellular differentiation linked to secondary metabolism [54,55]. In the control culture of R. solani, the mycelium presented highly branched hyphae associated with numerous monilioid cells, distributed both intercalary and terminally along the hyphae. These structures, ranging in shape from globular to ellipsoidal, represent precursors of sclerotia [56,57]. In contrast, R. solani grown in the presence of D7 – 0.439 µL/cm3 eTEO exhibited a less branched hyphae arranged in a sparser network. Furthermore, the number of monilioid cells was considerably reduced compared to the control. These changes suggest that the treatment with D7 – 0.439 µL/cm3 eTEO had a possible inhibitory effect on morphogenesis and the fungus’s ability to form survival-related structures.
3. Materials and Methods
3.1. Sodium Lignosulphonate Characterization
3.1.1. Fourier Transform Infrared Spectroscopy (FTIR) Analysis
FTIR spectrum of NaLS was recorded using a IRTracer-100 spectrometer (Shimadzu, Kyoto, Japan) operated in attenuated total reflectance (ATR) mode. The spectrum was collected as an average of 45 scans, in the 400-4000 cm-1 region, at a spectral resolution of 4 cm-1 using LabSolutions IR version 2.30 software. The data were plotted using Origin 2018 software.
3.1.2. Tensioactive Properties
For the determination of the tensioactive properties of NaLS, surface tension measurements using the pendant drop method were conducted. Surface tension of different NaLS solutions with concentrations ranging from 0.1 to 1% w/v was measured using an optical tensiometer OCA 50 (DataPhysics Instruments, Filderstadt, Germany). The SCA 20 version 4.5.13 software was used for data analysis. The data were plotted using Origin 2018 software.
3.1.3. Critical Aggregation Concentration
UV-Vis spectroscopy was used to determine the NaLS critical aggregation concentration as described by Qiu [44] using an UV-Vis spectrophotometer UV-VIS-NIR DH-2000-BAL, (Ocean Optics, Orlando, FL, USA). The absorbance of aqueous solutions with concentrations between 0 and 0.2% w/v was measured at 280 nm. The inflection point observed when plotting the obtained absorbance values vs sample concentration represents the critical aggregation concentration. The data were recorded using SpectraSuite software. The data were plotted using Origin 2018 software.
3.2. Nanoemulsion Preparation and Characterization
For the encapsulation of TEO in a nanoemulsion based delivery system, a phase inversion strategy adapted from Ostertag’s work [58] was considered. An organic phase (containing the emulsifier, carrier oil and essential oil) was titrated with an aqueous phase. The components of the organic phase were mixed at room temperature (23 ± 1°C) in a glass vial inserted in a plastic flask, under magnetic stirring at 1000 rpm for 30 min. Afterwards, the aqueous phase was added dropwise under continuous stirring at 1500 rpm and kept for an additional 60 min. The nonionic surfactant Tween 85 (MP biomedical, USA) was selected as emulsifier, fractionated coconut oil (Elemental, Oradea, Romania - MCT) as carrier oil and TEO (Solaris, Ciorogarla, Romania) as the active ingredient. The aqueous phase consisted of a sodium lignosulphonate 0.1% (w/v) solution (NaLS). To determine the optimal NE composition, proportions (v/v) of the most important components (emulsifier, oil and aqueous phase) were varied.
The particle size (PS) and polydispersity index (PDI) were determined by dynamic light scattering with a Particle Size & Zeta Potential Analyzer Amerigo (Cordouan Technologies, Pessac-Bordeaux, France). Prior to analysis, samples were diluted 1:100 (v/v) in double distilled water to avoid multiple scattering effects. Zeta Potential (ζ) was measured to assess the surface charge and electrostatic stability of the emulsion. The measurements were recorded at room temperature, with samples placed in disposable plastic cuvettes. The data were processed using the Amerigo software version 3.2.3.0. based on the Coumulant algorithm for PS and PDI. The emulsion stability was evaluated by measuring the same parameters at 24h after preparation under the same experimental conditions. The values were expressed as mean ± standard deviation of three measurement replicates of the same NE sample.
Light microscopy images were acquired in Bright Field (BF) mode, 40× magnification, using a Leica DM1000 LED optical microscope equipped with a Leica ICC50 W camera (Leica Microsystems CMS GmbH, Wetzlar, Germany). The image acquisition was performed using Leica Application Suite (LAS) V4.13 software (Leica Microsystems Ltd., Heerbrugg, Switzerland).
Additionally, visual observations were made to address any signs of instability phenomena occurring such as phase separation, creaming or sedimentation.
3.3. Volatile Release by GC-MS
To evaluate the time-dependent release of thymol from thyme essential oil and thyme essential oil nanoemulsion, 20 mL glass vials containing either TEO or eTEO samples were sealed with aluminum crimp caps fitted with blue PTFE/white silicone septa and incubated at room temperature for 0 h and 24 h.
Headspace solid-phase microextraction (HS-SPME) was performed using a PDMS/DVB (Polydimethylsiloxane/Divinylbenzene) coated fiber (65 µm, Supelco, Merck, Darmstadt, Germany), conditioned at 230°C for 30 min prior to the first use according to the manufacturer's recommendations. The samples were immersed in a thermostated water bath at 70°C just before the SPME fiber was inserted through the septum into the vial headspace and exposed for 5 min to allow for analyte absorption. An incubation temperature of 70°C was selected based on preliminary experiments, as the extraction at 50°C yielded insufficient analyte signal. Fiber positioning was kept consistent across all extractions to ensure reproducibility. Thermal desorption was performed in the GC injector at 230°C for 5 min in split mode (15:1). Samples were analysed with two replicates per time point.
A stock solution of thymol (Scharlau, Barcelona, Spain) was prepared in methanol (Merck, Darmstadt, Germany), from which working standards were prepared by successive dilution in methanol. For construction of the external calibration curve, 5 µL of each working standard was pipetted into sealed 20 mL extraction vials containing 1 g NaCl (Chimreactiv, Neamt, Romania), and the volume was brought up to 5 mL with ultrapure water. The standard solutions were processed under identical SPME conditions as the samples. For sample vials, 1 µL of TEO or 84 µL of eTEO (equivalent to 1 µL TEO content) was added to identically prepared vials. A fixed volume of 2-octanol (LGC Labor GmbH, Augsburg, Germany) in methanol was added to each vial as internal standard (ISTD).
Volatile analysis was carried out on an Agilent TQ 7000 GC-MS system equipped with a Zebron ZB-FFAP capillary column (30 m × 0.25 mm × 0.25 µm). Helium was used as carrier gas at a constant flow rate of 0.8 mL/min. The GC oven temperature program was: initial hold at 60°C for 2 min; ramp at 2°C /min to 90°C; ramp at 15°C/min to 190°C; ramp at 2°C/min to 205°C; final ramp at 15°C /min to 230°C, held for 5 min. The mass spectrometer was operated in electron ionization (EI) mode at 70 eV, with full-scan acquisition over m/z 20-400, a solvent delay of 3 min, and a transfer line temperature of 230°C.
Data acquisition and processing were performed using Agilent MassHunter software. Compound identification was carried out in MassHunter Qualitative Analysis by comparison of experimental mass spectra with the NIST Mass Spectral Library. Thymol quantification was performed in MassHunter Quantitative Analysis using the peak area ratio of thymol to the 2-octanol internal standard.
3.4. Seed Germination Assay
3.4.1. Indirect Contact, 72h Pretreatment by Volatile Fumigation of the Dry Seeds
Mung bean (Vigna radiata) seeds were sterilized according to [59]. Briefly, the seeds were treated with 95% ethanol for 3 min. and then with a 5% sodium hypochlorite solution for another 3 min. Afterwards, the seeds were washed 10-15 times with sterile double-distilled (dd) water and dried in a laminar flow hood. Ten dry sterilized seeds were placed in 60 mm Petri dishes containing vials with different doses (D1 = 0.0135 µL/cm3; D2 = 0.054 µL/cm3; D3 = 0.439 µL/cm3) of TEO and eTEO. Sterile water was used as a negative control. After 72h of pretreatment (by which the dry seeds were in indirect contact with the volatile compounds released), the seeds were placed in 90 mm Petri dishes coated with sterile cheesecloth, and soaked with 8 mL sterile dd water. The Petri dishes were placed in a growth chamber with controlled light, temperature and humidity (Aralab Fitoclima 600, Aralab, Rio de Mouro, Portugal) using the following parameters: 8 h dark/16 h light 22°C/26°C cycle, with 50% humidity. On day 2, additional 7 mL of sterile dd water was added. After 5 days, the seedlings were photographed and various parameters related to seed germination and seedling development [60] were investigated: GP, GE, GR, MGT, VI, seedling length, root length, and shoot length. Root, shoot, and seedling lengths were measured using the ImageJ software version 1.54d [61]. Each treatment was tested in triplicate, and the parameter values were expressed as mean ± standard error).
3.4.2. Indirect Contact–Fumigation During Seed Germination, no Pretreatment
Ten untreated, dried, sterilized Mung seeds were placed in 140 mm Petri dishes coated with sterile cheesecloth soaked with 20 mL sterile dd water. 90 mm Petri dishes, each containing one of the two doses tested (D1 = 0.439 µL/cm3; D2 = 1.756 µL/cm3) of either TEO or eTEO were placed in the center of the 140 mm Petri dishes. The tests were performed both in the absence and in the presence of saline stress (50 and 100 mM NaCl). For the saline stress experiments, the sterile cheese cloth was soaked in 20 mL saline solutions instead of water. The Petri dishes were sealed with a parafilm layer. Same germination conditions as those described in Section 3.4.1. were used for seed germination and seedling growth. The following parameters related to seed germination and seedling development were investigated: GP, VI, seedling length, root length, shoot length, seedling weight, root weight, and shoot weight.
3.5. Antifungal Activity
In order to investigate the antifungal activity of TEO and eTEO, the following phytopathogenic fungal strains were used: F. graminearum DSM 1095 and R. solani DSM 22880, as part of the Microbial Collection of ICECHIM (Bucharest, Romania). To refresh the phytopathogenic fungal strains, a disc of mycelium was taken from the edge of the old cultures and placed in the center of Petri dishes containing autoclaved Potato Dextrose Agar (PDA) medium. The fungal strains were incubated at 28°C for 6 days (ALGAETRON AG230, Photon Systems Instruments, Drásov, Czech Republic). Subsequently, 10 mL of PDA medium were pipetted into 60-mm Petri dishes. Using a 5-mm-diameter cork-borer, a disc of mycelium was taken from the edge of the fresh cultures and placed in the center of the 60-mm Petri dishes. TEO and eTEO at various essential oil doses expressed per volume of air in the 60 mm Petri dish (D1 – 0.0135 µL/cm3, D2 – 0.027 µL/cm3, D3 – 0.049 µL/cm3, D4 – 0.122 µL/cm3, D5 – 0.244 µL/cm3, D6 – 0.329 µL/cm3, D7 – 0.439 µL/cm3) were pipetted onto a 5-mm-diameter filter paper disc placed in the center of the Petri dish lids. The plates were sealed with parafilm tape and incubated upside down at 28°C for 6 days. Each dose was tested in triplicate and was followed by a negative control (C-, the fungal strain grown in the absence of TEO or eTEO) and a sterility control (without fungal strain). Subsequently, the plates were photographed, and the diameter of the growth zone of the phytopathogenic fungi was measured using the ImageJ software, further determining the growth area of the two phytopathogenic fungal strains and the percentage of inhibition (% of C-). Light microscopy images of the fungal strains grown in the absence of TEO or eTEO, as well as in the presence of the highest tested dose, i.e., D7 – 0.439 µL/cm3, were acquired using the same parameters described in Section 3.2.
3.6. Statistical Analysis
All analysis were performed in triplicate. Data statistical analysis was performed by one-way analyses of variance (ANOVA) using the IBM SPSS Statistics software, version 31.0, developed by IBM SPSS Corp, USA. The treatments were compared individually with the control. The level of statistical significance was set at p < 0.05, representing the minimum accepted threshold for statistical significance. Marginally significant differences were considered for 0.1 > p ≥ 0.05. Levene’s test was used to establish the homogeneity of variance.
4. Conclusions
In conclusion, we have developed a TEO nanoemulsion, which valorizes lignosulphonate as a cosurfactant, to be used as a vehicle with a controlled-release of TEO volatiles for seed treatment. Compared to free TEO, the nanoemulsion releases thymol more slowly, it is not phytotoxic at antifungal doses, and it even has biostimulant effects on the seedlings under certain conditions. More optimization is needed in order to increase the percent of lignosulphonate and encapsulated essential oil and reduce the percentage of other components. Moreover, the optimal dose for simultaneous biostimulant and fungistatic / fungicidal effects, as well as the mechanism of action will have to be established.
Supplementary Materials
The following supporting information can be downloaded at: https://www.mdpi.com/article/doi/s1, Figure S1: Light microscopy of encapsulated thyme essential oil (eTEO): (A) Undiluted eTEO, (B) Ten-fold diluted eTEO; Figure S2: GC-MS chromatograms of (A) thyme essential oil (TEO) at 0h incubation in vial, (B) TEO at 24h incubation in vial, (C) encapsulated TEO (eTEO) at 0h incubation in vial, (D) eTEO at 24h incubation in vial; Figure S3: Seedling aspect at various salt concentrations and treatment doses; C – control without salt, CS – control with salt; O – thyme essential oil (TEO) treatment, no salt; E – encapsulated TEO treatment, no salt; OS – thyme essential oil (TEO) treatment, salt stress; ES – encapsulated TEO treatment, salt stress..
Author Contributions
Conceptualization, F.O. and D.C.-A.; methodology, M.-A.T. and D.C.-A.; validation, D.C.-A. and F.O.; formal analysis, M.-A.T., N.T., and A.L.M.; investigation, M.-A.T., N.T., A.L.M., and M.C.-U.; resources, D.C.-A. and F.O.; data curation, D.C.-A.; writing—original draft preparation, M.-A.T., N.T., and A.L.M.; writing—review and editing, D.C.-A. and F.O.; visualization, D.C.-A. and F.O.; supervision, D.C.-A. and F.O.; project administration, D.C.-A.; funding acquisition, D.C.-A. and F.O. All authors have read and agreed to the published version of the manuscript.
Funding
This research was funded by project PN 23.06.02.01 InteGral, Nucleu Programme, funded by Romanian Ministry of Education and Research.
Data Availability Statement
The original contributions presented in this study are included in the article/supplementary material. Further inquiries can be directed to the corresponding author(s).
Acknowledgments
We thank Livia Teodora Ciobanu for the help provided during the seed germination experiments and Gabriel Vasilievici for guidance in GC-MS analysis.
Conflicts of Interest
The authors declare no conflicts of interest.
Abbreviations
The following abbreviations are used in this manuscript:
| EO | Essential oil |
| eTEO | Encapsulated thyme essential oil |
| FTIR | Fourier Transform Infrared Spectroscopy |
| GE | Germination energy |
| GP | Germination percentage |
| GR | Germination rate |
| MCT | Fractionated coconut oil |
| MGT | Mean germination time |
| NaLS | Sodium lignosulphonate |
| NE | Nanoemulsion |
| PDI | Polydispersity index |
| PS | Particle size |
| TEO | Thymus vulgaris (thyme) essential oil |
| VI | Vigour index |
| ZP | Zeta potential |
References
- Mawar, R.; Manjunatha, B.L.; Sanyal, A.; Sharma, S.K.; Singh, H.B.; Dubey, S.C. Current Regulatory Requirements for PGPM Products for Management of Seed, Soil and Plant Health: An Overview. In Plant Growth Promoting Microorganisms of Arid Region; Mawar, R., Sayyed, R.Z., Sharma, S.K., Sattiraju, K.S., Eds.; Springer Nature Singapore: Singapore, 2023; pp. 349–363. [Google Scholar] [CrossRef]
- Di Sario, L.; Boeri, P.; Matus, J.T.; Pizzio, G.A. Plant Biostimulants to Enhance Abiotic Stress Resilience in Crops. IJMS 2025, 26, 1129. [Google Scholar] [CrossRef] [PubMed]
- Pérez-Pizá, M.C.; Sautua, F.J.; Kocira, S.; Bohatá, A.; Bedrníček, J.; Sozoniuk, M.; Carmona, M.A. Quick and Effective Evaluation Methods for Biocontrol Agents and Biostimulants Against Phytopathogenic Fungi Relevant for Various Cropping Systems. Plant Pathol. 2025, 74, 641–668. [Google Scholar] [CrossRef]
- Balasubramaniam, T.; Shen, G.; Esmaeili, N.; Zhang, H. Plants’ Response Mechanisms to Salinity Stress. Plants 2023, 12, 2253. [Google Scholar] [CrossRef] [PubMed]
- El-kazzaz, M.K.; Ghoneim, K.E.; Agha, M.K.M.; Helmy, A.; Behiry, S.I.; Abdelkhalek, A.; Saleem, M.H.; Al-Askar, A.A.; Arishi, A.A.; Elsharkawy, M.M. Suppression of Pepper Root Rot and Wilt Diseases Caused by Rhizoctonia solani and Fusarium oxysporum. Life 2022, 12, 587. [Google Scholar] [CrossRef] [PubMed]
- Martí-Guillén, J.M.; Martínez-Lorente, S.E.; Pedreño, M.Á.; Almagro, L.; Sabater-Jara, A.B. Seed priming as a tool to improve crop resilience to abiotic stress: methodology, mechanisms of action and usefulness in crops of agronomic interest. Plant Stress 2026, 21, 101366. [Google Scholar] [CrossRef]
- Nabi, M.H.B.; Ahmed, M.M.; Mia, M.S.; Islam, S.; Zzaman, W. Essential oils: Advances in extraction techniques, chemical composition, bioactivities, and emerging applications. Food Chem. Adv. 2025, 8, 101048. [Google Scholar] [CrossRef]
- Piga, G.K.; Cossu, M.; Corbo, M.R.; Frabboni, L.; Speranza, B.; Guerrieri, A.; Germinara, G.S.; Melito, S. Assessing the Biostimulant Effects and Antimicrobial Activity of Lavandula Angustifolia Essential Oil. J. Soil Sci. Plant Nutr. 2026, 26, 797–811. [Google Scholar] [CrossRef]
- Ben Saad, R.; Ben Romdhane, W.; Wiszniewska, A.; Baazaoui, N.; Taieb Bouteraa, M.; Chouaibi, Y.; Alfaifi, M.Y.; Kačániová, M.; Čmiková, N.; Ben Hsouna, A.; et al. Rosmarinus officinalis L. essential oil enhances salt stress tolerance of durum wheat seedlings through ROS detoxification and stimulation of antioxidant defense. Protoplasma 2024, 261, 1207–1220. [Google Scholar] [CrossRef] [PubMed]
- Borromeo, I.; Giordani, C.; Forni, C. Efficacy of Lippia alba Essential Oil in Alleviating Osmotic and Oxidative Stress in Salt-Affected Bean Plants. Horticulturae 2025, 11, 457. [Google Scholar] [CrossRef]
- Aksit, H.; Bayar, Y.; Simsek, S.; Ulutas, Y. Chemical Composition and Antifungal Activities of the Essential Oils of Thymus Species ( Thymus pectinatus, Thymus convolutus, Thymus vulgaris ) Against Plant Pathogens. J. Essent. Oil Bear. Plants 2022, 25, 200–207. [Google Scholar] [CrossRef]
- Omar, H.S.; Abd El-Rahman, S.N.; AlGhannam, S.M.; Reyad, N.H.A.; Sedeek, M.S. Antifungal Evaluation and Molecular Docking Studies of Olea europaea Leaf Extract, Thymus vulgaris and Boswellia carteri Essential Oil as Prospective Fungal Inhibitor Candidates. Molecules 2021, 26. [Google Scholar] [CrossRef] [PubMed]
- Ben-Jabeur, M.; Vicente, R.; López-Cristoffanini, C.; Alesami, N.; Djébali, N.; Gracia-Romero, A.; Serret, M.D.; López-Carbonell, M.; Araus, J.L.; Hamada, W. A Novel Aspect of Essential Oils: Coating Seeds with Thyme Essential Oil induces Drought Resistance in Wheat. Plants 2019, 8, 371. [Google Scholar] [CrossRef] [PubMed]
- Dong, Y.; Wei, Z.; Yang, R.; Zhang, Y.; Sun, M.; Bai, H.; Mo, M.; Yao, C.; Li, H.; Shi, L. Chemical Compositions of Essential Oil Extracted from Eight Thyme Species and Potential Biological Functions. Plants 2023, 12, 4164. [Google Scholar] [CrossRef] [PubMed]
- Etri, K.; Pluhár, Z. Exploring Chemical Variability in the Essential Oils of the Thymus Genus. Plants 2024, 13, 1375. [Google Scholar] [CrossRef] [PubMed]
- Abd-ElGawad, A.M.; El Gendy, A.E.-N.G.; Assaeed, A.M.; Al-Rowaily, S.L.; Alharthi, A.S.; Mohamed, T.A.; Nassar, M.I.; Dewir, Y.H.; Elshamy, A.I. Phytotoxic Effects of Plant Essential Oils: A Systematic Review and Structure-Activity Relationship Based on Chemometric Analyses. Plants 2020, 10, 36. [Google Scholar] [CrossRef] [PubMed]
- Li, L.; Li, X.; McClements, D.J.; Jin, Z.; Ji, H.; Qiu, C. Recent progress in the source, extraction, activity mechanism and encapsulation of bioactive essential oils. Crit. Rev. Food Sci. Nutr. 2025, 65, 6352–6370. [Google Scholar] [CrossRef] [PubMed]
- Haghaninia, M.; Rasouli, F.; Golestaneh, S.; Asadi, M.; Mahdavinia, G. Nanoformulated rosemary essential oil in chitosan matrix alleviates salinity-induced physiological and biochemical damages in lettuce. Sci. Hortic. 2025, 350, 114325. [Google Scholar] [CrossRef]
- Devrnja, N.; Anđelković, B.; Ljujić, J.; Ćosić, T.; Stupar, S.; Milutinović, M.; Savić, J. Encapsulation of Fennel and Basil Essential Oils in β-Cyclodextrin for Novel Biopesticide Formulation. Biomolecules 2024, 14, 353. [Google Scholar] [CrossRef] [PubMed]
- Girardi, N.S.; García, D.; Robledo, S.N.; Passone, M.A.; Nesci, A.; Etcheverry, M. Microencapsulation of Peumus boldus oil by complex coacervation to provide peanut seeds protection against fungal pathogens. Ind. Crops Prod. 2016, 92, 93–101. [Google Scholar] [CrossRef]
- Girardi, N.S.; García, D.; Passone, M.A.; Nesci, A.; Etcheverry, M. Microencapsulation of Lippia turbinata essential oil and its impact on peanut seed quality preservation. Int. Biodeterior. Biodegrad. 2017, 116, 227–233. [Google Scholar] [CrossRef]
- Bolgen, U.M.G.; Demirci Kayiran, S.; Ozogul, Y.; Ozogul, F. Essential oil-based nanoemulsions with current knowledge: Formulation, characterization, and applications in food and pharmaceuticals. Ind. Crops Prod. 2025, 233, 121411. [Google Scholar] [CrossRef]
- Moazeni, M.; Davari, A.; Shabanzadeh, S.; Akhtari, J.; Saeedi, M.; Mortyeza-Semnani, K.; Abastabar, M.; Nabili, M.; Moghadam, F.H.; Roohi, B.; et al. In vitro antifungal activity of Thymus vulgaris essential oil nanoemulsion. J. Herb. Med. 2021, 28, 100452. [Google Scholar] [CrossRef]
- Gumede, S.; Mpai, S.; Kesavan Pillai, S.; Sivakumar, D. Nano Emulsion of Essential Oils Loaded in Chitosan Coating for Controlling Anthracnose in Tomatoes (Solanum lycopersicum) During Storage. Foods 2025, 14, 3038. [Google Scholar] [CrossRef] [PubMed]
- Heidary, L.; Nourbakhsh, H.; Javanmardi, Z.; Saba, M.K. Biopolymer-enhanced nanoemulsions for controlled release of thyme: Impact on strawberry shelf life and quality. J. Agric. Food Res. 2025, 21, 101796. [Google Scholar] [CrossRef]
- Kourdova, L.T.; Mottola, M.; Peppino Margutti, M.; Bogino, M.F.; Maritano, P.; Vico, R.V.; Blanco-Herrera, F.; Fanani, M.L.; Fabro, G. Rhamnolipid-Stabilized Essential Oils Nanoemulsions: Sustainable Biopesticides and Biostimulants with Potential for Crop Protection. Agronomy 2025, 15, 824. [Google Scholar] [CrossRef]
- Zaki, F.S.A.; El-Wakeel, M.A.; El-Sayed, A.E. Nanotechnology-based formulations of thyme essential oil to enhance its herbicidal efficiency for controlling weeds associated with maize plants. BMC Plant Biol. 2026, 26, 916. [Google Scholar] [CrossRef] [PubMed]
- Guedes, N.A.; Peccini, L.R.; Bigui, W.C.C.; Baute, J.L.; Feu, K.S.; Chaves, K.F.; De Oliveira Pires, R.M.; Villanova, J.C.O.; Morais, P.A.B.; Costa, A.V.; et al. Thyme essential oil-loaded emulsion as a potential nanofungicide for controlling Fusarium oxysporum f. sp. lycopersici. Eur. J. Plant Pathol. 2025, 172, 507–524. [Google Scholar] [CrossRef]
- Peccini, L.R.; Bigui, W.C.C.; Botelho, B.D.O.; Guedes, N.A.; Gaspari, C.D.S.F.; Melo, D.C.A.D.; Chaves, K.F.; Soares, L.D.S.; Costa, A.V.; Queiroz, V.T.D. In vitro control of Fusarium oxysporum f. sp. lycopersici Race 3 by the innovative formulation consisting of a thymol-based emulsion, and evaluation of its effects on the vigor of tomato seeds. Sci. Hortic. 2024, 336, 113380. [Google Scholar] [CrossRef]
- El-Gamal, S.M.A.; Rashad, E.M.; Saber, W.I.A.; Al-Askar, A.A.; Helmy, Y.A.; Ghoneem, K.M.; Ibrahim, A.A. Thyme and cumin eones: a safe and effective strategy for controlling Alternaria radicina in coriander, enhancing growth, and reducing cytotoxicity. Physiol. Mol. Biol. Plants 2025, 31, 2163–2184. [Google Scholar] [CrossRef] [PubMed]
- Das, S.; Singh, V.K.; Dwivedy, A.K.; Chaudhari, A.K.; Upadhyay, N.; Singh, A.; Deepika; Dubey, N.K. Fabrication, characterization and practical efficacy of Myristica fragrans essential oil nanoemulsion delivery system against postharvest biodeterioration. Ecotoxicol. Environ. Saf. 2020, 189, 110000. [Google Scholar] [CrossRef] [PubMed]
- Kumar Chaudhari, A.; Kumar Singh, V.; Das, S.; Deepika; Kishore Dubey, N. Fabrication, characterization, and bioactivity assessment of chitosan nanoemulsion containing allspice essential oil to mitigate Aspergillus flavus contamination and aflatoxin B1 production in maize. Food Chem. 2022, 372, 131221. [Google Scholar] [CrossRef] [PubMed]
- Singh, B.K.; Chaudhari, A.K.; Das, S.; Tiwari, S.; Maurya, A.; Singh, V.K.; Dubey, N.K. Chitosan encompassed Aniba rosaeodora essential oil as innovative green candidate for antifungal and antiaflatoxigenic activity in millets with emphasis on cellular and its mode of action. Front. Microbiol. 2022, 13–2022. [Google Scholar] [CrossRef] [PubMed]
- Ruwoldt, J. A Critical Review of the Physicochemical Properties of Lignosulfonates: Chemical Structure and Behavior in Aqueous Solution, at Surfaces and Interfaces. Surfaces 2020, 3, 622–648. [Google Scholar] [CrossRef]
- Ruwoldt, J. Emulsion Stabilization with Lignosulfonates. In Lignin - Chemistry, Structure, and Application; Sand, A., Tuteja, J., Eds.; IntechOpen, 2023. [Google Scholar] [CrossRef]
- Piombino, C.; Lange, H.; Sabuzi, F.; Galloni, P.; Conte, V.; Crestini, C. Lignosulfonate Microcapsules for Delivery and Controlled Release of Thymol and Derivatives. Molecules 2020, 25, 866. [Google Scholar] [CrossRef] [PubMed]
- Wang, R.; Zhang, J.; Sun, Z.; Jian, X.; Xu, Y.; Zhou, X.; Liang, X.; Lin, J.; Li, B.; Mu, W.; et al. Eucalyptol-loaded microcapsules combined with Cynanchum komarovii extracts provide long-term and low-risk management of Chinese wolfberry (Lycium barbarum L.). Ecotoxicol. Environ. Saf. 2024, 270, 115874. [Google Scholar] [CrossRef] [PubMed]
- Zuo, J.; Lin, Y.; Tian, J.; Cai, J.; Hao, L.; Liu, D.; Wang, Q.; Xiao, G.; Zhou, X.; Zhou, H. Tea tree oil Pickering emulsions stabilized by sodium lignosulfonate-zein covalent conjugate for fungicide delivery and enhanced control efficacy against peanut sclerotium blight. Chem. Eng. J. 2025, 513, 162876. [Google Scholar] [CrossRef]
- Sgarzi, M.; Gigli, M.; Giuriato, C.; Crestini, C. Simple Strategies to Modulate the pH-Responsiveness of Lignosulfonate-Based Delivery Systems. Materials 2022, 15, 1857. [Google Scholar] [CrossRef] [PubMed]
- Nasef, S.M.; Sayed, A.; Mahmoud, G.A. Comparative study of lignin and sodium lignosulfonate extracted from irradiated and non-irradiated sawdust wastes. Radiat. Phys. Chem. 2024, 214, 111302. [Google Scholar] [CrossRef]
- Karpukhina, E.A.; Volkov, D.S.; Proskurnin, M.A. Quantification of Lignosulfonates and Humic Components in Mixtures by ATR FTIR Spectroscopy. Agronomy 2023, 13, 1141. [Google Scholar] [CrossRef]
- Abdelrahman, N.S.; Galiwango, E.; Al-Marzouqi, A.H.; Mahmoud, E. Sodium lignosulfonate: a renewable corrosion inhibitor extracted from lignocellulosic waste. Biomass Conv. Bioref. 2024, 14, 7531–7541. [Google Scholar] [CrossRef]
- Nuithitikul, K.; Kabthong, R.; Oonoon, N.; Thetpitak, T.; Rattanasak, U.; Sata, V.; Jitsangiam, P.; Jaturapitakkul, C.; Chindaprasirt, P. Valorization of peanut husk biomass into a sodium lignosulfonate and cellulose aerogel for sustainable building materials. Clean. Eng. Technol. 2026, 31, 101196. [Google Scholar] [CrossRef]
- Qiu, X.; Kong, Q.; Zhou, M.; Yang, D. Aggregation Behavior of Sodium Lignosulfonate in Water Solution. J. Phys. Chem. B 2010, 114, 15857–15861. [Google Scholar] [CrossRef] [PubMed]
- Perazzo, A.; Preziosi, V.; Guido, S. Phase inversion emulsification: Current understanding and applications. Adv. Colloid Interface Sci. 2015, 222, 581–599. [Google Scholar] [CrossRef] [PubMed]
- Pavoni, L.; Perinelli, D.R.; Bonacucina, G.; Cespi, M.; Palmieri, G.F. An Overview of Micro- and Nanoemulsions as Vehicles for Essential Oils: Formulation, Preparation and Stability. Nanomaterials 2020, 10, 135. [Google Scholar] [CrossRef] [PubMed]
- Komaiko, J.; McClements, D.J. Low-energy formation of edible nanoemulsions by spontaneous emulsification: Factors influencing particle size. J. Food Eng. 2015, 146, 122–128. [Google Scholar] [CrossRef]
- Chang, Y.; McLandsborough, L.; McClements, D.J. Physicochemical Properties and Antimicrobial Efficacy of Carvacrol Nanoemulsions Formed by Spontaneous Emulsification. J. Agric. Food Chem. 2013, 61, 8906–8913. [Google Scholar] [CrossRef] [PubMed]
- Sampaio, C.I.; Bourbon, A.I.; Gonçalves, C.; Pastrana, L.M.; Dias, A.M.; Cerqueira, M.A. Low energy nanoemulsions as carriers of thyme and lemon balm essential oils. LWT 2022, 154, 112748. [Google Scholar] [CrossRef]
- Stojanović-Radić, Z.; Stojković, O.; Radulović, N.; Dimitrijević, M.; Ranđelović, M.; Otašević, S. Antifungal Activity of Thymus vulgaris L. Essential Oil Against Candida Species Causing Otomycosis: Anti-Virulence Activity, Synergistic Potential, and Cell Wall Effect. Chem. Biodivers. 2025, 22, e01145. [Google Scholar] [CrossRef] [PubMed]
- Tohidi-Nejad, Z.; Khajoei-Nejad, G.; Tohidi-Nejad, E.; Ghanbari, J. Essential oil production, chemical composition, bioactive compounds, and antioxidant activity of Thymus vulgaris as affected by harvesting season and drying conditions. Dry. Technol. 2024, 42, 1208–1220. [Google Scholar] [CrossRef]
- Hudaib, M.; Speroni, E.; Di Pietra, A.M.; Cavrini, V. GC/MS evaluation of thyme (Thymus vulgaris L.) oil composition and variations during the vegetative cycle. J. Pharm. Biomed. Anal. 2002, 29, 691–700. [Google Scholar] [CrossRef] [PubMed]
- Gheorghe Răuță, D.; Bînzari, V.; Constantinescu Aruxandei, D.; Lupu, C.; Shaposnikov, S.; Oancea, F. ACTIVITY OF THYME ESSENTIAL OILS AGAINST PLANT PATHOGENIC FUNGI AND ITS POTENTIAL USE AS SEED DISINFECTANT. AgroLife Sci. J. 2022, 11, 63–72. [Google Scholar] [CrossRef]
- Menke, J.; Dong, Y.; Kistler, H. Fusarium graminearum Tri12p Influences Virulence to Wheat and Trichothecene Accumulation. Mol. Plant-Microbe Interact. 2012, 25, 1408–1418. [Google Scholar] [CrossRef] [PubMed]
- Menke, J.; Weber, J.; Broz, K.; Kistler, H. Cellular Development Associated with Induced Mycotoxin Synthesis in the Filamentous Fungus Fusarium graminearum. PLoS ONE 2013, 8, e63077. [Google Scholar] [CrossRef] [PubMed]
- Sumner, D.R. Sclerotia Formation by Rhizoctonia Species and their Survival. In Rhizoctonia Species: Taxonomy, Molecular Biology, Ecology, Pathology and Disease Control; Sneh, B., Jabaji-Hare, S., Neate, S., Dijst, G., Eds.; Springer Netherlands: Dordrecht, 1996; pp. 207–215. [Google Scholar] [CrossRef]
- Kasiamdari, R. Orchid Mycorrhizal Fungi: Identification of Rhizoctonia from West Kalimantan. Microbiol. Indones. 2015, 9, 157–162. [Google Scholar]
- Ostertag, F.; Weiss, J.; McClements, D.J. Low-energy formation of edible nanoemulsions: Factors influencing droplet size produced by emulsion phase inversion. J. Colloid Interface Sci. 2012, 388, 95–102. [Google Scholar] [CrossRef] [PubMed]
- Tritean, N.; Trică, B.; Dima, Ş.-O.; Capră, L.; Gabor, R.-A.; Cimpean, A.; Oancea, F.; Constantinescu-Aruxandei, D. Mechanistic insights into the plant biostimulant activity of a novel formulation based on rice husk nanobiosilica embedded in a seed coating alginate film. Front. Plant Sci. 2024, 15, 1349573. [Google Scholar] [CrossRef] [PubMed]
- Trica, B.; Tritean, N.; Constantinescu-Aruxandei, D.; Oancea, F. Optimization of the Mung Bean Seed Coating with Alginate in a Bottom-Sprayed Wurster Fluidized Bed Coater. Coatings 2023, 13, 562. [Google Scholar] [CrossRef]
- Schneider, C.A.; Rasband, W.S.; Eliceiri, K.W. NIH Image to ImageJ: 25 years of image analysis. Nat. Methods 2012, 9, 671–675. [Google Scholar] [CrossRef] [PubMed]
Figure 1.
(A) FTIR spectrum of the sodium lignosulphonate (NaLS) powder; (B) Critical aggregation concentration of the NaLS solution.
Figure 1.
(A) FTIR spectrum of the sodium lignosulphonate (NaLS) powder; (B) Critical aggregation concentration of the NaLS solution.
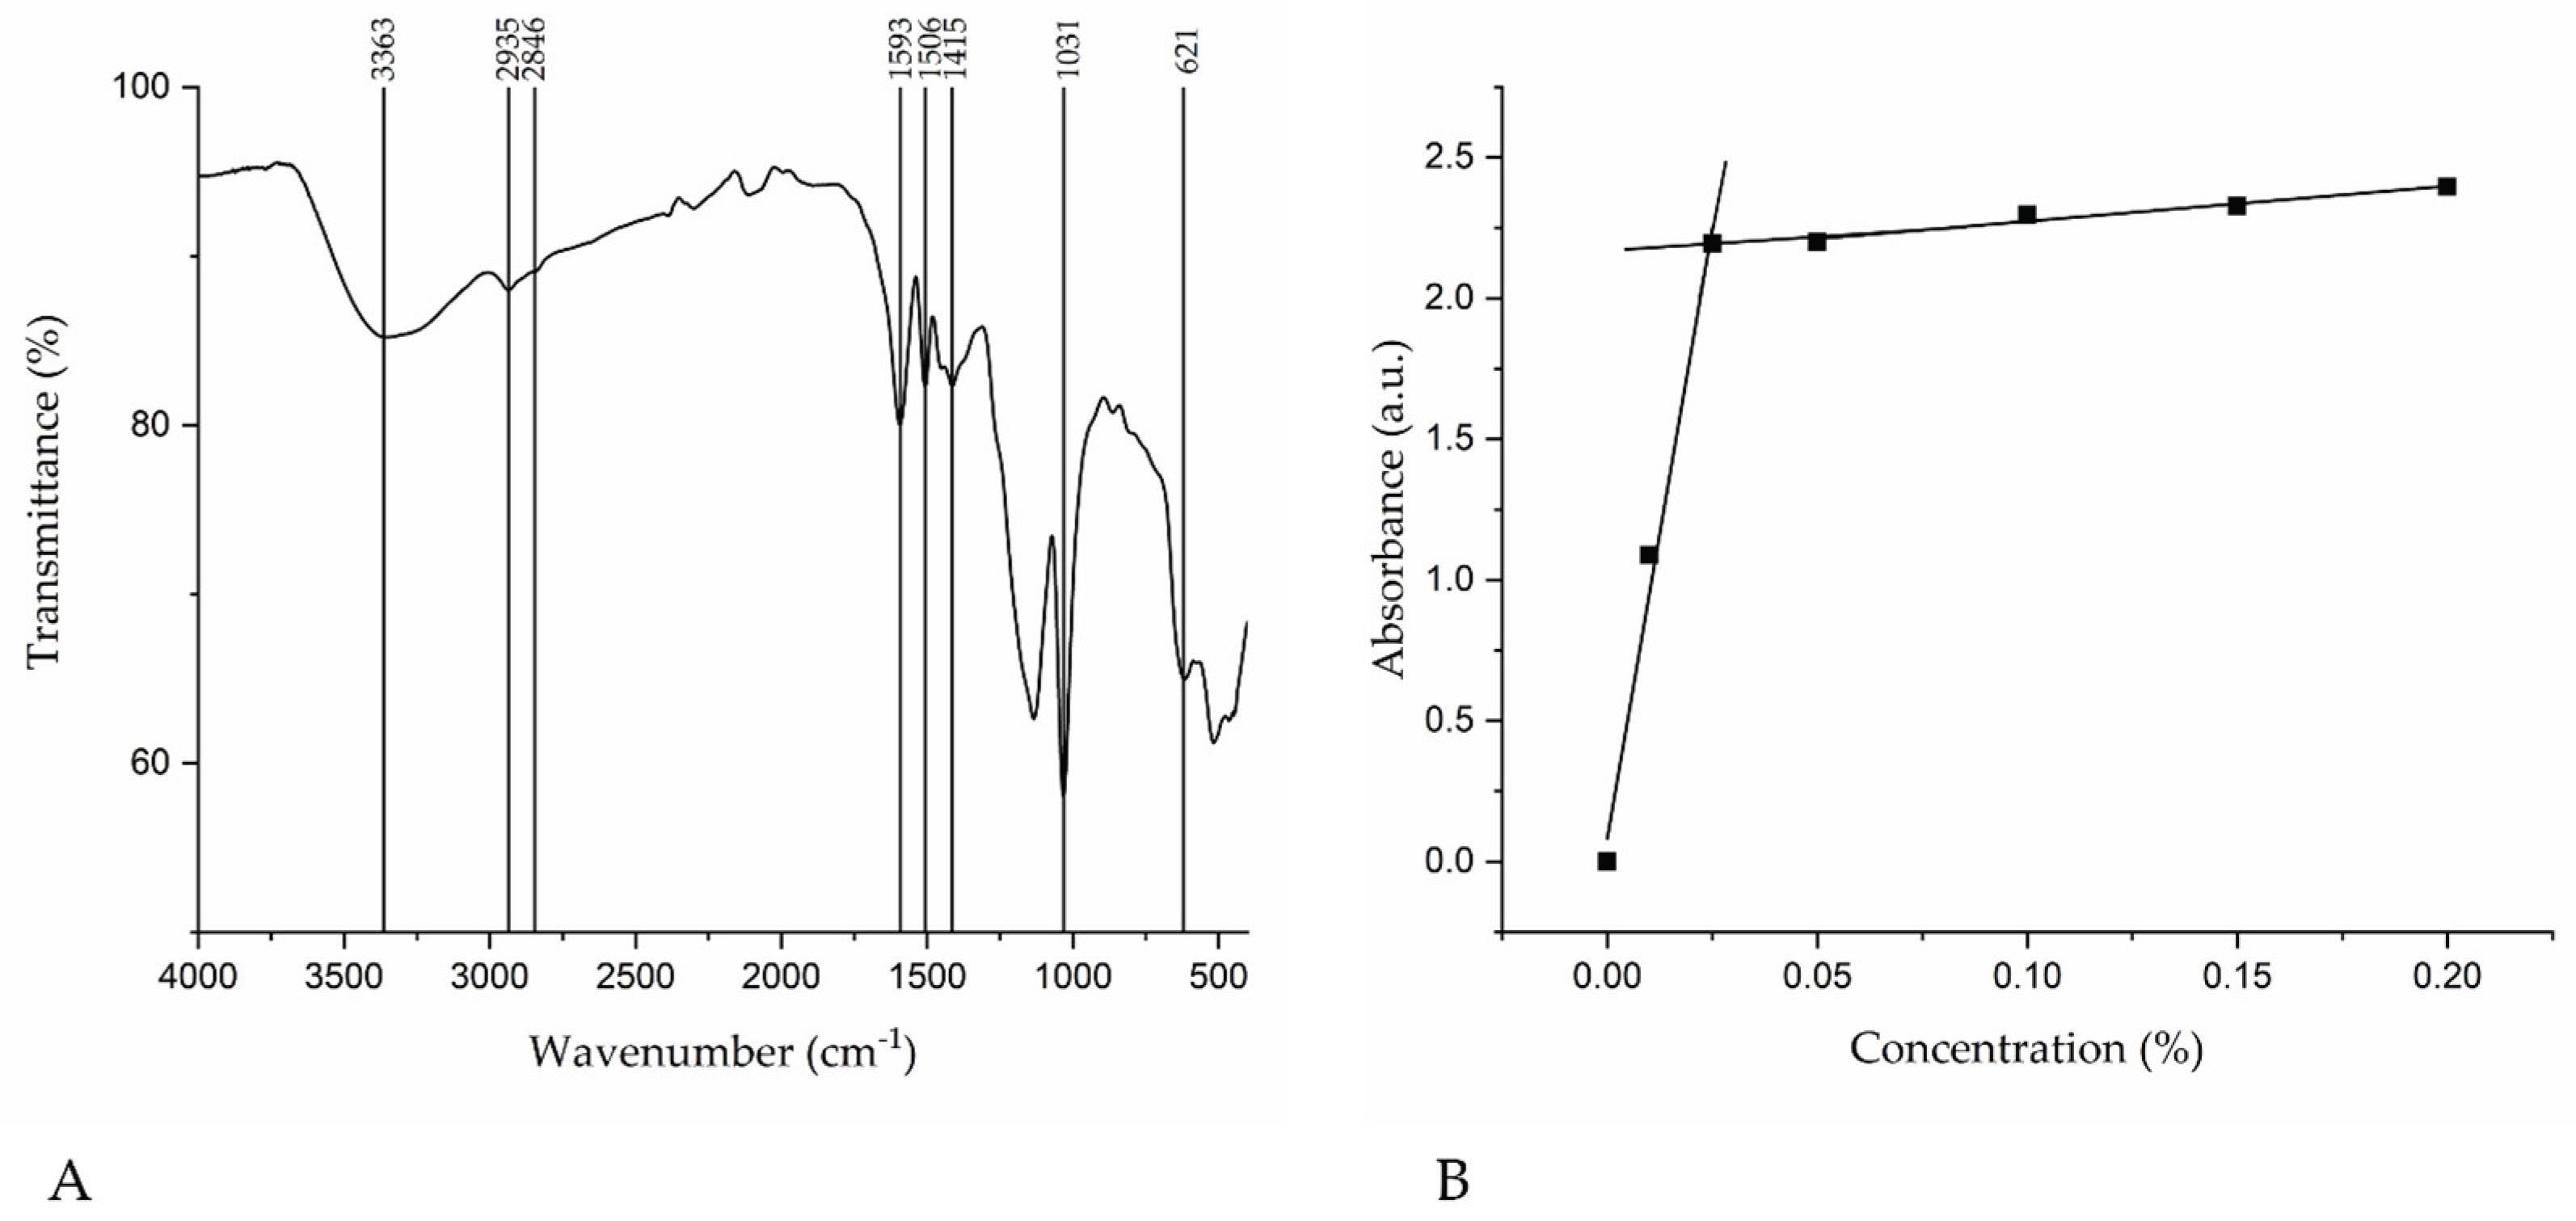
Figure 2.
Quantification of thymol release from TEO and eTEO at 0 h and 24 h.
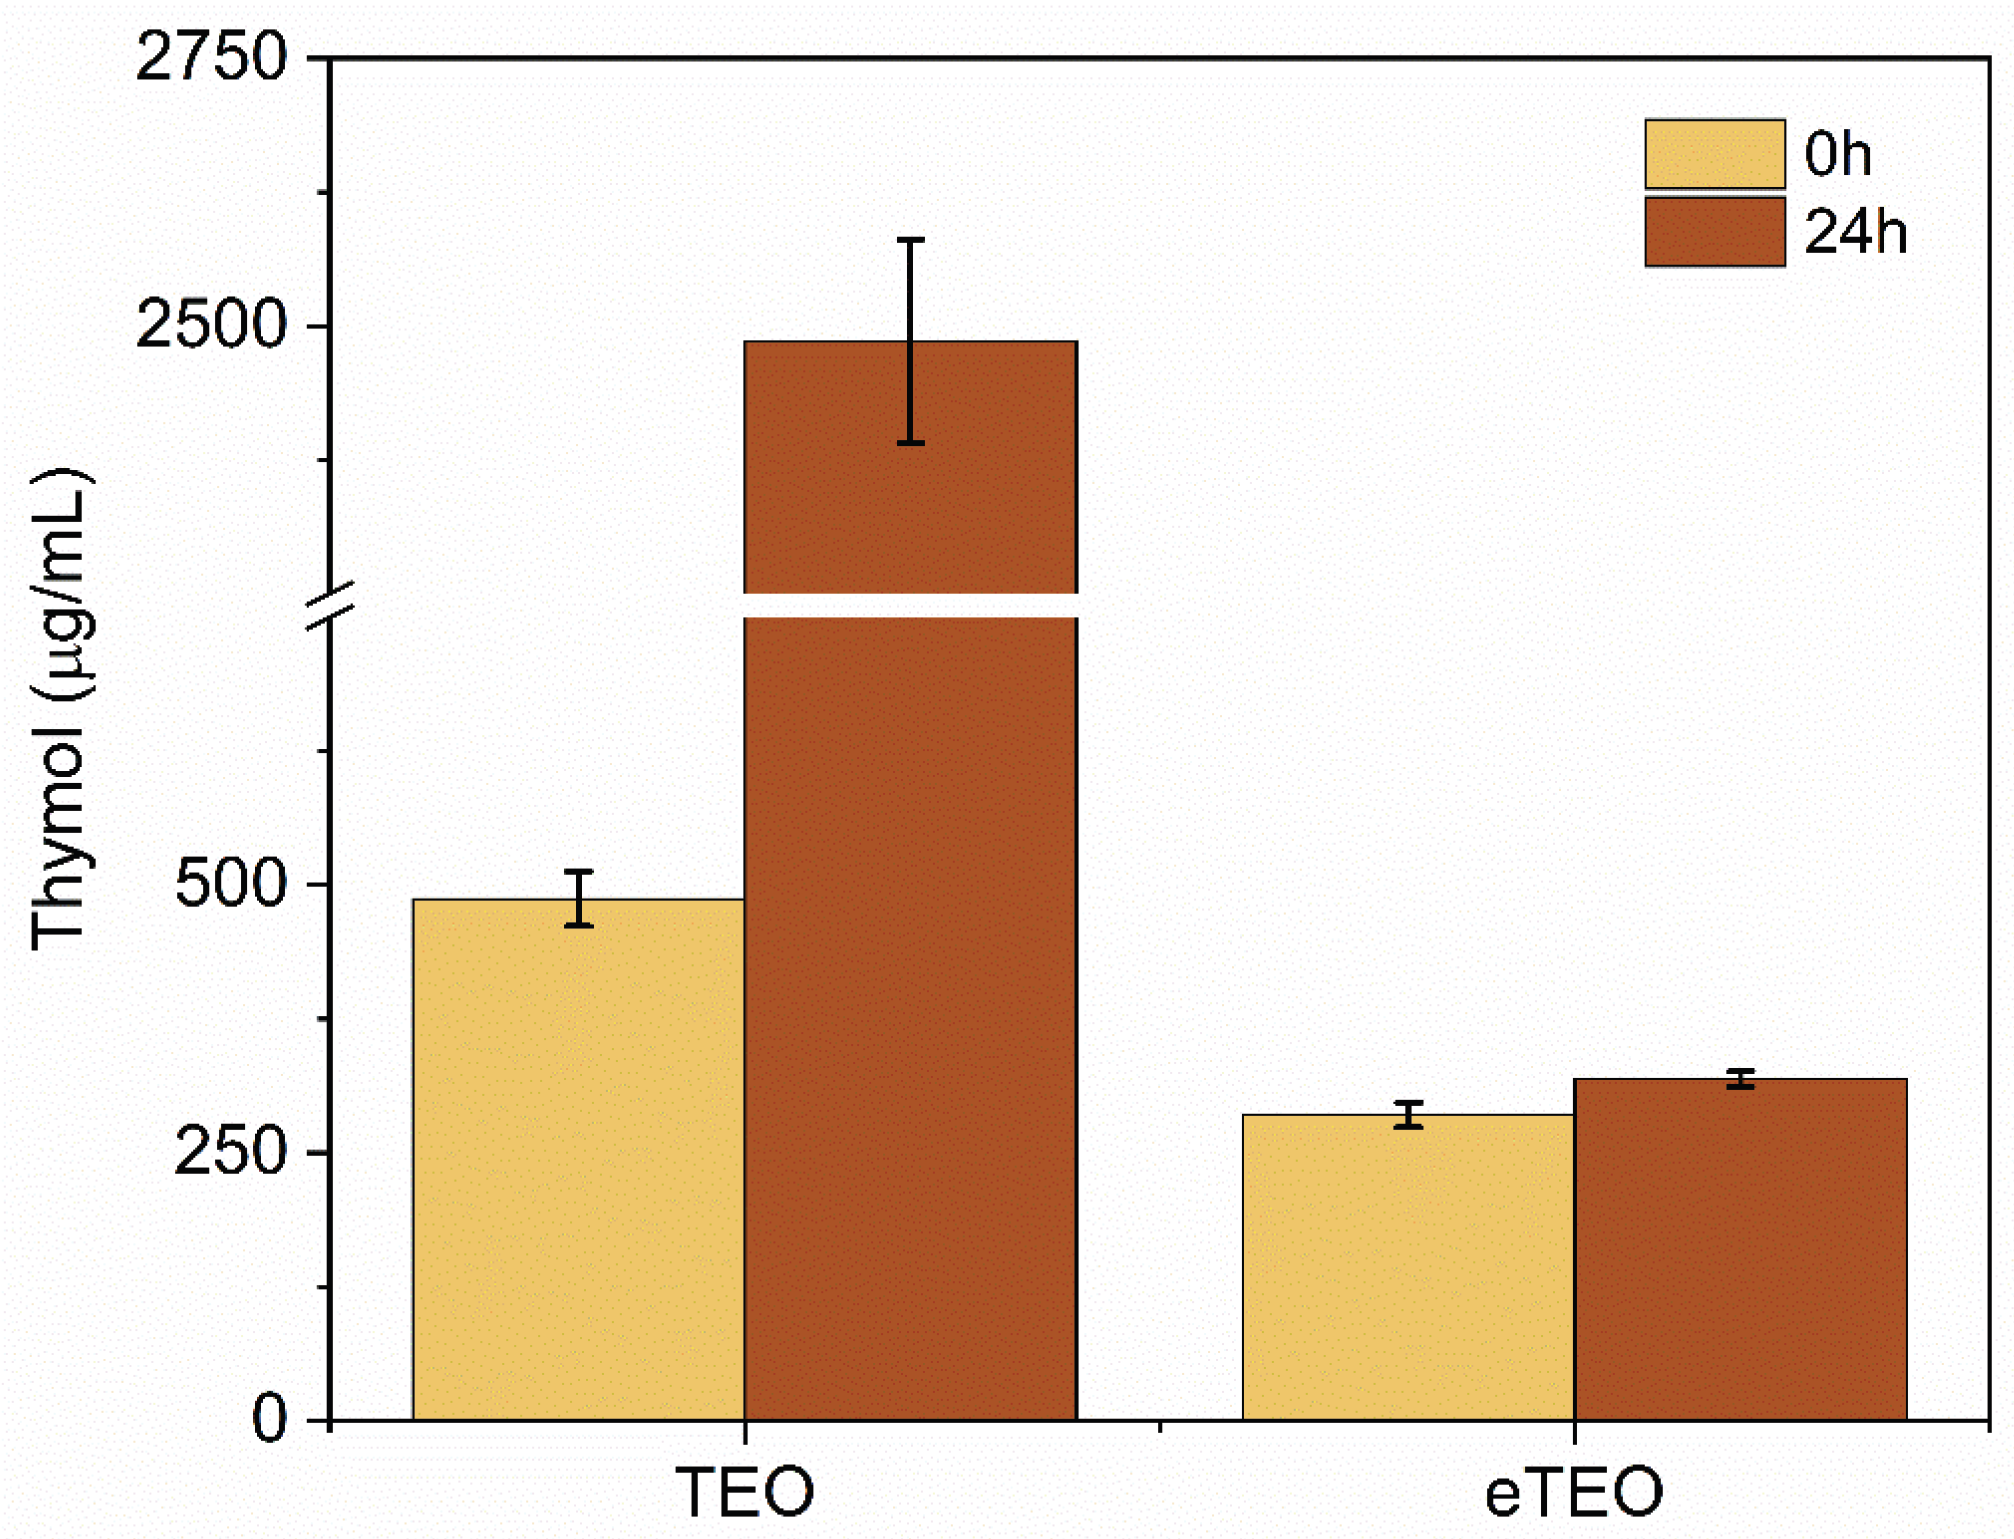
Figure 3.
Mung bean germination parameters of 72h pretreated dry seeds by volatile fumigation: (A) Germination percentage, (B) Germination energy, (C) Germination rate and Mean germination time, (D) Vigour Index; (± error bars, n = 3, α ≤ 0.05); C1 – control (untreated Mung bean seeds) for O1 and E1, C2 - control (untreated Mung bean seeds), for O2 and E2, C3 - control (untreated Mung bean seeds), for O3 and E3; O1, O2, and O3 – thyme essential oil, dose 0.0135 µL/cm3, 0.054 µL/cm3, and 0.439 µL/cm3, respectively; E1, E2, and E3 – encapsulated thyme essential oil, dose 0.0135 µL/cm3, 0.054 µL/cm3, and 0.439 µL/cm3, respectively.
Figure 3.
Mung bean germination parameters of 72h pretreated dry seeds by volatile fumigation: (A) Germination percentage, (B) Germination energy, (C) Germination rate and Mean germination time, (D) Vigour Index; (± error bars, n = 3, α ≤ 0.05); C1 – control (untreated Mung bean seeds) for O1 and E1, C2 - control (untreated Mung bean seeds), for O2 and E2, C3 - control (untreated Mung bean seeds), for O3 and E3; O1, O2, and O3 – thyme essential oil, dose 0.0135 µL/cm3, 0.054 µL/cm3, and 0.439 µL/cm3, respectively; E1, E2, and E3 – encapsulated thyme essential oil, dose 0.0135 µL/cm3, 0.054 µL/cm3, and 0.439 µL/cm3, respectively.
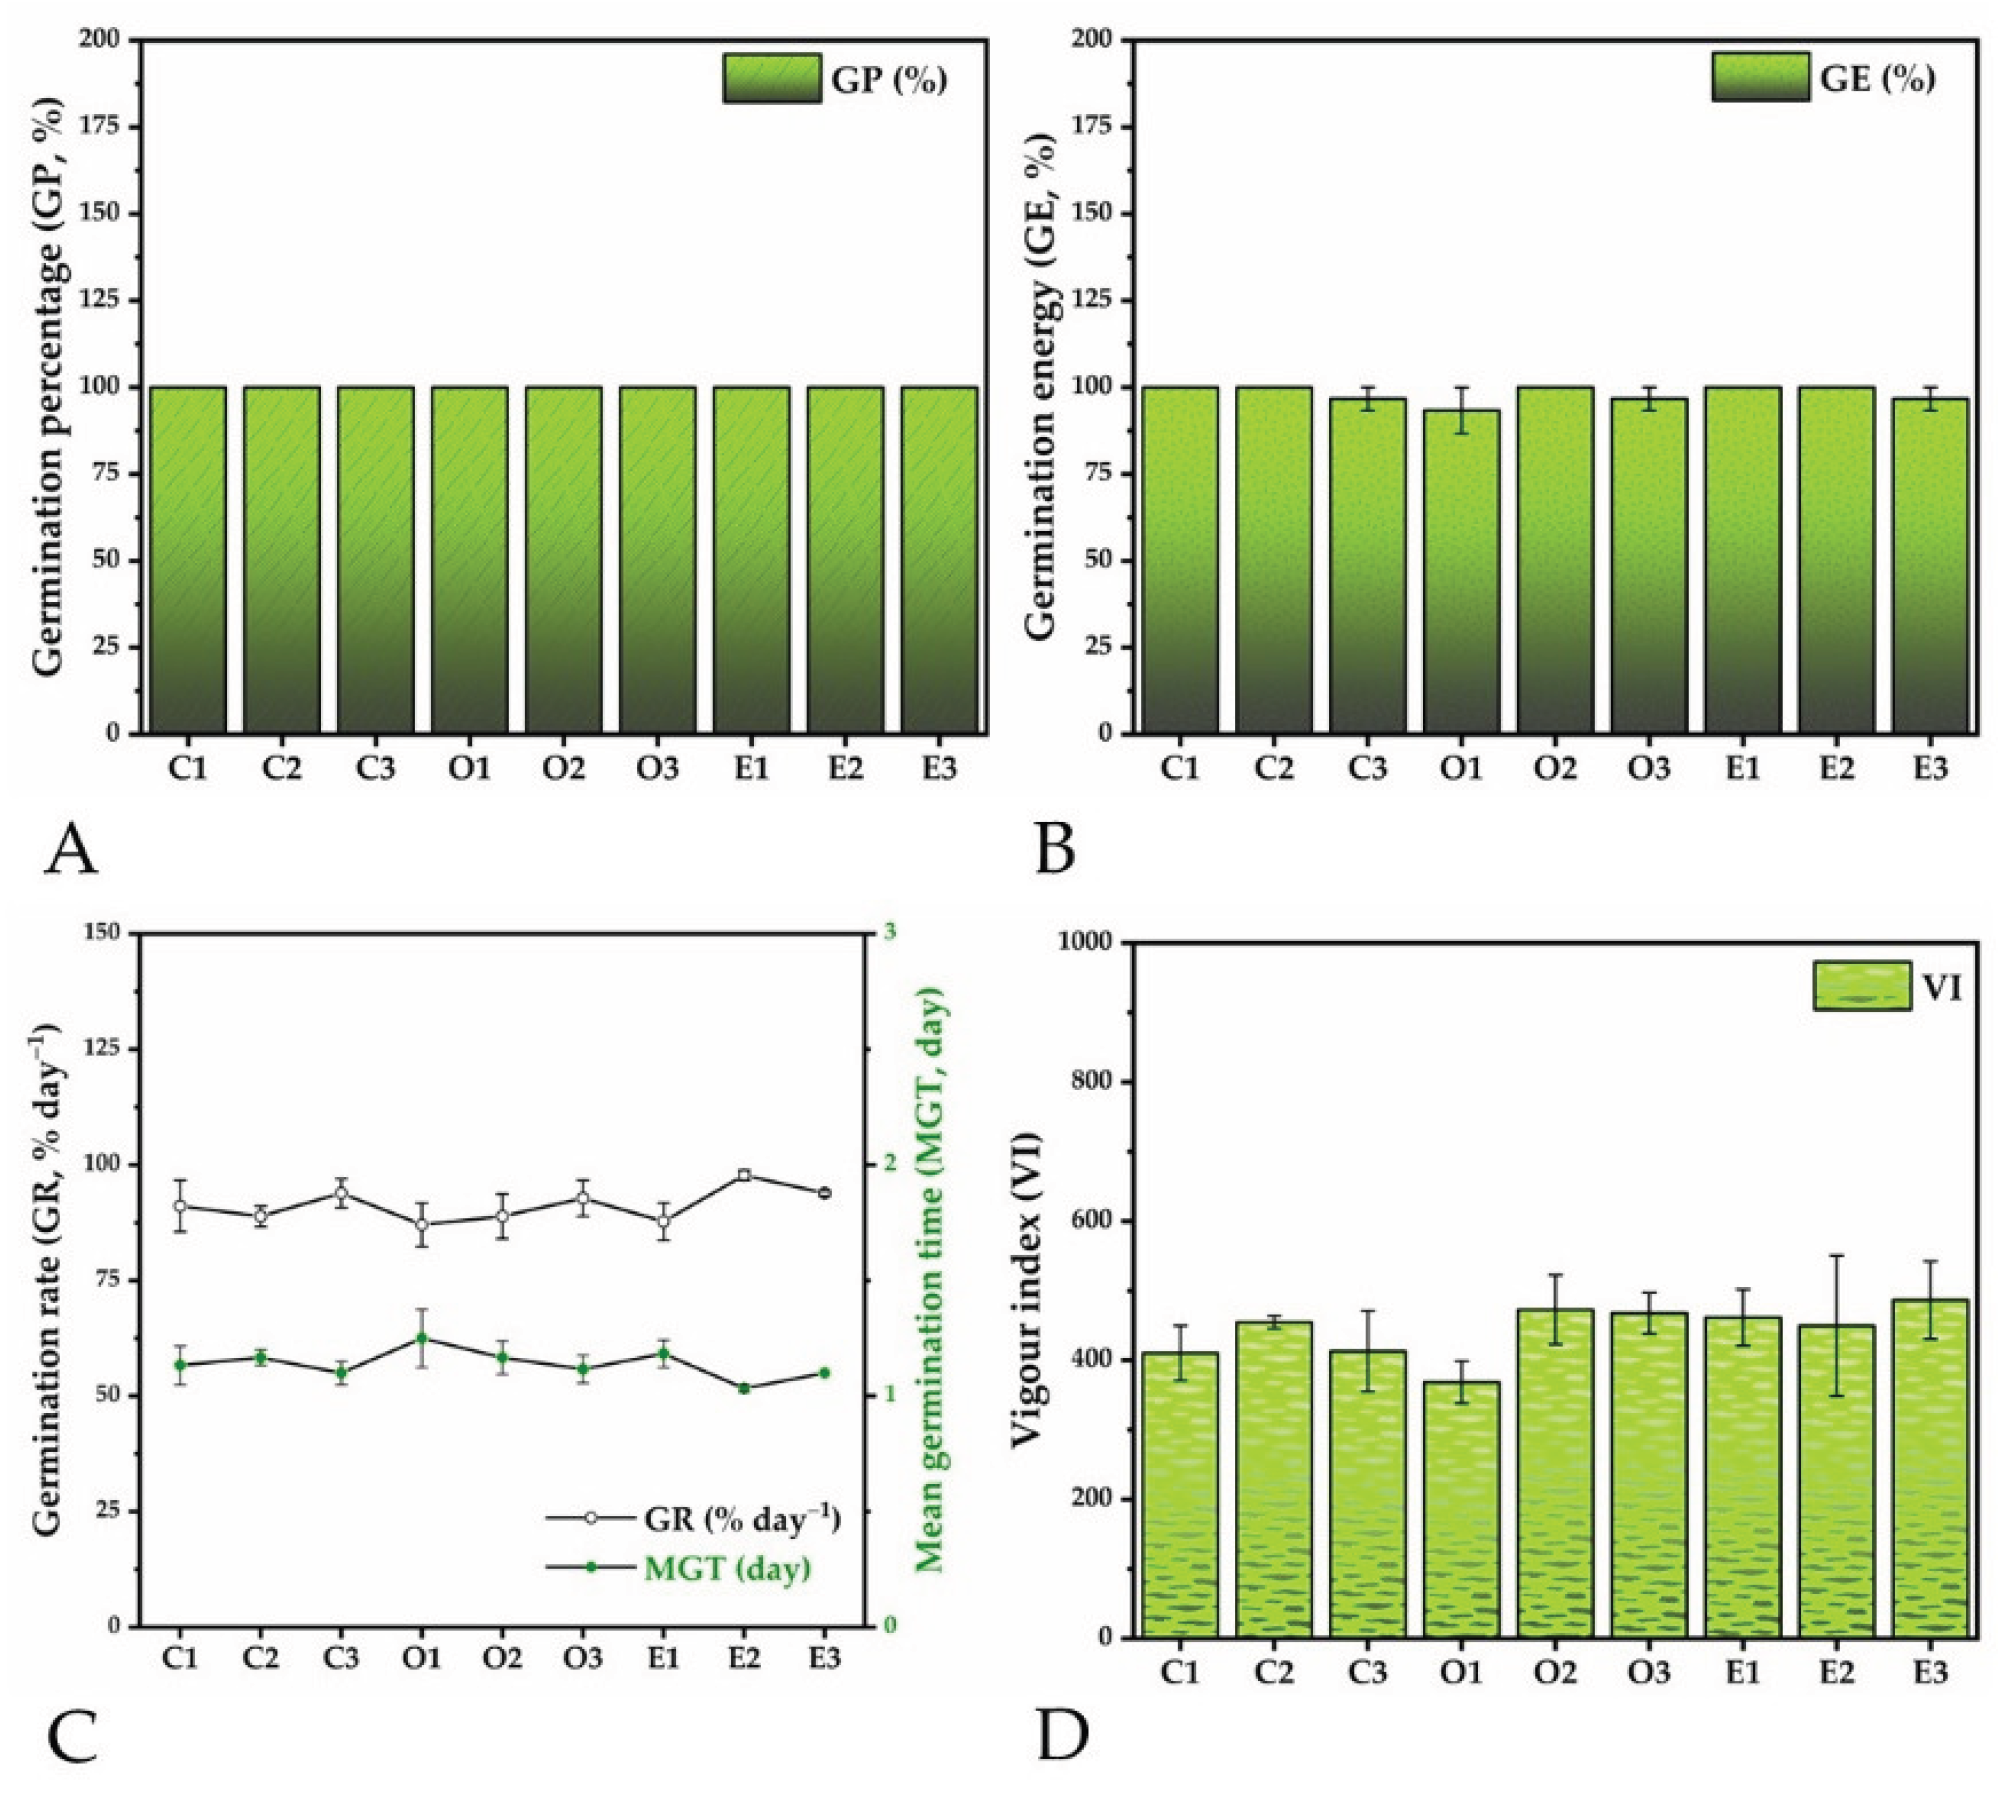
Figure 4.
Mung bean growth parameters of 72h pretreated dry seeds by volatile fumigation: (A) Seedling length, (B) Root length (C) Shoot length; (± error bars, n = 3, α ≤ 0.05); C1 – control (untreated Mung bean seeds) for O1 and E1, C2 - control (untreated Mung bean seeds), for O2 and E2, C3 - control (untreated Mung bean seeds), for O3 and E3; O1, O2, and O3 – thyme essential oil (TEO), dose 0.0135 µL/cm3, 0.054 µL/cm3, and 0.439 µL/cm3, respectively; E1, E2, and E3 – encapsulated thyme essential oil (eTEO), dose 0.0135 µL/cm3, 0.054 µL/cm3, and 0.439 µL/cm3, respectively.
Figure 4.
Mung bean growth parameters of 72h pretreated dry seeds by volatile fumigation: (A) Seedling length, (B) Root length (C) Shoot length; (± error bars, n = 3, α ≤ 0.05); C1 – control (untreated Mung bean seeds) for O1 and E1, C2 - control (untreated Mung bean seeds), for O2 and E2, C3 - control (untreated Mung bean seeds), for O3 and E3; O1, O2, and O3 – thyme essential oil (TEO), dose 0.0135 µL/cm3, 0.054 µL/cm3, and 0.439 µL/cm3, respectively; E1, E2, and E3 – encapsulated thyme essential oil (eTEO), dose 0.0135 µL/cm3, 0.054 µL/cm3, and 0.439 µL/cm3, respectively.
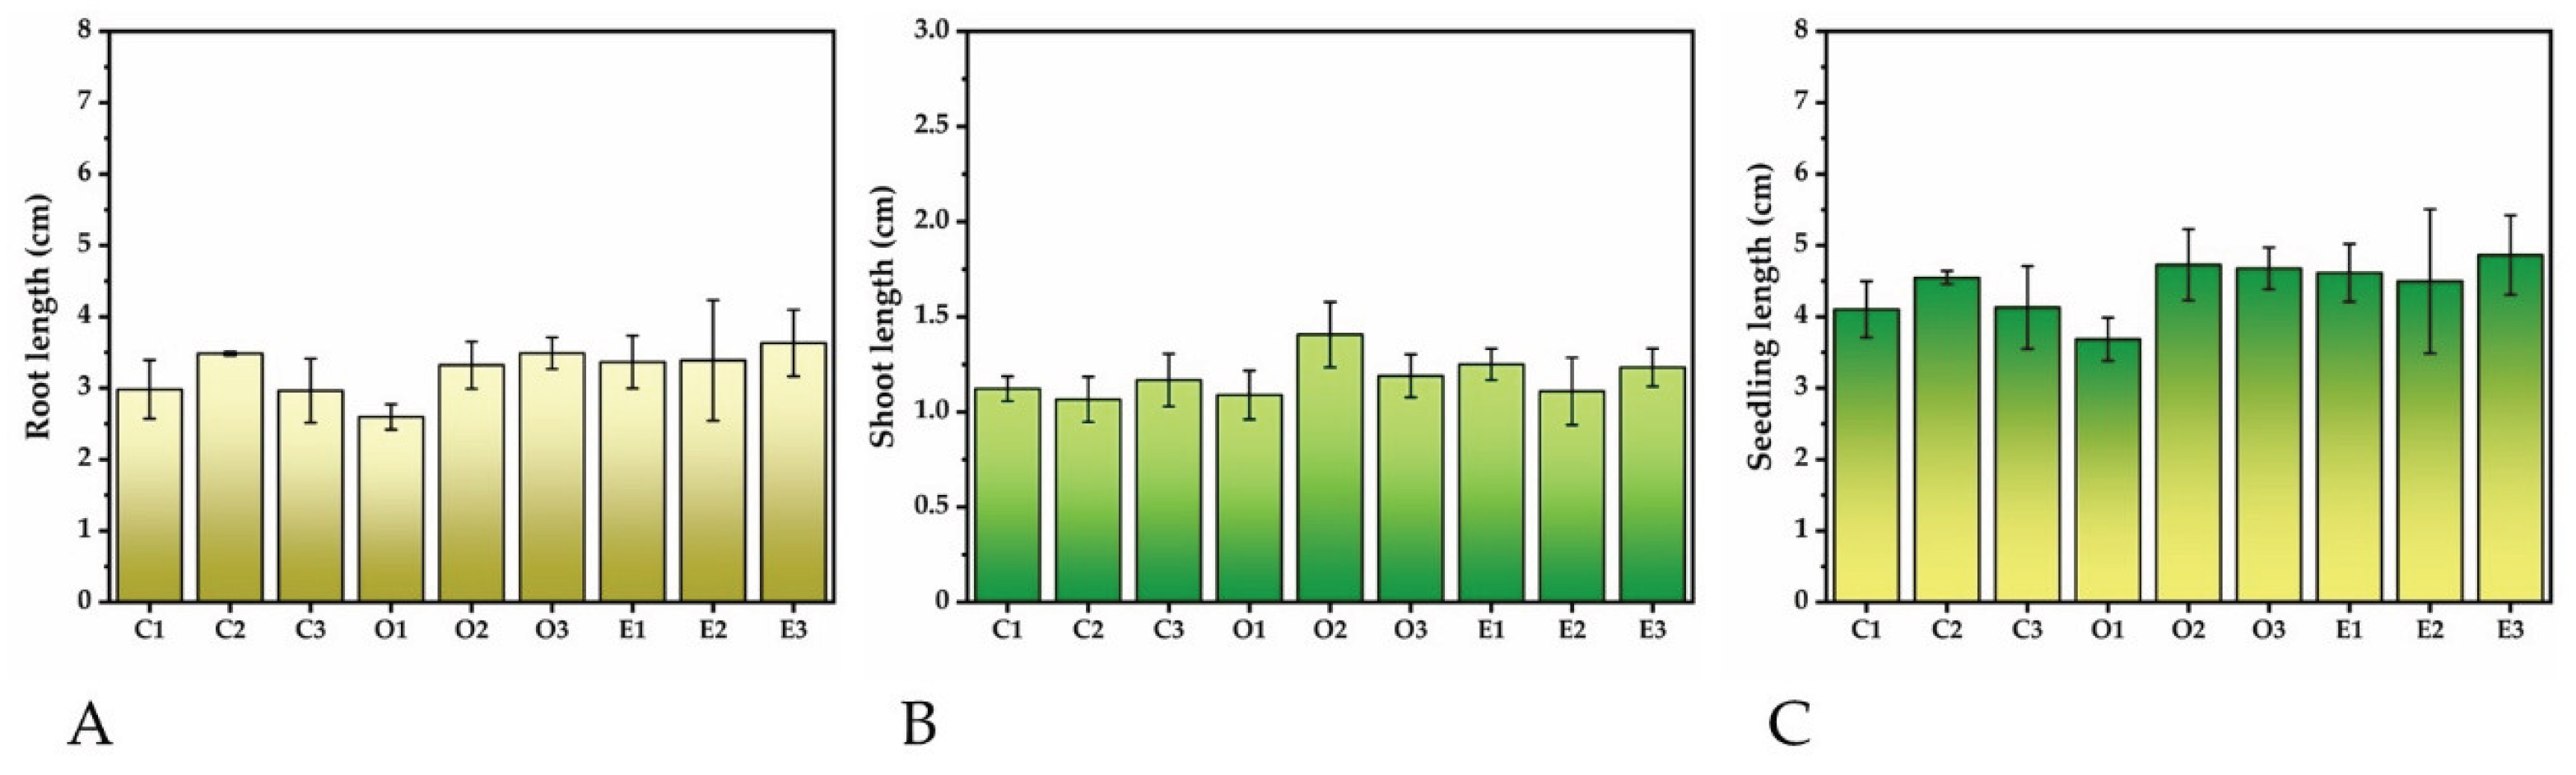
Figure 5.
Mung bean germination parameters induced by fumigation during seed germination, no pretreatment: (A-D) Germination percentage: (A) 50 mM salt stress and 0.439 µL/cm3 dose, (B) 50 mM salt stress and 1.756 µL/cm3 dose, (C) 100 mM salt stress and 0.439 µL/cm3 dose, (D) 100 mM salt stress and 1.756 µL/cm3 dose; (E-H) Vigour index: (E) 50 mM salt stress and 0.439 µL/cm3 dose, (F) 50 mM salt stress and 1.756 µL/cm3 dose, (G) 100 mM salt stress and 0.439 µL/cm3 dose, (H) 100 mM salt stress and 1.756 µL/cm3 dose (± error bars, n = 3, α ≤ 0.05); *—0.05 ≥ p > 0.01, **—0.01 ≥ p > 0.001, ***—p ≤ 0.001, and ms—marginally significant (0.05 < p ≤ 0.1); C – control (untreated Mung bean seeds), no salt stress, O – thyme essential oil (TEO), no salt stress, E – encapsulated thyme essential oil (eTEO), no salt stress, CS – control (untreated Mung bean seeds), salt stress, OS –TEO, salt stress, ES – eTEO, salt stress.
Figure 5.
Mung bean germination parameters induced by fumigation during seed germination, no pretreatment: (A-D) Germination percentage: (A) 50 mM salt stress and 0.439 µL/cm3 dose, (B) 50 mM salt stress and 1.756 µL/cm3 dose, (C) 100 mM salt stress and 0.439 µL/cm3 dose, (D) 100 mM salt stress and 1.756 µL/cm3 dose; (E-H) Vigour index: (E) 50 mM salt stress and 0.439 µL/cm3 dose, (F) 50 mM salt stress and 1.756 µL/cm3 dose, (G) 100 mM salt stress and 0.439 µL/cm3 dose, (H) 100 mM salt stress and 1.756 µL/cm3 dose (± error bars, n = 3, α ≤ 0.05); *—0.05 ≥ p > 0.01, **—0.01 ≥ p > 0.001, ***—p ≤ 0.001, and ms—marginally significant (0.05 < p ≤ 0.1); C – control (untreated Mung bean seeds), no salt stress, O – thyme essential oil (TEO), no salt stress, E – encapsulated thyme essential oil (eTEO), no salt stress, CS – control (untreated Mung bean seeds), salt stress, OS –TEO, salt stress, ES – eTEO, salt stress.
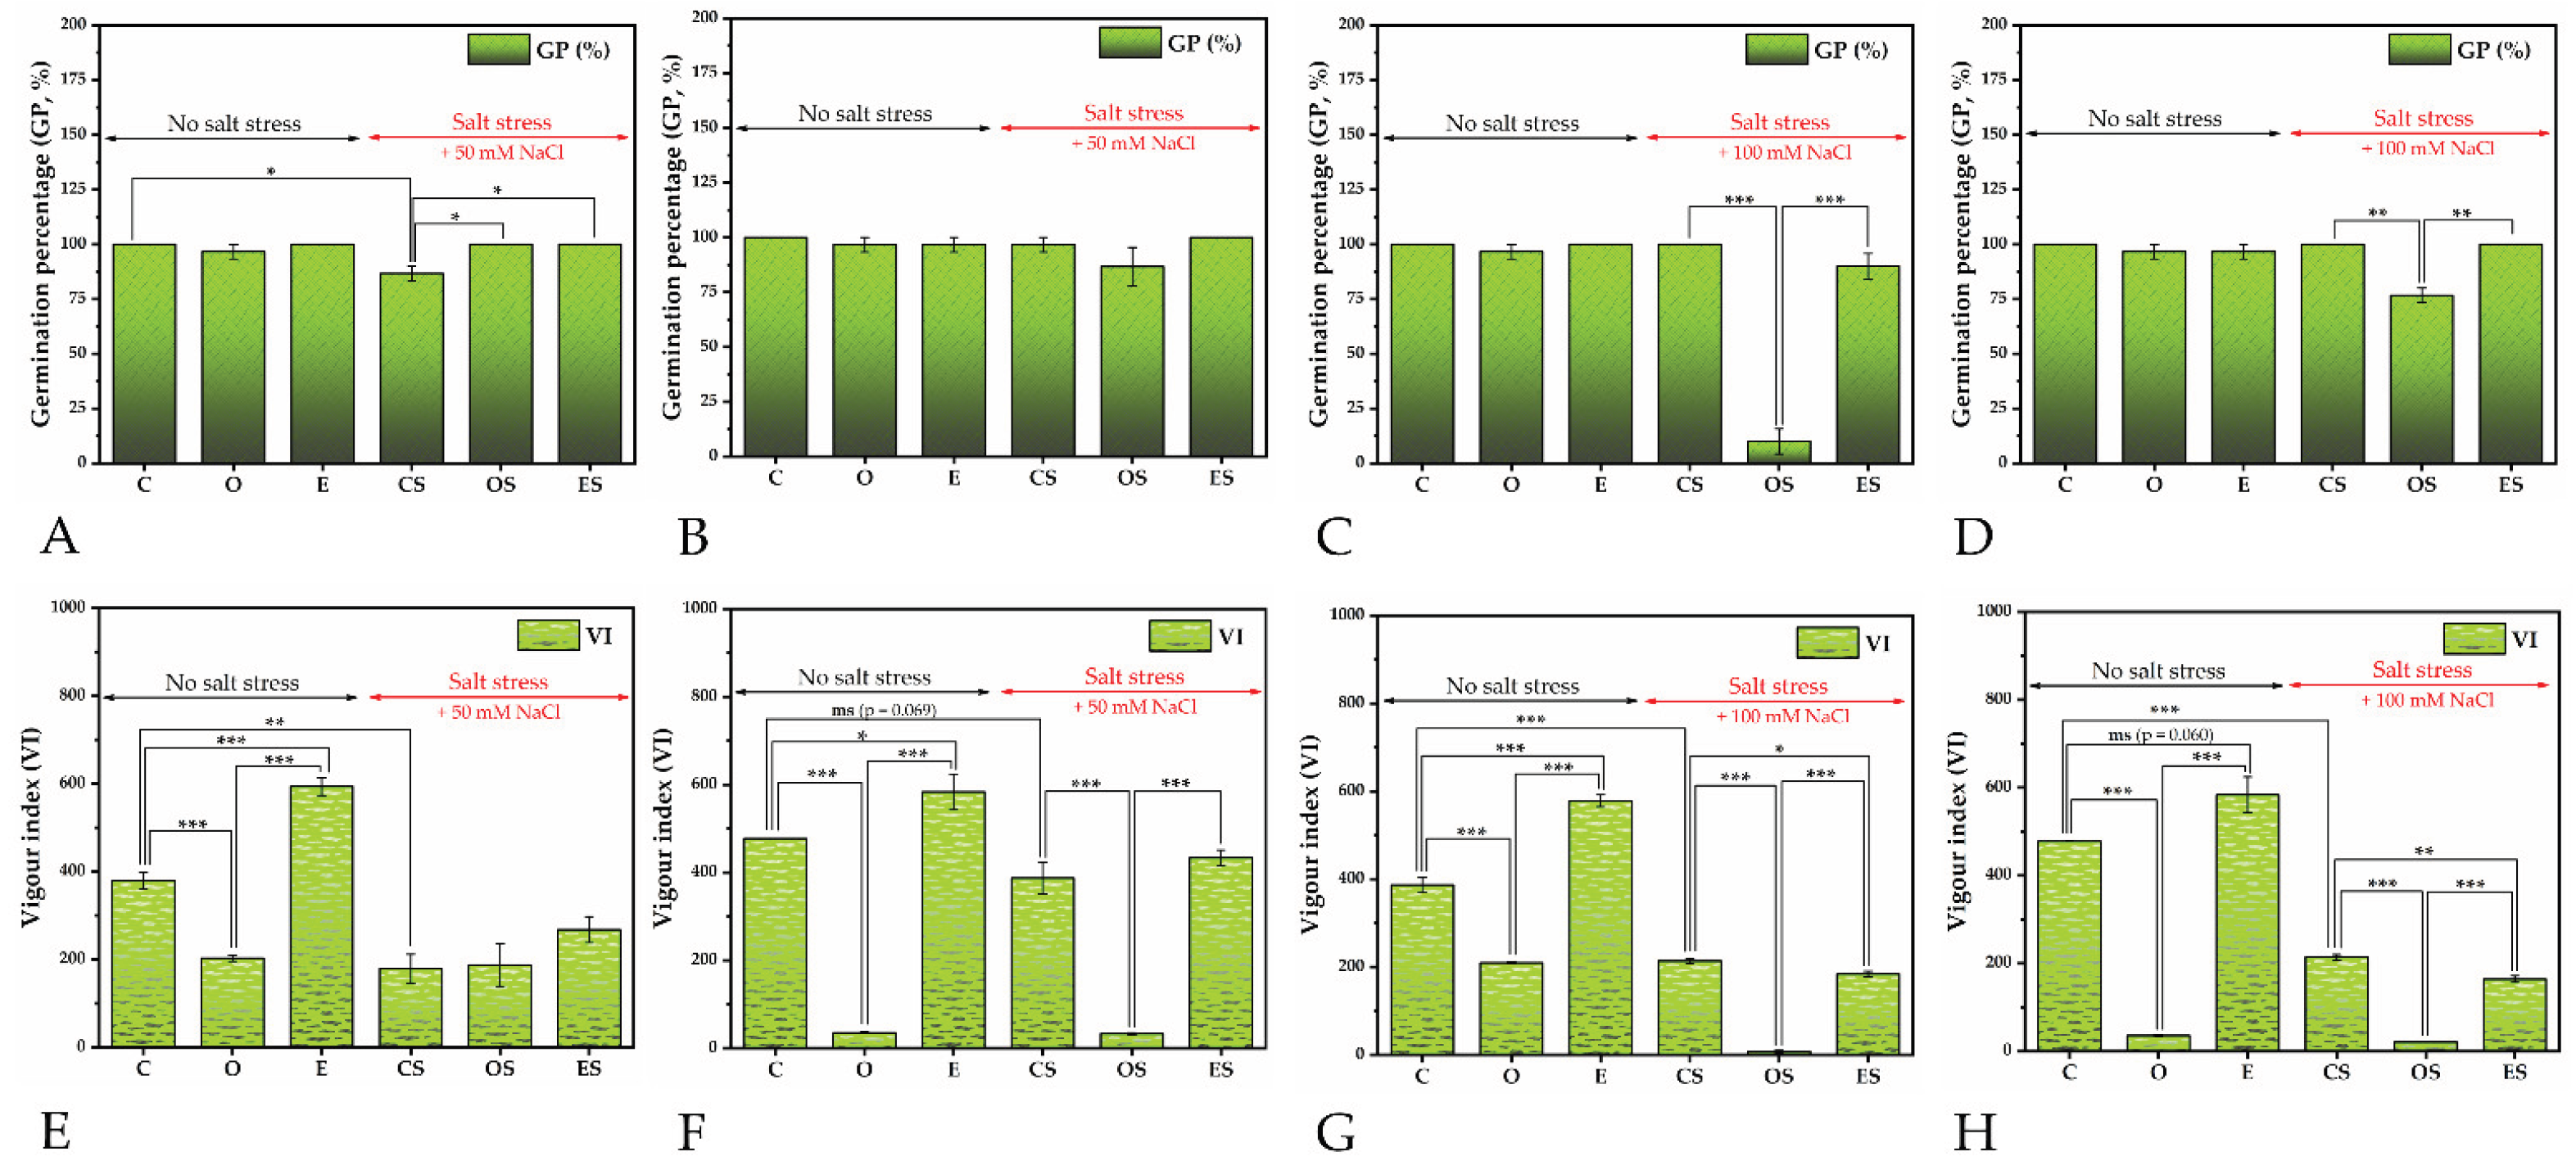
Figure 6.
Mung bean growth parameters (length) induced by fumigation during seed germination, no pretreatment: (A-D) Root length: (A) 50 mM salt stress and 0.439 µL/cm3 dose, (B) 50 mM salt stress and 1.756 µL/cm3 dose, (C) 100 mM salt stress and 0.439 µL/cm3 dose, (D) 100 mM salt stress and 1.756 µL/cm3 dose; (E-H) Shoot length: (E) 50 mM salt stress and 0.439 µL/cm3 dose, (F) 50 mM salt stress and 1.756 µL/cm3 dose, (G) 100 mM salt stress and 0.439 µL/cm3 dose, (H) 100 mM salt stress and 1.756 µL/cm3 dose; (I-L) Seedling length: (I) 50 mM salt stress and 0.439 µL/cm3 dose, (J) 50 mM salt stress and 1.756 µL/cm3 dose, (K) 100 mM salt stress and 0.439 µL/cm3 dose, (L) 100 mM salt stress and 1.756 µL/cm3 dose (± error bars, n = 3, α ≤ 0.05); *—0.05 ≥ p > 0.01, **—0.01 ≥ p > 0.001, ***—p ≤ 0.001, and ms—marginally significant (0.05 < p ≤ 0.1); C – control (untreated Mung bean seeds), no salt stress, O – thyme essential oil, no salt stress, E – encapsulated thyme essential oil, no salt stress, CS – control (untreated Mung bean seeds), salt stress, OS – thyme essential oil, salt stress, ES – encapsulated thyme essential oil, salt stress.
Figure 6.
Mung bean growth parameters (length) induced by fumigation during seed germination, no pretreatment: (A-D) Root length: (A) 50 mM salt stress and 0.439 µL/cm3 dose, (B) 50 mM salt stress and 1.756 µL/cm3 dose, (C) 100 mM salt stress and 0.439 µL/cm3 dose, (D) 100 mM salt stress and 1.756 µL/cm3 dose; (E-H) Shoot length: (E) 50 mM salt stress and 0.439 µL/cm3 dose, (F) 50 mM salt stress and 1.756 µL/cm3 dose, (G) 100 mM salt stress and 0.439 µL/cm3 dose, (H) 100 mM salt stress and 1.756 µL/cm3 dose; (I-L) Seedling length: (I) 50 mM salt stress and 0.439 µL/cm3 dose, (J) 50 mM salt stress and 1.756 µL/cm3 dose, (K) 100 mM salt stress and 0.439 µL/cm3 dose, (L) 100 mM salt stress and 1.756 µL/cm3 dose (± error bars, n = 3, α ≤ 0.05); *—0.05 ≥ p > 0.01, **—0.01 ≥ p > 0.001, ***—p ≤ 0.001, and ms—marginally significant (0.05 < p ≤ 0.1); C – control (untreated Mung bean seeds), no salt stress, O – thyme essential oil, no salt stress, E – encapsulated thyme essential oil, no salt stress, CS – control (untreated Mung bean seeds), salt stress, OS – thyme essential oil, salt stress, ES – encapsulated thyme essential oil, salt stress.
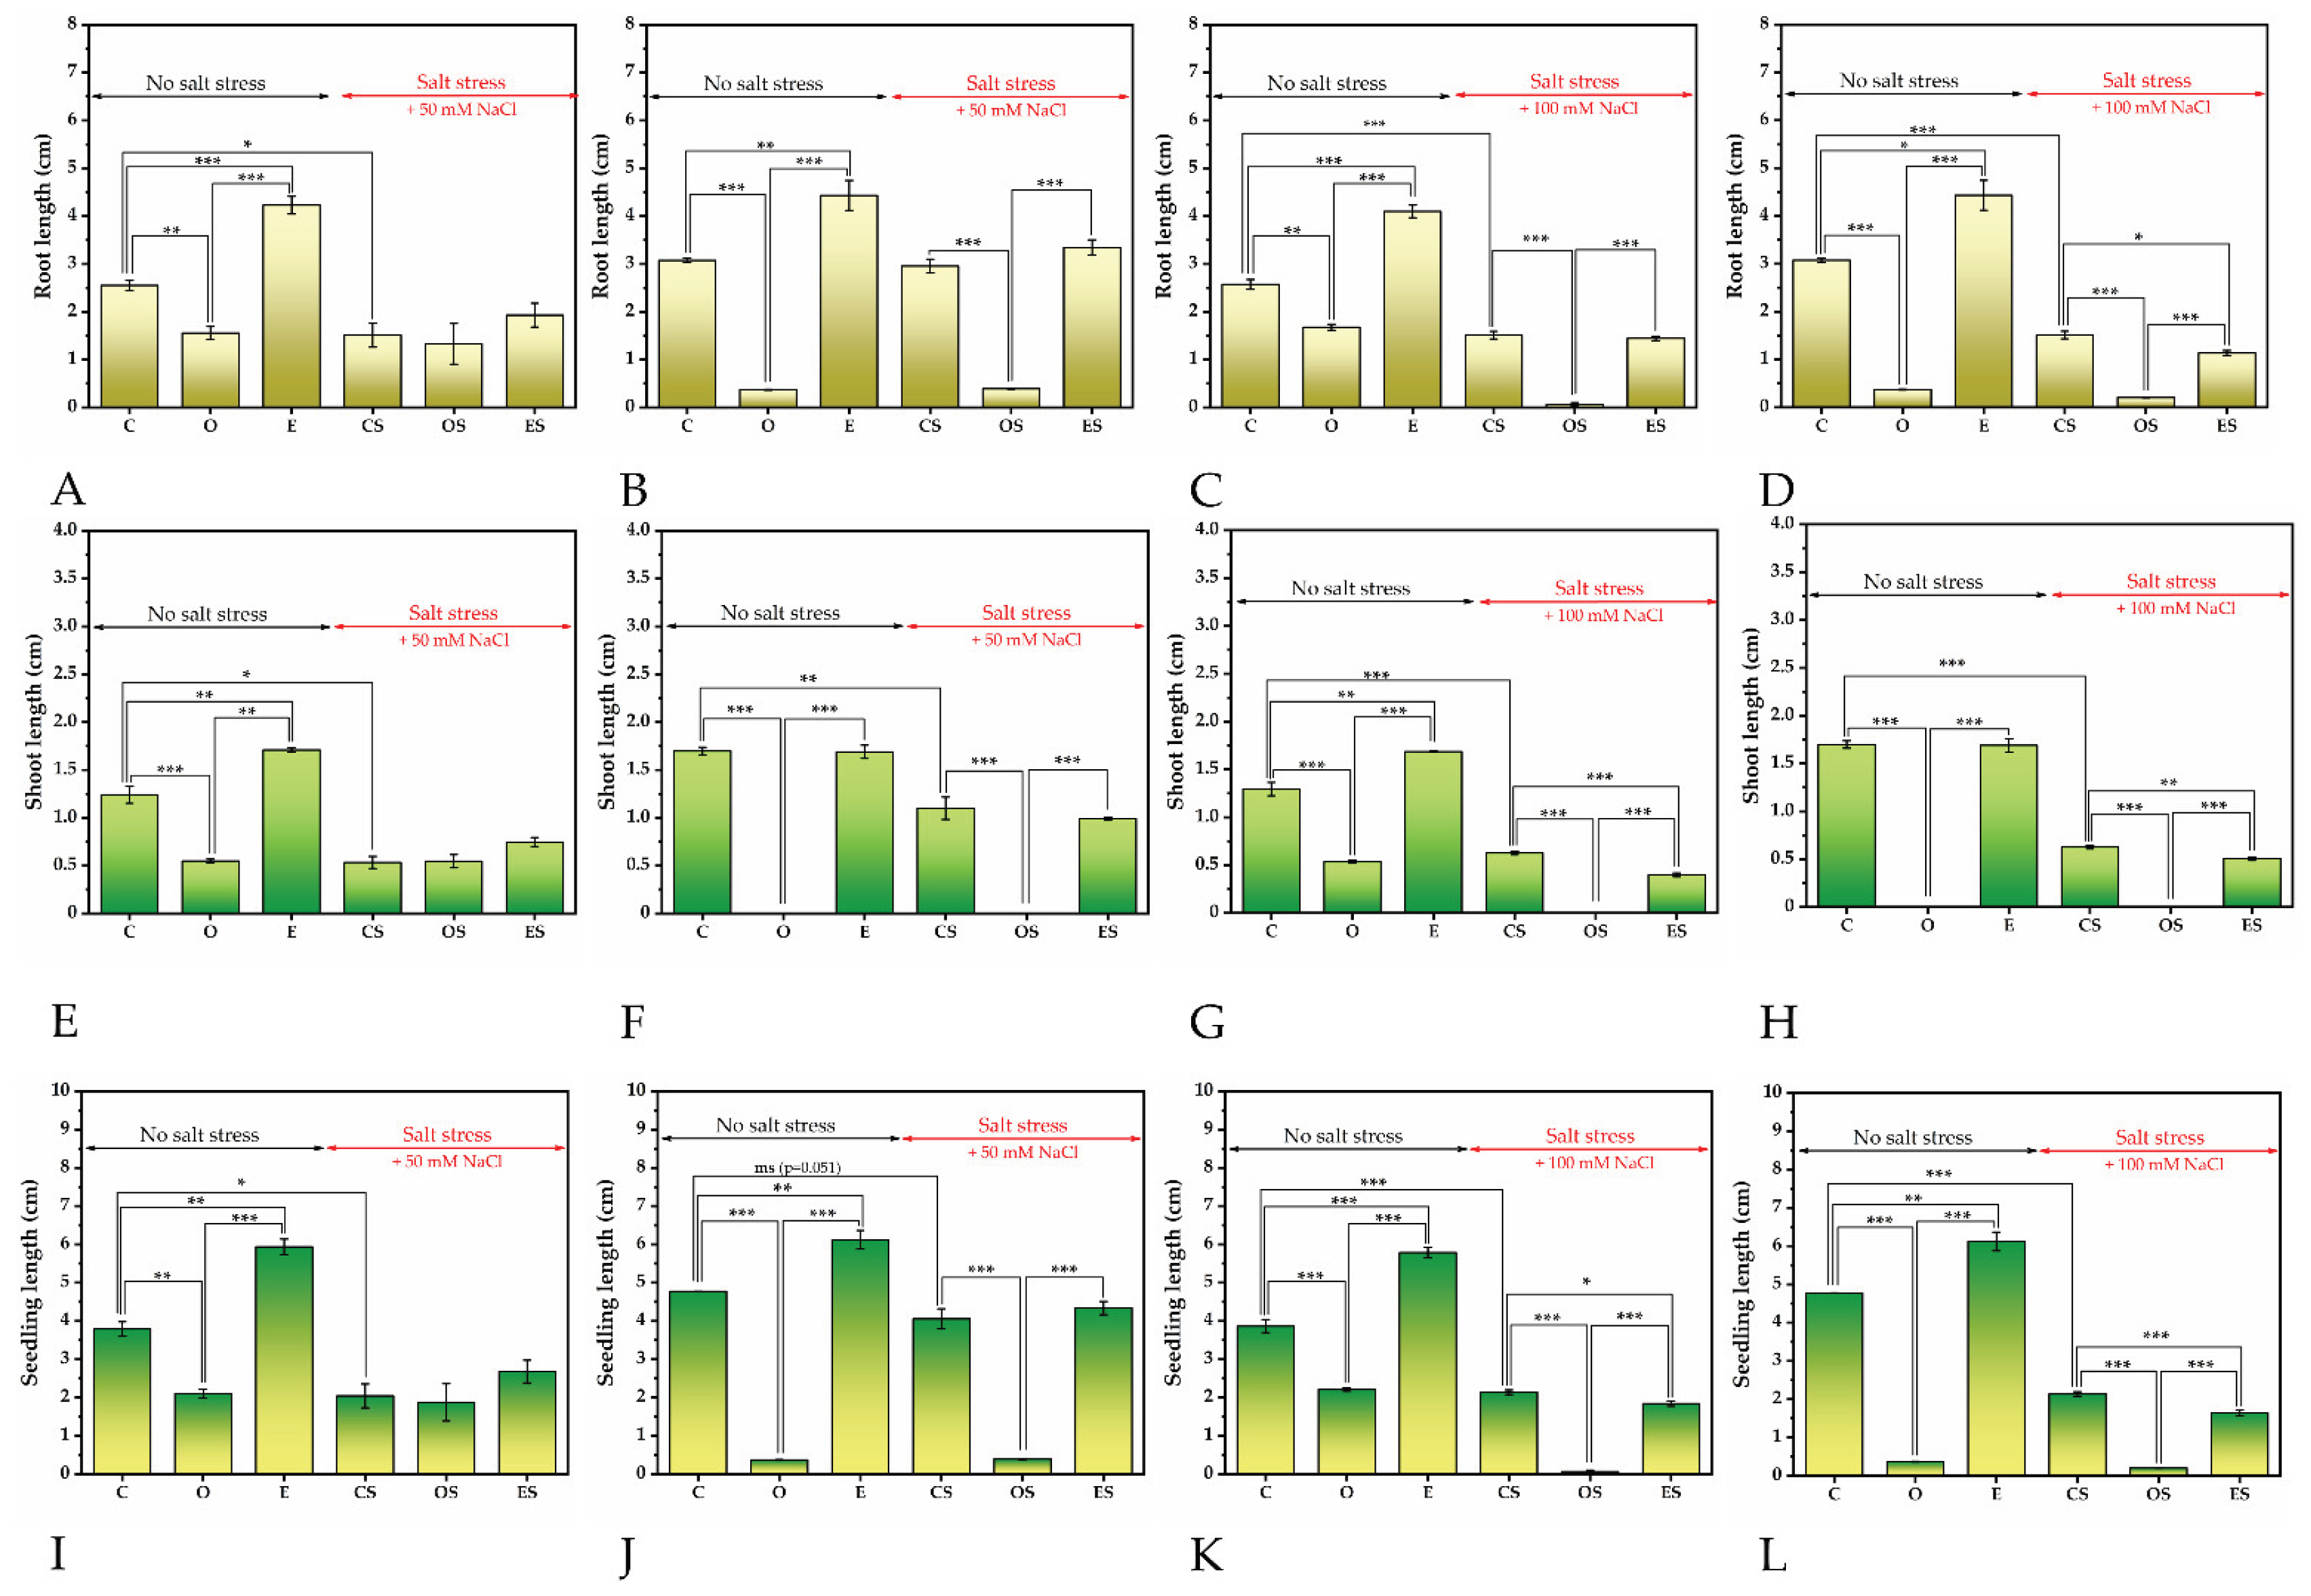
Figure 7.
Mung bean growth parameters (weight) induced by fumigation during seed germination, no pretreatment: (A-D) Root weight: (A) 50 mM salt stress and 0.439 µL/cm3 dose, (B) 50 mM salt stress and 1.756 µL/cm3 dose, (C) 100 mM salt stress and 0.439 µL/cm3 dose, (D) 100 mM salt stress and 1.756 µL/cm3 dose; (E-H) Shoot weight: (E) 50 mM salt stress and 0.439 µL/cm3 dose, (F) 50 mM salt stress and 1.756 µL/cm3 dose, (G) 100 mM salt stress and 0.439 µL/cm3 dose, (H) 100 mM salt stress and 1.756 µL/cm3 dose; (I-L) Seedling weight: (I) 50 mM salt stress and 0.439 µL/cm3 dose, (J) 50 mM salt stress and 1.756 µL/cm3 dose, (K) 100 mM salt stress and 0.439 µL/cm3 dose, (L) 100 mM salt stress and 1.756 µL/cm3 dose (± error bars, n = 3, α ≤ 0.05); *—0.05 ≥ p > 0.01, **—0.01 ≥ p > 0.001, ***—p ≤ 0.001, and ms—marginally significant (0.05 < p ≤ 0.1); C – control (untreated Mung bean seeds), no salt stress, O – thyme essential oil, no salt stress, E – encapsulated thyme essential oil, no salt stress, CS – control (untreated Mung bean seeds), salt stress, OS – thyme essential oil, salt stress, ES – encapsulated thyme essential oil, salt stress.
Figure 7.
Mung bean growth parameters (weight) induced by fumigation during seed germination, no pretreatment: (A-D) Root weight: (A) 50 mM salt stress and 0.439 µL/cm3 dose, (B) 50 mM salt stress and 1.756 µL/cm3 dose, (C) 100 mM salt stress and 0.439 µL/cm3 dose, (D) 100 mM salt stress and 1.756 µL/cm3 dose; (E-H) Shoot weight: (E) 50 mM salt stress and 0.439 µL/cm3 dose, (F) 50 mM salt stress and 1.756 µL/cm3 dose, (G) 100 mM salt stress and 0.439 µL/cm3 dose, (H) 100 mM salt stress and 1.756 µL/cm3 dose; (I-L) Seedling weight: (I) 50 mM salt stress and 0.439 µL/cm3 dose, (J) 50 mM salt stress and 1.756 µL/cm3 dose, (K) 100 mM salt stress and 0.439 µL/cm3 dose, (L) 100 mM salt stress and 1.756 µL/cm3 dose (± error bars, n = 3, α ≤ 0.05); *—0.05 ≥ p > 0.01, **—0.01 ≥ p > 0.001, ***—p ≤ 0.001, and ms—marginally significant (0.05 < p ≤ 0.1); C – control (untreated Mung bean seeds), no salt stress, O – thyme essential oil, no salt stress, E – encapsulated thyme essential oil, no salt stress, CS – control (untreated Mung bean seeds), salt stress, OS – thyme essential oil, salt stress, ES – encapsulated thyme essential oil, salt stress.
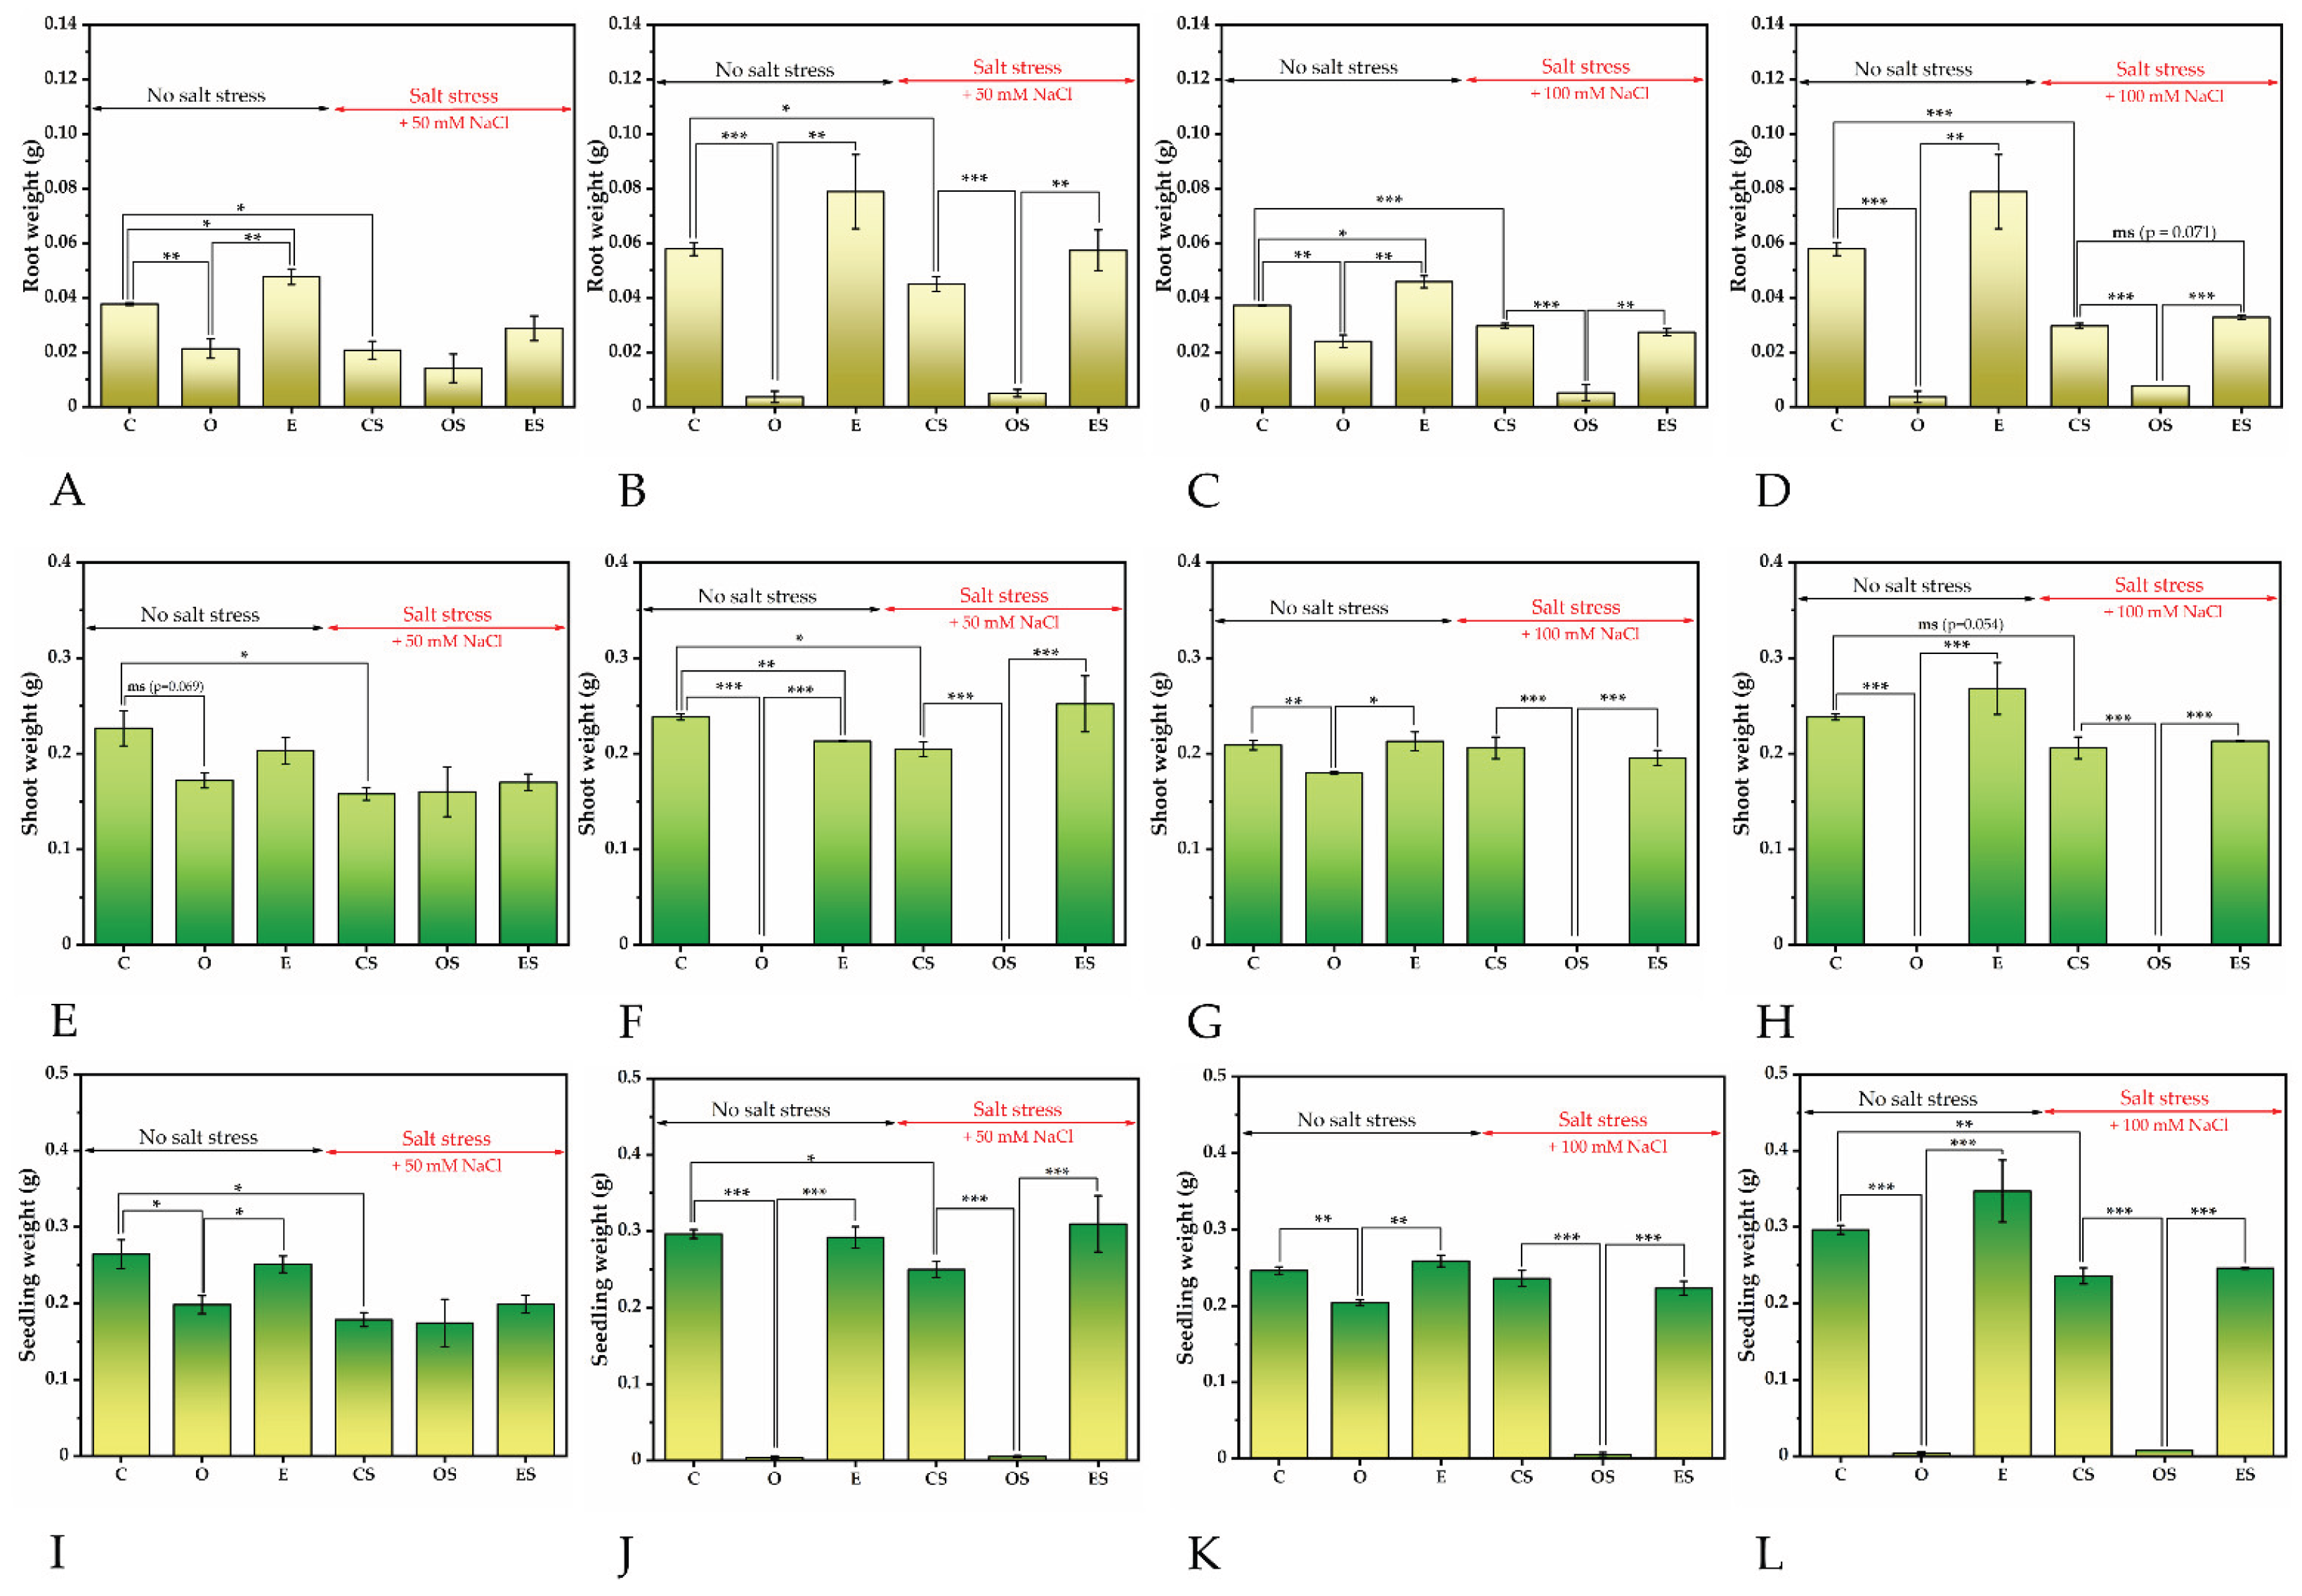
Figure 8.
Antifungal activity: (A-B) Percent of phytopathogenic fungi growth inhibition by TEO and eTEO at different essential oil doses expressed per volume of air in the Petri dish: (A) F. graminearum, (B) R. solani; D1 – 0.0135 µL/cm3, D2 – 0.027 µL/cm3, D3 – 0.049 µL/cm3, D4 – 0.122 µL/cm3, D5 – 0.244 µL/cm3, D6 – 0.329 µL/cm3, D7 – 0.439 µL/cm3; the values are represented as means ± standard deviation; TEO – thyme essential oil, eTEO – encapsulated thyme essential oil.
Figure 8.
Antifungal activity: (A-B) Percent of phytopathogenic fungi growth inhibition by TEO and eTEO at different essential oil doses expressed per volume of air in the Petri dish: (A) F. graminearum, (B) R. solani; D1 – 0.0135 µL/cm3, D2 – 0.027 µL/cm3, D3 – 0.049 µL/cm3, D4 – 0.122 µL/cm3, D5 – 0.244 µL/cm3, D6 – 0.329 µL/cm3, D7 – 0.439 µL/cm3; the values are represented as means ± standard deviation; TEO – thyme essential oil, eTEO – encapsulated thyme essential oil.
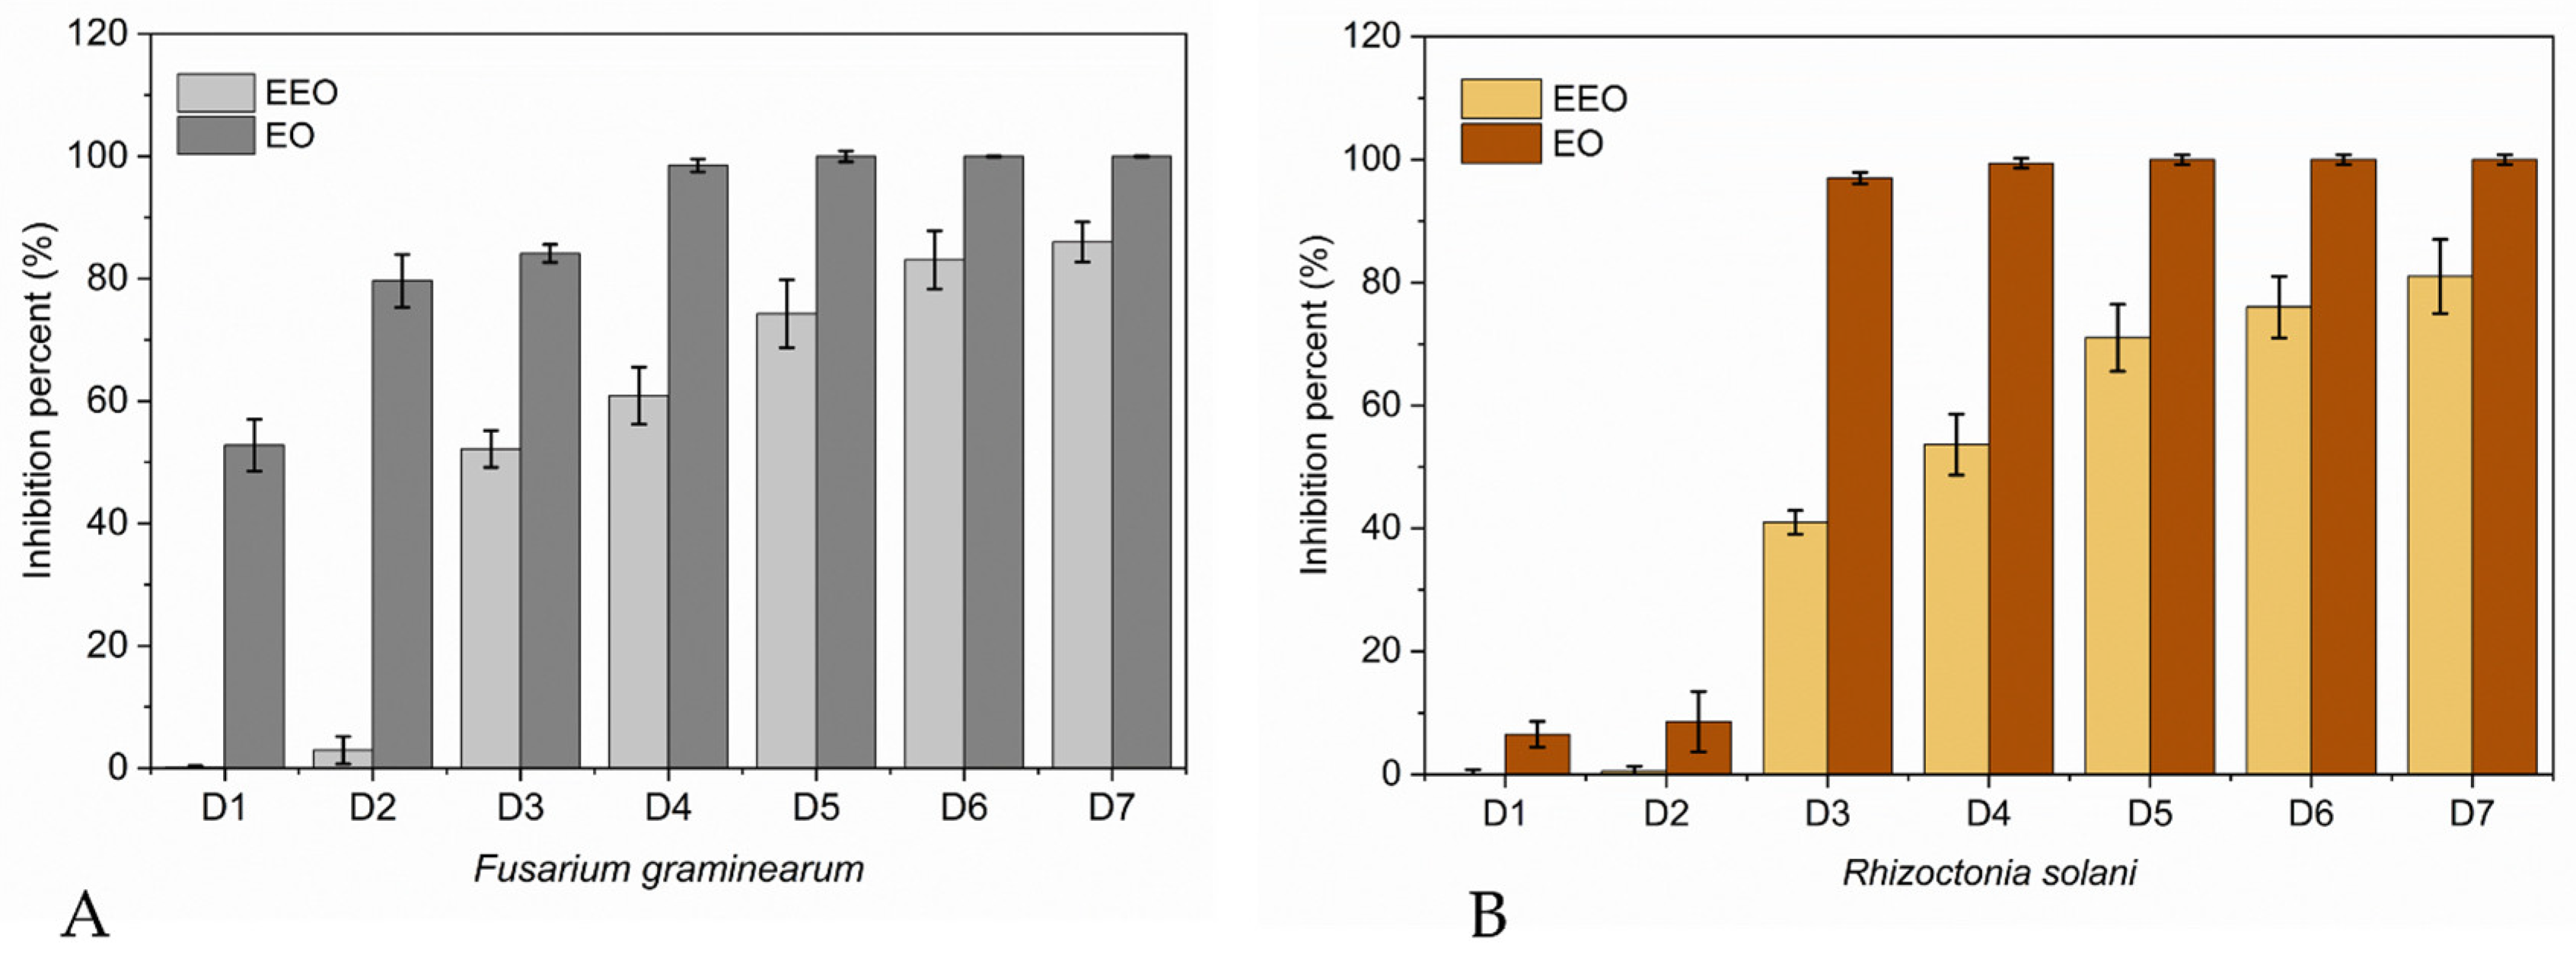
Figure 9.
Light microscopy observations of phytopathogenic fungi: (A) F. graminearum, (B) F. graminearum grown in the presence of D7 eTEO, (C) R. solani, (D) R. solani grown in the presence of D7 eTEO; D7 – 0.439 µL/cm3; eTEO – encapsulated thyme essential oil.
Figure 9.
Light microscopy observations of phytopathogenic fungi: (A) F. graminearum, (B) F. graminearum grown in the presence of D7 eTEO, (C) R. solani, (D) R. solani grown in the presence of D7 eTEO; D7 – 0.439 µL/cm3; eTEO – encapsulated thyme essential oil.
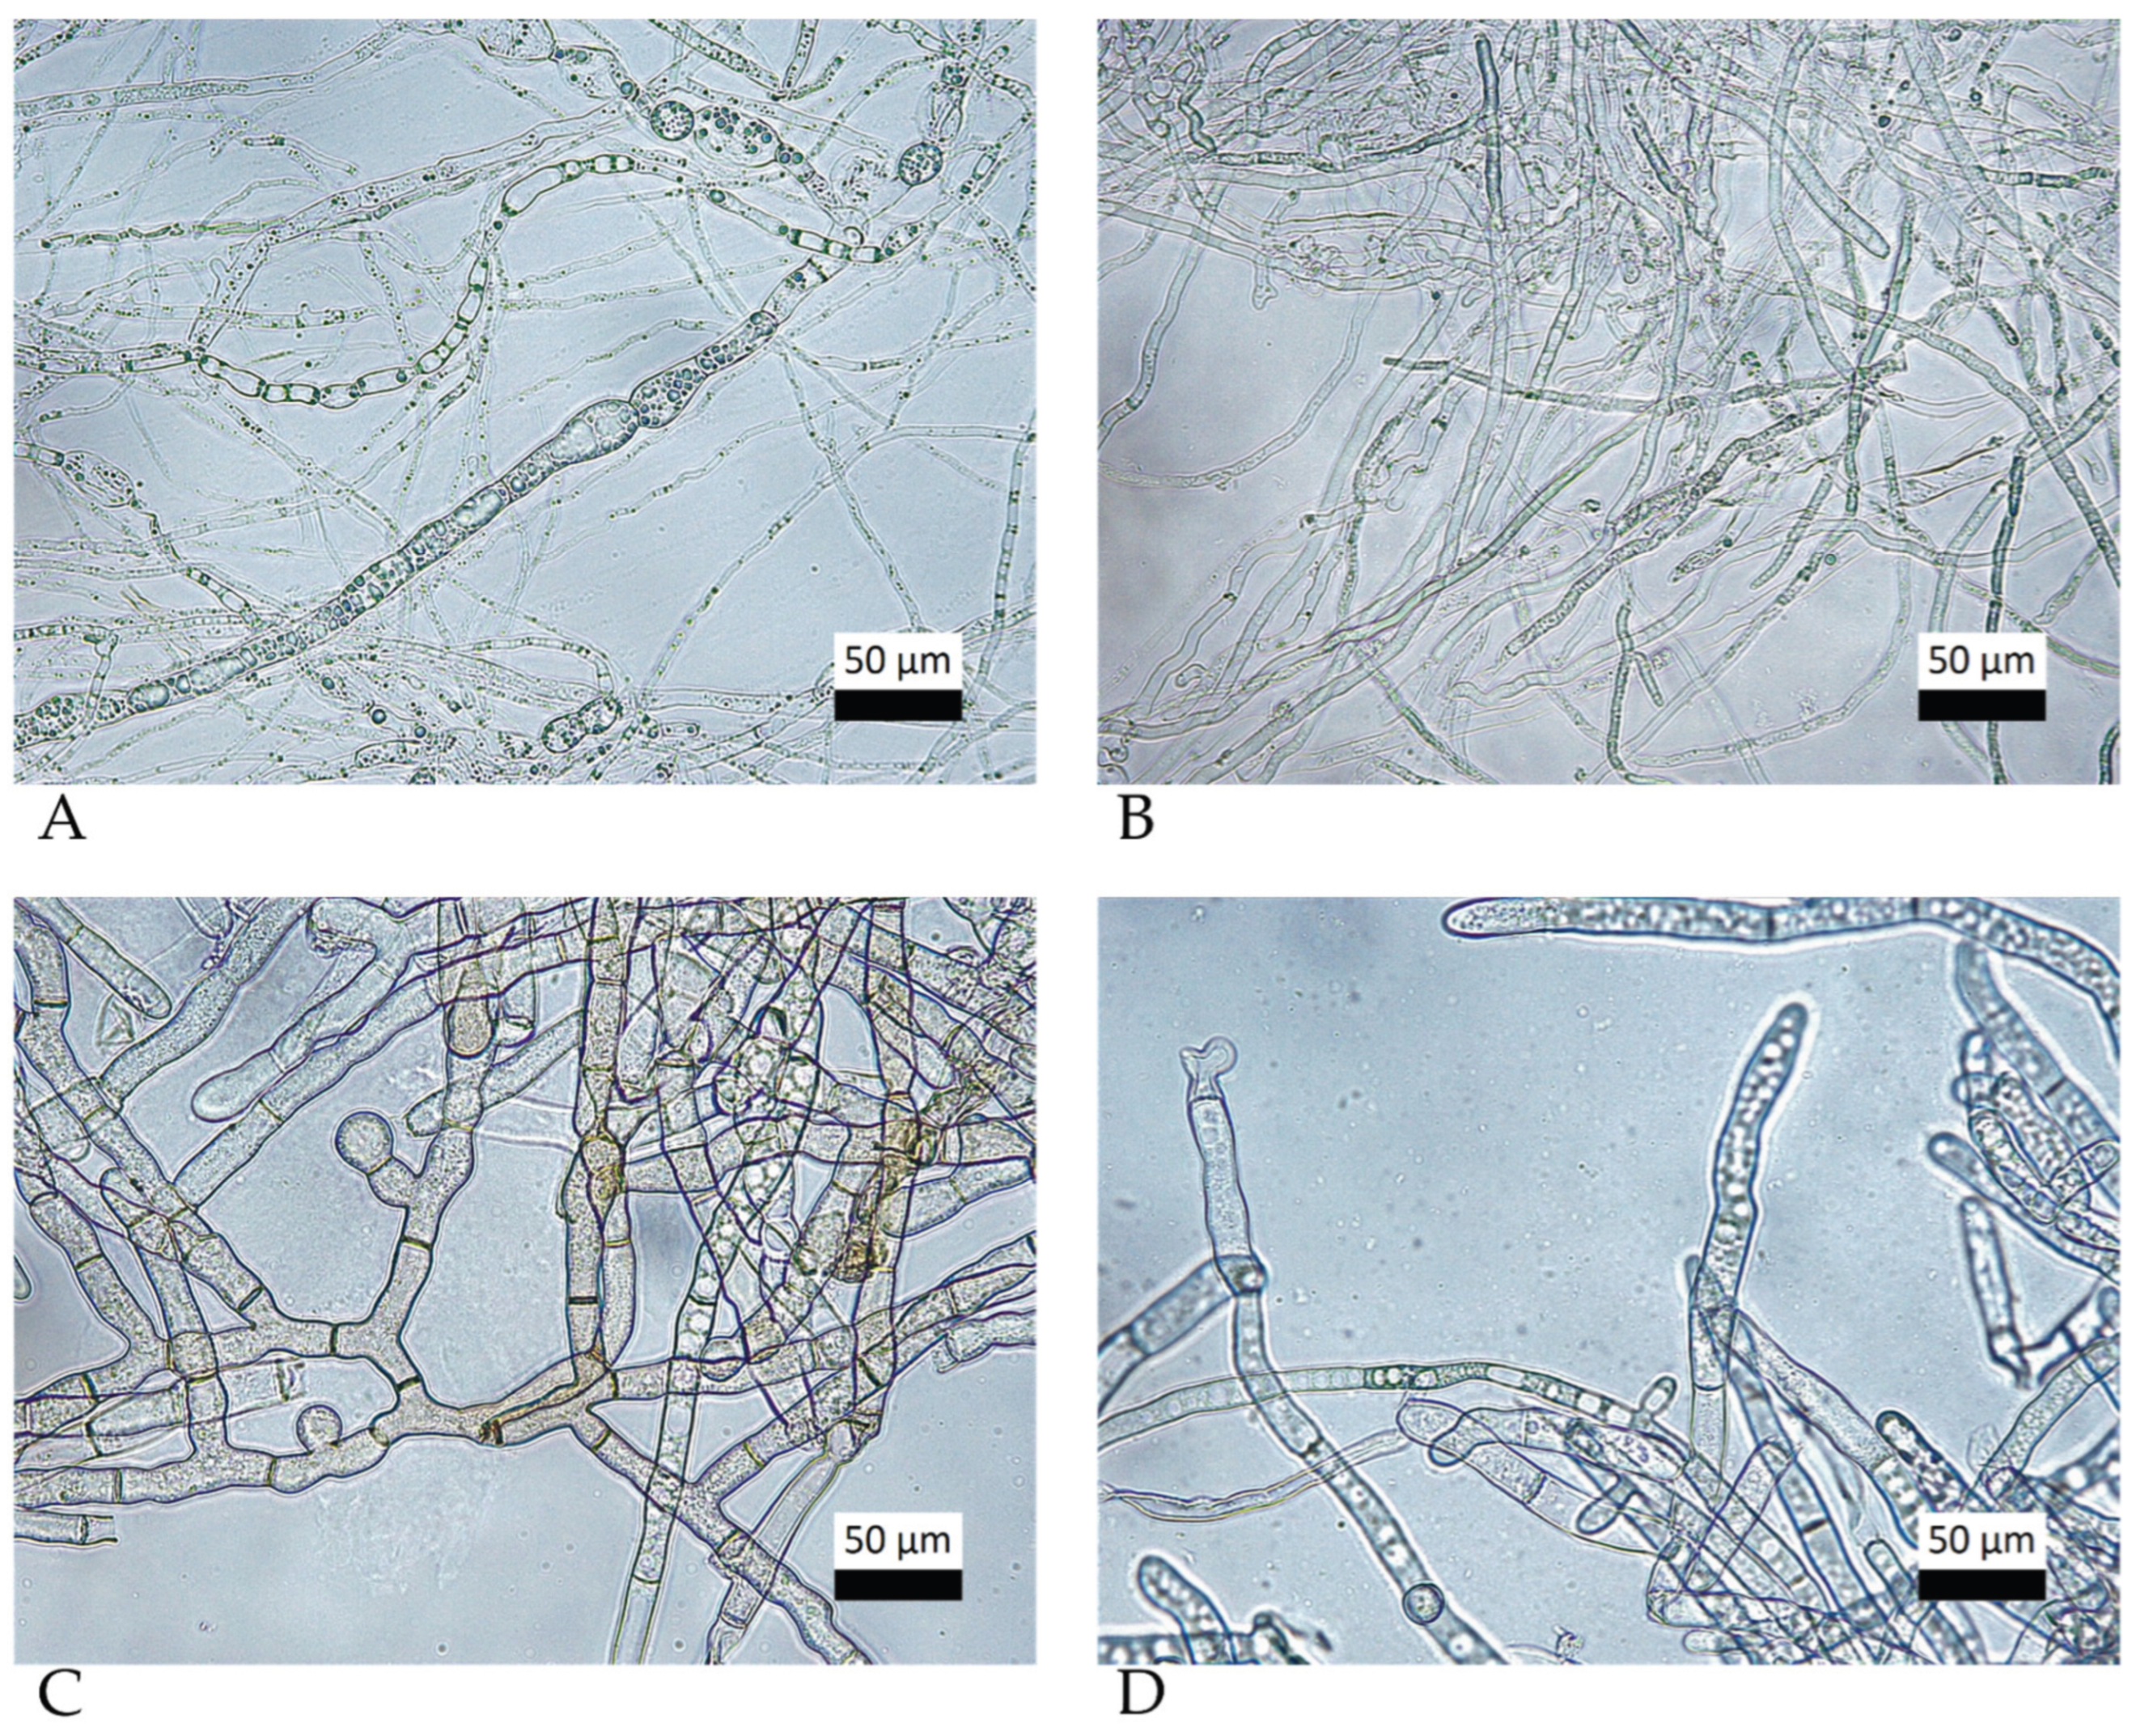

Table 1.
FTIR band assignment for the sodium lignosulphonate spectrum.
| Wavenumber (cm-1) | Assignment |
| 3363 | O-H stretching vibration |
| 2935 | Aliphatic C-H stretching vibration |
| 2846 | Aromatic C-H stretching vibration |
| 1593 | C=C stretching vibration |
| 1506 | C=O stretching vibration |
| 1415 | Aromatic C=C breathing vibration |
| 1031 | S=O stretching vibration |
| 621 | C-S stretching vibration |
Table 2.
Composition of the prepared emulsions and their physicochemical properties.
| Sample composition | Parameters at t0 | Parameters at t24 | ||||||||
|---|---|---|---|---|---|---|---|---|---|---|
| Sample | Aqueous phase % (v/v) |
Surfactant % (v/v) |
MCT % (v/v) |
TEO % (v/v) |
PS (nm) |
PDI |
ZP (mV) |
PS (nm) |
PDI |
ZP (mV) |
| NE1 | 50.000 | 10.000 | 38.100 | 1.900 | 815.430 ± 131.525 |
0.390 ± 0.201 |
−3.750 ± 0.000 |
n.d.* | n.d. | n.d. |
| NE2 | 65.000 | 10.000 | 23.810 | 1.190 | 175.996 ± 2.381 |
0.216 ± 0.023 |
−16.896 ± 0.012 |
165.390 ± 2.771 |
0.170 ± 0.040 |
-16.890 ± 0.000 |
| NE3 | 75.000 | 10.000 | 14.290 | 0.710 | 120.333 ± 5.165 |
0.186 ± 0.068 |
−11.260 ± 0.000 |
n.d. | n.d. | n.d. |
| NE4 | 65.000 | 5.000 | 28.570 | 1.420 | n.d. | n.d. | n.d. | n.d. | n.d. | n.d. |
| NE5 | 65.000 | 15.000 | 19.040 | 0.950 | 134.086 ± 25.921 |
0.160 ± 0.113 |
−15.556 ± 1.258 |
115.833 ± 1.085 |
0.189 ± 0.006 |
-14.993 ± 1.875 |
*n.d. – not determined; MCT – fractionated coconut oil; TEO – thyme essential oil; PS – particle size; PDI – polydispersity index; ZP – Zeta potential.
Table 3.
Thyme essential oil composition according to SPME-GC-MS analysis.
| Chemical Cmpound | RT* (min) | Concentration (peak area %) |
|---|---|---|
| β-Thujene | 3.747 | 0.41 |
| β-Pinene | 3.962 | 2.69 |
| β-Myrcene | 5.02 | 0.29 |
| Terpinolene | 5.362 | 0.22 |
| 3-Carene | 6.022 | 0.21 |
| γ-Terpinene | 7.3 | 33 |
| m-Cymene | 8.041 | 29.05 |
| p-Cymene | 8.961 | 0.04 |
| 1R,4R-p-Mentha-2,8-dien-1-ol | 9.605 | 0.01 |
| Fenchone | 12.529 | 0.08 |
| 2-octanol | 14.057 | 0.14 |
| p-Cymenene | 14.67 | 0.15 |
| D-isomenthone | 15.641 | 0.01 |
| Cosemn-2-ol | 17.911 | 0.14 |
| p-Menth-4-en-3-one | 18.585 | 0.01 |
| 1,2-Dihydrolinalool | 18.841 | 0.05 |
| Linalool | 19.158 | 3.03 |
| Terpinen-4-ol | 20.063 | 0.05 |
| cis-Anethole | 21.126 | 0.01 |
| cis-p-Mentha-2,8-dien-1-ol | 21.474 | 0.03 |
| Cumaldehyde | 22.429 | 0.02 |
| Phenol, 2-(1,1-dimethyl-2-propenyl)-3,6-dimethyl- | 22.588 | 0.02 |
| Anethole | 22.895 | 0.01 |
| 8,9-Dehydrothymol | 24.265 | 0.06 |
| Propofol | 24.351 | 0.02 |
| 5-Methyl-2,4-diisopropylphenol | 24.418 | 0.25 |
| 2-tert-Butyl-m-Cresol | 25.338 | 0.04 |
| Thymol | 26.018 | 21.51 |
| Carvacrol | 26.35 | 8.46 |
| Total | 99.87 |
*RT = retention time.
Disclaimer/Publisher’s Note: The statements, opinions and data contained in all publications are solely those of the individual author(s) and contributor(s) and not of MDPI and/or the editor(s). MDPI and/or the editor(s) disclaim responsibility for any injury to people or property resulting from any ideas, methods, instructions or products referred to in the content. |
© 2026 by the authors. Licensee MDPI, Basel, Switzerland. This article is an open access article distributed under the terms and conditions of the Creative Commons Attribution (CC BY) license (http://creativecommons.org/licenses/by/4.0/).
Copyright: This open access article is published under a Creative Commons CC BY 4.0 license, which permit the free download, distribution, and reuse, provided that the author and preprint are cited in any reuse.


