

Submitted:
20 July 2026
Posted:
20 July 2026
You are already at the latest version
Abstract
Hematopoietic malignancies are commonly associated with oncogenic chromosomal translocations involving histone methylases. Also, the phosphoinositide 3-kinases (PI3Ks) mediate growth factor signaling and are implicated in cancer as drivers of cellular transformation and as targets for anticancer agents. While histone methylation and growth factor signals interact at gene promoters, the interaction mechanisms are not well understood. Pan-specific and paralog-selective class I PI3K inhibitors were tested for the ability to inhibit the proliferation of the leukemia cells lines THP-1 and U937. Further, the transcriptional effects in U937 cells were studied with RNA-seq. Differential cytotoxicity was observed with taselisib being the most cytotoxic compound followed by idelalisib and wortmannin. Alpelisib and seralisib had lower levels of cytotoxicity in both cell lines. Morphological studies showed cell shrinkage and nuclear fragmentation in wortmannin and taselisib treated U937 cells. The transcriptional effects of idelalisib, taselisib, and wortmannin were studied in U937 cells. Consistent with a myeloid lineage, PI3Kδ was most abundant PI3K followed by PI3Kγ at 2-fold lower, and PI3Kβ at 4-fold lower. PI3Kα and class III PI3Ks were detected at much lower levels. Histone lysine methyltransferases and related proteins also displayed marked differences in expression levels. Taselisib caused the most changes in gene expression patterns with the dominant pathways being RNA processing, cell cycle and inflammatory pathways. The results identify genes in the PI3K/AKT pathway as well and histone modification enzymes that correlate with treatment with specific PI3K inhibitors and that could provide insights into the mechanisms of blockage of cell proliferation by the inhibitors.
Keywords:
PI3K
; apoptosis
; cell cycle
; taselisib
; wortmannin
; idelalisib
; RNA-seq
1. Introduction
Chromosomal defects including reciprocal and non-reciprocal translocations are common in cancer although the mechanisms are not well understood [1,2]. However, the recurrence of similar translocations in different patients suggests an underlying biological mechanism that leads to the juxtaposition of the specific regions that undergo recombination to form particular oncogenes [1]. Blood cancers in particular are often characterized by chromosomal translocations leading to the formation of oncogenes and the translocations are useful in diagnosis and in treatment decisions [3]. While not always deleterious to health, balanced translocations can create chimeric cancer driver genes that include the BCR/ABL1 oncogene in chronic myeloid leukemia, various MYC fusion genes in Burkitt lymphoma, and PML/RARA fusions in acute promyelocytic leukemia [2]. Similarly, acute leukemias are commonly associated with Mixed Lineage Leukemia (MLL) translocations that fuse the N-terminus region of the gene located at 11q23 to an array of different proteins [2,4]. MLL, also known as KMT2A among other names, is a transcriptional coactivator that methylates histone H3 lysine 4 (H3K4) and it functions in development and hematopoiesis [5]. The oncogenic fusion forms of MLL are epigenetic regulators of transcription leading to upregulation of homeobox genes [5]. The overexpression of HOX genes and a cofactor MEIS1 in MLL oncogenes appears to have causal implications to the development of leukemia. Furthermore, the HOX cluster long-noncoding RNA noncoding RNA HOXA10-AS exhibits oncogenic potential in the leukemias with rearranged KMT2A [6].
The U937 cell line is a histiocytic lymphoma cell line that has the PICALM(CALM)/AF10 (MLLT10) oncogene arising from a balanced t(10;11)(p13;q14) translocation [7]. This translocation is commonly associated with cancer including acute myeloid leukemia (AML) and acute lymphoblastic leukemia (ALL) [8,9,10]. PICALM-AF10 oncogene transgenic mice develop leukemia with a high degree of penetrance that is accompanied by upregulation of the HOXA cluster genes [8]. HOXA genes control embryonic development and are activated during tissue repair and hematopoiesis and are implicated in leukemias [11]. It is therefore plausible that PICALM-AF10 transforms cells by interfering with differentiation. Whereas the role of AF10 as a cofactor for DOT1L is established [12], not much is known about signal transduction pathways or physiological statuses that regulate its function. Similarly, while CALM is a phosphoinositide binding protein that plays a role in the endocytosis, its biochemical activity that leads to cellular transformation remains elusive [13,14]. The fusion protein has been implicated in the activation of the JAK/STAT pathway and thereby leading to oncogenesis [15].
Leukemias carrying CALM/AF10 oncogene overexpress homeobox genes including HOX cluster genes and Meis homeobox 1 [12]. Other upregulated genes are BMI1 proto-oncogene, polycomb ring finger (BMI1), and other neighboring genes; COMMD3, DNAJC1 and SPAG6 [12]. In general, global gene expression analysis indicated that CALM/AF10 oncogene positive leukemia cells upregulate chromatin structure and DNA replication and repair pathways [12]. MLLT10 participates in transcription regulation by functioning as a cofactor of DOT1L, which is a histone methyltransferase (H3K79) that is implicated embryogenesis [16]. Unlike KMT2A that contains a SET domain and it methylates histone H3 tails, DOT1L methylates a lysine located in the globular domain of histone H3 [17]. Knockdown of DOT1L is reported to block cell proliferation [18]. PICALM on the other hand is a phosphatidylinositol-binding clathrin assembly protein [16]. PICALM and the brain-restricted homolog AP180 bind to phosphoinositol-4,5-bisphosphate, PI(4,5)P2 with an N-terminal ANTH domain and to several other proteins in clathrin coated vesicles (CCVs) through a disordered C-terminal region [19]. PICALM is very abundant in CCVs where it functions in clathrin-coated pits (CCPs) formation and in the final steps of vesicle formation by modulating membrane tension [14,20]. Whereas the role of MLL-partner proteins in cellular transformation remains to be understood, current data suggest that the fusion proteins share the common pathway driven by MLL and that is augmented by additional regulatory mechanisms arising from the interactions of the respective partner proteins [21]. Further, requirement for additional mutations prior to disease progression may account for the latency observed in individuals carrying MLL rearrangements, and such mutations commonly affect the PI3K and RAS signaling pathways [22].
Phosphatidylinositol (PtdIns) phosphates function as docking sites for signaling and membrane sorting proteins and they also release second messengers in signal transduction [23,24]. Seven PtdIns phosphates function in mammalian cells as follows: PtdIns3P, PtdIns4P, PtdIns5P, PtdIns(3,4)P2, PtdIns(3,5)P2, PtdIns(4,5)P2, and PtdIns(3,4,5)P3 [24]. The differentiating phosphorylation patterns are generated by phosphoinositide lipid kinases that recognize the different positions of the inositol headgroup with specificity [23,24,25]. Of particular interest to this study is that PtdIns (3,4,5)P3 is generated by growth factor signaling pathways and the respective kinases are associated with cancer.
PI3Ks fall under three classes with class I producingPtdIns3P , PtdIns(3,4)P2, and PtdIns(3,4,5)P3 , class II producing PtdIns3P and PtdIns(3,4)P2 , and class III producing only PtdIns3P [26]. PtdIns(4,5)P2 , the substrate for class I PI3Ks (PIK3CA, PIK3CB, PIK3CG, and PIK3CD) is generated from PtdIns4P and PtdIns5P by PIP5K1A/B/C and PIP5K2A/B/C, respectively [25]. It is in turn dephosphorylated by the tumor suppressor PTEN [25]. Class I PI3K functions in many receptor-mediated signal transduction pathways and is linked to intracellular cell growth and proliferation pathways [26]. Members of this class, especially the PIK3CA catalytic subunit, are involved in cancer as oncogenes and therapeutic targets. Thus, PI3K inhibitors have generated interest as anticancer agents. These include PI3Kα inhibitors alpelisib, taselisib, inavolisib, and serabelisib and the PI3Kδ inhibitor idelalisib [27,28]. PI3Kδ is vital for the survival and function of B-cells and it generates PtdIns(3,4,5)P3, which is a second messenger for Bruton’s tyrosine kinase (BTK) and AKT [29]. Idelalisib thus blocks the activation of BTK in B-cell malignancies leading to cytotoxicity towards cancer cells.
The four class I PI3Ks display differential tissue expression patterns that reflect their physiological functions [30]. While PIK3CA and PIK3CB are ubiquitously expressed, PIK3CD and PIK3CG are primarily expressed in hematopoietic cells and in the central nervous system (PIK3CD) and the heart (PIK3CG) [30]. The overlapping functions of PIK3CD and PIK3CG in immune cells are reflected in knockout mice whereby loss of PIK3CD leads to partial loss of B-cell development while double knockout mice have a complete loss B-cell development [30]. Given the involvement of class I PI3Ks in cancer, selective inhibitors have shown promise as anticancer drugs as either single agents or in combination therapies. PIK3CD mediates functions of B cells including cell proliferation and consequently, idelalisib (CAL-101) was developed as a selective inhibitor of the kinase and it was shown to have efficacy in CLL, follicular lymphoma (FL) and small lymphocytic lymphoma (SLL) [31,32]. Taselisib (GDC-0032), is an inhibitor of all class I PI3Ks except PIK3CB and it is also reported to have a higher selectivity for PIK3CA [33]. Taselisib has been shown to have efficacy in cancer treatments and to enhance the radiotherapy of head and neck squamous carcinomas [33,34]. However, the inhibitors have shown toxicities that have led to the development of alternative dosing regimens given that the toxicities are reversible while in some cases approved PI3K inhibitors, such as taselisib and idelalisib, have been withdrawn [35,36].
The fungal furanosteroid wortmannin is an inhibitor of the phosphatidylinositol-3 kinase related kinase family (PIKKs) that includes PI3Ks and the DNA repair kinases DNA PKcs, ATR and ATM, and is known to increase the sensitivity of tumor cells to radiation [37,38]. Wortmannin causes DNA double-strand breaks as efficiently as 0.69 Gy of gamma-radiation in severe combined immunodeficient mice cells [37]. Studies have shown that wortmannin treatment inhibits tumor growth, proliferation and induces apoptosis [39] . Wortmannin is cytotoxic to U937 cells and it enhances apoptosis and caspase-3-like activity in tumor necrosis factor (TNF) treated U937 [40]. Further, wortmannin induced apoptosis in the absence of other co-stimulation at higher doses [40]. The potentiation of apoptosis by wortmannin and LY294002, another PI3K inhibitor, is also seen with other cytotoxic agents including the anticancer drugs 5-fuorouracil and gemcitabine [41].
The transformation of the two cell lines used in this study, U937 and THP-1, is causally associated with t(10;11)(p13;q14) translocation that creates the PICALM/AF10(MLLT10) oncogene and t(9;11)(p22;q23) translocation that creates MLL-AF9 oncogene, respectively [42,43]. U937 cells are used as in vitro models of blood cancers that are characterized with MLLT10 translocations. Taselisib appears to be more effective in inducing cell death in U937 cells than wortmannin. Further, some inhibitors of PI3K were not cytotoxic at a concentration of 2 µM. The cytotoxicity profiles of these inhibitors are similar in both cell lines.
2. Materials and Methods
2.1. Materials
U937 and THP-1 cells was obtained from the American Type Culture Collection (Manassas, VA); cell culture reagents (Fetal Bovine Serum and RPMI medium), wortmannin, and 3-(4,5-Dimethyl-2-thiazolyl)-2,5-diphenyl-2H-tetrazolium bromide, MTT, were purchased from Sigma-Aldrich, Inc, St. Louis, MO; DRAQ5™ was purchased from ThermoFisher Scientific (Rockford, IL); Cover glass chamber slides were purchased from Ibidi, Inc. (Fitchburg, Wisconsin).
2.2. Cell Culture
U937 cells were maintained in RPMI 1640 medium supplemented with 8% fetal bovine serum (FBS) at 37oC in a humidified incubator containing 5% CO2. The seeding density was approximately 2 x 10⁵ cells/ml. Cells were seeded a day before treatment. THP-1 cells were similarly cultured except that the medium was supplemented with 0.05 mM β-mercaptoethanol. Wortmannin was dissolved in dimethylsulfoxide (DMSO) at concentration of 1 mM. The stock solution was diluted in the culture medium at the desired concentrations. The cells were treated with wortmannin for 24 h. Alpelisib (BYL719), idelalisib, serabelisib (TAK-117), and taselisib (GDC-0032) were purchased from Selleckchem (Houston, TX) and dissolved in DMSO to achieve concentrations of 10mM as recommended by the manufacturer and then diluted in cell culture medium prior to addition to cells.
2.3. Cell Proliferation Assays
Cell proliferation was determined with the (3-(4,5-dimethylthiazol-2-yl)-2,5-diphenyltetrazolium bromide (MTT) reduction assay as follows: The MTT was dissolved in phosphate buffered saline (137 mM NaCl, 2.7 mM KCl, 8 mM Na2HPO4, and 2 mM KH2PO4, pH 7.4) at a concentration of 5 mg/ml and filter sterilized. It was added to the cell culture medium at a final concentration of 0.5 mg/ml. The cells were incubated for an additional four hours and harvested by centrifuging at 300 x g for 5 minutes. The supernatants were discarded, and the cells washed once with PBS. The resulting cell pellets were resuspended in 0.04 M HCl in isopropanol. The mixture was centrifuged at 10,000 rpm to clarify the extract and the supernatant was transferred into a microplate reader and the absorbance was read at 540nm [44]
2.4. Confocal Microscopy
Cell viability was assessed with DRAQ7 ™ dye-exclusion. The cells were cultured in cover-glass chamber slides and treated with wortmannin at a final concentration of 1 µM for 24 h. DRAQ7 ™ was added to the untreated and treated cells at the recommended final concentration of approximately 3 µM with limited optimization. Some cells were stained with DRAQ5™, which stains viable and non-viable cells. DRAQ5™ was added at a final concentration of 10 μM and the incubation conducted following the manufacturer’s recommendations. The cells were subsequently imaged with a Leica Stellaris 5 confocal microscope system.
2.5. Statistical Analysis
The cell proliferation data represents at least 8 replicates. The data were analyzed with one-way analysis of variance (ANOVA) with GraphPad Prism (GraphPad Software, Boston, MA). P values of < 0.05 were considered to be significant.
2.6. RNA Sequencing and Transcriptome Analysis
U937 cells were treated with wortmannin (2 μM), taselisib (2 μM), idelalisib (2 μM), or DMSO for 24 hours in biological triplicates. Total RNA was extracted using the RNeasy Mini Kit (Qiagen, Hilden, Germany) according to the manufacturer's protocol. RNA integrity was assessed with an Agilent Tapestation (Agilent Technologies, Santa Clara, CA), and samples with an RNA Integrity Number (RIN) ≥ 8.0 were used for library preparation. Paired-end sequencing (2 × 150 bp) was conducted by Azenta Life Sciences on an Illumina® NovaSeq™ platform (South Plainfield, NJ). Adaptors and low quality regions were trimmed with Trimmomatic v.0.36[45]. The reads were mapped to the Homo sapiens GRCh38 reference genome with STAR aligner v.2.5.2b[46]. Hit counts were generated with the Subread package v.1.5.2 featureCounts program [47]. The mean quality of the reads was 35.6 and the total reads per sample ranged from 20,304,601 to 36,191,125 reads.
Raw read counts were normalized and differential gene expression was determined using DESeq2 [48]. Differential expression cut-offs were a false discovery rate (FDR) of < 0.05 and an absolute log₂ fold change > 1. Six pairwise comparisons were performed: DMSO vs. taselisib, DMSO vs. idelalisib, DMSO vs. wortmannin, taselisib vs. wortmannin, idelalisib vs. wortmannin, and idelalisib vs. taselisib. Gene ontology (GO) biological process enrichment analysis was performed with GeneSCF v1.1-p2 [49].
3. Results
Isoform targeted PI3K inhibitors exhibit differential effects on U937 cells viability: The activation of PI3K by cell surface receptors including growth factor receptors leads to the phosphorylation of PtdIns(4,5)P2 to PtdIns(3,4,5)P3 and the subsequent activation of protein kinase B (AKT) [50]. The PI3K/AKT/mTOR pathway is crucial for cell growth and proliferation and it acts antagonistically to apoptosis [51]. The pathway is commonly mutated in many forms of cancer, and it provides avenues for anticancer therapies [28,51]. Inhibitors of the PI3K/Akt/mTOR pathway are could be effective anticancer agents given the central role of the pathway in cell survival, cell growth and proliferation [27,28,51]. The cytotoxicity of selected class I PI3K inhibitors was assessed in U-937 and THP-1 cells. Supplementary Table S1 summarizes the measured IC50s of the compounds as curated in the IUPHAR/BPS guide to pharmacology [52].
U937 were treated with Alpelisib, Idelalisib, Serabelisib, Taselisib, Wortmannin at a final concentration of 2 µM for 24 hours and cell proliferation analyzed with the MTT assay (Figure 1). Taselisib and idelalisib significantly inhibited cell proliferation with taselisib showing higher potency than wortmannin and idelalisib. The 2 µM concentration was selected based on established literatures where low micromolar rangers are standard for measurable cytotoxicity and anti-leukemic effects in AML cell lines [53]. Conversely, the downstream RNA-seq and imaging were kept at lower, uniform 1–2 µM range specifically to capture primary target inhibition pathways before widespread, non-specific cell death scrambled the transcriptome.
The effect of wortmannin on U937 cells was further investigated with confocal microscopy (Figure 2). The cells were treated with 1 µM of wortmannin for 24 h and stained with DRAQ5. Promonocytes and monocytes nuclei obtain bilobed shapes as a consequence of differentiation from the common myeloid progenitors and the granulocyte-monocyte progenitors or monocyte-dendritic cells progenitors [54,55]. The bilobed phenotype is evident in a majority of cells in control samples (Figure 2A and Figure 2D). DRAQ5 staining appears concentrated in certain regions including nuclear periphery. The nuclei appear more rounded with highly condensed chromatin in treated cells (Figure 2G-2I).
Morphological changes associated with taselisib’s cytotoxicity were also determined with confocal microscopy (Figure 3). Several areas of chromatin condensation and nuclear fragmentation is evident in taselisib treated cells.
THP-1 and U937 cells show a similar sensitivity profile for class I PI3K inhibitors: Idelalisib, taselisib, and wortmanmnin caused a dose-dependent inhibiton of both cell lines. The IC50 was calculated by plotting the percentage of cell proliferation against the logarithm of wortmannin concentration and interpolating to determine the concentration that yielded 50% cell inhibition. THP-1 cells are models of monocyte cell differentiation and leukemia. In addition to other chromosomal aberrations, THP-1 cells express the histone methyltransferase KMT2A (MLL) and MLLT3 (AF9) fusion oncogene [43]. The data for the treatment of THP-1 cells mirror those of U937 (Figure 4B).
Transcriptional responses to PI3K inhibitors in U937 cells: RNA sequencing was performed to determine the effects of idelalisib, taselisib and wortmannin on the transcriptome. Differential gene expression as determined by DESeq indicate differences between the three compounds. Taselisib caused more substantial changes in gene expression as compared to idelalisib, and wortmannin (Table 1).
The overlap of the differentially expressed genes is accounted for mostly by effects of taselisib as 74% of the differentially expressed genes in wortmannin treated cells are shared with taselisib treated cells (Supplementary Figure 1).
The data were analyzed for the expression of genes linked to PI3K. Consistent with myeloid lineage, PIK3CD (PI3Kδ) was the most abundant isoform followed by PIK3CG (PI3Kγ) (Figure 5). Taselisib led to an increase in the expression levels of several genes in the PI3K/AKT/mTOR pathway including downstream effectors such as FOXO3, FOXO4 and PIK3IP1 (Figure 5).
The PICALM/AF-10 (MLLT10) oncogene acts through epigenetic regulation of gene expression through the polycomb group complex 1 (PRC1) through BMI1 protooncogene and the HOX family of transcription factors, including the HOX cofactor MEIS1 [59]. The effect of treatment on the expression of histone methyltransferases and demethylases and related genes is summarized in Figure 6. BMI1, which is not shown in the figure, and MEIS1 are not differentially in taselisib treated cells. The apparent changes in DOT1L, MEIS1, KDM4B and KDM6B do not reach the threshold used of 1.5 fold increase or 0.5 fold decrease. However, MEIS3 was increased by two-fold.
DOT1L is a H3K79 methyltransferase that is implicated in leukemias associated MLLT/AF10 translocations while translocations involving the SET-domain H3K4 methyltransferases (MLL/KMT) create other leukemogenic oncogenes [17,18,60,61]. MLLs are implicated in hematopoiesis and blood cancers and function within complexes that include LEDGF/PSIP1, menin/Men1, WDR5, KAT8/MOF, ASH2L, DPY30, and RBBP5 [62]. The expression patterns of the relevant genes and the paralogs is shown in Supplementary Figure S1. RBBP proteins are named from their functional interaction with retinoblastoma protein (pRB) and many function in epigenetic regulation of gene expression and are also implicated in cancer [62,63,64,65,66,67,68]. No significant changes were seen in this set of genes (Supplementary Figure S2). In expression levels, the most abundant genes are WDR5, RBBP4/RBBP7, DNMT1, KAT2A, ASH2L, MEN1, and ASXL1.
The data were further analyzed with IPA [69]. The pathways associated with taselisib and wortmannin treatment are dominated by cell cycle, which are downregulated, and immune function regulation genes, which are Supplementary Figure S2.
The sequencing data were further analyzed with CEMiTool (Co-expression Modules Identification Tool) for gene set enrichment and overrepresentation of pathways [70,71]. The correlations in gene expression used Pearson’s correlation with variance stabilization and resulted in 8 modules and a set of non-correlated genes. Over-representation of genes in the resulting modules within specific biological pathways was conducted using the “C2 subcollection CGP: Chemical and genetic perturbations” gene set [72]. Idelalisib and wortmannin yielded negative normalized enrichment scores (NES) in Module 2 that includes cancer related pathways (Figure 7 and Supplementary Table S3). Taselisib uniquely has a negative NES in module 7 that includes ribosomal functions. Other modules (1, 3, 4, 5, 6) did not yield significant NES in over-representation analysis (ORA). The members of genesets, for example, CROONQUIST_IL6_DEPRIVATION_DN, include genes associated with cancer and some are important chromosomal instability (CIN) signatures relating to the cell cycle [73,74]. In taselisib treated cells, the 21 genes overlapping with CROONQUIST_IL6_DEPRIVATION_DN gene set (Supplementary Table S3) include all 10 mitosis CIN signatures.
4. Discussion
The results of this study suggest the need for further mechanistic investigations of PI3K inhibitors as antileukemics. The selected alpelisib, idelalisib, serabelisib, taselisib and wortmannin exhibited differential cytotoxicity in two cell lines (Figure 1&4). The International Union of Basic and Clinical Pharmacology (IUPHAR) / British Pharmacological Society (BPS) curated data indicate that except for serabelisib, which is highly selective for PI3Kα, the compounds used in this study show selectivity to specific isoforms within relatively narrow ranges of concentration (Supplementary Table S1). Wortmannin is a general inhibitor of PI3Ks with IC50s in the nanomolar range while taselisib has IC50s in the sub-nanomolar to nanomolar range for all class I PI3Ks but has a higher potency towards PI3Kδ. Idelalisib like taselisib has a higher potency towards PI3Kδ. Alpelisib has higher potency towards PI3Kα, but it inhibits other isoforms with sub-micromolar concentrations. Serabelisib is a PI3Kα selective inhibitor, but it has IC50s of under 10 µM for other isoforms. The compounds were used at concentrations above the reported in vitro IC50s. Thus, the differences seen cannot be fully accounted for by isoform selectivity in the absence of further data and especially studies on compound uptake, which was not examined in this study.
Taselisib is more cytotoxic than alpelisib to human cancer cell lines carrying oncogenic mutant PIK3CA [75,76]. It causes sustained through enhanced proteasomal degradation of the catalytic subunit of PIK3CA (PI3Kα). Interestingly, Song et al reported that taselisib and alpelisib were not cytotoxic to primary hepatocytes at a concentration of 0.1mM [75]. In this study, alpelisib was less cytotoxic to U937 cells at 2 µM (Figure 1), further highlighting potential mechanistic differences in mechanisms that require further exploration. While the referenced studies focused in breast cancer cells with mutated PIK3CA, very low expression of this isoform was detected in U937 cells (Figure 5). Consistent with the myeloid lineage, isoform expression studies indicate that PI3Kδ and PKCγ are the most abundant isoforms in U937 cells (Figure 5).
Chromosomal aberrations and especially translocations are a hallmark of cancer and some reciprocal translocations are the etiological basis for specific blood cancers [2,77]. In the cases where the biochemistry of the oncogene is well understood, effective targeted therapies have been developed, for example, imatinib in the treatment of leukemias caused by the Bcr-Abl oncogene [78]. Of note is that while chromosomal translocations can be the initiating event in cancer or a consequence of aberrant replication and DNA repair events in transformed cells, they also play a role in disease progression [2,79]. The biochemical activities of the oncogenes thus formed through translocation include kinases, and transcription factors, among others [2]. Hematopoietic malignancies are characterized by alterations in epigenetic markers in the genome and correspondingly there is a lot of interest in developing therapies that rely on the components of epigenetic regulation of gene expression [21,22,59,60,80,81]. Given that the frequency of translocations seems to be tumor specific and other investigators have implicated the broader mechanisms of transcriptional factories, DNA recombination and replication starts in the propensity for translocations[82,83,84], it can be inferred that a better understanding of the tumor-specific transcriptomes focused on the biology of the translocated regions will be provide insights into targeting cancer treatments.
U937 cells are monocytic leukemia cells and they express the PICALM/MLLT10 (AF10) oncogene, which is commonly seen hematological cancers with poorly differentiated cells [9]. By acting through DOT1L, PICALM/MLLT10 regulates gene expression by mechanisms that involve H3K79 methylation [59]. H3K4 methylations also determine gene expression and the methyltransferases, such as MLL, are frequently translocated in leukemias and lymphomas [21,22,61,81]. The expression levels of histone methyltransferases and demethylases did not show significant alterations in treated cells (Figure 6). Among these genes, the methyltransferases DOT1L and KMT2B (MLL2/4) and demethylases KDM1A (LSD1), KDM3B, and KDM5C are highly expressed. With the exception of KDM5C, these genes are implicated hematologic and other cancers [81,85,86]. Supplementary Figure S2 shows the expression of MLL methylation complex proteins and related proteins and among them WDR5, MEN1, and ASH2L are highly expressed while RBBP5 and MOF/KAT8 are expressed at lower levels. The MLL/SET proteins function in complexes that recruit other functions including histone acetyltranferases to gene promoter sites and are drivers of hematopoiesis and leukemia [62]. Thus, it will be of interest in future studies to determine the effect of knockdown of these genes in the growth and proliferation of U937 cells.
MLLT10/AF10 is a cofactor for hDOT1L (KMT4), a H3K79 methyltransferase, which activates genes involved in cell proliferation, and the PICALM-MLLT10 mechanism of cell transformation involves hDOT1L through the transcription factors MEIS1 and HOXA [18,59]. DOT1L and MEIS1 transcripts were detected in U937 cells but the inhibitors did not affect expression levels at the transcript level (Figure 6). Mechanisms through which H3k79 methylation is regulated remain unclear and more research is needed to elucidate functional interactions between histone methylations and upstream signal transduction pathways.
H3K79 methylation is a marker of active transcription and it is a key telomeres, cell cycle and DNA repair pathways and while a demethylase has not been identified, DOT1L is the only known methylase [60]. DOT1L protein levels are increased in TGF-β1 induced fibrosis while transcriptional knock-down prevented fibrosis induced by bleomycin [87]. Pathway analysis indicated that the taselisib and wortmannin downregulate cell cycle pathways and implicated c-Myc (Supplementary Figure S3). The functional link between DOT1L mediated histone methylation and c-Myc has been reported in cancer cells [88].
Gene ontology analysis of significant DEGs in taselisib-treated cells revealed enrichment for inflammatory and immune responses, signal transduction, and cell division. Wortmannin treated cells show enrichment in immune response and signaling pathways, and idelalisib treatment shows enrichment in transcription, cell-cell signaling. The results suggest differences in mechanisms of cytotoxicity of these compounds. The need to further study PI3K inhibitors as cancer agents is further strengthened by the observation that compounds that are selective for the same kinase can have differing molecular effects including the induction of proteolysis of mutant PIK3CA [75,76]. Gene set enrichment and over-representation analysis suggest genes that are potentially important in the activity of taselisib (Figure 7), which was the most active of the inhibitors tested.
Differential molecular and cytotoxic effects of compounds that target the same PI3K isoform suggest additional mechanisms that need to be unraveled as a step towards the design of drugs with more favorable efficacy and toxicity profiles. This study provides further evidence of the importance of this pathway in blood cancer cell lines that are characterized by MLLT10 and MLL translocations. Not addressed, however, is the functional interaction between PI3Ks and epigenetic regulation of gene expression.
Supplementary Materials
The following supporting information can be downloaded at the website of this paper posted on Preprints.org. Figure S1: Venn diagram illustrating the overlap of differentially expressed genes (DEGs) in U937 cells treated with idelalisib, taselisib, and wortmannin; Figure S2: Expression heatmap of MLL methylation complex partners and associated scaffold proteins following PI3K inhibitor treatment; Figure S3: Downregulated cell cycle and proliferation pathways regulated by taselisib and wortmannin in U937 cells; Table S1: In vitro IC50 values of targeted PI3K inhibitors against isolated proteins; Table S3: Gene sets with significant representation within co-expression modules identified by CEMiTool analysis
Author Contributions
Conceptualization, J.W.; methodology, I.S., J.W.; software, I.S., J.W.; validation, J.W.; formal analysis, J.W.; resources, J.W.; writing—original draft preparation, I.S., J.W.; writing: review and editing, I.S., J.W.; visualization, J.W.; super-vision, J.W.; project administration, J.W.; funding acquisition, J.W. All authors have read and agreed to the published version of the manuscript.
Funding
The authors acknowledge the use of core facilities supported by the National Institute on Minority Health and Health Disparities through grant number 5U54MD013376 and National Institute of General Medical Sciences through grant number 5UL1GM118973.
Institutional Review Board Statement
Not applicable.
Informed Consent Statement
Not applicable.
Data Availability Statement
The original contributions presented in this study are included in the article/supplementary materials. Further inquiries can be directed to the corresponding authors.
Conflicts of Interest
The authors declare no conflict of interest.
References
- Zheng, J. Oncogenic Chromosomal Translocations and Human Cancer (Review). Oncol. Rep. 2013, 30, 2011–2019. [Google Scholar] [CrossRef] [PubMed]
- Mitelman, F.; Johansson, B.; Mertens, F. The Impact of Translocations and Gene Fusions on Cancer Causation. Nat. Rev. Cancer 2007, 7, 233–245. [Google Scholar] [CrossRef] [PubMed]
- Zheng, J. Oncogenic Chromosomal Translocations and Human Cancer (Review). Oncol. Rep. 2013, 30, 2011–2019. [Google Scholar] [CrossRef] [PubMed]
- Ayton, P.M.; Cleary, M.L. Molecular Mechanisms of Leukemogenesis Mediated by MLL Fusion Proteins. Oncogene 2001, 20, 5695–5707. [Google Scholar] [CrossRef] [PubMed]
- Winters, A.C.; Bernt, K.M. MLL-Rearranged Leukemias—An Update on Science and Clinical Approaches. Front. Pediatr. 2017, 5. [Google Scholar] [CrossRef] [PubMed]
- Al-Kershi, S.; Bhayadia, R.; Ng, M.; Verboon, L.; Emmrich, S.; Gack, L.; Schwarzer, A.; Strowig, T.; Heckl, D.; Klusmann, J.-H. The Stem Cell-Specific Long Noncoding RNA HOXA10-AS in the Pathogenesis of KMT2A-Rearranged Leukemia. Blood Adv. 2019, 3, 4252–4263. [Google Scholar] [CrossRef] [PubMed]
- Dreyling, M.H.; Martinez-Climent, J.A.; Zheng, M.; Mao, J.; Rowley, J.D.; Bohlander, S.K. The t(10;11)(P13;Q14) in the U937 Cell Line Results in the Fusion of the AF10 Gene and CALM, Encoding a New Member of the AP-3 Clathrin Assembly Protein Family. Proc. Natl. Acad. Sci. 1996, 93, 4804–4809. [Google Scholar] [CrossRef] [PubMed]
- Caudell, D.; Zhang, Z.; Chung, Y.J.; Aplan, P.D. Expression of a CALM-AF10 Fusion Gene Leads to Hoxa Cluster Overexpression and Acute Leukemia in Transgenic Mice. Cancer Res. 2007, 67, 8022–8031. [Google Scholar] [CrossRef] [PubMed]
- Caudell, D.; Aplan, P.D. The Role of CALM-AF10 Gene Fusion in Acute Leukemia. Leukemia 2008, 22, 678–685. [Google Scholar] [CrossRef] [PubMed]
- Kumon, K.; Kobayashi, H.; Maseki, N.; Sakashita, A.; Sakurai, M.; Tanizawa, A.; Imashuku, S.; Kaneko, Y. Mixed-Lineage Leukemia with t(10;11)(P13;Q21): An Analysis of AF10-CALM and CALM-AF10 Fusion mRNAs and Clinical Features. Genes. Chromosom. Cancer 1999, 25, 33–39. [Google Scholar] [CrossRef]
- Sitwala, K.V.; Dandekar, M.N.; Hess, J.L. HOX Proteins and Leukemia. Int. J. Clin. Exp. Pathol. 2008, 1, 461–474. [Google Scholar] [PubMed]
- Mulaw, M.A.; Krause, A.J.; Deshpande, A.J.; Krause, L.F.; Rouhi, A.; La Starza, R.; Borkhardt, A.; Buske, C.; Mecucci, C.; Ludwig, W.-D.; et al. CALM/AF10-Positive Leukemias Show Upregulation of Genes Involved in Chromatin Assembly and DNA Repair Processes and of Genes Adjacent to the Breakpoint at 10p12. Leukemia 2012, 26, 1012–1019. [Google Scholar] [CrossRef] [PubMed]
- Miller, S.E.; Mathiasen, S.; Bright, N.A.; Pierre, F.; Kelly, B.T.; Kladt, N.; Schauss, A.; Merrifield, C.J.; Stamou, D.; Höning, S.; et al. CALM Regulates Clathrin-Coated Vesicle Size and Maturation by Directly Sensing and Driving Membrane Curvature. Dev. Cell 2015, 33, 163–175. [Google Scholar] [CrossRef] [PubMed]
- Willy, N.M.; Colombo, F.; Huber, S.; Smith, A.C.; Norton, E.G.; Kural, C.; Cocucci, E. CALM Supports Clathrin-Coated Vesicle Completion upon Membrane Tension Increase. Proc. Natl. Acad. Sci. U. S. A. 2021, 118, e2010438118. [Google Scholar] [CrossRef] [PubMed]
- Chen, B.-R.; Deshpande, A.; Barbosa, K.; Kleppe, M.; Lei, X.; Yeddula, N.; Vela, P.S.; Campos, A.R.; Wechsler-Reya, R.J.; Bagchi, A.; et al. A JAK/STAT-Mediated Inflammatory Signaling Cascade Drives Oncogenesis in AF10-Rearranged AML. Blood 2021, 137, 3403–3415. [Google Scholar] [CrossRef] [PubMed]
- Deutsch, J.L.; Heath, J.L. MLLT10 in Benign and Malignant Hematopoiesis. Exp. Hematol. 2020, 87, 1–12. [Google Scholar] [CrossRef] [PubMed]
- Feng, Q.; Wang, H.; Ng, H.H.; Erdjument-Bromage, H.; Tempst, P.; Struhl, K.; Zhang, Y. Methylation of H3-Lysine 79 Is Mediated by a New Family of HMTases without a SET Domain. Curr. Biol. CB 2002, 12, 1052–1058. [Google Scholar] [CrossRef] [PubMed]
- Okada, Y.; Feng, Q.; Lin, Y.; Jiang, Q.; Li, Y.; Coffield, V.M.; Su, L.; Xu, G.; Zhang, Y. hDOT1L Links Histone Methylation to Leukemogenesis. Cell 2005, 121, 167–178. [Google Scholar] [CrossRef] [PubMed]
- Azarnia Tehran, D.; López-Hernández, T.; Maritzen, T. Endocytic Adaptor Proteins in Health and Disease: Lessons from Model Organisms and Human Mutations. Cells 2019, 8, 1345. [Google Scholar] [CrossRef] [PubMed]
- Mettlen, M.; Chen, P.-H.; Srinivasan, S.; Danuser, G.; Schmid, S.L. Regulation of Clathrin-Mediated Endocytosis. Annu. Rev. Biochem. 2018, 87, 871–896. [Google Scholar] [CrossRef] [PubMed]
- Ayton, P.M.; Cleary, M.L. Molecular Mechanisms of Leukemogenesis Mediated by MLL Fusion Proteins. Oncogene 2001, 20, 5695–5707. [Google Scholar] [CrossRef] [PubMed]
- Andersson, A.K.; Ma, J.; Wang, J.; Chen, X.; Gedman, A.L.; Dang, J.; Nakitandwe, J.; Holmfeldt, L.; Parker, M.; Easton, J.; et al. The Landscape of Somatic Mutations in Infant MLL Rearranged Acute Lymphoblastic Leukemias. Nat. Genet. 2015, 47, 330–337. [Google Scholar] [CrossRef] [PubMed]
- Brown, J.R.; Auger, K.R. Phylogenomics of Phosphoinositide Lipid Kinases: Perspectives on the Evolution of Second Messenger Signaling and Drug Discovery. BMC Evol. Biol. 2011, 11, 4. [Google Scholar] [CrossRef] [PubMed]
- Tu-Sekine, B.; Kim, S.F. The Inositol Phosphate System—A Coordinator of Metabolic Adaptability. Int. J. Mol. Sci. 2022, 23, 6747. [Google Scholar] [CrossRef] [PubMed]
- Balla, T. Phosphoinositides: Tiny Lipids With Giant Impact on Cell Regulation. Physiol. Rev. 2013, 93, 1019–1137. [Google Scholar] [CrossRef] [PubMed]
- Jean, S.; Kiger, A.A. Classes of Phosphoinositide 3-Kinases at a Glance. J. Cell Sci. 2014, 127, 923–928. [Google Scholar] [CrossRef] [PubMed]
- Fruman, D.A.; Rommel, C. PI3K and Cancer: Lessons, Challenges and Opportunities. Nat. Rev. Drug Discov. 2014, 13, 140–156. [Google Scholar] [CrossRef] [PubMed]
- Vanhaesebroeck, B.; Perry, M.W.D.; Brown, J.R.; André, F.; Okkenhaug, K. PI3K Inhibitors Are Finally Coming of Age. Nat. Rev. Drug Discov. 2021, 20, 741–769. [Google Scholar] [CrossRef] [PubMed]
- Okkenhaug, K.; Bilancio, A.; Farjot, G.; Priddle, H.; Sancho, S.; Peskett, E.; Pearce, W.; Meek, S.E.; Salpekar, A.; Waterfield, M.D.; et al. Impaired B and T Cell Antigen Receptor Signaling in P110delta PI 3-Kinase Mutant Mice. Science 2002, 297, 1031–1034. [Google Scholar] [CrossRef] [PubMed]
- Lucas, C.L.; Chandra, A.; Nejentsev, S.; Condliffe, A.M.; Okkenhaug, K. PI3Kδ and Primary Immunodeficiencies. Nat. Rev. Immunol. 2016, 16, 702–714. [Google Scholar] [CrossRef] [PubMed]
- Lannutti, B.J.; Meadows, S.A.; Herman, S.E.M.; Kashishian, A.; Steiner, B.; Johnson, A.J.; Byrd, J.C.; Tyner, J.W.; Loriaux, M.M.; Deininger, M.; et al. CAL-101, a P110delta Selective Phosphatidylinositol-3-Kinase Inhibitor for the Treatment of B-Cell Malignancies, Inhibits PI3K Signaling and Cellular Viability. Blood 2011, 117, 591–594. [Google Scholar] [CrossRef] [PubMed]
- Zirlik, K.; Idelalisib, V.H. Recent Results Cancer Res. Fortschritte Krebsforsch. Prog. Dan. Rech. Sur Cancer 2018, 212, 243–264. [Google Scholar] [CrossRef] [PubMed]
- Zumsteg, Z.S.; Morse, N.; Krigsfeld, G.; Gupta, G.; Higginson, D.S.; Lee, N.Y.; Morris, L.; Ganly, I.; Shiao, S.L.; Powell, S.N.; et al. Taselisib (GDC-0032), a Potent β-Sparing Small Molecule Inhibitor of PI3K, Radiosensitizes Head and Neck Squamous Carcinomas Containing Activating PIK3CA Alterations. Clin. Cancer Res. Off. J. Am. Assoc. Cancer Res. 2016, 22, 2009–2019. [Google Scholar] [CrossRef] [PubMed]
- Krop, I.E.; Jegede, O.A.; Grilley-Olson, J.E.; Lauring, J.D.; Mitchell, E.P.; Zwiebel, J.A.; Gray, R.J.; Wang, V.; McShane, L.M.; Rubinstein, L.V.; et al. Phase II Study of Taselisib in PIK3CA-Mutated Solid Tumors Other Than Breast and Squamous Lung Cancer: Results From the NCI-MATCH ECOG-ACRIN Trial (EAY131) Subprotocol I. JCO Precis. Oncol. 2022, 6, e2100424. [Google Scholar] [CrossRef] [PubMed]
- Skånland, S.S.; Brown, J.R. PI3K Inhibitors in Chronic Lymphocytic Leukemia: Where Do We Go from Here? Haematologica 2023, 108, 9–21. [Google Scholar] [CrossRef] [PubMed]
- Nunnery, S.E.; Mayer, I.A. Management of Toxicity to Isoform α-Specific PI3K Inhibitors. Ann. Oncol. 2019, 30, x21–x26. [Google Scholar] [CrossRef] [PubMed]
- Ihara, M.; Shichijo, K.; Takeshita, S.; Kudo, T. Wortmannin, a Specific Inhibitor of Phosphatidylinositol-3-Kinase, Induces Accumulation of DNA Double-Strand Breaks. J. Radiat. Res. 2020, 61, 171–176. [Google Scholar] [CrossRef] [PubMed]
- Sarkaria, J.N.; Tibbetts, R.S.; Busby, E.C.; Kennedy, A.P.; Hill, D.E.; Abraham, R.T. Inhibition of Phosphoinositide 3-Kinase Related Kinases by the Radiosensitizing Agent Wortmannin. Cancer Res. 1998, 58, 4375–4382. [Google Scholar] [PubMed]
- Karve, S.; Werner, M.E.; Sukumar, R.; Cummings, N.D.; Copp, J.A.; Wang, E.C.; Li, C.; Sethi, M.; Chen, R.C.; Pacold, M.E.; et al. Revival of the Abandoned Therapeutic Wortmannin by Nanoparticle Drug Delivery. Proc. Natl. Acad. Sci. U. S. A. 2012, 109, 8230–8235. [Google Scholar] [CrossRef] [PubMed]
- Fujita, E.; Kouroku, Y.; Miho, Y.; Tsukahara, T.; Ishiura, S.; Momoi, T. Wortmannin Enhances Activation of CPP32 (Caspase-3) Induced by TNF or Anti-Fas. Cell Death Differ. 1998, 5, 289–297. [Google Scholar] [CrossRef] [PubMed]
- Wang, Q.; Li, N.; Wang, X.; Kim, M.M.; Evers, B.M. Augmentation of Sodium Butyrate-Induced Apoptosis by Phosphatidylinositol 3’-Kinase Inhibition in the KM20 Human Colon Cancer Cell Line. Clin. Cancer Res. Off. J. Am. Assoc. Cancer Res. 2002, 8, 1940–1947. [Google Scholar]
- Caudell, D.; Aplan, P.D. The Role of CALM-AF10 Gene Fusion in Acute Leukemia. Leuk. Off. J. Leuk. Soc. Am. Leuk. Res. Fund. UK 2008, 22, 678–685. [Google Scholar] [CrossRef] [PubMed]
- Odero, M.D.; Zeleznik-Le, N.J.; Chinwalla, V.; Rowley, J.D. Cytogenetic and Molecular Analysis of the Acute Monocytic Leukemia Cell Line THP-1 with an MLL-AF9 Translocation. Genes. Chromosom. Cancer 2000, 29, 333–338. [Google Scholar] [CrossRef] [PubMed]
- Riss, T.L.; Moravec, R.A.; Niles, A.L.; Duellman, S.; Benink, H.A.; Worzella, T.J.; Minor, L. Cell Viability Assays. In Assay Guidance Manual; Markossian, S., Grossman, A., Brimacombe, K., Arkin, M., Auld, D., Austin, C., Baell, J., Chung, T.D.Y., Coussens, N.P., Dahlin, J.L., Devanarayan, V., Foley, T.L., Glicksman, M., Haas, J.V., Hall, M.D., Hoare, S., Inglese, J., Iversen, P.W., Kales, S.C., Lal-Nag, M., Li, Z., McGee, J., McManus, O., Riss, T., Saradjian, P., Sittampalam, G.S., Tarselli, M., Trask, O.J., Wang, Y., Weidner, J.R., Wildey, M.J., Wilson, K., Xia, M., Xu, X., Eds.; Eli Lilly & Company and the National Center for Advancing Translational Sciences: Bethesda (MD), 2004. [Google Scholar]
- Bolger, A.M.; Lohse, M.; Usadel, B. Trimmomatic: A Flexible Trimmer for Illumina Sequence Data. Bioinformatics 2014, 30, 2114–2120. [Google Scholar] [CrossRef] [PubMed]
- Dobin, A.; Davis, C.A.; Schlesinger, F.; Drenkow, J.; Zaleski, C.; Jha, S.; Batut, P.; Chaisson, M.; Gingeras, T.R. STAR: Ultrafast Universal RNA-Seq Aligner. Bioinformatics 2013, 29, 15–21. [Google Scholar] [CrossRef] [PubMed]
- Liao, Y.; Smyth, G.K.; Shi, W. featureCounts: An Efficient General Purpose Program for Assigning Sequence Reads to Genomic Features. Bioinformatics 2014, 30, 923–930. [Google Scholar] [CrossRef] [PubMed]
- Love, M.I.; Huber, W.; Anders, S. Moderated Estimation of Fold Change and Dispersion for RNA-Seq Data with DESeq2. Genome Biol. 2014, 15, 550. [Google Scholar] [CrossRef] [PubMed]
- Subhash, S.; Kanduri, C. GeneSCF: A Real-Time Based Functional Enrichment Tool with Support for Multiple Organisms. BMC Bioinform. 2016, 17, 365. [Google Scholar] [CrossRef] [PubMed]
- Martelli, A.M.; Evangelisti, C.; Chiarini, F.; McCubrey, J.A. The Phosphatidylinositol 3-Kinase/Akt/mTOR Signaling Network as a Therapeutic Target in Acute Myelogenous Leukemia Patients. Oncotarget 2010, 1, 89–103. [Google Scholar] [CrossRef] [PubMed]
- Yuan, T.; Cantley, L. PI3K Pathway Alterations in Cancer: Variations on a Theme. Oncogene 2008, 27, 5497–5510. [Google Scholar] [CrossRef] [PubMed]
- Harding, S.D.; Armstrong, J.F.; Faccenda, E.; Southan, C.; Alexander, S.P.H.; Davenport, A.P.; Spedding, M.; Davies, J.A. The IUPHAR/BPS Guide to PHARMACOLOGY in 2026. Nucleic Acids Res. 2026, 54, D1446–D1456. [Google Scholar] [CrossRef] [PubMed]
- Chen, J.-Q.; Lou, Y.; Zhou, L.-L.; Shen, J.; Yang, Y.-L.; Wu, W.-J.; Geng, Y.-H. In Vitro Antitumor Effects of PI3K Inhibitor Linperlisib (YY-20394) on Acute Myeloid Leukemia Cells. Hematology 2025, 30, 2571812. [Google Scholar] [CrossRef] [PubMed]
- Wolf, A.A.; Yáñez, A.; Barman, P.K.; Goodridge, H.S. The Ontogeny of Monocyte Subsets. Front. Immunol. 2019, 10. [Google Scholar] [CrossRef] [PubMed]
- Skinner, B.M.; Johnson, E.E.P. Nuclear Morphologies: Their Diversity and Functional Relevance. Chromosoma 2017, 126, 195–212. [Google Scholar] [CrossRef] [PubMed]
- Venny 2.1.0. Available online: https://bioinfogp.cnb.csic.es/tools/venny/ (accessed on 12 March 2026).
- The Galaxy Community The Galaxy Platform for Accessible, Reproducible, and Collaborative Data Analyses: 2024 Update. Nucleic Acids Res. 2024, 52, W83–W94. [CrossRef] [PubMed]
- Heatmap.2 Function - RDocumentation. Available online: https://www.rdocumentation.org/packages/gplots/versions/3.3.0/topics/heatmap.2 (accessed on 22 March 2026).
- Cullen, J.M.; Nakatsugawa, A.C.; Barton, N.; Haines, H.; Stein, G.S.; Stein, J.L.; Wechsler, D.S.; Heath, J.L. PICALM::MLLT10 Translocated Leukemia. FEBS Lett. N/a. [CrossRef] [PubMed]
- Arnold, O.; Barbosa, K.; Deshpande, A.J.; Zhu, N. The Role of DOT1L in Normal and Malignant Hematopoiesis. Front. Cell Dev. Biol. 2022, 10. [Google Scholar] [CrossRef] [PubMed]
- Kumar, A.; Kumari, N.; Nallabelli, N.; Prasad, R. Pathogenic and Therapeutic Role of H3K4 Family of Methylases and Demethylases in Cancers. Indian J. Clin. Biochem. 2019, 34, 123–132. [Google Scholar] [CrossRef] [PubMed]
- Yang, W.; Ernst, P. SET/MLL Family Proteins in Hematopoiesis and Leukemia. Int. J. Hematol. 2017, 105, 7–16. [Google Scholar] [CrossRef] [PubMed]
- Kaustov, L.; Lemak, A.; Wu, H.; Faini, M.; Fan, L.; Fang, X.; Zeng, H.; Duan, S.; Allali-Hassani, A.; Li, F.; et al. The MLL1 Trimeric Catalytic Complex Is a Dynamic Conformational Ensemble Stabilized by Multiple Weak Interactions. Nucleic Acids Res. 2019, 47, 9433–9447. [Google Scholar] [CrossRef] [PubMed]
- Pai, G.; Roohollahi, K.; Rockx, D.; de Jong, Y.; Stoepker, C.; Pennings, C.; Rooimans, M.; Vriend, L.; Piersma, S.; Jimenez, C.R.; et al. Genome-Wide siRNA Screens Identify RBBP9 Function as a Potential Target in Fanconi Anaemia-Deficient Head-and-Neck Squamous Cell Carcinoma. Commun. Biol. 2023, 6, 37. [Google Scholar] [CrossRef] [PubMed]
- Davies, O.R.; Forment, J.V.; Sun, M.; Belotserkovskaya, R.; Coates, J.; Galanty, Y.; Demir, M.; Morton, C.R.; Rzechorzek, N.J.; Jackson, S.P.; et al. CtIP Tetramer Assembly Is Required for DNA-End Resection and Repair. Nat. Struct. Mol. Biol. 2015, 22, 150–157. [Google Scholar] [CrossRef] [PubMed]
- Wu, M.-Y.; Eldin, K.W.; Beaudet, A.L. Identification of Chromatin Remodeling Genes Arid4a and Arid4b as Leukemia Suppressor Genes. JNCI J. Natl. Cancer Inst. 2008, 100, 1247–1259. [Google Scholar] [CrossRef] [PubMed]
- Zhan, Y.; Yin, A.; Su, X.; Tang, N.; Zhang, Z.; Chen, Y.; Wang, W.; Wang, J. Interpreting the Molecular Mechanisms of RBBP4/7 and Their Roles in Human Diseases (Review). Int. J. Mol. Med. 2024, 53, 48. [Google Scholar] [CrossRef] [PubMed]
- Zhang, W.; Song, Y.; He, X.; Liu, X.; Zhang, Y.; Yang, Z.; Yang, P.; Wang, J.; Hu, K.; Liu, W.; et al. Prognosis Value of RBBP8 Expression in Plasma Cell Myeloma. Cancer Gene Ther. 2020, 27, 22–29. [Google Scholar] [CrossRef] [PubMed]
- Krämer, A.; Green, J.; Pollard, J.; Tugendreich, S. Causal Analysis Approaches in Ingenuity Pathway Analysis. Bioinformatics 2014, 30, 523–530. [Google Scholar] [CrossRef] [PubMed]
- Cardozo, L.E.; Russo, P.S.T.; Gomes-Correia, B.; Araujo-Pereira, M.; Sepúlveda-Hermosilla, G.; Maracaja-Coutinho, V.; Nakaya, H.I. webCEMiTool: Co-Expression Modular Analysis Made Easy. Front. Genet. 2019, 10, 146. [Google Scholar] [CrossRef] [PubMed]
- Russo, P.S.T.; Ferreira, G.R.; Cardozo, L.E.; Bürger, M.C.; Arias-Carrasco, R.; Maruyama, S.R.; Hirata, T.D.C.; Lima, D.S.; Passos, F.M.; Fukutani, K.F.; et al. CEMiTool: A Bioconductor Package for Performing Comprehensive Modular Co-Expression Analyses. BMC Bioinform. 2018, 19, 56. [Google Scholar] [CrossRef] [PubMed]
- Liberzon, A.; Birger, C.; Thorvaldsdóttir, H.; Ghandi, M.; Mesirov, J.P.; Tamayo, P. The Molecular Signatures Database (MSigDB) Hallmark Gene Set Collection. Cell Syst. 2015, 1, 417–425. [Google Scholar] [CrossRef] [PubMed]
- Croonquist, P.A.; Linden, M.A.; Zhao, F.; Van Ness, B.G. Gene Profiling of a Myeloma Cell Line Reveals Similarities and Unique Signatures among IL-6 Response, N-Ras-Activating Mutations, and Coculture with Bone Marrow Stromal Cells. Blood 2003, 102, 2581–2592. [Google Scholar] [CrossRef] [PubMed]
- Scott, R.; Ghule, P.; Stein, J.; Stein, G. Cell Cycle Gene Expression Networks Discovered Using Systems Biology: Significance in Carcinogenesis. J. Cell. Physiol. 2015, 230, 2533–2542. [Google Scholar] [CrossRef] [PubMed]
- Song, K.W.; Edgar, K.A.; Hanan, E.J.; Hafner, M.; Oeh, J.; Merchant, M.; Sampath, D.; Nannini, M.A.; Hong, R.; Phu, L.; et al. RTK-Dependent Inducible Degradation of Mutant PI3Kα Drives GDC-0077 (Inavolisib) Efficacy. Cancer Discov. 2022, 12, 204–219. [Google Scholar] [CrossRef] [PubMed]
- Vanhaesebroeck, B.; Burke, J.E.; Madsen, R.R. Precision Targeting of Mutant PI3Kα in Cancer by Selective Degradation. Cancer Discov. 2022, 12, 20–22. [Google Scholar] [CrossRef] [PubMed]
- Zhang, H.; Zhou, B.; Qin, S.; Xu, J.; Harding, R.; Tempel, W.; Nayak, V.; Li, Y.; Loppnau, P.; Dou, Y.; et al. Structural and Functional Analysis of the DOT1L–AF10 Complex Reveals Mechanistic Insights into MLL-AF10-Associated Leukemogenesis. Genes Dev. 2018, 32, 341–346. [Google Scholar] [CrossRef] [PubMed]
- Capdeville, R.; Buchdunger, E.; Zimmermann, J.; Matter, A. Glivec (STI571, Imatinib), a Rationally Developed, Targeted Anticancer Drug. Nat. Rev. Drug Discov. 2002, 1, 493–502. [Google Scholar] [CrossRef] [PubMed]
- Zhang, Y.; Gostissa, M.; Hildebrand, D.G.; Becker, M.S.; Boboila, C.; Chiarle, R.; Lewis, S.; Alt, F.W. The Role of Mechanistic Factors in Promoting Chromosomal Translocations Found in Lymphoid and Other Cancers. Adv. Immunol. 2010, 106, 93–133. [Google Scholar] [CrossRef] [PubMed]
- Barbosa, K.; Deshpande, A.; Chen, B.-R.; Ghosh, A.; Sun, Y.; Dutta, S.; Weetall, M.; Dixon, J.; Armstrong, S.A.; Bohlander, S.K.; et al. Acute Myeloid Leukemia Driven by the CALM-AF10 Fusion Gene Is Dependent on BMI1. Exp. Hematol. 2019, 74, 42–51.e3. [Google Scholar] [CrossRef] [PubMed]
- Zhao, A.; Zhou, H.; Yang, J.; Li, M.; Niu, T. Epigenetic Regulation in Hematopoiesis and Its Implications in the Targeted Therapy of Hematologic Malignancies. Signal Transduct. Target. Ther. 2023, 8, 71. [Google Scholar] [CrossRef] [PubMed]
- Canoy, R.J.; Shmakova, A.; Karpukhina, A.; Shepelev, M.; Germini, D.; Vassetzky, Y. Factors That Affect the Formation of Chromosomal Translocations in Cells. Cancers 2022, 14, 5110. [Google Scholar] [CrossRef] [PubMed]
- Rabbitts, T.H. Translocations, Master Genes, and Differences between the Origins of Acute and Chronic Leukemias. Cell 1991, 67, 641–644. [Google Scholar] [CrossRef] [PubMed]
- Mitelman, F.; Mandahl, N. Distinct Signatures of Chromosomal Involvement in 59 251 Translocations Across 58 Tumor Types. A Novel Perspective. Genes. Chromosom. Cancer 2025, 64, e70053. [Google Scholar] [CrossRef] [PubMed]
- Xu, X.; Nagel, S.; Quentmeier, H.; Wang, Z.; Pommerenke, C.; Dirks, W.G.; Macleod, R.A.F.; Drexler, H.G.; Hu, Z. KDM3B Shows Tumor-Suppressive Activity and Transcriptionally Regulates HOXA1 through Retinoic Acid Response Elements in Acute Myeloid Leukemia. Leuk. Lymphoma 2018, 59, 204–213. [Google Scholar] [CrossRef] [PubMed]
- Kaniskan, H.Ü.; Martini, M.L.; Jin, J. Inhibitors of Protein Methyltransferases and Demethylases. Chem. Rev. 2018, 118, 989–1068. [Google Scholar] [CrossRef] [PubMed]
- Yang, D.; Xu, P.; Su, H.; Zhong, W.; Xu, J.; Su, Z.; Liu, X. The Histone Methyltransferase DOT1L Is a New Epigenetic Regulator of Pulmonary Fibrosis. Cell Death Dis. 2022, 13, 60. [Google Scholar] [CrossRef] [PubMed]
- Yang, L.; Lei, Q.; Li, L.; Yang, J.; Dong, Z.; Cui, H. Silencing or Inhibition of H3K79 Methyltransferase DOT1L Induces Cell Cycle Arrest by Epigenetically Modulating C-Myc Expression in Colorectal Cancer. Clin. Epigenet. 2019, 11, 199. [Google Scholar] [CrossRef] [PubMed]
Figure 1.
Paralog selective inhibitors of PI3K are differentially cytotoxic to U937 leukemia cells. The cells were treated with alpelisib (A), idelalisib (I), serabelisib (S), taselisib (T), and wortmannin (W) or with a mixture of all A, I, S, and T and cell proliferation determined after 24 hours. The data are expressed as mean ± SEM. All differences are statistically significant (P < 0.05).
Figure 1.
Paralog selective inhibitors of PI3K are differentially cytotoxic to U937 leukemia cells. The cells were treated with alpelisib (A), idelalisib (I), serabelisib (S), taselisib (T), and wortmannin (W) or with a mixture of all A, I, S, and T and cell proliferation determined after 24 hours. The data are expressed as mean ± SEM. All differences are statistically significant (P < 0.05).
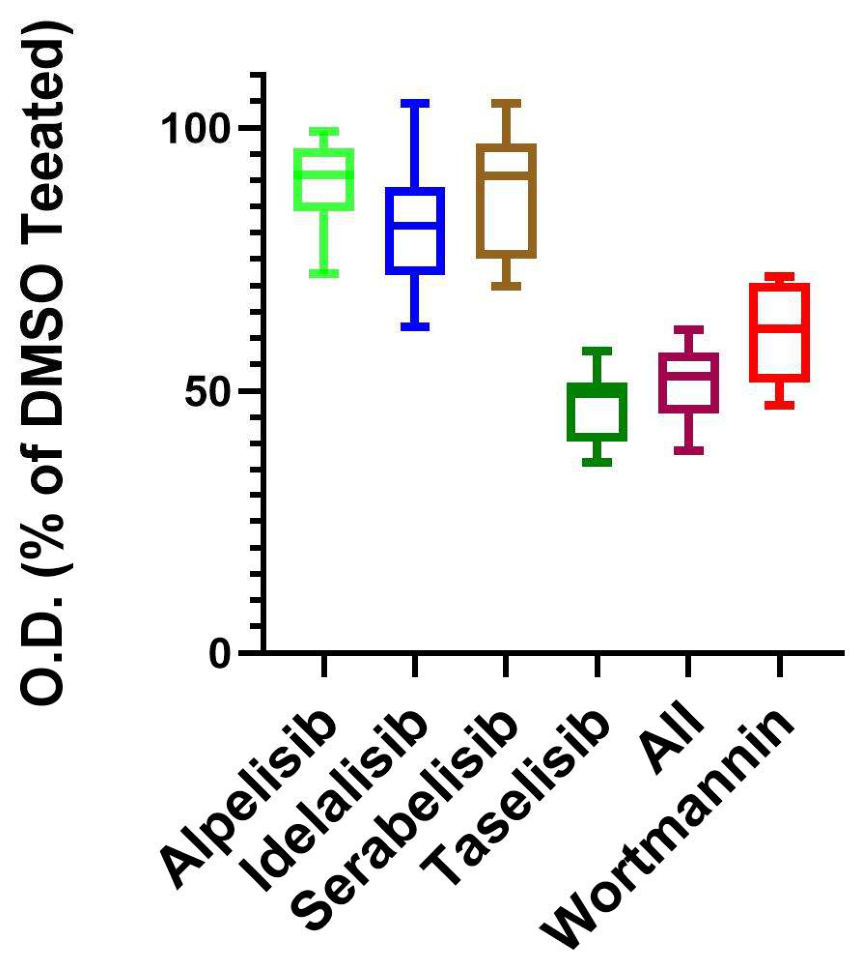
Figure 2.
Wortmannin causes cell shrinkage and nuclear fragmentation in U937 cells. The cells were treated for 24 h as follows: A to C) control cells; D to E) DMSO; and F to I) 1 µM wortmannin. The cells were stained with DRAQ5 and imaged with a confocal microscope.
Figure 2.
Wortmannin causes cell shrinkage and nuclear fragmentation in U937 cells. The cells were treated for 24 h as follows: A to C) control cells; D to E) DMSO; and F to I) 1 µM wortmannin. The cells were stained with DRAQ5 and imaged with a confocal microscope.
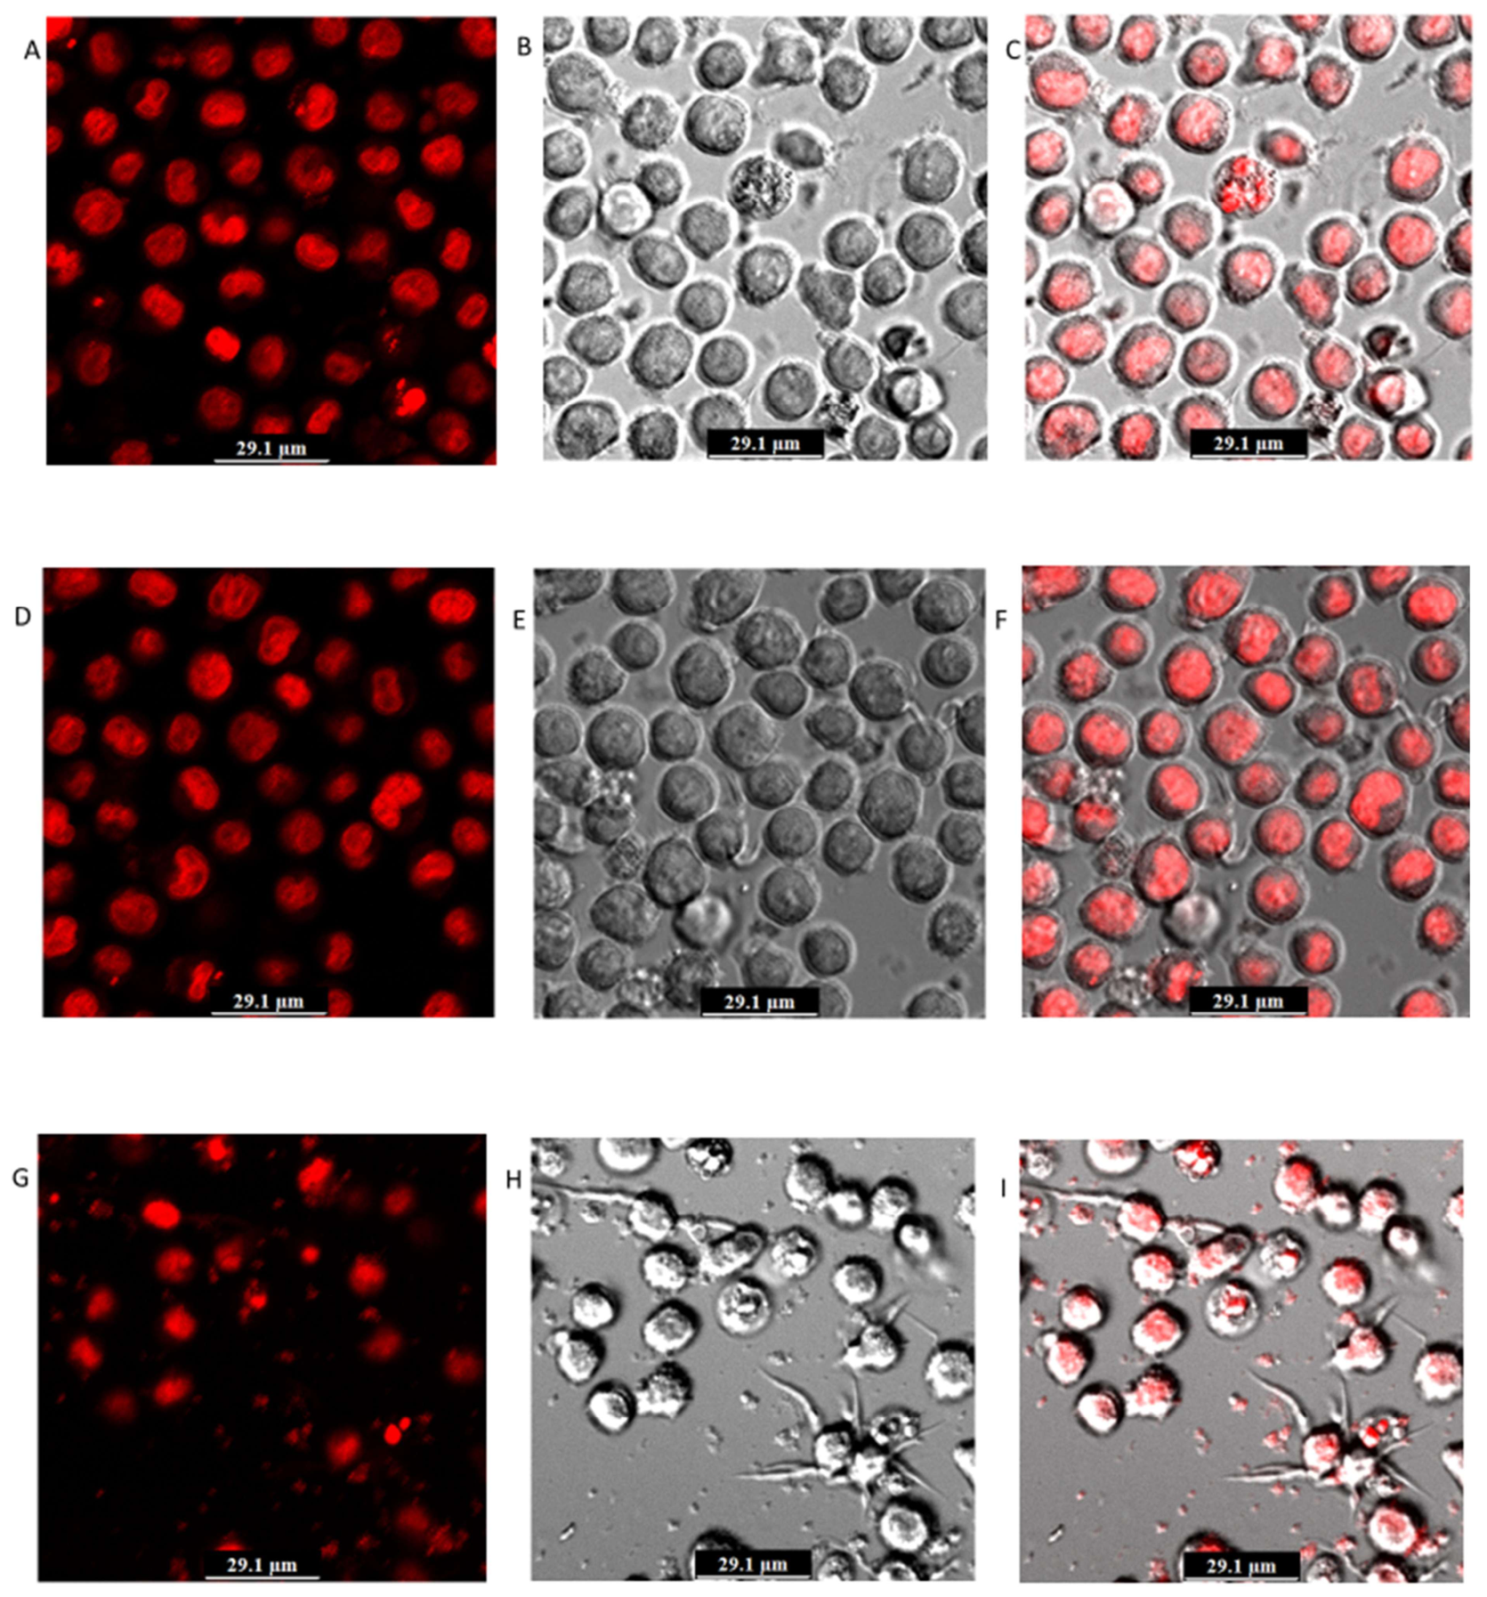
Figure 3.
Taselisib induces chromatin condensation and nuclear fragmentation in U937 cells. The cells were treated with DMSO (A to C) or 1µM taselisib (D to F) for 24 hours, stained with DRAQ5 then imaged with a confocal microscope.
Figure 3.
Taselisib induces chromatin condensation and nuclear fragmentation in U937 cells. The cells were treated with DMSO (A to C) or 1µM taselisib (D to F) for 24 hours, stained with DRAQ5 then imaged with a confocal microscope.
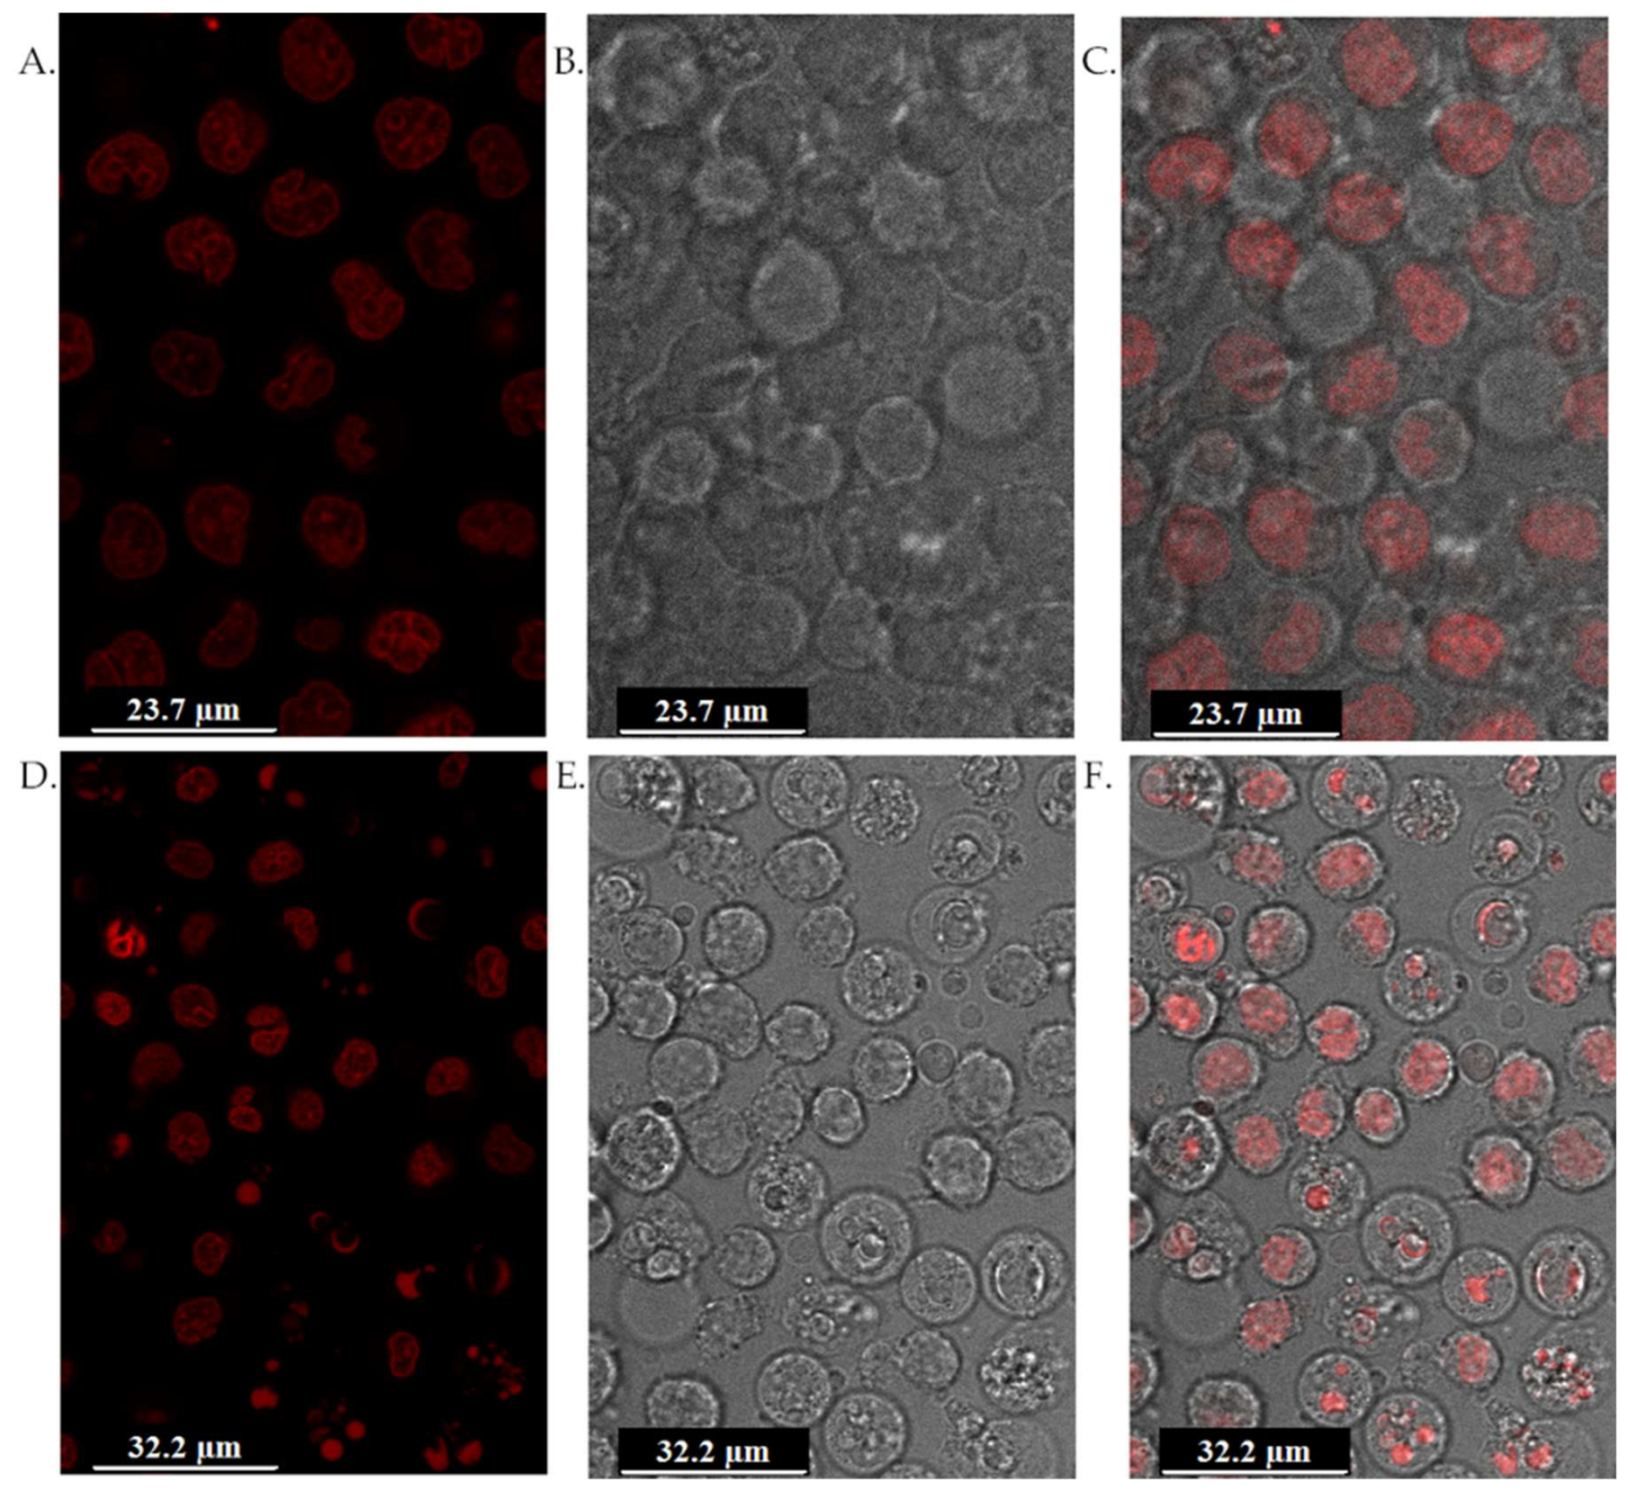
Figure 4.
Dose-dependent cytotoxicity profiles of class I PI3K inhibitors toward U937 and THP-1 leukemia cells are similar. A) U937 cells; B) THP-1 cells. Idelalisib, taselisib, and wortmannin are toxic to THP-1 cells. The cells were treated with the compounds for 48 hours. This extended concentration range (6.25 – 50 µM) was used strictly to capture the complete cell-death curves needed to calculate accurate mathematical values IC50.
Figure 4.
Dose-dependent cytotoxicity profiles of class I PI3K inhibitors toward U937 and THP-1 leukemia cells are similar. A) U937 cells; B) THP-1 cells. Idelalisib, taselisib, and wortmannin are toxic to THP-1 cells. The cells were treated with the compounds for 48 hours. This extended concentration range (6.25 – 50 µM) was used strictly to capture the complete cell-death curves needed to calculate accurate mathematical values IC50.
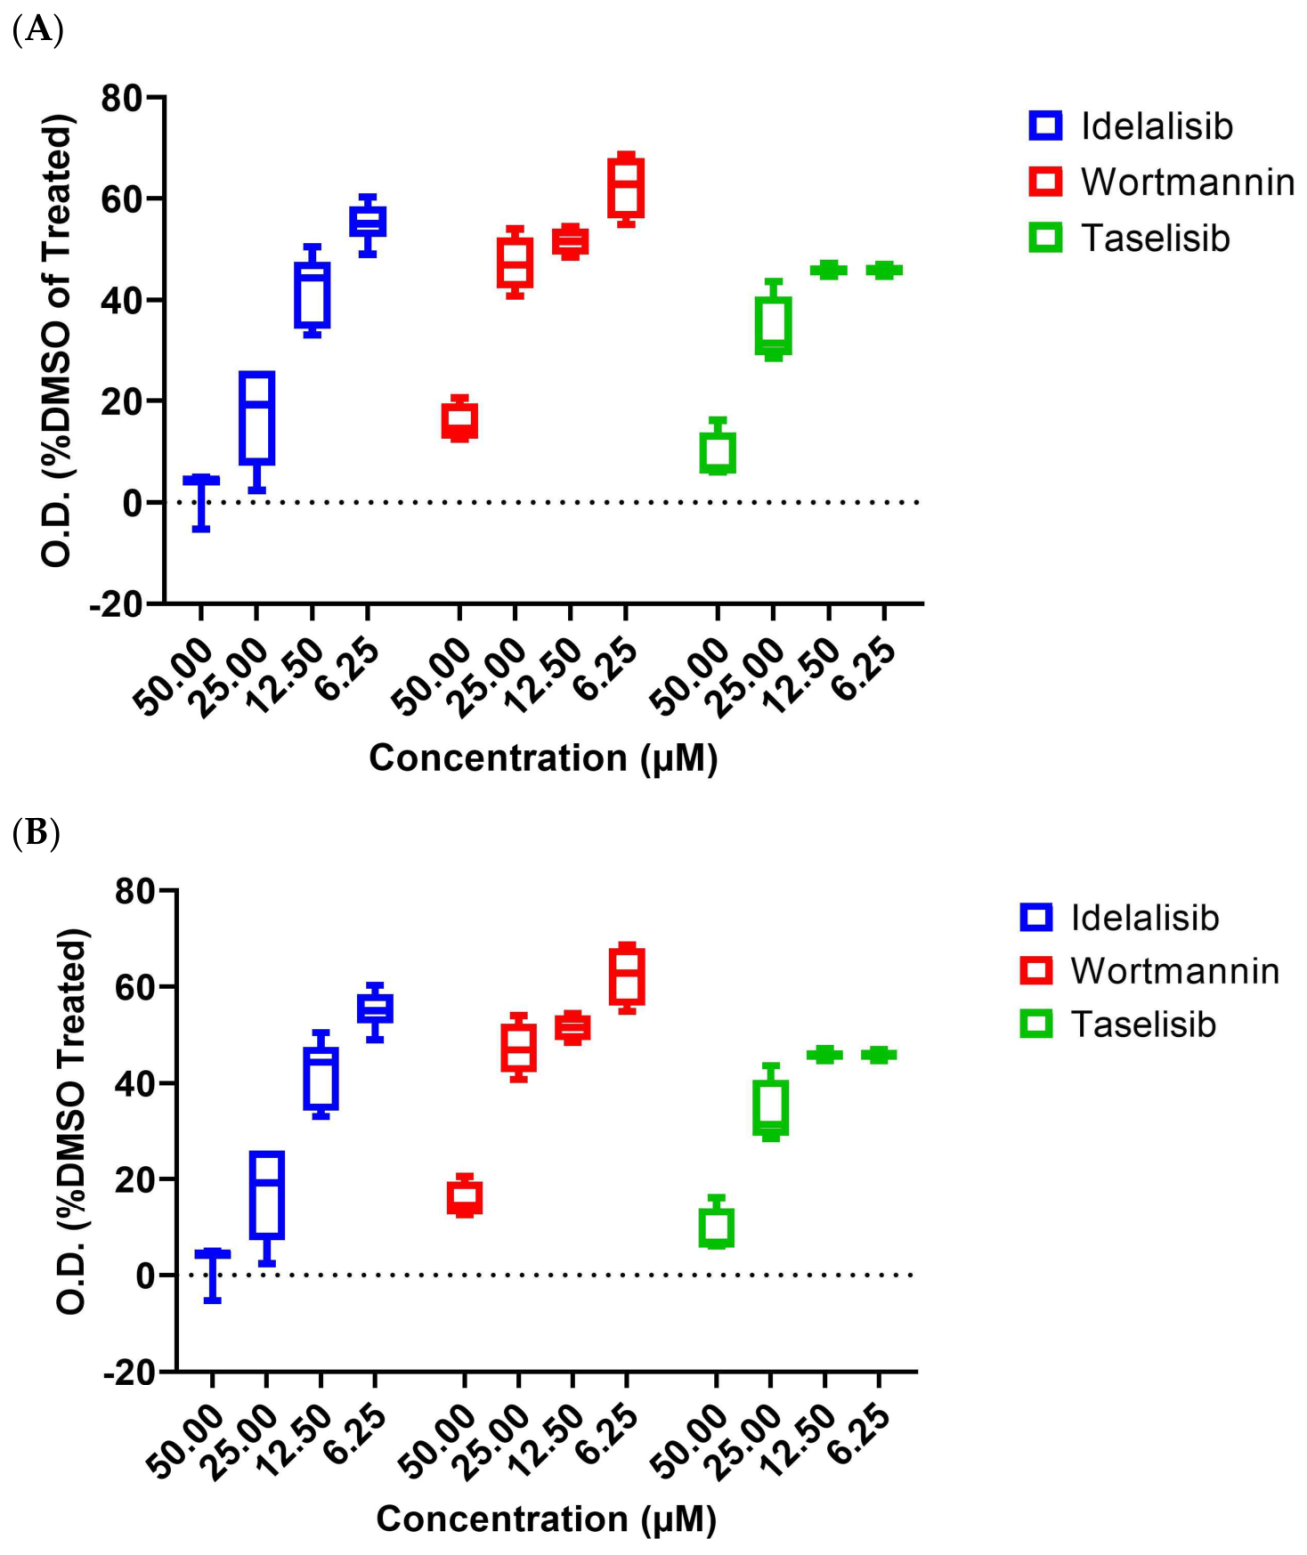
Figure 5.
Expression of class I PI3K isoforms is reflects the myeloid lineage of U937 cells. PIK3CD (PI3Kδ) is the most abundant isoform followed by PIK3CG (PI3Kγ). Taselisib led to an increase in the expression levels of PIK3IP1 by 3.2 times and a decrease of PIK3R3 by 2.8 times. Expression data were transformed to log2(value)+1 and plotted using Heatmap2 in Galaxy [57,58].
Figure 5.
Expression of class I PI3K isoforms is reflects the myeloid lineage of U937 cells. PIK3CD (PI3Kδ) is the most abundant isoform followed by PIK3CG (PI3Kγ). Taselisib led to an increase in the expression levels of PIK3IP1 by 3.2 times and a decrease of PIK3R3 by 2.8 times. Expression data were transformed to log2(value)+1 and plotted using Heatmap2 in Galaxy [57,58].
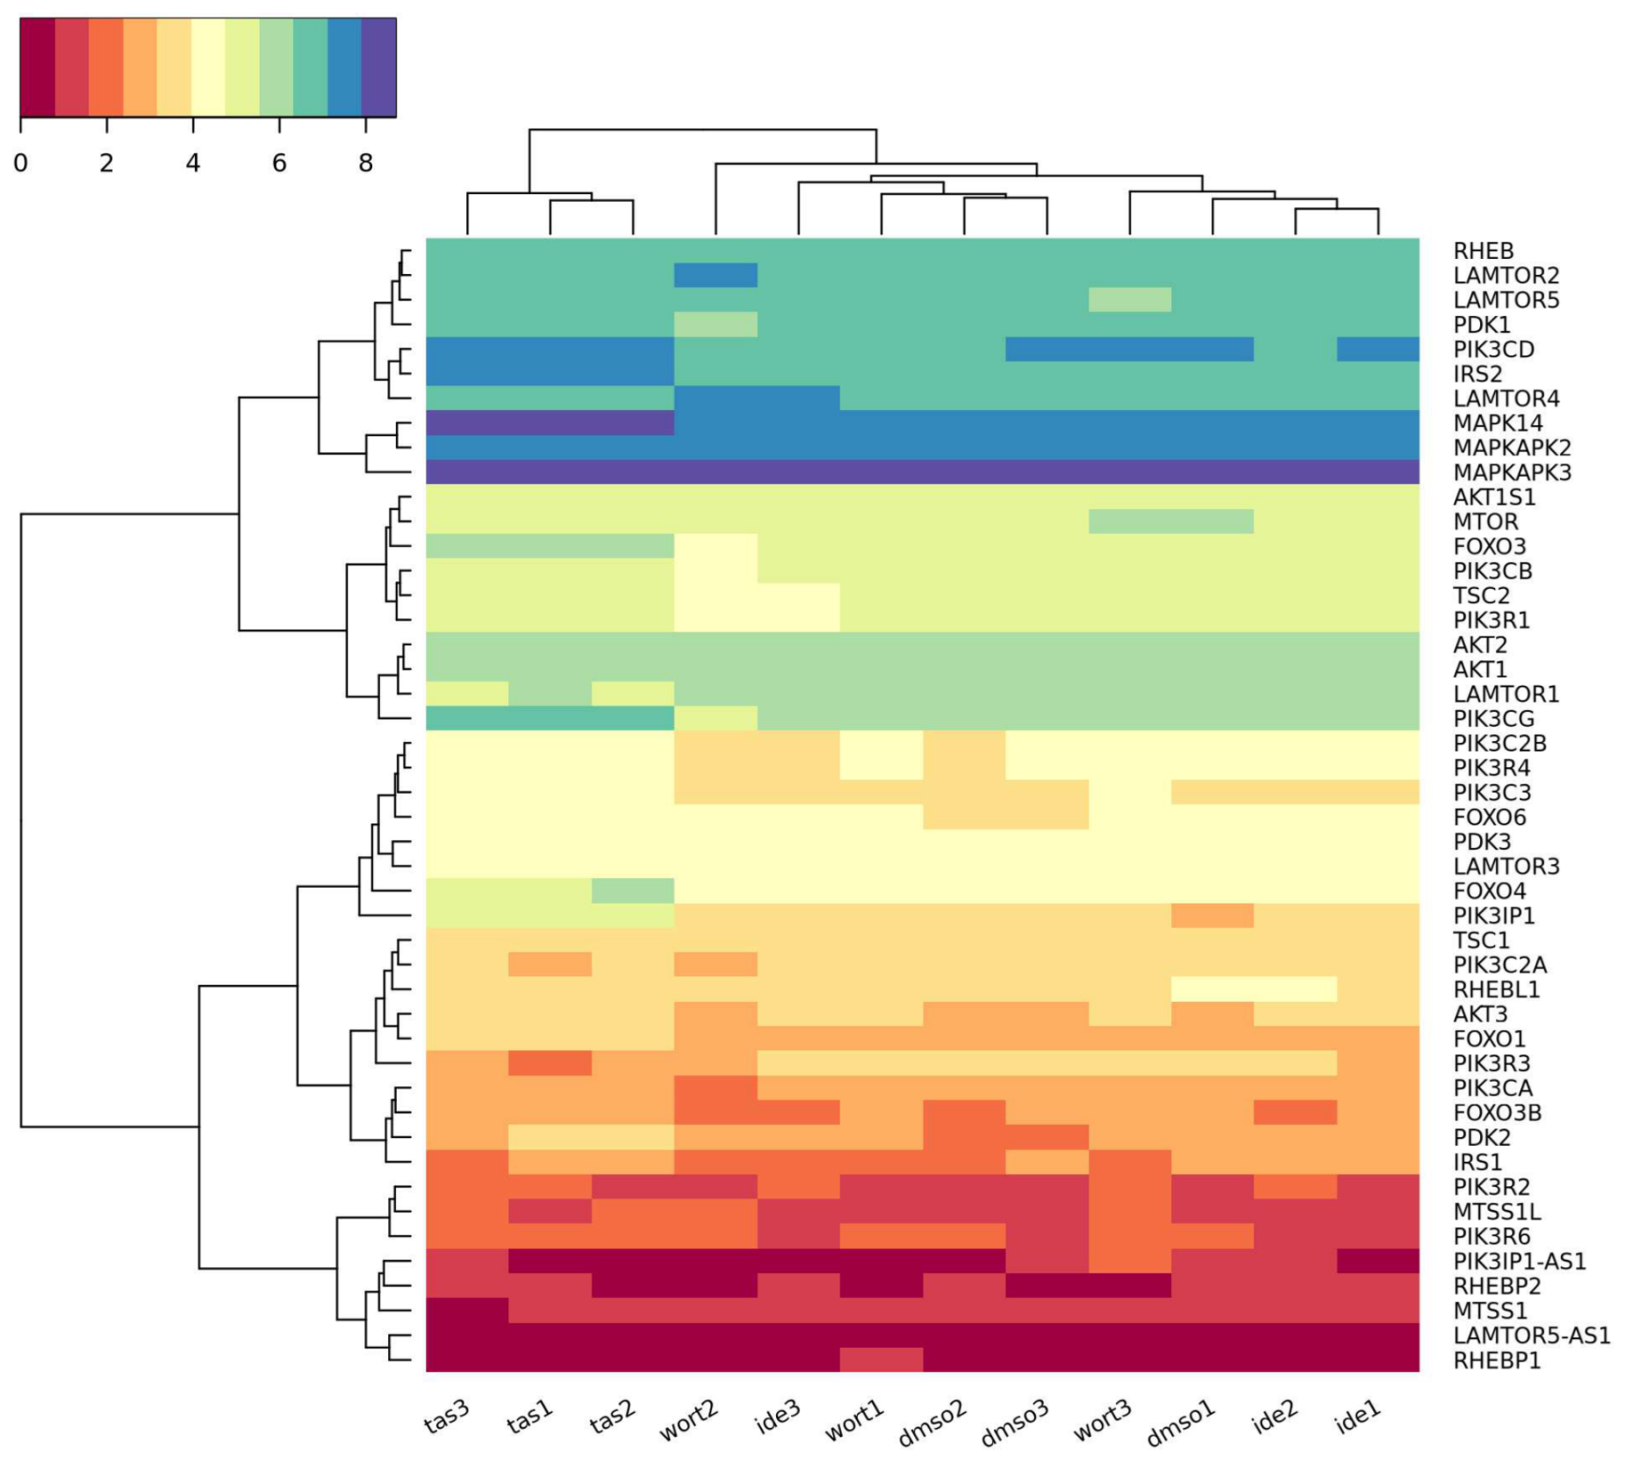
Figure 6.
Expression patterns of histone lysine methylases (KMTs) and histone lysine demethylases (KDMs) in U937 cells. The genes with the highest level of expression in this functional group are LSD1/KDM1A followed by KDM5C and the methyltransferase DOTL1.
Figure 6.
Expression patterns of histone lysine methylases (KMTs) and histone lysine demethylases (KDMs) in U937 cells. The genes with the highest level of expression in this functional group are LSD1/KDM1A followed by KDM5C and the methyltransferase DOTL1.
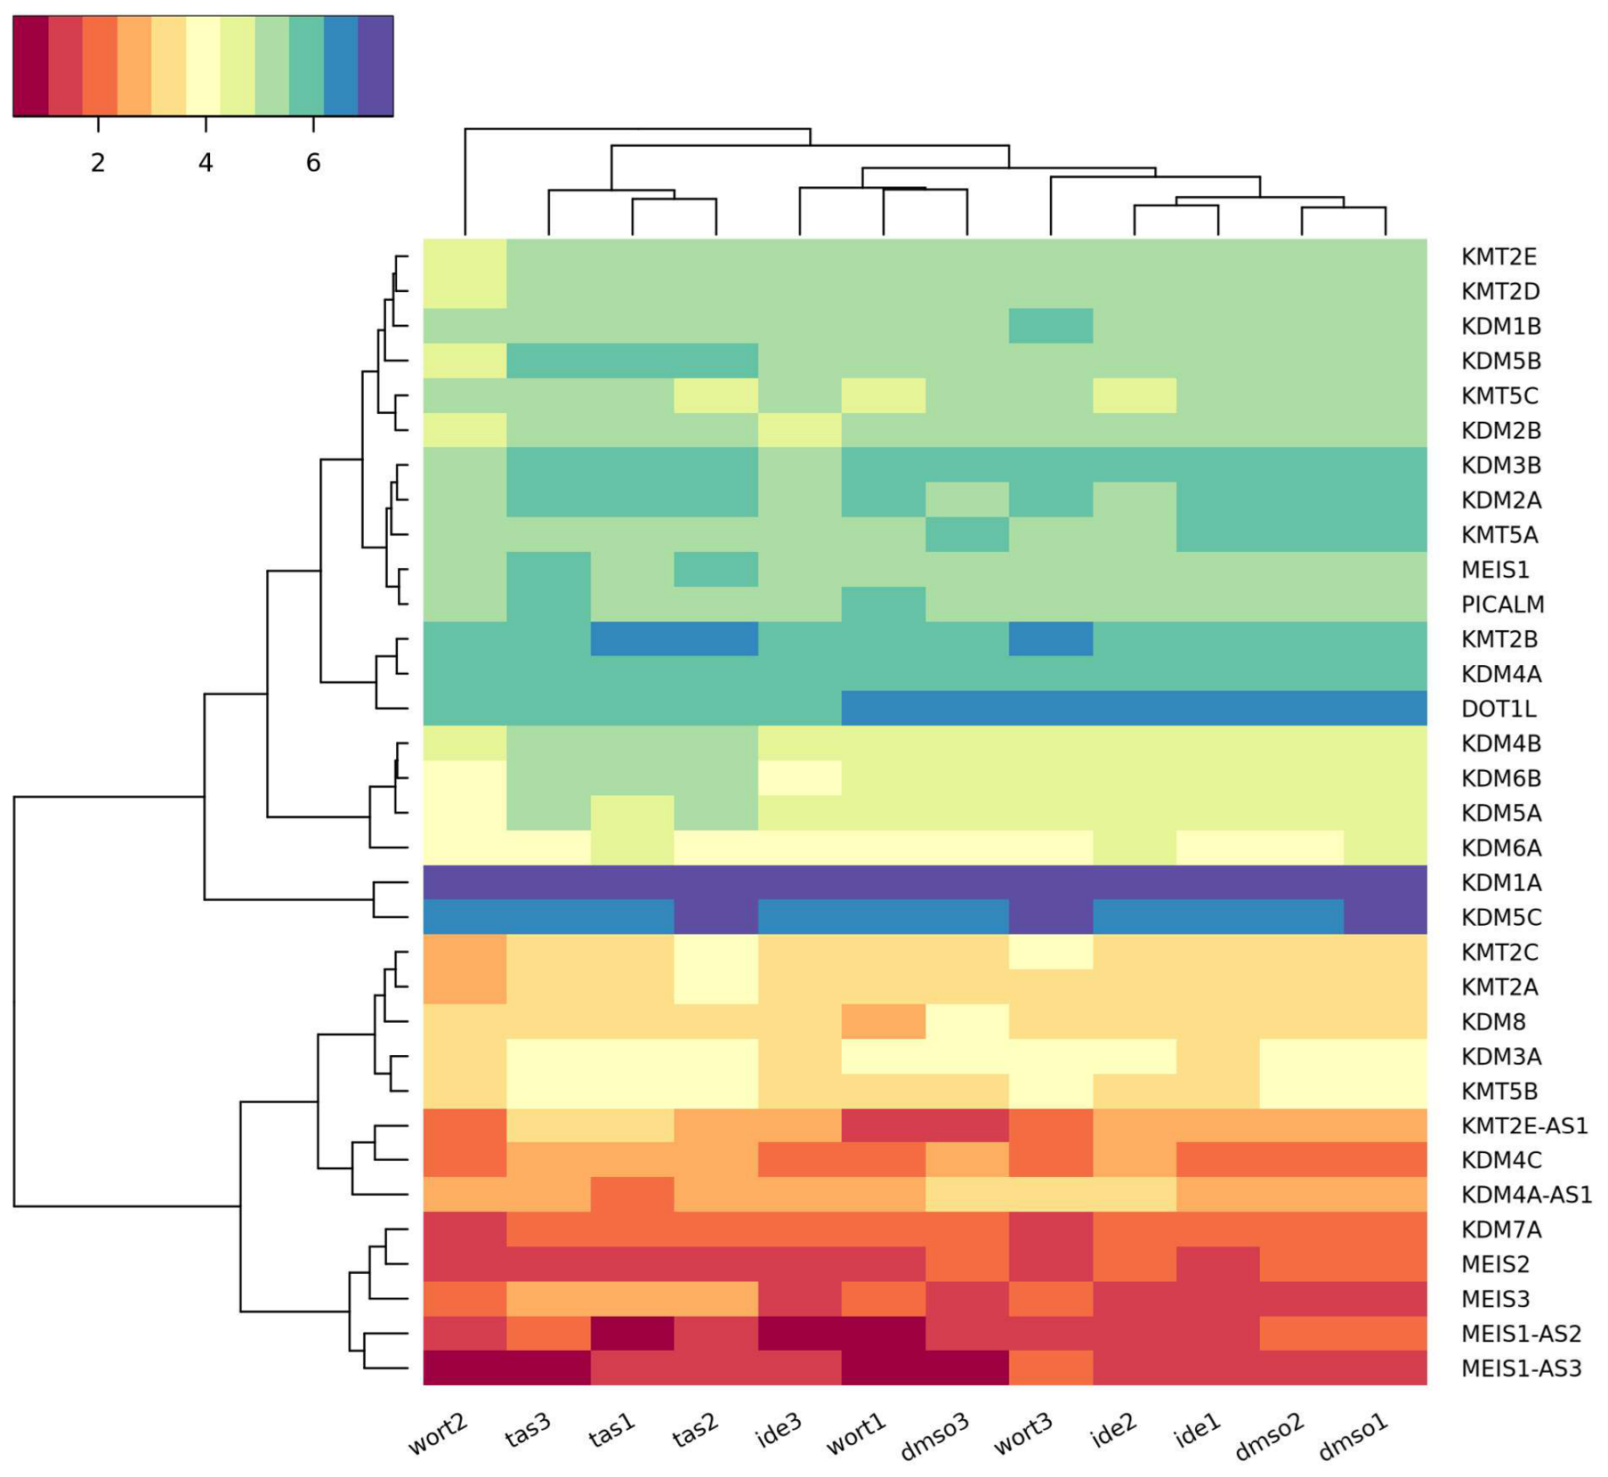
Figure 7.
Gene set enrichment. The data were further analyzed with CEMiTool to identify enriched pathways. Only modules classified as significant are shown.
Figure 7.
Gene set enrichment. The data were further analyzed with CEMiTool to identify enriched pathways. Only modules classified as significant are shown.
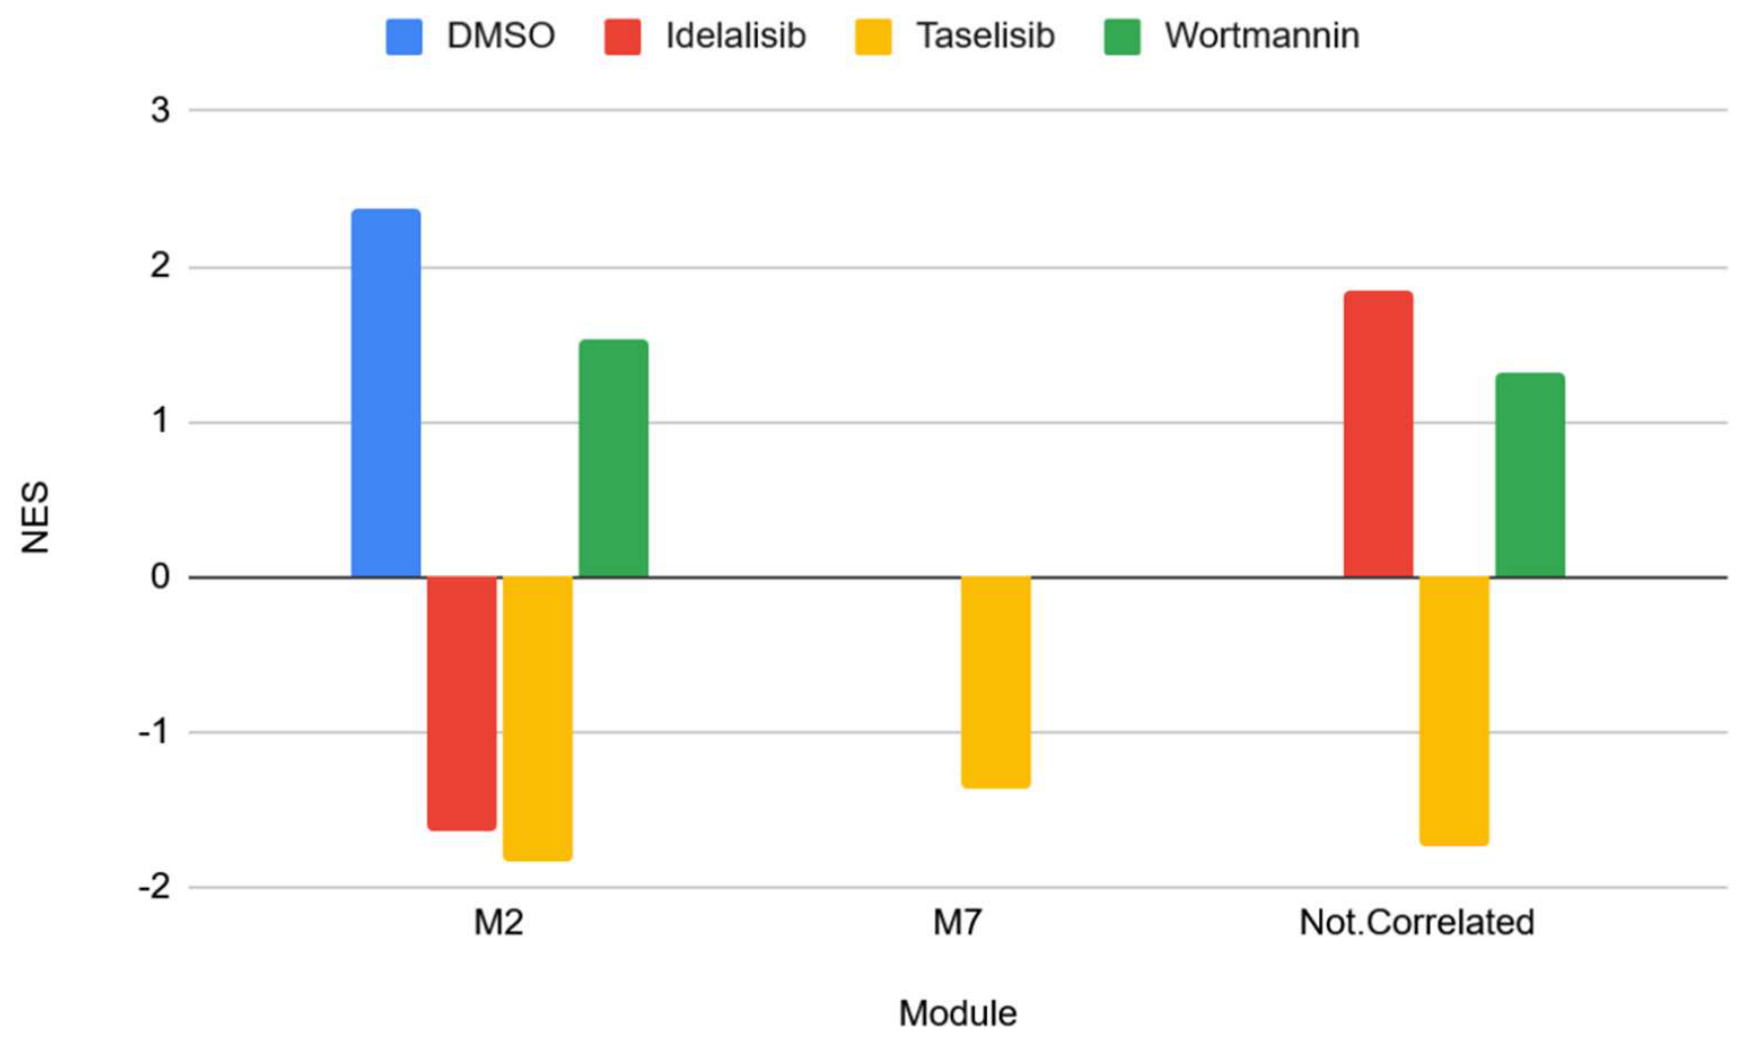

Table 1.
Summary of differentially expressed genes (DEGs) across pairwise comparisons in RNA sequencing analysis of PI3K inhibitor-treated U937 cells. DEGs defined as FDR < 0.05 and log₂FC > 1. Upregulated and downregulated counts are relative to the first-named condition in each comparison. PC1, first principal component from PCA of variance-stabilized read counts.
Table 1.
Summary of differentially expressed genes (DEGs) across pairwise comparisons in RNA sequencing analysis of PI3K inhibitor-treated U937 cells. DEGs defined as FDR < 0.05 and log₂FC > 1. Upregulated and downregulated counts are relative to the first-named condition in each comparison. PC1, first principal component from PCA of variance-stabilized read counts.
| Comparison | Total DEGs | Upregulated | Downregulated | PC1 Variance |
|---|---|---|---|---|
| DMSO vs. Taselisib | 1,588 | 1,266 | 322 | 97.5% |
| DMSO vs. Idelalisib | 2 | 2 | 0 | 47.3% |
| DMSO vs. Wortmannin | 73 | 67 | 6 | 62.9% |
| Taselisib vs. Wortmannin | 967 | 213 | 754 | 93.3% |
| Idelalisib vs. Wortmannin | 30 | 23 | 7 | 46.1% |
| Idelalisib vs. Taselisib | 1,042 | 240 | 802 | 96.2% |
Disclaimer/Publisher’s Note: The statements, opinions and data contained in all publications are solely those of the individual author(s) and contributor(s) and not of MDPI and/or the editor(s). MDPI and/or the editor(s) disclaim responsibility for any injury to people or property resulting from any ideas, methods, instructions or products referred to in the content. |
© 2026 by the authors. Licensee MDPI, Basel, Switzerland. This article is an open access article distributed under the terms and conditions of the Creative Commons Attribution (CC BY) license (http://creativecommons.org/licenses/by/4.0/).
Copyright: This open access article is published under a Creative Commons CC BY 4.0 license, which permit the free download, distribution, and reuse, provided that the author and preprint are cited in any reuse.


