

Submitted:
18 July 2026
Posted:
20 July 2026
You are already at the latest version
Abstract
Computational forecasting of influenza virus evolution can shorten the interval between mutation detection and public-health recognition, although the extent of that gain varies across the global surveillance landscape. This integrative narrative review synthesizes peer-reviewed research and authoritative technical documentation on genomic surveillance, phylodynamics, antigenic modeling, machine learning, and public-health forecasting pipelines. It examines the methodological and structural foundations of earlier recognition: the integration of genomic, epidemiological, mobility, and environmental data; compartmental, stochastic, and selective-pressure modeling frameworks; machine-learning architectures for antigenic prediction; and decision pipelines supported by GISRS, GISAID, and Nextstrain. Current approaches increasingly combine genomic and antigenic maps, allowing phylogenetic structure to inform phenotype space, although available data explain only part of clade behavior. Models based mainly on substitution counts may be unreliable during reassortment events, while deep-learning approaches show retrospective promise but may generalize poorly to previously unseen epitopes or lineages. A defensible near-term contribution of the field is therefore earlier recognition rather than exact prediction, providing additional lead time for vaccine-strain selection and outbreak response. Extending that contribution to health systems carrying substantial influenza burden will require interoperable multi-stream surveillance, accessible computational infrastructure, and sustained investment in surveillance capacity in low- and middle-income countries. Equitable access to forecasting tools remains an important complement to methodological improvement.
Keywords:
influenza
; genomic surveillance
; antigenic prediction
; computational forecasting
; machine learning
; vaccine strain selection
1.0. Introduction
Influenza viruses are members of the Orthomyxoviridae family and possess segmented, negative-sense RNA genomes. Influenza A and B viruses contain eight genomic segments encoding the polymerase proteins PB2, PB1, and PA; hemagglutinin (HA); nucleoprotein (NP); neuraminidase (NA); matrix proteins; and non-structural proteins [1]. Their segmented architecture supports two broad forms of evolutionary change. Antigenic drift reflects the accumulation and selection of mutations, particularly in HA and NA, that can progressively alter immune recognition and contribute to regular vaccine updating [2]. Antigenic shift results from reassortment between co-infecting influenza A viruses and can generate antigenically novel constellations with pandemic potential [3].
Seasonal influenza is associated with an estimated 290,000 to 650,000 respiratory deaths worldwide each year [4], while the 1918 and 2009 H1N1 pandemics illustrate the capacity of newly emergent influenza viruses to place health systems under severe pressure [5]. Surveillance must therefore operate quickly enough to detect evolutionary and epidemiological change while that information can still influence preparedness and response.
Sentinel surveillance, serological testing, and phenotypic assays remain essential, but used alone they generally cannot resolve closely related transmission lineages or process the volume of sequence information now produced by national and international sequencing networks. Genomic analysis adds resolution; phenotypic assays retain the decisive role of showing whether sequence change has translated into altered antigenicity or other biological effects.
Genomic sequences, epidemiological metadata, and clinical records each describe different dimensions of viral evolution and disease activity, yet their heterogeneous formats, uneven sampling densities, and differing access conditions complicate joint analysis. These challenges increase when information is contributed by laboratories operating under distinct technical, regulatory, and institutional arrangements [6].
Genomics and phylogenetics address complementary aspects of viral evolution. Sequence analysis identifies substitutions, resistance-associated markers, and reassortment patterns at the nucleotide or amino-acid level; phylogenetic reconstruction places those observations in temporal and geographic context and can support inference about lineage relationships, evolutionary rates, and plausible transmission histories.
When combined with appropriate metadata and phenotypic evidence, these methods support clade-level tracking of antigenic drift, detection of reassortment, and investigation of transmission patterns at a resolution not available from any single data stream. Mapping substitutions onto protein structures and fitness landscapes can further prioritize genetic changes for experimental study and estimate which changes may be associated with future growth advantages, without treating those projections as deterministic [7].
Cloud-hosted notebooks and workflow environments can lower some infrastructure barriers to genomic analysis by providing shared computing resources, reproducible software environments, and collaborative access to standardized pipelines. Platforms such as Google Colab and Yandex DataSphere illustrate different scales of this approach. Their practical value, however, still depends on data-governance rules, local connectivity, computational quotas, technical support, and the availability of trained personnel.
Two outbreak investigations illustrate the operational value of integrated genomic and phylogenetic analysis. During the 2009 H1N1 pandemic, whole-genome comparisons helped reconstruct the virus’s origins and evolutionary relationships soon after emergence [8]. In the 2013 H7N9 outbreak in China, genome analysis identified a reassortant avian-origin virus and mutations relevant to host adaptation and pathogenicity, helping to frame subsequent experimental and public-health risk assessment [9]. In both examples, sequence evidence accelerated characterization, but it complemented rather than replaced virological, clinical, and epidemiological investigation.
This review examines the methodological and structural foundations of computational influenza forecasting, covering genomic surveillance, mathematical modeling, machine-learning approaches to antigenic prediction, real-time decision pipelines, and intervention modeling. It is an integrative rather than systematic review: the aim is not to catalogue the literature exhaustively, but to evaluate where combinations of these components may improve decision-relevant inference, where evidence remains retrospective or incomplete, and how structural and equity constraints shape their practical use.
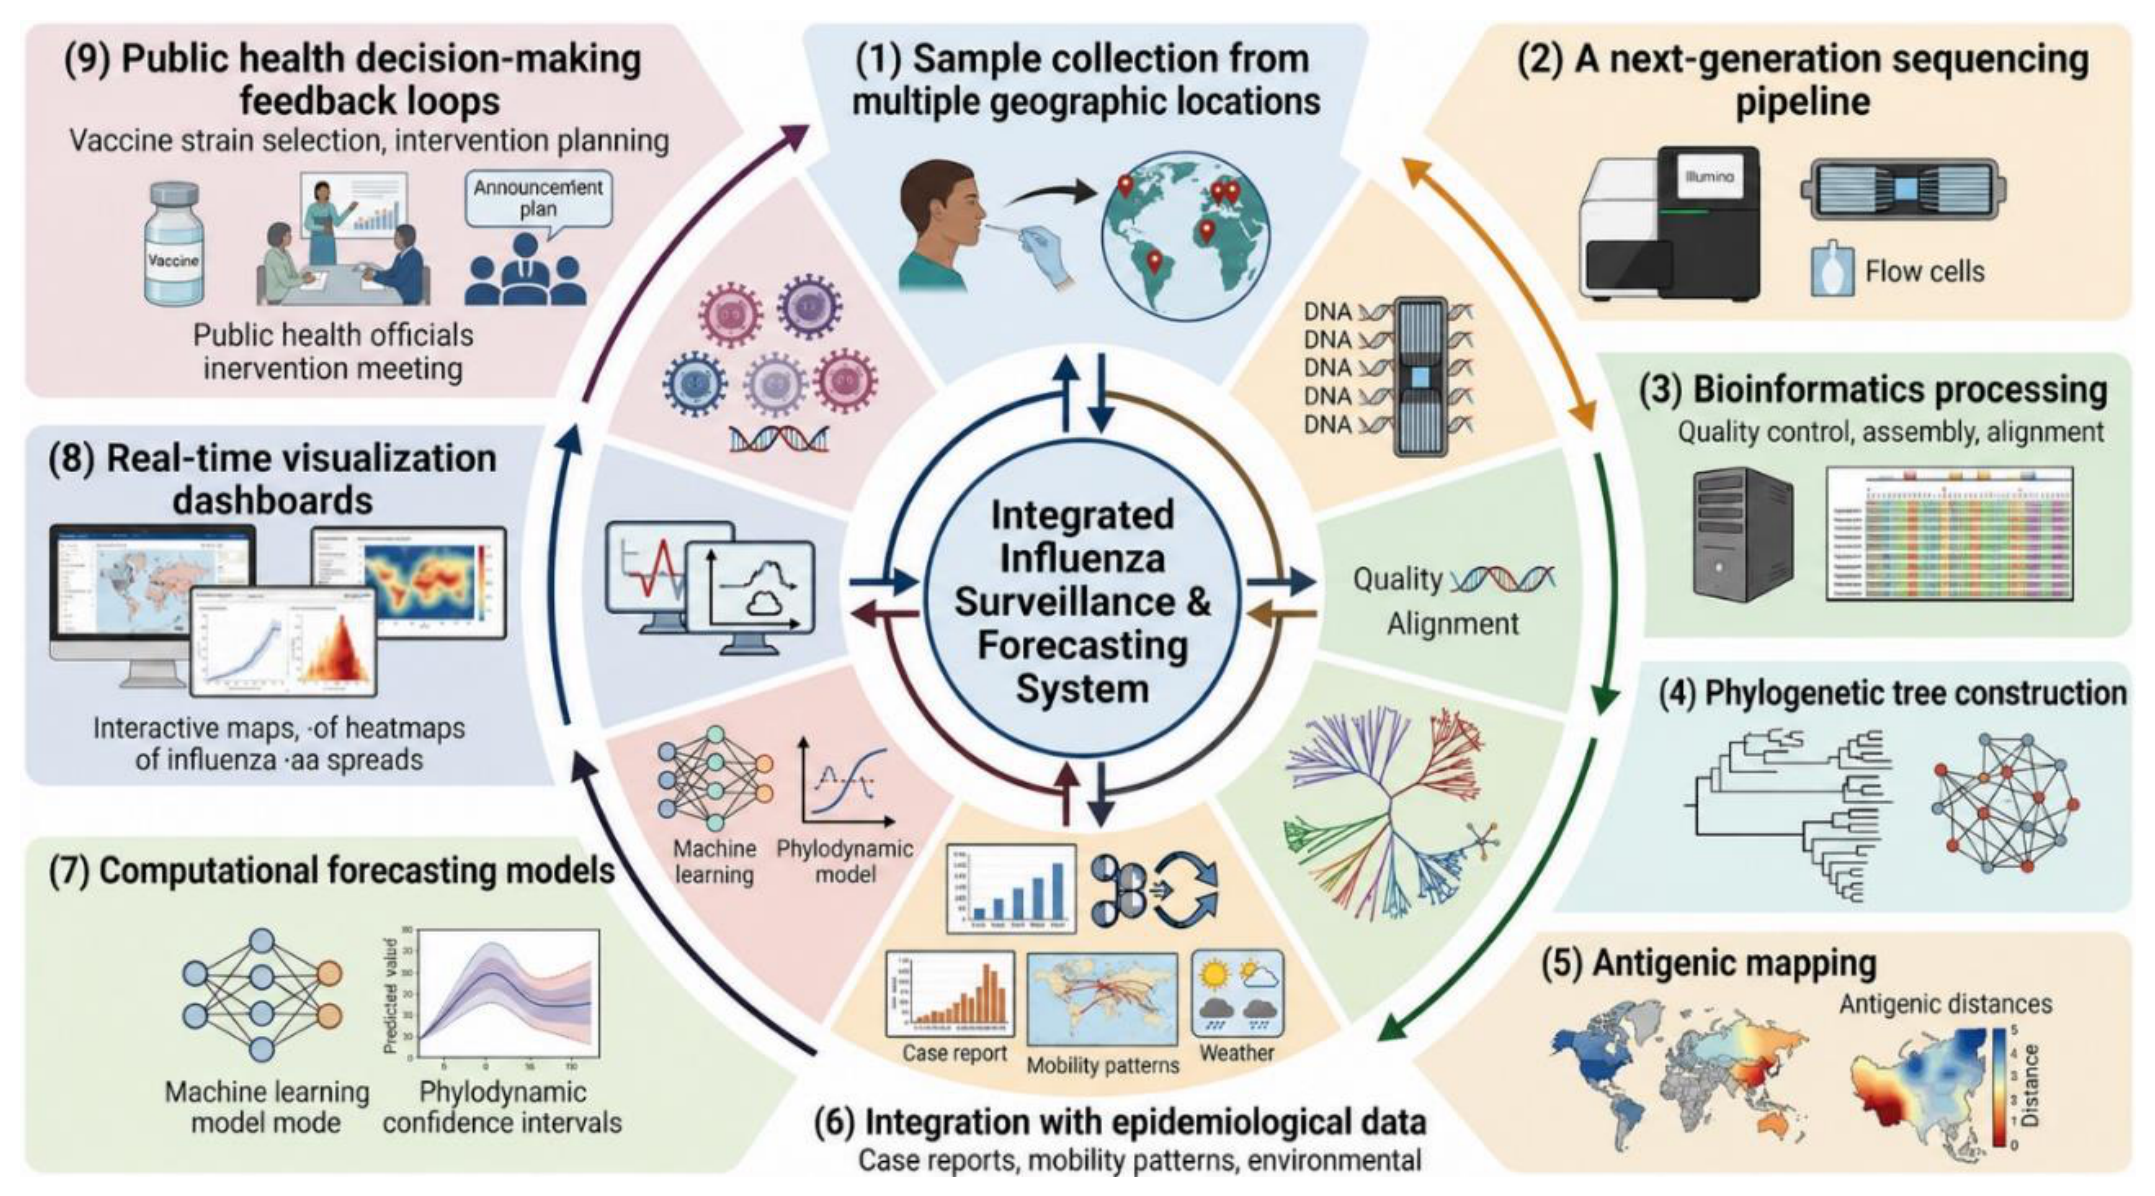
Figure 1.
Integrated genomic and epidemiological surveillance pipeline for influenza forecasting. The workflow depicts: (1) sample collection from multiple geographic locations; (2) next-generation sequencing; (3) bioinformatics processing, including quality control, assembly, and alignment; (4) phylogenetic-tree construction; (5) antigenic mapping; (6) integration with epidemiological data, including case reports, mobility patterns, and environmental variables; (7) computational forecasting using machine-learning and phylodynamic models with uncertainty intervals; (8) real-time visualization dashboards; and (9) public-health decision-making and feedback loops for vaccine-strain selection and intervention planning. Arrows indicate iterative exchange among surveillance, analysis, visualization, and response. NGS, next-generation sequencing; GISRS, Global Influenza Surveillance and Response System.
Figure 1.
Integrated genomic and epidemiological surveillance pipeline for influenza forecasting. The workflow depicts: (1) sample collection from multiple geographic locations; (2) next-generation sequencing; (3) bioinformatics processing, including quality control, assembly, and alignment; (4) phylogenetic-tree construction; (5) antigenic mapping; (6) integration with epidemiological data, including case reports, mobility patterns, and environmental variables; (7) computational forecasting using machine-learning and phylodynamic models with uncertainty intervals; (8) real-time visualization dashboards; and (9) public-health decision-making and feedback loops for vaccine-strain selection and intervention planning. Arrows indicate iterative exchange among surveillance, analysis, visualization, and response. NGS, next-generation sequencing; GISRS, Global Influenza Surveillance and Response System.
2.0. Antigenic And Structural Dynamics: How Antigenic Drift Arises, Structure-Function Coupling, And Molecular Modeling Links
Antigenic drift—the serial accumulation and selection of mutations in HA and NA—can progressively reduce immunity acquired through prior infection or vaccination and is a major reason influenza vaccines are reviewed and updated regularly [1,2]. The molecular consequences of these changes, and the extent to which structural variation translates into measurable antigenic escape, determine which signals can be assessed computationally and which still require experimental characterization.
2.1. Hemagglutinin: Primary Target of Neutralizing Antibodies
HA mediates attachment and membrane fusion and is the principal target of neutralizing antibodies. Mutations concentrated in exposed antigenic regions can alter antibody recognition and contribute to antigenic differences between circulating and vaccine strains. Classical mapping studies identified discrete antigenic sites on HA, while antigenic cartography linked serological distance to genetic change across circulating H3N2 viruses [10,11]. Computational and structural methods can now prioritize substitutions that may affect antigenicity, but proposed escape variants require validation against serological or other phenotypic data before being treated as established.
2.2. Neuraminidase: Complementary Role in Immunity and Drug Susceptibility
The neuraminidase (NA) protein is another important surface glycoprotein that facilitates viral release from infected cells. While HA is the primary target for vaccine-induced immunity, NA also contributes to protective immunity, and mutations in NA can affect antiviral drug susceptibility. Antigenic drift in NA can occur independently of HA, and both proteins contribute to the overall antigenic profile of the virus. Structural analysis of NA has revealed conserved active sites that are targeted by antiviral drugs, as well as variable regions that are subject to immune pressure [12].
2.3. Structure-Function Coupling in Viral Evolution
Structure-function coupling imposes an important constraint on influenza evolution. Changes in HA or NA may alter antigenicity, receptor-binding avidity, enzymatic activity, stability, or the functional balance between the two surface glycoproteins. Some substitutions associated with adaptation to human-type receptors or altered NA activity may influence transmission fitness, but their effect depends on the broader genomic background and cannot be inferred reliably from a single residue in isolation [1,13].
2.4. Molecular Modeling Approaches
Molecular modeling supports investigation of the structural and functional consequences of substitutions in influenza proteins. Homology models, experimentally resolved structures, molecular-dynamics simulations, and protein-language or embedding approaches can be used to examine conformational context, surface accessibility, electrostatic changes, and plausible antibody interactions. These methods are most appropriately viewed as hypothesis-generating tools that prioritize variants for experimental assessment rather than as standalone proof of antigenic escape [13,14].
Structural information can also be integrated with phylogenetic and antigenic data to examine how substitutions accumulate along lineages, whether similar changes arise independently, and how genotype relates to antigenic phenotype. Such integration has improved the interpretation of influenza antigenic evolution and can support vaccine-strain deliberation, while uncertainty remains when serological observations are sparse or unevenly sampled [11,14].
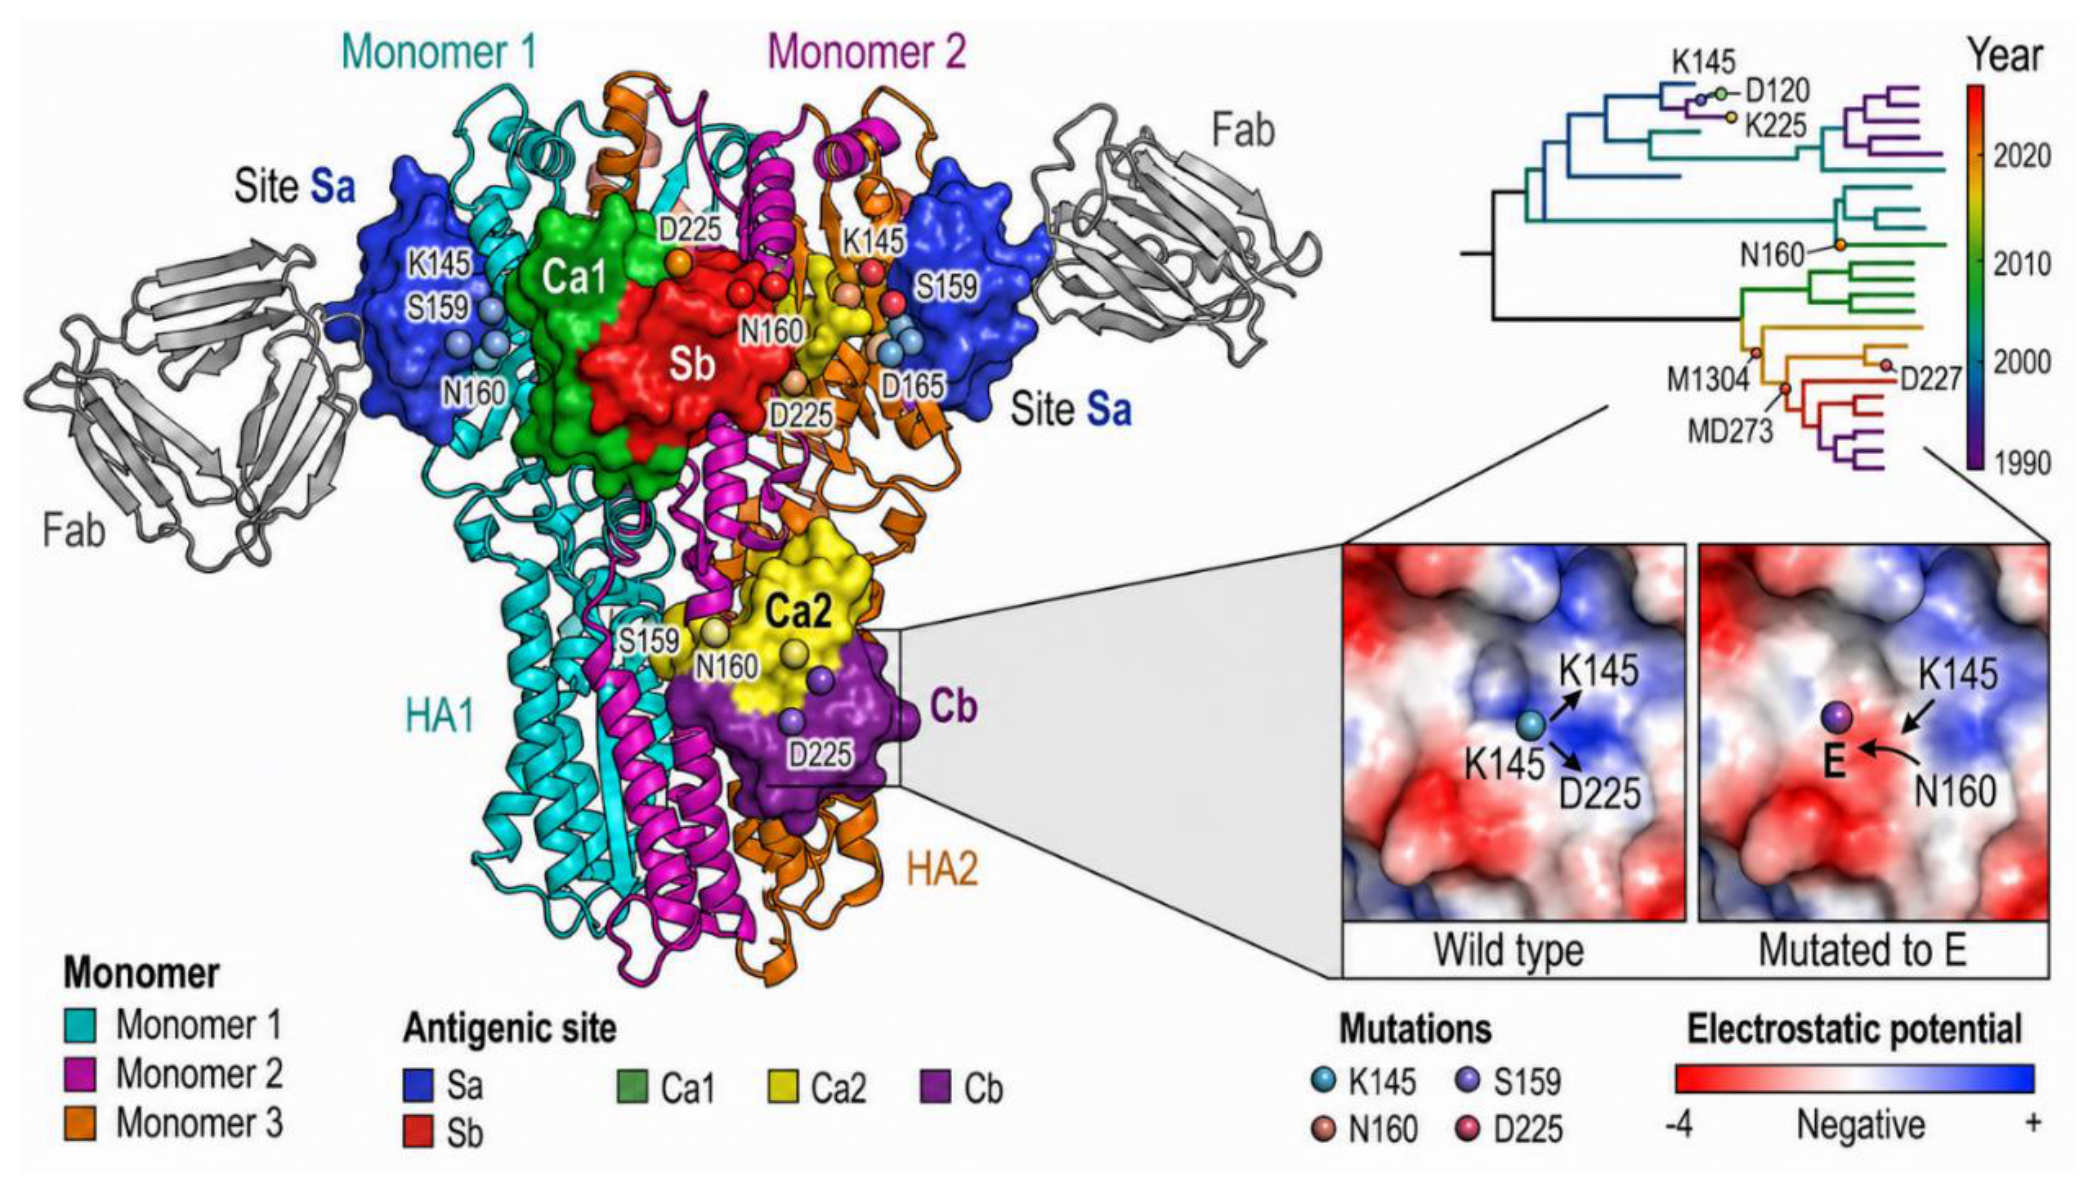
Figure 2.
Structural and antigenic dynamics of the influenza hemagglutinin (HA) glycoprotein. The illustration highlights: (1) the HA trimer and its three constituent monomers; (2) the major antigenic sites Sa, Sb, Ca1, Ca2, and Cb, together with bound Fab fragments; (3) a time-scaled phylogenetic view of selected substitutions; and (4) an illustrative comparison of local electrostatic potential before and after an amino-acid substitution. These elements show how sequence change may be interpreted in structural and evolutionary context; the illustration does not imply that structural change alone establishes immune escape.
Figure 2.
Structural and antigenic dynamics of the influenza hemagglutinin (HA) glycoprotein. The illustration highlights: (1) the HA trimer and its three constituent monomers; (2) the major antigenic sites Sa, Sb, Ca1, Ca2, and Cb, together with bound Fab fragments; (3) a time-scaled phylogenetic view of selected substitutions; and (4) an illustrative comparison of local electrostatic potential before and after an amino-acid substitution. These elements show how sequence change may be interpreted in structural and evolutionary context; the illustration does not imply that structural change alone establishes immune escape.
2.5. Fitness Trade-offs and Compensatory Mutations
The relationship among antigenic escape, host immunity, and viral fitness is not uniformly advantageous to the virus. An escape-associated substitution may carry costs in replication, stability, receptor binding, or transmissibility; compensatory changes may partly restore those functions. Forecasts of lineage success should therefore consider epistasis, genetic background, and ecological competition rather than treating individual substitutions as independent predictors [2,7].
Cryo-electron microscopy and X-ray crystallography have supplied increasingly detailed structures of influenza proteins and antibody complexes, strengthening the empirical basis for interpretations that once relied mainly on homology. When combined with serology, evolutionary analysis, and functional assays, these data can improve the calibration of antigenic-prediction models and inform the design of more broadly protective vaccines [13].
3.0. Integration Of Genomic And Epidemiological Signals: Merging Sequence Data, Case Data, And Mobility Patterns
Genomic sequences describe viral genotype, whereas case counts, hospitalization data, serology, and mobility indicators describe different consequences or contexts of transmission. No single stream is sufficient. A rising clade frequency without a corresponding disease signal may reflect sampling intensity, regional expansion, or limited clinical effect; conversely, an increase in influenza-like illness (ILI) without genomic context cannot distinguish viral evolution from changes in behavior, testing, or co-circulating pathogens. Integrated models may detect informative combinations of signals that would be less apparent when each stream is interpreted separately.
3.1. Genomic Sequencing: Molecular Fingerprints of Viral Evolution
Genomic sequencing provides a molecular record of influenza variation, revealing substitutions, reassortment, and phylogenetic relationships. These data support tracking of emerging lineages, investigation of resistance-associated markers, and estimation of evolutionary rates. Their epidemiological interpretation nevertheless depends on population immunity, human behavior, environmental conditions, and the representativeness of sampling. The early 2009 H1N1 experience illustrates both the speed and the uncertainty with which genomic and epidemiological evidence must be interpreted during emergence [15].
3.2. Epidemiological Data: Real-World Evidence of Disease Burden
Epidemiological data—including case reports, hospitalization rates, mortality indicators, and laboratory positivity—describe influenza activity and burden. When linked carefully to genomic data, they can be used to test whether changes in lineage frequency coincide with altered transmission, geography, or clinical severity. Such associations require adjustment for sampling, age, immunity, healthcare access, and reporting practices; a temporal coincidence between a clade and severe cases does not by itself demonstrate increased virulence [16].
3.3. Phylodynamic Analysis: Reconstructing Transmission Histories
Joint analysis of sequences, sampling times, locations, and case data supports phylodynamic inference about viral population history and transmission. Depending on model assumptions and data density, these methods can estimate evolutionary rates, changes in effective population size, spatial movement, and epidemiological quantities such as the effective reproduction number. They can also suggest cryptic transmission or source-sink relationships, although inferred transmission histories remain probabilistic rather than directly observed [17].
3.4. Mobility Patterns: Understanding Geographic Spread
Mobility data derived from air-travel records, aggregated telecommunications data, commuting patterns, or other movement proxies can inform models of geographic spread. Their inclusion may improve early-stage spatial forecasts when movement is a major driver and when the mobility measure corresponds to the population and timescale being modeled. Analyses of pandemic containment and network-driven contagion demonstrate the value of explicitly representing connectivity, while also showing that movement data alone do not determine transmission [18,19].
3.5. Methodological Challenges in Data Integration
Integrating genomic, epidemiological, mobility, and environmental data presents substantial methodological challenges. Streams differ in temporal and spatial resolution, completeness, sampling design, access rules, and revision schedules. A sequence may be linked to a city and collection date, while case data are aggregated by week and mobility data by region. Robust integration therefore requires explicit harmonization, uncertainty propagation, provenance tracking, and sensitivity analyses rather than simple juxtaposition [17].
3.6. Platforms Facilitating Integrated Analysis
Several international systems provide complementary foundations for integrated analysis. GISRS coordinates virological and epidemiological influenza surveillance through national and collaborating laboratories [20]. GISAID facilitates the sharing of influenza genomic data under defined access, attribution, and use conditions [6]. Nextstrain supplies open-source analytical and visualization workflows that can combine genomic data with associated metadata for near-real-time evolutionary interpretation [21]. These systems are complementary, but they do not constitute a single fully synchronized data-fusion platform.
3.7. Toward Open-Source Epidemiological Intelligence (OSEI)
Multi-source digital surveillance has a documented history in infectious-disease intelligence. HealthMap and related event-based systems showed that web reports, official notices, and human curation could complement formal surveillance and sometimes surface signals before conventional reporting pathways were complete [22]. That precedent motivates, but does not establish, the value of adding influenza genomic, clinical, mobility, wastewater, and environmental streams to a common analytic framework.
The relevant streams already exist in different systems: GISAID supports influenza sequence sharing; WHO platforms provide epidemiological summaries; mobility providers describe population movement; and wastewater surveillance has shown, for other respiratory viruses, that community-level RNA trends can precede or complement some clinical indicators [6,20,23,24]. In practice, these streams are updated on different schedules, at different geographic scales, and under different access conditions. This asynchrony may delay cross-stream comparison, but the magnitude of that delay and the benefit of concurrent analysis have not yet been established for an operational influenza platform.
We propose that concurrent correlation of genomic, epidemiological, mobility, wastewater, and environmental signals could reduce surveillance-to-alert latency. Prospective implementation and validation would be required to determine its operational benefit. Barriers are likely to include governance, interoperability, data-use agreements, engineering capacity, missing metadata, and the need for human review—not governance or computation alone. HealthMap offers a precedent for combining automated collection with expert curation [22]; extending that principle to structured influenza data would require new agreements, common schemas, predefined alert rules, and evaluation against existing surveillance practice.
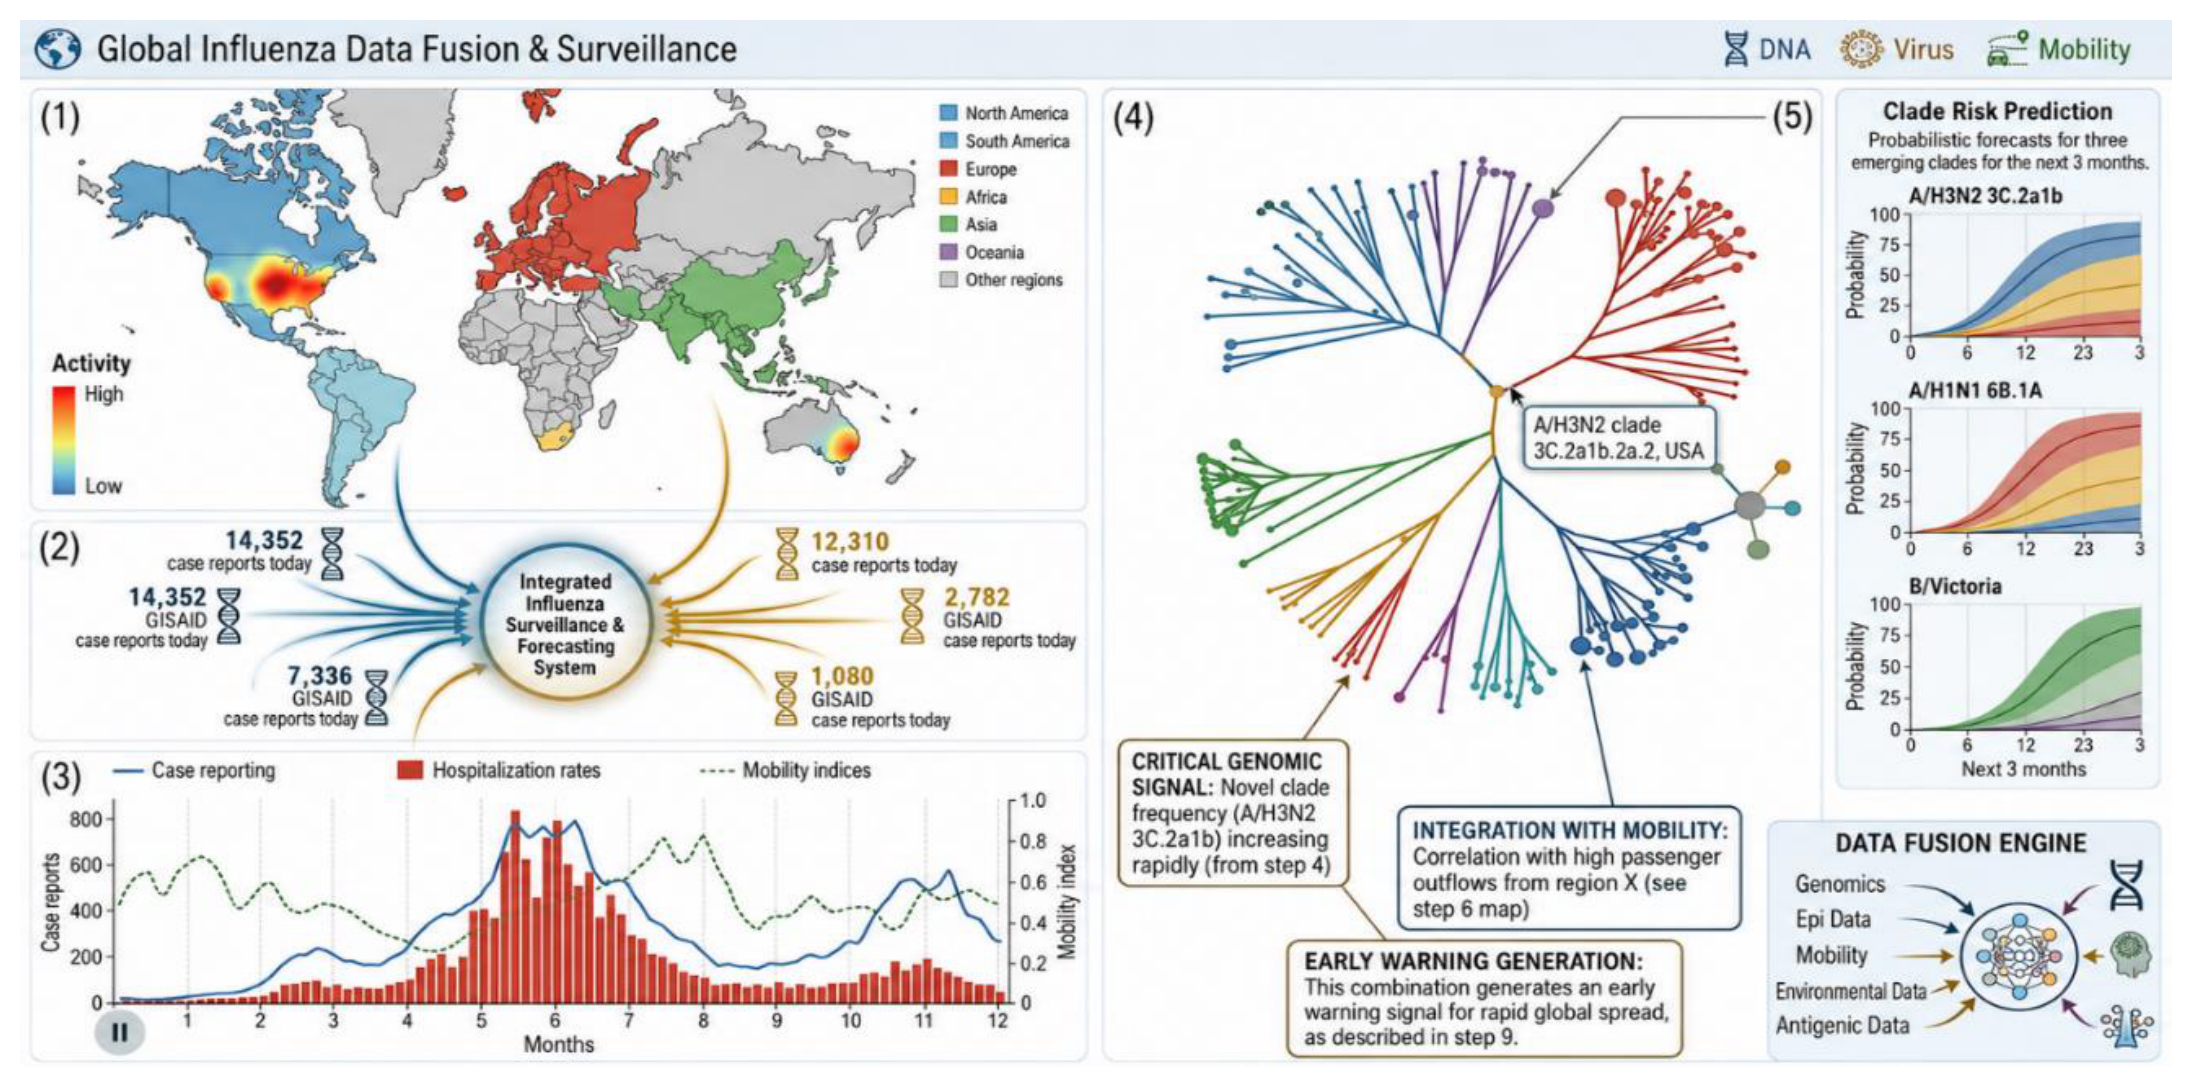
Figure 3.
Open-Source Epidemiological Intelligence (OSEI) architecture for real-time risk assessment. The conceptual dashboard contains: (1) a geographic view of influenza activity; (2) regional case-report and sequence-submission summaries; (3) aligned time series of case reporting, hospitalization, and mobility indicators; (4) a phylogenetic view used to identify a candidate genomic signal and examine its relationship to mobility; and (5) probabilistic clade-risk projections. The unnumbered data-fusion engine represents the proposed integration of genomic, epidemiological, mobility, environmental, and antigenic inputs. The display is illustrative: risk probabilities and alert timing would require prospective validation before operational use.
Figure 3.
Open-Source Epidemiological Intelligence (OSEI) architecture for real-time risk assessment. The conceptual dashboard contains: (1) a geographic view of influenza activity; (2) regional case-report and sequence-submission summaries; (3) aligned time series of case reporting, hospitalization, and mobility indicators; (4) a phylogenetic view used to identify a candidate genomic signal and examine its relationship to mobility; and (5) probabilistic clade-risk projections. The unnumbered data-fusion engine represents the proposed integration of genomic, epidemiological, mobility, environmental, and antigenic inputs. The display is illustrative: risk probabilities and alert timing would require prospective validation before operational use.
3.8. Public Health Decision-Making Applications
Integrated signals may inform vaccine distribution, antiviral planning, laboratory prioritization, hospital preparedness, and targeted communication. For example, a newly expanding antigenic lineage accompanied by rising case activity and outward mobility could justify intensified sampling or formal risk review. It should not automatically trigger a major intervention: action thresholds must account for uncertainty, data quality, feasibility, and the harms and benefits of acting early [20,21,22,23,24].
Sustained cross-stream integration is therefore an important feature of an early-warning system, but it is not sufficient by itself. The operational test is whether discordant or convergent signals are reproducible, calibrated, and delivered in time to alter a defined decision. A clade rising faster than expected, or geographic spread preceding local ILI reporting, may provide useful lead time; it may also reflect sampling bias or reporting delay. Both possibilities should be represented in the alert.
4.0. Computational Forecasting Frameworks: Demographic, Stochastic, And Selective Pressure Models
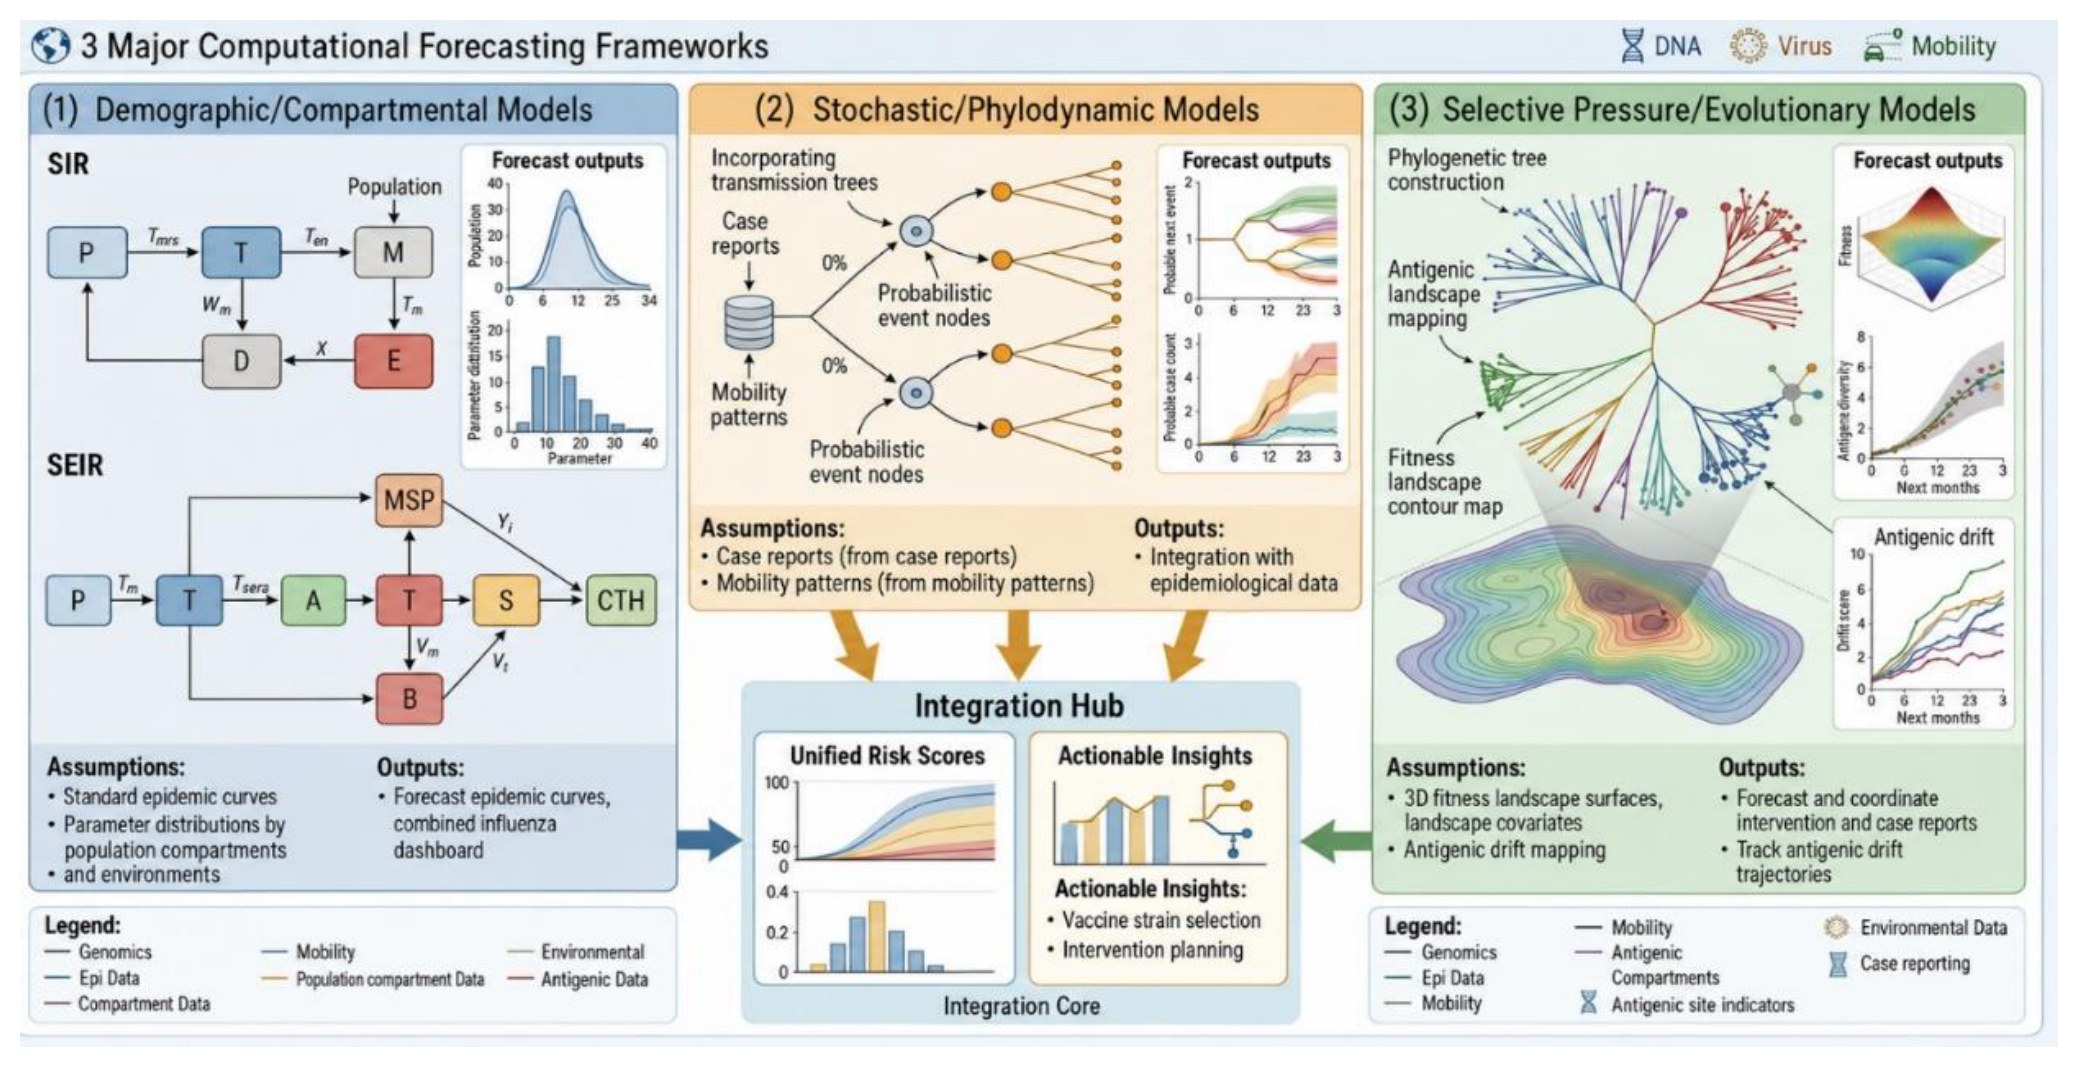
Three modeling families address different forecasting questions in influenza: demographic models that track population-level transmission dynamics, stochastic models that represent randomness in viral evolution and spread, and selective pressure models that focus on immune-driven genomic change. Each carries distinct data requirements, parameter identifiability constraints, and interpretive limits that determine its fitness for a given surveillance or scenario-analysis task.
4.1. Demographic Models
Demographic models, often based on susceptible-infectious-recovered (SIR) or susceptible-exposed-infectious-recovered (SEIR) structures, represent population-level infection, recovery, and immunity. They can incorporate age, space, contact patterns, vaccination, and changing susceptibility. For influenza, their principal value lies in explaining transmission mechanisms, projecting epidemic curves under stated assumptions, and comparing intervention scenarios rather than guaranteeing the most accurate short-term point forecast [25].
Extensions can represent multiple strains, partial cross-immunity, waning protection, and competition among antigenic variants. Such models help examine how evolutionary change may alter the susceptible population and, in turn, outbreak magnitude. Their outputs are sensitive to poorly observed quantities—including strain-specific immunity and mixing patterns—so scenario ranges are generally more defensible than a single projected trajectory [2,25].
4.2. Hybrid Time-Series Approaches: TSIR Models
Influenza forecasting draws on both statistical and mechanistic traditions. Autoregressive and seasonal time-series models learn regularities from historical incidence, including seasonality and autocorrelation. For some short-horizon tasks and data settings, these approaches can outperform less well-calibrated mechanistic models in predictive accuracy [26]. Their limitation is not that they are invariably opaque, but that extrapolation from past patterns provides limited leverage when immunity, surveillance practice, behavior, or viral phenotype changes abruptly.
Mechanistic compartmental models encode explicit assumptions about transmission, latency, recovery, and immunity. Their point forecasts may be less accurate when parameters are weakly identified, yet they remain useful for testing biological hypotheses and exploring counterfactual interventions. Statistical and mechanistic approaches should therefore be compared on the purpose of the analysis—prediction, explanation, or scenario evaluation—rather than placed in a universal performance hierarchy [25].
Time-Series SIR (TSIR) models bridge these traditions by embedding susceptible-infectious-recovered structure within a regression framework fitted to surveillance time series. Finkenstädt and Grenfell established the approach for childhood infections [27], and subsequent work developed related TSIR formulations for estimating transmission from reported cases [28]. The models retain mechanistic interpretation while accommodating observation noise and seasonal variation.
Influenza creates additional difficulties for TSIR-style susceptible reconstruction because immunity is incomplete, strain dependent, and repeatedly modified by vaccination, infection, and antigenic drift. Multi-strain or cross-immunity extensions can explore these mechanisms, but the resulting susceptible pool is less directly identifiable than for infections that confer long-lasting immunity. TSIR approaches may therefore provide a useful middle ground, provided that immunity assumptions and reporting uncertainty are made explicit [25,29].
4.3. Epidemic versus Endemic Initialization
Although epidemic and endemic models may use similar equations, their initialization differs importantly—especially in assumptions about the fraction and composition of the susceptible population at the start of analysis [15].
For a genuinely novel reassortant with little pre-existing immunity, a model may initialize susceptibility near the total population, while still allowing age-specific or cross-reactive protection. The 2009 H1N1 pandemic showed why that assumption must be revised as serological and epidemiological evidence accumulates: the population is rarely uniform, even at emergence [15].
Seasonal influenza begins from a different immunity landscape. Prior infection, vaccination, age, exposure history, waning protection, and antigenic drift produce heterogeneous susceptibility. Endemic-season models therefore need to represent pre-existing and strain-specific immunity using serology, historical attack rates, vaccination records, or carefully justified proxies [2,16,25].
Applying near-naive initialization to a seasonal setting can overestimate outbreak magnitude; assuming substantial pre-existing protection for a truly novel virus can underestimate early growth. The size and direction of either error depend on the model and data, but explicit initialization assumptions are essential when forecasts span both seasonal circulation and pandemic emergence.
4.4. Stochastic Models
Influenza evolution and transmission contain stochastic components, especially during early spread, rare reassortment, and small transmission chains. Agent-based models, branching processes, and stochastic compartmental models represent this variability and can generate distributions of possible outcomes rather than a single deterministic path. Their additional realism is useful only when uncertainty in inputs and model structure is also reported [25].
Stochastic phylodynamic models combine evolutionary and epidemiological processes to infer population history, transmission patterns, and changes in effective population size. They can be informative during early emergence and zoonotic-risk assessment, but reconstructed trees and parameters depend on sampling density, molecular-clock assumptions, and the correspondence between sampled sequences and the underlying transmission process [17].
4.5. Selective Pressure Models
Selective-pressure models examine how immunity and other evolutionary forces shape influenza genomes. They can identify sites or lineages with evidence of positive selection and estimate relative growth or antigenic advantage. Such signals may help rank candidate lineages for follow-up, but dominance is also influenced by founder effects, migration, epistasis, population immunity, and chance [30].
Phylogenetic and fitness-based models use tree shape, lineage frequency, genetic change, and sometimes antigenic measurements to estimate relative clade growth. Experimental evolutionary models can improve phylogenetic fit [31], while global analyses have linked patterns of seasonal circulation to antigenic drift [16]. These approaches inform vaccine-strain assessment by estimating plausible lineage trajectories, not by deterministically identifying the next dominant strain.
Complementary antigenic-prediction models combine HA sequence, structural information, and serological assays to estimate antigenic distance or classify candidate variants. Machine-learning methods can capture nonlinear relationships that fixed substitution rules miss, but performance depends strongly on the strain distribution and assay data used for training [32].
4.6. Data Quality as a Foundational Constraint
Data quality is an important determinant of influenza-forecast reliability, not a background assumption. Reporting delay, uneven geographic sampling, missing metadata, assay heterogeneity, revisions to surveillance data, and changes in healthcare-seeking behavior can all affect estimates and model rankings [33].
Influenza benefits from decades of surveillance and from comparatively well-studied quantities such as generation intervals, age-specific attack patterns, and seasonal timing [34,35,36,37]. Even so, surveillance maturity is uneven. Case definitions, laboratory confirmation, specimen collection, healthcare access, and reporting completeness differ across jurisdictions and seasons, and historical data may not represent a newly emerging lineage.
During an unusual season or the emergence of a novel strain, the earliest data are especially vulnerable to selection bias, under-ascertainment, right truncation, delayed reporting, and repeated revision. These errors can propagate into incidence estimates, reproduction-number calculations, and forecasts. The appropriate response is not to assume that early data are unusable, but to model the observation process, perform sensitivity analyses, and update conclusions as more representative information becomes available [33,38].
Data maturity therefore matters. Frameworks developed for well-observed seasonal influenza may be transferred to pandemic-risk settings only with explicit recalibration. Limitations should be reported alongside the forecast, and plausible bias ranges should be explored before outputs are used to support resource allocation or public communication.
4.7. Uncertainty in Forecasting
All influenza forecasts are uncertain because viral evolution, transmission, observation, behavior, and intervention are only partially known. Quantifying that uncertainty is as important as estimating the central trajectory. A precise-looking point forecast can be misleading when it does not communicate plausible alternatives or the conditions under which the estimate would change.
Probabilistic forecasts summarize a range of outcomes through ensembles, Monte Carlo simulation, Bayesian posterior distributions, or other methods. Prediction intervals and calibrated probability distributions allow decision-makers to compare risks rather than interpret a single number as certain. Multi-model influenza ensembles have generally provided more stable performance than reliance on one model, although ensemble skill still varies by target, location, and season [39].
Evaluation should therefore examine forecast skill, calibration, interval coverage, timeliness, robustness to data revisions, and decision relevance. Prospective comparison against observations is particularly important because retrospective fit can overstate performance when model selection and tuning use information unavailable at the forecast date [33,38].
Figure 4.
Comparative paradigms in computational forecasting models. The schematic compares: (1) demographic or compartmental models, represented by SIR and SEIR flows and epidemic-curve outputs; (2) stochastic or phylodynamic models, represented by probabilistic event trees and forecast distributions; and (3) selective-pressure or evolutionary models, represented by phylogenetic, antigenic, and fitness-landscape analyses. The central integration hub illustrates how outputs may be combined into risk scores and decision-support summaries. These model families answer different questions and carry different assumptions; their integration does not remove uncertainty.
Figure 4.
Comparative paradigms in computational forecasting models. The schematic compares: (1) demographic or compartmental models, represented by SIR and SEIR flows and epidemic-curve outputs; (2) stochastic or phylodynamic models, represented by probabilistic event trees and forecast distributions; and (3) selective-pressure or evolutionary models, represented by phylogenetic, antigenic, and fitness-landscape analyses. The central integration hub illustrates how outputs may be combined into risk scores and decision-support summaries. These model families answer different questions and carry different assumptions; their integration does not remove uncertainty.
5.0. Machine Learning And Deep Models: From Sequence-Based Gnns And Cnns To Hybrid Antigenic Predictors
The expansion of influenza sequence, serological, and epidemiological datasets—together with accessible high-performance computing—has made machine learning (ML) and deep learning (DL) increasingly practical for antigenic prediction and disease forecasting. These approaches can represent nonlinear relationships in high-dimensional data, but their value depends on out-of-sample validation, interpretable outputs, and training data that reflect the settings in which the model will be used.
5.1. Sequence-Based Models: GNNs and CNNs
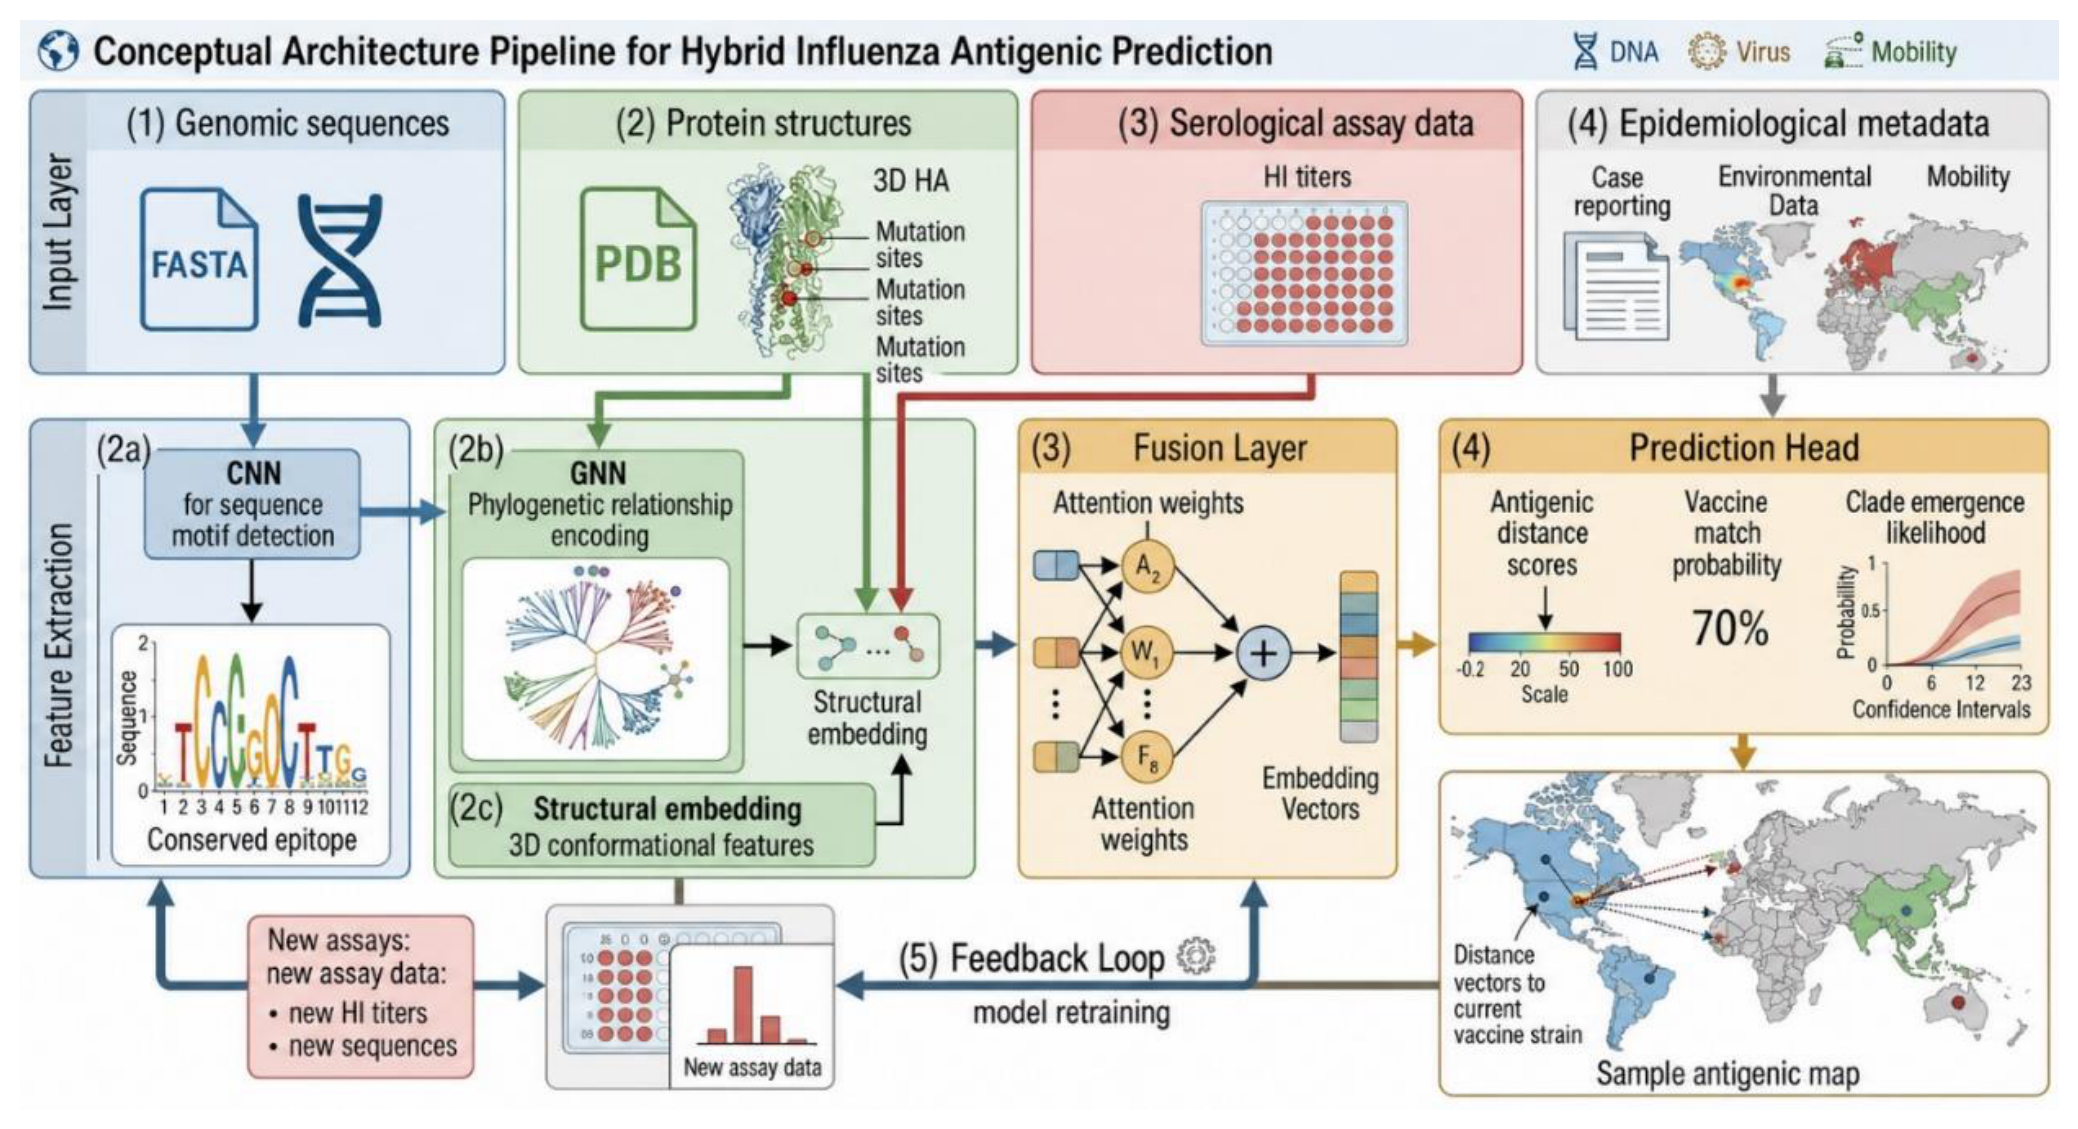
Convolutional neural networks (CNNs) can treat aligned nucleotide or amino-acid sequences as one-dimensional signals and learn local or hierarchical features without manually specifying every motif. Influenza studies have used CNN-based models to estimate H3N2 antigenicity and support vaccine-candidate ranking, with retrospective performance that compares favorably with several conventional approaches [40,41]. Such results do not establish prospective performance against a novel reassortant or a lineage outside the training distribution.
Graph-based learning is relevant when strains, locations, or observations are connected through phylogeny, geography, mobility, or assay relationships. In influenza research, graph-guided multi-task learning has been used to identify H3N2 antigenic variants [42], and graph neural networks have been applied to influenza-like-illness nowcasting across connected locations [43]. Direct GNN prediction of influenza antigenic phenotype remains less established than sequence-based CNN and tree-informed approaches; the specific graph, edge definition, and validation task should therefore be stated rather than invoking GNNs generically.
5.2. Hybrid Antigenic Predictors
Purely sequence-based models may not fully represent the context-dependent relationship between substitution and antigenic phenotype. Hybrid predictors combine sequence with serological measurements, protein structure, phylogeny, sampling time, or epidemiological metadata. Their potential advantage comes from complementary evidence, but additional inputs also introduce missingness, assay effects, and opportunities for data leakage.
Antigenic maps derived from hemagglutination-inhibition or related assays provide a phenotype space against which genetic models can be trained or evaluated. Integrating genotype and phenotype has improved longer-term forecasts of H3N2 evolution and can help place new strains relative to vaccine candidates [14,44]. The resulting positions are estimates conditioned on assay panels and should be interpreted with corresponding uncertainty.
Recurrent networks, attention mechanisms, and transformer-based approaches are being explored for temporal and sequence-based antigenic prediction. Recent machine-learning work has shown that seasonally updated models can learn nonlinear genotype-antigen relationships from prior seasons [45]. Whether those gains persist prospectively during major antigenic discontinuities remains an open empirical question.
5.3. Challenges and Future Directions
Three constraints are especially important. First, interpretability: a high-performing neural model may assign an antigenic-distance score without explaining which biological mechanism produced it. Attribution methods can identify influential features, but they do not automatically establish causality or mechanistic validity [46].
Second, generalizability: a model trained predominantly on seasonal H3N2 may generalize poorly when confronted with a reassortant, an uncommon subtype, a new assay panel, or a population outside the training distribution. Evolution-inspired augmentation and related strategies may improve robustness, but prospective influenza-specific validation remains necessary [47].
Third, data coverage: genomic sequences are far more abundant than standardized antigenic assays, complete clinical metadata, or observations from many low- and middle-income settings. Model architecture cannot compensate fully for systematic gaps in who, where, and when the training data represent.
A major need is therefore not simply larger models, but models whose uncertainty, failure modes, and influential features can be examined by virologists and public-health practitioners. Interpretability should support challenge and experimental follow-up rather than serve as a decorative explanation added after prediction.
Figure 5.
Hybrid machine-learning pipeline for sequence-based antigenic prediction. The conceptual architecture shows: (1) genomic-sequence input; (2) protein-structure input, with feature-extraction branches labelled (2a) CNN sequence-motif detection, (2b) graph-based phylogenetic encoding, and (2c) structural embedding; (3) serological-assay input and the central fusion layer; (4) epidemiological-metadata input and the prediction head for antigenic distance, vaccine-match probability, and clade-emergence likelihood; and (5) a feedback loop for model updating when new assays or sequences become available. The diagram illustrates a possible architecture rather than a prospectively validated operational system. CNN, convolutional neural network; GNN, graph neural network; PDB, Protein Data Bank; HI, hemagglutination inhibition.
Figure 5.
Hybrid machine-learning pipeline for sequence-based antigenic prediction. The conceptual architecture shows: (1) genomic-sequence input; (2) protein-structure input, with feature-extraction branches labelled (2a) CNN sequence-motif detection, (2b) graph-based phylogenetic encoding, and (2c) structural embedding; (3) serological-assay input and the central fusion layer; (4) epidemiological-metadata input and the prediction head for antigenic distance, vaccine-match probability, and clade-emergence likelihood; and (5) a feedback loop for model updating when new assays or sequences become available. The diagram illustrates a possible architecture rather than a prospectively validated operational system. CNN, convolutional neural network; GNN, graph neural network; PDB, Protein Data Bank; HI, hemagglutination inhibition.
6.0. Real-Time Forecasting Pipelines: Gisrs, Gisaid, Nextstrain, And Automation
Influenza surveillance must generate interpretable evidence within the decision windows for vaccine-strain selection and outbreak response. GISRS, GISAID, and Nextstrain address complementary parts of that process: coordinated surveillance and characterization, governed sequence sharing, and open-source evolutionary analysis and visualization. Together they support contemporary genomic surveillance, but their operation should not be described as one seamless or universally automated pipeline.
6.1. Global Influenza Surveillance and Response System (GISRS)
The WHO Global Influenza Surveillance and Response System (GISRS) links national influenza centers, WHO collaborating centers, essential regulatory laboratories, and other partner institutions. It coordinates collection, virological and antigenic characterization, epidemiological reporting, risk assessment, and the evidence base used in vaccine-composition consultations [20]. Coverage and analytical capacity vary among participating settings.
Next-generation sequencing has been incorporated progressively into influenza surveillance, increasing the resolution available for clade assignment, reassortment analysis, and resistance monitoring [48]. The speed advantage depends on specimen flow, sequencing turnaround, metadata completeness, quality control, and the capacity to interpret sequence changes alongside phenotypic evidence.
6.2. GISAID (Global Initiative on Sharing All Influenza Data)
GISAID provides a global mechanism for sharing influenza genomic data and associated metadata under an access agreement that emphasizes contributor recognition and defined conditions of use. Since its launch, it has become a central source for influenza sequence analysis and rapid international collaboration [6]. It is more accurate to describe this as facilitated, governed access than as unrestricted open access.
Collection date, location, host, and other metadata can support phylogenetic and spatial analysis, although completeness and granularity vary. Rapid submission can shorten the time to lineage recognition, but the interval from submission to actionable interpretation is not fixed and depends on curation, sampling representativeness, analytical workflows, and confirmatory evidence.
6.3. Nextstrain
Nextstrain is an open-source framework for reproducible phylogenetic analysis and interactive visualization of pathogen evolution. Influenza builds can combine appropriately accessed genomic data with metadata to display lineage relationships, geographic spread, and mutations over time [21]. These displays make complex analyses more accessible, while the reliability of any interpretation remains conditional on the underlying data and model assumptions.
Automated or regularly updated workflows can place new sequences into an evolving phylogenetic context and highlight frequency changes or mutations for review. Such visualization can support surveillance and vaccine-strain discussions, but it does not independently establish antigenic novelty, transmissibility, or clinical severity.
6.4. Automation of Genome-to-Decision Workflows
Across well-resourced implementations, parts of the genome-to-decision pathway can be automated: sequence quality control, alignment, phylogenetic placement, frequency estimation, and dashboard publication. Forecasting models may then combine these outputs with antigenic and epidemiological evidence. Formal vaccine recommendations, however, remain expert deliberations that weigh laboratory, epidemiological, manufacturing, and regulatory considerations; they are not direct outputs of an algorithm.
Automation can reduce some manual handoffs and shorten analytical turnaround, but the sequence-to-alert interval varies widely across laboratories and countries. Further improvement is likely to depend on both technical factors—interoperable formats, reliable pipelines, compute capacity—and organizational factors such as sharing timelines, staffing, governance, quality assurance, and routes for escalating uncertain signals.
7.0. Public Health Feedback Loops: Vaccine Strain Selection And Adaptive Risk Response
Forecasting outputs acquire operational value when they are timely, calibrated, interpretable, and connected to a defined decision. The two endpoints considered here—vaccine-strain selection and adaptive outbreak response—also explain why the intervention and reproduction-number sections that follow are within scope: evolutionary signals must ultimately be translated into assumptions about susceptibility, transmission, severity, and the likely effect of available actions.
7.1. Informing Vaccine Strain Selection
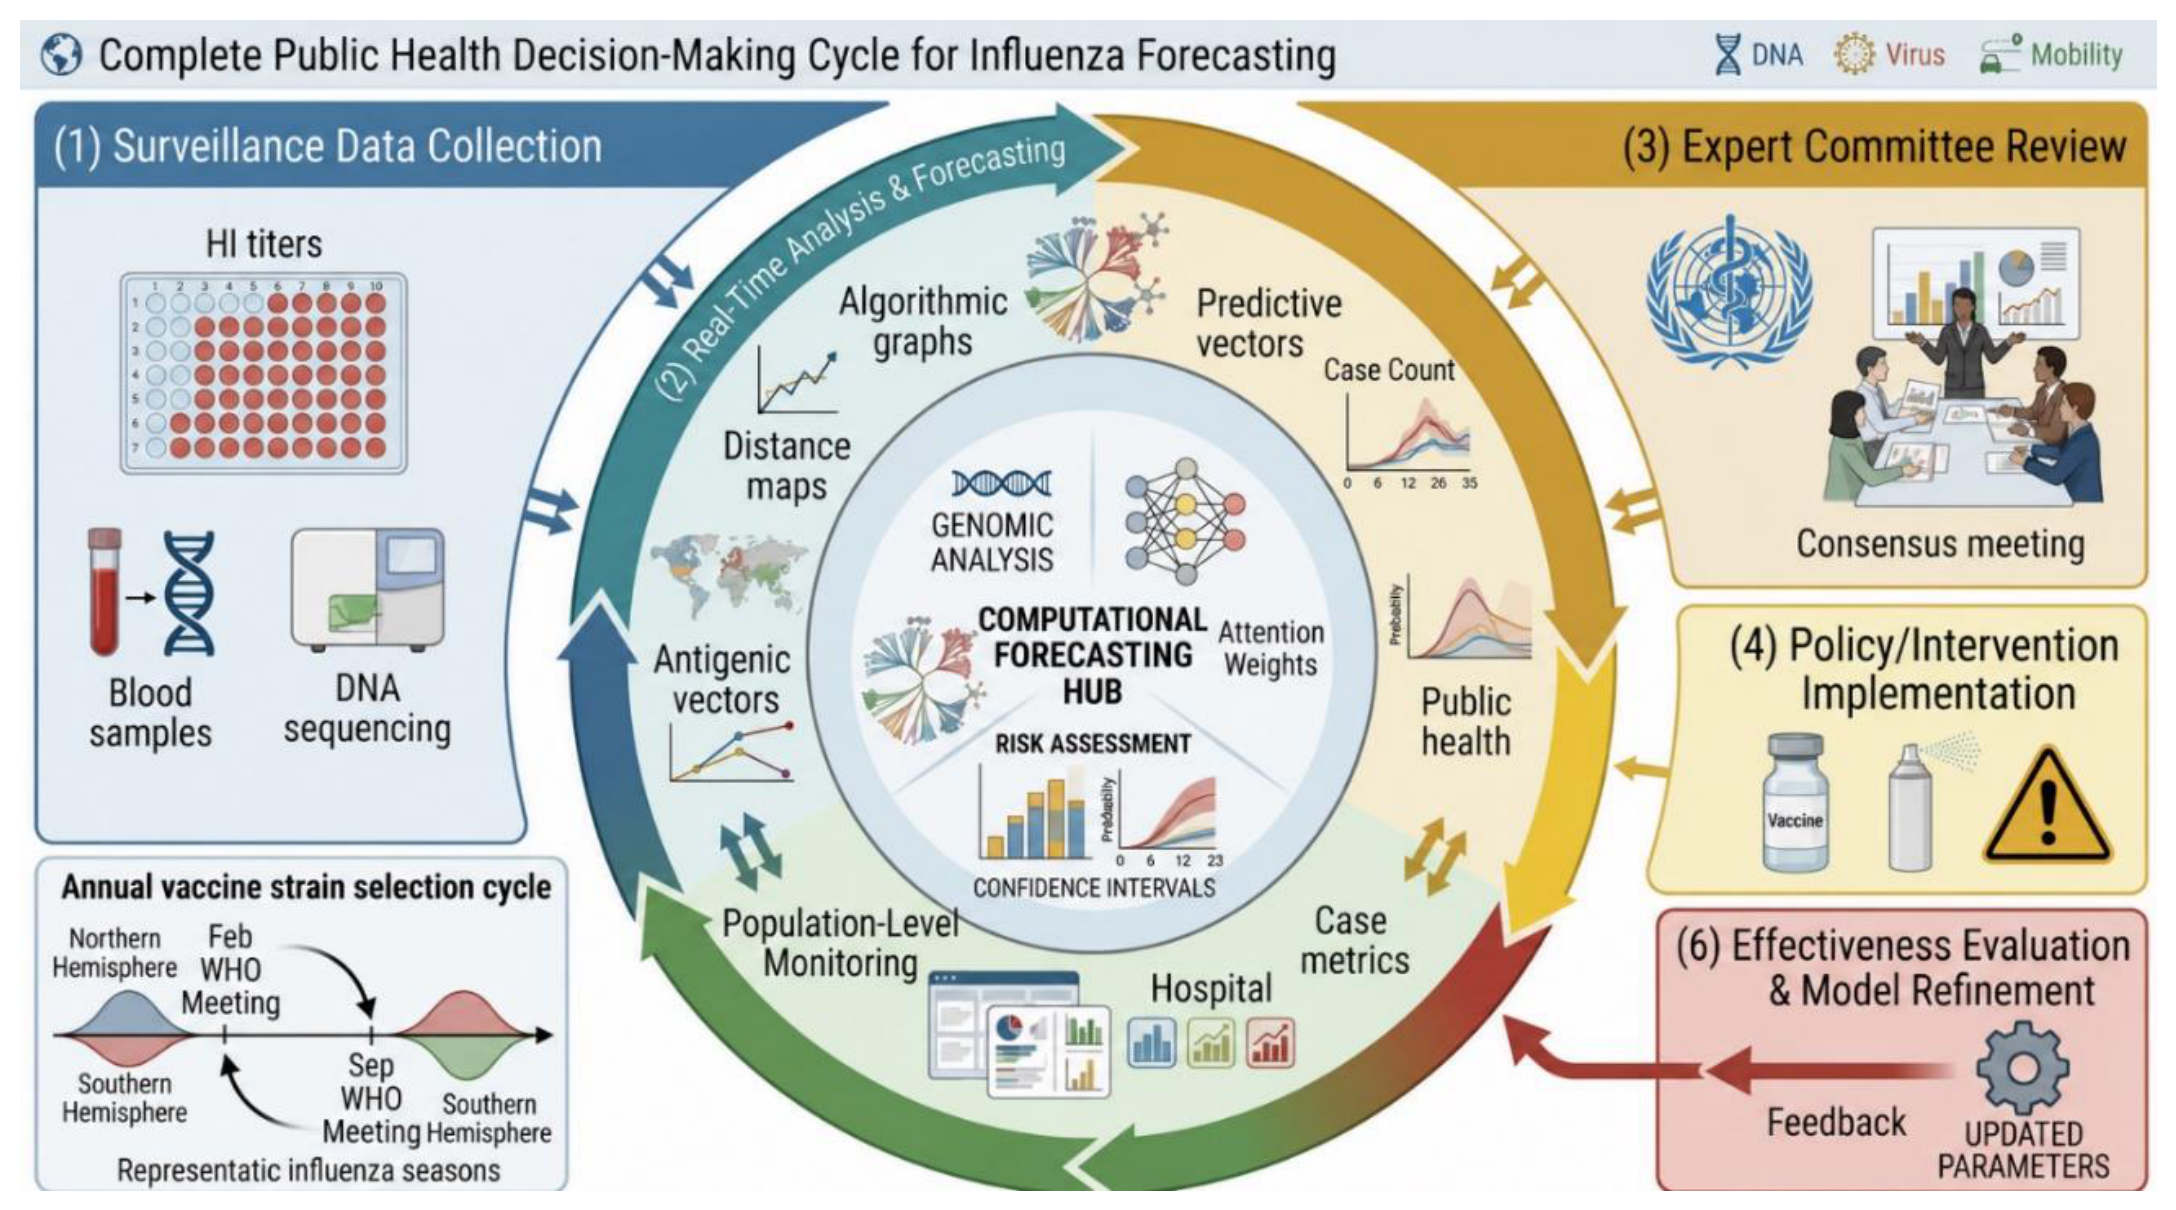
Vaccine-strain selection is one of the most consequential applications of influenza forecasting. WHO convenes vaccine-composition consultations for the Northern and Southern Hemispheres, drawing on genetic, antigenic, epidemiological, and other evidence to recommend candidate strains for upcoming seasons [20]. The process is recurrent because circulating viruses and the evidence base continue to change.
Computational models can estimate the relative likelihood that particular lineages will expand, compare genetic and antigenic distances, and identify substitutions or clades requiring closer laboratory review [49]. Their outputs are considered alongside serology, ferret and human data where available, lineage prevalence, geographic spread, and manufacturing feasibility. Associations between HA evolution and vaccine effectiveness further illustrate why sequence forecasts must be connected to phenotype and population immunity [16,50].
The cycle begins with continuous surveillance through GISRS and sequence-sharing systems, followed by genetic and antigenic analysis and expert review. Recommended strains then enter manufacturing and regulatory processes, and subsequent surveillance and effectiveness studies provide evidence for later cycles [20,50]. Feedback can improve model calibration and reveal recurrent errors, but it does not guarantee progressively closer agreement between a forecast and the final vaccine composition.
The objective is to reduce antigenic mismatch while meeting manufacturing timelines. Because strain recommendations precede the target season by several months, even a well-calibrated forecast cannot eliminate the possibility that circulation or antigenicity will change after selection.
7.2. Adaptive Risk Response
Beyond vaccine selection, forecasts can inform near-term risk review. Evidence of an antigenically unusual or rapidly expanding lineage may support earlier laboratory investigation, antiviral planning, hospital preparedness, or communication. The appropriate response depends on estimated severity, transmission, confidence, resource constraints, and the consequences of false alarm; detection alone should not be equated with an automatic policy trigger.
When a severe season is considered plausible, scenario outputs can help planners compare antiviral stock levels, surge-capacity needs, vaccination timing, and non-pharmaceutical options. These are decision-support uses: actual actions remain contingent on local epidemiology, feasibility, equity, and governance.
Across short-term response and longer-term system strengthening, surveillance updates the risk assessment, decisions alter transmission or observation, and later data permit evaluation. That feedback should examine what the model predicted, how uncertainty was communicated, whether the output was used, and whether the decision produced the intended effect.
A forecasting system should therefore be judged on more than retrospective accuracy. Calibration, timeliness, robustness, interpretability, and documented decision utility all matter. Evidence that forecasts changed procurement, vaccination, or preparedness at an appropriate time would demonstrate operational value; it should be assessed prospectively rather than assumed from technical capability alone.
Figure 6.
Public-health feedback loops from genomic forecasting to vaccine-strain selection. The numbered elements are: (1) surveillance data collection, including sequencing and HI assays; (2) real-time analysis and forecasting within the circular analytical workflow; (3) expert-committee review; (4) policy or intervention implementation; and (6) effectiveness evaluation and model refinement. The unnumbered inner ring represents the computational forecasting hub, uncertainty intervals, case metrics, and population-level monitoring. The figure intentionally follows the numbering visible in the graphic; no element labelled (5) is shown. Arrows indicate iterative feedback, not an assumption that each stage is fully automated or that a forecast directly determines policy.
Figure 6.
Public-health feedback loops from genomic forecasting to vaccine-strain selection. The numbered elements are: (1) surveillance data collection, including sequencing and HI assays; (2) real-time analysis and forecasting within the circular analytical workflow; (3) expert-committee review; (4) policy or intervention implementation; and (6) effectiveness evaluation and model refinement. The unnumbered inner ring represents the computational forecasting hub, uncertainty intervals, case metrics, and population-level monitoring. The figure intentionally follows the numbering visible in the graphic; no element labelled (5) is shown. Arrows indicate iterative feedback, not an assumption that each stage is fully automated or that a forecast directly determines policy.
8.0. Enhanced Intervention Modeling Framework
The real-time pipelines in Section 6 and feedback loops in Section 7 require a further translation: an evolutionary or antigenic signal must be converted into assumptions about susceptibility, infectiousness, severity, timing, and the effect of candidate interventions. Intervention models provide that bridge. Adding an intervention rarely reduces to changing one parameter, because each measure acts through a different biological or behavioral pathway and may be adopted unevenly [51,52].
8.1. Vaccination
Vaccination may reduce susceptibility to infection, the probability of symptomatic disease, infectiousness, severe outcomes, or several of these endpoints. A model should distinguish an all-or-none representation from a leaky reduction in per-exposure risk, and it should state how antigenic match modifies protection. Pre-season vaccination and reactive vaccination operate on different timelines; annual updating against an evolving target adds further uncertainty [53,54]. These distinctions determine how an antigenic forecast is translated into projected cases and vaccine demand.
8.2. Isolation and Quarantine
Isolation separates persons with suspected or confirmed infection, whereas quarantine restricts exposed persons who are not yet symptomatic. Models may represent these states explicitly, including delays to detection, adherence, residual household or facility transmission, and the proportion of infections that are never identified. Historical terminology is less important to forecasting than the timing and completeness with which infected or exposed persons leave the community-contact network.
Isolation alone may be insufficient to reduce the effective reproduction number below one when substantial transmission occurs before symptom recognition or from infections that remain undetected. Its modeled effect therefore depends on detection speed, contact tracing, adherence, and the distribution of infectiousness over time [55,56,57].
8.3. Mask Use and Prophylaxis
Masks can reduce source emission and wearer exposure, with effect sizes shaped by mask type, fit, consistency, setting, and study design. A model should therefore specify uptake and effective use rather than assign one universal efficacy. Antiviral prophylaxis acts through a different mechanism by reducing infection or disease risk among treated persons; timing, coverage, resistance, and drug availability must be represented separately [53,58].
8.4. Intervention Redundancy and Auto-Implementation
Two features of real intervention use are often simplified. First, concurrent measures may not be strictly additive because the same persons adopt several behaviors and the mechanisms overlap. Layered-containment models can represent combinations, but independence assumptions may overstate or understate the joint effect [59].
Second, behavior may change before or without a formal directive. Perceived risk, media coverage, and voluntary distancing can alter contact patterns and intervention uptake. If these changes are omitted, a model may attribute too much of a transmission decline to policy alone. Behavioral response should therefore be treated as a time-varying process with uncertainty, not as an automatic or uniform reaction [60].
9.0. The Reproduction Number: Interpretation And Limitations
The reproduction number links evolutionary forecasting to outbreak-risk assessment. A lineage forecast becomes operationally relevant only after its possible effect on transmission is interpreted in a particular immunity and intervention context. R₀ is the expected number of secondary infections generated by a typical infectious individual in a fully susceptible population under specified conditions. Values above one indicate the potential for sustained growth in a deterministic approximation; in a stochastic branching process, chance extinction can still occur. Under simple assumptions, the major-outbreak probability is related to—but not universally equal to—1 minus 1/R₀ [61].
Comparisons of R₀ across diseases or settings require care because the estimate depends on generation intervals, contact structure, population composition, and the model used. Similar R₀ values can correspond to very different epidemic speeds when infectious periods and generation times differ [62]. Published tables should not treat estimates obtained from incompatible assumptions and populations as directly interchangeable [63].
Estimation method also conditions the result. The next-generation-matrix framework provides a systematic approach for compartmental models, but the value obtained reflects choices about compartments, mixing, infectious-period distributions, and heterogeneity [64]. Two well-fitted models can therefore yield different reproduction-number estimates if they encode different mechanisms.
The time-varying effective reproduction number, Rₜ, extends the concept to populations with existing immunity, changing behavior, and active interventions. It can be estimated from epidemic growth and the generation-interval distribution, subject to reporting and delay assumptions [65,66]. In influenza risk assessment, an evolutionary signal combined with a sustained rise in Rₜ may justify closer review; neither signal alone proves increased intrinsic transmissibility. Rₜ is therefore more decision-relevant than R₀ for ongoing seasonal surveillance, but it remains an inferred and revision-prone quantity.
10.0. Future Directions: Transparency, Data-Sharing Ethics, Equitable Access, And The Limits Of Prediction
Progress in computational influenza forecasting has been uneven across methodological, ethical, structural, and epistemological dimensions. Algorithms and data volumes have advanced rapidly, while governance, equitable participation, prospective evaluation, and explicit treatment of predictive limits have received less consistent attention.
10.1. Transparency in Models and Data
As model complexity and public-health consequence increase, assumptions, input data, evaluation procedures, and uncertainty propagation should be examinable by people who did not build the model. Opaque forecasting can weaken reproducibility, accountability, and public trust. Reporting frameworks such as EPIFORGE provide a basis for more complete descriptions of epidemic-forecast studies, though reporting quality alone does not establish model validity [67].
Open-source code and reproducible workflows can improve scrutiny and reuse. Nextstrain illustrates this through open analytical software and shareable visual outputs, while access to underlying datasets may still be governed by the terms of the source repository. Future systems should pair transparent methods with versioned inputs, archived forecast dates, predefined evaluation targets, and clear statements of what the model cannot infer.
10.2. Data-Sharing Ethics and Governance
Combining genomic, clinical, mobility, and environmental data creates ethical and legal questions that sequence-only analyses may not resolve. Even de-identified or aggregated records can reveal information about small populations, locations, or movements. Governance should address proportionality, consent where applicable, access control, benefit sharing, data minimization, and the risk of stigmatizing places or groups.
GISAID’s access-and-attribution model offers one established governance approach for pathogen genomic data [6]. It should not be assumed that the same arrangement is sufficient for patient-level clinical records or telecommunications-derived mobility data. Cross-stream forecasting will require data-specific safeguards, institutional oversight, auditable permissions, and agreements that recognize contributors as well as downstream users.
10.3. Equitable Access to Forecasting Tools and Benefits
Advanced sequencing and forecasting capacity remains concentrated in comparatively well-resourced settings. Many low- and middle-income countries experience substantial respiratory-disease burden while contributing fewer sequences and less standardized metadata to global analyses, reflecting differences in financing, laboratory networks, workforce, and access to reagents and computing [68]. The resulting models may be least certain in settings where decision support is most needed.
Reducing this disparity requires sustained local training, maintainable open-source tools, reliable computing and connectivity, partnerships built around reciprocal capacity and authorship, and long-term surveillance financing. Episodic emergency projects can generate data without establishing the institutions needed to interpret and act on them.
10.4. Practical Considerations for Resource-Limited Settings
In resource-limited settings, missing local data are not merely a larger confidence interval; they may change the meaning of a forecast. Models calibrated in Europe or North America may not transfer directly to populations with different age structures, healthcare access, vaccination coverage, seasonality, and circulating lineages [38]. Transfer should therefore be evaluated rather than presumed.
Existing disease programs can provide useful infrastructure. HIV scale-up supported laboratories, workforce development, logistics, and data systems in many African settings, although effects on wider health systems have varied [69]. Ghana’s reuse of an influenza platform for SARS-CoV-2 genomic surveillance provides a concrete example of adaptable respiratory-pathogen capacity [70]. These precedents support investment in locally governed, multi-pathogen systems; they do not remove the need for influenza-specific sampling, validation, and decision pathways.
10.5. The Limits of Prediction
Influenza forecasting remains subject to irreducible and reducible uncertainty. Mutation, reassortment, transmission bottlenecks, and founder effects introduce stochastic variation. Population immunity is heterogeneous and incompletely measured. Behavior, interventions, and reporting systems change during an epidemic. Zoonotic influenza viruses can also possess phenotypes outside the distribution represented by seasonal human data [71,72].
These constraints clarify rather than negate the purpose of forecasting. Forecasts are conditional probability statements about near-term outcomes, updated as surveillance data accrue. Their contribution may include earlier recognition and structured comparison of risks, but the amount of lead time varies by pathogen, setting, and data flow. Claims of a universal compression from seasons to weeks should therefore be replaced by measured, prospectively evaluated estimates of surveillance-to-alert latency.
11.0. Conclusions
Sequencing at scale, antigenic and structural analysis, machine learning, and multi-stream integration have expanded what influenza forecasting can support. They have also made the limits of inference more visible. Sequence change can be detected rapidly; determining whether it changes antigenicity, transmission, or clinical risk still requires convergent evidence.
Integrated genomic and phylogenetic frameworks support high-resolution tracking of drift and reassortment. Hybrid genotype-phenotype models can improve antigenic estimation, and regularly updated analytical pipelines can shorten portions of the path from sequence generation to interpretation. The degree of improvement is setting dependent and should not be conflated with a fully automated route from sequence submission to policy.
Important challenges remain: stochastic evolution, uneven data quality and geographic coverage, model interpretability, changing behavior, and incomplete prospective validation. The appropriate goal is not perfect prediction. It is calibrated, timely evidence that can be revised and combined with laboratory, epidemiological, ethical, and operational judgment.
Future progress will depend on reproducible workflows, sustainable surveillance capacity, ethical governance for cross-stream data, prospective evaluation, and collaboration among virologists, bioinformaticians, epidemiologists, clinicians, and decision-makers. The OSEI architecture proposed in Section 3.7 is a testable design hypothesis: concurrent correlation may reduce surveillance-to-alert latency, but its value must be demonstrated against current practice before it is presented as an operational advance.
Computational forecasting is most useful when it enables earlier, better-informed decisions without concealing uncertainty. Probabilistic risk assessments can help health systems compare options, plan resources, and update interventions as evidence changes. Extending that benefit requires not only stronger algorithms, but also locally grounded data, interpretable outputs, and forecasting capacity distributed more equitably across the surveillance landscape.
Acknowledgments
The authors thank the global influenza surveillance community and data-sharing initiatives, including GISRS and GISAID, for supporting influenza data sharing and collaborative research.
Author Contributions
A.A.: Conceptualization, Methodology, Writing—Original Draft. A.O.A.: Methodology, Supervision, Writing—Review & Editing. I.A.S.: Domain expertise, Writing—Review & Editing. J.L.: Epidemiological context, Writing—Review & Editing. A.M.S.: Project supervision, Scientific direction, Writing—Review & Editing. All authors read and approved the final manuscript.
Funding
The authors received no specific funding for this work.
Ethics approval
Not applicable. This integrative review synthesizes published literature and authoritative public resources; no human participants, identifiable clinical data, or new dataset analyses were involved.
Consent for publication
Not applicable.
Conflicts of Interest
The authors declare no competing interests.
Data Availability Statement
No new datasets were generated or analysed for this integrative review. The publications and authoritative resources used in the synthesis are cited in the reference list. Where GISAID resources are discussed, access and use remain subject to the GISAID Database Access Agreement. No GISAID sequence-level data are redistributed in this manuscript.
AI Usage Disclosure
Artificial intelligence tools (Microsoft Copilot and Google Gemini) were used to assist with manuscript drafting, language editing, structural organization, and selected conceptual-figure creation. All scientific concepts, interpretations, and conclusions were reviewed by the authors, who retain full responsibility for the accuracy, provenance, and integrity of the manuscript and figures.
References
- Krammer, F.; Smith, G.J.D.; Fouchier, R.A.M.; Peiris, M.; Kedzierska, K.; Doherty, P.C.; et al. Influenza. Nat. Rev. Dis. Prim. 2018, 4(1), 3. [Google Scholar] [CrossRef] [PubMed]
- Ferguson, N.M.; Galvani, A.P.; Bush, R.M. Ecological and immunological determinants of influenza evolution. Nature 2003, 422(6930), 428–433. [Google Scholar] [CrossRef] [PubMed]
- Webster, R.G.; Bean, W.J.; Gorman, O.T.; Chambers, T.M.; Kawaoka, Y. Evolution and ecology of influenza A viruses. Microbiol. Rev. 1992, 56(1), 152–179. [Google Scholar] [CrossRef] [PubMed]
- Iuliano, A.D.; Roguski, K.M.; Chang, H.H.; Muscatello, D.J.; Palekar, R.; Tempia, S.; et al. Estimates of global seasonal influenza-associated respiratory mortality: a modelling study. Lancet 2018, 391(10127), 1285–1300. [Google Scholar] [CrossRef] [PubMed]
- Saunders-Hastings, P.R.; Krewski, D. Reviewing the history of pandemic influenza: understanding patterns of emergence and transmission. Pathogens 2016, 5(4), 66. [Google Scholar] [CrossRef] [PubMed]
- Shu, Y.; McCauley, J. GISAID: Global Initiative on Sharing All Influenza Data—from vision to reality. Euro Surveill. 2017, 22(13), 30494. [Google Scholar] [CrossRef] [PubMed]
- Lässig, M.; Mustonen, V.; Walczak, A.M. Predicting evolution. Nat. Ecol. Evol. 2017, 1(3), 77. [Google Scholar] [CrossRef] [PubMed]
- Smith, G.J.D.; Vijaykrishna, D.; Bahl, J.; Lycett, S.J.; Worobey, M.; Pybus, O.G.; et al. Origins and evolutionary genomics of the 2009 swine-origin H1N1 influenza A epidemic. Nature 2009, 459(7250), 1122–1125. [Google Scholar] [CrossRef] [PubMed]
- Gao, R.; Cao, B.; Hu, Y.; Feng, Z.; Wang, D.; Hu, W.; et al. Human infection with a novel avian-origin influenza A (H7N9) virus. N Engl. J. Med. 2013, 368(20), 1888–1897. [Google Scholar] [CrossRef] [PubMed]
- Caton, A.J.; Brownlee, G.G.; Yewdell, J.W.; Gerhard, W. The antigenic structure of the influenza virus A/PR/8/34 hemagglutinin (H1 subtype). Cell 1982, 31 2 Pt 1, 417–427. [Google Scholar] [CrossRef] [PubMed]
- Smith, D.J.; Lapedes, A.S.; de Jong, J.C.; Bestebroer, T.M.; Rimmelzwaan, G.F.; Osterhaus, A.D.M.E.; et al. Mapping the antigenic and genetic evolution of influenza virus. Science 2004, 305(5682), 371–376. [Google Scholar] [CrossRef] [PubMed]
- Rosu, M.E.; Westgeest, K.B.; de Graaf, M.; Hauser, B.M.; Tureli, S.; James, S.; Sinartio, F.F.; Bestebroer, T.M.; Lexmond, P.; Pronk, M.R.; van der Vliet, S.; Skepner, E.; Spronken, M.I.J.; Mühlemann, B.; Richard, M.; Jones, T.C.; Smith, D.J.; Herfst, S.; Fouchier, R.A.M. Molecular basis of 60 years of antigenic evolution of human influenza A(H3N2) virus neuraminidase. Cell Host Microbe 2026, 34(1), 103–115.e9. [Google Scholar] [CrossRef] [PubMed] [PubMed Central]
- Wu, N.C.; Wilson, I.A. Structural biology of influenza hemagglutinin: an amaranthine adventure. Viruses 2020, 12(9), 1053. [Google Scholar] [CrossRef] [PubMed]
- Bedford, T.; Suchard, M.A.; Lemey, P.; Dudas, G.; Gregory, V.; Hay, A.J.; et al. Integrating influenza antigenic dynamics with molecular evolution. eLife 2014, 3, e01914. [Google Scholar] [CrossRef] [PubMed]
- Fraser, C.; Donnelly, C.A.; Cauchemez, S.; Hanage, W.P.; Van Kerkhove, M.D.; Hollingsworth, T.D.; et al. Pandemic potential of a strain of influenza A (H1N1): early findings. Science 2009, 324(5934), 1557–1561. [Google Scholar] [CrossRef] [PubMed]
- Bedford, T.; Riley, S.; Barr, I.G.; Broor, S.; Chadha, M.S.; Cox, N.J.; et al. Global circulation patterns of seasonal influenza viruses vary with antigenic drift. Nature 2015, 523(7559), 217–220. [Google Scholar] [CrossRef] [PubMed]
- Volz, E.M.; Koelle, K.; Bedford, T. Viral phylodynamics. PLoS Comput Biol. 2013, 9(3), e1002947. [Google Scholar] [CrossRef] [PubMed]
- Longini, I.M., Jr.; Nizam, A.; Xu, S.; Ungchusak, K.; Hanshaoworakul, W.; Cummings, D.A.T.; et al. Containing pandemic influenza at the source. Science 2005, 309(5737), 1083–1087. [Google Scholar] [CrossRef] [PubMed]
- Brockmann, D.; Helbing, D. The hidden geometry of complex, network-driven contagion phenomena. Science 2013, 342(6164), 1337–1342. [Google Scholar] [CrossRef] [PubMed]
- World Health Organization. Global Influenza Surveillance and Response System (GISRS) [Internet]; World Health Organization: Geneva, 17 Jul 2026; Available online: https://www.who.int/initiatives/global-influenza-surveillance-and-response-system.
- Hadfield, J.; Megill, C.; Bell, S.M.; Huddleston, J.; Potter, B.; Callender, C.; et al. Nextstrain: real-time tracking of pathogen evolution. Bioinformatics 2018, 34(23), 4121–4123. [Google Scholar] [CrossRef] [PubMed]
- Brownstein, J.S.; Freifeld, C.C.; Madoff, L.C. Digital disease detection—harnessing the Web for public health surveillance. Nat. Biotechnol. 2009, 27(5), 431–434. [Google Scholar]
- Ginsberg, J.; Mohebbi, M.H.; Patel, R.S.; Brammer, L.; Smolinski, M.S.; Brilliant, L. Detecting influenza epidemics using search engine query data. Nature 2009, 457(7232), 1012–1014. [Google Scholar] [CrossRef] [PubMed]
- Peccia, J.; Zulli, A.; Brackney, D.E.; Grubaugh, N.D.; Kaplan, E.H.; Casanovas-Massana, A.; et al. Measurement of SARS-CoV-2 RNA in wastewater tracks community infection dynamics. Nat. Biotechnol. 2020, 38(10), 1164–1167. [Google Scholar] [CrossRef] [PubMed]
- Keeling, M.J.; Rohani, P. Modeling Infectious Diseases in Humans and Animals; Princeton University Press: Princeton (NJ), 2008. [Google Scholar]
- Shaman, J.; Karspeck, A. Forecasting seasonal outbreaks of influenza. Proc. Natl. Acad. Sci. U S A 2012, 109(50), 20425–20430. [Google Scholar] [CrossRef] [PubMed]
- Finkenstädt, B.F.; Grenfell, B.T. Time series modelling of childhood diseases: a dynamical systems approach. J. R Stat. Soc. Ser. C Appl. Stat. 2000, 49(2), 187–205. [Google Scholar] [CrossRef]
- Bjørnstad, O.N.; Finkenstädt, B.F.; Grenfell, B.T. Dynamics of measles epidemics: estimating scaling of transmission rates using a time series SIR model. Ecol. Monogr. 2002, 72(2), 169–184. [Google Scholar] [CrossRef]
- Dushoff, J.; Plotkin, J.B.; Levin, S.A.; Earn, D.J.D. Dynamical resonance can account for seasonality of influenza epidemics. Proc. Natl. Acad. Sci. U S A 2004, 101(48), 16915–16916. [Google Scholar] [CrossRef] [PubMed]
- Bush, R.M.; Bender, C.A.; Subbarao, K.; Cox, N.J.; Fitch, W.M. Predicting the evolution of human influenza A. Science 1999, 286(5446), 1921–1925. [Google Scholar] [CrossRef] [PubMed]
- Bloom, J.D. An experimentally determined evolutionary model dramatically improves phylogenetic fit. Mol. Biol. Evol. 2014, 31(8), 1956–1978. [Google Scholar] [CrossRef] [PubMed]
- Peng, Y.; Wang, D.; Wang, J.; Li, K.; Tan, Z.; Shu, Y.; et al. A universal computational model for predicting antigenic variants of influenza A virus based on conserved antigenic structures. Sci. Rep. 2017, 7, 42051. [Google Scholar] [CrossRef] [PubMed]
- Reich, N.G.; Brooks, L.C.; Fox, S.J.; Kandula, S.; McGowan, C.J.; Moore, E.; et al. A collaborative multiyear, multimodel assessment of seasonal influenza forecasting in the United States. Proc. Natl. Acad. Sci. U S A 2019, 116(8), 3146–3154. [Google Scholar] [CrossRef] [PubMed]
- Viboud, C.; Boëlle, P.Y.; Carrat, F.; Valleron, A.J.; Flahault, A. Prediction of the spread of influenza epidemics by the method of analogues. Am. J. Epidemiol. 2003, 158(10), 996–1006. [Google Scholar] [CrossRef] [PubMed]
- Lessler, J.; Reich, N.G.; Brookmeyer, R.; Perl, T.M.; Nelson, K.E.; Cummings, D.A.T. Incubation periods of acute respiratory viral infections: a systematic review. Lancet Infect. Dis. 2009, 9(5), 291–300. [Google Scholar] [CrossRef] [PubMed]
- Viboud, C.; Boëlle, P.Y.; Pakdaman, K.; Carrat, F.; Valleron, A.J.; Flahault, A. Influenza epidemics in the United States, France, and Australia, 1972-1997. Emerg. Infect. Dis. 2004, 10(1), 32–39. [Google Scholar] [CrossRef] [PubMed]
- Paget, J.; Marquet, R.; Meijer, A.; van der Velden, K. Influenza activity in Europe during eight seasons (1999-2007): an evaluation of the indicators used to measure activity and an assessment of the timing, length and course of peak activity. BMC Infect. Dis. 2007, 7, 141. [Google Scholar] [CrossRef] [PubMed]
- Lessler, J.; Edmunds, W.J.; Halloran, M.E.; Hollingsworth, T.D.; Lloyd, A.L. Seven challenges for model-driven data collection in experimental and observational studies. Epidemics 2017, 20, 3–7. [Google Scholar] [CrossRef] [PubMed]
- Reich, N.G.; McGowan, C.J.; Yamana, T.K.; Tushar, A.; Ray, E.L.; Osthus, D.; et al. Accuracy of real-time multi-model ensemble forecasts for seasonal influenza in the U.S. PLoS Comput Biol. 2019, 15(11), e1007486. [Google Scholar] [CrossRef] [PubMed]
- Lee, E.K.; Tian, H.; Nakaya, H.I. Antigenicity prediction and vaccine recommendation of human influenza virus A (H3N2) using convolutional neural networks. Hum. Vaccin Immunother. 2020, 16(11), 2690–2708. [Google Scholar] [CrossRef] [PubMed]
- Xia, Y.L.; Li, W.; Li, Y.; Ji, X.L.; Fu, Y.X.; Liu, S.Q. A deep learning approach for predicting antigenic variation of influenza A H3N2. Comput Math. Methods Med. 2021, 2021, 9997669. [Google Scholar] [CrossRef] [PubMed]
- Han, L.; Li, L.; Wen, F.; Zhong, L.; Zhang, T.; Wan, X.F. Graph-guided multi-task sparse learning model: a method for identifying antigenic variants of influenza A(H3N2) virus. Bioinformatics 2019, 35(1), 77–87. [Google Scholar] [CrossRef] [PubMed]
- Luo, J.; Li, X.; Wang, X.; et al. A novel graph neural network based approach for influenza-like illness nowcasting: exploring the interplay of temporal, geographical, and functional spatial features. BMC Public Health 2025, 25(1), 408. [Google Scholar] [CrossRef] [PubMed]
- Huddleston, J.; Barnes, J.R.; Rowe, T.; Xu, X.; Kondor, R.; Wentworth, D.E.; et al. Integrating genotypes and phenotypes improves long-term forecasts of seasonal influenza A/H3N2 evolution. eLife 2020, 9, e60067. [Google Scholar] [CrossRef] [PubMed]
- Shah, S.A.W.; Palomar, D.P.; Barr, I.G.; Poon, L.L.M.; Quadeer, A.A.; McKay, M.R. Seasonal antigenic prediction of influenza A H3N2 using machine learning. Nat. Commun. 2024, 15(1), 3833. [Google Scholar] [CrossRef] [PubMed]
- Chen, V.; Yang, M.; Cui, W.; Kim, J.S.; Talwalkar, A.; Ma, J. Applying interpretable machine learning in computational biology—pitfalls, recommendations and opportunities for new developments. Nat. Methods 2024, 21(8), 1454–1461. [Google Scholar] [CrossRef] [PubMed]
- Lee, N.K.; Tang, Z.; Toneyan, S.; Koo, P.K. EvoAug: improving generalization and interpretability of genomic deep neural networks with evolution-inspired data augmentations. Genome Biol. 2023, 24(1), 105. [Google Scholar] [CrossRef] [PubMed]
- McGinnis, J.; Laplante, J.; Shudt, M.; St George, K. Next generation sequencing for whole genome analysis and surveillance of influenza A viruses. J. Clin. Virol. 2016, 79, 44–50. [Google Scholar] [CrossRef] [PubMed]
- Agor, J.K.; Özaltın, O.Y. Models for predicting the evolution of influenza to inform vaccine strain selection. Hum. Vaccin Immunother. 2018, 14(3), 678–683. [Google Scholar] [CrossRef] [PubMed]
- Li, X.; Deem, M.W. Influenza evolution and H3N2 vaccine effectiveness, with application to the 2014/2015 season. Protein Eng. Des. Sel. 2016, 29(7), 309–315. [Google Scholar] [CrossRef] [PubMed]
- Ferguson, N.M.; Cummings, D.A.T.; Fraser, C.; Cajka, J.C.; Cooley, P.C.; Burke, D.S. Strategies for mitigating an influenza pandemic. Nature 2006, 442(7101), 448–452. [Google Scholar] [CrossRef] [PubMed]
- Ferguson, N.M.; Cummings, D.A.T.; Cauchemez, S.; Fraser, C.; Riley, S.; Meeyai, A.; et al. Strategies for containing an emerging influenza pandemic in Southeast Asia. Nature 2005, 437(7056), 209–214. [Google Scholar] [CrossRef] [PubMed]
- Longini, I.M., Jr.; Halloran, M.E.; Nizam, A.; Yang, Y. Containing pandemic influenza with antiviral agents. Am. J. Epidemiol. 2004, 159(7), 623–633. [Google Scholar] [CrossRef] [PubMed]
- Basta, N.E.; Chao, D.L.; Halloran, M.E.; Matrajt, L.; Longini, I.M., Jr. Strategies for pandemic and seasonal influenza vaccination of schoolchildren in the United States. Am. J. Epidemiol. 2009, 170(6), 679–686. [Google Scholar] [CrossRef] [PubMed]
- Fraser, C.; Riley, S.; Anderson, R.M.; Ferguson, N.M. Factors that make an infectious disease outbreak controllable. Proc. Natl. Acad. Sci. U S A 2004, 101(16), 6146–6151. [Google Scholar] [CrossRef] [PubMed]
- Peak, C.M.; Childs, L.M.; Grad, Y.H.; Buckee, C.O. Comparing nonpharmaceutical interventions for containing emerging epidemics. Proc. Natl. Acad. Sci. U S A 2017, 114(15), 4023–4028. [Google Scholar] [CrossRef] [PubMed]
- Peak, C.M.; Kahn, R.; Grad, Y.H.; Childs, L.M.; Li, R.; Lipsitch, M.; et al. Individual quarantine versus active monitoring of contacts for the mitigation of COVID-19: a modelling study. Lancet Infect. Dis. 2020, 20(9), 1025–1033. [Google Scholar] [CrossRef] [PubMed]
- Cowling, B.J.; Chan, K.H.; Fang, V.J.; Cheng, C.K.Y.; Fung, R.O.P.; Wai, W.; et al. Facemasks and hand hygiene to prevent influenza transmission in households: a cluster randomized trial. Ann. Intern Med. 2009, 151(7), 437–446. [Google Scholar] [CrossRef] [PubMed]
- Halloran, M.E.; Ferguson, N.M.; Eubank, S.; Longini, I.M., Jr.; Cummings, D.A.T.; Lewis, B.; et al. Modeling targeted layered containment of an influenza pandemic in the United States. Proc. Natl. Acad. Sci. U S A 2008, 105(12), 4639–4644. [Google Scholar] [CrossRef] [PubMed]
- Funk, S.; Salathé, M.; Jansen, V.A.A. Modelling the influence of human behaviour on the spread of infectious diseases: a review. J. R Soc. Interface 2010, 7(50), 1247–1256. [Google Scholar] [CrossRef] [PubMed]
- Andersson, H.; Britton, T. Stochastic Epidemic Models and Their Statistical Analysis; Springer: New York, 2000. [Google Scholar] [CrossRef]
- Heffernan, J.M.; Smith, R.J.; Wahl, L.M. Perspectives on the basic reproductive ratio. J. R Soc. Interface 2005, 2(4), 281–293. [Google Scholar] [CrossRef] [PubMed]
- Delamater, P.L.; Street, E.J.; Leslie, T.F.; Yang, Y.T.; Jacobsen, K.H. Complexity of the basic reproduction number (R0). Emerg. Infect. Dis. 2019, 25(1), 1–4. [Google Scholar] [CrossRef] [PubMed]
- van den Driessche, P.; Watmough, J. Reproduction numbers and sub-threshold endemic equilibria for compartmental models of disease transmission. Math. Biosci. 2002, 180, 29–48. [Google Scholar] [CrossRef] [PubMed]
- Wallinga, J.; Lipsitch, M. How generation intervals shape the relationship between growth rates and reproductive numbers. Proc. Biol. Sci. 2007, 274(1609), 599–604. [Google Scholar] [CrossRef] [PubMed]
- Wallinga, J.; Teunis, P. Different epidemic curves for severe acute respiratory syndrome reveal similar impacts of control measures. Am. J. Epidemiol. 2004, 160(6), 509–516. [Google Scholar] [CrossRef] [PubMed]
- Pollett, S.; Johansson, M.A.; Reich, N.G.; Brett-Major, D.; Del Valle, S.Y.; Venkatramanan, S.; et al. Recommended reporting items for epidemic forecasting and prediction research: the EPIFORGE 2020 guidelines. PLoS Med. 2021, 18(10), e1003793. [Google Scholar] [CrossRef] [PubMed]
- Nkengasong, J.N.; Tessema, S.K. Africa needs a new public health order to tackle infectious disease threats. Cell 2020, 183(2), 296–300. [Google Scholar] [CrossRef] [PubMed]
- Rabkin, M.; El-Sadr, W.M.; De Cock, K.M. The impact of HIV scale-up on health systems: a priority research agenda. J. Acquir Immune Defic. Syndr. 2009, 52 Suppl 1, S6–S11. [Google Scholar] [CrossRef] [PubMed]
- Asante, I.A.; Hsu, S.N.; Boatemaa, L.; Kwasah, L.; Adusei-Poku, M.A.; Odoom, J.K.; et al. Repurposing an integrated national influenza platform for genomic surveillance of SARS-CoV-2 in Ghana: a molecular epidemiological analysis. Lancet Glob. Health 2023, 11(7), e1075–e1085. [Google Scholar] [CrossRef] [PubMed]
- Herfst, S.; Schrauwen, E.J.A.; Linster, M.; Chutinimitkul, S.; de Wit, E.; Munster, V.J.; et al. Airborne transmission of influenza A/H5N1 virus between ferrets. Science 2012, 336(6088), 1534–1541. [Google Scholar] [CrossRef] [PubMed]
- Lewis, N.S.; Russell, C.A.; Langat, P.; Anderson, T.K.; Berger, K.; Bielejec, F.; et al. The global antigenic diversity of swine influenza A viruses. eLife 2016, 5, e12217. [Google Scholar] [CrossRef] [PubMed]
Disclaimer/Publisher’s Note: The statements, opinions and data contained in all publications are solely those of the individual author(s) and contributor(s) and not of MDPI and/or the editor(s). MDPI and/or the editor(s) disclaim responsibility for any injury to people or property resulting from any ideas, methods, instructions or products referred to in the content. |
© 2026 by the authors. Licensee MDPI, Basel, Switzerland. This article is an open access article distributed under the terms and conditions of the Creative Commons Attribution (CC BY) license (http://creativecommons.org/licenses/by/4.0/).
Copyright: This open access article is published under a Creative Commons CC BY 4.0 license, which permit the free download, distribution, and reuse, provided that the author and preprint are cited in any reuse.


