

Submitted:
18 July 2026
Posted:
20 July 2026
You are already at the latest version
Abstract
Real-time measurement of belowground tuber growth has not been conducted in field crops. Here, a strain-gauge sensor was used to monitor potato tuber growth and estimate mean daily tuber water loss. Over the 13 days preceding harvest, tuber thickness increased by 0.90 mm, corresponding to a daily gain of 1.33 g, or a 4.8% increase. The greatest diurnal fluctuation was 0.453 mm, corresponding to a transpirational water loss of 9.4 ml, or 3% of the tuber’s water content. Daily transpiration showed a positive correlation with air temperature and vapor pressure deficit. This sensor will enable more precise input control and higher temporal resolution than current methods for below-ground crops, supporting improved crop management, yield prediction, and harvest decisions.
Keywords:
phenotyping
; dendrometer
; agriculture
; electronic instrumentation
; tubers
; signal processing
; growth
; water status
Abstract
Real-time measurement of belowground tuber growth has not been conducted in field crops. Here, a strain-gauge sensor was used to monitor potato tuber growth and estimate mean daily tuber water loss. Over the 13 days preceding harvest, tuber thickness increased by 0.90 mm, corresponding to a daily gain of 1.33 g, or a 4.8% increase. The greatest diurnal fluctuation was 0.453 mm, corresponding to a transpirational water loss of 9.4 ml, or 3% of the tuber’s water content. Daily transpiration showed a positive correlation with air temperature and vapor pressure deficit. This sensor will enable more precise input control and higher temporal resolution than current methods for below-ground crops, supporting improved crop management, yield prediction, and harvest decisions.
1. Introduction
Measuring plants and their edible parts is crucial for understanding and managing plant growth. Efficient growth management involves adjusting resource inputs, such as water and nutrients, to maximize yield and quality while minimizing resource use. For managing aboveground crops, some workers now use real-time assessments of plant and fruit growth with dendrometers and fruit sensors to keep growth at target levels [1,2]. While this method is fairly straightforward for aboveground tissues, it becomes much more difficult for belowground tissues because soil can interfere with mechanical sensors like dendrometers [3]. To address this problem, [3] use a complex magnetic resonance imaging (MRI) tool to monitor tuber growth and water content, but only every four hours over four days. Unfortunately, MRI isn't suitable for fieldwork. An alternative method is needed.
Others [4,5] measure changes in the size of Solanum tuberosum (L.) tubers underground in greenhouse and laboratory settings, but the technology remains too fragile or complex for field use. An effort has also been made to measure potato tubers in real time in field conditions. A linear variable differential transformer (LVDT) for field trials is used on a nearly fully exposed potato after soil removal [6]. This was done to avoid soil interference, but it may bias the tuber response relative to that of buried tubers. Additionally, they use a narrow, curved tube to house a wire transmitting length changes to the LVDT, but the wire touches the tube’s surface, thereby interfering with the signal as the potato shrinks during the day. The authors note that a better design is needed. A reliable, field-tested sensor is used on apples [7,8,9], tomatoes [10], cherries [11], cucumbers [12], and olives [13] to measure growth, and is the focus of this study.
This sensor and other similar sensors also monitor water status by detecting very small diurnal changes in thickness, indicating water gain at night and loss during the day [14]. Diurnal variation in thickness is linked to plant water potential in stems [8,10,14,15], to relative water content in fruit [16], and to transpiration [17,18,19]. It should be noted that below-ground potato tubers are thickened stem-storage tissues that form at the ends of stolons and can store large amounts of water. For example, 82% of a Shepody cultivar tuber is water [20]. Given the large volume of water stored in tubers, it is important to determine how much of this water contributes to the plant’s overall transpiration for water budgeting. As [3] note, little is known about water fluxes into and out of tubers because measuring such fluxes below ground is challenging. In a controlled greenhouse study using MRI, they find that in 6-week-old well-watered plants, about 10% of the water in tubers is lost during the day and transferred to the plant's vegetative parts for transpiration. No further information is available about this process. Here, the amount of water lost by the test tuber was estimated, with the expectation that it may lose less water toward the end of the vegetative growth cycle as leaves begin to senesce. Additionally, since the vegetative part of potato plants shows a typical positive correlation between transpiration and increases in temperature and vapor pressure deficit (VPD) for well-watered plants [21,22], it is hypothesized that there will be a positive correlation between daily shrinkage or water loss in a tuber and mean daily air temperature and VPD.
This study aimed to determine whether the device could adequately monitor real-time changes in below-ground tuber size in an agricultural setting. Testing was conducted to (i) determine whether the device can accurately measure underground tuber growth and daily changes in thickness, (ii) determine whether, after separating the long-term growth signal from diurnal variation, the resulting assessment of water status can be used to quantify the amount of water lost during the day, and (iii) determine whether the daily water loss rate or the tuber’s contribution to transpiration can be related to daily air temperature and the vapor pressure deficit. These highly sensitive strain gauges can produce outliers or spikes due to electrical noise from motors [23], soil vibrations from the regular movement of pivot irrigation systems [24], and possibly water leakage through the sensor seals [25]. A soil moisture sensor was installed to monitor potential impacts of pivot irrigation on the signal. Removing spikes from strain gauge data is typically performed by inspection or with a moving median filter using a fixed threshold [26].
2. Materials and Methods
2.1. Field Propagation
The study was carried out on a 51-acre irrigated crop circle just north of Pasco, WA (46.37027957, -119.13218795; elevation: 201.8 m). The soil consisted of Quincy loamy fine sand. The potato variety used was Shepody, which was seeded in early March. Data collection was conducted from July 9 to July 22, 2025, until harvest.
2.2. Sensor
The sensor [7] consists of two aluminum bars, each 76.2 mm long, attached to a flexible stainless-steel band with strain gauges mounted on it (Figure 1A). The flexible stainless-steel band is 152.4 mm long, 25.4 mm wide, and 0.76 mm thick. The four strain gauges are connected in a full Wheatstone bridge configuration, with two gauges on each side positioned at the center of the band. The sensor was secured to the tuber by tightening a bolt with a curved anvil at its end, threaded through one of the aluminum bars, and pressing the potato between two anvils (Figs. 1A,B). Part of the sensor and the potato were covered by soil, except where blocked by a black pipe (Figure 1C). The pipe was oriented north to minimize light exposure. A platinum resistance thermometer (PRT) sensor was placed at the junction of the spring-steel band and the aluminum bar near the soil. The Delta-T soil moisture sensor was positioned horizontally in the soil at the same depth as the tubers. The soil moisture sensor was then covered with soil and tightly packed.
As the tuber diameter varied, the differences in the relative tension experienced by the strain gauges were recorded as millivolt signals. The strain gauge, temperature, and soil moisture sensors were connected to a Dynamax SapIP wireless data logger (Figure 1D), which collected data every 15 min and transmitted them via the Dynamax Agrisensors Platinum website (www.agrisensors.net). Millivolt signals are converted to millimeter units using a linear factory calibration (Dynamax, Inc.).
2.3. Effect of Temperature on The Sensor
The strain gauge sensor is temperature-sensitive. This effect was corrected in the experimental data, following [7]. The temperature effect was measured by placing an Invar metal-alloy cylinder between the anvils at mid-strain and exposing it to a range of diurnal temperatures. Invar was chosen because of its very low thermal expansion coefficient [27], making it a stable target for studies of temperature effects. The relationship between temperature (T) and apparent thickness (Sa) was determined as:
where b0 is the intercept (mm) at 0 °C, and b1 is the slope of the relationship between apparent thickness and temperature. This predicted value represents a thermal error. The error was set to zero at the mean temperature (33.86 °C). These error values were then added to or subtracted from each biological observation, depending on the sensor temperature relative to 33.86 °C.
Sa = b0 + b1T
2.4. Outliers
Repeated spike outliers were characterized by their daily spike range (mm) for spikes associated with and without periodic irrigation. These two conditions and their changes over time (t, days) were explained as:
where b0 is the intercept (mm) when time = 0, b1 is the slope of the relationship between the spike range and time (t, days), and b2 is the relative difference between the two conditions.
Spike range = b0 + b1t + b2condition
2.5. Growth
Growth was defined as the mean (µ, mm) of each day’s observations after [28], which were then related to time as:
where b0 is the intercept (mm) when time = 0, and b1 is the slope of the relationship between the mean daily thickness and time (t, days). Data collection began at 02:15 on July 10, 2025, and ended at 08:15 on July 22. The total increase in diameter (µt) was calculated at the end of the field trial as:
where f and i are the final and initial mean observations, respectively.
µ = b0 + b1t
µt = µf - µi
The increase in the mass of the test tuber was estimated by relating the measured mass (379.1 g) on an Ohaus Scout scale to the tuber's single measured diameter, its height (H). The final tuber height was 57 mm, measured at the center of the anvil locations with a caliper. Both mass and H were measured immediately after harvesting the tuber. Height was related to tuber mass, following the approach of [29] for Irish potatoes. While it would be more accurate to relate an ellipsoidal volume, calculated from all three dimensions, to mass, as in [30], or to use a linear regression incorporating all three measurements, as in [29], this is not feasible here. The other two larger dimensions cannot be measured with the sensor, and they should not be assumed to be proportional to the measured dimension because potato tuber growth and shrinkage are anisotropic, meaning dimensions such as height, length, and width change at different rates. The relationship in [29] was highly significant (r2 = 0.781) using only H, and was used here as:
where M is mass (g), and the exponent was adjusted to match the measured mass of the tuber. This modification likely provides a reasonable approximation for the small growth and diurnal height changes observed in this study. It should be noted that estimating mass using a sensor that measures only one dimension will require either relating existing dimensional and mass data for a specific variety or taking empirical measurements of the dimensions and masses of potato tubers across a full range of sizes
M = 0.002 H3.006
2.6. Diurnal Thickness Variation and an Estimate of Daily Transpiration as Related to Mean Daily Air Temperature and the Mean Estimated Vapor Pressure Deficit
Diurnal thickness variation was distinguished from growth by fitting a spline to the data. A spline can model small variations in potential growth that linear regression cannot adequately capture. The smoothing spline fit, after subjectively setting a lambda value of 20, produced residuals that represent diurnal thickness variation data separate from growth data. The diurnal thickness data can be used to estimate water mass loss from the tuber and quantify the tuber's contribution to the plant's daily transpiration. The daily transpiration contribution was estimated by calculating the difference in tuber thickness between the maximum thickness (Tmax) in the early morning and the minimum thickness (Tmin) at the end of each day. This change was subtracted from the final height and used in Eq. 5 to estimate daily water loss. Given that the Shepody variety is 82% water, the daily percentage of water loss was based on 82% of the final mass (379.1 g), resulting in 310.9 g or ml of H2O.
The relationship between estimated daily water loss or transpiration (Tr, ml day-1) and the mean air temperature (T, °C) just above the canopy during the period when transpiration is occurring was done with linear regression as:
where b0 is the intercept when the temperature is 0 °C, and b1 is the slope of the relationship between transpiration and air temperature.
Tr = b0 + b1T
Because relative humidity was not measured, the relationship between Tr and the mean estimated vapor pressure deficit (VPD, kPa) was derived from dew point temperature data collected at the Washington State University Pasco NW site, about 8.8 km west of the study site, and from site mean air temperature. This relationship was modeled using linear regression as:
where b0 is the intercept when the VPD is 0 kPa, and b1 is the slope of the relationship between transpiration and the VPD.
Tr = b0 + b1VPD
2.7. Data Analysis
Data were analyzed using JMP version 18.2.1 software [31]. Outliers were removed by inspection. Error terms represent 1 standard error of the mean (SEM). Statistical significance was set at α = 0.05.
3. Results
3.1. Effect of Temperature on the Sensor
To address the effect of temperature on the sensor, a thermally stable Invar piece [27] was placed at mid-strain between the anvils on the sensor (Figure S1A) and then subjected to a range of temperatures [7]. The effect of temperature on apparent thickness was linear (Eq. 1, Figure 2) and highly significant (r2 = 0.99, p < 0.0001, n = 61), with b0 = 5.961 ± 0.00257 mm (p < 0.0001) and b1 = 0.006859 ± 0.00007433 dSa/dT (p < 0.0001). The range of apparent thickness was 0.14404 mm over 20°C. After zeroing the error at the mean temperature, the relationship showed b0 = -0.23224 ± 0.00257 mm (p < 0.0001), with the same b1 value. The thermal error values ranged from -0.07228 to 0.07176 mm and were subtracted from the tuber thickness data as a function of temperature.
3.2. Outliers
Outliers were detected repeatedly over 13 days (Figure 3A). The sensor appears to be affected by periodic extraneous noise related to the irrigation process (red, Figure 3B) and by another periodic process (green) unrelated to water. The relationship (Eq. 2) between spike range (mm) for the two irrigation conditions and time was highly significant (p < 0.0001, r2 = 0.60, n = 23). The intercept was 0.385 ± 0.0572 (p < 0.0001), and the spike range decreased significantly over time (b1 = -.0369 ± 0.00786, p = 0.0001). The effect of the two irrigation conditions was significant (b2 = -0.0705 ± 0.0274, p = 0.0182), with the least squares mean of the spike range associated with irrigation at 0.219 ± 0.0396 being significantly (p < 0.05) greater than the spike range not associated with irrigation, which was 0.0782 ± 0.0379. Because the sensor was affected by an external signal, the resulting outliers, represented by the green and most red points, were manually removed by visual inspection (Figure 3C), except on days 7, 11, and 12, when no apparent irrigation effect was observed.
3.3. Growth
The tuber grew steadily during the observation period (Fig.S1B,C, Figure 4A). The linear relationship (Eq. 3), which is highly significant (r2 = 0.98, p < 0.0001, n = 13), has coefficients of b0 = -0.149 ± 0.0234 and b1 = 0.0777 ± 0.00294. The tuber increased in thickness by 0.90 mm over 13 days. Based on the final measured tuber height of 57 mm, subtracting 0.90 mm yields a final percentage increase in height of 1.6%.
The growth rate was estimated by first predicting the initial mass using Eq. 5 with H = 56.1 mm, which yielded 361.8 g. The difference between the final mass of 379.1 g and the predicted initial mass was 17.3 g, yielding an estimated growth rate of 1.33 g day-1 and a 4.8% increase in mass over 13 days.
3.4. Diurnal Thickness Variation and an Estimate of Daily Transpiration as Related to the Mean Air Temperature and Vapor Pressure Deficit
Transpiration was estimated by separating growth from diurnal variation. This was done by first predicting continuous growth using a spline (Figure 4B, λ = 20, n = 1117, r2 = 0.853). This approach allows for variation over time to reflect potential growth patterns that are too fine to be captured by the simple linear regression in Figure 4A. The resulting residuals are considered representative of diurnal variations in thickness related to water status (Figure 4C). Diurnal variation ranged from 0.217 to 0.453 mm (Figure 4C).
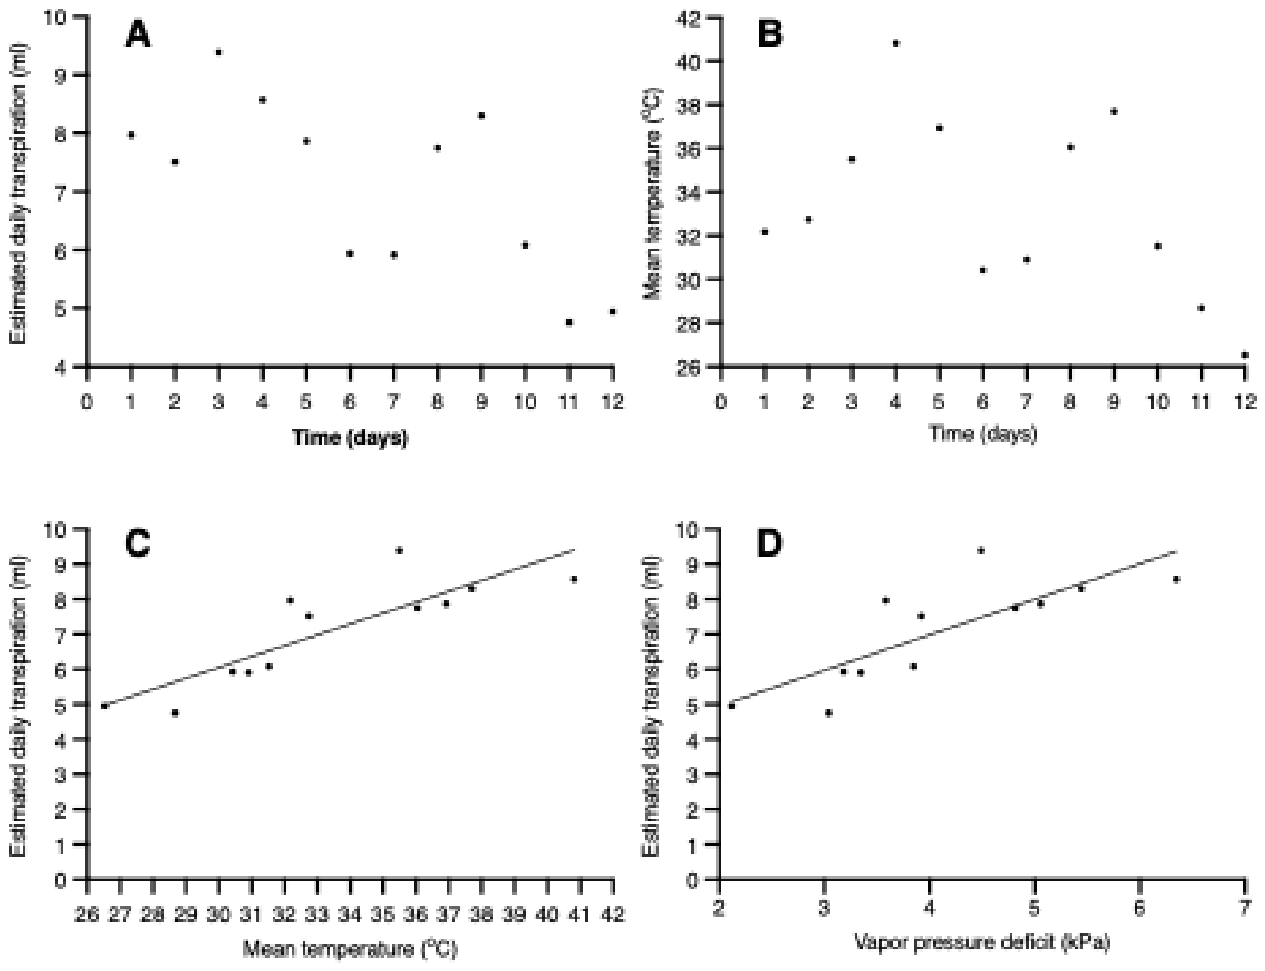
The estimated contribution of water for whole plant transpiration from the test tuber ranged from a maximum of 9.4 ml or 3.0% of the full 310.9 ml of water stored in the tuber to a minimum of 4.8 ml or 1.5%. (Figure 5A). The mean air temperature for the period corresponding to daily estimated transpiration in Figure 5A ranged from 40.8 ºC to 26.5 ºC on the last day. The relationship between daily tuber water loss or the estimated contribution of the tuber to whole plant transpiration with the mean air temperature was highly significant (p = 0.0004, r2 = 0.73) with b0 = -3.26 ± 2.00 and b1 = 0.310 ± 0.0596 (Figure 5C). The relationship with the mean vapor pressure deficit was also highly significant (p = 0.0019, r2 = 0.63) with b0 = 2.93 ± 1.04 and b1 = 1.01 ± 0.244 (Figure 5D).
4. Discussion
The main goals of this study were to determine whether the sensor could reliably measure underground tuber growth in real time and to estimate the tuber’s contribution to transpiration. These goals appear to have been met, as evidenced by consistent daily patterns, a 0.90 mm increase over 13 days, and a positive relationship between VPD and the tuber's water loss. The sensor is the first to do so for underground tubers in an agricultural setting.
4.1. Effect of Temperature on the Sensor
The sensor used here, along with other commonly used sensors, is temperature-sensitive [9,32], which can impair the ability to relate diurnal variation to water status [33]. With 20°C changes, thermal noise is less than 10 µm for a potentiometer [34], ranges from 17 to 27 µm for LVDTs [32], and 50 µm for the smaller DEX20 strain-gauge sensor on olive fruit [13]. This is much smaller than the 144 µm variation observed with the larger DEX100 strain-gauge sensor, underscoring the need to correct for temperature effects when diurnal thickness changes range from 217 to 453 µm. This will reduce high signal-to-noise ratios that can impair the ability to relate diurnal variation to water status [33].
4.2. Outliers
Outliers are a problem with strain-gauge data and must be removed to draw conclusions about growth and water status [33]. In this study, periodic, mostly negative spikes occurred when the pivot-irrigation system passed over the sensor. These spikes lasted up to 2 hours and were larger at the beginning of the trial. Because some spikes were not linked to water application, they may have been caused by other sources of electromagnetic interference [35,36]. Such interference could originate from the motors of nearby equipment. It is also possible that the sensor detected soil vibrations [37] associated with the pivot irrigation system. Because the spike range was higher during water application than for other outliers, there may have been an additive effect of water on the sensor. Water beneath adhesive layers can adversely affect strain gauges, leading to sudden spikes [38]. The reduction in spike range over time suggests that these environmental factors may be temporary. The sensor behaved similarly to those on apples [7], except for the repeated outliers. The sensor used in the orchard was not repeatedly exposed to electromagnetic interference, showing only three spiked outliers on stems and one on an apple over 15 d [7]. Removing spikes from strain gauge data is often done using a moving median data filter with a threshold [26].
4.3. Growth
The tuber grew at 1.33 g day-1, comparable to the 1.36 g day-1 growth rate of a Honeycrisp apple under similar conditions [39]. Both were well-watered. In a controlled greenhouse, the Julinka potato cultivar grew at about 4 g day-1 during the final stage of potato growth [40]. There appears to be little other information on individual tuber daily growth rates under field conditions.
Yield estimation is crucial for all crops and is relatively simple for above-ground crops. For example, modeled apple fruit diameters improve early yield predictions [41,42], and fruit growth sensors provide reliable yield forecasts up to 8 days after data collection [42]. However, predicting yield for below-ground crops is much more difficult. As a result, models link yield to observable, correlated traits. Recent reviews [43,44] of potato yield prediction note that these efforts have been ongoing with varying success. This is partly because modeling tuber growth using only correlated predictors is inherently less accurate than models based on direct measurements of the target. Current methods, such as machine learning, improve accuracy but require large datasets and are difficult to implement at the individual-farm level [43,44]. Belowground crop models are limited by the lack of real-time tuber growth data, which could simplify and improve model logic [44]. The positive results here suggest that measuring below-ground growth in real time, as easily as for above-ground crops, will streamline yield prediction for potatoes and, likely, other below-ground crops.
The ability to monitor tuber growth in real time enables estimation of daily increases in potato yield. While using a single potato to estimate yield primarily serves as a demonstration, it is now possible—with sufficient sensors and knowledge of size distribution for a specific cultivar—to provide a reasonable field estimate. For example, the tuber grew 4.8% over 13 days. Based on this, and the average yield of 31 tons per acre in the Columbia Basin in 2024 [45], the yield 13 days before harvest would have been around 29.51 tons per acre; thus, the yield increased by 1.49 tons per acre at a rate of 0.114 tons per day. At a price of $10.40 per 100-pound hundredweight (CWT) [45], or $208 per ton, a 100-acre field could generate $2,371 per day during the 13 days before harvest. The sensor’s timely information will help managers balance daily maintenance costs against the estimated increase in value to optimize harvest timing.
The ability to measure tuber growth in real time also enables Proportional-Integral-Derivative (PID) fertigation control logic, in which tuber size and growth rate serve as control targets. Such control logic may be similar to that used for fruit growth, which is directly related to fruit yield and has demonstrated positive results for irrigation scheduling [46]. A PID approach, or a similar method, is employed by [1] to conserve water for above-ground crops like apples.
4.4. Diurnal Thickness Variation and An Estimate of Daily Transpiration as Related to the Mean Air Temperature and Vapor Pressure Deficit
For water storage dynamics, the maximum diurnal variation of 0.45 mm is similar to that of cucumbers (0.40 mm) [12], tomatoes (0.45 mm) [47], olives (0.55 mm) [13], and apples (0.7 mm) [39]. This suggests that the sensor operating underground, is much like sensors measuring diurnal variation in above-ground crops. This technological advancement will now allow exploration of the role of tuber water storage in water budget models and its contribution to transpiration under field conditions.
Potato tuber water storage may be significant because tubers can account for 78% of total plant biomass [48], with 82% of the Shepody tuber biomass being water [20]. Because they don’t exchange water with their environment, they supply water to the shoot [3], as do olives [13]. The maximum daily percentage water loss in this study was 3% in about 18-week-old plants, and while experimental conditions differed, it appears to be less than the 10% daily water loss in 6-week-old plants [3], largely supporting observations that transpiration decreases significantly as plants senesce [49].
The daily estimated contribution to whole-plant transpiration rates was positively correlated with the VPD and temperature, supporting the observation that transpiration rates increase with increasing VPD for well-watered plants [21,22]. It appears that the sensor can be used to estimate transpiration rates similar to how dendrometers are used for above-ground crops [17,18,19].
The contribution of stored tuber water to daily transpiration can also be compared with irrigation rates. Assuming a single tuber represents the others in a field, a 3% loss of water would be calculated as 31 tons acre-1 x 0.82 x 0.03, resulting in 0.76 tons acre-1 or 689.5 liters acre-1. This amount is only about 2.68% of the typical application rate at the season's end, which is 6.35 mm or 25,698 liters acre-1. The contribution of stored tuber water can also be compared with an average crop evapotranspiration rate of 3.42 mm day-1 for potatoes at the end of the season in the Columbia Basin [50]. In that context, the contribution from tubers would be approximately 0.17 mm day-1, or 5% of the crop's evapotranspiration rate. While this contribution rate appears small, it may be larger in younger plants and could be useful for refining water budgets for potatoes.
Potential applications of the technology also include tracking hydration levels. This is crucial for reducing damage from blackspot [51,52] and shatter bruise [52]. These sources note that blackspot damage is high when tubers are dehydrated and shatter damage is high when tubers are crisp or very turgid. Determining the optimal harvest time to minimize damage is challenging because tuber weight decreases when roots are pruned and increases when plant tops are removed [51]. Harvesting when water content is high can boost yield for the producer but may harm the processor [51]. A tuber sensor can provide size and an estimate of water content in real time, likely improving the ability to minimize damage and maximize yield.
Although the current sensor worked on a large tuber at the end of the growing season, it is important to test the sensor or similar sensors over a longer period. Smaller tubers can be accommodated by designing smaller anvils and using a narrower pipe. A narrower, longer pipe will also reduce light and greening, as was observed at a low level here.
5. Conclusions
The sensor, or its modifications, will likely work across all belowground food crops and will significantly contribute to the sensor revolution in precision agriculture. This new capacity to measure tuber size in real time under field conditions will help improve our understanding of the relationships among growth, water status, daily transpiration, and external factors. This will enable more precise control of inputs at a much higher temporal resolution than current methods for belowground crops. This should improve quality and yield while reducing inputs, saving water, nutrients, and power. The sensor, or its modifications, can likely also measure relatively shallow rhizome and thick-root growth, as well as their diurnal variation.
Funding
This research received no external funding.
Data Availability Statement
Supporting data are available from the corresponding author.
Acknowledgments
M.G. van Bavel of Dynamax, Inc. is thanked for his advice on sensor use. Field and technical assistance from E. Mendoza and N. Sheshunov are appreciated. Suggestions by J. Blauer and A. Schreiber that enhanced the manuscript are appreciated. Comments on the manuscript by E. Mendoza and M. Rubalcava are acknowledged. The potato field for this research was provided by C. Sullivan.
Conflicts of Interest
The author declare no conflicts of interest.
Abbreviations
The following abbreviations are used in this manuscript:
| MDPI | Multidisciplinary Digital Publishing Institute |
| DOAJ | Directory of open access journals |
| MRI | Magnetic resonance imaging |
| LVDT | Linear variable differential transformer |
| VPD | Vapor pressure deficit |
| PRT | Platinum resistance thermometer |
References
- Phytech, “Phytech & Manna irrigation unite to create a powerhouse of irrigation intelligence” (Phytech. 2025. Available online: www.phytech.com.
- Waldburger, T.; Anken, T.; Cockburn, M.; Walter, A.; Hatt, M.; Chiang, C.; Nasser, H. Automated irrigation of apple trees based on dendrometer sensors. Agric. Water Manag. 2025, 311, 109398. [Google Scholar] [CrossRef]
- Huntenburg, K.; Pflugfelder, D.; Koller, R.; Dodd, I. C.; van Dusschoten, D. Diurnal water fluxes and growth patterns in potato tubers under drought stress. Plant Soil 2025, 507, 269–282. [Google Scholar] [CrossRef]
- Stark, J. C.; Halderson, J. L. Measurement of diurnal changes in potato tuber growth. Am. Potato J. 1987, 64, 245–248. [Google Scholar] [CrossRef]
- Pérez-Torres, E.; Kirchgessner, N.; Pfeifer, J.; Walter, A. Assessing potato tuber diel growth by means of X-ray computed tomography. Plant Cell Environ. 2015, 33, 2318–2326. [Google Scholar] [CrossRef]
- Shimazu, M.; Shibata, Y.; Araki, H.; Kataoka, T.; Okamoto, H. Measurement of dilation of root crops. XVIIth World Congress of the International Commission of Agricultural and Biosystems Engineering (CIGR, 2010; pp. 1–10. [Google Scholar]
- Link, S. O.; Thiede, M. E.; van Bavel, M. G. An improved strain-gauge device for continuous field measurement of stem and fruit diameter. J. Exp. Bot. 1998, 49, 1583–1587. [Google Scholar] [CrossRef]
- Link, S. O. “The use of sensors to continuously and non-destructively measure fruit and stem diameter change as measures of leaf water potential and growth as influenced by irrigation strategies” in Washington Tree Fruit Research Commission. In Apple Horticulture/Pathology Research Review; Yakima, WA, 2004; pp. 74–79. [Google Scholar]
- Link, S. O.; Drake, S. R.; Thiede, M. E. Prediction of apple firmness from mass loss and shrinkage. J. Food Qual. 2004, 27, 13–26. [Google Scholar] [CrossRef]
- T. D. Swaef, K. Steppe, Linking stem diameter variations to sap flow, turgor and water potential in tomato. Funct. Plant Biol. 2010, 37, 429–438. [Google Scholar] [CrossRef]
- Zucchini, M.; Khosravi, A.; Giorgi, V.; Mancini, A.; Neri, D. Is there daily growth hysteresis versus vapor pressure deficit in cherry fruit? Horticulturae 2021, 7, 131. [Google Scholar] [CrossRef]
- Ruijiang, W.; Wang, X.; Zhu, H. Dynamic changes of transverse diameter of cucumber fruit in solar greenhouse based on no damage monitoring. 9th International Conference on Computer and Computing Technologies in Agriculture (CCTA, 2015; pp. 469–458. [Google Scholar] [CrossRef]
- Khosravi, A.; Zucchini, M.; Giorgi, V.; Mancini, A.; Neri, D. Continuous monitoring of olive fruit growth by automatic extensimeter in response to vapor pressure deficit from pit hardening to harvest. Horticulturae 2021, 7, 349. [Google Scholar] [CrossRef]
- Gallardo, M.; Thompson, R. B.; Valdez, L. C.; Fernández, M. D. Use of stem diameter variations to detect plant water stress in tomato. Irrig. Sci. 2006, 24, 241–255. [Google Scholar] [CrossRef]
- Nortes, P. A.; Pérez-Pastor, A.; Egea, G.; Conejero, W.; Domingo, R. Comparison of changes in stem diameter and water potential values for detecting water stress in young almond trees. Agric. Water Manag. 2005, 77, 296–307. [Google Scholar] [CrossRef]
- Scalisi; Bresilla, K.; Grilo, F. S. Continuous determination of fruit tree water-status by plant-based sensors. Italus Hortus 2017, 24, 39–50. [Google Scholar]
- De Schepper, V.; Van Dusschoten, D.; Copini, P.; S. Jahnke, K. Steppe, MRI links stem water content to stem diameter variations in transpiring trees. J. Exp. Bot. 2012, 63, 2645–2653. [Google Scholar] [CrossRef] [PubMed]
- Simonneau, T.; Habib, R.; Goutouly, J.-P.; Huguet, J.-G. Diurnal changes in stem diameter depend upon variations in water content: direct evidence in peach trees. J. Exp. Bot. 1993, 44, 615–621. [Google Scholar] [CrossRef]
- Sperling, O.; Kamai, T.; Gardi, I. A.; Zwieniecki, M.; Marino, G. Modeling tree responses to soil water variability guides irrigation to account for soil winter reserves. Vadose Zone J. 2025, 24 e20385. [Google Scholar]
- Geremew, E. B.; Steyn, J. M.; Annandale, J. G. Evaluation of growth performance and dry matter partitioning of four processing potato (Solanum tuberosum) cultivars. N. Z. J. Crop Hortic. Sci. 2007, 35, 385–393. [Google Scholar] [CrossRef]
- Ribeiro, R. V.; Machado, E. C.; Santos, M. G.; Oliveira, R. F. Photosynthesis and water relations of well-watered orange plants as affected by winter and summer conditions. Photosynthetica 2009, 47, 215–222. [Google Scholar] [CrossRef]
- Zhang, P.; Yang, X.; Manevski, K.; Li, S.; Wei, Z.; Andersen, M. N.; Liu, F. Physiological and growth responses of potato (Solanum Tuberosum L.) to air temperature and relative humidity under soil water deficits. Plants 2022, 11, 1126. [Google Scholar] [CrossRef] [PubMed]
- Adamchuk, V. I.; Morgan, M. T.; Sumali, H. Application of a strain gauge array to estimate soil mechanical impedance on–the–go. Trans. ASAE 2001, 44, 1377–1383. [Google Scholar] [CrossRef]
- Kahrobaee, S.; Vuran, M. C. Vibration energy harvesting for wireless underground sensor networks. 2013 IEEE International Conference on Communications (ICC, 2013; pp. 1543–1548. [Google Scholar]
- Hoffmann, K. An introduction to stress analysis and transducer design using strain gauges; (HBM test and measurement: Darmstadt, 2012. [Google Scholar]
- Brock, F. V. A Nonlinear filter to remove impulse noise from meteorological data. J. Atmos. Ocean. Technol. 1986, 3, 51–58. [Google Scholar] [CrossRef]
- Katerji, N.; Tardieu, F.; Bethenod, O.; Quentin, P. Behavior of maize stem diameter during drying cycles: comparison of two methods for detecting water stress. Crop Sci. 1994, 34, 165–169. [Google Scholar] [CrossRef]
- Oberhuber, W.; Gruber, A.; Kofler, W.; Swidrak, I. Radial stem growth in response to microclimate and soil moisture in a drought-prone mixed coniferous forest at an inner Alpine site. Eur. J. For. Res. 2014, 133, 467–479. [Google Scholar] [CrossRef] [PubMed]
- Oyefeso, B. O.; Raji, A. O. Estimating mass and volume of Nigerian grown sweet and Irish potato tubers using their geometrical attributes. Adeleke Univ. J. Eng. Technol. 2018, 1, 123–130. [Google Scholar]
- Pitts, J.; Hyde, G. M.; Cavalieri, R. P. Modeling potato tuber mass with tuber dimensions. Trans. ASAE 1987, 30, 1154–1159. [Google Scholar] [CrossRef]
- JMP®; JMP Statistical Discovery LLC: Cary, NC, 2025.
- Erasmus, C. S.; Drew, D.; Booysen, M. J. A low-cost wireless dendrometer and digital twin for precision forestry applications. 2025. Available online: https://ssrn.com/abstract=5607710. [CrossRef]
- Francini, S.; Cocozza, C.; Hölttä, T.; Lintunen, A.; Paljakka, T.; Chirici, G.; Traversi, M. L.; Giovannelli, A. A temporal segmentation approach for dendrometers signal-to-noise discrimination. Comput. Electron. Agric. 2023, 210, 107925. [Google Scholar] [CrossRef]
- Morandi, B.; Manfrini, L.; Zibordi, M.; Noferini, M.; Fiori, G.; Grappadelli, L. C. A low-cost device for accurate and continuous measurements of fruit diameter. HortScience 2007, 42(no. 6), 1380–1382. [Google Scholar] [CrossRef]
- Ott, H. W. Noise Reduction Techniques in Electronic Systems; John Wiley &Sons, Inc., New York ed. 2, 1988. [Google Scholar]
- Liu, Q.; Ding, W.; Zhou, H.; Han, R.; Wu, J.; Jing, Y.; Qiu, A. A novel strain measurement system in strong electromagnetic field. IEEE Trans. Plasma Sci. 2015, 43, 3562–3567. [Google Scholar] [CrossRef]
- Ágoston, K. Vibration detection of the electrical motors using strain gauges. Procedia Technol. 2016, 22, 767–772. [Google Scholar] [CrossRef]
- Sensing Systems Corporation. “Environmental factors that affect strain gauge performance — and how to protect your measurements” (Sensing Systems Corporation. 2025. Available online: https://sensing-systems.com/environmental-factors-that-affect-strain-gauge-performance-and-how-to-protect-your-measurements/.
- Blanco, V.; Kalcsits, L. Relating microtensiometer-based trunk water potential with sap flow, canopy temperature, and trunk and fruit diameter variations for irrigated ‘Honeycrisp’apple. Front. Plant Sci. 2024, 15 1393028. [Google Scholar]
- Jama-Rodzenska, A.; Janik, G.; Walczak, A.; Adamczewska-Sowinska, K.; Sowinski, J. Tuber yield and water efficiency of early potato varieties (Solanum tuberosum L.) cultivated under various irrigation levels. Sci. Rep. 2021, 11, 19121. [Google Scholar] [CrossRef] [PubMed]
- Stajnko, D.; Črtomir, R.; Pavlovič, M.; Beber, M.; Zadravec, P. Modeling of ‘Gala’apple fruits diameter for improving the accuracy of early yield prediction. Sci. Hortic. 2013, 160, 306–312. [Google Scholar] [CrossRef]
- Najdenovska, E.; Carvalho, C. C.; Dunkel, T.; Whittaker, R.; Monney, P.; Dutoit, F.; Raileanu, L. E. LSTM-based prediction of apple fruit growth using past diameter and climatic condition data. 2025 International Conference on Artificial Intelligence, Computer, Data Sciences and Applications (ACDSA IEEE, 2025; pp. 1–6. [Google Scholar]
- Piekutowska, M.; Gniewko, N. Review of methods and models for potato yield prediction. Agriculture 2025, 15, 367. [Google Scholar] [CrossRef]
- Lin, Y.; Li, S.; Duan, S.; Ye, Y.; Li, B.; Li, G.; Lyv, D.; Jin, L.; Bian, C.; Liu, J. Methodological evolution of potato yield prediction: a comprehensive review. Front. Plant Sci. 2023, 14, 1214006. [Google Scholar] [CrossRef] [PubMed]
- USDA. “2024 Washington State Agricultural Review”. USDA. 2025. Available online: https://www.nass.usda.gov/Quick_Stats/Ag_Overview/stateOverview.php?state=WASHINGTON.
- Fernandes, R. D. M.; Cuevas, M. V.; Diaz-Espejo, A.; Hernandez-Santana, V. Effects of water stress on fruit growth and water relations between fruits and leaves in a hedgerow olive orchard. Agric. Water Manag. 2018, 210, 32–40. [Google Scholar] [CrossRef]
- Dunkel, T.; Najdenovska, E.; Dutoit, F.; Whittaker, R.; Raileanu, L. E.; Camps, C. Novel fruit growers’ advisory system using connected fruit dendrometer, micro-climate data and machine learning algorithms. International Symposium on New Technologies for Sustainable Greenhouse Systems (GreenSys, 2023 1426; pp. 333–340. [Google Scholar]
- Fleisher, D. H.; Timlin, D. J.; Yang, Y.; Reddy, V. R. Simulation of potato gas exchange rates using SPUDSIM. Agric. For. Meteorol. 2010, 150, 432–42. [Google Scholar] [CrossRef]
- Nelson, S. H.; Hwang, K. E. Water usage by potato plants at different stages of growth. Am. Potato J. 1975, 52, 331–339. [Google Scholar] [CrossRef]
- Gonzalez, F. T.; Pavek, M. J.; Holden, Z. J.; Garza, R. Evaluating potato evapotranspiration and crop coefficients in the Columbia Basin of Washington state. Agric. Water Manag. 2023, 286, 108371. [Google Scholar] [CrossRef]
- Kunkel, R.; Gardner, W. H. Potato tuber hydration and its effect on blackspot of Russet Burbank potatoes in the Columbia Basin of Washington. Am. Potato J. 1965, 42, 109–124. [Google Scholar] [CrossRef]
- Hiller, L. K.; Pelter, G. Q. “Conditioning Potatoes for Harvest” 14th Annual Washington State Potato Conference and Trade Fair. Moses Lake, WA, 4 to 6 February 1975. [Google Scholar]
Figure 1.
Tuber sensor and field implementation. (A) The strain gauge C-clamp [7] model DEX100 (Dynamax Inc., Houston, TX, USA) on a potato tuber. (B) The sensor was placed on the cleaned upper surface of the tuber. The metal anvil contacts the cleaned tuber and is inserted through an approximately 3 cm-long black plastic pipe, flush with the tuber surface, pointing north. (C) The sensor on the buried tuber, except where the soil was blocked by the black plastic pipe. The square metal anvil is touching the potato inside the pipe, as shown in Figure 1A, and is positioned to measure the height dimension. (D) The equipment (Dynamax, Inc.) set up on July 9 included a solar panel, a 12-volt deep-cycle battery, an air temperature sensor inside the white data logger housing, and a data logger with a transmitter mounted on a tripod.
Figure 1.
Tuber sensor and field implementation. (A) The strain gauge C-clamp [7] model DEX100 (Dynamax Inc., Houston, TX, USA) on a potato tuber. (B) The sensor was placed on the cleaned upper surface of the tuber. The metal anvil contacts the cleaned tuber and is inserted through an approximately 3 cm-long black plastic pipe, flush with the tuber surface, pointing north. (C) The sensor on the buried tuber, except where the soil was blocked by the black plastic pipe. The square metal anvil is touching the potato inside the pipe, as shown in Figure 1A, and is positioned to measure the height dimension. (D) The equipment (Dynamax, Inc.) set up on July 9 included a solar panel, a 12-volt deep-cycle battery, an air temperature sensor inside the white data logger housing, and a data logger with a transmitter mounted on a tripod.
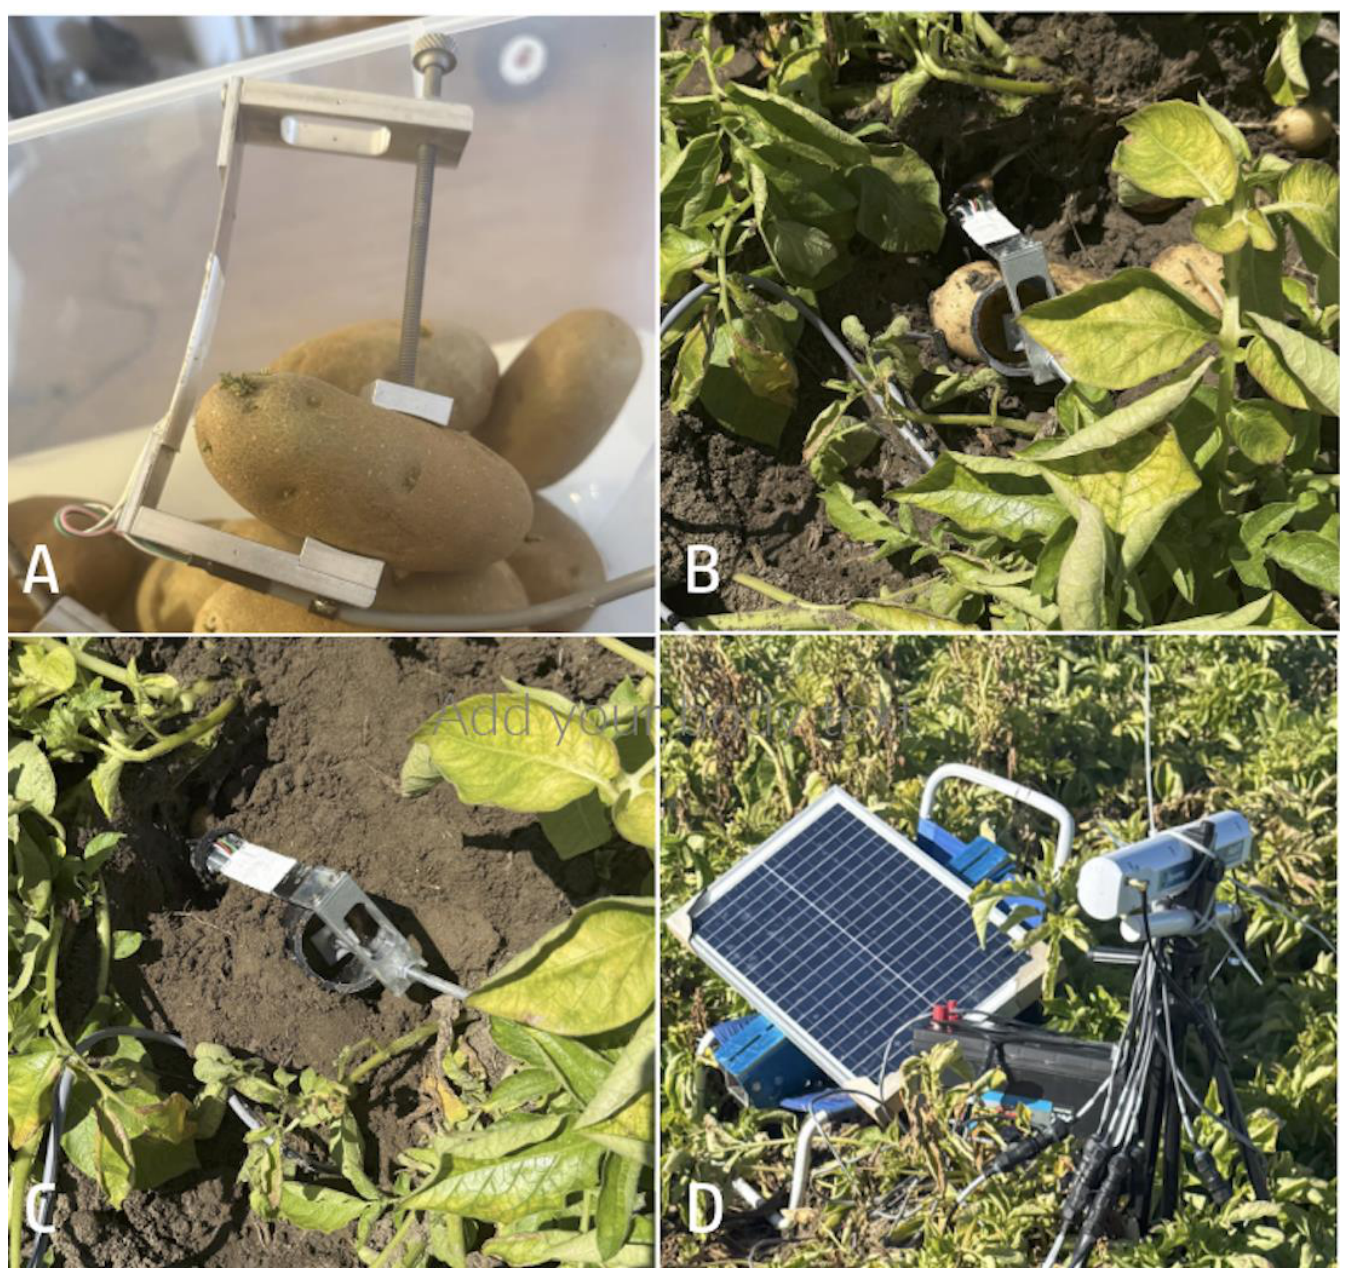
Figure 2.
The relationship (Eq. 1) between the apparent thickness (Sa) of a temperature-insensitive Invar bar and the sensor temperature.
Figure 2.
The relationship (Eq. 1) between the apparent thickness (Sa) of a temperature-insensitive Invar bar and the sensor temperature.
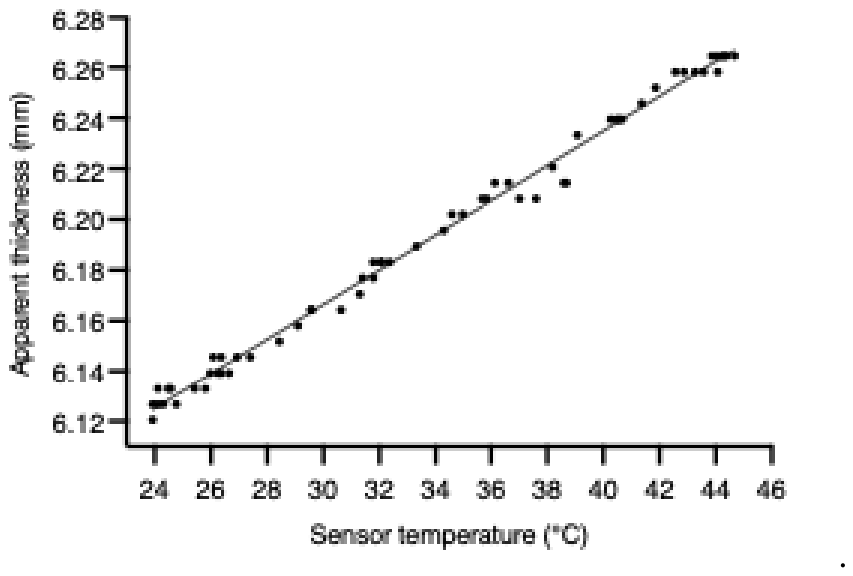
Figure 3.
Outlier removal. (A) The temperature-corrected tuber thickness changed from July 10 to 22. Note the periodic red points, which are aligned with irrigation applications in Figure 3B, and the green points, which were not associated with water. (B) The volumetric soil water content at the red points during irrigation corresponded to the red outliers in thickness change in Figure 3A. (C) The temperature-corrected change in tuber thickness from July 10 to 22, excluding outliers.
Figure 3.
Outlier removal. (A) The temperature-corrected tuber thickness changed from July 10 to 22. Note the periodic red points, which are aligned with irrigation applications in Figure 3B, and the green points, which were not associated with water. (B) The volumetric soil water content at the red points during irrigation corresponded to the red outliers in thickness change in Figure 3A. (C) The temperature-corrected change in tuber thickness from July 10 to 22, excluding outliers.
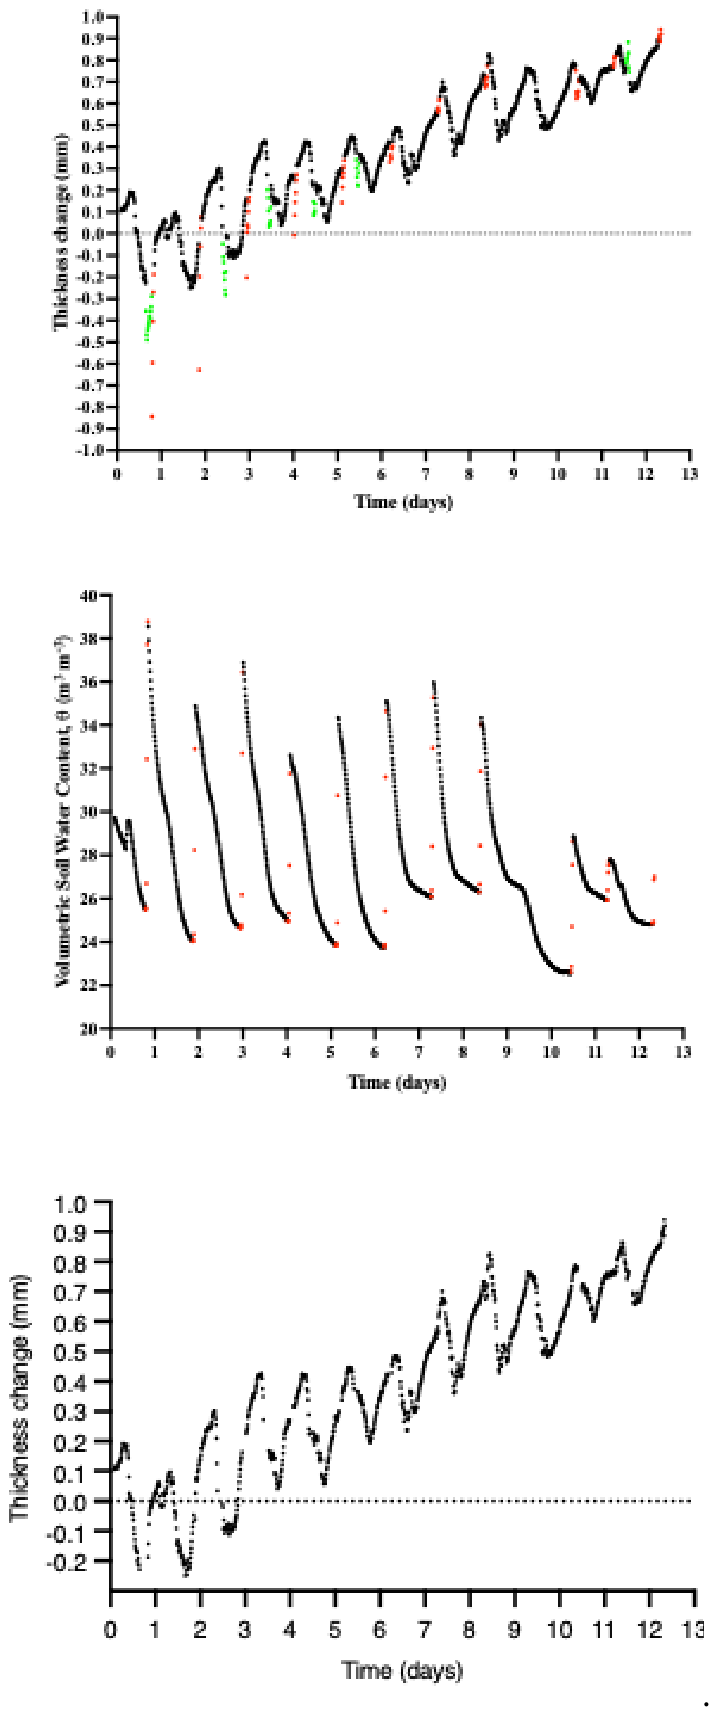
Figure 4.
Growth and diurnal residuals. (A) The mean daily thickness (height) increases from July 10 to 22, based on the data in Figure 3C. (B) The smoothing spline fit represents growth. (C) Residuals taken from the spline growth function in Figure 4B.
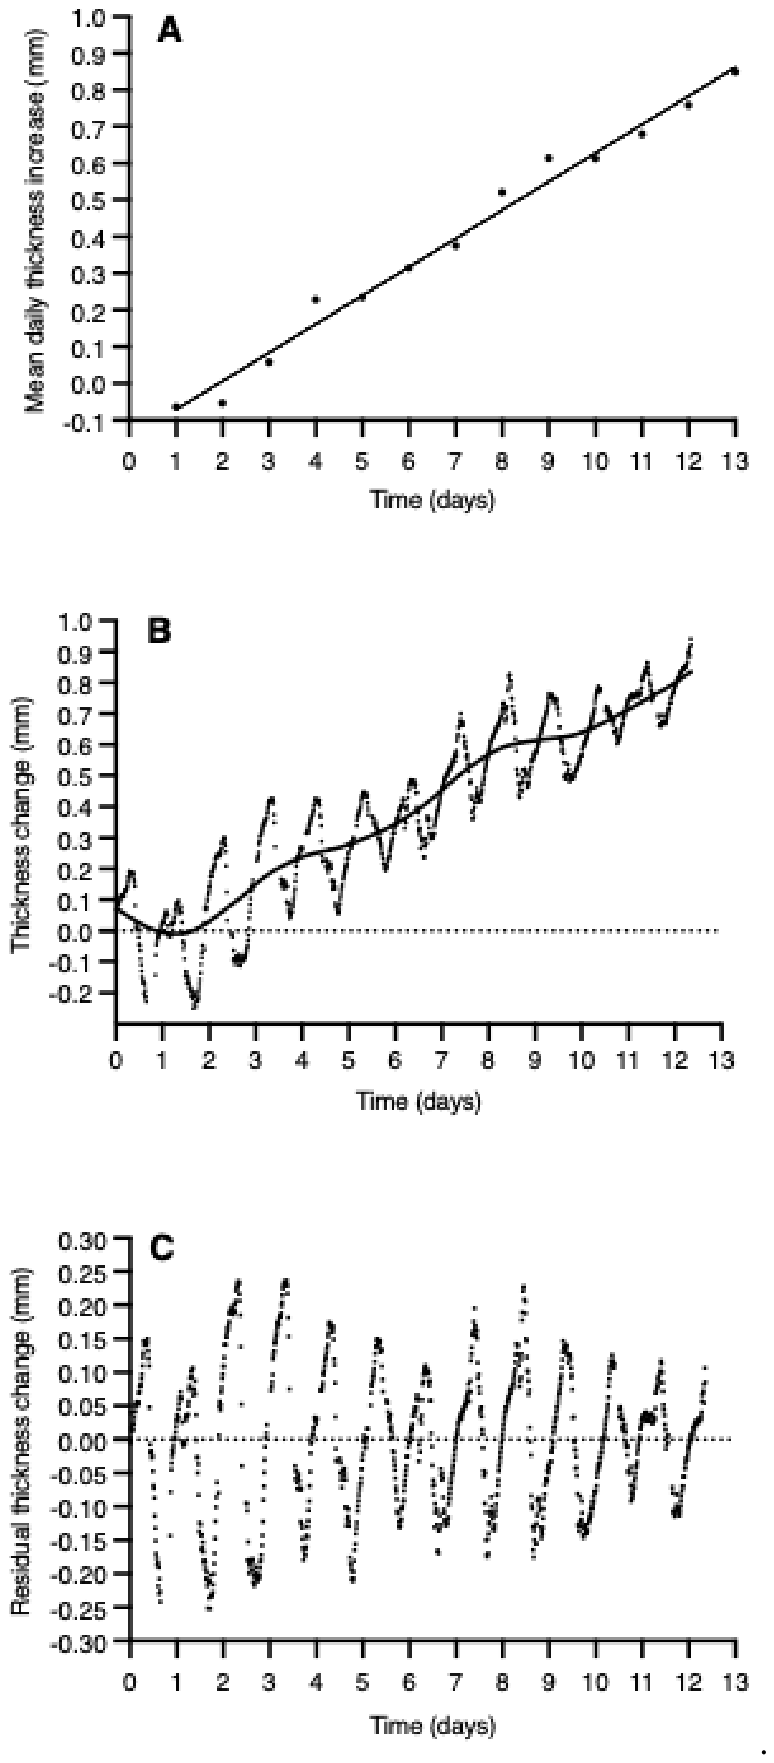
Figure 5.
Estimated daily transpiration. (A) The contribution to the daily rate by the test tuber. (B) Mean air temperature during the period of daily transpiration in Figure 5A. (C) The relationship between the estimated water loss or the contribution to daily whole plant transpiration from the test tuber and the mean air temperature. (D) The relationship between the estimated water loss or contribution to daily whole-plant transpiration from the test tuber and the estimated vapor pressure deficit derived from dew point records collected 8.8 km west of the site.
Figure 5.
Estimated daily transpiration. (A) The contribution to the daily rate by the test tuber. (B) Mean air temperature during the period of daily transpiration in Figure 5A. (C) The relationship between the estimated water loss or the contribution to daily whole plant transpiration from the test tuber and the mean air temperature. (D) The relationship between the estimated water loss or contribution to daily whole-plant transpiration from the test tuber and the estimated vapor pressure deficit derived from dew point records collected 8.8 km west of the site.
Disclaimer/Publisher’s Note: The statements, opinions and data contained in all publications are solely those of the individual author(s) and contributor(s) and not of MDPI and/or the editor(s). MDPI and/or the editor(s) disclaim responsibility for any injury to people or property resulting from any ideas, methods, instructions or products referred to in the content. |
© 2026 by the authors. Licensee MDPI, Basel, Switzerland. This article is an open access article distributed under the terms and conditions of the Creative Commons Attribution (CC BY) license (http://creativecommons.org/licenses/by/4.0/).
Copyright: This open access article is published under a Creative Commons CC BY 4.0 license, which permit the free download, distribution, and reuse, provided that the author and preprint are cited in any reuse.