

Submitted:
16 July 2026
Posted:
17 July 2026
You are already at the latest version
Abstract
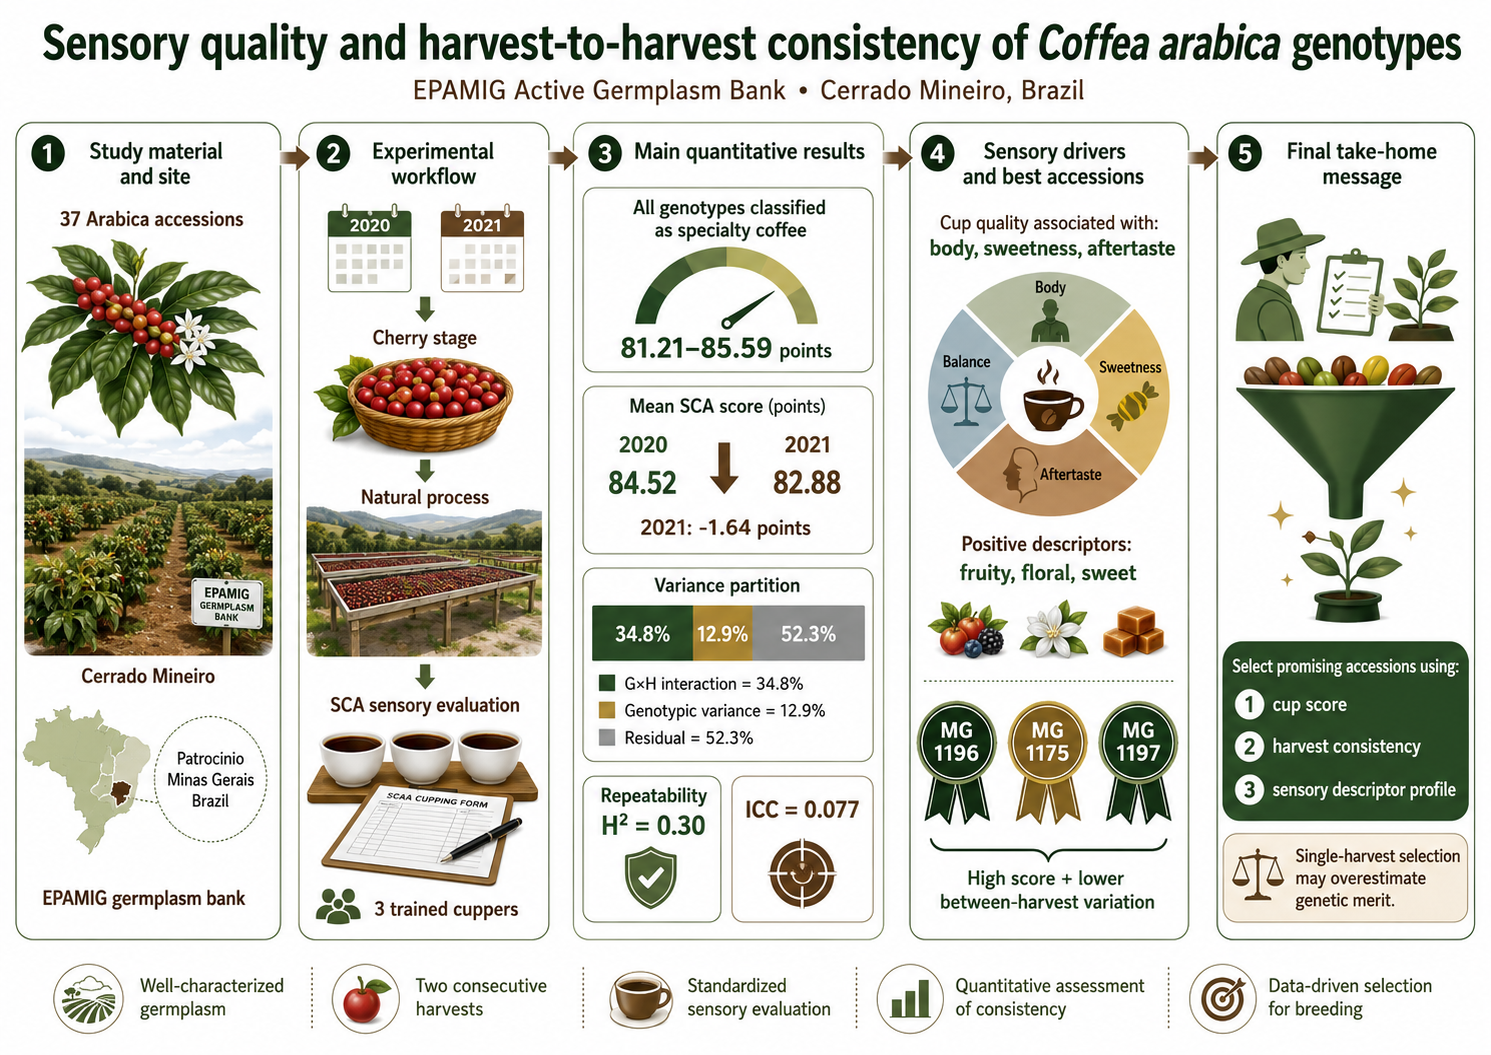
Identifying Coffea arabica genotypes that combine high cup quality and consistent sensory performance across harvests is essential to breeding programs targeting specialty coffee production. This study aimed to characterize the sensory quality of Coffea arabica genotypes and to assess their consistency across two consecutive harvests. Thirty-seven C. arabica accessions maintained in the EPAMIG Active Germplasm Bank, located in Patrocínio, Minas Gerais, Brazil, were evaluated during the 2020 and 2021 harvest seasons. Fruits were harvested at the cherry stage, dry-processed to obtain natural coffee, and sensorially evaluated according to the Specialty Coffee Association (SCA) protocol. Cup intensity attributes, final score, prevalence of aroma and flavor nuances, across-harvest agreement, principal component analysis, and Spearman correlation were assessed. Phenotypic data were further analyzed using a linear mixed model to estimate variance components, the genotype × harvest interaction, and repeatability. All genotypes scored above 80 points and were therefore classified as specialty coffees, ranging from 81.21 to 85.59 points. The genotype × harvest interaction was significant and exceeded the genotypic variance; consequently, the genotype effect was not significant when tested against the interaction mean square, resulting in low across-harvest repeatability (H2 = 0.30). Agreement analysis indicated a mean reduction of 1.64 point in 2021 relative to 2020, with wide limits of agreement (−4.70 to 1.44 points) and a low, non-significant intraclass correlation coefficient (ICC = 0.077), evidencing the harvest effect on sensory quality. Despite the overall low agreement between harvests, accessions MG 1196, MG 1175, and MG 1197 combined high final scores with the smallest variation between the two harvests. Multivariate analysis indicated that cup quality was more closely associated with body, sweetness, and aftertaste. The fruity, floral, and sweet nuances showed positive correlations with the final score. Taken together, these findings suggest that selecting promising coffee accessions should simultaneously consider overall cup quality, harvest-to-harvest consistency, and the frequency of key sensory descriptors.
Keywords:
Germplasm bank
; genotype × harvest interaction
; cup quality
; plant breeding
1. Introduction
Brazil is the world’s largest producer and exporter of Coffea arabica (Amrouk et al., 2025). National production of this species estimated for 2026 is 44.1 million bags, an increase of 23.3% relative to the previous harvest, attributed to the expansion of the bearing area, more favorable climatic conditions, and positive biennial bearing (Companhia Nacional de Abastecimento – CONAB, 2026). In Brazil, arabica coffee cultivation accounts for 81% of the total national coffee-growing area, with the highest concentration of this species in the state of Minas Gerais, corresponding to 75.1% of the national arabica area (CONAB, 2026).
According to the Specialty Coffee Report of the National Coffee Association of the U.S.A., demand for specialty coffees has increased by 84% since 2011, surpassing the consumption of traditional coffee (International Coffee Organization – ICO, 2024; National Coffee Association of U.S.A – NCA, 2025). This growing consumer interest in specialty coffees has been driven by factors such as increased demand for high-quality coffees from specific origins, the emergence of new marketing strategies for coffee-based beverages, greater sensitivity to environmental sustainability, and the challenges and vulnerabilities faced by coffee growers (Sera et al., 2025).
Specialty coffees refer to beverages of superior quality, characterized by beans free of impurities and defects, with distinct sensory characteristics and scores above 80 points (Silva et al., 2024). The quality of specialty C. arabica beans is influenced by genetic factors, environment, cultivation practices, pest and disease control, the microbiota present at the site, harvesting methods, post-harvest treatments, and storage (Sera et al., 2025).
In this study, natural processing was used, a method in which fruits are dried whole and which may favor greater body and the expression of sweet and fruity descriptors in the cup, owing to the biochemical transformations occurring during drying and to the retention of the mucilage surrounding the beans (Hameed et al., 2018; Cao et al., 2023). In the Cerrado Mineiro region, natural processing is favored by the relatively dry conditions during the harvesting and drying period and is widely employed in the production of coffees with greater body and expression of sweet and fruity descriptors.
This region is recognized for its coffee origin certification (“Indication of Origin”) owing to its unique climate and geographic characteristics (Sabio; Spers, 2020). More specifically, the Active Germplasm Bank (AGB) of the Agricultural Research Agency of Minas Gerais (EPAMIG) is in the municipality of Patrocínio, Minas Gerais, holding a collection of more than 1.500 C. arabica accessions. The sensory characterization of these accessions is of great importance for identifying the most promising genotypes for specialty coffee production. This meets consumer preferences and the growing demand for high-quality coffees (Freitas et al., 2024), contributing to the improvement of consumption habits (da Silva et al., 2023), while also representing a source of income for many coffee growers and entrepreneurs (Sera et al., 2025).
Another aspect related to specialty coffee production is its higher valuation, since price is influenced by the cup classification (Ferreira et al., 2023). Sensory experience remains the main parameter for assessing the quality of specialty coffees (Velásquez; Banchón, 2023), and the method developed by the Specialty Coffee Association (SCA) is widely used (Ferreira et al., 2023). Certified Q-graders evaluate the attributes fragrance/aroma, uniformity, clean cup, sweetness, flavor, acidity, body, aftertaste, balance, defects, and overall impression (SCA, 2015).
Although several studies have characterized the sensory quality of arabica coffee cultivars, comparatively few have simultaneously investigated cup quality, descriptive sensory profiles, and harvest-to-harvest consistency within active germplasm collections. This knowledge gap limits the identification of genotypes capable of consistently expressing superior beverage quality under contrasting harvest conditions.
Therefore, this study aimed to characterize the sensory quality of C. arabica accessions maintained in the EPAMIG Active Germplasm Bank and to evaluate their harvest-to-harvest consistency using complementary univariate, multivariate, and mixed-model approaches, seeking to identify genotypes with greater potential for use in breeding programs related to specialty coffee production.
2. Materials and Methods
2.1. Experimental Site
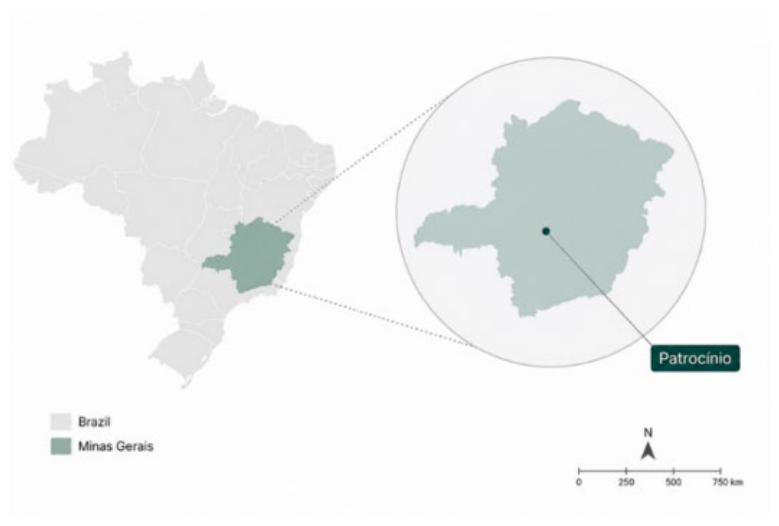
The Active Germplasm Bank of Coffee of the State of Minas Gerais, belonging to the Agricultural Research Agency of Minas Gerais (EPAMIG), is established at the Patrocínio Experimental Farm, located in the Alto Paranaíba region (18°59’26” S, 48°58’9.5” W, 975 m altitude). The soil is classified as a dystrophic Red-Yellow Latosol. The topography of the germplasm bank area is flat, with a slight slope. The climate of the municipality of Patrocínio is classified as subtropical mesothermal, with rainy summers, dry winters, and hot summers (Cwa), according to the Köppen classification.
Figure 1.
Patrocínio, a coffee-producing municipality located in the Alto Paranaíba region, Minas Gerais, Brazil, where the fruits were harvested at the Active Germplasm Bank (AGB) of EPAMIG.
Figure 1.
Patrocínio, a coffee-producing municipality located in the Alto Paranaíba region, Minas Gerais, Brazil, where the fruits were harvested at the Active Germplasm Bank (AGB) of EPAMIG.
2.2. Harvesting, Processing, Drying, and Storage of Coffee Samples
Coffee was harvested between June and July of 2020 and 2021, when most fruits had reached the cherry (ripe) maturation stage. Fruits were harvested by manual stripping onto cloth, and any impurities, green fruits, and lower-density fruits (“floaters”) were removed. Dry processing was used to obtain natural coffee, and fruits were dried on suspended screen-bottom trays and periodically turned until reaching approximately 12% moisture content (w.b.).
The same C. arabica genotypes were harvested in two consecutive years (2020 and 2021 harvests) (Table 1). The field experiment followed a randomized complete block design consisting of 37 coffee accessions, two field replicates, and ten plants per experimental plot. Fully ripe cherries were manually harvested from each plot, pooled, and processed as a single experimental sample.
After the dried cherry coffee samples reached the target moisture content, they were stored in a cold chamber at 18 °C for approximately 60 days to homogenize the moisture content. Samples were hulled and prepared at the Coffee Quality Laboratory located at the EPAMIG Experimental Field in Lavras, MG, Brazil.
2.3. Sensory Analysis
For the sensory analysis, only flat beans retained on screen 16/64” and above, free of intrinsic and extrinsic defects, were used, to eliminate possible interferences unrelated to the genetic material. Samples were coded with random three-digit numbers and presented in randomized order to avoid positional bias. Each assessor evaluated all experimental samples independently under controlled sensory laboratory conditions.
Sensory evaluation was performed by three trained cuppers with previous experience in specialty coffee evaluation, according to the protocol established by the Specialty Coffee Association – SCA (Lingle, 2011), with results analyzed for each genotype per harvest. On a 0-to-10-point scale, the following sensory attributes were evaluated: fragrance/aroma, uniformity, clean cup, sweetness, acidity, flavor, body, aftertaste, balance, and overall impression. The final score corresponded to the arithmetic mean of the three assessors for each experimental plot. The aroma and flavor nuances of the samples were also assessed.
For the statistical analyses, the intensity attributes showing variation among genotypes (acidity, body, sweetness, and aftertaste) and the final score were considered. The remaining SCA protocol attributes (uniformity, clean cup, balance, and overall impression) showed constant or negligibly variable scores among samples — an expected feature in defect-free specialty coffees — and were therefore not included in the multivariate analyses.
2.4. Data Analysis
Analyses were based on the sensory panel evaluations (three cuppers) of each of the 37 C. arabica genotypes common to the 2020 and 2021 harvests. The plot mean, obtained as the average of the three cuppers within each field block, was used as the observational unit. The final cup score, the intensity attributes (acidity, body, sweetness, and aftertaste), and the aroma and flavor nuances were considered. Aroma and flavor nuances were recorded by each cupper as present or absent in each sample. For each genotype and each nuance, the detection frequency was calculated, defined as the number of positive records accumulated across cuppers, blocks, and harvests. Absence of detection was coded as zero. This detection frequency was the variable used both in describing nuance prevalence and in the Spearman correlation with the final score.
The complete structure comprised 148 plots (37 genotypes × 2 harvests × 2 blocks). Nine plots had no final score recorded in the original cupping forms, resulting in 139 valid plots for the analysis of the final score. The missing plots were concentrated in the first block of the 2021 harvest and were treated as missing data, without imputation.
A linear mixed model was fitted to the final score, with harvest as a fixed effect and genotype, genotype × harvest interaction, and block within harvest as random effects. Given the reduced structure of the design (two environments), variance components were estimated from the expected mean squares of the analysis of variance. The significance of the genotype × harvest interaction was assessed by an F test over the residual mean square; because genotype and the interaction are random effects, the genotype effect was tested using the genotype × harvest interaction mean square as the denominator. Repeatability on a genotype-mean basis was obtained as:
where a = 2 harvests and r = 2 blocks per harvest. Genotypic predictions (BLUP) were obtained by shrinking the genotype means toward the overall mean in proportion to the repeatability, as BLUPi = μ + H2(ȳi − μ), and were used to rank the accessions.
H2 = 2²g / [2σ²g 2 σ²gh/a2+ σ²e/(a·r)]
Across-harvest agreement was assessed by the absolute-agreement intraclass correlation coefficient (two-way model) and by a Bland–Altman plot, with mean bias and 95% limits of agreement. Agreement among cuppers was assessed by the absolute-agreement intraclass correlation coefficient (two-way random-effects model), computed over samples (genotype × harvest × block), complemented by the mean standard deviation among cuppers within each sample. For nuance prevalence, each descriptor was analyzed with respect to the proportion of cuppers detecting it and to its mean detection frequency. Principal Component Analysis (PCA) was performed on the intensity attributes; the final score was projected as a supplementary quantitative variable. The Spearman correlation between the final score and the nuance descriptors was calculated with absence of nuance set to zero and with Benjamini–Hochberg adjustment for multiple comparisons.
Statistical analyses were conducted in R 4.5.0 and Python 3.13. The mixed model and the analysis of variance were performed with the lme4 and stats packages, with variance components estimated from the expected mean squares as described above. Intraclass correlation coefficients were obtained with the psych package. Figures were generated in Python (matplotlib).
3. Results
In this study, the cup quality of 37 C. arabica genotypes was evaluated over the 2020 and 2021 harvests at the AGB located in Patrocínio, MG. The mean final cup scores of these genotypes ranged from 81.21 (Poliatrofica – MG 0236) to 85.59 points (Planta 1 do A. J. Favoreto – MG 1196), all being classified as specialty coffees (Table S1). The overall mean was 84.17 points in 2020 and 82.53 points in 2021, corresponding to a mean reduction of 1.64 point in the 2021 harvest.
The mixed model indicated a highly significant harvest effect and a significant genotype × harvest interaction (F = 2.33; p = 0.002). The decomposition of the phenotypic variance (Table S2) showed that the genotype × harvest interaction (34.8%) exceeded the genotypic variance (12.9%), whereas the largest fraction corresponded to the plot residual (52.3%). The block-within-harvest component was negligible (F = 0.41; p = 0.75). When tested against the genotype × harvest interaction mean square, the genotype effect was not significant (F = 1.42; p = 0.15), indicating that the differentiation among genotypes was not consistently sustained given the magnitude of the interaction with harvest. Consequently, repeatability on a genotype-mean basis was low (H2 = 0.30), indicating that approximately 30% of the variation among genotype means is repeatable across the evaluated harvests.
Consistent with the low repeatability, the genotypic predictions (BLUP) showed marked shrinkage toward the overall mean (μ = 83.35 points). Whereas the observed mean scores ranged from 81.21 to 85.58 points (a range of 4.37 points), the BLUPs ranged from 82.71 to 84.02 points (a range of 1.31 point), corresponding to a reduction of approximately 70% in the range among accessions (Table S1). The extreme accessions remained among the upper and lower positions, although the predicted differences were substantially reduced. The highest values were observed for MG 1196 (BLUP = 84.02) and MG 1177 (BLUP = 83.92), and the lowest for MG 0236 (BLUP = 82.71) and MG 0202 (BLUP = 82.84). This result reinforces that, with only two harvests, the differences observed among genotype means overestimate genetic merit and should be interpreted with caution.
The final cup score revealed sensory variation among the evaluated genetic classes (Figure S1). The Exotic class showed the widest score range, including the genotypes with the lowest and highest scores of the analyzed dataset. This result indicates high sensory heterogeneity within the class, consistent with the genetic diversity of the accessions classified in this group. The Timor Hybrid Derivatives (THD) class showed intermediate scores, with lower dispersion compared to the Exotic class, suggesting greater homogeneity among the evaluated genotypes. The IPR class included one accession with a high final cup score, IPR 99 (MG 1177), although the low number of evaluated accessions (n = 3) limits inferences about the behavior of the class.
The Bourbon group genotypes (Figure S1) showed mean scores concentrated in the intermediate-to-high range, with moderate dispersion. Although this class is frequently associated with superior cup quality, the results indicate that variation occurred among accessions, without a predominance of the highest values. The Mundo Novo accessions were concentrated in the lower final score ranges of the evaluated set.
A comparative analysis of the intensity attributes (acidity, body, sweetness, and aftertaste) and the final cup score was performed between the 2020 and 2021 harvests (Figure 2). Overall, the plot shows a mean reduction in the scores of all attributes in 2021, particularly for sweetness and aftertaste. Individual lines indicate that some genotypes followed the opposite trend, that is, they increased their scores or maintained similar results for sensory attributes.
The agreement analysis by the Bland–Altman plot (Figure S2) indicated a bias of −1.64 point, confirming that the final scores were, on average, lower in 2021. The 95% limits of agreement ranged from −4.70 to 1.44 points, evidencing wide individual variation between years. The absolute-agreement intraclass correlation coefficient was low and non-significant (ICC = 0.077; F(36,36) = 1.34; p = 0.19), reinforcing the reduced agreement between harvests.
Agreement among cuppers within each sample was adequate. The mean standard deviation among the three cuppers within the same sample was 0.86 point, and the absolute-agreement intraclass correlation coefficient of the panel mean was 0.86 (0.69 for a single cupper). These results suggest that the low across-harvest agreement did not arise predominantly from a lack of panel agreement, but mainly from the harvest effect and the genotype × harvest interaction.
Overall, these across-harvest agreement results suggest that the genotypes do not exhibit high sensory stability. Accordingly, stability was analyzed without assuming a homogeneous set, through an individual analysis of the genotypes (Figure 3). The upper-left region of the plot indicates the genotypes with the greatest sensory potential, such as MG 1197 and MG 1175, since it combines the highest cup scores with low variation in scores between harvests. The genotypes falling within this condition showed scores above 84 points and a difference between harvests below 1.0 point. The most outstanding accession is MG 1196, whose final score exceeded 85 points, also with variation below 1.0 point between the two evaluated years.
The accessions MG 1185, MG 1128, MG 0594, MG 0145, MG 0124, and MG 1177 also showed final scores above 84 points, but variation above 1.0 point between years (Figure 3). The remaining accessions showed means below 84 points but were nonetheless considered specialty coffees. These accessions demonstrated sensory potential; however, they showed intermediate stability (difference between 1.0 and 2.0 points) or reduced stability (difference > 2.0 points).
A Principal Component Analysis (PCA) was applied to the intensity attributes (acidity, body, sweetness, and aftertaste), with the final score subsequently projected as a supplementary variable (Figure 4). The PCA explained 98.2% of the total data variability in the first two components, with the difference among samples expressed mainly by PC1 (95.5%). It should be noted that a structural dependency exists between the intensity attributes and the final score, since the four attributes arithmetically compose the SCA score. Therefore, the high variance concentrated in PC1 partly reflects the construction of the scale itself, and the observed associations should not be interpreted as independent evidence. PC1 expresses overall cup quality, with the highest final score being positively associated with the attributes sweetness, body, and aftertaste (Figure 4). The variable acidity contributed to the separation of samples along PC2, showing a weaker association with the final score. These results suggest that the highest-scoring coffees were more closely associated with higher body, sweetness, and aftertaste scores than with higher acidity intensity.
Samples were grouped according to genetic class (Figure 4). The extensive overlap among the class ellipses indicates the absence of a clear separation among groups, suggesting that genotypes of different genetic origins may present similar sensory profiles. Exotic was the class with the greatest dispersion along PC1, indicating high heterogeneity in the attributes sweetness, body, and aftertaste, and the presence of genotypes with lower or higher association with these attributes. In contrast, the Bourbon class showed high dispersion among samples mainly with respect to PC2, indicating variation among samples associated with acidity (Figure 4).
The Mundo Novo class is located predominantly in the negative region of PC1 (Figure 4), opposite to the direction of the final score, body, sweetness, and aftertaste, suggesting a weaker association with the attributes that most contributed to sensory quality. The THD class is positioned in the intermediate region of the PCA, overlapping with the other classes, demonstrating variable sensory profiles. The IPR class, in turn, with n = 3 — a low number of genotypes — was not represented by an ellipse. The sensory profile of the IPR group is also distinct, comprising: one genotype with a weaker association with the attributes that most contributed to sensory quality, one genotype with an intermediate result, and another genotype with a stronger association with cup quality attributes.
The mean detection frequencies of the aroma and flavor nuances (fermented, spicy, floral, fruity, nutty, chocolate, and sweet) are represented in the forest plot (Figure S3). The nuances showed distinct profiles between aroma and flavor. For the aroma attribute, the sweet and chocolate nuances showed the highest frequencies and were detected in all evaluated genotypes. The fermented nuance showed the lowest frequency, followed by spicy and floral. The remaining nuances, fruity and nutty, showed intermediate values and were detected in all genotypes.
The sweet and chocolate nuances also showed the highest mean detection frequencies for the flavor attribute (Figure S3) and were detected in all genotypes. Fruity was another nuance with high frequency and wide occurrence, indicating greater expression of this characteristic in flavor compared to aroma. As observed for the aroma attribute, the nutty nuance showed an intermediate value, whereas floral, spicy, and fermented showed lower frequencies. The fermented nuance was observed in only two genotypes for aroma and in three genotypes for flavor, indicating the low representativeness of this nuance in the evaluated set.
A Spearman correlation analysis was performed between the final cup score and the nuances (spicy, floral, fruity, nutty, chocolate, and sweet) of the aroma and flavor attributes of the 37 C. arabica genotypes (Figure 5). The fermented nuance was removed from this analysis owing to its low prevalence, having been detected in only two genotypes for aroma and three for flavor.
The highest positive correlations with the final cup score (Figure 5) were found for fruity (ρ = 0.73) and floral (ρ = 0.49) in the aroma attribute, as well as fruity (ρ = 0.83), floral (ρ = 0.68), and sweet (ρ = 0.71) in the flavor attribute. These results indicate that genotypes with higher detection frequencies of the fruity, floral, and sweet nuances tend to show higher final cup scores. Conversely, the chocolate nuance in the aroma attribute showed a negative correlation with the final cup score (ρ = −0.53), suggesting that higher frequencies of this nuance are associated with lower final cup scores.
Positive correlations between equivalent aroma and flavor nuances (Figure 5) were observed, notably for spicy (ρ = 0.50) and floral (ρ = 0.77). These results suggest a positive association between aromatic and gustatory perception for the mentioned nuances. Positive correlations among different sensory nuances were also observed. In the aroma attribute, floral correlated with spicy and fruity in the flavor attribute; fruity (aroma) correlated with sweet, spicy, and floral (flavor). This suggests coffees with a more complex profile, described as the combination of the floral, fruity, sweet, and spicy nuances. Correlations were assessed with Benjamini–Hochberg correction for multiple comparisons; all highlighted associations remained significant (FDR-adjusted p < 0.05), except for spicy in the aroma.
4. Discussion
The C. arabica genotypes evaluated in this study showed final cup scores ranging from 81.21 to 85.59 points, all being classified as specialty coffees. These coffees are characterized by a minimum final score of 80 points, absence of cup defects, differentiated quality, and high potential for aroma and flavor expression (Cardoso et al., 2021). These results demonstrate the sensory potential of the accessions evaluated at the EPAMIG AGB and reinforce the importance of germplasm characterization for identifying genotypes with superior cup quality.
The main Brazilian cultivars are classified as regular or differentiated based on sensory analyses and on their genetic potential for specialty coffees (Carvalho et al., 2022). Nevertheless, cultivars with these classifications may yield excellent cups when subjected to adequate management, harvesting, and post-harvest conditions (Sera et al., 2025). Phenotypic differences were observed among the accessions, but these differences were not consistently maintained between the two harvests. In addition, pre- and post-harvest conditions, including natural processing, may have positively influenced the sensory scores obtained.
The geographic location of the coffee plantation has been used as a reference for final cup quality (Pereira et al., 2021). The region used in this study is the Cerrado Mineiro, recognized by consumers as “Cerrado coffee”, a differentiating characteristic relative to other coffees considered standard (Sabio; Spers, 2020). Thus, the combination of geographic origin, genetic material, and post-harvest processing may have contributed to the sensory expression of the evaluated genotypes.
The analysis of sensory stability and its relationship with cup quality is important for the selection of genotypes in breeding programs that consider sensory predictability. Overall, the genotypes received scores 1.64 point lower in 2021 relative to 2020, indicating that the cup score was influenced by the harvest effect. Furthermore, the variance decomposition showed that the genotype × harvest interaction (34.8% of the variance) exceeded the genotypic variance (12.9%), resulting in low across-harvest repeatability (H2 = 0.30). When tested against the interaction mean square, the genotype effect was not significant, reinforcing that the differentiation among accessions was not consistently sustained between the two years. The wide limits of agreement observed between harvests reinforce the need for validation across more harvests or environments. It is worth noting that the plot residual represented the largest single fraction of the variance (52.3%), corresponding to variation among field plots and to the variability inherent to sensory evaluation. Given that panel agreement was adequate, this fraction partly reflects field variation, which reinforces the recommendation to increase the number of replicates in future evaluations.
These results are based on two consecutive harvests at a single site. With two environments, the genotype × harvest interaction is estimable but cannot be fully separated from non-repeatable fluctuations, and formal stability statistics (for example, AMMI or GGE) cannot be applied. Therefore, the stability ranking presented here should be interpreted as a preliminary screening, to be validated across a greater number of harvests and environments before definitive selection decisions.
These results demonstrate that the selection of the most promising genotypes should consider not only the final cup score but also the across-harvest stability. In this context, accession MG 1196 stood out by combining the highest final score (85.59 points) with the smallest difference observed between the two harvests (a difference of only 0.16 point), followed by MG 1175 and MG 1197, both with a final score of 84.13 points and a difference below 0.1 point between years. These accessions are promising for further studies and for breeding programs related to specialty coffee production.
Conversely, the accessions MG 1177 (IPR 99), MG 0124, MG 0145, MG 0594, MG 1185, and MG 1128, despite showing final scores close to or above 84 points, demonstrated intermediate or low stability, with a difference above 1.0 point between harvests. Accession MG 1177, in particular, showed the second-highest mean final score (85.25 points) but the largest reduction between harvests (3.33 points), illustrating that a high score in one harvest does not guarantee temporal stability.
Based on the genetic origins of the coffee genotypes and on the PCA of the intensity attributes (acidity, body, sweetness, and aftertaste), there was partial separation and extensive overlap among the Bourbon, Exotic, THD, IPR, and Mundo Novo classes. This overlap suggests that sensory variation exists within each group and that genotypes of different genetic origins may present similar sensory profiles. Thus, genetic classification alone was not sufficient to fully explain cup quality.
The Mundo Novo and Bourbon cultivars are widely planted in Brazil, with yellow-fruited Bourbon cultivars being preferred for cultivation on farms affiliated with the Brazilian Association of Specialty Coffees – BSCA (Sera et al., 2025). Regarding cup quality, Mundo Novo cultivars are reported as having good or reasonable cup quality (Barbosa et al., 2020; Carvalho et al., 2022; Matiello et al., 2020; World Coffee Research – WCR, 2026), whereas Bourbon genotypes show very good (Matiello et al., 2020; WCR, 2026), differentiated (Carvalho et al., 2022), or excellent cup quality, being among those preferred in the international market owing to their desirable aroma and flavor attributes (Fazuoli et al., 2007).
In the present study, the Bourbon genotypes showed sensory variation among accessions, whereas the Mundo Novo class was concentrated in lower final score ranges. The Exotic class showed greater dispersion, evidencing high sensory heterogeneity, which is consistent with the genetic diversity of the accessions classified in this group. The THD class occupied an intermediate position in the PCA and overlapped with other classes, demonstrating variable sensory profiles. The IPR class included one accession with a high final score – IPR 99 (MG 1177).
High-quality coffees are usually derived from C. arabica, such as Typica and Bourbon (Sera et al., 2025), whereas arabica coffee genotypes with introgression of C. canephora genes may display undesirable characteristics (Eskes; Leroy, 2004). However, some genotypes with C. canephora introgression are classified as differentiated (Carvalho et al., 2022). Examples of genotypes analyzed in this study carrying C. canephora in their crosses and with good cup quality are those originating from Timor Hybrid germplasm, such as Sarchimor and Catimor, in addition to Icatu derivatives, such as the IPR class.
Interestingly, the cultivar IPR 99 showed a higher final score than cultivars traditionally recognized for their superior cup quality, such as Bourbon and Mundo Novo. IPR 99 results from the cross between ‘Villa Sarchi’, CIFC 971/10, and Timor Hybrid CIFC 832/2, with probable spontaneous hybridization with ‘Catuaí Amarelo’ (Carvalho et al., 2022).
In addition to genotypes with introgression of C. canephora genes showing good cup quality, as verified in this study, they are resistant to diseases, mainly to coffee leaf rust (Carvalho et al., 2022; Sera et al., 2022; Sera et al., 2013; Silva et al., 2006). Other studies have reported that these hybrid genotypes, besides excellent cup quality, show high yield (Salojärvi et al., 2024; Sera et al., 2013). These factors favor cultivation, the attainment of certifications, and the reduction of production costs, potentially increasing the profitability and sustainability of coffee plantations (Sera et al., 2025).
The overlap among genetic classes suggests that sensory variation exists within each group. These results demonstrate that similar cup scores may offer distinct sensory profiles, providing a diversity of flavors according to consumer preferences (Silva et al., 2024). This indicates that each genotype may present unique characteristics, with genetics being a factor influencing final cup quality (Hall et al., 2022; Scholz et al., 2018).
For the aroma and flavor attributes, the sweet and chocolate nuances showed the highest frequencies, as did the fruity nuance for the flavor attribute. Aromas derive mainly from coffee volatile organic compounds produced during post-harvest and roasting (Cao et al., 2023). More specifically, during natural fermentation processes, the mucilage surrounding the coffee bean is used as a substrate by microorganisms, converting complex polymers such as polysaccharides, proteins, fatty acids, and phenolic acids into simple molecules such as sugars and amino acids. These compounds give rise to volatile compounds through the Maillard reaction and oxidation mechanisms (Tang et al., 2021), thus conferring a diversity of coffee aromas (Cardoso et al., 2023).
Flavor results from the integration of the retronasal perception of volatile compounds, gustatory stimuli, and trigeminal sensations (Stevenson, 2012; Sunarharum et al., 2014). Maillard and caramelization reactions are essential for a diversity of desirable sensory characteristics in the final beverage, ranging from fruity and floral notes to chocolate, caramel, and nutty flavors (Sruthi et al., 2021). The dry processing used in this study may have favored the expression of sweet and fruity notes and greater body. This is because this processing confers on the coffee a relatively higher aldehyde content compared to wet processing, with a fruity flavor and a more intense body in the coffee beverage, where the different aldehydes may be generated from mucilage residues (Hameed et al., 2018).
The Spearman correlation between the final cup score and the nuances of the aroma and flavor attributes of the C. arabica genotypes showed that coffees with higher floral, fruity, and sweet scores tend to present higher final cup scores, indicating that sensory quality results from the combination of positive descriptors rather than from a single nuance. Sensory quality results from the interaction among several descriptors (Nascimento et al., 2024). According to these authors, notes such as chocolate, caramel, and nutty are common in specialty coffees, but coffees with higher added value frequently show simultaneously a higher frequency of floral and fruity descriptors, associated with greater sensory complexity.
A moderate negative correlation was observed between the frequency of the chocolate nuance in the aroma and the final cup score (ρ = −0.53), indicating that, in the evaluated sample set, coffees with a higher frequency of this descriptor tended to show lower final scores. This result, however, does not indicate that the chocolate note constitutes an undesirable sensory attribute. Indeed, descriptors such as chocolate, cocoa, and nutty are frequently found in high-quality specialty coffees. In the present study, however, the chocolate aroma showed a negative correlation with the sweet aroma and with the fruity flavor, attributes widely recognized as important for obtaining higher scores in specialty coffee evaluation protocols. Thus, the negative association between chocolate and the final score probably reflects a less complex sensory profile, in which the predominance of chocolate notes occurred concomitantly with a lower frequency of sweet and fruity attributes, considered highly desirable by cuppers. Therefore, the observed correlation should be interpreted as a specific characteristic of the analyzed sample set and not as a negative effect inherent to the chocolate nuance (Freitas et al., 2024).
The results of this study showed that all C. arabica genotypes were classified as specialty coffees. High sensory scores combined with desirable nuances are of interest to breeding programs and to coffee growers aiming to obtain differentiated micro- or nanolots of specialty coffees. This is also in line with the interest of coffee shops, which seek exclusive microlot varieties (Boaventura et al., 2018). Disclosing information on the quality of specialty coffees and on the roast type, for example, allows consumers to perceive attributes that differentiate these coffees from those considered regular, favoring the acceptance of specialty coffees (Bemfeito et al., 2021).
Thus, the results of this work demonstrate that the sensory characterization of AGB accessions should simultaneously consider the final cup score, the across-harvest stability, and the sensory nuance profile. This approach makes it possible to identify genotypes with greater potential for breeding programs aimed at specialty coffee production, as well as for obtaining differentiated lots with higher added value. Disclosing the characteristics present in specialty coffees may be used as a marketing strategy by industries to increase sales of these products and/or to optimize consumers’ sensory experience with the beverage (Bemfeito et al., 2021).
5. Conclusions
The 37 C. arabica genotypes showed final scores above 80 points, confirming the sensory potential of the germplasm bank. However, the genotype × harvest interaction exceeded the genotypic variance and across-harvest repeatability was low (H2 = 0.30), demonstrating that cup quality was strongly influenced by the harvest effect and reinforcing the need to consider temporal stability as a criterion complementary to the mean score.
Among the evaluated accessions, MG 1196 stood out by combining the highest final cup score with low variation between harvests, followed by MG 1175 and MG 1197. Superior cup quality was associated mainly with the attributes body, sweetness, and aftertaste. The fruity, floral, and sweet nuances showed a positive association with the final cup score, indicating that sensory quality results from the combination of multiple descriptors rather than from a single characteristic.
The accessions with greater potential for specialty coffees may be prioritized in further studies for validation across different environments, with a greater number of harvests and with chemical characterization of compounds associated with cup quality.
Supplementary Materials
The following supporting information can be downloaded at the website of this paper posted on Preprints.org.
Author Contributions
Conceptualization, M.R.M., G.R.C. and A.A.P; Methodology, M.R.M. and G.R.C.; Software, M.R.M.; Validation, D.H.S.N.; Resources, A.A.P., M.R.M., G.R.C. and T.R.; Data curation, D.H.S.N. and T.R.; Writing—original draft, M.R.M. and T.R.; Writing—review & editing, M.R.M. and T.R.; Supervision, D.H.S.N.; Funding acquisition, M.R.M. All authors have read and agreed to the published version of the manuscript.
Funding
This research was funded by Fundação de Amparo à Pesquisa do Estado de Minas Gerais (FAPEMIG), grant number PPE-00082-23, and by Consórcio Pesquisa Café, grant number 10.18.20.034.00.03. Acknowledgment to CNPq for the productivity grant Number 304618/2024-1.
Institutional Review Board Statement
Not applicable.
Informed Consent Statement
Not applicable.
Data Availability Statement
The original contributions presented in this study are included in the article. Further inquiries can be directed at the corresponding author.
Acknowledgments
The authors would like to thank the Fundação de Amparo à Pesquisa do Estado de Minas Gerais (FAPEMIG) for the financial support of this project. The authors also thank the staff of EPAMIG in Patrocínio, Minas Gerais, Brazil, for their assistance with several project activities, including coffee harvesting, processing, and drying. During the preparation of this manuscript, the authors used Claude (Anthropic, version Sonnet 4.5, 2025) to assist with manuscript structuring, language editing, reference formatting, and graphical abstract design. The authors have reviewed and edited the output and take full responsibility for the content of this publication.
Conflicts of Interest
The authors declare no conflicts of interest.
References
- AMROUK, E. M.; PALMERI, F.; MAGRINI, E. Global coffee market and recent price developments; Food and Agriculture Organization of the United Nations (FAO): Roma, Itália, 2025; Available online: https://openknowledge.fao.org/handle/20.500.14283/cd4706en.
- BARBOSA, I. D.; et al. Sensory analysis of arabica coffee: cultivars of rust resistance with potential for the specialty coffee market. Euphytica 2020, v. 216(n. 165). [Google Scholar] [CrossRef]
- BEMFEITO, C. M.; GUIMARÃES, A. S.; OLIVEIRA, A. L.; ANDRADE, B. F.; PAULA, L. M. A. F.; PIMENTA, C. J. Do consumers perceive sensory differences by knowing information about coffee quality? LWT-Food Sci. Technol. 2021, v. 138, art. 110778. [Google Scholar] [CrossRef]
- BOAVENTURA, P. S. M.; ABDALLA, C. C.; ARAÚJO, C. L.; ARAKELIAN, J. S. Value co-creation in the specialty coffee value chain: the third-wave coffee movement. Rev. De Adm. De Empres. 2018, v. 58(n. 3), 254–266. [Google Scholar] [CrossRef]
- CAO, X.; et al. Effects of postharvest processing on aroma formation in roasted coffee: a review. Int. J. Food Sci. Technol. 2023, v. 58(n. 3), 1007–1027. [Google Scholar] [CrossRef]
- CARDOSO, W.S.; AGNOLETTI, B.Z.; DE FREITAS, R.; DE ABREU PINHEIRO, F.; PEREIRA, L.L. Biochemical Aspects of Coffee Fermentation. In Quality Determinants In Coffee Production. Food Engineering Series.; Louzada Pereira, L., Rizzo Moreira, T., Eds.; Springer: Cham, 2021; pp. 149–208. [Google Scholar] [CrossRef]
- CARDOSO, W. S.; DIAS, S. R.; COELHO, V. S.; PEREIRA, L. L.; FIORESI, D. B.; PINHEIRO, F. A. Maillard reaction precursors and arabica coffee (Coffea arabica L.) beverage quality. Food Humanit. 2023, v. 1, 1–7. [Google Scholar] [CrossRef]
- CARVALHO, C. H. S.; BARTELEGA, L.; SERA, G. H.; MATIELLO, J. B.; ALMEIDA, S. R.; SANTINATO, F.; HOTZ, A. L. Catálogo de cultivares de café arábica; (Documentos / Embrapa Café, 16); Embrapa Café: Brasília, DF, 2022; ISSN 1678-1694. [Google Scholar]
- CONAB - COMPANHIA NACIONAL DE ABASTECIMENTO. Acompanhamento da safra brasileira de café: safra 2026, primeiro levantamento; Conab: Brasília, DF, 2026; Volume v. 13, n. 1, pp. 1–62. ISSN 2318-7913. [Google Scholar]
- DA SILVA, M. G.; VILAS BOAS, L. H. B.; TEODORO, A. J. S. Behind the ‘specialty’: personal values that influence the behavior of specialty coffee consumers. Br. Food J. 2023, v. 125(n. 5), 1716–1731. [Google Scholar] [CrossRef]
- ESKES, A. B.; LEROY, T. Coffee selection and breeding. In Coffee: growing, processing, sustainable production: a guidebook for growers, processors, traders and researchers; WINTGENS, J. N., Ed.; Wiley-VCH: Weinheim, 2004; pp. 57–86. [Google Scholar] [CrossRef]
- FAZUOLI, L. C.; et al. Cultivares de café arábica do IAC: um patrimônio da cafeicultura brasileira. O Agronômico 2007, v. 59, 12–15. [Google Scholar]
- FERREIRA, L. J. C.; GOMES, M. S.; OLIVEIRA, L. M.; SANTOS, L. D. Coffee fermentation process: a review. Food Res. Int. 2023, v. 169, n. 112793. [Google Scholar] [CrossRef] [PubMed]
- FREITAS, V. V.; BORGES, L. L. R.; VIDIGAL, M. C. T. R.; SANTOS, M. H.; STRINGHETA, P. C. Coffee: a comprehensive overview of origin, market, and the quality process. Trends Food Sci. Technol. 2024, v. 146, art. 104411. [Google Scholar] [CrossRef]
- HALL, R. D.; TREVISAN, F.; DE VOS, R. C. H. Coffee berry and green bean chemistry: opportunities for improving cup quality and crop circularity. Food Res. Int. 2022, v. 151(n. 110825). [Google Scholar] [CrossRef] [PubMed]
- HAMEED, A.; HUSSAIN, S. A.; IJAZ, M. U.; ULLAH, S.; PASHA, I.; SULERIA, H. A. R. Farm to consumer: factors affecting the organoleptic characteristics of coffee. II: postharvest processing factors. Compr. Rev. Food Sci. Food Saf. 2018, v. 17(n. 5), 1184–1237. [Google Scholar] [CrossRef] [PubMed]
- ICO - INTERNATIONAL COFFEE ORGANIZATION. Coffee Market Report: December 2024; ICO: London, 2024; Available online: https://ico.org/resources/coffee-market-report-statistics-section/.
- LINGLE, T. R. The Coffee Cupper’s Handbook: a systematic guide to the sensory evaluation of coffee’s flavor, 4. ed.; Specialty Coffee Association of America: Long Beach, 2011; p. 66 p. [Google Scholar]
- MATIELLO, J. B.; SANTINATO, R.; ALMEIDA, S. R.; GARCIA, A. W. R. Cultivares de café no Brasil: manual de recomendações; Fundação Procafé: Varginha, 2020. [Google Scholar]
- Nascimento, M. O.; Ombredane, A. S.; Oliveira, L. L. Descriptive sensory tests for evaluating Coffea arabica: A systematic review. Coffee Sci. 2024, v. 19, e192204. [Google Scholar] [CrossRef]
- NCA - NATIONAL COFFEE ASSOCIATION OF U.S.A. Specialty coffee consumption hits 14-year high; NCA: New York, 2025; Available online: https://www.ncausa.org/Newsroom/Specialty-coffee-consumption-hits-14-year-high.
- PEREIRA, P. V.; et al. Effect of altitude and terrain aspect on the chemical composition of Coffea canephora cherries and sensory characteristics of the beverage. J. Sci. Food Agric. 2021, v. 101(n. 6), 2570–2575. [Google Scholar] [CrossRef] [PubMed]
- SABIO, R. P.; SPERS, E. E. Does coffee origin matter? An analysis of consumer behavior based on regional and national origin. In Coffee consumption and industry strategies in Brazil; ALMEIDA, L. F., SPERS, E. E., Eds.; Woodhead Publishing: Duxford; Elsevier, 2020; pp. 297–320. [Google Scholar] [CrossRef]
- SALOJÄRVI, J.; et al. The genome and population genomics of allopolyploid Coffea arabica reveal the diversification history of modern coffee cultivars. Nat. Genet. 2024, v. 56, 721–731. [Google Scholar] [CrossRef] [PubMed]
- SCA - SPECIALTY COFFEE ASSOCIATION OF AMERICA. SCAA protocols: cupping specialty coffee; SCAA: Long Beach, 2015. [Google Scholar]
- SCHOLZ, M. B. S.; KITZBERGER, C. S. G.; DURAND, N.; RAKOCEVIC, M. From the field to coffee cup: impact of planting design on chlorogenic acid isomers and other compounds in coffee beans and sensory attributes of coffee beverage. Eur. Food Res. Technol. 2018, v. 244, 1793–1802. [Google Scholar] [CrossRef]
- SERA, G. H.; et al. Coffee leaf rust in Brazil: historical events, current situation and control measures. Agronomy 2022, v. 12(n. 2). [Google Scholar] [CrossRef]
- SERA, G. H.; VOLSI, B.; MARIUCCI JÚNIOR, V.; PEREIRA, C. T. M.; TELLES, T. S. Production and trade of specialty coffee in Brazil. Sci. Rep. 2025, v. 15(n. 42403). [Google Scholar] [CrossRef] [PubMed]
- SERA, T.; SERA, G. H.; FAZUOLI, L. C. IPR 103: rustic dwarf arabic coffee cultivar more adapted to hot regions and poor soils. Crop Breed. Appl. Biotechnol. 2013, v. 13, 95–98. [Google Scholar] [CrossRef]
- SILVA, M. C.; et al. Coffee resistance to the main diseases: leaf rust and coffee berry disease. Braz. J. Plant Physiol. 2006, v. 18(n. 1), 119–147. [Google Scholar] [CrossRef]
- SILVA, M. E. S.; OLIVEIRA, R. L.; LUCENA, R. M.; SILVA, S. P.; PORTO, T. S. Coffee fermentation as a tool for quality improvement: an integrative review and bibliometric analysis. Int. J. Food Sci. Technol. 2024, v. 59(n. 9), 5912–5925. [Google Scholar] [CrossRef]
- SRUTHI, N. U.; PREMJIT, Y.; PANDISELVAM, R.; KOTHAKOTA, A.; RAMESH, S. V. Characterization of the aroma profile and main key odorants of espresso coffee. Molecules 2021, v. 26(n. 3856). [Google Scholar] [CrossRef] [PubMed]
- STEVENSON, R. J. The role of attention in flavour perception. Flavour 2012, v. 1(n. 2), 1–8. [Google Scholar] [CrossRef]
- SUNARHARUM, W. B.; WILLIAMS, D. J.; SMYTH, H. E. Complexity of coffee flavor: a compositional and sensory perspective. Food Res. Int. 2014, v. 62, 315–325. [Google Scholar] [CrossRef]
- TANG, V. C. Y.; SUN, J.; CORNUZ, M.; YU, B.; LASSABLIERE, B. Effect of solid-state fungal fermentation on the non-volatiles content and volatiles composition of Coffea canephora (Robusta) coffee beans. Food Chem. 2021, v. 337, n. 128023. [Google Scholar] [CrossRef] [PubMed]
- VELÁSQUEZ, S.; BANCHÓN, C. Influence of pre- and post-harvest factors on the organoleptic and physicochemical quality of coffee: a short review. J. Food Sci. Technol. 2023, v. 60(n. 10), 2526–2538. [Google Scholar] [CrossRef] [PubMed]
- WCR - WORLD COFFEE RESEARCH. Arabica coffee varieties catalog; World Coffee Research: Portland, 2026; Available online: https://varieties.worldcoffeeresearch.org/arabica.
Figure 2.
Variation of the intensity attributes and the final cup score of 37 C. arabica genotypes evaluated over the 2020 and 2021 harvests. Panels show the attributes acidity, body, sweetness, aftertaste, and the final cup score. Gray lines represent the individual variation of each genotype between the two harvests, while the red line indicates the mean trend of the evaluated genotypes. Red dots represent the mean values in each harvest.
Figure 2.
Variation of the intensity attributes and the final cup score of 37 C. arabica genotypes evaluated over the 2020 and 2021 harvests. Panels show the attributes acidity, body, sweetness, aftertaste, and the final cup score. Gray lines represent the individual variation of each genotype between the two harvests, while the red line indicates the mean trend of the evaluated genotypes. Red dots represent the mean values in each harvest.
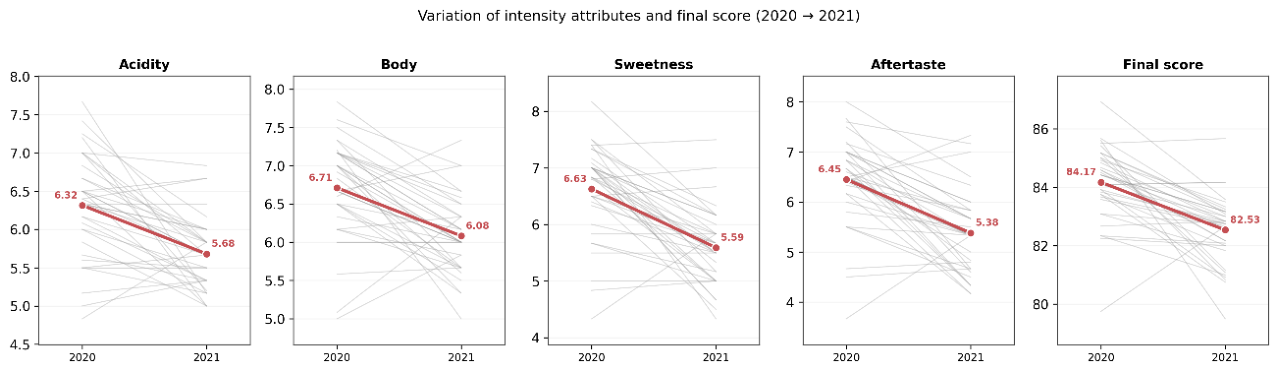
Figure 3.
Relationship between the final cup score and the sensory stability of 37 C. arabica accessions evaluated over the 2020 and 2021 harvests. The Y axis represents the mean final cup score across the two harvests, while the X axis represents the absolute difference between the 2020 and 2021 final scores, used as an indicator of temporal stability. The dashed horizontal line indicates the 84-point threshold, used to highlight accessions with higher cup quality. The dashed vertical lines delimit three stability bands: high stability, with a difference ≤ 1.0 point between harvests; intermediate stability, with a difference between 1.0 and 2.0 points; and lower stability, with a difference > 2.0 points.
Figure 3.
Relationship between the final cup score and the sensory stability of 37 C. arabica accessions evaluated over the 2020 and 2021 harvests. The Y axis represents the mean final cup score across the two harvests, while the X axis represents the absolute difference between the 2020 and 2021 final scores, used as an indicator of temporal stability. The dashed horizontal line indicates the 84-point threshold, used to highlight accessions with higher cup quality. The dashed vertical lines delimit three stability bands: high stability, with a difference ≤ 1.0 point between harvests; intermediate stability, with a difference between 1.0 and 2.0 points; and lower stability, with a difference > 2.0 points.
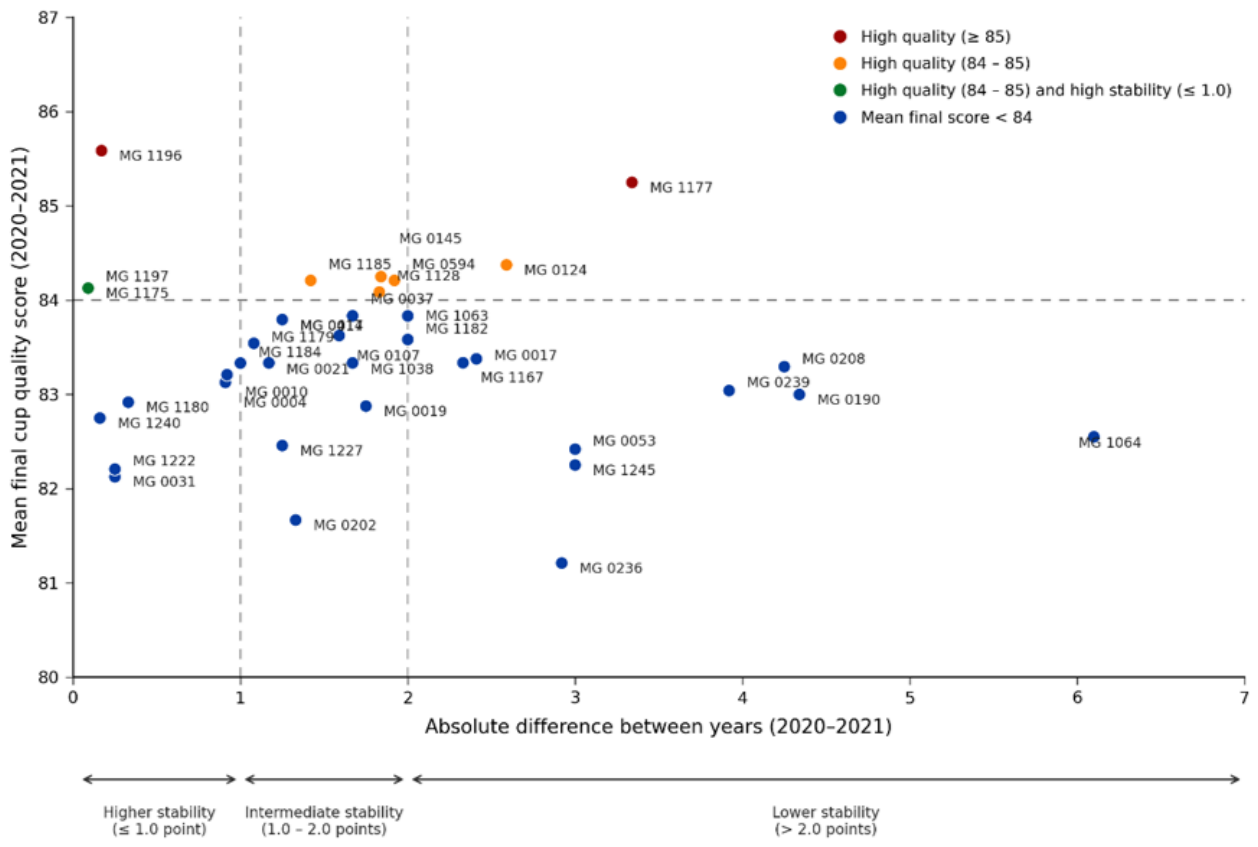
Figure 4.
Principal Component Analysis (PCA) of the intensity attributes (acidity, body, sweetness, and aftertaste) of 37 C. arabica genotypes grouped by genetic class: Bourbon, Exotic, Timor Hybrid (THD), IPR, and Mundo Novo. The final cup score, being a composite variable of the sensory evaluation, was not included in the PCA computation and was added to the biplot as a supplementary variable to aid the interpretation of its association with the evaluated attributes. Ellipses represent 95% concentration regions for classes with n ≥ 4; the IPR class, with n = 3, was not represented by an ellipse.
Figure 4.
Principal Component Analysis (PCA) of the intensity attributes (acidity, body, sweetness, and aftertaste) of 37 C. arabica genotypes grouped by genetic class: Bourbon, Exotic, Timor Hybrid (THD), IPR, and Mundo Novo. The final cup score, being a composite variable of the sensory evaluation, was not included in the PCA computation and was added to the biplot as a supplementary variable to aid the interpretation of its association with the evaluated attributes. Ellipses represent 95% concentration regions for classes with n ≥ 4; the IPR class, with n = 3, was not represented by an ellipse.
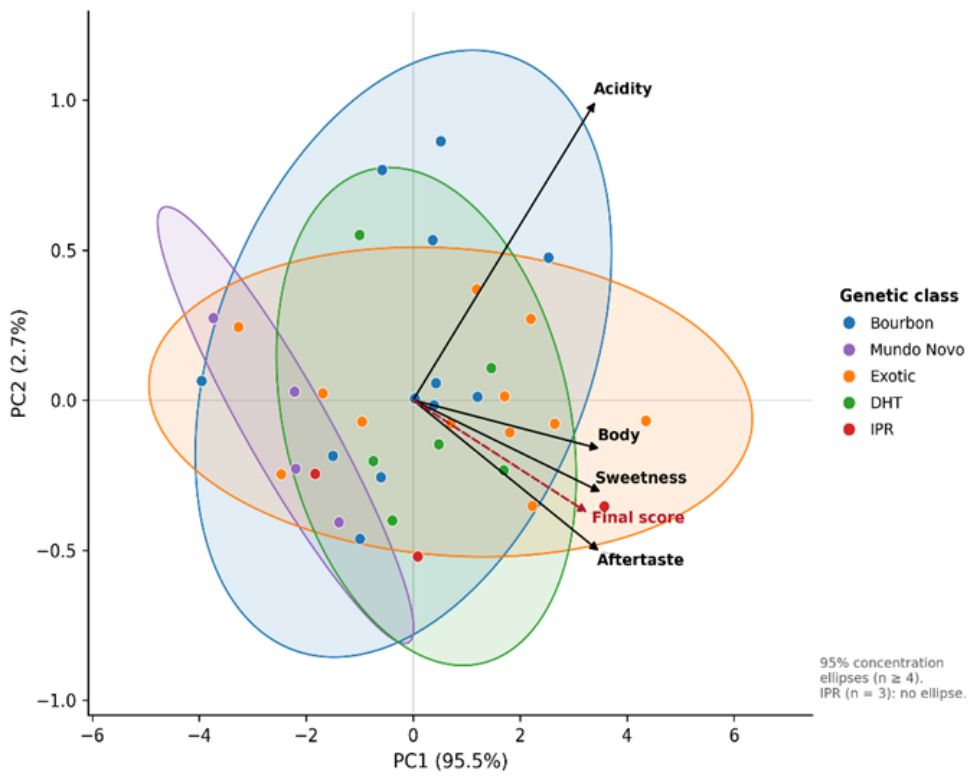
Figure 5.
Spearman correlation between the final cup score and the aroma and flavor nuances of 37 C. arabica genotypes. The heatmap shows the Spearman correlation coefficients among the sweet, nutty, chocolate, spicy, floral, and fruity nuances in the aroma (A) and flavor (F) attributes, as well as the final cup score. The color scale indicates the direction and magnitude of the correlations, ranging from −1.0 to 1.0. Positive values indicate a direct association between variables, whereas negative values indicate an inverse association. Asterisks indicate statistical significance: p < 0.05 (*), p < 0.01 (**), and p < 0.001 (***).
Figure 5.
Spearman correlation between the final cup score and the aroma and flavor nuances of 37 C. arabica genotypes. The heatmap shows the Spearman correlation coefficients among the sweet, nutty, chocolate, spicy, floral, and fruity nuances in the aroma (A) and flavor (F) attributes, as well as the final cup score. The color scale indicates the direction and magnitude of the correlations, ranging from −1.0 to 1.0. Positive values indicate a direct association between variables, whereas negative values indicate an inverse association. Asterisks indicate statistical significance: p < 0.05 (*), p < 0.01 (**), and p < 0.001 (***).
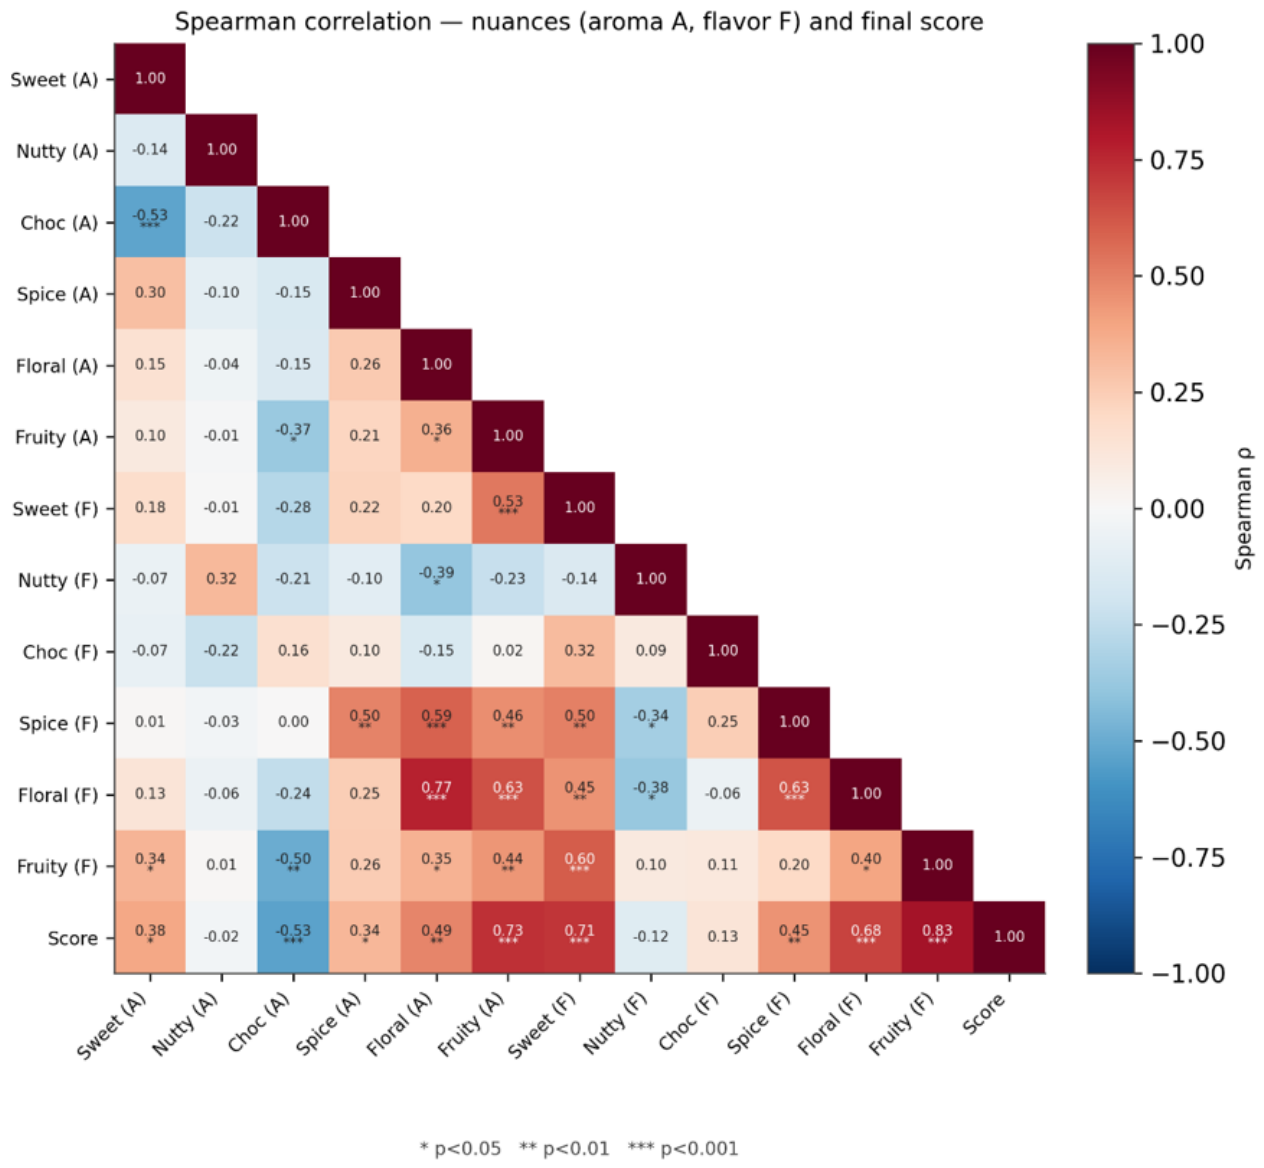

Table 1.
C. arabica genotypes with their respective codes, accessions, and genetic classes, located at the Active Germplasm Bank (AGB) of EPAMIG in Patrocínio, MG, Brazil. * THD: Timor Hybrid Derivatives.
Table 1.
C. arabica genotypes with their respective codes, accessions, and genetic classes, located at the Active Germplasm Bank (AGB) of EPAMIG in Patrocínio, MG, Brazil. * THD: Timor Hybrid Derivatives.
| Code | Accession | Genotype | Class |
|---|---|---|---|
| 1 | MG 0004 | Red Bourbon | Bourbon |
| 2 | MG 0010 | Red Bourbon | Bourbon |
| 3 | MG 0014 | Red Bourbon | Bourbon |
| 4 | MG 0017 | Yellow Bourbon LCJ 20 | Bourbon |
| 5 | MG 0019 | Yellow Bourbon | Bourbon |
| 6 | MG 0021 | Yellow Bourbon T7 | Bourbon |
| 7 | MG 0031 | Yellow Bourbon | Bourbon |
| 8 | MG 0037 | Yellow Bourbon T8 | Bourbon |
| 9 | MG 0053 | Red Bourbon T1890 Pl 11 | Bourbon |
| 10 | MG 0107 | Red Bourbon Long Leaf | Bourbon |
| 11 | MG 0124 | Yellow Bourbon IAC J9 | Bourbon |
| 12 | MG 0145 | Unknown plant | Exotic |
| 13 | MG 0190 | Red Caturra | Bourbon |
| 14 | MG 0202 | Pacas (Bronze tip) | Exotic |
| 15 | MG 0208 | Guatenano | Exotic |
| 16 | MG 0236 | Poliatrofica | Exotic |
| 17 | MG 0239 | Angustifolia | Exotic |
| 18 | MG 0417 | Timor Hybrid | THD* |
| 19 | MG 0594 | BA8 UFV 161-02 | Exotic |
| 20 | MG 1038 | Sarchimor UFV 349-04 | THD* |
| 21 | MG 1063 | Sarchimor IAC 1669-1-6 | THD* |
| 22 | MG 1064 | Sarchimor IAPAR 75-163 | THD* |
| 23 | MG 1128 | Catimor UFV 392-30 | THD* |
| 24 | MG 1167 | Sabiá médio 708 | Exotic |
| 25 | MG 1175 | Catucaiaçu | Exotic |
| 26 | MG 1177 | IPR 99 | IPR |
| 27 | MG 1179 | IPR 102 | IPR |
| 28 | MG 1180 | IPR 103 | IPR |
| 29 | MG 1182 | Yellow Tupi | Exotic |
| 30 | MG 1184 | Sarchimor | THD* |
| 31 | MG 1185 | Siriema 842-2-4 | Exotic |
| 32 | MG 1196 | Plant 1 from A. J. Favoreto | Exotic |
| 33 | MG 1197 | Plant 2 from A. J. Favoreto | Exotic |
| 34 | MG 1222 | Yellow Mundo Novo | Mundo Novo |
| 35 | MG 1227 | Mundo Novo Bronze tip | Mundo Novo |
| 36 | MG 1240 | Mundo Novo 25L LCP 379-19 | Mundo Novo |
| 37 | MG 1245 | Mundo Novo II LCP 382-14 | Mundo Novo |
Disclaimer/Publisher’s Note: The statements, opinions and data contained in all publications are solely those of the individual author(s) and contributor(s) and not of MDPI and/or the editor(s). MDPI and/or the editor(s) disclaim responsibility for any injury to people or property resulting from any ideas, methods, instructions or products referred to in the content. |
© 2026 by the authors. Licensee MDPI, Basel, Switzerland. This article is an open access article distributed under the terms and conditions of the Creative Commons Attribution (CC BY) license (http://creativecommons.org/licenses/by/4.0/).
Copyright: This open access article is published under a Creative Commons CC BY 4.0 license, which permit the free download, distribution, and reuse, provided that the author and preprint are cited in any reuse.


