
Preprint
Article

This version is not peer-reviewed.

Spectroscopic Identification of Yellow Natural Dyes on Wool: Cuscuta tinctoria, Tagetes lucida and Reseda luteola

Submitted:

15 July 2026

Posted:

16 July 2026

You are already at the latest version

Abstract
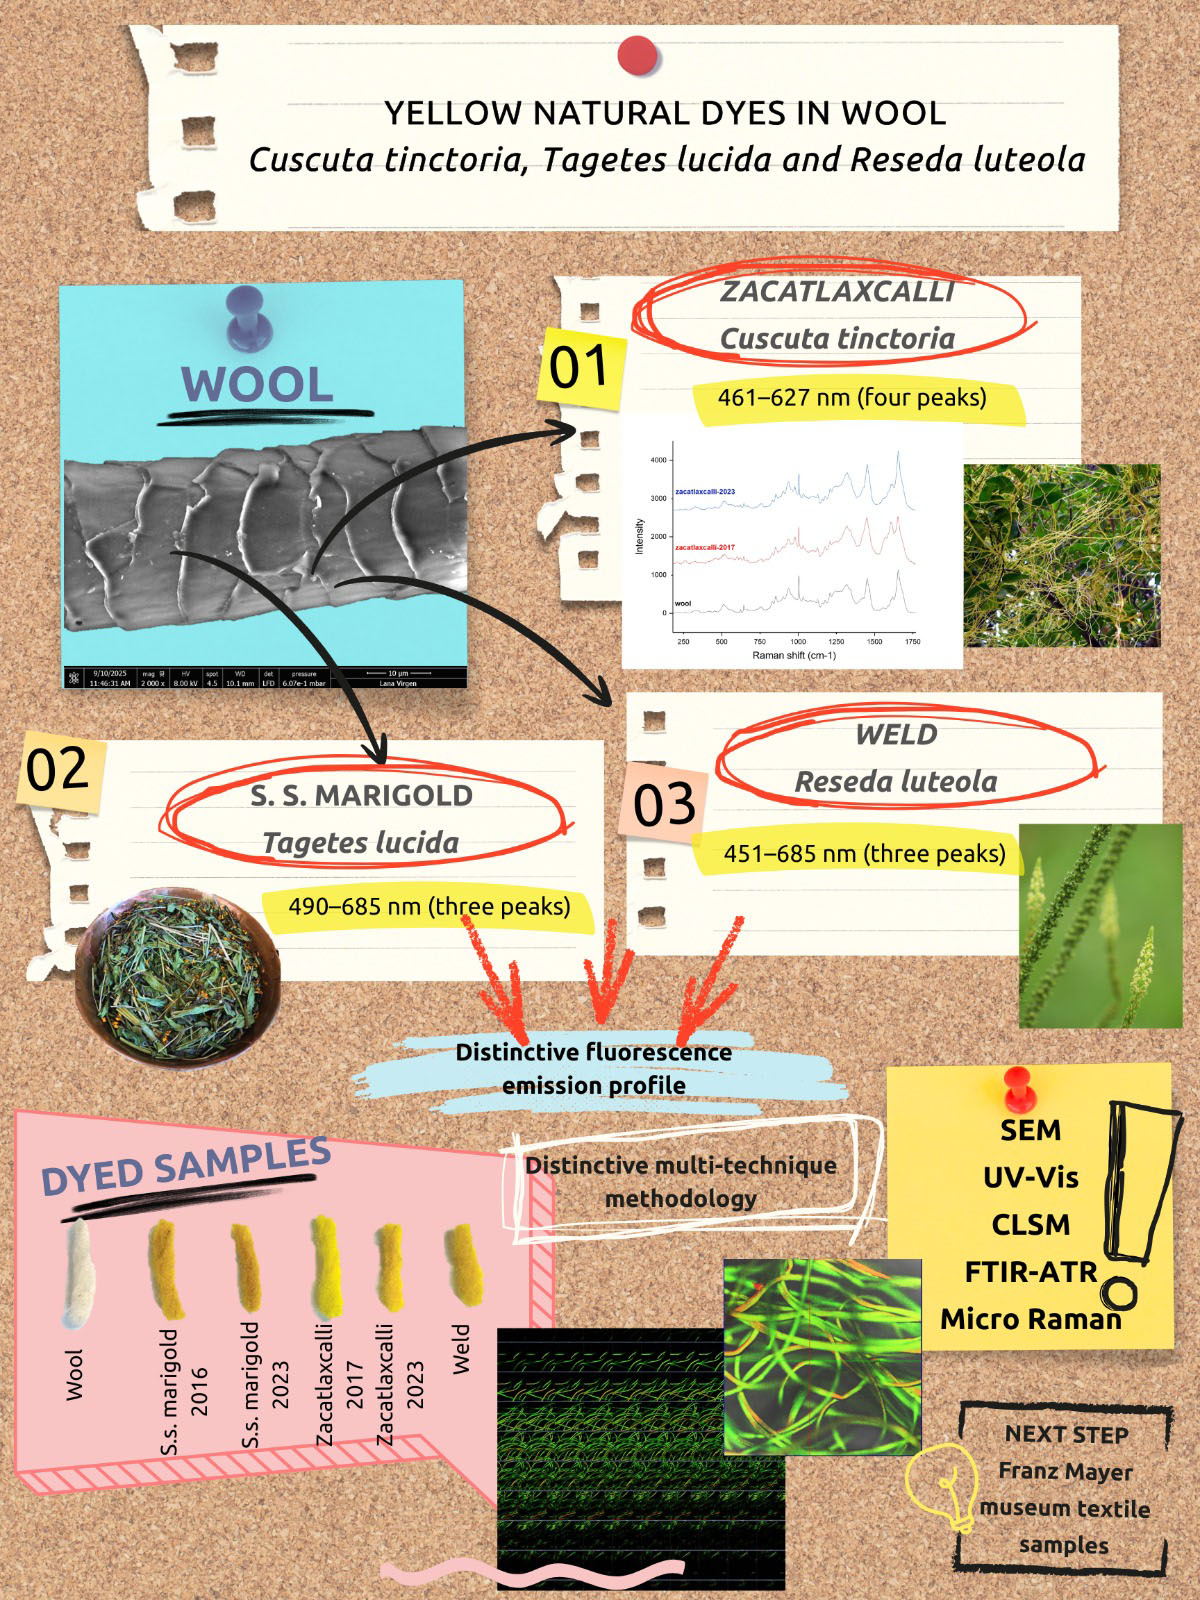
The identification of natural yellow dyes in ancient textiles is complicated, regardless of whether destructive or non-destructive techniques are used. The main limitation is the need for sampling, followed by deterioration and interference by the materials used in consolidation and restoration processes. In addition, different yellow dye sources share the same main fluorophores or components such as luteolin, kaempferol, and quercetin-based chromophores. We propose a minimally invasive methodology to identify sweet-scented marigold (Tagetes lucida), zacatlaxcalli (Cuscuta tinctoria), and weld (Reseda luteola). This methodology was tested on yellow wool samples that were dyed in an artisan workshop in the last 3 to 10 years. Another two samples of yellow wool fibres were obtained from the textile collection of the Franz Mayer Museum in Mexico City. Confocal scanning laser microscopy (CSLM), micro-Raman spectroscopy, attenuated total reflectance Fourier transformed infrared spectroscopy (ATR-FTIR), and variable pressure environmental scanning electron microscopy (VP-ESEM) were used to analyse the samples. The CLSM results showed that dyes are absorbed into the matrix of the fibres. The wool and dyes presented different emission spectra, which can be associated with the main groups of autofluorescent compounds in plants. The FTIR-ATR results supported the proteinaceous origin of the fibres, and the chemical composition and molecular structure of the autofluorescence phytocompounds were identified by micro-Raman spectroscopy. The findings indicate that the proposed methodology is adequate for identifying natural yellow dyes in wool fibres and can be applied to cultural heritage textiles.
Keywords: 
;  ;  ;  ;  ;  

1. Introduction

The identification and characterization of natural yellow dyes pose a challenge in the study of ancient textiles [1]. Man has dyed textiles using plants for perhaps more than 5,000 years [2], but very little is known about archaeological textiles because they are so fragile and impermanent. Many of them have been destroyed due to harsh archaeological environments, ageing, and biodegradation. They also change as a result of UV exposure, are sensitive to oxygen and heat, and can be degraded by photo-oxidization [3], among other factors that pose problems for scientists [2,4]. Other obstacles are the need for sampling, as well as deterioration and interference by the materials used in consolidation and restoration processes [5].
Different sources of yellow dye share the same main fluorophores or components such as luteolin, kaempferol, and quercetin-based chromophores [6]. The use of yellow dyes in Mexico was fundamental to pre-Columbian cosmogony. Zacatlaxcalli (Cuscuta tintoria) was one of the most used dyes in the region, and in the Mayan area, it has been referred to as “Maya Yellow,” which alludes to the highly valued “Maya Blue” recognized by historians and archaeologists [7]. Upon contact with the Spanish, its use was noted in the writings of Fray Bernardino de Sahagún [8], and it has been applied to culturally significant objects such as lacquerware and colonial textiles. Its use remained prevalent in 20th-century ethnographic textiles.
Pericón or sweet-scented marigold (Tagetes lucida) is a source of a yellow dye that provides a distinctive colour between yellow and orange and has been used in Mexican food, medicine, rituals, and textile dyeing [9]. With the arrival of the Spanish, European and Asian dyeing knowledge reached New Spain and was integrated into the region’s chromatic palette. Weld (Reseda luteola) is another example of the diverse plants that are known to achieve yellow tones and was used to produce a hue ranging from yellow to yellow-green [10]. This dye has been used in Africa since the Neolithic, it was widely used by the Romans, and its use has even been recorded in the 20th century and Western Asia [11,12]. In New Spain, it is believed to have been part of the tapestries that arrived from Europe [13].
Identification of these dyes is essential for deepening our understanding of past societies and provides new insights for developing appropriate conservation and restoration methodologies. Before the emergence of synthetic dyes in the mid-19th century, dyes derived from plants, insects, or molluscs were the primary resources for dyeing textiles. Besides identifying the origin of these dyestuffs, this field of study connects us to the sociocultural context in which they were created and brings us closer to recognizing the geographical regions or species used as raw materials [6,11,14].
Methodologies for identifying natural dyes from plants in historical and archaeological textiles can locate specific colorants by mapping surfaces, provide identification of dyes and pigments or specific chemical markers in fibres. They can also distinguish between organic dyes and mineral pigments and monitor damage on historic textiles [16], but they have several limitations [17]. Non-invasive techniques include reflectance imaging spectroscopy (RIS) [2,18], fibre optic reflectance spectroscopy (FORS), near-infrared spectroscopy (NIR), mid infrared spectroscopy (IR) [14,19], multispectral imaging (MSI), hyperspectral imaging (HSI) [20], ultraspectral imaging (USI), X-ray fluorescence (XRF) [15,21,22], fluorescence excitation-emission matrix spectroscopy (FEEM), and direct analysis in real time-time of flight-mass spectrometry (DART-TOF-MS). Examples of minimally invasive techniques are scanning electron microscopy (SEM) [23], surface enhanced Raman spectroscopy (SERS), surface enhanced resonance Raman spectroscopy (SERRS) [1,24], attenuated total reflectance infrared spectroscopy (FTIR-ATR) [15], and colorimetry [1,25,26]. Invasive techniques include radiocarbon dating [27], thin layer chromatography (TLC), gas chromatography (GC), high performance liquid chromatography (HPLC), and high performance liquid chromatography with diode array detection (HPLC-DAD) [11,25], and other more sophisticated HPLC variants [1,2,6,11,28].
All techniques have advantages and disadvantages. For example, even when SERS presents positive aspects such as signal increase above 6 orders of magnitude and a decrease in luminescence at the surface, a certain amount of the sample is irreversibly affected by silver particles in the substrate or is consumed during sampling. One of the main drawbacks of the technique is that it is not easy to prepare substrates, and it has low repeatability and reproducibility [24]. In addition, some bands are affected by Ag near the surface [29]. The rise of portable instrumentation (XRF, Raman spectroscopy, FTIR, multispectral imaging, etc.) for archaeometric studies has provided non-invasive, touchless, and non-destructive techniques with their own advantages, disadvantages, and limitations. The tools available at the Center for Nanosciences and Micro and Nanotechnologies of the National Polytechnique Institute (CNMN-IPN) are used to support the National School of Conservation, Restoration, and Museography of the National Institute of Anthropology and History (ENCRyM).
Identifying the chemical structure of the dyes is complicated as they contain a combination of components such as flavonoids, alkaloids, phenolic compounds, steroids, triterpenoids, fatty acids, lipids, coumarins, lignans, terpenes, polyacetylenes, and glycosides [30]. Only some of these components are natural chromophores that have a yellow colour [6]. The molecules of the phytocomponents that mainly have a yellow colour have the same main fluorophores or components such as luteolin, kaempferol, quercetin-based chromophores (see Table 2). Their identification through Raman and FTIR spectroscopy in dyed natural fibre samples is challenging as the fibres exhibit bonds and vibrations in their chemical structures that also appear in dyestuff components [31]. These problems are partially solved by the application of HPL, GC, and MS techniques. This has been demonstrated in a study on ancient Chinese textiles analysed by HPLC and MS, although the exact source of yellow dyestuff was not identified with certainty. Nevertheless, luteolin or luteolin-like derivatives were detected in two yellow dye extracts [12].
In this work, a minimally invasive methodology is proposed to identify sweet-scented marigold (T. lucida), zacatlaxcalli (C. tintoria), and weld (R. luteola) in modern dyed wool samples. Considering the material transformations that objects undergo over time, the first stage of the analysis involved implementing the proposed methodology on dyed samples from different years in the Teaching Laboratory of ENCRyM-INAH. After confirming that the emission spectra of the three dyes could be differentiated, two samples from the textile collection of the Franz Mayer Museum in Mexico City were analysed. The combination of techniques is useful for obtaining structural images, information on the functional groups in the samples, and images of fibre damage from aging and consolidation processes. This methodology could be applied to other kinds of yellow-dyed fibres using non-portable equipment when portable equipment is unavailable.

2. Wool and Natural Yellow Dyes

2.1. Wool Fibre

2.1.1. Morphology and Physical Structure

Wool is one of the first animal protein fibres to be used as a textile material. Depending on the breed of sheep, it presents various types of fibres [32] with different lengths, diameters, cuticular patterns, types of scales and piths, shapes of the margins of the scales, and distances between the margins of the scales [33]. Wool fibres consist of a cuticle, cortex, and medulla [34,35]. The cuticle is the outermost part of the fibre and is made up of overlapping scales called cuticular cells, which have a waxy layer that is chemically attached to the surface [36], acts as a barrier against the penetration of dyes, protects the fibre from damage, and is responsible for felting [35].
The epicuticle and exocuticle of wool contain high contents of sulphur with numerous cystine cross-links, which result in resistance to biological and chemical attacks. The endocuticle is somewhat less resistant. The cortex is the main component and makes up 80–90% of the fibre. It is formed by two orthocortical and paracortical cells that are surrounded and joined by a complex of cell membranes that allows easy absorption of dye molecules [36]. The medulla is the nucleus of the cortex in the centre of the fibre and is formed by hollow cells [37]. Wool fibres may or may not have a pith (α-keratin), which makes the appearance whiter because it reflects light. If melanin is present, it gives the fibre its natural colour [35].

2.1.2. Chemical Structure

Wool has a complex physical and chemical structure [34] and is mainly composed of sulphur-rich keratin-type proteins, which are natural polymers with high molecular weight (α-keratin and β-keratin). The amino acids that make up the proteins in wool are acidic amino acids, basic amino acids, tryptophan, amino acids with chain-side hydroxyl groups, sulphur-containing amino acids, and chain-side amino acids without reactive groups. The cuticle and cortical cells are separated by a chemically complex membrane that is responsible for the strong intercellular bonding. The chemical compositions differ between orthocortical and paracortical cells [35]. Table 1 shows the main components of wool fibres.

2.1.3. Properties

The physical properties of wool fibres include the diameter, length, strength, and colour, which are important characteristics for marketing. The fibres capable of water vapor absorption of up to 30% by weight, act as thermal insulators, and repel liquid water as a result of the surface waxy layer. They have elongation and breakage properties, moderate abrasion resistance, high resistance to heat and flammability, low generation of static electricity, the ability to be felted, and the ability to absorb odour or filter toxic chemicals [26,32,37].

2.2. Phytochemical Composition of Natural Yellow Dyes

Natural yellow dyes that are mainly obtained from plants are one of the largest groups of natural dyes [2,3]. The availability of usable plants depends on the geographical region and dyeing traditions. Flavonoids dyes are the most abundant, chalconoids are poorly soluble in water, and carotenoids are extremely insoluble in water. Alkaloid are used as direct dyes because they are water-soluble. Quinones are usually used with mordants. Tannins are water-soluble and can be used as a dye or as a mordant, and diarylheptanoids are also water-soluble [2].
The three sources of natural yellow dyes studied in this work are sweet-scented marigold (T. lucida), zacatlaxcalli (C. tintoria), and weld (R. luteola). In Mexico, extracts of these plants have been used to dye textile fibres since pre-Hispanic times. Each of them contains a complex mixture of phytochemical compounds, of which only some are natural fluorophores, as shown in Table 2 [13,31,38,39,40,41,42,43].
Table 2. Phytochemical components of natural yellow dyes. Data obtained from several sources.
Component Sweet-scented marigold (Tagetes lucida) Zacatlaxcalli (Cuscuta tinctoria) Weld
(Reseda luteola)
Flavonoids quercetin quercetin* quercetin*
kaempferol * kaempferol * kaempferol *
luteolin * luteolin * luteolin *
7-O-glucoside luteolin *
3’,4’,5,7-trihydroxyflavone *
hyperoside
various
flavonoids-glycosides
various
flavonoids-glycosides
various
flavonoids-glycosides
quercetagetin*
petuletin
leucoanthocyanins

chrysoerol
apigenin apigenin apigenin*
Alkaloids cuscutamine
lupanine
sparteine
Phenolic compounds chlorogenic acid chlorogenic acid* chlorogenic acid*
caffeic acid caffeic acid caffeic acid
gallic acid
p-coumaric acid p-coumaric acid
ferulic acid ferulic acid
Steroids and triterpenoids beta-sitosterol
stigmasterol
triterpenoid lupeol
Fatty acids and lipids palmitic acid
linoleic acid
oleic acid
Coumarins and Lignans coumarin derivatives coumarins*
lignans
6,7,8-trimethoxycoumarin
7-hydroxycoumarin dimethyl allyl ether
hernia
Terpenes limonene
Polyacetylenes oleoacetilenes
Glycosides saponins (triterpenes)
cyanogenic glycosides (aminoglycosides)
* Main fluorophores.

3. Materials and Methods

Samples of wool were dyed with sweet-scented marigold (T. lucida), zacatlaxcalli (C. tintoria), and weld (R. luteola) in an artisan workshop as part of academic activities at ENCRyM-INAH. The samples were dyed using the traditional knowledge of master dyer Román Gutiérrez by students from the Textile Conservation Workshop (STCT) under the direction of restorer Rosa Lorena Román Torres. The sheep’s wool was purchased from a ranch in the State of Mexico as spun (row wool). The master dyer technique involves 100 g of wool and does not specify a washing and drying process before dyeing. The preparation of the wool consists of placing it in water at room temperature before introducing it to the dyeing bath.
The plants were collected in fields in Oaxaca in different seasons: zacatlaxcalli was harvested in April, sweet-scented marigold was harvested in August, and weld was harvested in march. The plants were dried in the sun for several days before being ground to dye the wool. The dried plant is placed in hot water (no higher than 80 °C), and once the dye is extracted, the wool is placed in the dyeing bath. The wool is placed in water at room temperature before being introduced to the dyeing bath. Only alum (Al+3 ion) was used in the staining process of the sweet-scented marigold sample from 2016 and the weld samples. Mordants are not always necessary for fixing natural dyes [24] and are only needed when there is low affinity between the fibre and dye [26]. When weld is used with alum as a mordant, it results in bright yellow colours due to the luteolin and apigenin contents [43,44].
The dyed wool was stored in plastic bags in drawers to avoid exposure to light, humidity, dust, and extreme temperatures. The museum’s textile works are protected by undyed cotton fabric to protect them from dust and dirt and are kept in a warehouse with specific conditions of relative humidity, temperature, and light. Small samples were cut from the back of the textiles (40 µm). The sample sizes were sufficient to perform the analyses and accessible for the study of ancient textiles without affecting their materiality during sampling. The order of the characterization techniques was decided according to the way in which the fibres must be fixed for each analysis, and the analysed fibres were recovered at the end of the process.

3.1. Confocal Laser Scanning Microscopy

The autofluorescence of the wool fibres was observed using a confocal-multiphotonic microscope (LSM 710 NLO, Carl Zeiss, Germany). The observations were combined with spectral analysis and linear unmixing to separate spectral signals of different fluorophores using computer algorithms included in the acquisition software (ZEN 2010 black edition, Carl Zeiss, Germany). Some fibres were placed between two glass slides and examined using the channel spectral mode (Lambda mode).
The fibres were excited with seven laser lines (405, 458, 488, 514, 561, 594, and 633 nm), and the fluorescence was detected at 420–720 nm. Four regions were analysed with a 10×/0.3 Plan Neofluar objective, and the resolution was 512 × 512 pixels. Images were stored in *.tiff format for further analysis. Images of the cultural heritage samples were obtained with a resolution of resolution 1024 pixels.

3.2. Raman Spectroscopy

Raman spectroscopy analyses were performed using a LabRam HR800 Horiba Jobin Yvon confocal micro-Raman spectrometer. A HeNe laser with a wavelength of 633 nm was employed as the excitation source with a spectral range of 100–4000 cm−1, a 600-gr/mm grating, and a CCD detector. Measurements were collected in triplicate for each sample with the laser power fixed at 11 mW, an acquisition time of 5 seconds, and 10 accumulations per point. The confocal pinhole and slit apertures were set to 400 and 150 µm, respectively, yielding an instrumental resolution of 3.8 cm−1. The laser beam was focused onto the sample surface through a 100×/0.9 NA achromat plane dry objective, resulting in a spot size of approximately 0.8 µm.
To perform the analyses, a group of fibres was fixed at their edges with scotch tape on a glass slide to restrict their movement. To mitigate fluorescence interference, baseline subtraction was performed using Horiba LabSpec6 software for each spectrum. For this purpose, a linear algorithm with 21 points was applied to define the baseline curve. Depending on the background profile, certain points were manually repositioned (see the raw Raman spectra, prior to baseline correction, in supplementary Figure S1). For the purposes of comparison, each spectrum was normalized by dividing the full spectrum by the intensity of the most prominent band, as suggested by García-Bucio et al. [1]. Data were processed using Origin 2021 software.

3.3. Attenuated Total Reflectance Fourier Transform Infrared Spectroscopy

ATR-FTIR spectra were collected using a Jasco FT/IR-4X spectrometer equipped with a 45° Michelson interferometer, a TGS detector, and a diamond crystal ATR PRO4x module. Spectra were recorded in the mid-infrared range (4000–400 cm−1) with a spectral resolution of 2 cm−1. On average, 32 scans per sample were obtained to improve the signal-to-noise ratio. Prior to each measurement, background spectra were acquired under identical conditions. (see FTIR-ATR spectra, prior to normalization in supplementary Figure S2).
The fibre samples were processed in situ without any special preparation. The only preparation involved carefully separating a set of fibres, placing them directly into the ATR module, and compacting them using the equipment’s manual press to obtain a uniform fibre-diamond contact. All spectra were normalized for comparative analysis using Origin 2021 software.

3.4. Variable Pressure Environmental Scanning Electron Microscopy (VP-ESEM)

The morphology was observed with secondary electron imaging using field emission gun equipment: Quanta FEG-250 instrument (FEI) operated at 8 kV in low vacuum mode, from 500x to 5kx and JSM-7800F (JEOL) operated at 1.5 kV, from 400x to 2kx, both without conductive layer (see Original SEM micrographs in supplementary Figure S3). Sample preparation involved removing a few fibres and fixing them on double-sided carbon tape, which was placed on an aluminium stub.

4. Results and Discussion

4.1. CSLM

Autofluorescence of the analysed samples occurs when they excited are by UV or visible lasers, and the emission is generally broad. It is generally not possible to directly assign the wavelengths of a CLSM emission spectrum to specific functional groups of a molecule as in Raman spectroscopy. However, it is possible to associate them with autofluorescent compounds that are present in plants, which provides qualitative information about the location of the fluorophores.
Plant fluorescence results from the multicomponent emission of light from several autofluorescent compounds. The most abundant are phenolic compounds (flavonoids, tannins, coumarins, flavins, alkaloids, and carotenoids), which fluoresce in the region of 492–597 nm (green-yellow). Certain autofluorescing phenols, terpenoids, and alkaloids fluoresce in the region of 400–455 nm (violet) and 455–492 nm (blue), and some alkaloids, sesquiterpenoids, and chlorophylls fluoresce in the region of 597–750 nm (orange-red) [30]. Figure 1 shows the emission spectra of selected yellow-dyed samples and undyed wool. All three dyes contained flavonoids (quercetin, kaempferol, luteolin, apigenin, and others), phenolic compounds (coumarins, chlorogenic acid, and tannins), flavins, and alkaloids that produce fluorescence in the green-yellow region (490–597 nm).
In general, no emissions were observed at 421 to 450 nm in the spectra of dyes. Natural wool exhibits two main bands in the visible range between 441 and 539 nm (cyan-green) and a minor band between 578 and 617 nm (yellow-orange). The two main bands for the sweet-scented marigold sample from 2016, zacatlaxcalli sample from 2023, and weld occurred between 500 nm and 617 nm (green-yellow-orange). Weld and zacatlaxcalli 2023 showed low fluorescence in the blue region (480 nm and 470 nm, respectively), while sweet-scented marigold and weld had low fluorescence in the orange-red region (646–675 nm). The hue can be considered a result of the emission of all wavelengths related to the chemical components of each dye that fluoresce and is possibly associated with the presence of terpenes, flavonoids, phenolic compounds, coumarins, alkaloids, and fatty acids, among other compounds present in the extracts (Table 2). The structures of these compounds are made up of double or triple bonds and do not emit in only the yellow region [30].
CSLM has been used to visualize the penetration of dyestuff into different types of textile fibres for different purposes, including forensic analyses [45]. In dyed wool fibres, fluorescent species appear more concentrated in the cortex [46,47], which can be seen in 3D images and orthogonal visualizations [48]. An advantage of CSLM is that it separates the emission signals of the fluorophores in wool from those of the fluorophores of the dyes, which helps to identify the emission wavelengths of the dyes and infer the type of plant components that emit at particular wavelengths [30,49].
It was possible to identify the location of yellow dye fluorophores (red colour) and proteinaceous fluorophores in wool fibres (green colour). It was confirmed that yellow dyes were absorbed into the cortex of the wool fibres in the yellow-dyed samples (Figure 2). However, when the wool fibre does not contain a waxy layer, the dye molecules also adhere to the surface of the fibre, as shown in Figure 2c.

4.2. Raman Spectroscopy

Figure 3 shows the Raman spectra obtained from dyed and undyed wool samples, including a detailed view of each spectral region (Figure 3a–d) in the range of 400–1750 cm-1. As mentioned, wool is composed of proteins (mainly keratin) and high contents of sulphur that form disulphide bonds that are characteristic of cystine. The spectra show characteristic vibrations that include a band located at 513 cm-1 associated with S–S stretching vibrations of gauche–gauche geometry, C–S bond stretching at 644 cm-1, and bands associated with the amino acid tryptophan at 752 cm-1 (CCC stretching), 829 cm-1, 853 cm-1 (CH2, CCOO stretching), 1174 cm-1 and 1554 cm-1. There is also C–C skeletal bending at 935 cm-1, a sharp band at 1005 cm-1 due to vibrations of the aromatic ring of phenylalanine, one at 1316 cm-1 due to CH2 bending vibrations, one at 1450 cm-1 associated with vibrational modes of CH2 and CH3 bonds, and one at 1654 cm-1 corresponding to amide I. The high-intensity bands around 2935 cm-1 were due to asymmetric CH2 stretching, and vibrations at 3033 cm-1 to 3300 cm-1 were due to N-H bonds of amide groups [50,51]. All of these vibrations were also observable in dyed wool samples, and many of them overlap with most of the vibrational responses of the dyes in the region of 700–1700 cm-1.
In the spectra of wool samples dyed with sweet-scented marigold, quercetin was one of the main components. Quercetin was also present in samples dyed with zacatlaxcalli. Both compounds have similar molecular structure and thus share common molecular vibrations. For example, the band located at 976 cm−1 [1,52,53,54] is associated with flavonoid compounds. The samples dyed with sweet-scented marigold exhibit an increased intensity of the band located at 1612 cm−1 associated with C=C vibrations of flavonoids. They also show a decrease and shift in the amide I band (1654 cm−1, α-helix), producing a flavonoid-keratin interaction [55]. This was confirmed by the presence of a band around 1343 cm−1, which may be associated with changes in amide III due to the presence of C-O vibrations of phenolic groups and C-H vibrations of aromatic groups [53,56].
These observations suggest a structural reorganization of the protein that led to less ordered structures. This indicates greater incorporation of the dyes into the wool, unlike the zacatlaxcalli-dyed fibres, where the amide I band does not show alterations in intensity, position, or width. Notably, since Raman spectroscopy is a point-analysis technique, local concentration differences of dyes (as shown in Figure 3) between the different analysis areas can produce differences in the intensities of the Raman bands corresponding to the dyes. Therefore, the spectral differences between the sweet-scented marigold 2016 and zacatlaxcalli 2023 sample pairs cannot be directly attributed to differences in the dyeing dates.
For the weld sample, the main dye component was luteolin, and a broad band occurred at 1258 cm−1. This band is related to ring vibrations that are characteristic of this flavonoid’s structure and was not present in the spectra of the sweet-scented marigold or zacatlaxcalli dyes (see Table 2). Additionally, an intense band was observed in the region of 1583 cm-1, which corresponds to C=C of the conjugated aromatic ring. Together with the band at 1654 cm-1 and the changes observed in the amide I band, the spectra suggest that there is a significant presence of the dye in the fibre and a surface interaction with the protein part of the wool causing distortion in the α-helix structure. This was confirmed by the decrease in the band at 938 cm-1 related to skeletal (C-C) vibrations since it is sensitive to the ordering of the α-helix [57,58].

4.3. ATR-FTIR

The infrared spectra acquired from the six dyed and undyed samples after normalization are presented in Figure 4a. Those of weld (Figure 4b), sweet-scented marigold, and zacatlaxcalli are also shown in pairs (Figure 4c–f). The spectral analysis focused on the range of 550–4000 cm-1. It is well known that the spectra mainly present signals from wool, which is mainly composed of proteins (particularly keratin). This is not surprising because the dye is found in the wool fibre matrix at a much lower proportion than the proteins in the fibre. However, differences in intensities and bandwidths from the different dyes are evident.
In Figure 5a,b, the fingerprint region and high-frequency region are show in greater detail. There is a variation in the intensities of some bands with respect to the spectrum of undyed wool. Only the weld spectrum presented a small band at 1170 cm-1, which is related to the C-O absorption band for cyclic ether stretching vibration of the weld extract [40,59]. The spectral features of each region are described below.
  • 3600–3000 cm−1: O–H and N–H Stretching
In all spectra, a wide band was observed at 3600–3000 cm−1 and was attributed to O–H and N–H stretching of the functional groups in the wool and the hydroxyl groups in the dyes. The zacatlaxcalli 2023 and sweet-scented marigold 2023 samples showed significant widening of this band, suggesting greater interaction between the phenolic compounds of the dyes and the amide groups of the wool, promotes the formation of hydrogen bonds [60]. This behaviour was more pronounced for the zacatlaxcalli 2023 sample than zacatlaxcalli 2016, indicating better fixation of the dye in the 2023 sample.
  • 3000–2800 cm−1: Aliphatic C–H Stretching
The region of 3000–2800 cm−1 corresponding to aliphatic C–H stretching shows similar intensity for all samples with no significant variations between them. This indicates that dyeing treatments did not alter the aliphatic composition of the wool and confirms that the interactions between the dye and fibre did not involve the incorporation of aliphatic chains [61]. This result is consistent with the fact that vegetable dyes do not significantly alter the lipid components of wool.
  • 1700–1500 cm−1: Amide I and Amide II Bands
The characteristic bands of amide I (~1650 cm−1) and amide II (~1540 cm−1) associated with the primary structure of keratin were clearly defined in all spectra. No significant shifts were observed in the positions of these bands, indicating that dyeing did not cause fibre degradation. However, the zacatlaxcalli 2023 and sweet-scented marigold 2023 samples showed a slight decrease in transmittance and a slight widening of these bands, which reflect stronger chemical interaction between the amide groups of the wool and the dyes. This interaction is probably mediated by hydrogen bonds and was more pronounced in the 2023 samples, indicating better dye fixation for samples from that year [62].
  • 1450–1200 cm−1: C–O, Amide III, and C–H Vibrations
The region of 1450–1200 cm−1 includes the vibrations of amide III and C–O and C–C stretching of the flavonoids. This region showed increased transmittance for the 2023 zacatlaxcalli and sweet-scented marigold 2023 samples. The increase in intensity of the bands in this region indicates that the phenolic compounds in the dyes interact strongly with the wool, which leads to more efficient fixation of the dyes in the fibre. In the weld sample, the transmittance was also intense, although not as pronounced as in the samples of zacatlaxcalli and sweet-scented marigold, suggesting a weaker interaction with the fibre [63].
  • 1000–500 cm−1: Dye Fingerprint
The region of 1000–500 cm−1 is crucial for the identification of specific dye–fibre interactions. Samples stained with zacatlaxcalli and sweet-scented marigold showed a significant increase in transmittance in this region, which was attributed to C-O and C-O-C vibrations and aromatic deformations of the phenolic compounds of the dye. This increase was more pronounced in the 2023 samples, which confirms that better fixation of the dyes occurred for samples from that year.
The FTIR results showed that samples stained with zacatlaxcalli, sweet-scented marigold, and weld exhibited stronger chemical interaction between the phenolic groups of dyes and the amide groups of the wool, as reflected in the widening of the bands at 3600–3000 cm−1 and the increase in transmittance at 1450–1200 cm−1. These interactions are more pronounced in the 2023 samples, suggesting better fixation of the dyes compared to the 2016 and 2017 samples. Global analysis suggests that the vegetable dyes provide stable chemical fixation, which can translate into better colour stability and increased resistance to washing.

4.4. VP-ESEM

Scanning electron micrographs of the dyed and undyed wool samples (Figure 6) help to define the fibre diameter, cuticle pattern, scale thickness, distance between scale margins, and shape of those margins. It has been shown that an increase in the diameters of wool fibres causes an increase in the apparent dye diffusion coefficient, which contrasts with the stablished theory that fibres with minor diameters are associated with a higher dyeing rate [64]. Table 3 shows the values of the morphological characteristics of the samples. Regardless of the cuticle pattern, the shape and space between the scales as well as the distribution of the scales identified by SEM may be related to and actively involved in the process of absorption and retention of the dye.
When the wool is washed, the inherent lipid monolayer on the fibres is removed [65]. The surface morphology of the undyed wool and the two samples dyed with zacatlaxcalli was smooth, and there was no waxy layer on the surfaces (Figure 6a,d,e). The lack of waxy layer allows dye to be absorbed in the matrix of the fibres and superficial adhesion on the scales, as shown in the CLSM images (Figure 6c). These characteristics are the result of the washing and softening processes of the wool before dyeing [66].
In the sweet-scented marigold 2016 sample, waxy layer residues were observed (Figure 6b). In the sweet-scented marigold 2023 sample, a thick waxy layer was evident on the surface of the scales (Figure 6c). The weld sample’s wax layer was thinner and partially covered the surface of the scales (Figure 6f). The absorption during the dyeing process is influenced by temperature, time, concentration gradient, rate of agitation, mordants, the shape and spacing of scales, presence or absence of waxy layer on the surface, and chemical structure of the dye. There is not much literature addressing the issue of how intercellular gaps between scales influence the diffusion of dyes into the core of wool fibre, but the process has been explained with the help of Fick’s law of diffusion [64].

4.5. Yellow Wool Samples from Franz Mayer Museum

There are few studies on Mexican textiles, and the collections of archaeological textiles in Mexican museums are very limited. Most of the textiles examined come from the north of the country (Chihuahua [67] and Durango [68]), and few are from the south (Chiapas vegetal fibres) [69] and the centre of the country (Mexico City) [70]. By the time that the Spanish arrived, textiles dyed with minerals and dyes were already being produced [70]. There is evidence of the use of natural dyes in Mexico since early pre-Hispanic periods, and efforts have been made to identify them through plant extracts [1]. Only one such study has examined lab-dyed wool fibres and extracts of plants such as zacatlaxcalli using SERS [71]. To test the proposed methodology, two historic wool textiles from the Franz Mayer Museum collection were analysed: a 16th-century European tapestry made in Europe and a 19th-century Embroidery sampler labelled as “Dechado”, which was probably made in Mexico (Table 4). The integrity of the cultural objects was not harmed.
The identification of natural yellow dyes in archaeological textiles was carried out by means of comparative analysis. The emission spectra of the two samples of ancient textiles were compared with those of dyes made from sweet-scented marigold 2026 (Figure 7a), zacatlaxcalli 2023 (Figure 7b), and weld (Figure 7c). The results indicate greater coincidence with the bands corresponding to the weld sample, but the intensity of the bands was lower in the tapestry S-XIX sample. The spectra of sweet-scented marigold and zacatlaxcalli samples showed three peaks, and that of weld samples showed four peaks.
The 3D CSLM images with orthogonal cuts (Figure 8a,b) confirm that the dyes are present in the cortex of the fibres as in the samples dyed in the workshop. It is evident that the tapestry S-XVI sample (Figure 8b) has very low contrast, which is probably a result of restorative treatment (there are no records of washing or interventions in the museum). It has been reported that the natural fluorescence level of wool decreases when it is embedded in glycerol [47], which is used as a wetting and plasticizing agent in the preservation of textiles, helps to restore flexibility in dry fibres, and facilitates the alignment of deformations. In restoration, it is applied after dilution in distilled water, followed by careful drying processes [72] to prevent the growth of mould and fungi.
Glycerol also serves as chemical modifier and dyeing aid for natural fibres like wool. It forms hydrogen bonds with the wool (keratin) by penetrating the fibre structure, enhancing wettability, and allowing for deep colour absorption at lower temperatures. This process reduces environmental contamination and has been a recent trend in the textile industry [73,74]. The low contrast could be explained by the 3D CSLM images and probably results from restorative treatments.
The CLSM results are complemented by micro-Raman spectra results to link spectral information of functional groups from the dye structure. It is known that the main component in weld is the flavonoid luteolin, with minor proportions of apigenin and chrysoeriol [15,29,44]. The comparative analysis results of the spectra of the weld sample with the samples Dechado S-XIX and tapestry S-XVI are shown in Figure 9. The spectra show the absence of a peak at 900 cm-1, but the same characteristic peaks occur at 1258, 1310, and 1580 cm-1 (Figure 3c,d), although with different intensity. These results are consistent agreement with the extract spectra reported for luteolin and apigenin [1,24,29]. In general, the FTIR spectra in Figure 10 confirm that all of the fibres are of proteinaceous origin [41,52].
The spectra of the samples Dechado S-XIX and tapestry S-XVI show a band 1170 cm-1, which was only observed in the weld sample (Figure 4b and Figure 5a). The band is related to the C-O absorption band of cyclic ether stretching vibration of the weld extract [40,59]. Small differences were detected in the Raman and FTIR-ATR spectra of weld samples with respect to the sweet-scented marigold and zacatlaxcalli samples (four peaks in Raman spectra and one band in FTIR-ATR spectra). These peaks and band match the spectra of the museum samples and reinforce the identification of the weld dye by CSLM.
The SEM micrographs of the historical wool textiles showed no evidence of biodegradation by bacteria. Neither of the two samples showed the protective superficial waxy layer, perhaps due to cleaning processes and interventions applied to them since their manufacture, which were probably the main cause of aging and fibre damage. Both samples showed tears in the wool fibres due to frictional and tension forces caused by their use. In general, the diameter of the fibres was in the range of 12 to 35 μm.
The Dechado S-XIX sample showed a coronal cuticle pattern (Figure 11a), while tapestry S-XVI showed a reticulate cuticle pattern. The shape of the scale margins was straight in both samples, and the distance between the margins was in the range of 8.7 to 20.3 µm. The dirt that had accumulated on the edges of the scales did not allow for reliable measurement of the scale thickness. In the case of the tapestry S-XVI (Figure 11b), a uniform superficial layer of material prevented observation of the scale thickness and distinction of the scales. In addition, some fibres with superficial damage and others with tears had cortexes that were exposed to the environment (Figure 11b). Such conditions accelerate the deterioration of the dye, including deterioration due to UV and visible light exposure. The morphological evidence points to the use of glycerol in restorative treatment, as mentioned in the discussion of the CSLM images.
The preferred source of yellow dye in Europe was weld into the 19th century [12,25,44]. According to the period in which the museum textiles were manufactured (XVI and XIX centuries), particularly the Dechado S-XIX sample, weld from local sources or imported natural dyes could have been used for dyeing. Alternatively, the dyed wool or textile pieces may have perhaps been brought to Mexico after being manufactured in Europe. The analysed samples are approximately 200 and 500 years old but maintain their yellow colour despite the physical conditions of the wool fibres, use, and exposure to light for a long time, which indicates a good dyeing process. To date, the weld recipes used in historical dyeing processes are not clear [25,63].

5. Conclusions

This study provides just one approach to analysing wool dyed with natural yellow dyes in current workshops and two samples of Mexican historical textiles aged 200 and 500 years old, without extracting the dyes. The study spectrometrically and structurally characterised three popular dyes used in historical yellow-dyed wool in Mexico since pre-Hispanic era: sweet-scented marigold, zacatlaxcalli, and weld. We used relatively conventional techniques because we lack sophisticated portable equipment, and the findings highlight the potential of CLSM in the analysis of natural yellow dyes in textile fibres of animal origin. Using SEM and CLSM, it was demonstrated that the dyes are absorbed in the matrix of the wool fibres and adhere to the surface when the waxy layer of the wool is absent. It is not possible to directly assign the wavelengths of a CLSM emission spectrum to specific functional groups of a molecule, but it was possible to identify the type of compounds in plants that fluoresce naturally based on the study by García-Plazaola.
Comparative analyses of the spectra allowed us to identify the yellow dye used to in the samples of Dechado S-XIX and tapestry S-XVI as weld (R. luteola). Small differences were detected in the Raman and FTIR-ATR spectra of weld with respect to the sweet-scented marigold and zacatlaxcalli samples, which matched with the spectra of the museum samples and reinforced the identification of the weld dye by CSLM. SEM images can provide information regarding restorative treatment in historic textiles, which explains the increase in fluorescence in the Raman spectra and complicates the identification of yellow dyes in wool dyed. Although the size of the samples was sufficient to perform all analyses, the sizes of samples of cultural heritage textiles will always be more limited. The proposed minimally invasive methodology is adequate to identify natural yellow dyes in wool fibres and could be applied to other kinds of yellow-dyed fibres.

Supplementary Materials

The following supporting information can be downloaded at the website of this paper posted on Preprints.org, Figure S1. Raw Raman spectra, prior to base line corrections: a) dyed and undyed wool samples, b) Dechado S-XIX and Tapestry S-XVI. Figure S2. Raw FTIR-ATR spectra, prior to normalization: a) dyed and undyed wool samples, b) Dechado S-XIX and Tapestry S-XVI. Figure S3. Original SEM micrographs. Quanta FEG-250 (a-f). JSM-7800F (g-h).

Author Contributions

Conceptualization, M.O.A. and A.J.P.G.; methodology, M.O.A.; validation, M.O.A., A.J.P.G., E.T.S., L.A.M.R. and A.P.B.; formal analysis, M.O.A., A.J.P.G., E.T.S., L.A.M.R. and A.P.B.; investigation, M.O.A., A.J.P.G. and E.T.S.; writing—original draft preparation, M.O.A.; writing—review and editing, M.O.A., A.J.P.G., E.T.S., L.A.M.R. and A.P.B. All authors have read and agreed to the published version of the manuscript.

Funding

This research was partly funded by SIP-IPN, project SIP20241424.

Data Availability Statement

All data in the paper and Supplementary Materials.

Acknowledgments

The authors are grateful with professors at the National School of ENCRyM-INAH for providing the samples, master dyer Román Gutiérrez, restorer Rosa Lorena Román Torres. M.O.A acknowledges the CNMN of Instituto Politécnico Nacional for the facilities provided through the project SIP20241424.

Conflicts of Interest

The authors declare no conflicts of interest.

Abbreviations

The following abbreviations are used in this manuscript:
VP-SEM Variable Pressure Scanning Electron Microscopy
UV-VIS Ultraviolet-Visible spectroscopy
CSLM Confocal Scanning Laser Microscopy
ATR-FTIR Attenuated Total Reflectance - Fourier Transform Infrared Spectroscopy
RIS Reflectance Imaging Spectroscopy
FORS Fiber Optic Reflectance Spectroscopy
NIR Near.Infrared Spectroscopy
IR Mid Infrared Spectroscopy
MSI Multispectral Imaging
HSI Hyperspectral Imaging
USI Ultraspectral Imaging
XRF X-Ray Fluorescence
FEEM Fluorescence Excitation-Emission Matrix Spectroscopy
DART-TOF-MS Direct Analysis in real time-time of Flight-Mass Spectrometry
SERS Surface Enhanced Raman Spectroscopy
SERRS Surface Enhanced Resonance Raman Spectroscopy
TLC Thin Layer Chromatography
GC Gas Chromatography
HPLC High Performance Liquid Chromatography
HPLC-DAD High Performance Liquid Chromatography with Diode Array Detection
ENCRyM Escuela Nacional de Conservación Restauración y Museografía
INAH Instituto Nacional de Antropología e Historia
STCT Estudiantes del Taller de Conservación de Textiles

References

  1. García-Bucio, M.A.; Casanova-González, E.; Mitrani, A.; Ruvalcaba-Sil, J.L.; Maynez-Rojas, M.A.; Rangel-Chávez, I. Non-destructive and non-invasive methodology for the in-situ identification of Mexican yellow lake pigments. Microchem. J. 2022, 183, 107948. [Google Scholar] [CrossRef]
  2. Abu-Ghosh, S.; Sukenik, N.; Amar, Z.; Iluz, D. Yellow dyes in archaeological textiles: Sources, locations, identification, and challenges. J. Archaeol. Sci. Rep. 2023, 49, 104030. [Google Scholar] [CrossRef]
  3. Melo, M.J.; Nabais, P.; Vieira, M.; Araújo, R.; Otero, V.; Lopes, J.; Martín, L. Between past and future: Advanced studies of ancient colours to safeguard cultural heritage and new sustainable applications. Dye. Pigment. 2022, 208, 110815. [Google Scholar] [CrossRef]
  4. Paterson, R.A.; Lowe, B.J.; Smith, C.A.; Lord, J.M.; Ngarium-Cameron, R. Polarized light microscopy: an old technique cast new light on Maori Textile plants. Archaeometry 2017, 59(5), 965–979. [Google Scholar] [CrossRef]
  5. Vicente Palomino, S.; Bonet Aracil, M.A.; Arbús Fandos, N.; Monllor Pérez, P. Fabrics analysis and characterization that usually are used in the textile consolidation. Arché Publicación del Instituto Universitario de Restauración del Patrimonio de la UPV 2006, 1, 139–144. [Google Scholar]
  6. Mas-Normand, L.; Dangles, O.; Mathe, C.; Culioli, G. Identification of yellow dye plant chemical markers for applications in cultural heritage using LC-MS-based metabolomics and molecular networking. Microchem. J. 2025, 218, 115621. [Google Scholar] [CrossRef]
  7. Doménech, A.; Doménech-Carbó, M.T.; Vázquez de Agredos-Pascual, M.L. From Maya Blue to “Maya Yellow”: A connection between ancient nanostructured materials from the voltammetry of microparticles. Angew. Chem. Int. Ed. 2011, 50, 5741–5744. [Google Scholar] [CrossRef]
  8. Domenici, D.; Buti, D.; Miliani, C.; Sgamellotti, A. Changing Colours in a Changing World. The Technology of Codex Painting in Post-Classic and Early Colonial Mesoamerica. In Materia Americana; Siracusano, G., Rodríguez, A. R., Eds.; EDUNTREF: Buenos Aires, Argentina, 2020; pp. 45–57. [Google Scholar]
  9. García, M.A. Estudio de colorantes amarillos mexicanos mediante espectroscopías Raman y SERS. Doctoral Thesis, Universidad Nacional Autónoma de México, Ciudad de México, México, 2019. [Google Scholar]
  10. Ponting, K. G. Important Natural Dyes of History. Ind. Archaeol. Rev. 1978, 2(2), 154–159. [Google Scholar] [CrossRef]
  11. Petroviciu, I.; Crețu, I.; Vanden Berghe, I.; Wouters, J.; Medvedovici, A.; Albu, F. Flavonoid dyes detected in historical textiles from Romanian collections. E-Preserv. Sci. 2014, 11, 84–90. [Google Scholar]
  12. Zhang, X.; Good, I.; Laursen, R. Characterization of dyestuffs in ancient textiles from Xinjiang. J. Archaeol. Sci. 2008, 35, 1095–1103. [Google Scholar] [CrossRef]
  13. Deveoğlu, O.; Karadağ, R. A review on the flavonoids – A dye source. Int. J. Adv. Eng. Pure Sci. 2019, 31, 188–200. [Google Scholar] [CrossRef]
  14. Smith, G.D.; Esson, J.M.; Chen, V.J.; Hanson, R.M. Forensic dye analysis in cultural heritage: Unraveling the authenticity of the earliest Persian knotted-pile silk carpet. Forensic Sci. Int. Synerg. 2021, 3, 100130. [Google Scholar] [CrossRef] [PubMed]
  15. Petroviciu, I.; Teodorescu, L.; Albu, F.; Virgolici, M.; Nagoda, E.; Medvedovici, A. Dyes and biological sources in nineteenth to twentieth century ethnographic textiles from Transylvania, Romania Herit. Sci. 2019, 7(15), 1–15. [Google Scholar] [CrossRef]
  16. Hulme, A.N.; McNab, H.; Peggie, D.A.; Quye, A. Scientific Analysis of Ancient and Historic Textiles; Archetype: London, England, 2004; pp. 208–216. [Google Scholar]
  17. Colombini, M.P.; Andreotti, A.; Baraldi, C.; Degano, I.; Łucejko, J.J. Colour fading in textiles: A model study on the decomposition of natural dyes. Microchem. J. 2007, 85, 174–182. [Google Scholar] [CrossRef]
  18. Grillini, F.; De Ferri, L.; Pantos, G.A.; George, S.; Veseth, M. Reflectance imaging spectroscopy for they study of archaeological pre-Columbian textiles. Microchem. J. 2014, 200, 110168. [Google Scholar]
  19. El Enen Amin, E.A. Technical investigation and conservation of a tapestry textile from the Egyptian Textile Museum. Sci. Cult. 2018, 4(3), 35–46. [Google Scholar] [CrossRef]
  20. Vlachou-Mogire, C. Mapping materials and dyes in historic tapestries using hyperspectral imaging. In Proceedings of the Dyes in History and Archaeology 2022, Riksantikvarie Ämbetet, Sweden, 11-13 october 2022. [Google Scholar]
  21. Nowik, W.; Desrosiers, S.; Suroweic, I.; Trojanowicz, M. The analysis of the dyestuff from first-to second-century textile artifacts found in the Matres-De-Veyre (France) Excavations. Archaeom. 2005, 47(4), 835–848. [Google Scholar] [CrossRef]
  22. Pantoja Muñoz, L. Non-invasive, non-destructive and portable identification of Indian yellow: Moving from highly purified standards to real watercolour, oil and historical samples. J. Cult. Herit. 2023, 62, 441–448. [Google Scholar] [CrossRef]
  23. Skals, I.; Gleba, M.; Taube, M.; Mannering, U. Wool textiles and archaeometry: testing reliability of archaeological wool fibre diameter measurements. Dan. J. Archaeol. 2018, 7(2), 161–179. [Google Scholar] [CrossRef]
  24. Bernardino, N.D.; De Faria, D.L.A.; Negrón, A.C.V. Applications of Raman spectroscopy in archaeometry: An investigation of pre-Columbian Peruvin textiles. J. Archaeol. Sci. Rep. 2015, 4, 23–31. [Google Scholar] [CrossRef]
  25. Santo, M.; Cardon, D.; Teixeira, N.; Nabais, P. Yellow Dyes of Historical Importance: A Handful of Weld Yellows from the 18th-Century Recipe Books of FrenchMaster Dyers Antoine Janot and Paul Gout. Heritage 2023, 6, 7466–7481. [Google Scholar] [CrossRef]
  26. Quispe-Quispe, A.; Lozano, F.; Machaca-Machaca, V.; Quispe-Marcatoma, J. Textile Characteristics, Medullation, and Colorimetry of Wool Fiber Dyed with Dactylopius coccus Using Atmospheric Pressure Plasma Jet (APPJ). Appl. Sci. 2025, 15(421), 1–18. [Google Scholar] [CrossRef]
  27. Margariti, C.; Sava, G.; Sava, T.; Boudin, M.; Nosch, M.L. Radiocarbon dating of archaeological textiles at different states of preservation. Herit. Sci. 2023, 11(44), 1–13. [Google Scholar] [CrossRef]
  28. Han, J.; Wanrooij, J.; Van Bommel, M.; Quye, A. Characterisation of chemical components for identifying historicalChinese textile dyes by ultra-high-performance liquid chromatography photodiode array – electrospray ionisation mass spectromete. J. Chromatogr. A. 2017, 1479, 87–96. [Google Scholar] [CrossRef] [PubMed]
  29. Corredor, C.; Teslova, T.; Cañamares Vega, M.; Chen, Z.; Zhang, J.; Lombardi, J.R.; Leona, M. Raman and surface-enhanced Raman spectra of chrysin,apigenin and luteolin. Vib. Spectrosc. 2009, 49, 190–195. [Google Scholar] [CrossRef]
  30. García-Plazaola, J.I.; Fernández-Marín, B.; Duke, S.O.; Hernández, A.; López-Arbeloa, F.; Becerril, J.M. Autofluorescence: Biological functions and technical applications. Plant Sci. 2015, 236, 136–145. [Google Scholar] [CrossRef] [PubMed]
  31. Mahltig, B. Overview on natural dyes and their IR-spectra – Part V: Plant based dyes. Commun. Dev. Assem. Text. Prod. 2025, 6, 13–46. [Google Scholar] [CrossRef]
  32. Flores Torres, D.I. Elaboración de una guía didáctica virtual para los procesos de hilatura de fibras largas. Bachelor Thesis, Universidad Técnica del Norte, Ibarra, Ecuador, 2011. [Google Scholar]
  33. Frank, E.N.; Hick, M.V.H.; Prieto, A.; Castillo, M.F. Metodología de identificación cualitativa y cuantitativa de fibras textiles naturales; SUPPRAD, Universidad Católica de Córdoba: Córdoba, Argentina, 2009. [Google Scholar]
  34. TextileAid. Wool fibre chemical composition of wool. Available online: https://textileaid.blogspot.com/2013/07/wool-fiber-chemical-composition-of-wool.html (accessed on 27 February 2026).
  35. Baskan-Bayrak, H.; Karakas, H. Morphology and chemical structure of a wool fiber. In The Wool Handbook: Morphology, Structure, Properties, Processing, and Applications; Woodhead Publishing: Cambridge, UK, 2024; pp. 181–194. [Google Scholar]
  36. Wool Fiber Structure and Properties. Available online: https://www.sciencelearn.org.nz/image_maps/61-wool-fibre-structure-and-properties (accessed on 27 February 2026).
  37. Sitio Argentino de Producción Animal. Available online: https://www.produccion-animal.com.ar/produccion_ovina/produccion_ovina_lana/11-lana.pdf (accessed on 2 january 2026).
  38. Borrego, P.; Sanz, E.; Pérez, P.P.; Albar, A.; Partearroyo, C.; Arteaga, Á.; Marras, S.; Roquero, A. Caracterización de materiales y análisis técnico de tejidos medievales. Ge-Conservación 2017, 12, 6–30. [Google Scholar] [CrossRef]
  39. Veneno, M.; Nabais, P.; Otero, V.; Clemente, A.; Oliveira, M.C.; Melo, M.J. Yellow lake pigments from weld in art: Investigating the Winsor & Newton 19th century archive. Heritage 2021, 4, 422–436. [Google Scholar] [CrossRef]
  40. Raji, Y.; Nadi, A.; Chemchame, Y.; Mechnou, I.; Bouari, A.E.L.; Cherkaoui, O.; Zyade, S. Eco-friendly extraction of flavonoids dyes from Moroccan (Reseda luteola L.), wool dyeing, and antibacterial effectiveness. Fibers Polym. 2023, 24, 1051–1065. [Google Scholar] [CrossRef]
  41. Fonseca Nabais, P.S. Spectroscopic Characterization of Natural Dyes by Their Non-Invasive Identification on Pre-Columbian Codices: The Maya Yellow. Doctoral Thesis, Universidade Nova de Lisboa, Lisboa, Portugal, 2014. [Google Scholar]
  42. Ministerio de Agricultura y Ganadería, Gobierno de Costa Rica. Available online: https://www.mag.go.cr/bibliotecavirtual/A50-8516-p271.pdf (accessed on 2 january 2026).
  43. Ferreira, E.S.; Hulme, A.N.; McNab, H.; Quye, A. The natural constituents of historical textile dyes. Chem. Soc. Rev. 2004, 33, 329–336. [Google Scholar] [CrossRef] [PubMed]
  44. Barbache, S.; Lamhasni, T.; El Bakkali, A.; Ait Lyazidi, S.; Haddad, M.; Ben-Ncer, A. Optical analyses of wool dyeing materials in ancient Moroccan carpets “Zarbia(s)”: Combination of UV-vis diffuse reflectance, 3D-fluorescence and Raman spectroscopies. Dye. Pigment. 2018, 153, 256–265. [Google Scholar] [CrossRef]
  45. Kirkbride, K.P.; Tridico, S.R. The application of laser scanning confocal microscopy to the examination of hairs and textile fibers: An initial investigation. Forensic Sci. Int. 2010, 195, 28–35. [Google Scholar] [CrossRef] [PubMed]
  46. Collins, S.; Davidson, R.S.; Hilchenbach, M.E.C.; Lewis, D.M. The natural fluorescence of wool. Dye. Pigment. 2008, 24(2), 151–169. [Google Scholar]
  47. Collins, S. Studies on the natural fluorescence of wool and wool grease. Unpublished doctoral Thesis, City University London, 1992. [Google Scholar]
  48. SEBBM. Available online: https://sebbm.es/rincon-del-aula/uso-de-la-fluorescencia-y-la-microscopia-confocal-en-la-investigacion-cientifica/ (accessed on 2 january 2026).
  49. Malak, M.; James, J.; Grantham, J.; Ericson, M.B. Contribution of autofuorescence from intracellular proteins in multiphoton fuorescence lifetime imaging. Sci. Rep. 2022, 12, 16584. [Google Scholar] [CrossRef] [PubMed]
  50. Puchowicz, D.; Cieslak, M. Raman spectroscopy in the analysis of textile structures. In Recent Developments in Atomic Force Microscopy and Raman Spectroscopy for Materials Characterization; Pathak, C.S., Kumar, S., Eds.; Intech Open: London, UK, 2021; pp. 1–21. [Google Scholar]
  51. Carter, E.A.; Fredericks, P.M.; Church, J.S.; Denning, R.J. FT-Raman spectroscopy of wool – I. Preliminary studies. Spectrochim. Acta A 1994, 50, 1927–1936. [Google Scholar] [CrossRef]
  52. Andersen, O.M.; Markham, K.R. Flavonoids: Chemistry, Biochemistry and Applications; CRC Press: Boca Raton, FL, USA, 2006. [Google Scholar]
  53. De Gussem, K.; Vandenabeele, P.; Verbeken, A.; Moens, L. Raman spectroscopic study of flavonoids. Spectrochim. Acta A 2005, 61, 2896–2908. [Google Scholar] [CrossRef]
  54. Baranska, M.; Schulz, H. Determination of flavonoids by Raman spectroscopy. Vib. Spectrosc. 2006, 42, 341–345. [Google Scholar] [CrossRef]
  55. Kanakis, C.D.; Tarantilis, P.A.; Polissiou, M.G.; Diamantoglou, S.; Tajmir-Riahi, H.A. An overview of DNA and protein binding to antioxidant flavonoids. J. Mol. Struct. 2005, 740, 51–59. [Google Scholar]
  56. Edwards, H.G.M.; Farwell, D.W. FT-Raman spectroscopy of proteins and amino acids. Spectrochim. Acta A 1995, 51, 2079–2085. [Google Scholar] [CrossRef]
  57. Doherty, B.; Miliani, C.; Vanden Berghe, I.; Brunetti, B. Micro-Raman spectroscopic study of artificially aged natural and dyed wool. J. Raman Spectrosc. 2008, 39, 638–645. [Google Scholar] [CrossRef]
  58. Rintoul, L.; Carter, E.A.; Stewart, S.D.; Fredericks, P.M. Keratin orientation in wool and feathers by polarized Raman spectroscopy. Biopolymers 2000, 57, 19–28. [Google Scholar] [CrossRef] [PubMed]
  59. Hindarto, C.K.; Surini, S.; Permana, A.H.; Redjeki, S.; Irawan, C. Effect of mol ratio on physicochemical properties of luteolin-loades phytosome. Pharma Innov. 2017, 12, 96–101. [Google Scholar]
  60. Bechtold, T.; Mussak, R. Handbook of Natural Colorants; John Wiley & Sons: Chichester, UK, 2009. [Google Scholar]
  61. Coates, J. Interpretation of infrared spectra, a practical approach. In Encyclopedia of Analytical Chemistry; Meyers, R.A., Ed.; John Wiley & Sons: Chichester, UK, 2000; pp. 10815–10837. [Google Scholar]
  62. Moniruzzaman, M.; Rahman, M.; Islam, M. Dyeing of wool fabric using natural dyes extracted from plants. J. Clean. Prod. 2015, 87, 574–580. [Google Scholar]
  63. Cardon, D. Natural Dyes: Sources, Tradition, Technology and Science; Archetype Publications: London, UK, 2007. [Google Scholar]
  64. Paul, S.; Hewitt, A.; Rana, S.; Goswami, P. Development of novel parameters for characterising scale morphology of wool fibre and its correlation with dye diffusion coefficient of acid dye. Sci. Rep. 2023, 13, 18444. [Google Scholar] [CrossRef] [PubMed]
  65. Wikaputri, A.S.; Ihwah, A.; Irvine, D.J.; Stockman, R.A.; Grebby, S.; Shivaprasad, P. Multi-substrate kinetic framework and wool-immobilised Pseudomonas fluorescens lipase (WPFL) for solvent-free biocatalysis of terpene esters from rose geranium oil. Biochem. Eng. J. 2026, 226, 110002. [Google Scholar] [CrossRef]
  66. Castellanos Perilla, M.V.; Sánchez Díaz, D.C.; Pataquiva Mateus, A.Y.; Echeverry Ocampo, M.A.; Dotor Robayo, Á.L.; Ramos Kalmar, E. Nanoestructuración y experimentación de fibras proteicas para superficies textiles y moda sostenible. Ingeniare 2018, 24, 47–64. [Google Scholar] [CrossRef]
  67. Green Strupp, J. Archaeological Chihuahuan textiles and modern Tarahumara weaving. J. Anthropol. 2010, 36, 115–130. [Google Scholar]
  68. Irmgard, W.J. Weft-Wrap Openwork Techniques in Archaeological and Contemporary Textiles of México. In Proceedings of the Irene Emery Roundtable on Museum Textiles, Washington D.C., U.S.A., 18-20 april 1974. [Google Scholar]
  69. Mastache de Escobar, A. G. Textiles from the Cueva de la Media Luna Chiapas, México, A Preliminary Report. In Proceedings of the Irene Emery Roundtable on Museum Textiles, Washington D.C., U.S.A., 18-20 april 1974. [Google Scholar]
  70. Filloy, N. L. Mesoamerican Archaeological Textiles: An Overview of Materials, Techniques, and Contexts. In PreColumbian Textile Conference VII / Jornadas de Textiles PreColombinos VII; Bjerregaard, L., Peters, A., Eds.; Zea Books: Lincoln, Nebrazka, U.S.A., 2017; pp. 7–39. [Google Scholar]
  71. Casanova-Gonzáles, E.; García-Burcio, A.; Ruvalcaba-Sil, J.L.; Santos-Vásquez; Esquivel, B.; Falcón, T.; Arroyo, E.; Zetina, S.; Roldán, M.L.; Domingo, C. Surface-enhancced Raman spectroscopy spectra of Mexican dyestuff. J. Raman Spectrosc. 2012, 43, 1551–1559. [Google Scholar] [CrossRef]
  72. Toca, T. Conservation and Restoration of Pre-Columbian Textiles. In Tejiendo imágenes. Homenaje a Victoria Solanilla Demestre; Simmons, C. C., Valls i, G. M., Eds.; Zea Books: Lincoln, Nebraska, U.S.A., 2023; pp. 367–374. [Google Scholar]
  73. Ferrero, F.; Periolatto, M. Glycerol in comparison with ethanol in alcohol-assisted dyeing. J. Clean. Prod. 2012, 33, 127–131. [Google Scholar] [CrossRef]
  74. Touatou, S.; Belhaneche-Bensemra, N. Valorization of wool keratin in developing thermo-pressed plasticized films using factorial design. Alger. J. Environ. Sci. Technol. 2022, 8(4), 2869–2878. [Google Scholar]
Figure 1. CSLM emission spectra, dye fluorescence signals of selected samples and undyed wool.
Preprints 223498 g001
Figure 2. 3D CSLM images with virtual cuts and emission spectrum of selected samples showing main bands: a) wool, b) sweet-scented marigold 2016, c) zacatlaxcalli 2023, d) weld.
Preprints 223498 g002
Figure 3. Raman spectra of different regions with base line correction: a) general superimposed spectra and b–f) detail of each of the fingerprint regions.
Preprints 223498 g003
Figure 4. ATR-FTIR spectra: a) general superimposed spectra, b) weld, c–f) pairwise comparison of yellow-dyed wools to undyed wool.
Preprints 223498 g004aPreprints 223498 g004b
Figure 5. ATR-FTIR spectra for regions: a) detailed assessment of the fingerprint region at 500–1800 cm-1 and b) high-frequency region at 1900–3750 cm-1.
Preprints 223498 g005
Figure 6. Optical and SEM images at 500× and 5000× of a) undyed wool and wool dyed with b) sweet-scented marigold 2016, c) sweet-scented marigold 2023, d) zacatlaxcalli 2017, e) zacatlaxcalli 2023, and f) weld.
Preprints 223498 g006
Figure 7. Comparison of CSLM emission spectra of samples from Franz Mayer Museum with samples dyed with a) sweet-scented marigold 2016, b) zacatlaxcalli 2023, and c) weld.
Preprints 223498 g007
Figure 8. 3D CSLM images with virtual cuts and emission spectrum showing main bands: a) Dechado S-XIX and b) tapestry S-XVI.
Preprints 223498 g008
Figure 9. Comparison of Raman spectra of weld sample, Dechado S-XIX, and tapestry S-XVI.
Preprints 223498 g009
Figure 10. Comparison of FTIR-ATR spectra of weld sample, Dechado S-XIX, and tapestry S-XVI.
Preprints 223498 g010
Figure 11. SEM micrographs: a) Dechado S-XIX and b) tapestry S-XVI.
Preprints 223498 g011
Table 1. Chemical composition of wool [35].
“Acidic” amino acids “Basic” amino acids and tryptophan Amino acids with hydroxyl groups in the side chain Sulphur-containing amino acids Amino acids without reactive groups in the side chain
Aspartic acid Arginine Serine Cysteine (cys) Glycine
Glutamic acid Lysine Threonine Thiocysteine Alanine
Asparagine Histidine Tyrosine Cysteine Valine
Glutamine Tryptophan Methionine Proline
Leucine
Isoleucine
Table 3. Morphological characteristics of undyed wool and wool dyed with natural yellow dyes.
Characteristic Undyed wool Sweet-scented marigold 2016 Sweet-scented marigold 2023 Zacatlaxcalli 2017 Zacatlaxcalli 2023 Weld
Fibre diameter (range in µm) 14.1–10.5 13.1–32.8 14.4–37.3 10.8–33.8 12.8–43 13–39
Scale thickness (nm) 484–540 340–720 407–555 539–802 540–866 544–704
Cuticle pattern coronal reticulate coronal–reticulate coronal–reticulate coronal coronal–reticulate
Shape of the scale margins straight straight straight straight straight straight
Distance between scale margins (µm) 8.2–13.2 12.8–20.2 11–16.6 8.7–20.5 8.4–15.6 7.3–18.4
Comment No brittle surface layer Almost completely detached brittle surface layer Brittle surface layer without detachment No brittle surface layer No brittle surface layer Brittle surface layer with large detachments
Table 4. Yellow wool samples from Franz Mayer Museum.
Preprints 223498 i001
Disclaimer/Publisher’s Note: The statements, opinions and data contained in all publications are solely those of the individual author(s) and contributor(s) and not of MDPI and/or the editor(s). MDPI and/or the editor(s) disclaim responsibility for any injury to people or property resulting from any ideas, methods, instructions or products referred to in the content.
Copyright: This open access article is published under a Creative Commons CC BY 4.0 license, which permit the free download, distribution, and reuse, provided that the author and preprint are cited in any reuse.